dhl global forwarding, freight ocean freight market update · ocean alliance has announced 1 blank...
TRANSCRIPT

1
OCEAN FREIGHT MARKET UPDATE
DHL Global Forwarding, Freight
May 2018
PUBLIC

2 2
Contents
TOPIC OF THE MONTH
Operational Start of Ocean Network Express (ONE) on 1 April
HIGH LEVEL DEVELOPMENT
MARKET OUTLOOK
Freight Rates and Volume Development
ECONOMIC OUTLOOK & DEMAND DEVELOPMENT
CAPACITY DEVELOPMENT
CARRIERS
BACK-UP
PUBLIC
DHL Global Forwarding | OFR Market Update | May 2018

3 3
O N E H A S C O M M E N C E D O P E R A T I N G A S S C H E D U L E D
• ONE combines the container operations of three Japanese carriers K
Line, MOL and NYK in a new entity and is part of THE Alliance
• According to Alphaliner data the new carrier operates a fleet of 230
containerships with a total capacity of 1’494’135 TEU with NYK being the
largest contributor with 90 ships with a total capacity of 550’593 TEU.
• The newly combined fleet gives ONE a global capacity share of 6.8%,
making them the 6th largest carrier in the world
• The three shareholders have also announced completion of a USD 3bn
cash investment into ONE with 31% contributed by K line, 31% by MOL
and 38% by NYK, all made fully in cash.
• The new joint venture was established as Ocean Network Express
Holdings Ltd in Tokyo. Operations are however managed from
Singapore by Ocean Network Express Pte Ltd.
• ONE has selected magenta as its brand color, thus standing our from the
usual colors used in the industry like blue and red
Topic of the Month
Operational Start of Ocean Network Express (ONE) on 1 April
Source: Alphaliner, carrier, DHL
DHL Global Forwarding | OFR Market Update | May 2018

4 4
High Level Market Development – Supply and Demand
1’000
800
600
400
200
0
Q1
’18
Q4 Q3 Q2 Q1
17
Q4 Q3 Q2 Q1
16 BIX MGO
BIX 380
ECONOMIC OUTLOOK GDP GROWTH BY REGION1)
DHL Global Forwarding | OFR Market Update | May 2018
2017F 2018F 2019F 2020F 2021F CAGR
(2018-21)
EURO 2.4% 2.4% 2.0% 1.9% 1.8% 1.9%
MEA 3.3% 3.4% 3.6% 3.8% 3.7% 3.7%
AMER 2.2% 2.6% 2.7% 2.3% 2.1% 2.4%
ASPA 5.0% 5.0% 4.8% 4.7% 4.8% 4.8%
DGF World 3.3% 3.4% 3.3% 3.1% 3.1% 3.2%
PUBLIC
Supply Growth %
Demand Growth
%
0%1%2%3%4%5%6%7%8%9%
2015 2016 2017 2018F 2019F 2020F 2021F
SUPPLY/DEMAND GROWTH (ANNUALIZED), IN % 2)
1)real GDP, Global Insight, Copyright © IHS, Q2 2018 . All rights reserved 2) Demand growth = Port-to-Port Container Traffic growth. Supply growth = Fleet Growth. Source: Drewry Maritime Research. 3) Shanghai Shipping Exchange, in USD/20ft container & USD/40ft ctnr for US routes, 15 routes from
Shanghai. 4) Global Insight, Drewry, 5) Bunker Index, in USD/metric ton, Bunker Index MGO (BIX MGO) = avg. Global Bunker Price for marine gasoil (MGO) port prices; (BIX 380= avg. Global Bunker Price for all 380 centistoke (cSt) port prices; both index published on the Bunker Index website., 6) DHL
Global Trade Barometer Mar18, index value represents weighted average of current growth and upcoming two months of trade, a value at 50 is considered neutral, expanding above 50, and shrinking below 50.
BUNKER PRICE INDEX 5)
BIX 360
BIX MGO
0
100
200
300
400
500
600
700
800
Q4 Q3 Q2 Q1
16 Q1
’18
Q4 Q3 Q2 Q1
17
2’000
1’500
1’000
500
0
Q1
’18
Q4 Q3 Q2 Q1
17
Q4 Q3 Q2 Q1
16
WORLD CONTAINER INDEX (WCI)3) SHANGHAI CONTAINERIZED FREIGHT INDEX (SCFI)4)
DHL TRADE BAROMETER6)
30
40
50
60
70
80
Q1
'16
Q2 Q3 Q4 Q1
'17
Q2 Q3 Q4 Q1
'18
Ocean
Global
5 5
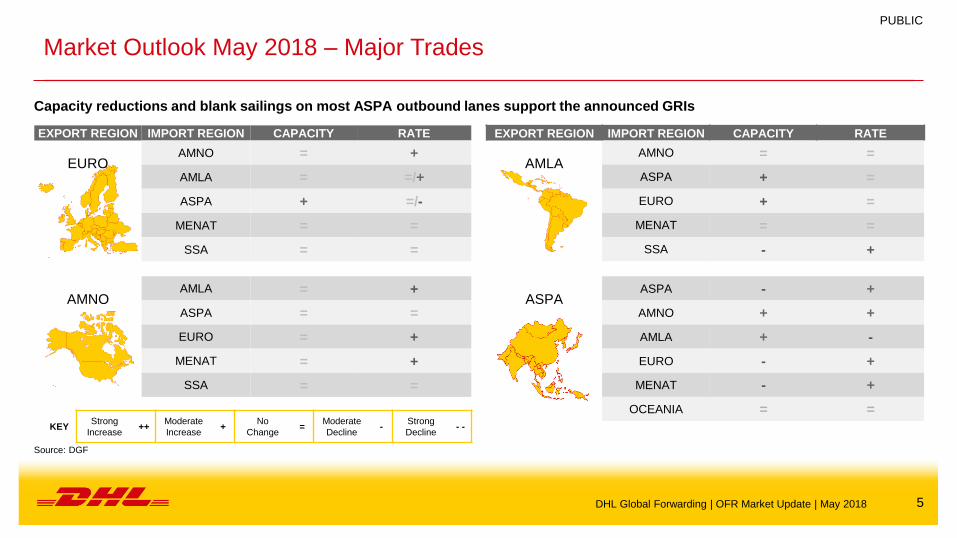
Market Outlook May 2018 – Major Trades
Capacity reductions and blank sailings on most ASPA outbound lanes support the announced GRIs
KEY Strong
Increase ++
Moderate
Increase +
No
Change =
Moderate
Decline -
Strong
Decline - -
EXPORT REGION IMPORT REGION CAPACITY RATE
EURO AMNO = +
AMLA = =/+
ASPA + =/-
MENAT = =
SSA = =
AMNO AMLA = +
ASPA = =
EURO = +
MENAT = +
SSA = =
EXPORT REGION IMPORT REGION CAPACITY RATE
AMLA AMNO = =
ASPA + =
EURO + =
MENAT = =
SSA - +
ASPA ASPA - +
AMNO + +
AMLA + -
EURO - +
MENAT - +
OCEANIA = =
DHL Global Forwarding | OFR Market Update | May 2018
Source: DGF
PUBLIC

6 6
Market Outlook April 2018 – Ocean Freight Rates Major Trades Market outlook on smaller trades available in the back-up
O C E A N F R E I G H T R A T E S O U T L O O K
ASPA – EURO A new round of GRI’s are announced for the month of May and rates are expected to increase due to an overall capacity reduction and
blank sailings.
EURO – ASPA & MEA Market showing signs of softening; space is back and the carriers are looking for high volume cargo to fill gaps left open by the
recyclables.
ASPA – AMLA Rates to MX/WCSA have reached 3-digit level, and carriers have introduced several blank sailing to bring up the rates. We can expect
some rate recovery in mid-May 2018. ECSA do not have major space injection and rate is stable at the moment.
ASPA – AMNO Ocean alliance has announced 1 blank sailing into USWC early May. With TP contract renewal commencing May 1st, most carriers have
announced May 1st/15th GRI in an effort to raise the spot rate levels.
EURO – AMNO Space is getting really tight and carriers have started to push up the rates. Additional increases are also affecting the Ramps / Inland
locations.
ASPA – MENAT Carriers have implemented few GRI for the month of May. Rates have been declining into EMED and Middle East, and in order to push
through GRI, Carriers have now introduced several blank sailings from End April till May.
ASPA – ASPA The May GRI has been announced for the IPBC trade. Vessel schedules have been affected by the recent bad weather in Shanghai.
The delays have led to some space issues from this port of loading.
AMNO – EURO Most services are running full leading to rate increases for Q2.
Carriers are increasing their door rates in their tariffs.
DHL Global Forwarding | OFR Market Update | May 2018
Source: DGF
PUBLIC

7 7
Economic Outlook & Demand Development
Even a limited tariff war could begin to wear down global economic growth
Source: IHS Markit Global Executive Summary, IHS Purchasing Manager Index Manufacturing, a PMI at 50 is considered neutral, expanding above 50, and business shrinking below 50.
DHL Global Forwarding | OFR Market Update | May 2018
PUBLIC
EURO
EU’s growth is still solid, but softening. Recent data on inflation, output, and retail sales have been disappointing. The European Central Bank
(ECB) removed its easing bias in early March, sounding more confident that medium-term core inflation will pick up. Yet, cautious withdrawal of
stimulus is still the most likely scenario. Meanwhile, high inflation, a strengthening currency, and continued uncertainty about the path of Brexit
mean UK growth is likely to slip.
AMNO
Consumer spending slowed sharply early this year in the US. Recently legislated tax cuts and new federal spending will however aid GDP
growth for the rest of the year. The announced tariffs will have a negative, but probably small, impact on growth. Moreover, numerous
exemptions and carve-outs from these tariffs will likely mitigate their effect.
ASPA
JP: early data suggest a further softening GDP growth in Q1 ’18 with residential investment declining, consumer spending restrained by heavy
snowfalls, and imports outpacing exports.
CN: the three rounds of tariffs proposed by the US and the two rounds proposed by CN are highly dangerous. If it is the prelude to an all-out
trade war, then the damage to US, CN, and global growth could be substantial. However, this scenario looks unlikely.
EMERGING
MARKETS
If the tariffs announced by the US and CN take effect, there could be sizeable impacts on global supply chains. The shares of exports going from
Asian economies (AU, KR, JP, ID) to CN are substantial, making them particularly vulnerable. Value added by some countries (e.g. TW, MY,
SG) to CN exports going to the US is also large. Tariffs on CN aerospace, automotive, machinery, information technology industries could help
China’s competitors in DE, JP, MX. Chinese tariffs on US agricultural products could benefit BR and could lift demand for substitutes such as
palm oil products, helping ID & MY.
DEMAND
DEVELOPMENT
In March, global business optimism dropped sharply to the weakest level in over a year. The Global PMI fell, for the 1st time in six months, down
sharply from 54.8 in February to a 16-month low of 53.3. The 1.5-index-point drop was the steepest for two years. Weaker business sentiment
was seen in all four of the largest developed economies (EU, UK, JKP, US).

8 8
Capacity Development 1/3
Source: Alphaliner, carriers
C A P A C I T Y D E V E L O P M E N T
Containership scrapping activity has slowed dramatically from the frenetic
pace of 2016 and early 2017, with only 12 ships for 21,778 TEU sold for
recycling so far this year. Full-year scrapping estimates for 2018 have been
adjusted to only 200,000 TEU and this number could be revised downwards
further if the currently slow pace of ship-breaking does not pick up in the
coming months.
413,982 TEU of container tonnage were recycled in 2017 and 654,862 in 2016.
A further reduction in the rate of vessel scrapping could therefore make
this year’s container ship-breaking volume the lowest in record since
2011.
With more than 1.00 M TEU of new container ship capacity still due for
delivery between April and December this year, the reduced rate of
scrapping has pushed full-year capacity growth estimates up to 6.0%. The
total cellular vessel fleet is thus expected to reach 22.37 M TEU by the end of
the year, compared to 21.10 M TEU at the beginning of 2018.
While the overall idle containership capacity has been reduced
significantly from a record high of 1.60 MTEU in October 2016 to 340,000
TEU as of today, the overall market remains delicate with any slackening in
demand threatening to disrupt the fragile recovery in the containership charter
markets, even as freight rates have started to tumble under the pressure of
excess supply.
DHL Global Forwarding | OFR Market Update | May 2018
PUBLIC
Source: Alphaliner, carriers

9 9
Capacity Development 2/3
Source: Alphaliner, carriers
C A P A C I T Y D E V E L O P M E N T
COSCO and Gold Star Line (GSL) will introduce in early May a dedicated Far East – South Africa service that will directly connect China with South Africa
while wayporting in the Straits in both directions to further connect with their respective South East Asia networks. COSCO will market the service as ‘ZAX3’ while
GSL will use the ‘SA1’ appellation. The service will turn in 9 weeks. It will initially deploy 8 ships of 4,200 TEU providing weekly fixed day sailings with one sailing
skipped. The first effective sailing is scheduled on 8 May. In the southbound direction, it will be the only container service offering a direct connection from
Xingang, Qingdao and Nansha to Durban and Port Elizabeth, compared to rival services that currently offer these links via transhipment.
APL (CMA CGM Group) has unveiled its new Transpacific offer, effective from May this year. 2 weekly loops will be added to the network, bringing to 24 the
number of loops APL operates between Asia and North America. The changes come within a wider service restructuring, unveiled in December by the OCEAN
Alliance partners.
Maersk Line and Hamburg Süd are to withdraw their newly-launched ‘AC-5/ASCA’ service, that focuses on the Far East – NCSA – Caribbean trade, after just 6
sailings. According to a Maersk customer announcement, the loop will be replaced by a revised service starting on 14 May. The revised service will be offered
through an arrangement on the existing East Asia – Mexico – Caribbean – NCSA service operated jointly by CMA CGM, COSCO, Hapag-Lloyd and Hamburg Süd.
Hamburg Süd is to leave the service later this year further to Korea’s Fair Trade Commission decision for Maersk’s acquisition of Hamburg Süd. The new ‘AC-
5/ASCA’ service was launched in this context. Maersk and Hamburg Süd will co-load temporarily on the existing service until withdrawing, presumably this summer, to
continue to serve the Fare East – NCSA-Caribbean trade separately to comply with the Korea decision.
HMM has officially announced its plans for a newbuilding program of 20 eco-friendly large containerships totaling over 350,000 TEU, comprising 12 Megamax
units of over 20,000 TEU, aimed at the Fare East-Europe trade, and 8 maxi-neo-panamaxes of 14,000 TEU, aimed at the Far-East-USEC trade. The announcement
comes in the context of a Korean government’s ‘5 Year Plan for Rebuilding Korean Shipping’ involving HMM as Korea’s flagship carrier.
DHL Global Forwarding | OFR Market Update | May 2018
PUBLIC
Source: Alphaliner, carriers

10 10
Capacity Development 3/3
Source: Alphaliner, carriers
C A P A C I T Y D E V E L O P M E N T
COSCO Shipping has received the COSCO SHIPPING GEMINI 20,119 TEU, the 3rd unit of a Megamax newbuilding program totaling 17 vessels of 19,000-21,000
TEU. The COSCO SHIPPING GEMINI was built by the Shanghai Waigaoqiao Shipbuilding (CSSC) and joined OCEAN Alliance Asia-Europe ‘NEU2’ loop on 14
April.
The COSCO SHIPPING LEO 19,273 TEU (4th of the Megamax newbuilding program), was also finally delivered to COSCO Shipping. Her phasing in, had to be
postponed by 2 weeks after a collision with a cargo vessel while on final sea trials. The COSCO SHIPPING LEO has also joined the OCEAN Alliance Asia-Europe
‘NEU2’ loop on 28 April.
Evergreen has taken in charge the EVER GOLDEN, 1st of 11 20,160 TEU ‘megamax’ ULCS contracted in October 2015 from Japan’s Imabari Group. The EVER
GOLDEN was delivered on 30 March and sailed from Japan to Qingdao in ballast to join the OCEAN Alliance Asia – Europe loop ‘NEU3’.
The idle containership fleet of over 500 TEU has fallen to 84 units for 294,282 TEU as at 16 April, with continued strong demand for fresh tonnage pushing
down the idle fleet figures. The idle fleet now stands at 1.4% of the total cellular fleet, compared to 2.9% (626,996 TEU) a month ago. Carriers are pushing ahead
with the launch of new services and with vessel upgrades on various services for the summer, which will continue to draw on the current idle fleet. Most of
the existing idle ships of above 5,000 TEU are expected to return to service in the coming weeks, which will further push down the idle fleet numbers. Charter rates
continue to strengthen and the availability of spot tonnage is shrinking.
DHL Global Forwarding | OFR Market Update | May 2018
PUBLIC
Source: Alphaliner, carriers

11 11
Carriers (1/2)
Source: Alphaliner, carriers
C A R R I E R S
COSCO Shipping announced, together with joint-acquirer SIPG, a general cash offer to acquire OOIL (Orient Overseas International Ltd.) on 7 July 2017. The
COSCO – OOIL deal has already passed 3 pre-conditions including the anti-trust reviews in the US (on 23 October 2017) and the EU (on 5 December 2017) and
the approval of COSCO Shipping Holdings’ shareholders (on 16 October 2017). However it still requires approval from the Committee on Foreign Investment in
the United States (CFIUS) and from the Chinese regulators (MOFCOM and NDRC).
According to the OOIL offer document submitted by COSCO, the deal has to be completed by 30 June 2018. OOIL will receive a break fee of $253 M if COSCO
fails to complete the deal by the deadline. However the fee will be waived if the transaction ‘failed to meet the requirements of CFIUS’, even though the CFIUS
clearance was not listed as 1 of the 5 pre-conditions for the offer from COSCO.
The main issue at stake is OOCL’s Long Beach Container Terminal (LBCT), viewed as one of OOIL’s key assets, which will come under COSCO’s control upon
completion of the OOIL takeover. A key question is, whether COSCO’s control of the fully-automated terminal on the US West Coast, with 40-year lease
expiring in 2052 that is worth $4.6 Bn in total, could harm US national security interests. COSCO already controls two separate container terminals in the Los
Angeles-Long Beach San Pedro Bay area. COSCO has confirmed beginning of April, that they are still in discussions with the US Treasury Department’s
CFIUS, with attention apparently focused on COSCO and OOIL’s US terminal assets. However, COSCO officials maintained that they expect the deal to close
before the 30 June deadline.
DHL Global Forwarding | OFR Market Update | May 2018
PUBLIC

12 12
Carriers (2/2)
Source: Alphaliner, carriers
C A R R I E R S - Financial performance FY 2017
The container shipping operations of 13 of the top 15 carriers recorded an aggregated operating income of $3.28 Bn in 2017, compared to combined
operating losses of -$4.19 Bn in 2016*. The combined revenues from the container shipping operations of the carriers surveyed reached $112 Bn in 2017,
compared to $97 Bn in 2016, for a growth of 14.9%. Average operating margins of 2.0% in 2017, based on a simple average calculation of the carriers surveyed,
or 2.9% based on cumulative average, was the highest for the carriers since 2010. However the recovery has stuttered as carriers’ average operating margins
slumped in the 4th Q 2017 to only 0.9% from a high of 5.0% in the 3rd Q. The negative trend has continued into the 1st Q 2018 as carriers faced falling freight
rates, lower capacity utilization as well as rising fuel and vessel charter costs. The backhaul freight rates, which surged in 2017 and helped to push up carriers’
margins last year, have also fallen back and look set to come under further pressure. The impact of a looming US-China trade war on container volumes also
remains to be assessed.
DHL Global Forwarding | OFR Market Update | May 2018
PUBLIC
*incl losses incurred by Hanjin Shipping which filed insolvency in Aug 2016 / Source: Alphaliner, carriers
Average revenue by carrier 2017 vs 2016
FY 2017

13 13 B A C K - U P
PUBLIC

14 14
Source: DGF
Market Outlook April 2018 – Ocean Freight Rates Additional Trades (1/2)
O C E A N F R E I G H T R A T E S O U T L O O K
EURO – AMLA Carriers are reporting fully booked vessels and rollings are taking place. Pre-bookings well in advance are recommended. Rates are remaining
stable for now, but intentions for further increases are still in place.
EURO – SSA Rates remain stable and space is available. .
AMNO – MENAT
Rates are in the rise approx. $50/TEU with major carriers.
Space is a major issue especially from US Gulf Coast and USEC is also heavy
With bookings are out 4-5 weeks
AMNO – SSA No Space issues or service changes on USA to South & West Africa services
Rates are stable with no increase/decrease expected until new year or in the first quarter of 2018
AMNO – AMLA
Rates ticking upward USA to WCSA. Direct carrier GRI action applied April.
US to ECSA capacity slowly tightening, GRI’s announced but postpone 3 months running.
US to CENAC/Caribbean stable w/new Gulf-CENAC service stressing stable capacity.
AMLA Exports
No space/Container rolls SAWC to all destinations, equipment deficits at Colombia CY’s
Bookings need 4-6 weeks in advance from vessel departure;
Commodity season starts in April and rates will increase again
AMNO – ASPA Space is tight for all carriers and pre-booking 2-3 weeks in advance is recommended.
Pocket issues of equipment deficit in IPI location.
Source: DGF team
Source: DGF team
Source: DGF team
DHL Global Forwarding | OFR Market Update | May 2018
PUBLIC

15 15
Market Outlook April2018 – Ocean Freight Rates Additional Trades (2/2)
O C E A N F R E I G H T R A T E S O U T L O O K
EURO MED - AMNO Increases will occur during April (PSS/rate increases/costs connected to US deliveries)
EUR MED – AMLA Stable/some increases depending on service and provider
EURO MED – ASPA Stable/some increases depending on service and provider
EURO MED – MENAT Stable/some increases depending on service and provider
EURO MED – SSA Unchanged/Stable
ASPA-SPAC All carrier are seen to extend/reduce rates from April to at least first half of May. Only 1 carrier, Hamburg Sud has announced a planned
GRI in mid May.
DHL Global Forwarding | OFR Market Update | May 2018
Source: DGF
PUBLIC

16 16
Carriers
Drewry’s Altman Z-Score as of 1 April 2018
DHL Global Forwarding | OFR Market Update | May 2018
PUBLIC
Source: Drewry Sea & Air Shipper Insight February 2018, 1) parent of OOCL, 2) parent of Cosco Container Lines; Z-score is calculated as follows: T1 = (Current Assets - Current Liabilities) / Total Assets, T2 = Retained Earnings / Total Assets, T3 =
Annualized EBIT / Total Assets, T4 = Book Value of Equity / Total Liabilities, T5 = Annualized Sales / Total Assets, Z-score bankruptcy rating = 1.2*T1 + 1.4*T2 + 3.3*T3 + 0.6*T4 + 1.0*T5
The Z-Score is a statistical analysis to predict a company’s probability of failure in the next two years, using data from the company’s financial statement.
Z-Score 2.99 = company is “safe”; Z-Score between 1.8 and 2.99 = exercise caution (“grey zone”); Z-Score 1.8 = Higher risk of the company going bankrupt
(“distress zone”)
Company Period Period Ended Units Net Sales EBIT Assets Book Value
of Equity
Liabilities Retained
Earnings Z-Score
Total Current Total Current
OOIL 1) Annual 31. Dez 17 million US$ 6'108 208 10'069 2'965 4'683 5'387 1'380 4'620 2.03
CMA CGM Annual 31. Dez 17 million US$ 21'116 1'574 19'657 5'624 5'644 14'013 5'956 4'619 1.89
AP Moller-Maersk Annual 31. Dez 17 million US$ 30'945 641 63'227 24'081 31'425 31'802 14'757 26'835 1.89
Wan Hai 9 months 30. Sep 17 million NT$ 44'970 2'480 75'688 30'509 34'074 41'614 20'588 11'142 1.79
NYK group 9 months 31. Dez 17 billion Yen 1'631 25 2'117 580 588 1'528 524 342 1.57
K Line group 9 months 31. Dez 17 billion Yen 884 7 1'054 397 260 794 285 66 1.56
China Cosco 2) 9 months 30. Sep 17 million RMB 67'599 4'567 132'443 45'728 42'981 89'462 42'854 32'765 1.49
Evergreen Marine Corp 9 months 30. Sep 17 million NT$ 113'068 5'893 193'384 62'178 59'025 134'359 45'053 11'810 1.37
MOL group 9 months 31. Dez 17 billion Yen 1'240 24 2'252 465 714 1'538 444 383 1.31
Hapag-Lloyd Holding 9 months 30. Sep 17 million euro 7'314 268 15'817 2'840 5'780 10'037 3'323 3'157 1.28
Pacific International Lines 6 months 30. Jun 17 million US$ 1'878 98 5'698 1'290 1'804 3'894 1'907 1'034 1.17
Yang Ming 9 months 30. Sep 17 million NT$ 99'263 501 131'096 24'696 17'670 113'426 44'536 -1'752 0.92
Hyundai Merchant Marine 9 months 30. Sep 17 billion Won 3'840 -289 3'442 1'206 636 2'806 774 -2'467 0.40
Zim Annual 31. Dez 17 million US$ 2'978 135 1'802 580 -93 18'996 687 -1'892 0.36

17 17
Topic of the Month
Top 12 Carriers by Operated Capacity (in Mil. TEU), December 2017
0
1
2
3
4
5
APM-Maersk,
HamburgSüd
MSC COSCO,OOCL
CMA CGM,Mercosul
Hapag-Lloyd ONE (NYK,MOL, K Line)
Evergreen Yang Ming PIL Zim HMM Wan Hai
DHL Global Forwarding | OFR Market Update | May 2018
Source: Alphaliner, incl. pending mergers
After triggering regulatory approval processes in 23 jurisdictions, Maersk
finally aquired Hamburg Süd.
Over the next five months, Maerk will terminate some of Hamburg Süd’s
overlapping services on certain trades.
PUBLIC

18 18
Market Outlook – Volume Outlook in Main Trade Lanes, 2017 Estimate &
2018/21Growth Forecast in %
N O R T H
A M E R I C A I n c l .
M E X I C O
3.5 mTEU +0.5%
1.7 mTEU +0.4%
1.7 mTEU +3.1%
2.0 mTEU +3.1%
N O R T H
A M E R I C A I n c l .
M E X I C O
L A T I N
A M E R I C A
E U R O P E
I n c l . M E D
11.9 mTEU +1.8%
7.2 mTEU +2.4%
7.8 mTEU +1.6%
16.2 mTEU +2.3%
1.8 mTEU +0.9%
4.6 mTEU +2.7%
2017e, in mTEU 2018e-2021e CAGR, in %
F A R E A S T
I N T R A A S I A
excl. Oceania
35.6 mTEU +3.6%
2.5 mTEU
+2.4%
2.0 mTEU
+1.8%
L A T I N
A M E R I C A
G L O B A L C O N T A I N E R T R A D E 2 0 1 7 e 1 3 9 . 8 m T E U + 2 . 6 % C A G R 2 0 1 8 e - 2 0 2 1 e
Mid-term growth is mainly driven by Asian tradelanes.
Source: Seabury Nov17 update
DHL Global Forwarding | OFR Market Update | May 2018
PUBLIC

19 19
Global Capacity Development all Trades
20 19 23 23 23 24
28 28 27
Highest scrapping level ever Idling remains high
[TTEU]
602
(May 2018)
1,324
Q4
2016
Q4
2015
1,359
Q4
2014
228
Q4
2013
779
Q4
2012
809
Q4
2011
595
Q4
2010
356
Q4
2009
1,480
Returning
capacity
well
absorbed
by
demand
3.0%
[TTEU]
381
2013
444
2012
332
2011
75
2010
131
2009
351
+239%
Apr 17
YTD
205
2016
654
2015
193
2014
Average age Net capacity growth remains low
Net capacity growth 2017E
Scrapping Net capacity
growth
2.7%
-3.3%
-1.8%
Scheduled
capacity growth
Post-ponements
7.7%
Orders placed by year [TEU m] Vessel deliveries by year [TEU m]
0.2
2015
0.0
2016
2.2
2014
1.1
2013
2.0
2012
0.4
2011
1.8
2010
0.6
2009
0.1
2008
1.2
2007
3.2
Apr17
YTD
+33%
1.2
2017E 2016
0.9
2015
1.7
2014
1.5
2013
1.3
2012
1.3
2011
1.2
2010
1.4
2009
1.2
2008
1.4
2007
1.4 15,300 TEU
Very few deliveries expected post 2018
Source: Alphaliner (May 2017), carrier views
DHL Global Forwarding | OFR Market Update | May 2018
PUBLIC

20 20
Carrier Mergers, Acquisitions and Alliances
M E R G E R S A N D A Q U I S I T I O N S
China
Shipping Cosco
OOCL TBC
Evergreen APL CMA
CGM Hapag
Lloyd
United
Arab
Shipping
Hyundai
Merchant
Marine
Hamburg
Süd Maersk
Line MSC K Line MOL NYK
Yang
Ming Hanjin
Shipping
CHINA COSCO SHIPPING EVER
GREEN CMA CGM HAPAG-LLOYD/UASC
HYUNDAI
MERCHANT
MARINE MAERSK LINE MSC
OCEAN NETWORK
EXPRESS (ONE) YANG
MING Bankrupt
A L L I A N C E S
F O R M E R A L L I A N C E S P R E S E N T A L L I A N C E S
2M MAERSK LINE
MSC OCEAN 3
CMA CGM
CHINA SHIPPING
UNITED ARAB
SHIPPING COMPANY
2M
MAERSK LINE
MSC
HMM (strategic
cooperation)
OCEAN
ALLIANCE
OOCL
CMA CGM
CHINA COSCO SHIPPING
EVERGREEN
G6
HAPAG-LLOYD
MOL
NYK
APL
HYUNDAI
MERCHANT
MARINE
OOCL
CKYHE
COSCO
EVERGREEN
HANJIN
SHPPING
K-LINE
YANG MING THE ALLIANCE
HAPAG-LLOYD/UASC
ONE
YANG MING
Source: Carriers
DHL Global Forwarding | OFR Market Update | May 2018
PUBLIC

21 21
Acronyms and Explanations
2M - Carrier Alliance: Maersk / MSC OCRS - Operational Cost Recovery surcharge
AMLA - Latin America OWS - Overweight Surcharge
AMNO - North America PH - Philippines
AR - Argentina PNW - Pacific North West
ASPA - AsiaPacific Ppt. - Percentage points
BR - Brazil PSW - Pacific South West
CAGR - Compound Annual Growth Rate RR(I) - Rate Restoration
CENAC - Central Amercia and Caribbean SAEC - South America East Coast
CKYHE - Carrier Alliance: Cosco, K-Line, YangMing, Hanjin and Evergreen SAWC - South America West Coast
CNC - CNC Line (Cheng Lie Navigation Co. Ltd.) SOLAS - Safety of Life at Sea
DG - Dangerous Goods SPRC - South People’s Republic of China – South China
DWT - Dead Weight Tonnage SSA - Sub-Saharan Africa
EB - Eastbound SSL - Steam Ship Line
ECSA - East Coast South America T - Thousands
EURO - Europe TEU - Twenty foot equivalent unit (20‘ container)
FMC - US Federal Marine Commission TP - Trans Pacific
G6 - Carrier Alliance: APL, Hapag Lloyd, Hyundai, MOL, NYK and OOCL TSA - Trans Pacific Stabilization Agreement
GRI - General Rate Increase ULCS - Ultra Large Container Ship
HJS - Hanjin Shipping USGC - US Gulf Coast
HMM - Hyundai US FMC - US Federal Maritime Commission
HSUD - Hamburg Süd USEC - US East Coast
HWS - Heavy Weight Surcharge USWC - US West Coast
IA - Intra Asia VGM - Verified Gross Mass
IPBC - India Pakistan Bangladesh Colombo VLCS - Very Large Container Ship
IPI - Inland Point Intermodal VSA - Vessel Sharing Agreement
ISC - Indian Sub Continent WB - Westbound
MENAT - Middle East and North Africa WCSA - West Coast South America
mn - Millions YML - Yang Ming Line
MoM - Month-on-Month YoY - Year-on-Year
NOO - Non-operating (vessel) owners YTD - Year-to-Date
Ocean 3 - Carrier Alliance: CMA, UASC, China Shipping
DHL Global Forwarding | OFR Market Update | May 2018
PUBLIC