dhs comparative reports 49 - dhsprogram.com · vi appendix table 8 percent of facilities with...
TRANSCRIPT

DHS COMPARATIVEREPORTS 49
FACILITY-BASED NUTRITION READINESS AND DELIVERY OF MATERNAL AND CHILD NUTRITION SERVICES USING SERVICE PROVISION ASSESSMENT SURVEYS
September 2018
This publication was produced for review by the United States Agency for International Development (USAID). The report was prepared byLindsay Mallick, Gheda Temsah, and Rukundo K. Benedict.

DHS Comparative Reports No. 49
Facility-based Nutrition Readiness and Delivery of Maternal and Child Nutrition Services Using Service Provision
Assessment Surveys
Lindsay Mallick1,2 Gheda Temsah3
Rukundo K. Benedict2,3
ICF Rockville, Maryland, USA
September 2018
1 Avenir Health 2 The DHS Program 3 ICF Corresponding author: Rukundo Kambarami Benedict, International Health and Development, ICF, 530 Gaither Road, Suite 500, Rockville, MD 20850, USA; phone: 301-407-0537; fax: 301-407-0211; email: [email protected]

Acknowledgments: We would like to thank Tom Fish for designing maps, Anika Hannan for formatting tables and figures, Allison Schmale for data preparation, and Sarah Yang for creating the brief summarizing indicators. Special thanks to Sorrel Namaste for her comments and Melinda Munos for her technical review. Finally, we would like to thank Erin Milner (USAID) for her conceptual support of this report.
Editor: Diane Stoy Document Production: Joan Wardell
This study was carried out with support provided by the United States Agency for International Development (USAID) through The DHS Program (#AID-OAA-C-13-00095). The views expressed are those of the authors and do not necessarily reflect the views of USAID or the United States Government.
The DHS Program assists countries worldwide in the collection and use of data to monitor and evaluate population, health, and nutrition programs. Additional information about The DHS Program can be obtained from ICF, 530 Gaither Road, Suite 500, Rockville, MD 20850, USA; telephone: +1 301-407-6500, fax: +1 301-407-6501, email: [email protected], internet: www.DHSprogram.com.
Recommended citation:
Mallick, Lindsay, Gheda Temsah, and Rukundo K. Benedict. 2018. Facility-based Nutrition Readiness and Delivery of Maternal and Child Nutrition Services Using Service Provision Assessment Surveys. DHS Comparative Reports No. 49. Rockville, Maryland, USA: ICF.

iii
CONTENTS
TABLES ........................................................................................................................................................ v FIGURES ..................................................................................................................................................... ix PREFACE .................................................................................................................................................... xi ABSTRACT................................................................................................................................................ xiii
1 INTRODUCTION AND RATIONALE ............................................................................................... 1
2 DATA AND METHODS ................................................................................................................... 3 2.1 Data ..................................................................................................................................... 3 2.2 Methods .............................................................................................................................. 6
3 RESULTS ...................................................................................................................................... 11 3.1 Antenatal Nutrition ............................................................................................................. 11
3.1.1 Service readiness ................................................................................................ 11 3.1.2 Service delivery .................................................................................................... 12 3.1.3 Service readiness and delivery by region and facility background
characteristics ...................................................................................................... 15 3.2 Child Nutrition .................................................................................................................... 19
3.2.1 Service readiness ................................................................................................ 20 3.2.2 Service delivery .................................................................................................... 20 3.2.3 Service readiness and delivery by region and facility background
characteristics ...................................................................................................... 23
4 DISCUSSION ................................................................................................................................. 25 4.1 Summary of Findings ........................................................................................................ 25 4.2 Limitations ......................................................................................................................... 26 4.3 Recommendations for Next Steps .................................................................................... 27 4.4 Conclusions ....................................................................................................................... 28
REFERENCES ............................................................................................................................................ 29
APPENDIX .................................................................................................................................................. 33


v
TABLES
Table 1 Sample design of included surveys .............................................................................. 4
Table 2a Nutrition indicators in antenatal care services .............................................................. 8
Table 2b Nutrition indicators in curative child care and growth monitoring services ................... 9
Table 3 Percent of facilities with capacity to provide nutrition-related care among facilities with ANC and percent of providers with training on maternal nutrition, by country ................................................................................ 12
Table 4 Percent of facilities with capacity to provide nutrition interventions among facilities with curative child care services and percent of providers with training on child nutrition topics, by country ........................................................ 20
Table 5 Availability of infant and child scales among facilities that provide curative child care services, by country and region ................................................................. 24
Appendix Table 1 Percent of facilities providing antenatal care services, curative child care services, and growth monitoring services, by country ................................................ 33
Appendix Table 2 Percent of facilities with capacity to provide nutrition-related care in ANC, percent of clients observed and reporting nutrition-related counseling among clients attending ANC, and percent of providers with training on nutritional assessment in pregnancy, by country ........................................................................ 34
Appendix Table 3 Percent of facilities with capacity to provide nutrition-related care in ANC, percent of clients observed and reporting nutrition-related counseling among clientsattending ANC, and percent of providers with training on nutritional assessment in pregnancy, by background characteristics, Bangladesh SPA 2014 ................................................................................................................... 36
Appendix Table 4 Percent of facilities with capacity to provide nutrition-related care in ANC, percent of clients observed and reporting nutrition-related counseling among clientsattending ANC, and percent of providers with training on nutritional assessment in pregnancy, by background characteristics, Haiti SPA 2013 .............. 37
Appendix Table 5 Percent of facilities with capacity to provide nutrition-related care in ANC, percent of clients observed and reporting nutrition-related counseling among clientsattending ANC, and percent of providers with training on nutritional assessment in pregnancy, by background characteristics, Kenya SPA 2010 ........... 38
Appendix Table 6 Percent of facilities with capacity to provide nutrition-related care in ANC, percent of clients observed and reporting nutrition-related counseling among clientsattending ANC, and percent of providers with training on nutritional assessment in pregnancy, by background characteristics, Malawi SPA 2013-14 ..... 39
Appendix Table 7 Percent of facilities with capacity to provide nutrition-related care in ANC, percent of clients observed and reporting nutrition-related counseling among clientsattending ANC, and percent of providers with training on nutritional assessment in pregnancy, by background characteristics, Namibia SPA 2009 ........ 40
vi
Appendix Table 8 Percent of facilities with capacity to provide nutrition-related care in ANC, percent of clients observed and reporting nutrition-related counseling among clientsattending ANC, and percent of providers with training on nutritional assessment in pregnancy, by background characteristics, Nepal SPA 2015 ............ 41
Appendix Table 9 Percent of facilities with capacity to provide nutrition-related care in ANC, percent of clients observed and reporting nutrition-related counseling among clientsattending ANC, and percent of providers with training on nutritional assessment in pregnancy, by background characteristics, Rwanda SPA 2007 ................................................................................................................... 42
Appendix Table 10 Percent of facilities with capacity to provide nutrition-related care in ANC, percent of clients observed and reporting nutrition-related counseling among clientsattending ANC, and percent of providers with training on nutritional assessment in pregnancy, by background characteristics, Senegal SPA 2016 ....................................................................................................................... 43
Appendix Table 11 Percent of facilities with capacity to provide nutrition-related care in ANC, percent of clients observed and reporting nutrition-related counseling among clientsattending ANC, and percent of providers with training on nutritional assessment in pregnancy, by background characteristics, Tanzania SPA 2014-15 .............................................................................................................. 44
Appendix Table 12 Percent of facilities with capacity to provide nutrition-related care in ANC, percent of clients observed and reporting nutrition-related counseling among clientsattending ANC, and percent of providers with training on nutritional assessment in pregnancy, by background characteristics, Uganda SPA 2007 ....................................................................................................................... 45
Appendix Table 13 Availability of IFA supplements among facilities that provide ANC and percent of women provided or prescribed IFA supplements, by country and region ................................................................................................................... 46
Appendix Table 14 Percent of facilities with capacity to provide nutrition-related care in curative child care services, percent of clients observed and caretakers reporting nutrition-related counseling among clients attending sick child care visits, and percent of providers with training on child nutrition topics, by country ........................................ 47
Appendix Table 15 Percent of facilities with capacity to provide nutrition-related care in curative child care services, percent of clients observed and caretakers reporting nutrition-related counseling among clients attending sick child care visits, and percent of providers with training on child nutrition topics, by facility background characteristics, Bangladesh SPA 2014 ...................................................................... 49
Appendix Table 16 Percent of facilities with capacity to provide nutrition-related care in curative child care services, percent of clients observed and caretakers reporting nutrition-related counseling among clients attending sick child care visits, and percent of providers with training on child nutrition topics, by facility background characteristics, Haiti SPA 2013 .................................................................................. 50

vii
Appendix Table 17 Percent of facilities with capacity to provide nutrition-related care in curative child care services, percent of clients observed and caretakers reporting nutrition-related counseling among clients attending sick child care visits, and percent of providers with training on child nutrition topics, by facility background characteristics, Kenya SPA 2010 ............................................................................... 51
Appendix Table 18 Percent of facilities with capacity to provide nutrition-related care in curative child care services, percent of clients observed and caretakers reporting nutrition-related counseling among clients attending sick child care visits, and percent of providers with training on child nutrition topics, by facility background characteristics, Malawi SPA 2013-14 ......................................................................... 52
Appendix Table 19 Percent of facilities with capacity to provide nutrition-related care in curative child care services, percent of clients observed and caretakers reporting nutrition-related counseling among clients attending sick child care visits, and percent of providers with training on child nutrition topics, by facility background characteristics, Namibia SPA 2009 ............................................................................ 53
Appendix Table 20 Percent of facilities with capacity to provide nutrition-related care in curative child care services, percent of clients observed and caretakers reporting nutrition-related counseling among clients attending sick child care visits, and percent of providers with training on child nutrition topics, by facility background characteristics, Nepal SPA 2015 ................................................................................ 54
Appendix Table 21 Percent of facilities with capacity to provide nutrition-related care in curative child care services, percent of clients observed and caretakers reporting nutrition-related counseling among clients attending sick child care visits, and percent of providers with training on child nutrition topics, by facility background characteristics, Rwanda SPA 2007 ............................................................................ 55
Appendix Table 22 Percent of facilities with capacity to provide nutrition-related care in curative child care services, percent of clients observed and caretakers reporting nutrition-related counseling among clients attending sick child care visits, and percent of providers with training on child nutrition topics, by facility background characteristics, Senegal SPA 2016 ............................................................................ 56
Appendix Table 23 Percent of facilities with capacity to provide nutrition-related care in curative child care services, percent of clients observed and caretakers reporting nutrition-related counseling among clients attending sick child care visits, and percent of providers with training on child nutrition topics, by facility background characteristics, Tanzania SPA 2014-15 ..................................................................... 57
Appendix Table 24 Percent of facilities with capacity to provide nutrition-related care in curative child care services, percent of clients observed and caretakers reporting nutrition-related counseling among clients attending sick child care visits, and percent of providers with training on child nutrition topics, by facility background characteristics, Uganda SPA 2007 ............................................................................. 58

ix
FIGURES
Figure 1a Percent distribution of facilities according to facility type, by country .......................... 5
Figure 1b Percent distribution of facilities according to managing authority, by country .............. 5
Figure 1c Percent distribution of facilities according to locale, by country ................................... 6
Figure 2 Percent of facilities providing ANC services, by country ............................................ 11
Figure 3 Percent of women prescribed or provided IFA supplements during an ANC visit and percent of women receiving IFA-related counseling among those prescribed or provided IFA supplements, by country ................................................. 13
Figure 4 Percent of women receiving weight assessment and maternal nutrition counseling during an ANC visit, by country ................................................................ 14
Figure 5 Percent of women assessed or tested for anemia during an ANC visit, by country ................................................................................................................... 14
Figure 6 Percent of women receiving breastfeeding counseling during an ANC visit, by country ................................................................................................................... 15
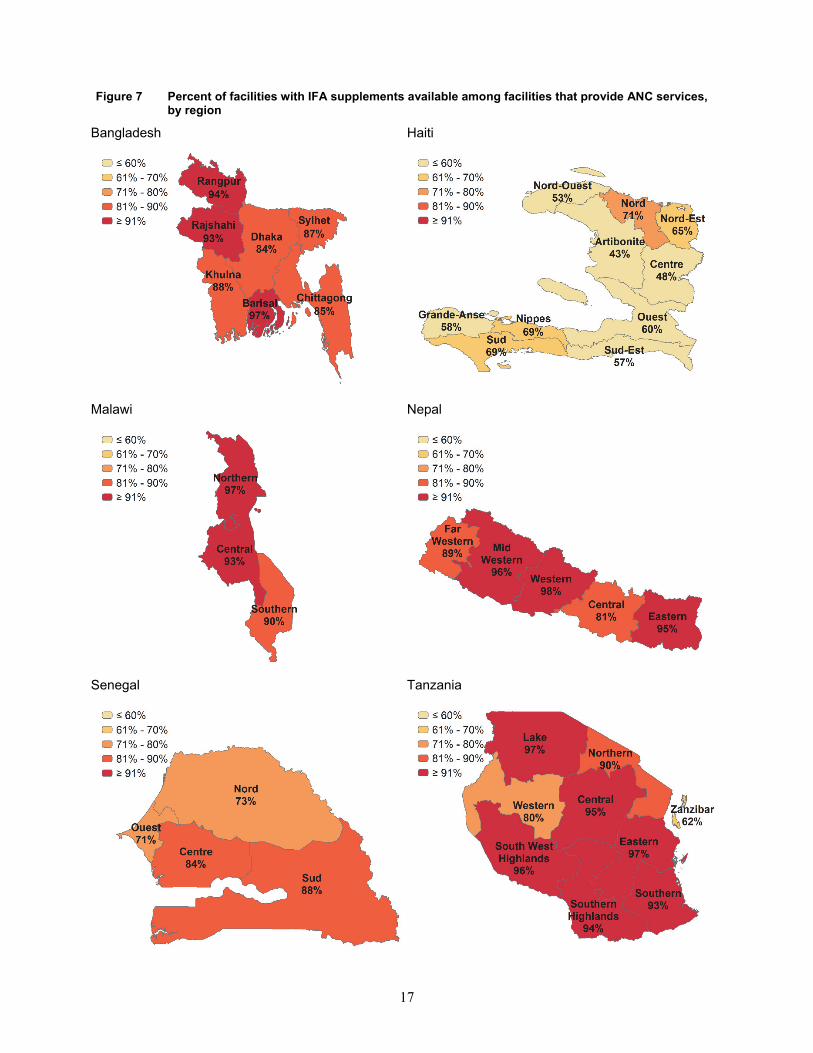
Figure 7 Percent of facilities with IFA supplements available among facilities that provide ANC services, by region ............................................................................................. 17
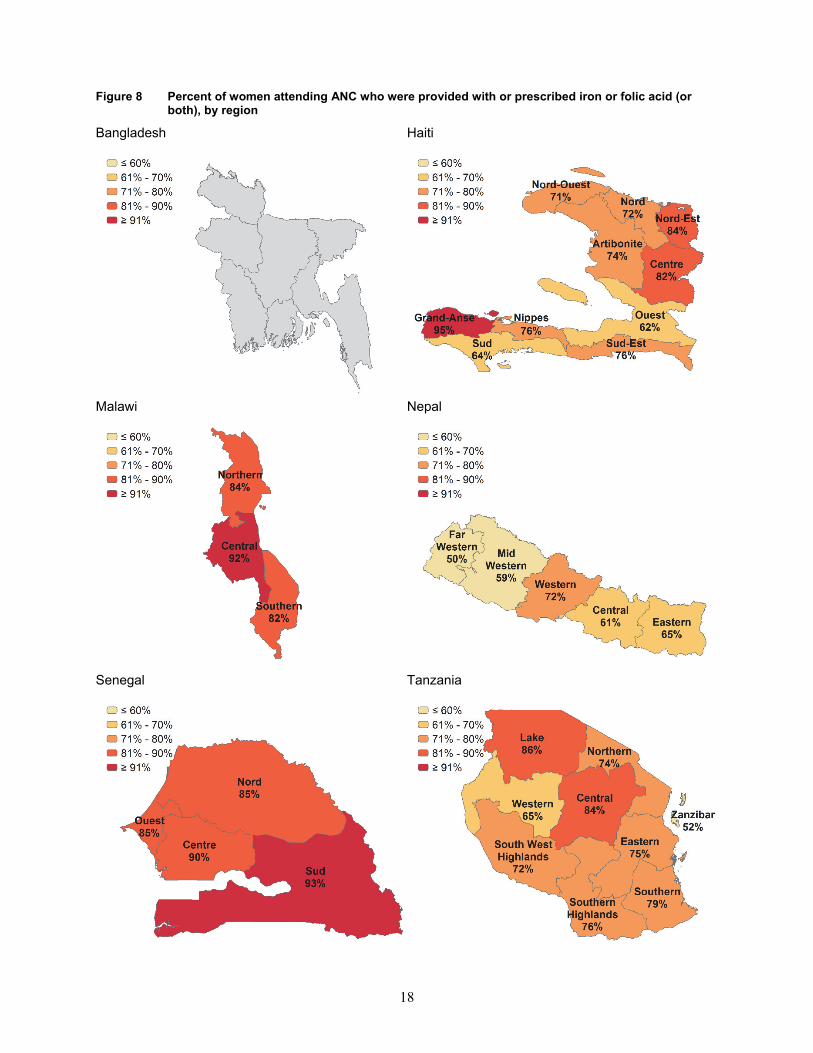
Figure 8 Percent of women attending ANC who were provided with or prescribed iron or folic acid (or both), by region ...................................................................................... 18
Figure 9 Percent of facilities providing curative care and growth monitoring services for children, by country .................................................................................................... 19
Figure 10 Percent of children whose weight was measured and percent of children whose weight was plotted on a growth chart among children weighed during sick child consultations, by country ............................................................................................ 21
Figure 11 Percent of children who received vitamin A during sick child visits, by country ......... 22
Figure 12 Percent of caretakers who discussed feeding or breastfeeding practices during illness or wellness during sick child visits, by country ..................................... 22


xi
PREFACE
The Demographic and Health Surveys (DHS) Program is one of the principal sources of international data on fertility, family planning, maternal and child health, nutrition, mortality, environmental health, HIV/AIDS, malaria, and provision of health services.
One of the objectives of The DHS Program is to provide policymakers and program managers in low- and middle-income countries with easily accessible data on levels and trends for a wide range of health and demographic indicators. DHS Comparative Reports provide such information, usually for a large number of countries in each report. These reports are largely descriptive, without multivariate methods, but when possible they include confidence intervals and/or statistical tests.
The topics in this series are selected by The DHS Program in consultation with the U.S. Agency for International Development.
It is hoped that the DHS Comparative Reports will be useful to researchers, policymakers, and survey specialists, particularly those engaged in work in low- and middle-income countries.
Sunita Kishor Director, The DHS Program


xiii
ABSTRACT
Persistent malnutrition in low- and middle-income countries requires an exploration of nutrition-related services provided by health facilities in order to identify potential areas for future interventions. The Demographic and Health Surveys (DHS) Program Service Provision Assessment (SPA) surveys provide nationally representative facility data for such exploration. The SPA surveys provide key information about service readiness (availability of resources required to perform services) and service delivery (care and counseling that clients receive during consultations) within facilities.
This report identifies 40 indicators of nutrition intervention readiness and delivery as part of antenatal care (ANC) and sick child care according to SPA surveys conducted in 10 countries. We first describe the availability of ANC and sick child care at the national level. We then describe service readiness in terms of availability of commodities and provider training, service delivery, and, more specifically, counseling provided during ANC and sick child visits related to nutrition. We describe regional-level estimates for selected indicators, including the availability and provision of iron and folic acid (IFA) supplements and the availability of infant and child scales. Finally, we provide supplemental information on nutrition-related readiness according to facility background characteristics.
This report demonstrates variation in the availability of medication and equipment for pregnant women and children across countries. Supplement availability ranged from 58%-92% for IFA among women and from 4%-70% for iron among children. Availability of adult weighing scales was over 88% across countries, while availability of child and infant scales ranged from 35%-95%. Provider training for nutrition-related topics was low, ranging from 11%-25% for nutritional assessment in pregnancy to 14%-43% for training in infant and young child feeding practices. Observations of counseling on breastfeeding and maternal nutrition during ANC ranged from 1%-13% and 33%-48%, respectively. Overall, regional variation within countries was less than variation across countries, and there were no strong trends when comparing availability by facility background characteristics. However, a key finding of this study is that across all countries, there is considerable room for improvement in provider training and provider counseling on nutrition-related topics, particularly breastfeeding practices. This indicates a need for new or strengthened strategies to boost training among providers and further investigations into the extent that lack of provider training leads to poor nutrition practices.
KEYWORDS: antenatal care, breastfeeding, complementary feeding, growth monitoring, health facility assessment, IFA supplementation, maternal nutrition, service provision assessment

1
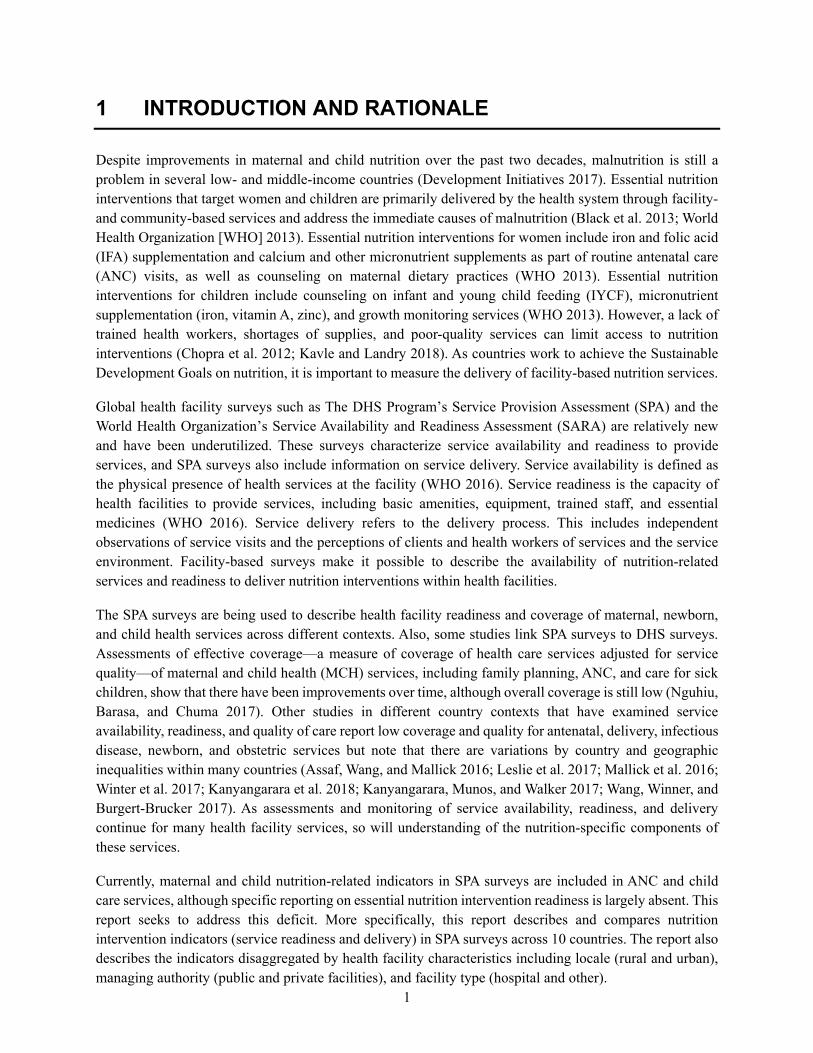
1 INTRODUCTION AND RATIONALE
Despite improvements in maternal and child nutrition over the past two decades, malnutrition is still a problem in several low- and middle-income countries (Development Initiatives 2017). Essential nutrition interventions that target women and children are primarily delivered by the health system through facility- and community-based services and address the immediate causes of malnutrition (Black et al. 2013; World Health Organization [WHO] 2013). Essential nutrition interventions for women include iron and folic acid (IFA) supplementation and calcium and other micronutrient supplements as part of routine antenatal care (ANC) visits, as well as counseling on maternal dietary practices (WHO 2013). Essential nutrition interventions for children include counseling on infant and young child feeding (IYCF), micronutrient supplementation (iron, vitamin A, zinc), and growth monitoring services (WHO 2013). However, a lack of trained health workers, shortages of supplies, and poor-quality services can limit access to nutrition interventions (Chopra et al. 2012; Kavle and Landry 2018). As countries work to achieve the Sustainable Development Goals on nutrition, it is important to measure the delivery of facility-based nutrition services.
Global health facility surveys such as The DHS Program’s Service Provision Assessment (SPA) and the World Health Organization’s Service Availability and Readiness Assessment (SARA) are relatively new and have been underutilized. These surveys characterize service availability and readiness to provide services, and SPA surveys also include information on service delivery. Service availability is defined as the physical presence of health services at the facility (WHO 2016). Service readiness is the capacity of health facilities to provide services, including basic amenities, equipment, trained staff, and essential medicines (WHO 2016). Service delivery refers to the delivery process. This includes independent observations of service visits and the perceptions of clients and health workers of services and the service environment. Facility-based surveys make it possible to describe the availability of nutrition-related services and readiness to deliver nutrition interventions within health facilities.
The SPA surveys are being used to describe health facility readiness and coverage of maternal, newborn, and child health services across different contexts. Also, some studies link SPA surveys to DHS surveys. Assessments of effective coverage—a measure of coverage of health care services adjusted for service quality—of maternal and child health (MCH) services, including family planning, ANC, and care for sick children, show that there have been improvements over time, although overall coverage is still low (Nguhiu, Barasa, and Chuma 2017). Other studies in different country contexts that have examined service availability, readiness, and quality of care report low coverage and quality for antenatal, delivery, infectious disease, newborn, and obstetric services but note that there are variations by country and geographic inequalities within many countries (Assaf, Wang, and Mallick 2016; Leslie et al. 2017; Mallick et al. 2016; Winter et al. 2017; Kanyangarara et al. 2018; Kanyangarara, Munos, and Walker 2017; Wang, Winner, and Burgert-Brucker 2017). As assessments and monitoring of service availability, readiness, and delivery continue for many health facility services, so will understanding of the nutrition-specific components of these services.
Currently, maternal and child nutrition-related indicators in SPA surveys are included in ANC and child care services, although specific reporting on essential nutrition intervention readiness is largely absent. This report seeks to address this deficit. More specifically, this report describes and compares nutrition intervention indicators (service readiness and delivery) in SPA surveys across 10 countries. The report also describes the indicators disaggregated by health facility characteristics including locale (rural and urban), managing authority (public and private facilities), and facility type (hospital and other).


3
2 DATA AND METHODS
2.1 Data
This report uses data collected in the most recent SPA survey conducted by The DHS Program in the following 10 countries where SPA surveys have been conducted since 2007: Bangladesh (2014), Haiti (2013), Kenya (2010), Malawi (2013-2014), Namibia (2009), Nepal (2015), Rwanda (2007), Senegal (2016), Tanzania (2014-2015), and Uganda (2007). Given the wide time frame during which The DHS Program conducted these SPA surveys, most of the report focuses on the most recent surveys, which were conducted within the previous 5 years (2013 to present)—Bangladesh, Haiti, Malawi, Nepal, Senegal, and Tanzania—in order to avoid comparisons with countries that have potentially outdated data. However, the appendix tables include results from all 10 surveys. The SPA survey in Senegal is an annual (continuous) series of surveys. There were two surveys conducted in Senegal prior to the survey included in this report (2012-13 and 2014). This report includes the most recent survey available.
The data from the SPA surveys are used to assess the extent of nutrition intervention service readiness and provision at the facility level, which includes the availability of various nutrition intervention supplies, counseling, procedures, or services provided to the client and nutrition-related training for health service providers. The readiness results represent formal-sector health facilities and their providers, and the service provision data represent patients at those facilities. Formal-sector health facilities include public, private (for-profit, not-for-profit, nongovernmental, faith-based), and mixed private-public facilities. Pharmacies, mobile clinics, and individual doctors’ offices are usually not included as formal-sector facilities.
The SPA surveys include several questionnaires that collect data on the service environment of the facility:
1. An inventory questionnaire that examines the availability of services, infrastructure, commodities, procedures, and resources at the facility.
2. A health worker interview that collects information from providers on routine duties, training, and demographic characteristics.
3. An observation checklist that records the content and quality aspects of the selected health visits. The observations are specific to types of health visits and include ANC, child health, family planning, and birth and delivery services.
4. A client exit interview in which clients whose visit was observed provide their perceptions on the visit and demographic information.
In most countries, the SPA survey is based on a sample of randomly selected formal-sector health facilities; exceptions are Haiti, Malawi, and Namibia, where information was collected from all formal-sector health facilities. The study sample is designed for key indicators to be representative at the national and subnational levels and by facility type and managing authority. The sample of facilities in Nepal was further stratified by ecological region, by development-ecological region, and for private hospitals according to number of beds (less than 100 versus 100 or more). The sample design for the selection of facilities and the total number of facilities are summarized in Table 1.

4
A sample of 8-15 health providers who were present in the facility on the day of the assessment are randomly selected from provider lists at each health facility. Preference is given to providers who provided consultation services, counseling, health education, or laboratory services, which were assessed in the SPA survey. If fewer than eight providers were present on the day of the assessment, all providers present that day were interviewed.
For ANC and curative care for sick children, clients were systematically selected based on the expected number of clients at each service site on the day of the assessment. In other cases, where the number of clients could not be determined in advance, clients were selected upon arrival at the facility. If numerous clients were available, interviewers selected two new clients for every returning or follow-up client, with a preference for ANC clients who were women attending their first ANC visit for that pregnancy. In general, a maximum of five clients per provider of the service were interviewed, with a maximum of 15 observations per type of service (ANC or curative care for sick children) per facility. To select the interval between clients, the total number of expected clients was divided by 5 to obtain the Nth interval for selecting the next client for observation. Exit interviews were conducted with every observed client prior to the client departing the facility that day.
Table 1 Sample design of included surveys
Survey Selection of facilities
Stratification Number of facilities
Bangladesh 2014 Sample Facility type, district 1,548 Haiti 2013 Census None 905 Kenya 2010 Sample Facility type, managing authority, region 695 Malawi 2013-14 Census None 977 Namibia 2009 Census None 411 Nepal 2015 Sample Facility type, managing authority, ecological
region, development-ecological region, number of inpatient beds (for hospitals only; less than 100 versus 100 or more)
963
Rwanda 2007 Sample Facility type, province 538 Senegal 2016 Sample Facility type, managing authority, region 468 Tanzania 2014-15 Sample Facility type, managing authority, region 1,188 Uganda 2007 Sample Facility type, region 491
Figures 1a though 1c describe the background characteristics of the facilities in each country. We recoded the characteristics to facilitate comparisons across countries. For facility type, all lower-level facilities were grouped together to compare with hospitals (Figure 1a). Lower-level facilities typically include health centers, clinics, dispensaries, maternity units, health posts, or other formal outlets that are unique to each country. For the managing authority, private and combined public-private facilities were grouped together to compare with public facilities (Figure 1b). Facility locale—urban or rural—is described for surveys that included this information (Figure 1c).
Figure 1a indicates that hospitals represent between 3% and 13 % of all facilities in each country. Figure 1b shows that in Bangladesh, Nepal, Senegal, and Tanzania, facilities are largely government-managed. Public and private facilities are more evenly divided in Malawi. In Haiti, 62% of facilities are managed by private entities. Figure 1c shows that 8% of facilities in Bangladesh are located in urban areas; by contrast, a greater share of facilities in Haiti, Malawi, Senegal, and Tanzania are urban (with a range of 27% in Tanzania to 39% in Haiti).

5
Figure 1a Percent distribution of facilities according to facility type, by country
Figure 1b Percent distribution of facilities according to managing authority, by country
Hospital2.7%
Other facilty type
97.3%
Bangladesh 2014 (N=1,548)
Hospital13.3%
Other facilty type
86.7%
Haiti 2013 (N=905)
Hospital11.5%
Other facilty type
88.5%
Malawi 2013-14 (N=977)
Hospital9.7%
Other facilty type
90.3%
Nepal 2015 (N=963)
Hospital4.4%
Other facilty type
95.6%
Senegal 2016 (N=468)
Hospital3.9%
Other facilty type
96.1%
Tanzania 2014-15 (N=1,188)
Public93.0%
Private, other7.0%
Bangladesh 2014 (N=1,548)
Public37.8%Private,
other62.2%
Haiti 2013 (N=905)
Public83.5%
Private, other
16.5%
Senegal 2016 (N=468)
Public48.3%Private,
other51.7%
Malawi 2013-14 (N=977)
Public90.4%
Private, other9.6%
Nepal 2015 (N=963)
Public72.1%
Private, other
27.9%
Tanzania 2014-15 (N=1,188)

6
Figure 1c Percent distribution of facilities according to locale, by country
2.2 Methods
This report focuses on maternal and child nutrition and uses nutrition intervention indicators collected in SPA surveys, selected according to their applicability to the package of essential nutrition actions (WHO 2013). We examined the indicators separately by the relevant service. In the first section of the results, we examine facility readiness, provider interactions (providing counseling or other care), client reports, and health worker training as they pertain to providing ANC. These indicators relate to maternal nutrition as well as counseling on future nutrition for the unborn child (breastfeeding). In the second section, we assess nutrition readiness, counseling, client reports, and provider training related specifically to child nutrition. These services are captured among facilities that provide curative care for children under age 5. Observations of child nutrition-related provider interactions and caretakers’ reports on visits are based on consultations for sick child care services. Provider training is based on providers who offer any services within the facility, with laboratory staff or other non-qualifying providers excluded, based on country-specific preferences.
The indicators include six interventions: (1) iron-folic acid (IFA) supplementation, (2) micronutrient supplementation for children, (3) anthropometry for women and children, (4) infant and young child feeding counseling, (5) maternal nutrition counseling, and (6) anemia assessment or testing. Tables 2a and 2b show indicators for each area.
All indicators are first recoded to binary variables in which a value of 1 indicates that a specific nutrition-related supply, counseling or advice, procedure, or training indicator was available or was provided and a value of 0 indicates that the indicator was not available or provided. We recoded missing responses as 0.
Rural91.6%
Urban8.4%
Bangladesh 2014 (N=1,548)
Rural60.9%
Urban39.1%
Haiti 2013 (N=905)
Rural69.0%
Urban31.0%
Malawi 2013-14 (N=977)
Rural67.3%
Urban32.7%
Senegal 2016 (N=468)
Rural72.7%
Urban27.3%
Tanzania 2014-15 (N=1,188)

7
Prior to 2013, SPA surveys were not standardized. The data recoding process standardized the indicators to the extent possible. The description of each indicator and additional notes on the methods used in calculating the indicators are summarized in Tables 2a and 2b. Table 2a describes the indicators relevant to ANC and Table 2b the indicators for child care services. The availability of each item may differ in this report from the SPA final reports because there can be differences in the definitions of the indicators.
In the main body of the report, we present all indicators related to service readiness and observation of service delivery for nutrition-related readiness and care for women’s ANC and sick children’s visits. Because observation data are considered the gold standard as compared with exit interview data (Choi 2018), reports of service delivery according to client exit interviews are included only in the appendix tables. Research shows that there are discrepancies between observations and client exit interviews (Assaf, Wang, and Mallick 2016). Clients may overestimate the care provided (Choi 2018), and their reports may be subject to recall and courtesy bias (Bessinger and Bertrand 2001). The main body of the report also includes results from recent surveys to avoid comparison with potentially outdated information.
All analyses adjusted for health worker and client non-response with provider and client weights. In all countries (except Haiti, Malawi, and Namibia) where a census of facilities was conducted, the complex multistage stratified sample design is taken into consideration, facility non-response is considered in the sampling weights, and confidence intervals are provided in all descriptive analyses. We conducted all analyses using Stata 15.0.
This report presents descriptive statistics of facility characteristics illustrating percentage distributions by facility type, managing authority, locale, and region. Data on nutrition intervention service readiness and provision across the topics assessed are presented for each country and stratified by health facility characteristics (facility type, managing authority, locale, and region).

8
Table 2a Nutrition indicators in antenatal care services
Indicator Description1 Questionnaire
IFA supplementation Iron tablets for women available Iron, folic acid, and IFA tablets are available and valid (not expired) in any service area
of the facility such as the general area or ANC service area. Not all country SPAs include a filter on whether the tablets are valid.
Facility inventory2 Folic acid for women available IFA for women available IFA provided/prescribed to client Observed the provider prescribe or give the client iron tablets or folic acid (IFA) or both
during the visit. ANC observation
IFA counseling on the purpose of the tablets
Observed the provider explain the purpose of iron or folic acid tablets among women who were provided or prescribed iron, folic acid, or IFA.3
IFA counseling on how to take the tablets
Observed the provider explain how to take iron or folic acid tablets among women who were provided or prescribed iron, folic acid, or IFA.3
Counseling provided on iron side effects
Observed the provider explain side effects of iron tablets among women who were provided or prescribed iron, folic acid, or IFA.3
IFA provided/prescribed Client reported that she was provided/prescribed iron tablets, folic acid, or iron with folic acid on this visit, past visits, or both visits.
ANC client exit interview
Counseling provided on how to take iron tablets
Client reported that provider explained how to take the iron tablets on this visit, previous visits, or both.4
Counseling provided on side effects of iron
Client reported that provider explained the side effects of iron tablets during the visit.4
Client’s knowledge of iron side effects
Client identified at least one side effect of iron, folic acid, or IFA: nausea, black stools, or constipation.4
Pregnancy growth monitoring Adult weighing scale available Adult weighing scale was observed and functioning in any service area among facilities
that provide ANC. Facility inventory4
Physical examination of weight of pregnant women
Observed provider weigh the client. ANC observation
Maternal nutrition Training on ANC nutritional
assessment for pregnant women
Provider received training or a training update on ANC nutritional assessment of pregnant women within the previous 24 months.
Health worker interview5
Gave advice on nutrition during pregnancy
Observed provider give advice on nutrition during pregnancy (quality and quantity of food to eat).
ANC observation
Anemia assessment or testing Physical examination for anemia
(conjunctiva/palms) Observed provider examine client for anemia (conjunctiva/palms).6 ANC observation
Anemia test Observed provider ask about, perform, or refer client for an anemia test. Breastfeeding counseling
Counseling on exclusive breastfeeding
Observed provider discuss exclusive breastfeeding during this visit. ANC observation
Counseling on early and prolonged breastfeeding
Observed provider discuss early and prolonged breastfeeding with the client.7
Reported counseling on importance of exclusive breastfeeding
Client reported that provider gave advice about exclusive breastfeeding. ANC client exit interview
Reported counseling on duration of exclusive breastfeeding
Client reported that provider recommended that she exclusively breastfeed for 6 months during this visit, past visits, or both visits (among clients who received counseling on exclusive breastfeeding).
1 Bangladesh SPA does not include observation or exit interviews for ANC visits or child health visits. 2 Among facilities that provide ANC 3 Newer surveys do not include a filter for IFA counseling; however, we standardized the variable for the purpose of this report. 4 Among clients who reported being prescribed or provided with iron, folic acid, or IFA 5 Provider training in Kenya includes training up to 36 months before the survey. Laboratory technicians and other country-specific non-qualifying providers are excluded. 6 The observation checklist for Rwanda and Uganda did not include a question on physical examination for anemia. 7 In Namibia, Rwanda, and Uganda, health providers’ observations related to exclusive breastfeeding only.

9
Table 2b Nutrition indicators in curative child care and growth monitoring services
Indicator Description1 Questionnaire
Growth monitoring Infant weighing scale
available Infant weighing scale (100-gram gradation) was observed and functioning in any service area.2
Facility inventory3
Child weighing scale available Child weighing scale (250-gram gradation) was observed and functioning in any service area.4
Stadiometer/height rod available
Stadiometer or height rod was observed and functioning in any service area.
Tape measure available Measuring tape was observed in any service area. Physical examination of child
weight Observed provider weigh the child. Sick child observation
Plotted child’s weight on growth chart
Observed provider plot the child’s weight on a growth chart.
Weighed the child Client reported that child was weighted during the visit. Sick child client exit interview
Discussed child’s growth Client reported that child’s growth was discussed during the visit. Micronutrient supplementation for children
Iron tablets for children available
Iron tablets are available for child health services in the facility.5 Facility inventory3
Vitamin A for children available
Vitamin A supplementation is available for child health services in the facility.6
Zinc tablets for children available
Zinc tablets are available for child health services in the facility.7
Provider asked if child received vitamin A
Observed provider ask if child received vitamin A within past 6 months Sick child observation
Infant and young child feeding counseling Training on breastfeeding Provider received training on breastfeeding in the previous 24 months. Health worker interview8 Training on early and
exclusive breastfeeding Provider received any in-service training or training updates on early and exclusive breastfeeding in the previous 24 months.9
Training on complementary feeding in infants
Provider received training on complementary feeding in the previous 24 months.
Training on infant and young child feeding
Provider received training on infant and young child feeding in the previous 24 months.
Asked client about feeding or breastfeeding when child is not ill
Observed provider ask about normal feeding or breastfeeding habits or practices when the child is not ill.
Sick child observation
Asked client about feeding or breastfeeding during illness
Observed provider ask about feeding or breastfeeding habits or practices for child during this illness.
Reported provider discussed feeding or breastfeeding when child is not ill
Provider asked about of feeding solids or liquids (or breastfeeding) when child is not ill. Sick child client exit interview10
Reported counseling on feeding or breastfeeding during illness
Client reported counseling on of feeding solids or liquids (or breastfeeding) during illness and identified the recommended practices.
1 Bangladesh SPA does not include observation or exit interviews for ANC visits or child health visits. 2 Or a digital standing scale with gradations of 100 grams or less on which an adult can hold a child to be weighed 3 All facility-based indicators are calculated among facilities that provide curative child care services. 4 Or a digital standing scale with gradations of 250 grams or less on which an adult can hold a child to be weighed 5 Iron dosage is not specified. 6 Some country SPAs (Kenya, Rwanda, and Uganda) inquired about the number of days that vitamin A supplementation is available; in those cases, the variable is coded yes if vitamin A supplementation is available at least 1 day per month. The threshold of 1 day was selected to facilitate comparison with other countries. 7 Zinc for treatment of diarrhea 8 Provider training in Kenya includes training up to 36 months prior to the survey. 9 In Namibia, Rwanda, and Tanzania, health providers were interviewed about receipt of training related to exclusive breastfeeding rather than early and exclusive breastfeeding. 10 Question wording varies in older surveys


11
3 RESULTS
3.1 Antenatal Nutrition
This section describes service readiness in terms of facility capacity to provide nutrition-related care during pregnancy and service delivery for the provision of nutritional care for pregnant women who attend ANC visits at facilities assessed by recent SPA surveys in six countries: Bangladesh, Haiti, Malawi, Nepal, Senegal, and Tanzania. First, we describe availability of ANC at facilities by country. We then present the level of facility readiness to provide nutrition-related ANC and provider training in nutrition for pregnant women. Next, we describe provision of nutrition-related care and counseling during ANC visits at the national level. Finally, we present maps that represent readiness for and delivery of two nutrition interventions by region in each country: (1) availability of IFA at facilities with ANC (service readiness) and (2) percentage of clients who received IFA during ANC (service delivery). The information included in this chapter focuses on the most recent SPA surveys, although for each figure and table we include a corresponding appendix table with country estimates assessed through surveys conducted before 2013. We also include appendix tables (3-12) that present the availability of each item by facility type, managing authority, and locale (as available).
Figure 2 Percent of facilities providing ANC services, by country
Figure 2 shows the percentage of facilities in the six countries with recent SPA surveys that provide ANC services. Over 90% of facilities in Bangladesh (97%), Haiti (92%), and Nepal (96%) provide ANC. ANC services are least available in facilities in Malawi (65%). Appendix Table 1 includes data on the availability of ANC in all 10 countries assessed and the 95% confidence intervals (CIs) for sample-based surveys.
3.1.1 Service readiness
Among facilities that offer ANC, Table 3 shows the percentage that have resources available to provide nutritional care for pregnant women. Table 3 also includes the percentage of providers who have received training related to nutrition counseling for pregnant women. There is a range of availability within and across countries, with IFA and an adult weighing scale being the two most commonly available items across all countries (except Haiti). Approximately 80% or more of facilities have IFA, except in Haiti (58%), and 88% of facilities in all countries have an adult scale.
84.6
76.3
96.2
64.7
91.9
97.4
Antentatal Care
Bangladesh Haiti Malawi Nepal Senegal Tanzania

12
Iron and folic acid (as separate tablets) are less commonly available, with more variation between countries. Availability ranges from 1% of facilities with folic acid and 5% with iron in Senegal to 69% of facilities in Tanzania with folic acid and 65% of facilities in Haiti with iron available. Given that iron and folic acid are usually provided together in the combined IFA supplement, it is reassuring that the countries with the least availability of separate iron and folic acid tablets, such as Malawi, Nepal, and Senegal, are well equipped to provide the combined IFA. Across all six countries, only one-fifth or less of providers of all types—except those in non-qualifying positions (e.g., laboratory technicians or those who do not have direct contact with clients)—have received recent training in provision of nutritional care for pregnant women, with a range from 11% in Nepal to 22% in Bangladesh. Appendix Table 2 presents data on the availability of these items (and 95% CIs) and counseling and care components observed or reported during exit interviews for all 10 countries.
Table 3 Percent of facilities with capacity to provide nutrition-related care among facilities with ANC and percent of providers with training on maternal nutrition, by country
Bangladesh SPA
2014 Haiti SPA
2013 Malawi SPA
2013-14 Nepal SPA
2015 Senegal SPA
2016 Tanzania SPA
2014-15
% 95% CI1 % 95% CI1 % 95% CI1 % 95% CI1 % 95% CI1 % 95% CI1 Facilities with ANC
Iron for women 61.8 [57.7,65.8] 64.9 37.3 12.5 [10.2,15.3] 5.2 [3.2,8.1] 41.1 [37.1,45.4] Folic acid for women 57.7 [53.6,61.6] 54.9 29.5 10.6 [8.6,13.0] 1.3 [0.5,3.3] 68.5 [64.4,72.4] IFA for women 88.4 [85.3,91.0] 58.1 92.0 90.7 [88.0,92.9] 79.2 [74.1,83.5] 92.4 [89.8,94.4] Vitamin A for women 64.6 [61.2,67.9] 55.5 51.6 89.4 [86.9,91.4] 60.0 [55.2,64.6] 73.8 [70.0,77.3] Adult weighing scale 88.3 [85.2,90.8] 92.9 93.8 94.9 [92.6,96.5] 93.7 [89.0,96.5] 88.0 [84.6,90.7]
Number of facilities with ANC 1,508 832 632 926 357 1,005
Provider training2 Recent training on nutritional
assessment for pregnant women 21.5 [19.1,24.1] 16.0 [14.3,17.8] 16.5 [15.0,18.2] 11.3 [9.7,13.0] 17.3 [15.4,19.4] 13.1 [11.8,14.5]
Number of providers 4,169 3,967 2,538 3,709 1,623 6,078
1 The 95% CI reflects the upper and lower bounds of the 95% confidence interval. There are no CIs for facility-based indicators for Haiti and Malawi because these two countries had census-based surveys. However, CIs are included for provider- and client-based indicators for all countries. 2 Excludes providers who exclusively worked in the laboratory of the facility or in other non-qualifying positions
3.1.2 Service delivery
Figures 3 through 6 present data on care provision for women attending ANC at facilities in five countries with recent SPA surveys in which observation of ANC was available (with supporting information in Appendix Table 2). Figure 3 shows counseling and care related to iron, folic acid, or IFA. This figure indicates that while IFA is commonly provided or prescribed (with a range of 63% in Nepal to 87% and 88% in Malawi and Senegal, respectively), counseling on why and how to take IFA, as well as potential side effects, is less common and varies substantially across and within countries. Across all five countries, counseling related to side effects was least common, offered to only 14% or fewer of women who were provided IFA. The percentages of women counseled on why and how to take IFA mirrored each other in each country, with percentages slightly lower for why versus how women should take IFA. Counseling on these two items was lowest in Nepal (18% counseled on why and 28% counseled on how) and highest in Tanzania (73% and 78%).
Figure 4 shows the percentage of women who were weighed during their ANC visit and the percentage who received counseling on nutrition during pregnancy. Three quarters or more of women in all countries had their weight assessed; 74% were weighed in Nepal and 93% in Senegal. Only one-third (33% in Tanzania) to one-half (48% in Nepal) of women were counseled about nutrition during their visit. There is a wide

13
range of anemia assessment and testing across the countries (Figure 5). Except in Haiti, more women in each country are physically assessed for anemia than are tested during ANC. Women are nearly universally assessed for anemia via physical exams of conjunctiva and palms in Senegal (96%), although only 30% of these same women are given a blood test. Similarly in Malawi, 79% of women were assessed with an observation, but only 8% were tested. Figure 6 shows that, overall, very few women were counseled on exclusive breastfeeding and early initiation of and prolonged breastfeeding during ANC. Tanzanian women were counseled more frequently, although only 13% were counseled on exclusive breastfeeding and 9% on early and prolonged breastfeeding. Only 1% of women in Nepal were counseled on both aspects of breastfeeding.
Figure 3 Percent of women prescribed or provided IFA supplements during an ANC visit and percent of women receiving IFA-related counseling among those prescribed or provided IFA supplements, by country
Note: Shaded portion indicates counseling items that were assessed only among the women who were provided or given a prescription for IFA.
70.9
35.4
43.0
3.5
86.5
65.9
68.6
10.6
62.7
18.0
28.4
4.0
87.5
41.0
48.0
1.8
75.3
72.6
77.6
14.2
IFA provided/prescribed
Counseled on IFA (purpose)
Counseled on IFA (how to take)
Counseled on IFA (side effects)
Haiti Malawi Nepal Senegal Tanzania

14
Figure 4 Percent of women receiving weight assessment and maternal nutrition counseling during an ANC visit, by country
Figure 5 Percent of women assessed or tested for anemia during an ANC visit, by country
80.8
43.3
75.1
39.1
74.0
48.1
93.4
38.4
80.2
32.5
Weight assessed
Counseled on maternal nutrition during ANC
Haiti Malawi Nepal Senegal Tanzania
49.4
57.8
78.9
8.4
36.9
32.3
96.3
29.6
58.7
42.3
Physical exam for anemia
Tested for anemia
Haiti Malawi Nepal Senegal Tanzania

15
Figure 6 Percent of women receiving breastfeeding counseling during an ANC visit, by country
3.1.3 Service readiness and delivery by region and facility background characteristics
Appendix Tables 3-12 describe the availability of IFA and the provision of IFA during ANC by facility background characteristics, including facility type, managing authority, and either urban or rural locale. Although we did not assess the significance of the differences, we found that the availability of resources, counseling related to nutritional care, and provider training varied within and across countries by background characteristics. No clear trend emerged across countries, within most countries, or by whether the indicator reflected measures of availability of resources, provision of care, or provider training.
Figures 7 and 8 (and Appendix Table 13) show maps of each country with recent SPA surveys that reflect the regional availability of IFA among facilities that provide ANC services (Figure 7) and the percentage of women who were given IFA or a prescription for IFA during ANC consultations (Figure 8). Because availability and provision of IFA are generally high, the scale on the maps is demarcated in ranges of 10%, with the lowest range including all regions with IFA readiness or delivery of 60% or less.
Figure 7 shows that, within each country, there is little variation by region; the range of IFA availability is no greater than 20% in any country except for Haiti and Tanzania. In Haiti, Artibonite has the lowest availability (43%) and Nord the highest (71%). In Tanzania, over 90% of facilities in most zones have IFA available, although facilities in Zanzibar are much less prepared to provide IFA (62%).
There is a greater amount of variation between and, to some extent, within countries in terms of IFA distribution during ANC (Figure 8). Observation of ANC was not a part of the SPA in Bangladesh, as represented by the gray map for the country. In Haiti, women were either given or prescribed IFA at 95% of ANC visits in Grande-Anse, although as few as 62% of women received IFA in the Ouest department. In
5.6
1.5
6.7
4.4
0.9
1.4
2.2
1.8
12.5
8.7
Counseled on exclusive breastfeeding
Counseled on early and prolonged breastfeeding
Haiti Malawi Nepal Senegal Tanzania

16
Malawi and Senegal, IFA was commonly prescribed or given during ANC, at a rate above 80% in all regions. Regional provision of IFA in Nepal ranged only from 50% to 72%.
Comparing regional availability of IFA and regional provision of IFA within each country, we found that provision, including prescriptions, outperformed availability in Haiti and Senegal. However, in Malawi, Nepal, and Tanzania, provider provision of IFA lagged behind the facility’s capacity to provide the supplement on-site. In Nepal and Tanzania, the areas with the lowest availability of IFA (the Far Western and Central regions of Nepal and the Western and Zanzibar zones of Tanzania) also had the lowest levels of provision.
17
Figure 7 Percent of facilities with IFA supplements available among facilities that provide ANC services, by region
Bangladesh Haiti
Malawi Nepal
Senegal Tanzania
18
Figure 8 Percent of women attending ANC who were provided with or prescribed iron or folic acid (or both), by region
Bangladesh Haiti
Malawi Nepal
Senegal Tanzania

19
3.2 Child Nutrition
This section first presents the availability of services for children including diagnosis and treatment of malnutrition, growth monitoring, and curative care services, service readiness to provide nutrition-related care for children among facilities with curative care services, and service delivery of nutrition-related care provided for children attending sick child consultations. We present the regional availability of a functioning infant weighing scale and a functioning child scale at facilities with curative care services (readiness). The information presented here focuses on the most recent SPA surveys. For each figure and table, we include a corresponding appendix table with the upper and lower bounds of the 95% CI (for sample-based surveys), as well as the estimates for countries assessed through surveys conducted before 2013. Also, Appendix Tables 15-24 show estimates for each item by facility type, managing authority, and locale (where available). In addition to indicators of facility readiness, provider training, and care observed during sick child visits, the appendix tables include information on reports of care received according to the caretaker who participated in client exit interviews.
Figure 9 (and Appendix Table 1) shows the availability of malnutrition, growth monitoring, and curative care services for children according to recent SPA surveys in six countries. While curative care services are nearly universal (93% or higher in each country), there is more variation in availability of growth monitoring services by country. Growth monitoring is available in as many as 94% of facilities in Nepal but as few as 62% of facilities in Bangladesh. Services for diagnosis and treatment for malnutrition are common, nearly 80% or higher among all countries.
Figure 9 Percent of facilities providing curative care and growth monitoring services for children, by country
97.6
84.8
80.0
95.4
87.6
91.1
97.2
93.6
88.7
93.8
73.8
78.0
93.7
66.8
79.0
92.9
62.2
86.6
Curative child care
Growth monitoring
Malnutrition
Bangladesh Haiti Malawi Nepal Senegal Tanzania

20
3.2.1 Service readiness
Table 4 shows the national-level availability of essential items for providing nutrition-related care for children among facilities that provide curative child care services. Both child and infant scales range in their availability across countries. Facilities in Bangladesh and Nepal appear least equipped to provide growth monitoring services. Only one-third (35%) of facilities in Bangladesh have an infant scale, 41% have a tape measure, and just over 60% have a child scale or a stadiometer/height rod. In Nepal, less than 30% of facilities have a stadiometer/height rod (24%) or a tape measure (29%), and less than half (46%) have a child weighing scale. Almost all facilities in Senegal have an infant scale (95%) and a tape measure (92%).
Facilities in Nepal that provide curative child care services commonly have vitamin A (90%) and zinc (96%) available. Although iron supplementation is not commonly available in Nepal and Senegal (13% and 4%, respectively), SPA surveys do not specify the dosage of iron; iron supplementation availability in SPA surveys may reflect only the availability of adult doses of iron (e.g., for pregnant women in need who are attending ANC). Only around one-third or fewer providers in most countries have received recent training in child nutrition-related topics, including breastfeeding, complementary feeding, and infant and young child feeding. The exception is Senegal, where nearly half (49%) of all providers were recently trained in complementary feeding and 43% were recently trained on breastfeeding.
Table 4 Percent of facilities with capacity to provide nutrition interventions among facilities with curative child care services and percent of providers with training on child nutrition topics, by country
Bangladesh SPA 2014
Haiti SPA 2013
Malawi SPA 2013-14
Nepal SPA 2015
Senegal SPA 2016
Tanzania SPA 2014-15
% 95% CI1 % 95% CI % 95% CI % 95% CI % 95% CI % 95% CI Facilities with curative child care
Child weighing scale available 61.3 [57.2,65.3] 70.6 73.6 45.5 [41.0,50.0] 65.1 [60.9,69.0] 82.6 [79.4,85.5] Infant scale available 34.8 [31.3,38.4] 74.0 71.0 78.4 [74.3,82.0] 95.1 [92.4,96.8] 73.9 [70.2,77.2] Stadiometer/height rod available 62.6 [58.4,66.5] 64.2 71.3 24.3 [20.8,28.0] 81.5 [77.7,84.8] 53.9 [49.8,57.9] Tape measure available 40.9 [37.0,45.1] 78.2 51.8 29.3 [25.4,33.5] 92.0 [88.5,94.5] 63.1 [59.1,66.9] Vitamin A supplementation
available 64.0 [60.6,67.3] 82.1 42.8 89.6 [87.2,91.6] 49.1 [45.0,53.2] 66.6 [63.0,70.0] Iron supplementation available 61.6 [57.4,65.6] 64.9 38.3 12.5 [10.2,15.3] 4.4 [2.8, 6.8] 37.8 [34.1,41.8] Zinc supplementation available 63.7 [60.1,67.2] 54.2 76.3 95.5 [94.3,96.5] 53.6 [49.5,57.6] 44.3 [40.3,48.3]
Number of facilities with curative
child care 1,437 848 917 936 447 1,160
Provider training2 Recent training on breastfeeding 42.7 [39.7,45.8] 26.7 [24.2,29.3] 34.9 [32.3,37.5] 31.5 [29.0,34.1] 42.8 [39.8,45.8] 15.1 [13.9,16.5] Recent training on early and
exclusive breastfeeding 27.6 [24.8,30.5] 17.4 [15.6,19.4] 23.2 [21.3,25.3] 21.5 [19.4,23.8] 31.7 [28.9,34.5] 24.7 [23.2,26.3] Recent training on complementary
feeding 38.9 [36.0,41.8] 22.5 [20.2,24.9] 35.8 [33.2,38.4] 27.9 [25.4,30.5] 48.7 [45.6,51.8] 19.3 [17.8,20.9] Recent training on infant and
young child feeding 20.8 [18.4,23.4] 20.5 [17.8,23.6] 35.0 [32.7,37.4] 6.9 [5.8,8.3] 14.9 [13.4,16.5] 32.1 [30.4,34.0] Number of providers 4,169 3,967 2,538 3,709 1,623 6,078
1 The 95% CI reflects the upper and lower bounds of the 95% confidence interval. There are no CIs for facility-based indicators for Haiti and Malawi because these two countries had census-based surveys. However, CIs are included for provider- and client-based indicators for all countries. 2 Excludes providers who exclusively worked in the laboratory of the facility or in other non-qualifying positions
3.2.2 Service delivery
Figures 10 and 11 show the percentage of children who were observed receiving nutrition-related care and counseling during sick child visits; Figure 12 shows the percentage of caretakers who discussed feeding or breastfeeding practices. Appendix Table 14 includes these estimates, along with 95% confidence intervals for sample-based surveys, and the corresponding indicators of care received as reported by caretakers via

21
exit interviews. Although services for growth monitoring may be assessed during routine visits or prior to the start of the sick child visit based on country- or facility-specific procedures or protocols, observed levels of counseling and care for growth monitoring vary widely by country (Figure 10). It is important to note that assessment of child nutritional status (weight and height plotted on a growth chart or mid-upper arm circumference) is a component of Integrated Management of Childhood Illness (IMC). The percentage of children who were weighed ranged from 16% in Tanzania to 85% in Senegal. The second set of bars, in the shaded portion of the figure, represents the percentage of children whose growth was plotted on a growth chart (among children who were weighed during the consultation). Again, service delivery varied by country; only 16% of children in Haiti who were weighed had their growth plotted, as compared with 59% of children in Senegal.
Figure 10 Percent of children whose weight was measured and percent of children whose weight was plotted on a growth chart among children weighed during sick child consultations, by country
WHO recommends that in settings where vitamin A deficiency is a public health problem, children age 6-11 months receive a high dose of vitamin A once, while children age 12-59 months should receive a high-dose vitamin A supplement every 4 to 6 months (WHO 2018). Overall, very few children received a dose of vitamin A (between 1% and 3% in Haiti, Malawi, Nepal, and Tanzania), although 30% of children in Senegal were observed receiving vitamin A (Figure 11). The low provision of vitamin A in health facilities, however, may not reflect facility capacity to provide vitamin A, because children could be receiving vitamin A from other sources, during either routine visits or mobile campaigns.
The percentage of children whose caretakers were counseled on feeding practices during sick child visits varied across countries (Figure 12). Fourteen percent of caretakers in Malawi and 40% in Haiti discussed
76.2
15.5
26.5
27.0
49.7
24.4
85.0
59.1
16.1
21.6
Child weight assessed
Child weight plotted on growth chart
Haiti Malawi Nepal Senegal Tanzania

22
feeding or breastfeeding while a child was well, while 16% in Malawi and Nepal and 25% in Haiti discussed feeding or breastfeeding practices while a child was ill.
Figure 11 Percent of children who received vitamin A during sick child visits, by country
Figure 12 Percent of caretakers who discussed feeding or breastfeeding practices during illness or
wellness during sick child visits, by country
2.7
1.9
1.1
29.6
3.1
Child received vitamin A
Haiti Malawi Nepal Senegal Tanzania
40.1
25.2
14.2
15.5
17.7
16.3
31.1
18.6
27.9
18.8
Counseled on feeding or breastfeeding when childis well
Counseled on feeding or breastfeeding duringillness
Haiti Malawi Nepal Senegal Tanzania

23
3.2.3 Service readiness and delivery by region and facility background characteristics
Appendix Tables 15-24 describe the availability of child nutrition items, provision of child nutrition services as observed and reported by the caretaker, and provider training for all 10 countries by facility characteristics. Facility capacity to care for the nutritional needs of children, provision of care during sick child visits, and provider training on these topics varied by level of readiness and service delivery and by facility characteristics, both within and between countries. We were unable to uncover any consistent pattern because we did not assess the significance of differences, and in many cases differences by facility characteristics were minor.
Table 5 shows the availability of an infant scale (a scale with a gradation of 100 grams) and the availability of a child scale (a scale with a gradation of 250 grams), which are necessary components of growth monitoring for children under age 5. Although we have corresponding service delivery data for whether or not the child was weighed during the consultation, this intervention may not be accurately captured in all countries because children may be weighed prior to the start of the observation of the consultation. Also, this information is available for some but not all countries. In fact, as part of the inventory questionnaire, facilities are asked if they provide certain routine services before each consultation, including an assessment of the child’s weight. This information is included in the SPA data set. We tabulated these data and found that, in many countries, it is a common procedure to weigh a child before the consultation (results not shown).
There was a considerable range across countries in the percentage of facilities with infant and child scales. Neither type of scale was consistently more available than the other across countries. However, within countries, there was some variation for each indicator. Tanzania demonstrated the largest differences by zone, with differences as large as 40 and 41 percentage points for the availability of an infant and child scale, respectively. In each country except for Bangladesh, two-thirds or more of facilities in most regions had an infant scale available. For each country, contrary to expectations, the regions where the capital city is located did not have the highest availability of scales.

24
Table 5 Availability of infant and child scales among facilities that provide curative child care services, by country and region
Percentage of facilities that have an infant
scale1 available and functioning in any
service area among facilities that provide
curative child care services
Percentage of facilities that have a child scale2
available and functioning in any
service area among facilities that provide
curative child care services
Country % 95% CI N % 95% CI N Bangladesh
Barisal 34.5 [26.9,43.0] 112 62.5 [53.2,71.0] 112 Chittagong 31.4 [24.8,38.7] 265 59.1 [50.3,67.4] 265 Dhaka 32.1 [25.1,39.9] 380 50.2 [40.5,59.9] 380 Khulna 31.6 [22.8,42.0] 195 61.3 [49.8,71.7] 195 Rajshahi 32.1 [22.5,43.4] 190 57.6 [45.2,69.1] 190 Rangpur 46.5 [35.5,57.8] 200 84.0 [73.5,90.9] 200 Sylhet 42.6 [32.3,53.6] 96 70.0 [58.4,79.6] 96
Haiti Ouest 69.6 298 67.6 298 Sud-Est 69.1 55 69.1 55 Nord 78.8 85 71.8 85 Nord-Est 74.3 35 65.7 35 Artibonite 72.8 114 66.7 114 Centre 81.8 44 75.0 44 Sud 88.9 63 84.1 63 Grand-Anse 78.6 42 83.3 42 Nord-Ouest 72.7 83 64.0 83 Nippes 73.3 30 86.7 30
Malawi North 80.1 158 68.2 158 Central 70.1 340 74.0 340 South 68.3 418 75.3 418
Nepal Eastern development region 64.1 [54.3,72.9] 208 42.9 [33.7,52.6] 208 Central development region 78.8 [71.3,84.8] 308 33.2 [26.1,41.1] 308 Western development region 80.1 [68.9,88.0] 201 53.1 [41.9,64.0] 201 Mid-western development region 91.3 [83.9,95.5] 130 55.4 [44.5,65.8] 130 Far-western development region 87.8 [77.2,93.9] 89 62.1 [49.7,73.2] 89
Senegal Ouest 95.1 [88.6,98.0] 115 57.6 [46.5,68.0] 115 Centre 95.0 [87.3,98.1] 106 65.4 [57.6,72.6] 106 Nord 97.7 [92.5,99.3] 95 54.7 [46.6,62.6] 95 Sud 93.2 [86.9,96.5] 130 78.9 [73.2,83.7] 130
Tanzania Western 86.4 [76.6,92.5] 91 88.7 [75.3,95.3] 91 Northern 68.5 [58.9,76.7] 171 78.0 [67.3,86.0] 171 Central 72.6 [59.7,82.6] 121 86.4 [75.7,92.8] 121 Southern Highlands 80.0 [67.6,88.4] 123 83.2 [71.3,90.7] 123 Southern 84.2 [68.8,92.9] 70 99.3 [97.2,99.8] 70 South West Highlands 84.8 [71.7,92.4] 117 95.0 [89.0,97.8] 117 Lake 73.8 [63.9,81.8] 231 83.5 [75.4,89.2] 231 Eastern 65.5 [55.3,74.5] 193 72.2 [60.7,81.4] 193 Zanzibar 45.8 [36.2,55.6] 43 57.7 [46.2,68.3] 43
1 Or a digital standing scale with gradations of 100 grams or less on which an adult can hold a child to be weighed 2 Or a digital standing scale with gradations of 250 grams or less on which an adult can hold a child to be weighed CI = confidence interval

25
4 DISCUSSION
4.1 Summary of Findings
This report consolidates information related to service readiness and delivery of nutrition-related care for pregnant women and children under age 5. We examined nutrition-related intervention readiness, including availability of commodities, provider training related to nutrition topics, and delivery of nutrition-related care, at the national level and by region for six countries with SPA surveys conducted since 2013. Among women attending ANC, nutrition-related equipment and medications were largely available, although counseling on IFA varied across countries and counseling was low for maternal nutrition and breastfeeding. In contrast, for children who had curative care visits, nutrition-related equipment, medication, and growth monitoring varied across countries, while counseling on child feeding during illness or wellness was low across countries. Provider training on nutritional assessment in pregnancy and infant and young child feeding counseling was also low across countries. Stratifications by public or private facilities, urban or rural facilities, and hospitals or lower-care facilities revealed minor differences that varied by country and nutrition intervention.
Most women (around three quarters of women observed in almost all countries) are being prescribed or provided with IFA supplements and are being weighed during ANC visits. Analyses of DHS survey data on IFA supplementation in several low- and middle-income countries have identified points of “faltering” for women not consuming the recommended dose of IFA supplementation because of multiple health system failures and have recommended reporting these “falter” points for tracking country IFA supplementation programming (Sununtnasuk, D'Agostino, and Fiedler 2016). The faltering points include ANC attendance, receipt or purchase of IFA supplements, consumption of supplements, and adequate dosage (Sununtnasuk, D'Agostino, and Fiedler 2016). A key gap in knowledge is the inability to identify the supply and demand factors that lead to faltering. An advantage of this analysis is the information on national and subnational coverage of IFA and related counseling that can help countries identify where faltering is occurring in their health facilities. Such information can be used by policymakers and program managers to improve IFA supplementation programs.
IFA supplement availability, prescription, and provision showed more variation across different countries than within countries. In two countries where IFA supplementation was readily available in most regions, Nepal and Tanzania, observed prescription and provision of IFA supplements were lagging. Conversely, in Haiti and Senegal, prescription and provision of IFA supplements among women exceeded IFA availability in facilities with ANC. On the surface, the findings suggest that providers in Nepal or Tanzania may not be prescribing and providing IFA supplements despite availability in the facility. However, provision of IFA supplements in this report is captured only during the observed visit and not during any of a woman’s previous ANC visits (Appendix 2). In Haiti and Senegal, providers may be prescribing IFA supplements despite the fact that facilities may not be stocked with supplements (with the expectation that women will acquire supplements from outside sources). However, whether or not a woman is provided or prescribed IFA supplements could depend on several factors, such as facility rationing of supplements, whether she already has a supply of supplements, or whether she has acquired supplements from other non-facility sources.

26
Counseling on maternal nutrition and breastfeeding during ANC was low across all countries, as seen in an earlier study that examined counseling during ANC (Assaf, Wang, and Mallick 2016). Research shows that counseling during ANC can influence maternal dietary practices, child birthweight, and childhood feeding practices (Ahmad et al. 2012; Nikièma et al. 2017); better counseling can also influence a caretaker’s intent to return to the facility for future care (Larson, Leslie, and Kruk 2017). Our report also indicates low levels of training. Recent research identified a link between increased provider counseling and increased levels of training and education (Larson, Leslie, and Kruk 2017). Thus, strategies to strengthen and improve health worker training, including regular refresher training that helps health workers retain knowledge on all aspects of nutrition counseling, will be important (Chopra et al. 2012).
Compared with maternal nutrition resources, our findings show that there was greater variation in readiness for growth monitoring and curative care interventions for children across countries. Senegal was among the best prepared, with the highest proportion of recently trained providers and the highest coverage of nutrition interventions for children. This finding is consistent with other research reporting high levels of multi-sectoral engagement in nutrition policy and programming in Senegal (Kampman et al. 2017); similar investments in other countries would also likely be beneficial for nutrition.
Our report identifies a number of areas of improvement for child nutrition. We observed that a small proportion of children were weighed during sick child visits in some countries. However, as noted in the results section, weighing may be part of a routine assessment that is conducted prior to the visit. Thus, the findings related to weighing and growth monitoring should be interpreted with caution. Across all countries, we also observed that caretakers were counseled infrequently on feeding or breastfeeding practices when the child was either ill or well. Recent provider training on feeding or breastfeeding was not routine. Given the small amount of facility-level counseling and training in many countries, strengthening health facility worker training may improve nutrition counseling (Larson, Leslie, and Kruk 2017). Receipt of vitamin A was nearly non-existent during the observed visits (except in Senegal). Children are most likely to receive vitamin A outside of these visits, during mobile campaigns, child health days, or routine visits (Horton et al. 2018). As countries shift to using routine health services for vitamin A distribution, tracking vitamin A supplementation across health system platforms may need to be strengthened to facilitate monitoring of intervention coverage (Horton et al. 2018).
Sick child visits are part of the longstanding integrated management of childhood illness (IMCI) program. Children’s nutrition status can change rapidly during illness. Despite recommendations for feeding children during and after illness and guidelines for measuring height and weight that assess and manage overweight and obesity in children, evidence suggests that IMCI may have little impact on nutrition status (Paintal and Aguayo 2016; WHO 2017; Gera et al. 2016). A possible explanation is that readiness and delivery of many child nutrition interventions are low in most countries (Assaf, Wang, and Mallick 2016; Leslie et al. 2017). Our results demonstrate that, in many countries, more action is needed to ensure that facility capacity and training are adequate to address important nutrition interventions in the context of IMCI.
4.2 Limitations
There are some limitations of this report. First, many indicators of nutrition-related care for children (e.g., growth monitoring, vitamin A) are preventative and part of routine child care and not necessarily curative child care services. Thus, it may be important to capture routine well-child visits in SPA surveys. However, in areas where routine care for children is hindered by access related to cost of care, distance to a facility,

27
or other issues, these visits may be an opportunity for children to receive nutritional supplements and growth monitoring services. In addition, some routine elements of care, such as weighing a child, may have occurred before the visit.
Second, although many nutrition interventions are delivered through health facilities, many are also based in the community. Common examples in low- and middle-income countries include behavior change interventions for infant and young child feeding to improve child health and survival and distribution of IFA supplementation and counseling to reduce anemia in pregnant women (Chapman et al. 2010; Kavle and Landry 2018). Community health workers deliver many preventative and curative nutrition interventions outside of the health facility, which extends the reach and effectiveness of nutrition interventions (Perry and Zulliger 2012; Menon et al. 2014). Thus, actual population-level coverage of nutrition interventions may differ from estimates in this report.
For women, counseling on nutrition and breastfeeding may not be standard for every ANC visit throughout pregnancy. Maternal nutrition may be discussed only early in pregnancy, while counseling on breastfeeding may occur only towards the end of pregnancy, particularly if the provider adheres to scheduled counseling as per the WHO “focused” ANC four-visit model (Lincetto et al. 2006). These factors are important to consider when reporting service readiness and delivery during ANC. However, in areas where contact with health facilities during pregnancy is minimal, counseling during any visit may be conducted.
Another limitation of this report is that SPA surveys have been collected in a small number of countries in the past decade. In four countries (reported in the appendix only), the surveys are 10 or more years old and therefore do not reflect recent improvements in health systems and nutrition programming. In the future, more countries should conduct regular SPA surveys as global efforts to strengthen health systems continue.
Finally, although SPA surveys include data on service readiness or delivery for nutrition interventions in children under age 5, we have not presented service delivery information stratified by the child’s age. The first 1,000 days from conception to a child’s second birthday is a critical window for nutrition intervention. Reporting on service delivery by age group would provide more helpful information on targeting of nutrition interventions within health facilities.
4.3 Recommendations for Next Steps
Nutrition interventions are embedded within different service areas in health facilities, such as ANC, curative care for sick children, and growth monitoring. Collecting information on delivery of all nutrition interventions, including availability of micronutrient powders for children and pregnant women, ready-to-use therapeutic foods, and ready-to-use supplementary foods, would complement service readiness data and foster better representation of nutrition interventions in health facilities. It will also be important for surveys such as SPAs to consider adding community assessment components for common service areas in order to capture community readiness and delivery of many important nutrition interventions.
As shown in other studies, summary indices can offer important information about the overall capacity of facilities to provide services in specific areas and provide a simplified means of benchmarking facilities over time and across countries (Bellows et al. 2016; Mallick, Wang, and Temsah, 2017). Future research can use the indicators defined in this report and create service readiness and delivery nutrition indices for key nutrition interventions. For example, a readiness index for facility implementation of the Baby Friendly

28
Hospital Initiative (BFHI) would allow countries to monitor and track BFHI readiness in facilities. The WHO landscape analysis on readiness to act in nutrition also uses multiple data sources such as DHS surveys and country health management information systems to track country progress on global nutrition targets (WHO 2012). The landscape analysis includes data on facility availability and readiness to provide nutrition interventions that could leverage SPA data to create a nutrition index and contribute to monitoring country action on nutrition.
Finally, The DHS Program conducts closely timed surveys among households and facilities in a number of countries. It is often possible to link SPA and DHS data to assess the association between service provision and utilization, behavior, or coverage. Future research can explore the relationship between service readiness and the uptake of nutrition behaviors reported by women interviewed in household surveys.
4.4 Conclusions
This report describes nutrition intervention readiness and delivery at health facilities in the context of antenatal and curative care services. The availability of trained providers, medications, and equipment for pregnant women and children varies by country, although some countries appear well-equipped to provide nutrition interventions. However, provider counseling on nutrition-related topics lags in all countries, particularly with respect to maternal diet, breastfeeding, and complementary feeding practices. In addition, the majority of providers have not received recent training on nutrition-related topics for women and children.
Increased use of SPA and community-based surveys by more countries is warranted in order to describe nutrition intervention readiness and delivery in health facilities and the community. Given the importance of counseling for many nutrition behaviors, future efforts should focus on improving health worker training and counseling skills. The findings from this report can be used by governments and program planners as they work toward addressing the nutrition-related Sustainable Development Goals.
29
REFERENCES
Ahmad, M. O., U. Sughra, U. Kalsoom, M. Imran, and U. Hadi. 2012. “Effect of Antenatal Counselling on Exclusive Breastfeeding.” J Ayub Med Coll Abbottabad 24 (2): 116-9. http://www.ncbi.nlm.nih.gov/pubmed/24397070
Assaf, S., W. Wang, and L. Mallick. 2016. Provider Counseling and Knowledge Transfer in Health Facilities of Haiti, Malawi, and Senegal. DHS Analytical Studies No. 60. Rockville, Maryland, USA: ICF International. https://dhsprogram.com/pubs/pdf/AS60/AS60.pdf
Black, R. E., C. G. Victora, S. P. Walker, et al. 2013. “Maternal and Child Undernutrition and Overweight in Low-Income and Middle-Income Countries.” Lancet 382 (9890): 427-51. http://www.ncbi.nlm.nih.gov/pubmed/23746772
Bellows, B., R. Behl, T. Abuya, A. Muriuki, A. Bajracharya, and Y. Choi. 2016. “Benchmarking to Assess Quality of Family Planning Services: Construction and Use of Indices for Family Planning Readiness in Kenya with Data from 2010 and 2014.” In Quality Measurement in Family Planning: Past, Present, Future: Papers from the Bellagio Meeting on Family Planning Quality, edited by A. Sprockett, S. H. Leisher, K. Longfield, and D. Montagu. Oakland, California, USA: Metrics for Measurement. http://m4mgmt.org/wp-content/uploads/2017/07/Bellagio-book-web.pdf
Bessinger, R. E., and J. T. Bertrand. 2001. “Monitoring Quality of Care in Family Planning Programs: A Comparison of Observations and Client Exit Interviews.” Int Fam Plann Perspect 27 (2): 63-70. https://pdfs.semanticscholar.org/fb43/221351e1ec1812dfce046048a9f54d0f5d91.pdf
Chapman, D. J., K. Morel, A. K. Anderson, G. Damio, and R. Perez-Escamilla. 2010. “Breastfeeding Peer Counseling: From Efficacy through Scale-Up.” J Hum Lact 26 (3): 314-26. http://www.ncbi.nlm.nih.gov/pubmed/20715336
Choi, Y. 2018. “Estimates of Side Effects Counseling in Family Planning Using Three Data Sources: Implications for Monitoring and Survey Design.” Stud Fam Plann 49 (1): 23-39. https://onlinelibrary.wiley.com/doi/pdf/10.1111/sifp.12044
Chopra, M., A. Sharkey, N. Dalmiya, D. Anthony, N. Binkin, and UNICEF Equity in Child Survival, Health and Nutrition Analysis Team. 2012. “Strategies to Improve Health Coverage and Narrow the Equity Gap in Child Survival, Health, and Nutrition.” Lancet 380 (9850): 1331-40. http://www.ncbi.nlm.nih.gov/pubmed/22999430
Development Initiatives. 2017. Global Nutrition Report 2017: Nourishing the SDGs. Bristol, UK: Development Initiatives. http://globalnutritionreport.org/the-report/
Gera, T., D. Shah, P. Garner, M. Richardson, and H. S. Sachdev. 2016. “Integrated Management of Childhood Illness (IMCI) Strategy for Children under Five.” Cochrane Database Syst Rev 6: CD010123. http://www.ncbi.nlm.nih.gov/pubmed/27378094

30
Horton, S., L. S. Blum, M. Diouf, et al. 2018. “Delivering Vitamin A Supplements to Children Aged 6-59 Months: Comparing Delivery through Campaigns and through Routine Health Services in Senegal.” Curr Dev Nutr 2 (4): nzy006. http://www.ncbi.nlm.nih.gov/pubmed/30019030
Kampman, H., A. Zongrone, R. Rawat, and E. Becquey. 2017. “How Senegal Created an Enabling Environment for Nutrition: A Story of Change.” Glob Food Security 13: 57-65. http://www.sciencedirect.com/science/article/pii/S2211912416301109
Kanyangarara, M., V. B. Chou, A. A. Creanga, and N. Walker. 2018. “Linking Household and Health Facility Surveys to Assess Obstetric Service Availability, Readiness and Coverage: Evidence from 17 Low- and Middle-Income Countries.” J Glob Health 8 (1): 010603. http://www.ncbi.nlm.nih.gov/pubmed/29862026
Kanyangarara, M., M. K. Munos, and N. Walker. 2017. “Quality of Antenatal Care Service Provision in Health Facilities across Sub-Saharan Africa: Evidence from Nationally Representative Health Facility Assessments.” J Glob Health 7 (2): 021101. http://www.ncbi.nlm.nih.gov/pubmed/29163936
Kavle, J. A., and M. Landry. 2018. “Community-Based Distribution of Iron-Folic Acid Supplementation in Low- and Middle-Income Countries: A Review of Evidence and Programme Implications.” Public Health Nutr 21 (2): 346-54. http://www.ncbi.nlm.nih.gov/pubmed/29061205
Larson, E., H. H. Leslie, and M. E. Kruk. 2017. “The Determinants and Outcomes of Good Provider Communication: A Cross-Sectional Study in Seven African Countries.” BMJ Open 7 (6): e014888. http://www.ncbi.nlm.nih.gov/pubmed/28674138
Leslie, H. H., A. Malata, Y. Ndiaye, and M. E. Kruk. 2017. “Effective Coverage of Primary Care Services in Eight High-Mortality Countries.” BMJ Glob Health 2: e000424. http://gh.bmj.com/content/bmjgh/2/3/e000424.full.pdf
Lincetto, O., S. Mothebesoane-Anoh, P. Gomez, and S. Munjanja. 2006. “Antenatal Care.” In Opportunities for Africa’s Newborns: Practical Data, Policy and Programmatic Support for Newborn Care in Africa. Geneva, Switzerland: World Health Organization.
Mallick, L., R. Winter, W. Wang, and J. Yourkavitch. 2016. Integration of Infectious Disease Services with Antenatal Care Services at Health Facilities in Kenya, Malawi, and Tanzania. DHS Analytical Studies No. 62. Rockville, Maryland, USA: ICF International.
Mallick, L., W. Wang, and G. Temsah. 2017. A Comparison of Summary Measures of Quality of Service and Quality of Care for Family Planning in Haiti, Malawi, and Tanzania. DHS Methodological Report No. 20. Rockville, Maryland, USA: ICF.
Menon, P., N. M. Covic, P. B. Harrigan, et al. 2014. “Strengthening Implementation and Utilization of Nutrition Interventions through Research: A Framework and Research Agenda.” Ann N Y Acad Sci 1332: 39-59. http://www.ncbi.nlm.nih.gov/pubmed/24934307
Nikièma, L., L. Huybregts, Y. Martin-Prevel, et al. 2017. “Effectiveness of Facility-Based Personalized Maternal Nutrition Counseling in Improving Child Growth and Morbidity up to 18 Months: A Cluster-

31
Randomized Controlled Trial in Rural Burkina Faso.” PLoS One 12 (5): e0177839. http://www.ncbi.nlm.nih.gov/pubmed/28542391
Nguhiu, P. K., E. W. Barasa, and J. Chuma. 2017. “Determining the Effective Coverage of Maternal and Child Health Services in Kenya, Using Demographic and Health Survey Data Sets: Tracking Progress Towards Universal Health Coverage.” Trop Med Int Health 22 (4): 442-53. http://www.ncbi.nlm.nih.gov/pubmed/28094465
Paintal, K., and V. M. Aguayo. 2016. “Feeding Practices for Infants and Young Children During and After Common Illness. Evidence from South Asia.” Matern Child Nutr 12 (Suppl 1): 39-71. http://www.ncbi.nlm.nih.gov/pubmed/26840205
Perry, H., and R. Zulliger. 2012. How Effective Are Community Health Workers? An Overview of Current Evidence with Recommendations for Strengthening Community Health Worker Programs to Accelerate Progress in Achieving the Health-Related Millennium Development Goals. Baltimore, Maryland, USA: Johns Hopkins Bloomberg School of Public Health. https://ccmcentral.com/wp-content/uploads/2013/12/How-Effective-are-CHWs-Evidence-Summary-Condensed_JHSPH_2012.pdf
Sununtnasuk, C., A. D’Agostino, and J. L. Fiedler. 2016. “Iron+Folic Acid Distribution and Consumption through Antenatal Care: Identifying Barriers across Countries.” Public Health Nutr 19 (4): 732-42. http://www.ncbi.nlm.nih.gov/pubmed/26022914
Wang, W., M. Winner, and C. R. Burgert-Brucker. 2017. “Limited Service Availability, Readiness, and Use of Facility-Based Delivery Care in Haiti: A Study Linking Health Facility Data and Population Data.” Glob Health Sci Pract 5 (2): 244-60. http://www.ncbi.nlm.nih.gov/pubmed/28539502
WHO. 2012. Landscape Analysis on Countries’ Readiness to Accelerate Action in Nutrition: Country Assessment Tools. http://www.who.int/nutrition/landscape_analysis/publications_and_information/en/
WHO. 2013. Essential Nutrition Actions: Improving Maternal, Newborn, Infant and Young Child Health and Nutrition. http://www.who.int/nutrition/publications/infantfeeding/essential_nutrition_actions/en/
WHO. 2016. Service Availability and Readiness Assessment (SARA): Indicators and Questionnaire. http://www.who.int/healthinfo/systems/sara_indicators_questionnaire/en/
WHO. 2017. Guideline: Assessing and Managing Children at Primary Health-Care Facilities to Prevent Overweight and Obesity in the Context of the Double Burden of Malnutrition: Updates for the Integrated Management of Childhood Illness (IMCI). http://www.who.int/nutrition/publications/guidelines/children-primaryhealthcare-obesity-dbm/en/
WHO. 2018. E-Library of Evidence for Nutrition Actions (eLENA). http://www.who.int/elena/titles/en/#I.
Winter, R., J. Yourkavitch, W. Wang, and L. Mallick. 2017. “Assessment of Health Facility Capacity to Provide Newborn Care in Bangladesh, Haiti, Malawi, Senegal, and Tanzania.” J Glob Health 7 (2): 020509. http://www.ncbi.nlm.nih.gov/pubmed/29423186


33
APPENDIX
Appendix Table 1 Percent of facilities providing antenatal care services, curative child care services, and growth monitoring services, by country
Antenatal
care Curative
child care Growth
monitoring Country % 95% CI1 % 95% CI1 % 95% CI1 Bangladesh 97.4 [96.2,98.2] 92.9 [90.3,94.8] 62.2 [58.1,66.0] Haiti 91.9 93.7 66.8 Kenya 73.4 [68.0,78.2] 96.1 [92.8,97.9] Malawi 64.7 93.8 73.8 Namibia 73.7 86.1 Nepal 96.2 [94.7,97.3] 97.2 [96.7,97.7] 93.6 [92.4,94.7] Rwanda 80.7 [78.4,82.7] 96.5 [94.9,97.6] Senegal 76.3 [72.3,80.0] 95.4 [92.7,97.2] 87.6 [84.3,90.3] Tanzania 84.6 [81.6,87.2] 97.6 [96.1,98.6] 84.8 [81.8,87.4] Uganda 70.5 [66.0,74.7] 98.3 [96.4,99.2] 1 The 95% CI reflects the upper and lower bounds of the 95% confidence interval. There are no CIs for facility-based indicators for Haiti, Malawi, and Namibia as these countries had census-based surveys. However, CIs are included for provider- and client-based indicators for all countries.

34
Appe
ndix
Tab
le 2
Pe
rcen
t of f
acili
ties
with
cap
acity
to p
rovi
de n
utrit
ion-
rela
ted
care
in A
NC
, per
cent
of c
lient
s ob
serv
ed a
nd re
port
ing
nutr
ition
-re
late
d co
unse
ling
amon
g cl
ient
s at
tend
ing
ANC
, and
per
cent
of p
rovi
ders
with
trai
ning
on
nutr
ition
al a
sses
smen
t in
preg
nanc
y,
by c
ount
ry
B
angl
ades
h SP
A 20
14
Hai
ti SP
A
2013
K
enya
SPA
20
10
Mal
awi S
PA
2013
-14
Nam
ibia
SPA
20
09
Nep
al S
PA
2015
Rw
anda
SPA
20
07
Sene
gal S
PA
2016
Ta
nzan
ia S
PA
2014
-15
Uga
nda
SPA
2007
%
95
% C
I %
95
% C
I %
95
% C
I %
95
% C
I %
95
% C
I %
95
% C
I %
95
% C
I %
95
% C
I %
95
% C
I %
95
% C
I Fa
cilit
ies
with
AN
C
Iron
for w
omen
61
.8
[57.
7,65
.8]
64.9
58.8
[5
2.4,
64.8
] 37
.3
14
.9
12
.5
[10.
2,15
.3]
75.3
[7
1.3,
79.0
] 5.
2 [3
.2,8
.1]
41.1
[3
7.1,
45.4
] 42
.0
[36.
2,48
.1]
Folic
aci
d fo
r wom
en
57.7
[5
3.6,
61.6
] 54
.9
72
.1
[65.
9,77
.6]
29.5
40.9
10.6
[8
.6,1
3.0]
1.
3 [0
.5,3
.3]
68.5
[6
4.4,
72.4
]
IF
A fo
r wom
en
88.4
[8
5.3,
91.0
] 58
.1
18
.1
[13.
8,23
.4]
92.0
88.8
90.7
[8
8.0,
92.9
] 75
.3
[71.
3,79
.0]
79.2
[7
4.1,
83.5
] 92
.4
[89.
8,94
.4]
40.0
[3
4.0,
46.3
] Vi
tam
in A
for w
omen
64
.6
[61.
2,67
.9]
55.5
93.4
[8
9.6,
95.9
] 51
.6
97
.4
89
.4
[86.
9,91
.4]
60.0
[5
5.2,
64.6
] 73
.8
[70.
0,77
.3]
77.3
[7
1.8,
82.0
] Ad
ult w
eigh
ing
scal
e 88
.3
[85.
2,90
.8]
92.9
89.8
[8
3.4,
93.8
] 93
.8
92
.4
94
.9
[92.
6,96
.5]
84.8
[8
1.2,
87.8
] 93
.7
[89.
0,96
.5]
88.0
[8
4.6,
90.7
] 69
.8
[63.
8,75
.3]
Num
ber o
f AN
C fa
cilit
ies
1,
508
83
2
510
63
2
303
92
6
434
35
7 1
,005
347
Obs
erva
tion
of A
NC
1
IF
A pr
ovid
ed/p
resc
ribed
70
.9
[67.
2,74
.3]
49.9
[4
4.4,
55.4
] 86
.5
[83.
1,89
.3]
74.8
[6
6.7,
81.4
] 62
.7
[57.
5,67
.6]
41.8
[3
5.3,
48.6
] 87
.5
[84.
4,90
.1]
75.3
[7
1.8,
78.5
] 73
.9
[67.
9,79
.1]
Cou
nsel
ing
on IF
A (p
urpo
se)2
35.4
[3
0.7,
40.4
] 77
.3
[71.
3,82
.4]
65.9
[6
0.9,
70.6
] 69
.9
[62.
5,76
.3]
18.0
[1
3.5,
23.6
] 80
.1
[71.
6,86
.6]
41.0
[3
4.9,
47.4
] 72
.6
[68.
6,76
.2]
45.5
[3
7.0,
54.3
] C
ouns
elin
g on
IFA
(how
to
take
)2
43
.0
[38.
2,47
.9]
78.8
[7
2.4,
84.1
] 68
.6
[63.
9,72
.9]
86.1
[8
1.0,
90.0
] 28
.4
[23.
3,34
.1]
90.1
[8
4.4,
93.8
] 48
.0
[41.
8,54
.3]
77.6
[7
4.2,
80.7
] 68
.3
[60.
0,75
.6]
Cou
nsel
ing
on IF
A (s
ide
effe
cts)
2
3.
5 [2
.2,5
.6]
19.0
[1
4.4,
24.7
] 10
.6
[8.1
,13.
9]
20.5
[1
3.8,
29.4
] 4.
0 [2
.5,6
.4]
36.4
[2
7.1,
46.9
] 1.
8 [1
.0,3
.3]
14.2
[1
1.7,
17.3
] 9.
1 [5
.9,1
3.7]
C
ouns
eled
on
brea
stfe
edin
g
5.
6 [4
.1,7
.7]
23.4
[1
9.3,
28.0
] 6.
7 [4
.3,1
0.3]
39
.0
[30.
3,48
.5]
0.9
[0.4
,2.2
] 20
.5
[15.
3,27
.0]
2.2
[1.0
,4.6
] 12
.5
[10.
4,14
.8]
17.6
[1
2.8,
23.7
] C
ouns
eled
on
early
and
pr
olon
ged
brea
stfe
edin
g
1.
5 [0
.8,2
.9]
19.5
[1
5.7,
24.1
] 4.
4 [2
.5,7
.7]
n/a
1.
4 [0
.7,2
.9]
n/a
1.
8 [0
.8,4
.3]
8.7
[6.9
,10.
9] n
/a
W
eigh
t ass
esse
d 80
.8
[76.
4,84
.5]
96.2
[9
2.9,
97.9
] 75
.1
[69.
9,79
.6]
94.9
[9
0.6,
97.3
] 74
.0
[67.
3,79
.6]
98.5
[9
5.3,
99.5
] 93
.4
[89.
6,95
.9]
80.2
[7
6.0,
83.8
] 76
.6
[68.
3,83
.3]
Cou
nsel
ed o
n nu
tritio
n
43.3
[3
9.3,
47.4
] 47
.1
[41.
7,52
.6]
39.1
[3
4.3,
44.2
] 48
.9
[40.
0,57
.9]
48.1
[4
3.3,
53.0
] 39
.6
[33.
3,46
.3]
38.4
[3
2.7,
44.4
] 32
.5
[29.
2,36
.0]
29.5
[2
3.7,
36.0
] Ph
ysic
al e
xam
for a
nem
ia
49.4
[4
5.2,
53.6
] 82
.5
[78.
0,86
.2]
78.9
[7
5.1,
82.2
] 62
.0
[52.
6,70
.6]
36.9
[3
2.0,
42.1
]
96
.3
[94.
6,97
.5]
58.7
[5
5.0,
62.3
]
Te
sted
for a
nem
ia
57.8
[5
4.1,
61.3
] 42
.8
[38.
7,47
.1]
8.4
[5.7
,12.
3]
84.0
[7
7.0,
89.1
] 32
.3
[27.
4,37
.7]
35.0
[2
8.3,
42.5
] 29
.6
[25.
2,34
.4]
42.3
[3
8.7,
46.1
] 20
.0
[14.
5,26
.8]
Num
ber o
f clie
nts
1,62
0 1
,409
2
,068
859
1,5
09
72
2
849
4,0
07
37
3
Wom
en’s
repo
rt o
f AN
C3
IFA
prov
ided
/pre
scrib
ed
82.4
[7
9.7,
84.8
] 67
.4
[62.
5,71
.9]
93.3
[9
0.8,
95.2
] 94
.8
[90.
6,97
.2]
77.3
[7
1.7,
82.1
] 47
.2
[41.
1,53
.5]
97.6
[9
6.0,
98.6
] 85
.6
[82.
6,88
.2]
81.9
[7
7.3,
85.7
] C
ouns
elin
g on
IFA
(how
to
take
)4
84
.6
[81.
1,87
.6]
93.3
[9
0.1,
95.5
] 96
.7
[95.
6,97
.5]
95.3
[9
3.1,
96.7
] 91
.0
[87.
8,93
.3]
89.7
[8
5.0,
93.1
] 83
.6
[79.
8,86
.8]
97.2
[9
5.9,
98.1
] 88
.6
[81.
6,93
.1]
Cou
nsel
ing
on IF
A (s
ide
effe
cts)
4
19
.9
[16.
9,23
.2]
20.8
[1
6.8,
25.4
] 16
.8
[14.
2,19
.7]
30.6
[2
4.9,
36.8
] 20
.7
[17.
1,24
.8]
11.1
[7
.6,1
6.1]
5.
1 [3
.4,7
.5]
26.7
[2
4.0,
29.6
] 20
.0
[14.
6,26
.8]
Clie
nt c
an id
entif
y at
leas
t on
e si
de e
ffect
4
22
.0
[18.
8,25
.7]
31.9
[2
6.8,
37.6
] 10
.3
[8.4
,12.
5]
22.5
[1
8.3,
27.4
] 16
.1
[12.
7,20
.2]
7.3
[4.7
,11.
2]
35.8
[3
1.6,
40.2
] 15
.2
[13.
4,17
.2]
23.6
[1
7.8,
30.7
] C
ouns
eled
on
impo
rtanc
e of
ex
clus
ive
brea
stfe
edin
g
31
.4
[28.
2,34
.8]
38.0
[3
4.3,
42.0
] 52
.6
[49.
2,55
.9]
71.1
[6
5.9,
75.7
] 15
.9
[12.
8,19
.6]
32.4
[2
7.1,
38.3
] 4.
6 [3
.0,7
.1]
34.6
[3
1.7,
37.7
] 31
.9
[25.
6,39
.0]
Cou
nsel
ed o
n du
ratio
n of
ex
clus
ive
brea
stfe
edin
g5
67
.7
[61.
7,73
.1]
81.7
[7
5.8,
86.5
] 67
.6
[63.
1,71
.8]
15.6
[1
0.5,
22.5
] 58
.9
[47.
2,69
.7]
84.6
[7
7.1,
90.0
] 53
.9
[28.
3,77
.6]
76.3
[7
2.5,
79.7
] 63
.7
[52.
2,73
.8]
Cou
nsel
ed o
n nu
tritio
n
41
.0
[37.
7,44
.4]
51.0
[4
6.7,
55.3
] 65
.1
[61.
3,68
.8]
66.4
[6
1.0,
71.4
] 73
.1
[68.
2,77
.4]
37.7
[3
2.4,
43.2
] 47
.3
[41.
6,53
.2]
44.0
[4
0.9,
47.2
] 50
.6
[44.
4,56
.7]
Num
ber o
f clie
nts
1,
620
1,4
09
2,0
68
85
9 1
,509
722
84
9 4
,007
373
Prov
ider
trai
ning
6
R
ecen
t tra
inin
g on
nut
ritio
nal
asse
ssm
ent f
or p
regn
ancy
21
.5
[19.
1,24
.1]
16.0
[1
4.3,
17.8
] 16
.9
[14.
6,19
.4]
16.5
[1
5.0,
18.2
] 10
.4
[8.3
,13.
0]
11.3
[9
.7,1
3.0]
n/a
17.3
[1
5.4,
19.4
] 13
.1
[11.
8,14
.5]
n/a
Num
ber o
f pro
vide
rs
4,1
69
3,
967
2,
518
2,
538
1,
283
3,
709
1,
719
1,
623
6,
078
1,
590
35
1 O
nly
clie
nts
who
agr
eed
to b
e ob
serv
ed a
nd in
terv
iew
ed a
nd o
nly
at fa
cilit
ies
whe
re th
ere
wer
e ob
serv
atio
ns
2 In
old
er s
urve
ys (K
enya
, Nam
ibia
, Rw
anda
, and
Uga
nda)
, obs
erva
tions
of t
hese
item
s w
ere
reco
rded
onl
y if
the
prov
ider
gav
e or
pre
scrib
ed IF
A; fi
lter w
as a
pplie
d to
cur
rent
sur
veys
for t
he p
urpo
ses
of c
ompa
rabi
lity
in th
is
repo
rt.
3 Ex
it in
terv
iew
cou
nsel
ing
item
s ba
sed
on c
urre
nt o
r pas
t vis
its
4 IF
A-re
late
d co
unse
ling
asse
ssed
onl
y am
ong
wom
en w
ho re
porte
d th
at th
eir p
rovi
der p
resc
ribed
or p
rovi
ded
them
with
IFA
5 As
ked
only
am
ong
wom
en w
ho re
porte
d th
at th
e pr
ovid
er c
ouns
eled
on
excl
usiv
e br
east
feed
ing
6 Ex
clud
es p
rovi
ders
who
exc
lusi
vely
wor
ked
in th
e la
bora
tory
of t
he fa
cilit
y or
in o
ther
non
-qua
lifyi
ng p
ositi
ons
CI =
con
fiden
ce in
terv
al; n
/a =
not
ava
ilabl
e

36
Appendix Table 3 Percent of facilities with capacity to provide nutrition-related care in ANC, percent of clients observed and reporting nutrition-related counseling among clients attending ANC, and percent of providers with training on nutritional assessment in pregnancy, by background characteristics, Bangladesh SPA 2014
Facility type Managing authority Locale
Hospital Other Public Private, other Rural Urban
% CI % CI % CI % CI % CI % CI Facilities with ANC
Iron for women 73.9 [64.0,81.8] 61.6 [57.4,65.6] 60.9 [56.5,65.1] 75.8 [68.4,81.9] 60.8 [56.3,65.0] 74.2 [68.2,79.3] Folic acid for women 72.6 [62.4,80.9] 57.3 [53.1,61.4] 56.5 [52.1,60.7] 74.7 [67.2,81.0] 56.4 [51.9,60.7] 72.6 [66.6,77.9] IFA for women 81.3 [71.4,88.3] 88.6 [85.3,91.2] 88.5 [85.2,91.2] 86.8 [80.7,91.2] 88.4 [85.0,91.1] 88.5 [83.5,92.2] Vitamin A for women 56.8 [45.7,67.3] 64.8 [61.3,68.1] 64.7 [61.1,68.2] 63.2 [55.1,70.6] 64.6 [60.9,68.1] 65.0 [58.6,70.9] Adult weighing scale 88.1 [77.4,94.1] 88.3 [85.2,90.9] 87.9 [84.6,90.6] 93.6 [88.8,96.5] 87.8 [84.4,90.5] 94.3 [90.6,96.6]
Observation of women’s ANC (n/a) IFA provided/prescribed
Counseling on IFA (purpose) Counseling on IFA (how to take) Counseling on IFA (side effects)
Counseled on breastfeeding Counseled on early and prolonged
breastfeeding Weight assessed Counseled on nutrition during ANC Physical exam for anemia Tested for anemia
Women's report of ANC (n/a) IFA provided/prescribed
Counseling on IFA (how to take) Counseling on IFA (side effects) Client can identify at least one side
effect Counseled on importance of exclusive
breastfeeding Counseled on duration of exclusive
breastfeeding Counseled on nutrition during ANC
Provider training1 Recent training on nutritional
assessment for pregnant women 14.8 [10.5,20.3] 22.2 [19.6,25.1] 21.8 [19.1,24.7] 19.8 [15.4,25.2] 22.4 [19.4,25.7] 18.7 [15.8,21.9] 1 Excludes providers who exclusively worked in the laboratory of the facility or in other non-qualifying positions CI = confidence interval; n/a = not available
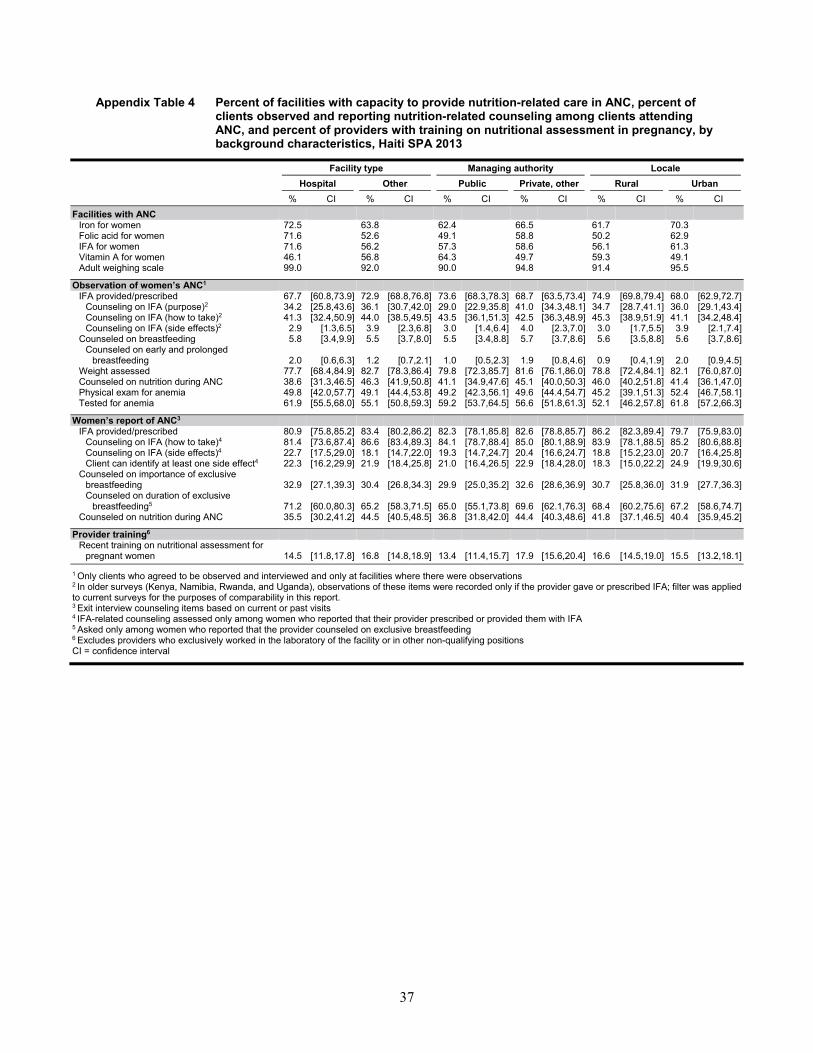
37
Appendix Table 4 Percent of facilities with capacity to provide nutrition-related care in ANC, percent of clients observed and reporting nutrition-related counseling among clients attending ANC, and percent of providers with training on nutritional assessment in pregnancy, by background characteristics, Haiti SPA 2013
Facility type Managing authority Locale
Hospital Other Public Private, other Rural Urban
% CI % CI % CI % CI % CI % CI Facilities with ANC
Iron for women 72.5 63.8 62.4 66.5 61.7 70.3 Folic acid for women 71.6 52.6 49.1 58.8 50.2 62.9 IFA for women 71.6 56.2 57.3 58.6 56.1 61.3 Vitamin A for women 46.1 56.8 64.3 49.7 59.3 49.1 Adult weighing scale 99.0 92.0 90.0 94.8 91.4 95.5
Observation of women’s ANC1 IFA provided/prescribed 67.7 [60.8,73.9] 72.9 [68.8,76.8] 73.6 [68.3,78.3] 68.7 [63.5,73.4] 74.9 [69.8,79.4] 68.0 [62.9,72.7]
Counseling on IFA (purpose)2 34.2 [25.8,43.6] 36.1 [30.7,42.0] 29.0 [22.9,35.8] 41.0 [34.3,48.1] 34.7 [28.7,41.1] 36.0 [29.1,43.4] Counseling on IFA (how to take)2 41.3 [32.4,50.9] 44.0 [38.5,49.5] 43.5 [36.1,51.3] 42.5 [36.3,48.9] 45.3 [38.9,51.9] 41.1 [34.2,48.4] Counseling on IFA (side effects)2 2.9 [1.3,6.5] 3.9 [2.3,6.8] 3.0 [1.4,6.4] 4.0 [2.3,7.0] 3.0 [1.7,5.5] 3.9 [2.1,7.4]
Counseled on breastfeeding 5.8 [3.4,9.9] 5.5 [3.7,8.0] 5.5 [3.4,8.8] 5.7 [3.7,8.6] 5.6 [3.5,8.8] 5.6 [3.7,8.6] Counseled on early and prolonged
breastfeeding 2.0 [0.6,6.3] 1.2 [0.7,2.1] 1.0 [0.5,2.3] 1.9 [0.8,4.6] 0.9 [0.4,1.9] 2.0 [0.9,4.5] Weight assessed 77.7 [68.4,84.9] 82.7 [78.3,86.4] 79.8 [72.3,85.7] 81.6 [76.1,86.0] 78.8 [72.4,84.1] 82.1 [76.0,87.0] Counseled on nutrition during ANC 38.6 [31.3,46.5] 46.3 [41.9,50.8] 41.1 [34.9,47.6] 45.1 [40.0,50.3] 46.0 [40.2,51.8] 41.4 [36.1,47.0] Physical exam for anemia 49.8 [42.0,57.7] 49.1 [44.4,53.8] 49.2 [42.3,56.1] 49.6 [44.4,54.7] 45.2 [39.1,51.3] 52.4 [46.7,58.1] Tested for anemia 61.9 [55.5,68.0] 55.1 [50.8,59.3] 59.2 [53.7,64.5] 56.6 [51.8,61.3] 52.1 [46.2,57.8] 61.8 [57.2,66.3]
Women’s report of ANC3 IFA provided/prescribed 80.9 [75.8,85.2] 83.4 [80.2,86.2] 82.3 [78.1,85.8] 82.6 [78.8,85.7] 86.2 [82.3,89.4] 79.7 [75.9,83.0]
Counseling on IFA (how to take)4 81.4 [73.6,87.4] 86.6 [83.4,89.3] 84.1 [78.7,88.4] 85.0 [80.1,88.9] 83.9 [78.1,88.5] 85.2 [80.6,88.8] Counseling on IFA (side effects)4 22.7 [17.5,29.0] 18.1 [14.7,22.0] 19.3 [14.7,24.7] 20.4 [16.6,24.7] 18.8 [15.2,23.0] 20.7 [16.4,25.8] Client can identify at least one side effect4 22.3 [16.2,29.9] 21.9 [18.4,25.8] 21.0 [16.4,26.5] 22.9 [18.4,28.0] 18.3 [15.0,22.2] 24.9 [19.9,30.6]
Counseled on importance of exclusive breastfeeding 32.9 [27.1,39.3] 30.4 [26.8,34.3] 29.9 [25.0,35.2] 32.6 [28.6,36.9] 30.7 [25.8,36.0] 31.9 [27.7,36.3] Counseled on duration of exclusive
breastfeeding5 71.2 [60.0,80.3] 65.2 [58.3,71.5] 65.0 [55.1,73.8] 69.6 [62.1,76.3] 68.4 [60.2,75.6] 67.2 [58.6,74.7] Counseled on nutrition during ANC 35.5 [30.2,41.2] 44.5 [40.5,48.5] 36.8 [31.8,42.0] 44.4 [40.3,48.6] 41.8 [37.1,46.5] 40.4 [35.9,45.2]
Provider training6 Recent training on nutritional assessment for
pregnant women 14.5 [11.8,17.8] 16.8 [14.8,18.9] 13.4 [11.4,15.7] 17.9 [15.6,20.4] 16.6 [14.5,19.0] 15.5 [13.2,18.1] 1 Only clients who agreed to be observed and interviewed and only at facilities where there were observations 2 In older surveys (Kenya, Namibia, Rwanda, and Uganda), observations of these items were recorded only if the provider gave or prescribed IFA; filter was applied to current surveys for the purposes of comparability in this report. 3 Exit interview counseling items based on current or past visits 4 IFA-related counseling assessed only among women who reported that their provider prescribed or provided them with IFA 5 Asked only among women who reported that the provider counseled on exclusive breastfeeding 6 Excludes providers who exclusively worked in the laboratory of the facility or in other non-qualifying positions CI = confidence interval

38
Appendix Table 5 Percent of facilities with capacity to provide nutrition-related care in ANC, percent of clients observed and reporting nutrition-related counseling among clients attending ANC, and percent of providers with training on nutritional assessment in pregnancy, by background characteristics, Kenya SPA 2010
Facility type Managing authority Locale (n/a)
Hospital Other Public Private, other Rural Urban
% CI % CI % CI % CI % CI % CI Facilities with ANC
Iron for women 62.7 [56.9,68.1] 58.3 [51.3,65.0] 42.7 [34.3,51.7] 82.7 [73.1,89.3] Folic acid for women 69.0 [62.6,74.7] 72.4 [65.6,78.4] 64.2 [55.2,72.3] 84.0 [76.2,89.6] IFA for women 27.0 [22.0,32.6] 17.1 [12.5,23.1] 13.6 [8.6,20.8] 24.9 [17.8,33.6] Vitamin A for women 95.9 [91.9,97.9] 93.1 [88.9,95.8] 98.8 [96.8,99.6] 85.3 [76.1,91.3] Adult weighing scale 96.6 [92.9,98.4] 89.0 [82.0,93.5] 89.9 [81.8,94.7] 89.5 [77.2,95.5]
Observation of women’s ANC1 IFA provided/prescribed 49.6 [44.1,55.1] 50.0 [41.9,58.1] 48.4 [41.4,55.3] 54.4 [47.3,61.4]
Counseling on IFA (purpose)2 77.1 [69.9,83.0] 77.4 [68.6,84.3] 76.8 [69.4,82.9] 78.6 [67.5,86.7] Counseling on IFA (how to take)2 84.6 [77.9,89.6] 75.6 [66.1,83.1] 75.6 [67.2,82.4] 87.6 [79.8,92.7] Counseling on IFA (side effects)2 16.2 [11.7,22.0] 20.6 [14.0,29.2] 16.2 [11.0,23.1] 26.7 [17.3,38.6]
Counseled on breastfeeding 22.6 [17.9,28.1] 23.8 [18.1,30.5] 23.2 [18.4,28.8] 23.9 [16.8,32.7] Counseled on early and prolonged
breastfeeding 20.4 [15.9,25.8] 19.1 [13.8,25.8] 19.0 [14.5,24.6] 21.1 [14.6,29.6] Weight assessed 97.2 [93.8,98.8] 95.6 [90.3,98.0] 96.2 [92.0,98.3] 96.0 [89.6,98.5] Counseled on nutrition during ANC 48.7 [43.2,54.3] 46.2 [38.3,54.3] 46.7 [40.0,53.5] 48.5 [40.2,57.0] Physical exam for anemia 81.9 [76.9,86.0] 82.8 [76.1,87.9] 80.6 [75.0,85.2] 88.0 [81.0,92.7] Tested for anemia 45.2 [41.1,49.3] 41.5 [35.5,47.8] 45.5 [40.5,50.6] 34.7 [28.2,41.7]
Women’s report of ANC3 IFA provided/prescribed 66.2 [60.9,71.1] 68.1 [60.9,74.5] 64.5 [58.5,70.0] 76.4 [68.5,82.8]
Counseling on IFA (how to take)4 90.6 [86.6,93.5] 94.8 [89.7,97.4] 92.1 [87.8,95.0] 96.3 [92.1,98.3] Counseling on IFA (side effects)4 20.7 [16.5,25.6] 20.8 [15.3,27.7] 18.4 [13.7,24.4] 26.7 [20.0,34.7] Client can identify at least one side effect4 27.6 [23.0,32.6] 34.4 [26.9,42.7] 29.5 [23.5,36.3] 38.3 [28.6,49.0]
Counseled on importance of exclusive breastfeeding 43.9 [39.2,48.7] 34.7 [29.4,40.4] 36.2 [31.8,40.9] 43.5 [36.4,50.8] Counseled on duration of exclusive
breastfeeding5 77.3 [68.8,84.0] 85.0 [76.2,90.9] 79.9 [72.4,85.8] 86.3 [76.4,92.5] Counseled on nutrition during ANC 52.3 [48.3,56.3] 50.3 [44.0,56.7] 45.9 [40.7,51.2] 66.7 [59.8,72.9]
Provider training6 Recent training on nutritional assessment for
pregnant women 16.9 [15.0,19.0] 17.0 [13.8,20.8] 15.0 [12.5,17.9] 19.2 [15.3,23.8] 1 Only clients who agreed to be observed and interviewed and only at facilities where there were observations 2 In older surveys (Kenya, Namibia, Rwanda, and Uganda), observations of these items were recorded only if the provider gave or prescribed IFA; filter was applied to current surveys for the purposes of comparability in this report. 3 Exit interview counseling items based on current or past visits 4 IFA-related counseling assessed only among women who reported that their provider prescribed or provided them with IFA 5 Asked only among women who reported that the provider counseled on exclusive breastfeeding 6 Excludes providers who exclusively worked in the laboratory of the facility or in other non-qualifying positions n/a = not available; CI = confidence interval

39
Appendix Table 6 Percent of facilities with capacity to provide nutrition-related care in ANC, percent of clients observed and reporting nutrition-related counseling among clients attending ANC, and percent of providers with training on nutritional assessment in pregnancy, by background characteristics, Malawi SPA 2013-14
Facility type Managing authority Locale
Hospital Other Public Private, other Rural Urban
% CI % CI % CI % CI % CI % CI Facilities with ANC
Iron for women 47.1 35.4 29.5 50.5 33.3 54.8 Folic acid for women 65.1 22.6 21.3 43.6 23.8 54.7 IFA for women 96.2 91.2 92.9 90.6 92.2 91.2 Vitamin A for women 54.7 51.0 46.4 60.5 52.0 49.9 Adult weighing scale 94.4 93.7 92.1 96.7 93.2 96.7
Observation of women’s ANC1 IFA provided/prescribed 87.4 [80.9,91.9] 85.9 [81.8,89.2] 87.6 [83.6,90.7] 83.4 [76.1,88.8] 85.9 [82.0,89.0] 88.1 [80.0,93.2]
Counseling on IFA (purpose)2 64.0 [53.6,73.3] 67.2 [62.4,71.7] 66.4 [60.2,72.1] 64.6 [56.5,71.9] 66.9 [62.1,71.5] 63.4 [50.5,74.7] Counseling on IFA (how to take)2 68.5 [58.9,76.8] 68.6 [63.8,73.1] 69.2 [63.7,74.3] 66.6 [57.2,74.9] 68.8 [64.0,73.3] 67.9 [56.2,77.7] Counseling on IFA (side effects)2 12.7 [7.9,19.8] 9.2 [6.7,12.5] 10.3 [7.5,14.0] 11.6 [6.6,19.4] 9.8 [7.1,13.3] 12.7 [7.4,20.9]
Counseled on breastfeeding 9.3 [4.5,18.2] 5.0 [3.3,7.6] 7.1 [4.2,11.9] 5.6 [2.8,10.8] 5.1 [3.4,7.5] 10.9 [4.7,22.9] Counseled on early and prolonged
breastfeeding 6.8 [2.9,15.3] 2.8 [1.7,4.8] 4.3 [2.1,8.9] 4.7 [2.2,9.7] 3.1 [1.9,5.2] 7.7 [2.8,19.6] Weight assessed 77.1 [66.2,85.3] 73.7 [68.4,78.3] 71.8 [65.3,77.5] 84.1 [76.3,89.7] 76.6 [71.6,80.9] 71.2 [57.4,81.9] Counseled on nutrition during ANC 43.6 [34.1,53.5] 36.2 [31.4,41.2] 39.9 [34.0,46.2] 37.0 [29.4,45.2] 36.4 [31.6,41.4] 46.2 [34.8,57.9] Physical exam for anemia 80.5 [73.0,86.3] 77.8 [73.6,81.5] 79.7 [75.1,83.6] 76.6 [69.6,82.4] 77.8 [73.8,81.3] 81.6 [72.0,88.5] Tested for anemia 18.0 [11.5,27.0] 2.0 [1.3,3.0] 5.5 [3.0,10.0] 16.3 [9.9,25.9] 5.6 [3.2,9.7] 15.4 [8.9,25.4]
Women’s report of ANC3 IFA provided/prescribed 93.9 [89.3,96.6] 92.9 [89.5,95.2] 93.4 [90.4,95.6] 92.9 [87.3,96.1] 92.4 [89.3,94.7] 95.4 [90.6,97.8]
Counseling on IFA (how to take)4 97.1 [94.7,98.4] 96.4 [95.2,97.4] 97.0 [95.7,97.8] 95.9 [93.2,97.6] 96.4 [95.1,97.3] 97.4 [94.6,98.8] Counseling on IFA (side effects)4 18.6 [13.7,24.8] 15.5 [13.2,18.3] 17.4 [14.3,20.9] 15.1 [11.1,20.2] 14.8 [12.4,17.6] 21.7 [15.9,28.9] Client can identify at least one side
effect4 11.2 [7.7,16.0] 9.6 [7.8,11.8] 10.4 [8.3,13.0] 9.9 [6.5,14.9] 9.7 [7.7,12.1] 11.7 [7.8,17.1] Counseled on importance of exclusive
breastfeeding 50.7 [43.9,57.5] 53.8 [50.3,57.2] 51.7 [47.5,55.8] 55.0 [49.5,60.4] 53.4 [50.2,56.5] 50.5 [41.5,59.4] Counseled on duration of exclusive
breastfeeding5 74.4 [65.7,81.5] 63.3 [58.8,67.6] 71.2 [66.0,75.9] 58.1 [50.4,65.4] 65.8 [61.6,69.7] 72.5 [60.5,81.9] Counseled on nutrition during ANC 67.3 [59.4,74.3] 63.7 [59.9,67.4] 63.2 [58.5,67.7] 70.5 [64.5,75.9] 65.4 [61.7,68.9] 64.6 [54.4,73.6]
Provider training6 Recent training on nutritional
assessment for pregnant women 18.2 [15.1,21.8] 15.9 [14.2,17.9] 17.9 [15.7,20.2] 14.7 [12.6,17.2] 17.1 [15.2,19.3] 15.2 [12.7,18.2] 1 Only clients who agreed to be observed and interviewed and only at facilities where there were observations 2 In older surveys (Kenya, Namibia, Rwanda, and Uganda), observations of these items were recorded only if the provider gave or prescribed IFA; filter was applied to current surveys for the purposes of comparability in this report. 3 Exit interview counseling items based on current or past visits 4 IFA-related counseling assessed only among women who reported that their provider prescribed or provided them with IFA 5 Asked only among women who reported that the provider counseled on exclusive breastfeeding 6 Excludes providers who exclusively worked in the laboratory of the facility or in other non-qualifying positions CI = confidence interval

40
Appendix Table 7 Percent of facilities with capacity to provide nutrition-related care in ANC, percent of clients observed and reporting nutrition-related counseling among clients attending ANC, and percent of providers with training on nutritional assessment in pregnancy, by background characteristics, Namibia SPA 2009
Facility type Managing authority Locale (n/a)
Hospital Other Public Private, other Rural Urban
% CI % CI % CI % CI % CI % CI Facilities with ANC
Iron for women 12.5 14.9 13.4 42.9 Folic acid for women 100.0 39.3 37.4 71.4 IFA for women 100.0 88.5 90.8 71.4 Vitamin A for women 100.0 97.3 99.2 57.1 Adult weighing scale 100.0 92.2 91.6 92.9
Observation of women’s ANC1 IFA provided/prescribed 86.5 [43.3,98.2] 73.7 [65.3,80.7] 75.5 [66.3,82.8] 25.5 [0.5,96.1]
Counseling on IFA (purpose)2 57.4 [9.6,94.5] 71.2 [63.7,77.6] 70.8 [63.3,77.3] Counseling on IFA (how to take)2 90.4 [15.7,99.8] 85.7 [80.6,89.6] 85.9 [80.4,90.0] Counseling on IFA (side effects)2 19.3 [4.8,53.2] 20.7 [13.4,30.4] 20.8 [14.1,29.6]
Counseled on breastfeeding 69.5 [10.7,97.7] 36.3 [28.3,45.2] 39.2 [30.1,49.1] Counseled on early and prolonged
breastfeeding (n/a) Weight assessed 100.0 94.5 [89.8,97.1] 94.4 [89.4,97.2] 29.0 [0.1,99.7] Counseled on nutrition during ANC 63.9 [8.7,97.0] 47.5 [38.9,56.3] 49.8 [40.5,59.2] 0.0 Physical exam for anemia 72.8 [8.9,98.7] 61.1 [51.7,69.7] 63.8 [54.0,72.6] 85.5 [2.3,99.9] Tested for anemia 76.2 [6.7,99.3] 84.7 [78.6,89.2] 84.6 [78.1,89.5] 0.0
Women’s report of ANC3 IFA provided/prescribed 91.0 [78.5,96.6] 95.1 [90.4,97.6] 96.5 [93.4,98.2] 65.6 [1.0,99.7]
Counseling on IFA (how to take)4 90.9 [74.7,97.1] 95.6 [93.5,97.1] 95.1 [92.7,96.7] Counseling on IFA (side effects)4 1.4 [0.1,18.2] 33.0 [27.7,38.9] 29.5 [23.8,35.9] 61.0 [0.0,100.0] Client can identify at least one side
effect4 11.8 [0.8,70.1] 23.4 [19.3,28.1] 22.5 [17.9,27.8] 22.1 [0.0,100.0] Counseled on importance of
exclusive breastfeeding 84.3 [62.1,94.6] 69.9 [64.5,74.8] 70.0 [64.6,74.9] 54.5 [3.0,97.9] Counseled on duration of exclusive
breastfeeding5 23.8 [6.3,59.1] 14.7 [9.5,22.1] 18.2 [12.5,25.8] 26.6 [00.0,100.0] Counseled on nutrition during ANC 65.7 [41.7,83.7] 66.4 [60.7,71.7] 66.4 [60.8,71.6] 54.5 [3.0,97.9]
Provider training6 Recent training on nutritional
assessment for pregnant women 10.8 [6.7,16.9] 10.7 [8.6,13.1] 11.5 [9.4,14.1] 3.9 [1.3,10.8] 1 Only clients who agreed to be observed and interviewed and only at facilities where there were observations 2 In older surveys (Kenya, Namibia, Rwanda, and Uganda), observations of these items were recorded only if the provider gave or prescribed IFA; filter was applied to current surveys for the purposes of comparability in this report. 3 Exit interview counseling items based on current or past visits 4 IFA-related counseling assessed only among women who reported that their provider prescribed or provided them with IFA 5 Asked only among women who reported that the provider counseled on exclusive breastfeeding 6 Excludes providers who exclusively worked in the laboratory of the facility or in other non-qualifying positions n/a = not available; CI = confidence interval

41
Appendix Table 8 Percent of facilities with capacity to provide nutrition-related care in ANC, percent of clients observed and reporting nutrition-related counseling among clients attending ANC, and percent of providers with training on nutritional assessment in pregnancy, by background characteristics, Nepal SPA 2015
Facility type Managing authority Locale (n/a)
Hospital Other Public Private, other Rural Urban
% CI % CI % CI % CI % CI % CI Facilities with ANC
Iron for women 47.6 [38.9,56.4] 9.0 [6.7,12.0] 9.5 [7.2,12.4] 51.8 [41.2,62.3] Folic acid for women 57.2 [48.5,65.5] 5.8 [4.0,8.3] 6.5 [4.7,8.9] 63.6 [52.9,73.0] IFA for women 74.5 [65.9,81.5] 92.4 [89.4,94.6] 92.3 [89.4,94.5] 70.2 [59.6,79.0] Vitamin A for women 52.6 [44.0,61.1] 93.5 [90.7,95.4] 93.1 [90.5,95.1] 41.1 [30.8,52.2] Adult weighing scale 96.9 [90.4,99.1] 94.6 [92.1,96.4] 94.7 [92.3,96.5] 96.6 [88.2,99.1]
Observation of women’s ANC1 IFA provided/prescribed 56.1 [48.5,63.5] 68.8 [62.3,74.6] 66.6 [61.5,71.4] 46.4 [33.5,59.7]
Counseling on IFA (purpose)2 11.5 [7.7,16.9] 22.9 [16.0,31.6] 19.3 [14.2,25.5] 10.6 [4.1,24.9] Counseling on IFA (how to take)2 19.3 [13.8,26.3] 35.2 [27.7,43.5] 31.5 [25.8,37.8] 9.6 [3.9,21.7] Counseling on IFA (side effects)2 3.3 [1.5,7.5] 4.6 [2.6,8.0] 4.7 [2.9,7.5] 0.2 [0.0,1.5]
Counseled on breastfeeding 0.7 [0.3,1.8] 1.1 [0.3,4.0] 1.0 [0.4,2.6] 0.5 [0.1,4.3] Counseled on early and prolonged
breastfeeding 1.0 [0.3,2.9] 1.8 [0.7,4.7] 1.4 [0.6,3.1] 1.6 [0.3,7.6] Weight assessed 68.8 [58.0,77.9] 78.7 [70.5,85.0] 75.8 [69.2,81.4] 66.3 [45.9,82.0] Counseled on nutrition during ANC 36.4 [30.2,43.2] 58.8 [52.7,64.7] 53.2 [47.9,58.4] 26.9 [19.4,36.0] Physical exam for anemia 37.0 [30.4,44.2] 36.8 [29.8,44.5] 34.8 [29.5,40.5] 45.8 [33.2,59.0] Tested for anemia 35.1 [28.2,42.6] 29.8 [22.8,37.9] 33.7 [28.2,39.7] 26.5 [17.2,38.5]
Women’s report of ANC3 IFA provided/prescribed 66.9 [58.3,74.5] 86.8 [78.8,92.1] 82.7 [76.5,87.5] 54.8 [40.0,68.7]
Counseling on IFA (how to take)4 86.2 [79.6,90.9] 94.3 [91.4,96.3] 91.9 [88.6,94.2] 85.3 [72.4,92.8] Counseling on IFA (side effects)4 20.9 [16.4,26.1] 20.5 [15.5,26.7] 19.3 [15.5,23.7] 29.5 [20.2,40.9] Client can identify at least one side
effect4 16.8 [12.5,22.2] 15.6 [11.0,21.8] 16.0 [12.3,20.5] 16.9 [9.0,29.6] Counseled on importance of exclusive
breastfeeding 13.1 [9.3,18.2] 18.5 [13.9,24.1] 16.8 [13.4,21.0] 12.0 [6.0,22.5] Counseled on duration of exclusive
breastfeeding5 56.3 [31.2,78.5] 60.7 [51.1,69.4] 61.6 [53.5,69.1] 43.4 [1.8,96.9] Counseled on nutrition during ANC 69.5 [64.0,74.5] 76.3 [68.2,82.9] 73.8 [68.2,78.8] 69.8 [61.0,77.4]
Provider training6 Recent training on nutritional
assessment for pregnant women 6.9 [5.5,8.7] 12.7 [10.7,15.0] 12.4 [10.6,14.5] 5.8 [4.1,8.2] 1 Only clients who agreed to be observed and interviewed and only at facilities where there were observations 2 In older surveys (Kenya, Namibia, Rwanda, and Uganda), observations of these items were recorded only if the provider gave or prescribed IFA; filter was applied to current surveys for the purposes of comparability in this report. 3 Exit interview counseling items based on current or past visits 4 IFA-related counseling assessed only among women who reported that their provider prescribed or provided them with IFA 5 Asked only among women who reported that the provider counseled on exclusive breastfeeding 6 Excludes providers who exclusively worked in the laboratory of the facility or in other non-qualifying positions n/a = not available; CI = confidence interval

42
Appendix Table 9 Percent of facilities with capacity to provide nutrition-related care in ANC, percent of clients observed and reporting nutrition-related counseling among clients attending ANC, and percent of providers with training on nutritional assessment in pregnancy, by background characteristics, Rwanda SPA 2007
Facility type Managing authority Locale (n/a)
Hospital Other Public Private, other Rural Urban
% CI % CI % CI % CI % CI % CI Facilities with ANC
Iron for women 86.7 [51.9,97.5] 74.9 [70.8,78.6] 77.1 [71.7,81.7] 72.3 [66.3,77.7] Folic acid for women IFA for women 86.7 [51.9,97.5] 74.9 [70.8,78.6] 77.1 [71.7,81.7] 72.3 [66.3,77.7] Vitamin A for women Adult weighing scale 66.7 [35.4,87.9] 85.4 [81.8,88.4] 84.4 [79.5,88.2] 85.5 [79.4,90.1]
Observation of women’s ANC1 IFA provided/prescribed 40.0 [1.1,97.6] 41.9 [35.3,48.7] 42.7 [34.4,51.4] 39.8 [29.9,50.7]
Counseling on IFA (purpose)2 16.7 [1.9,67.0] 81.4 [72.8,87.8] 79.4 [68.2,87.3] 82.1 [67.8,91.0] Counseling on IFA (how to take)2 33.3 [0.1,99.7] 91.2 [85.4,94.8] 89.4 [81.9,94.1] 91.7 [80.8,96.6] Counseling on IFA (side effects)2 37.2 [27.7,47.7] 39.4 [28.2,52.0] 28.6 [15.5,46.7]
Counseled on breastfeeding 20.9 [15.6,27.5] 20.0 [13.8,28.0] 21.8 [12.9,34.5] Counseled on early and prolonged
breastfeeding Weight assessed 100.0 98.4 [95.2,99.5] 99.6 [98.4,99.9] 95.7 [84.4,98.9] Counseled on nutrition during ANC 33.3 [0.4,98.3] 39.7 [33.4,46.5] 38.2 [30.8,46.1] 43.1 [31.4,55.6] Physical exam for anemia Tested for anemia 66.7 [1.9,99.5] 34.4 [27.6,41.9] 35.2 [27.3,44.1] 34.6 [22.0,49.8]
Women’s report of ANC3 IFA provided/prescribed 40.0 [1.1,97.6] 47.4 [41.2,53.7] 46.0 [38.0,54.2] 50.2 [41.0,59.4]
Counseling on IFA (how to take)4 83.3 [0.2,100.0] 89.9 [85.0,93.3] 91.1 [85.8,94.5] 86.8 [74.1,93.8] Counseling on IFA (side effects)4 16.7 [00.0,99.8] 11.0 [7.4,16.1] 12.3 [7.9,18.8] 8.5 [3.7,18.3] Client can identify at least one side
effect4 7.5 [4.8,11.4] 7.7 [4.5,12.7] 6.6 [2.9,14.2] Counseled on importance of exclusive
breastfeeding 20.0 [0.2,97.6] 32.7 [27.3,38.6] 28.6 [22.5,35.5] 41.7 [31.4,52.8] Counseled on duration of exclusive
breastfeeding5 84.4 [76.8,89.9] 81.5 [70.6,89.0] 89.8 [78.9,95.4] Counseled on nutrition during ANC 66.7 [18.2,94.7] 37.1 [31.7,42.7] 34.4 [28.3,41.1] 45.5 [36.2,55.1]
Provider training6 Recent training on nutritional
assessment for pregnant women (n/a) 1 Only clients who agreed to be observed and interviewed and only at facilities where there were observations 2 In older surveys (Kenya, Namibia, Rwanda, and Uganda), observations of these items were recorded only if the provider gave or prescribed IFA; filter was applied to current surveys for the purposes of comparability in this report. 3 Exit interview counseling items based on current or past visits 4 IFA-related counseling assessed only among women who reported that their provider prescribed or provided them with IFA 5 Asked only among women who reported that the provider counseled on exclusive breastfeeding
6 Excludes providers who exclusively worked in the laboratory of the facility or in other non-qualifying positions n/a = not available; CI = confidence interval

43
Appendix Table 10 Percent of facilities with capacity to provide nutrition-related care in ANC, percent of clients observed and reporting nutrition-related counseling among clients attending ANC, and percent of providers with training on nutritional assessment in pregnancy, by background characteristics, Senegal SPA 2016
Facility type Managing authority Locale
Hospital Other Public Private, other Rural Urban
% CI % CI % CI % CI % CI % CI Facilities with ANC
Iron for women 7.3 [1.5,28.3] 5.6 [3.5,9.0] 4.8 [2.8,7.9] 8.1 [2.6,22.5] 5.8 [3.4,9.9] 3.7 [1.5,8.9] Folic acid for women 7.3 [1.5,28.3] 1.1 [0.3,3.7] 1.3 [0.4,3.7] 1.2 [0.1,8.7] 1.5 [0.4,4.7] 0.9 [0.2,3.4] IFA for women 62.9 [41.2,80.4] 82.1 [77.1,86.2] 81.6 [76.1,86.1] 61.0 [46.1,74.1] 82.4 [76.0,87.4] 72.1 [63.2,79.6] Vitamin A for women 16.3 [5.5,39.2] 68.1 [62.9,72.8] 62.0 [56.7,67.0] 44.9 [32.1,58.3] 62.3 [56.2,68.0] 55.0 [46.8,63.0] Adult weighing scale 98.5 [95.9,99.4] 92.9 [87.6,96.0] 90.8 [84.1,94.9]
Observation of women’s ANC1 IFA provided/prescribed 79.4 [61.1,90.5] 87.7 [84.6,90.4] 87.7 [84.4,90.4] 84.9 [71.9,92.5] 89.2 [85.6,92.0] 85.6 [80.0,89.9]
Counseling on IFA (purpose)2 38.6 [17.5,65.0] 41.1 [34.8,47.6] 41.2 [34.7,48.1] 38.2 [24.4,54.2] 36.3 [30.3,42.7] 46.4 [35.4,57.7] Counseling on IFA (how to take)2 30.2 [14.5,52.4] 48.5 [42.2,55.0] 47.2 [40.7,53.7] 59.6 [43.9,73.5] 45.9 [38.1,53.9] 50.4 [40.2,60.6] Counseling on IFA (side effects)2 0.0 1.8 [1.0,3.4] 1.6 [0.8,3.1] 3.8 [0.4,26.4] 2.9 [1.4,5.5] 0.6 [0.1,4.2]
Counseled on breastfeeding 0.0 2.2 [1.0,4.7] 2.3 [1.1,4.9] 0.0 2.0 [0.8,4.8] 2.3 [0.7,7.7] Counseled on early and prolonged
breastfeeding 0.0 1.9 [0.8,4.4] 2.0 [0.8,4.6] 0.0 1.4 [0.5,4.1] 2.3 [0.7,7.8] Weight assessed 94.4 [82.1,98.4] 93.4 [89.5,95.9] 93.1 [89.0,95.8] 96.9 [93.3,98.6] 92.5 [87.8,95.5] 94.3 [86.9,97.7] Counseled on nutrition during ANC 35.6 [21.0,53.4] 38.5 [32.6,44.7] 38.4 [32.4,44.8] 37.9 [22.5,56.2] 32.9 [27.4,39.0] 44.3 [34.1,55.1] Physical exam for anemia 95.5 [81.2,99.0] 96.4 [94.5,97.6] 96.2 [94.3,97.5] 97.5 [91.4,99.3] 95.4 [92.8,97.1] 97.3 [94.3,98.7] Tested for anemia 35.6 [25.3,47.5] 29.4 [24.9,34.4] 30.2 [25.5,35.3] 21.8 [11.8,36.8] 26.6 [21.5,32.4] 32.9 [25.7,41.1]
Women’s report of ANC3 IFA provided/prescribed 91.7 [61.4,98.7] 97.8 [96.2,98.8] 97.6 [95.8,98.6] 98.4 [88.1,99.8] 98.6 [96.9,99.3] 96.6 [93.3,98.3]
Counseling on IFA (how to take)4 65.4 [44.6,81.7] 84.1 [80.3,87.3] 83.1 [79.0,86.4] 90.2 [77.4,96.1] 83.9 [78.9,87.9] 83.2 [77.0,88.0] Counseling on IFA (side effects)4 6.3 [1.7,20.9] 5.1 [3.4,7.5] 5.1 [3.4,7.6] 5.0 [1.1,19.8] 5.5 [3.3,9.1] 4.6 [2.5,8.4] Client can identify at least one side
effect4 51.6 [30.6,72.1] 35.3 [31.1,39.9] 35.8 [31.3,40.5] 36.5 [25.8,48.8] 31.9 [27.7,36.3] 40.2 [32.5,48.4] Counseled on importance of exclusive
breastfeeding 1.7 [0.2,13.3] 4.7 [3.0,7.2] 4.9 [3.1,7.5] 1.6 [0.2,11.9] 4.3 [2.6,7.1] 4.9 [2.4,9.8] Counseled on duration of exclusive
breastfeeding5 100.0 53.4 [27.6,77.4] 55.3 [28.9,79.0] 0.0 51.7 [26.9,75.7] 56.0 [9.2,94.1] Counseled on nutrition during ANC 37.3 [21.2,56.9] 47.7 [41.7,53.7] 47.4 [41.2,53.6] 47.2 [33.2,61.8] 41.4 [35.3,47.7] 53.9 [43.5,64.0]
Provider training6 Recent training on nutritional
assessment for pregnant women 18.6 [11.3,29.1] 18.7 [16.5,21.0] 17.5 [15.5,19.7] 16.2 [10.9,23.2] 16.4 [14.3,18.7] 18.4 [15.1,22.2] 1 Only clients who agreed to be observed and interviewed and only at facilities where there were observations 2 In older surveys (Kenya, Namibia, Rwanda, and Uganda), observations of these items were recorded only if the provider gave or prescribed IFA; filter was applied to current surveys for the purposes of comparability in this report. 3 Exit interview counseling items based on current or past visits 4 IFA-related counseling assessed only among women who reported that their provider prescribed or provided them with IFA 5 Asked only among women who reported that the provider counseled on exclusive breastfeeding
6 Excludes providers who exclusively worked in the laboratory of the facility or in other non-qualifying positions CI = confidence interval

44
Appendix Table 11 Percent of facilities with capacity to provide nutrition-related care in ANC, percent of clients observed and reporting nutrition-related counseling among clients attending ANC, and percent of providers with training on nutritional assessment in pregnancy, by background characteristics, Tanzania SPA 2014-15
Facility type Managing authority Locale
Hospital Other Public Private, other Rural Urban
% CI % CI % CI % CI % CI % CI Facilities with ANC
Iron for women 48.5 [39.9,57.1] 40.8 [36.6,45.2] 40.4 [36.0,45.0] 44.5 [34.4,55.1] 40.0 [35.6,44.6] 45.9 [37.1,55.0] Folic acid for women 81.5 [75.2,86.5] 68.0 [63.7,71.9] 70.3 [65.9,74.3] 60.5 [49.4,70.6] 69.0 [64.5,73.2] 66.4 [56.0,75.4] IFA for women 95.9 [92.9,97.7] 92.3 [89.6,94.4] 93.7 [91.1,95.5] 86.8 [77.2,92.8] 92.4 [89.5,94.6] 92.4 [86.2,96.0] Vitamin A for women 52.7 [43.8,61.5] 74.8 [70.7,78.4] 77.0 [73.0,80.6] 59.5 [48.5,69.7] 75.7 [71.5,79.5] 65.7 [56.0,74.2] Adult weighing scale 100.0 87.4 [84.0,90.3] 85.8 [81.8,89.0] 97.9 [90.5,99.6] 86.8 [82.9,90.0] 92.9 [85.0,96.8]
Observation of women’s ANC1 IFA provided/prescribed 79.5 [75.5,83.0] 74.5 [70.4,78.2] 77.7 [73.7,81.3] 65.0 [58.0,71.3] 76.5 [72.0,80.5] 72.2 [66.9,76.8]
Counseling on IFA (purpose)2 79.4 [73.0,84.6] 71.2 [66.5,75.4] 71.7 [67.2,75.8] 76.8 [67.8,84.0] 72.9 [68.1,77.3] 71.6 [64.6,77.7] Counseling on IFA (how to take)2 79.8 [73.6,84.8] 77.2 [73.2,80.7] 78.8 [74.9,82.2] 71.7 [64.5,77.9] 80.7 [76.7,84.2] 69.2 [62.0,75.5] Counseling on IFA (side effects)2 18.8 [14.9,23.4] 13.3 [10.4,16.9] 14.6 [11.7,18.0] 12.5 [7.6,19.9] 12.9 [9.9,16.8] 17.8 [13.4,23.2]
Counseled on breastfeeding 20.6 [16.5,25.3] 10.9 [8.7,13.6] 12.0 [9.7,14.7] 14.6 [10.7,19.5] 11.1 [8.9,13.6] 16.1 [11.8,21.5] Counseled on early and prolonged
breastfeeding 15.5 [12.3,19.3] 7.4 [5.5,10.0] 8.3 [6.2,10.9] 10.6 [7.7,14.6] 7.2 [5.4,9.4] 12.6 [8.5,18.2] Weight assessed 88.2 [83.8,91.6] 78.7 [73.8,82.9] 77.4 [72.4,81.7] 92.3 [87.8,95.2] 78.9 [73.4,83.5] 83.6 [77.7,88.3] Counseled on nutrition during ANC 40.2 [34.6,46.1] 31.1 [27.3,35.1] 31.9 [28.1,36.0] 34.9 [28.7,41.8] 30.0 [25.9,34.4] 39.0 [33.9,44.3] Physical exam for anemia 63.6 [58.2,68.6] 57.8 [53.4,62.0] 59.4 [55.2,63.4] 55.7 [47.7,63.5] 58.6 [54.2,62.9] 58.8 [51.8,65.6] Tested for anemia 61.0 [55.9,65.8] 38.8 [34.7,43.1] 39.2 [35.2,43.3] 56.0 [47.1,64.4] 33.5 [29.4,37.9] 64.9 [59.9,69.7]
Women’s report of ANC3 IFA provided/prescribed 90.1 [87.2,92.4] 84.7 [81.2,87.7] 87.4 [84.1,90.2] 77.6 [70.2,83.7] 86.5 [82.4,89.7] 83.3 [79.5,86.5]
Counseling on IFA (how to take)4 98.0 [95.9,99.0] 97.0 [95.4,98.0] 97.4 [96.0,98.3] 96.2 [91.3,98.4] 97.7 [96.2,98.6] 95.8 [92.1,97.8] Counseling on IFA (side effects)4 33.9 [30.4,37.5] 25.3 [22.1,28.7] 26.1 [23.1,29.4] 29.4 [24.1,35.3] 24.7 [21.3,28.4] 32.0 [28.0,36.3] Client can identify at least one side
effect4 22.8 [19.8,26.0] 13.7 [11.7,16.0] 14.6 [12.6,16.7] 18.5 [14.2,23.8] 13.2 [11.1,15.7] 20.6 [17.2,24.4] Counseled on importance of exclusive
breastfeeding 51.2 [46.3,56.0] 31.5 [28.2,35.0] 32.3 [29.0,35.7] 44.6 [38.1,51.3] 30.1 [26.8,33.5] 46.2 [40.7,51.9] Counseled on duration of exclusive
breastfeeding5 76.5 [71.1,81.2] 76.2 [71.5,80.3] 74.6 [70.0,78.7] 81.4 [74.8,86.6] 75.6 [71.0,79.7] 77.4 [70.7,82.9] Counseled on nutrition during ANC 55.8 [51.8,59.8] 41.8 [38.2,45.5] 42.7 [39.1,46.3] 49.7 [43.3,56.1] 40.4 [36.5,44.5] 53.2 [48.7,57.6]
Provider training6 Recent training on nutritional
assessment for pregnant women 13.0 [11.5,14.7] 13.1 [11.6,14.8] 15.3 [13.6,17.2] 9.0 [7.5,10.9] 15.7 [13.9,17.7] 9.2 [7.8,10.9] 1 Only clients who agreed to be observed and interviewed and only at facilities where there were observations 2 In older surveys (Kenya, Namibia, Rwanda, and Uganda), observations of these items were recorded only if the provider gave or prescribed IFA; filter was applied to current surveys for the purposes of comparability in this report. 3 Exit interview counseling items based on current or past visits 4 IFA-related counseling assessed only among women who reported that their provider prescribed or provided them with IFA 5 Asked only among women who reported that the provider counseled on exclusive breastfeeding 6 Excludes providers who exclusively worked in the laboratory of the facility or in other non-qualifying positions CI = confidence interval
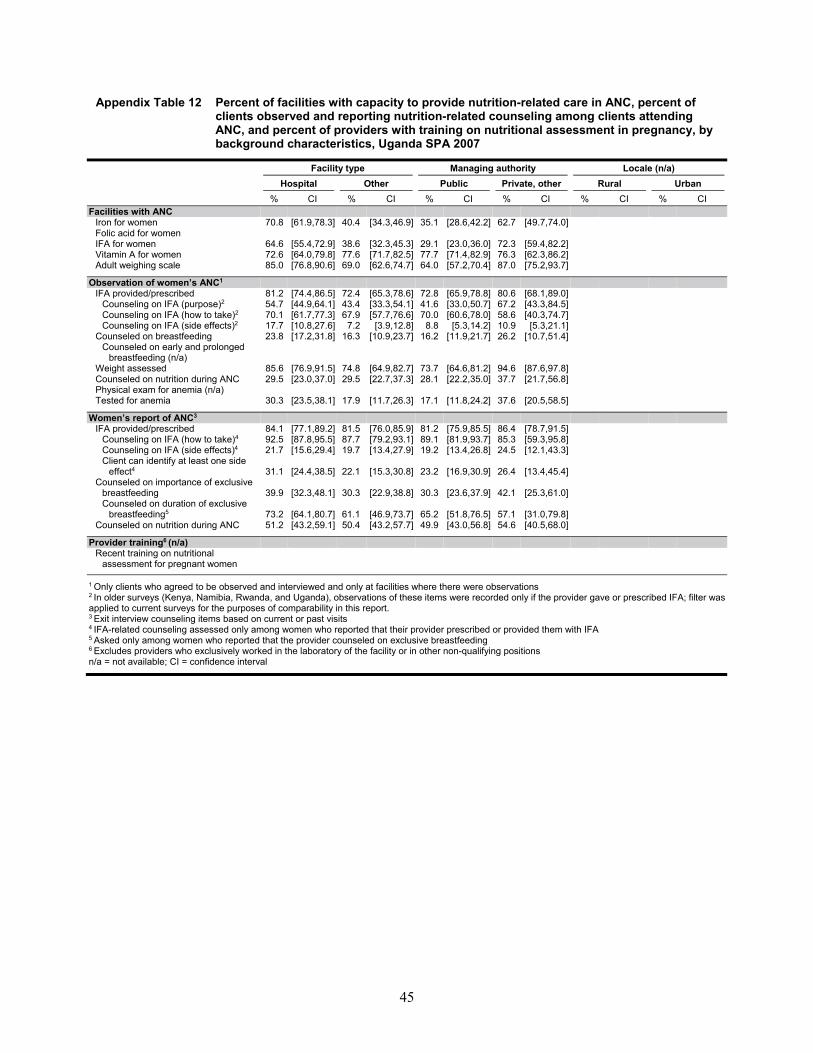
45
Appendix Table 12 Percent of facilities with capacity to provide nutrition-related care in ANC, percent of clients observed and reporting nutrition-related counseling among clients attending ANC, and percent of providers with training on nutritional assessment in pregnancy, by background characteristics, Uganda SPA 2007
Facility type Managing authority Locale (n/a)
Hospital Other Public Private, other Rural Urban
% CI % CI % CI % CI % CI % CI Facilities with ANC
Iron for women 70.8 [61.9,78.3] 40.4 [34.3,46.9] 35.1 [28.6,42.2] 62.7 [49.7,74.0] Folic acid for women IFA for women 64.6 [55.4,72.9] 38.6 [32.3,45.3] 29.1 [23.0,36.0] 72.3 [59.4,82.2] Vitamin A for women 72.6 [64.0,79.8] 77.6 [71.7,82.5] 77.7 [71.4,82.9] 76.3 [62.3,86.2] Adult weighing scale 85.0 [76.8,90.6] 69.0 [62.6,74.7] 64.0 [57.2,70.4] 87.0 [75.2,93.7]
Observation of women’s ANC1 IFA provided/prescribed 81.2 [74.4,86.5] 72.4 [65.3,78.6] 72.8 [65.9,78.8] 80.6 [68.1,89.0]
Counseling on IFA (purpose)2 54.7 [44.9,64.1] 43.4 [33.3,54.1] 41.6 [33.0,50.7] 67.2 [43.3,84.5] Counseling on IFA (how to take)2 70.1 [61.7,77.3] 67.9 [57.7,76.6] 70.0 [60.6,78.0] 58.6 [40.3,74.7] Counseling on IFA (side effects)2 17.7 [10.8,27.6] 7.2 [3.9,12.8] 8.8 [5.3,14.2] 10.9 [5.3,21.1]
Counseled on breastfeeding 23.8 [17.2,31.8] 16.3 [10.9,23.7] 16.2 [11.9,21.7] 26.2 [10.7,51.4] Counseled on early and prolonged
breastfeeding (n/a) Weight assessed 85.6 [76.9,91.5] 74.8 [64.9,82.7] 73.7 [64.6,81.2] 94.6 [87.6,97.8] Counseled on nutrition during ANC 29.5 [23.0,37.0] 29.5 [22.7,37.3] 28.1 [22.2,35.0] 37.7 [21.7,56.8] Physical exam for anemia (n/a) Tested for anemia 30.3 [23.5,38.1] 17.9 [11.7,26.3] 17.1 [11.8,24.2] 37.6 [20.5,58.5]
Women’s report of ANC3 IFA provided/prescribed 84.1 [77.1,89.2] 81.5 [76.0,85.9] 81.2 [75.9,85.5] 86.4 [78.7,91.5]
Counseling on IFA (how to take)4 92.5 [87.8,95.5] 87.7 [79.2,93.1] 89.1 [81.9,93.7] 85.3 [59.3,95.8] Counseling on IFA (side effects)4 21.7 [15.6,29.4] 19.7 [13.4,27.9] 19.2 [13.4,26.8] 24.5 [12.1,43.3] Client can identify at least one side
effect4 31.1 [24.4,38.5] 22.1 [15.3,30.8] 23.2 [16.9,30.9] 26.4 [13.4,45.4] Counseled on importance of exclusive
breastfeeding 39.9 [32.3,48.1] 30.3 [22.9,38.8] 30.3 [23.6,37.9] 42.1 [25.3,61.0] Counseled on duration of exclusive
breastfeeding5 73.2 [64.1,80.7] 61.1 [46.9,73.7] 65.2 [51.8,76.5] 57.1 [31.0,79.8] Counseled on nutrition during ANC 51.2 [43.2,59.1] 50.4 [43.2,57.7] 49.9 [43.0,56.8] 54.6 [40.5,68.0]
Provider training6 (n/a) Recent training on nutritional
assessment for pregnant women
1 Only clients who agreed to be observed and interviewed and only at facilities where there were observations 2 In older surveys (Kenya, Namibia, Rwanda, and Uganda), observations of these items were recorded only if the provider gave or prescribed IFA; filter was applied to current surveys for the purposes of comparability in this report. 3 Exit interview counseling items based on current or past visits 4 IFA-related counseling assessed only among women who reported that their provider prescribed or provided them with IFA 5 Asked only among women who reported that the provider counseled on exclusive breastfeeding 6 Excludes providers who exclusively worked in the laboratory of the facility or in other non-qualifying positions n/a = not available; CI = confidence interval

46
Appendix Table 13 Availability of IFA supplements among facilities that provide ANC and percent of women provided or prescribed IFA supplements, by country and region
Percentage of facilities that have IFA available and
valid in any service area among facilities
that provide ANC services
Percentage of ANC clients who were
prescribed or provided iron, folic
acid, or IFA Country % 95% CI N % 95% CI N Bangladesh
Barisal 97.0 [93.2,98.7] 115 n/a Chittagong 84.9 [77.1,90.3] 280 n/a Dhaka 84.3 [75.6,90.3] 412 n/a Khulna 87.7 [77.7,93.6] 191 n/a Rajshahi 92.8 [83.5,97.1] 212 n/a Rangpur 93.6 [84.1,97.6] 203 n/a Sylhet 86.8 [76.3,93.1] 96 n/a
Haiti Ouest 59.6 296 61.8 [56.1,67.2] 609 Sud-Est 57.1 63 76.2 [61.9,86.3] 74 Nord 70.7 75 72.2 [57.7,83.2] 137 Nord-Est 64.7 34 83.6 [63.6,93.7] 61 Artibonite 42.6 108 74.0 [60.4,84.2] 181 Centre 47.7 44 82.2 [68.0,91.0] 164 Sud 69.4 62 63.5 [50.4,75.0] 105 Grand-Anse 57.5 40 94.8 [85.3,98.3] 98 Nord-Ouest 52.6 82 70.7 [61.6,78.4] 154 Nippes 69.0 29 76.4 [52.3,90.5] 37
Malawi
North 96.6 118 84.2 [70.1,92.4] 232 Central 92.5 235 91.9 [87.7,94.7] 884 South 89.8 280 82.1 [76.5,86.6] 952
Nepal
Eastern development region 95.2 [90.5,97.7] 206 64.7 [51.4,76.1] 385 Central development region 81.1 [74.1,86.5] 301 60.9 [53.0,68.2] 661 Western development region 97.9 [94.9,99.1] 202 72.4 [60.9,81.6] 232 Mid-western development region 95.8 [88.7,98.5] 129 58.6 [45.3,70.8] 135 Far-western development region 89.3 [78.9,94.9] 89 49.7 [38.9,60.4] 96
Senegal
Ouest 70.6 [59.0,80.1] 98 85.3 [78.4,90.3] 334 Centre 84.2 [74.2,90.8] 93 89.5 [84.6,93.0] 220 Nord 73.4 [59.9,83.6] 76 84.9 [77.7,90.0] 162 Sud 88.1 [79.0,93.5] 90 92.7 [87.7,95.7] 133
Tanzania
Western 80.3 [66.4,89.4] 89 67.0 [54.4,77.6] 705 Northern 90.2 [77.5,96.1] 139 74.5 [68.3,79.9] 316 Central 94.7 [84.9,98.3] 108 83.6 [75.1,89.6] 340 Southern Highlands 94.0 [83.9,97.9] 118 77.5 [66.1,85.9] 341 Southern 92.5 [77.8,97.7] 70 78.3 [67.5,86.2] 189 South West Highlands 96.2 [80.7,99.4] 110 72.0 [56.7,83.5] 290 Lake 97.0 [89.7,99.2] 200 85.4 [80.5,89.3] 1086 Eastern 96.6 [88.2,99.1] 141 76.2 [67.9,82.8] 359 Zanzibar 62.0 [49.9,72.8] 31 53.4 [36.4,69.6] 383
CI = confidence interval; n/a = not available

47
Appe
ndix
Tab
le 1
4 Pe
rcen
t of f
acili
ties
with
cap
acity
to p
rovi
de n
utrit
ion-
rela
ted
care
in c
urat
ive
child
car
e se
rvic
es, p
erce
nt o
f clie
nts
obse
rved
and
car
etak
ers
repo
rtin
g nu
triti
on-r
elat
ed c
ouns
elin
g am
ong
clie
nts
atte
ndin
g si
ck c
hild
car
e vi
sits
, and
per
cent
of p
rovi
ders
with
trai
ning
on
child
nut
ritio
n to
pics
, by
coun
try
Ban
glad
esh
SPA
2014
H
aiti
SPA
20
13
Ken
ya S
PA
2010
M
alaw
i SPA
20
13-1
4 N
amib
ia S
PA
2009
N
epal
SPA
20
15
Rwan
da S
PA
2007
Se
nega
l SPA
20
16
Tanz
ania
SPA
20
14-1
5 U
gand
a SP
A
2007
%
95
% C
I %
95
% C
I %
95
% C
I %
95
% C
I %
95
% C
I %
95
% C
I %
95
% C
I %
95
% C
I %
95
% C
I %
95
% C
I Fa
cilit
ies
with
cur
ativ
e ch
ild c
are
C
hild
wei
ghin
g sc
ale
avai
labl
e1 61
.3
[57.
2,65
.3]
70.6
69.2
[6
3.5,
74.4
] 73
.6
77
.4
45
.5
[41.
0,50
.0]
70.1
[6
6.2,
73.8
] 65
.1
[60.
9,69
.0]
82.6
[7
9.4,
85.5
] 73
.3
[68.
0,77
.9]
Infa
nt s
cale
ava
ilabl
e2 34
.8
[31.
3,38
.4]
74.0
75.9
[7
1.1,
80.2
] 71
.0
87
.9
78
.4
[74.
3,82
.0]
84.4
[8
1.5,
86.9
] 95
.1
[92.
4,96
.8]
73.9
[7
0.2,
77.2
] 64
.2
[59.
3,68
.9]
Stad
iom
eter
/hei
ght r
od
avai
labl
e 62
.6
[58.
4,66
.5]
64.2
24.9
[2
0.4,
29.9
] 71
.3
24
.3
[20.
8,28
.0]
81.5
[7
7.7,
84.8
] 53
.9
[49.
8,57
.9]
Tape
mea
sure
ava
ilabl
e 40
.9
[37.
0,45
.1]
78.2
51.8
29.3
[2
5.4,
33.5
]
92
.0
[88.
5,94
.5]
63.1
[5
9.1,
66.9
]
Vi
tam
in A
sup
plem
enta
tion
avai
labl
e 64
.0
[60.
6,67
.3]
82.1
79.2
[7
4.8,
83.0
] 42
.8
94
.4
[91.
4,96
.3]
89.6
[8
7.2,
91.6
]
49
.1
[45.
0,53
.2]
66.6
[6
3.0,
70.0
] 74
.7
[69.
7,79
.1]
Iron
supp
lem
enta
tion
avai
labl
e 61
.6
[57.
4,65
.6]
64.9
50.6
[4
4.5,
56.6
] 38
.3
15
.8
[12.
4,20
.0]
12.5
[1
0.2,
15.3
] 68
.4
[64.
8,71
.8]
4.4
[2.8
,6.8
] 37
.8
[34.
1,41
.8]
40.5
[3
5.4,
45.8
] Zi
nc s
uppl
emen
tatio
n av
aila
ble
63.7
[6
0.1,
67.2
] 54
.2
76
.3
95
.5
[94.
3,96
.5]
53.6
[4
9.5,
57.6
] 44
.3
[40.
3,48
.3]
N
umbe
r of f
acili
ties
1,
437
84
8
668
91
7
354
93
6
519
44
7 1
,160
483
Obs
erva
tion
of s
ick
child
vis
its
C
hild
wei
ght a
sses
sed
76.2
[7
2.6,
79.5
] 49
.8
[44.
8,54
.8]
26.5
[2
1.8,
31.7
] 88
.7
[84.
8,91
.7]
49.7
[4
4.9,
54.6
] 64
.2
[59.
9,68
.2]
85.0
[8
0.2,
88.8
] 16
.1
[13.
8,18
.7]
45.5
[3
9.1,
52.1
] C
hild
wei
ght p
lotte
d on
gr
owth
cha
rt3
15
.5
[12.
3,19
.3]
36.9
[3
0.7,
43.5
] 27
.0
[19.
7,35
.9]
46.3
[4
0.6,
52.0
] 24
.4
[19.
7,29
.9]
8.3
[5.9
,11.
5]
59.1
[5
2.5,
65.4
] 21
.6
[15.
8,28
.8]
24.1
[1
6.7,
33.4
] Pr
ovid
er a
sked
if c
hild
re
ceiv
ed v
itam
in A
4
2.
7 [2
.0,3
.6]
23.1
[1
9.4,
27.3
] 1.
9 [1
.3,2
.6]
29.7
[2
5.9,
34.0
] 1.
1 [0
.6,1
.9]
17.6
[1
4.6,
21.1
] 29
.6
[25.
0,34
.7]
3.1
[2.2
,4.4
] 11
.7
[8.7
,15.
5]
Aske
d cl
ient
abo
ut fe
edin
g or
bre
astfe
edin
g w
hen
child
is w
ell4
40.1
[3
7.3,
43.0
] 44
.3
[40.
1,48
.4]
14.2
[1
1.9,
16.9
] 44
.1
[40.
2,48
.1]
17.7
[1
5.1,
20.6
] 29
.4
[26.
3,32
.8]
31.1
[2
7.1,
35.4
] 27
.9
[25.
5,30
.4]
48.9
[4
3.6,
54.1
] As
ked
clie
nt a
bout
feed
ing
or b
reas
tfeed
ing
durin
g illn
ess4
25.2
[2
2.8,
27.8
] 46
.9
[43.
1,50
.8]
15.5
[1
3.5,
17.7
] 43
.9
[39.
7,48
.3]
16.3
[1
3.9,
19.1
] 42
.4
[38.
7,46
.1]
18.6
[1
5.3,
22.5
] 18
.8
[16.
9,20
.9]
43.9
[3
8.9,
49.0
]
Num
ber o
f clie
nts5
2,44
2
1,94
6
3,32
9
1,54
4
2,18
6
1,70
9
1,02
7
4,96
1
769
Car
etak
ers’
repo
rt of
sic
k ch
ild v
isit
C
hild
wei
ght a
sses
sed
83
.8
[80.
7,86
.5]
50.6
[4
5.7,
55.5
] 45
.3
[40.
0,50
.8]
87.6
[8
3.9,
90.6
] 59
.1
[54.
5,63
.5]
70.6
[6
7.0,
73.9
] 90
.4
[86.
3,93
.3]
30.5
[2
8.0,
33.1
] 46
.7
[40.
5,53
.0]
Dis
cuss
ed c
hild
’s g
row
th
39.4
[3
6.3,
42.6
] 23
.6
[20.
3,27
.2]
23.4
[2
0.0,
27.2
] 30
.7
[27.
2,34
.4]
14.7
[1
1.9,
18.0
] 42
.1
[38.
3,45
.9]
27.6
[2
3.8,
31.9
] 37
.9
[35.
4,40
.5]
18.8
[1
4.8,
23.4
] R
epor
ted
prov
ider
dis
cuss
ed
feed
ing
or b
reas
tfeed
ing
whe
n ch
ild is
not
ill
27.7
[2
5.2,
30.3
] 21
.6
[18.
4,25
.1]
11.5
[9
.8,1
3.5]
28
.3
[25.
3,31
.6]
12.7
[1
0.6,
15.0
] 9.
1 [7
.6,1
1.0]
39
.7
[35.
3,44
.3]
19.9
[1
8.2,
21.7
] 25
.1
[20.
7,30
.0]
Rep
orte
d co
unse
ling
on
feed
ing
or b
reas
tfeed
ing
durin
g illn
ess
24.6
[2
2.4,
27.0
] 15
.4
[12.
7,18
.5]
11.5
[9
.8,1
3.4]
22
.0
[19.
3,24
.9]
21.8
[1
9.1,
24.7
] 9.
6 [7
.9,1
1.6]
26
.1
[22.
4,30
.2]
12.8
[1
1.3,
14.5
] 37
.5
[32.
6,42
.6]
N
umbe
r of c
aret
aker
s5
2,
442
1,9
46
3,3
29
1,5
44
2,1
86
1,7
09
1,0
27
4,9
61
76
9
Prov
ider
trai
ning
6
R
ecen
t tra
inin
g on
br
east
feed
ing
42.7
[3
9.7,
45.8
] 27
.0
[24.
2,29
.3]
30.0
[2
6.9,
33.1
] 35
.0
[32.
3,37
.5]
21.0
[1
8.4,
24.5
] 32
.0
[29.
0,34
.1]
9.0
[7.4
,10.
1]
43.0
[3
9.8,
45.8
] 15
.0
[13.
9,16
.5]
25.0
[2
1.5,
29.7
] R
ecen
t tra
inin
g on
ear
ly
and
excl
usiv
e br
east
feed
ing
27.6
[2
4.8,
30.5
] 17
.4
[15.
6,19
.4]
22.5
[1
9.7,
25.6
] 23
.2
[21.
3,25
.3]
21.6
[1
8.5,
25.1
] 21
.5
[19.
4,23
.8]
6.4
[5.3
,7.7
] 31
.7
[28.
9,34
.5]
24.7
[2
3.2,
26.3
] 16
.1
[12.
8,20
.1]
Rec
ent t
rain
ing
on
com
plem
enta
ry fe
edin
g 38
.9
[36.
0,41
.8]
22.5
[2
0.2,
24.9
] 27
.3
[24.
6,30
.2]
35.8
[3
3.2,
38.4
] 20
.6
[17.
6,24
.0]
27.9
[2
5.4,
30.5
] 7.
3 [6
.2,8
.6]
48.7
[4
5.6,
51.8
] 19
.3
[17.
8,20
.9]
21.6
[1
7.8,
25.9
] R
ecen
t tra
inin
g on
infa
nt
and
youn
g ch
ild fe
edin
g 20
.8
[18.
4,23
.4]
20.5
[1
7.8,
23.6
] n/
a
35.0
[3
2.7,
37.4
] n/
a
6.9
[5.8
,8.3
] n/
a
14.9
[1
3.4,
16.5
] 32
.1
[30.
4,34
.0]
n/a
Num
ber o
f pro
vide
rs
4,16
9
3,
967
2,
518
2,
538
1,
283
3,
709
1,
719
1,
623
6,
078
1,
590
1 O
r a d
igita
l sta
ndin
g sc
ale
with
gra
datio
ns o
f 250
gra
ms
or le
ss o
n w
hich
an
adul
t can
hol
d a
child
to b
e w
eigh
ed
2 O
r a d
igita
l sta
ndin
g sc
ale
with
gra
datio
ns o
f 100
gra
ms
or le
ss o
n w
hich
an
adul
t can
hol
d a
child
to b
e w
eigh
ed

48
3 Fi
lter f
or o
lder
sur
veys
(Ken
ya, N
amib
ia, R
wan
da, a
nd U
gand
a), q
uest
ion
aske
d on
ly if
the
abov
e ite
m w
as a
sked
or p
erfo
rmed
; filt
er w
as a
pplie
d to
cur
rent
sur
veys
for t
he p
urpo
ses
of c
ompa
rabi
lity
in th
is re
port.
4
Brea
stfe
edin
g an
d vi
tam
in A
item
s ha
d n/
a re
spon
se o
ptio
ns in
old
er s
urve
ys; h
owev
er, n
ewer
sur
veys
do
not h
ave
the
n/a
or s
kip
optio
n fo
r the
se p
artic
ular
indi
cato
rs. F
or c
ompa
rabi
lity,
n/a
resp
onse
s w
ere
code
d as
no
for o
lder
su
rvey
s.
5 O
nly
clie
nts
who
agr
eed
to b
e ob
serv
ed a
nd in
terv
iew
ed a
nd o
nly
at fa
cilit
ies
whe
re th
ere
wer
e ob
serv
atio
ns
6 Ex
clud
es p
rovi
ders
who
exc
lusi
vely
wor
ked
in th
e la
bora
tory
of t
he fa
cilit
y or
in o
ther
non
-qua
lifyi
ng p
ositi
ons
CI =
con
fiden
ce in
terv
al; n
/a =
not
ava
ilabl
e

49
Appendix Table 15 Percent of facilities with capacity to provide nutrition-related care in curative child care services, percent of clients observed and caretakers reporting nutrition-related counseling among clients attending sick child care visits, and percent of providers with training on child nutrition topics, by facility background characteristics, Bangladesh SPA 2014
Facility type Managing authority Locale
Hospital Other Public Private, other Rural Urban
% CI % CI % CI % CI % CI % CI Facilities with curative child care
Child weighing scale available1 91.3 [80.2,96.4] 60.7 [56.5,64.7] 59.9 [55.5,64.1] 84.9 [77.0,90.4] 59.3 [54.9,63.6] 86.3 [80.6,90.6] Infant scale available2 91.4 [82.0,96.1] 33.5 [30.0,37.2] 32.1 [28.5,35.9] 78.4 [70.5,84.6] 31.0 [27.4,34.9] 81.6 [76.0,86.1] Stadiometer/height rod available 54.6 [43.4,65.3] 62.7 [58.5,66.8] 62.3 [58.0,66.5] 66.3 [58.0,73.7] 62.1 [57.6,66.3] 68.8 [62.4,74.5] Tape measure available 51.8 [40.4,63.0] 40.7 [36.7,44.9] 39.6 [35.4,44.0] 62.5 [54.0,70.3] 39.4 [35.2,43.8] 60.1 [53.7,66.2] Vitamin A supplementation available 50.8 [39.5,62.1] 64.3 [60.8,67.6] 64.2 [60.6,67.6] 60.4 [51.9,68.3] 64.1 [60.4,67.5] 63.3 [56.8,69.4] Iron supplementation available 66.2 [55.2,75.6] 61.5 [57.2,65.6] 60.8 [56.4,65.0] 75.2 [67.6,81.4] 60.7 [56.3,65.0] 72.2 [65.9,77.6] Zinc supplementation available 60.3 [48.9,70.7] 63.8 [60.1,67.4] 63.9 [60.1,67.6] 61.3 [52.5,69.3] 64.0 [60.1,67.7] 61.0 [54.4,67.3]
Observation of sick child visits (n/a) Child weight assessed
Child weight plotted on growth chart Provider asked if child received vitamin A Asked client about feeding or
breastfeeding when child is well Asked client about feeding or
breastfeeding during illness
Caretakers’ report of sick child visit (n/a) Child weight assessed Discussed child’s growth Reported provider discussed feeding or
breastfeeding when child is not ill Reported counseling on feeding or
breastfeeding during illness
Provider training3 Recent training on breastfeeding 18.4 [14.6,22.9] 45.3 [42.0,48.7] 45.1 [41.7,48.6] 27.1 [21.8,33.2] 48.2 [44.4,52.1] 24.9 [22.0,27.9] Recent training on early and exclusive
breastfeeding 16.3 [12.0,21.8] 28.8 [25.8,32.0] 29.0 [25.9,32.3] 18.2 [14.2,23.1] 29.6 [26.1,33.3] 21.1 [18.3,24.1] Recent training on complementary
feeding 15.7 [12.2,20.0] 41.4 [38.2,44.6] 41.3 [38.1,44.6] 23.3 [18.0,29.6] 44.3 [40.7,48.0] 21.3 [18.5,24.3] Recent training on infant and young child
feeding 15.6 [11.3,21.3] 21.3 [18.8,24.1] 20.9 [18.3,23.8] 20.1 [15.5,25.5] 21.0 [18.1,24.2] 20.1 [17.2,23.3] 1 Or a digital standing scale with gradations of 250 grams or less on which an adult can hold a child to be weighed 2 Or a digital standing scale with gradations of 100 grams or less on which an adult can hold a child to be weighed 3 Excludes providers who exclusively worked in the laboratory of the facility or in other non-qualifying positions CI = confidence interval; n/a = not available

50
Appendix Table 16 Percent of facilities with capacity to provide nutrition-related care in curative child care services, percent of clients observed and caretakers reporting nutrition-related counseling among clients attending sick child care visits, and percent of providers with training on child nutrition topics, by facility background characteristics, Haiti SPA 2013
Facility type Managing authority Locale
Hospital Other Public Private, other Rural Urban
% CI % CI % CI % CI % CI % CI Facilities with curative child care
Child weighing scale available1 68.6 70.9 70.2 70.8 69.7 72.0 Infant scale available2 92.4 71.5 79.2 70.7 70.7 79.7 Stadiometer/height rod available 78.1 62.3 71.7 59.4 64.5 63.8 Tape measure available 78.1 78.2 82.0 75.7 79.9 75.3 Vitamin A supplementation available 68.6 84.2 84 80.9 87.6 73.4 Iron supplementation available 71.4 63.9 61.9 66.8 61.7 70.2 Zinc supplementation available 28.9 55.8 63.6 48.4 58.7 47.1
Observation of sick child visits Child weight assessed 72.3 [64.1,79.3] 78.1 [74.4,81.5] 75.7 [69.8,80.8] 76.6 [71.9,80.7] 75.9 [70.7,80.5] 76.5 [71.3,80.9]
Child weight plotted on growth chart3 15.2 [8.3,26.2] 15.6 [12.6,19.1] 15.9 [10.3,23.8] 15.2 [11.8,19.3] 14.4 [10.1,20.0] 16.5 [12.0,22.1] Provider asked if child received vitamin A4 1.5 [0.7,2.9] 3.3 [2.4,4.6] 2.1 [1.4,3.3] 3.1 [2.1,4.5] 2.6 [1.8,3.8] 2.8 [1.8,4.3] Asked client about feeding or
breastfeeding when child is well4 40.7 [34.8,46.9] 39.8 [36.8,43.0] 39.9 [35.8,44.2] 40.3 [36.5,44.2] 38.9 [34.9,43.0] 41.2 [37.2,45.4] Asked client about feeding or
breastfeeding during illness4 22.1 [17.5,27.7] 26.8 [24.1,29.6] 22.8 [19.6,26.4] 26.9 [23.5,30.5] 25.3 [22.0,28.8] 25.2 [21.7,29.0]
Caretakers’ report of sick child visit5 Child weight assessed 81.7 [74.3,87.3] 84.9 [81.7,87.5] 80.7 [75.5,85.0] 85.9 [82.0,89.1] 81.5 [76.5,85.6] 85.9 [81.8,89.2] Discussed child’s growth 37.8 [31.3,44.8] 40.2 [36.9,43.6] 38.1 [33.8,42.5] 40.3 [36.0,44.7] 37.9 [33.8,42.2] 40.7 [36.2,45.5] Reported provider discussed feeding or
breastfeeding when child is not ill 28.0 [22.5,34.2] 27.5 [25.1,30.1] 28.0 [24.3,31.9] 27.5 [24.2,31.0] 25.0 [22.0,28.2] 30.1 [26.3,34.1] Reported counseling on feeding or
breastfeeding during illness 25.2 [20.4,30.7] 24.3 [22.0,26.8] 26.1 [22.4,30.3] 23.6 [20.9,26.5] 21.7 [18.8,24.8] 27.3 [24.0,30.8]
Provider training6 Recent training on breastfeeding 21.3 [17.0,26.3] 29.6 [26.8,32.5] 25.2 [21.2,29.7] 27.7 [24.8,30.9] 31.3 [27.8,35.1] 23.3 [20.1,26.8] Recent training on early and exclusive
breastfeeding 19.2 [15.3,23.7] 16.5 [14.6,18.5] 15.4 [13.0,18.2] 18.9 [16.3,21.7] 18.7 [15.8,21.9] 16.5 [14.2,19.1] Recent training on complementary feeding 18.3 [14.3,23.2] 24.7 [22.1,27.5] 21.2 [17.5,25.3] 23.4 [20.6,26.5] 25.6 [22.4,29.1] 20.2 [17.2,23.6] Recent training on infant and young child
feeding 26.4 [20.3,33.6] 17.3 [15.1,19.8] 21.2 [16.2,27.2] 20.0 [17.2,23.2] 17.3 [14.2,20.8] 22.8 [18.8,27.4]
1 Or a digital standing scale with gradations of 250 grams or less on which an adult can hold a child to be weighed 2 Or a digital standing scale with gradations of 100 grams or less on which an adult can hold a child to be weighed 3 Filter for older surveys (Kenya, Namibia, Rwanda, and Uganda), question asked only if the above item was asked or performed; filter was applied to current surveys for the purposes of comparability in this report. 4 Breastfeeding and vitamin A items had n/a response options in older surveys; however, newer surveys do not have the n/a or skip option for these particular indicators. For comparability, n/a responses were coded as no for older surveys. 5 Only clients who agreed to be observed and interviewed and only at facilities where there were observations 6 Excludes providers who exclusively worked in the laboratory of the facility or in other non-qualifying positions CI = confidence interval

51
Appendix Table 17 Percent of facilities with capacity to provide nutrition-related care in curative child care services, percent of clients observed and caretakers reporting nutrition-related counseling among clients attending sick child care visits, and percent of providers with training on child nutrition topics, by facility background characteristics, Kenya SPA 2010
Facility type Managing authority Locale (n/a)
Hospital Other Public Private, other Rural Urban
% CI % CI % CI % CI % CI % CI Facilities with curative child care
Child weighing scale available1 83.8 [78.4,88.1] 68.0 [61.8,73.6] 82.8 [75.0,88.5] 55.4 [46.5,63.9] Infant scale available2 98.7 [95.9,99.6] 74.1 [68.8,78.7] 91.4 [86.4,94.7] 60.1 [51.5,68.1] Stadiometer/height rod available 50.1 [43.8,56.4] 22.8 [18.1,28.3] 31.2 [24.4,39.0] 18.4 [13.1,25.1] Tape measure available (n/a) Vitamin A supplementation available 94.2 [90.0,96.7] 77.9 [73.2,82.1] 96.1 [92.7,97.9] 61.9 [53.6,69.6] Iron supplementation available 62.0 [56.3,67.4] 49.7 [43.1,56.2] 40.5 [32.6,49.0] 60.8 [51.6,69.3] Zinc supplementation available (n/a)
Observation of sick child visits Child weight assessed 50.9 [44.8,56.9] 49.4 [43.2,55.7] 48.7 [42.9,54.6] 52.7 [43.0,62.1]
Child weight plotted on growth chart3 33.4 [26.8,40.7] 38.0 [30.2,46.4] 38.4 [31.1,46.2] 33.1 [21.8,46.7] Provider asked if child received vitamin A4 15.7 [12.3,19.7] 25.4 [20.7,30.8] 24.9 [20.3,30.2] 18.1 [12.8,25.1] Asked client about feeding or breastfeeding
when child is well4 44.1 [39.2,49.2] 44.3 [39.2,49.5] 41.9 [37.3,46.7] 50.6 [42.1,59.1] Asked client about feeding or breastfeeding
during illness4 49.4 [44.2,54.5] 46.2 [41.4,51.0] 44.4 [39.7,49.1] 53.9 [47.4,60.2]
Caretakers’ report of sick child visit5 Child weight assessed 53.5 [47.7,59.1] 49.8 [43.6,55.9] 49.5 [43.9,55.2] 53.7 [43.8,63.3] Discussed child’s growth 22.9 [19.3,27.0] 23.8 [19.7,28.4] 23.9 [19.9,28.4] 22.8 [17.7,28.7] Reported provider discussed feeding or
breastfeeding when child is not ill 19.3 [15.9,23.3] 22.3 [18.3,26.8] 21.7 [17.9,26.0] 21.3 [15.9,27.9] Reported counseling on feeding or
breastfeeding during illness 13.4 [10.4,17.1] 16.0 [12.6,20.0] 15.4 [12.1,19.3] 15.3 [11.2,20.7]
Provider training6 Recent training on breastfeeding 27.1 [24.5,29.9] 31.5 [27.3,36.1] 29.9 [26.0,34.1] 29.9 [25.4,34.8] Recent training on early and exclusive
breastfeeding 25.1 [22.3,28.1] 21.5 [17.7,25.9] 21.0 [17.7,24.7] 24.4 [19.9,29.5] Recent training on complementary feeding 26.0 [23.4,28.7] 28.2 [24.3,32.4] 26.5 [23.2,30.0] 28.3 [23.9,33.2] Recent training on infant and young child
feeding (n/a) 1 Or a digital standing scale with gradations of 250 grams or less on which an adult can hold a child to be weighed 2 Or a digital standing scale with gradations of 100 grams or less on which an adult can hold a child to be weighed 3 Filter for older surveys (Kenya, Namibia, Rwanda, and Uganda), question asked only if the above item was asked or performed; filter was applied to current surveys for the purposes of comparability in this report. 4 Breastfeeding and vitamin A items had n/a response options in older surveys; however, newer surveys do not have the n/a or skip option for these particular indicators. For comparability, n/a responses were coded as no for older surveys. 5 Only clients who agreed to be observed and interviewed and only at facilities where there were observations 6 Excludes providers who exclusively worked in the laboratory of the facility or in other non-qualifying positions n/a = not available; CI = confidence interval

52
Appendix Table 18 Percent of facilities with capacity to provide nutrition-related care in curative child care services, percent of clients observed and caretakers reporting nutrition-related counseling among clients attending sick child care visits, and percent of providers with training on child nutrition topics, by facility background characteristics, Malawi SPA 2013-14
Facility type Managing authority Locale
Hospital Other Public Private, other Rural Urban
% CI % CI % CI % CI % CI % CI Facilities with curative child care
Child weighing scale available1 88.2 71.7 82.9 64.6 79.2 59.8 Infant scale available2 96.2 67.6 87.4 55.2 79.5 50.3 Stadiometer/height rod available 83.5 69.7 89.6 53.7 80.1 49.9 Tape measure available 64.5 50.2 59.8 44.2 57.0 39.3 Vitamin A supplementation available 55.5 41.1 45.8 40.0 46.0 35.1 Iron supplementation available 48.1 37.0 27.8 48.4 31.8 54.1 Zinc supplementation available 91.7 74.3 86.3 66.7 79.9 67.6
Observation of sick child visits Child weight assessed 45.8 [35.1,57.0] 15.7 [13.3,18.5] 25.0 [19.1,31.9] 31.2 [25.9,37.0] 20.3 [16.1,25.3] 40.0 [29.5,51.5]
Child weight plotted on growth chart3 28.2 [17.4,42.3] 25.0 [18.2,33.3] 30.4 [20.4,42.7] 18.5 [11.8,27.8] 24.0 [16.5,33.5] 30.4 [18.1,46.2] Provider asked if child received vitamin A4 1.5 [0.7,3.6] 2.0 [1.4,2.8] 1.5 [0.9,2.4] 3.0 [1.8,4.8] 2.0 [1.4,3.0] 1.4 [0.7,3.1] Asked client about feeding or
breastfeeding when child is well4 12.3 [7.7,19.1] 15.2 [13.1,17.7] 12.8 [10.1,16.1] 18.6 [15.0,22.8] 15.1 [12.9,17.6] 12.2 [7.4,19.6] Asked client about feeding or
breastfeeding during illness4 13.8 [10.1,18.6] 16.5 [14.3,18.8] 13.2 [11.0,15.8] 22.6 [19.0,26.8] 17.7 [15.4,20.3] 10.7 [7.5,15.0]
Caretakers’ report of sick child visit5 Child weight assessed 76.5 [68.2,83.1] 28.0 [25.0,31.3] 45.6 [38.9,52.5] 44.5 [38.6,50.5] 32.5 [28.4,37.0] 73.5 [64.7,80.8] Discussed child’s growth 35.5 [27.6,44.2] 16.7 [14.6,19.1] 23.6 [19.3,28.5] 22.7 [19.2,26.6] 18.6 [16.0,21.6] 33.9 [26.1,42.7] Reported provider discussed feeding or
breastfeeding when child is not ill 11.1 [7.2,16.5] 11.8 [10.4,13.3] 11.0 [8.9,13.6] 13.1 [10.7,15.8] 12.1 [10.5,13.8] 10.3 [6.4,16.0] Reported counseling on feeding or
breastfeeding during illness 10.4 [7.0,15.3] 12.1 [10.6,13.7] 10.2 [8.3,12.5] 15.4 [12.7,18.6] 12.6 [11.1,14.3] 9.1 [5.5,14.5]
Provider training6 Recent training on breastfeeding 32.5 [28.2,37.2] 35.7 [32.7,38.8] 35.6 [32.0,39.3] 33.9 [30.5,37.5] 35.8 [32.6,39.1] 32.8 [29.0,36.9] Recent training on early and exclusive
breastfeeding 27.9 [24.1,32.1] 21.5 [19.3,24.0] 25.6 [22.8,28.6] 19.9 [17.4,22.8] 24.3 [21.7,27.0] 21.0 [18.1,24.2] Recent training on complementary feeding 31.6 [27.4,36.1] 37.3 [34.2,40.4] 38.4 [34.8,42.1] 32.1 [28.6,35.7] 38.3 [35.1,41.6] 30.3 [26.4,34.4] Recent training on infant and young child
feeding 39.6 [35.0,44.3] 33.4 [30.7,36.1] 37.2 [34.0,40.5] 32.0 [28.7,35.5] 35.1 [32.2,38.1] 34.8 [30.9,38.9] 1 Or a digital standing scale with gradations of 250 grams or less on which an adult can hold a child to be weighed 2 Or a digital standing scale with gradations of 100 grams or less on which an adult can hold a child to be weighed 3 Filter for older surveys (Kenya, Namibia, Rwanda, and Uganda), question asked only if the above item was asked or performed; filter was applied to current surveys for the purposes of comparability in this report. 4 Breastfeeding and vitamin A items had n/a response options in older surveys; however, newer surveys do not have the n/a or skip option for these particular indicators. For comparability, n/a responses were coded as no for older surveys. 5 Only clients who agreed to be observed and interviewed and only at facilities where there were observations 6 Excludes providers who exclusively worked in the laboratory of the facility or in other non-qualifying positions CI = confidence interval

53
Appendix Table 19 Percent of facilities with capacity to provide nutrition-related care in curative child care services, percent of clients observed and caretakers reporting nutrition-related counseling among clients attending sick child care visits, and percent of providers with training on child nutrition topics, by facility background characteristics, Namibia SPA 2009
Facility type Managing authority Locale (n/a)
Hospital Other Public Private, other Rural Urban
% CI % CI % CI % CI % CI % CI Facilities with curative child care
Child weighing scale available1 60.6 79.1 80.0 42.3 Infant scale available2 100.0 86.6 89.3 80.8 Stadiometer/height rod available (n/a) Tape measure available (n/a) Vitamin A supplementation available 90.9 94.7 98.7 38.5 Iron supplementation available 27.3 14.6 13.7 42.3 Zinc supplementation available (n/a)
Observation of sick child visits Child weight assessed 91.1 [75.3,97.2] 88.5 [84.4,91.6] 89.9 [85.9,92.8] 48.2 [23.9,73.4]
Child weight plotted on growth chart3 47.3 [21.5,74.7] 46.2 [40.5,52.0] 47.3 [41.3,53.4] 40.1 [12.9,75.2] Provider asked if child received vitamin A4 29.7 [15.1,50.2] 29.7 [25.7,34.1] 30.9 [26.7,35.4] 17.2 [2.8,59.8] Asked client about feeding or
breastfeeding when child is well4 56.1 [40.6,70.6] 43.2 [39.2,47.3] 43.6 [39.4,47.8] 56.5 [33.7,76.8] Asked client about feeding or
breastfeeding during illness4 43.1 [26.3,61.6] 44.0 [39.6,48.5] 43.2 [38.7,47.9] 48.0 [25.4,71.4]
Caretakers’ report of sick child visit5 Child weight assessed 83.6 [73.3,90.5] 87.9 [83.9,91.0] 89.5 [85.6,92.4] 44.2 [21.7,69.4] Discussed child’s growth 24.5 [15.8,35.9] 31.2 [27.5,35.1] 31.1 [27.2,35.2] 22.7 [9.9,43.7] Reported provider discussed feeding or
breastfeeding when child is not ill 32.2 [19.6,48.1] 28.1 [24.9,31.4] 27.3 [24.0,30.8] 27 [15.6,42.6] Reported counseling on feeding or
breastfeeding during illness 18.4 [10.3,30.6] 22.2 [19.4,25.3] 22.6 [19.7,25.8] 12.8 [6.0,25.1]
Provider training6 Recent training on breastfeeding 21.1 [15.7,27.7] 22.4 [19.3,25.9] 21.8 [18.8,25.1] 19.2 [11.3,30.8] Recent training on early and exclusive
breastfeeding 25.3 [18.9,33.0] 20.1 [17.2,23.2] 23.9 [20.2,28.2] 11.9 [6.7,20.2] Recent training on complementary feeding 21.9 [15.9,29.4] 20.7 [17.8,24.0] 21.3 [18.1,24.8] 15.7 [9.4,25.1] Recent training on infant and young child
feeding (n/a) 1 Or a digital standing scale with gradations of 250 grams or less on which an adult can hold a child to be weighed 2 Or a digital standing scale with gradations of 100 grams or less on which an adult can hold a child to be weighed 3 Filter for older surveys (Kenya, Namibia, Rwanda, and Uganda), question asked only if the above item was asked or performed; filter was applied to current surveys for the purposes of comparability in this report. 4 Breastfeeding and vitamin A items had n/a response options in older surveys; however, newer surveys do not have the n/a or skip option for these particular indicators. For comparability, n/a responses were coded as no for older surveys. 5 Only clients who agreed to be observed and interviewed and only at facilities where there were observations 6 Excludes providers who exclusively worked in the laboratory of the facility or in other non-qualifying positions n/a = not available; CI = confidence interval

54
Appendix Table 20 Percent of facilities with capacity to provide nutrition-related care in curative child care services, percent of clients observed and caretakers reporting nutrition-related counseling among clients attending sick child care visits, and percent of providers with training on child nutrition topics, by facility background characteristics, Nepal SPA 2015
Facility type Managing authority Locale (n/a)
Hospital Other Public Private, other Rural Urban
% CI % CI % CI % CI % CI % CI Facilities with curative child care
Child weighing scale available1 36.5 [28.7,44.9] 46.4 [41.6,51.3] 46.5 [41.8,51.3] 31.3 [22.1,42.3] Infant scale available2 82.8 [74.7,88.8] 77.9 [73.5,81.8] 78.3 [74.0,82.1] 79.3 [68.9,86.9] Stadiometer/height rod available 49.8 [41.8,57.8] 21.6 [18.0,25.8] 22.6 [19.1,26.6] 45.8 [35.9,56.0] Tape measure available 50.6 [42.2,58.9] 27.1 [23.0,31.8] 27.8 [23.7,32.3] 49.3 [38.9,59.7] Vitamin A supplementation available 50.3 [42.2,58.4] 93.6 [90.9,95.6] 93.2 [90.6,95.2] 41.8 [31.5,52.8] Iron supplementation available 48.2 [39.8,56.8] 8.9 [6.6,11.9] 9.3 [7.1,12.2] 54.2 [43.5,64.4] Zinc supplementation available 67.3 [58.9,74.8] 98.5 [97.2,99.2] 98.2 [97.0,98.9] 60.5 [49.8,70.2]
Observation of sick child visits Child weight assessed 59.2 [50.0,67.8] 45.2 [39.7,50.8] 45.9 [41.0,51.0] 72.8 [59.3,83.1]
Child weight plotted on growth chart3 16.8 [9.9,27.0] 29.2 [23.4,35.8] 28.4 [22.9,34.6] 9.2 [3.2,23.5] Provider asked if child received vitamin A4 0.8 [0.3,2.3] 1.2 [0.6,2.3] 1.2 [0.7,2.1] 0.6 [0.2,2.2] Asked client about feeding or breastfeeding
when child is well4 23.4 [18.2,29.4] 15.0 [12.2,18.3] 16.5 [13.8,19.6] 25.0 [17.7,34.0] Asked client about feeding or breastfeeding
during illness4 20.3 [15.5,26.0] 14.5 [11.8,17.6] 14.8 [12.4,17.5] 25.6 [16.9,36.8]
Caretakers’ report of sick child visit5 Child weight assessed 74.7 [68.1,80.4] 51.6 [45.8,57.3] 54.3 [49.3,59.3] 87.9 [79.2,93.2] Discussed child’s growth 14.5 [10.4,19.8] 14.8 [11.3,19.1] 14.8 [11.9,18.4] 14.0 [7.5,24.5] Reported provider discussed feeding or
breastfeeding when child is not ill 14.0 [10.8,18.1] 12.0 [9.5,15.0] 12.4 [10.2,15.0] 14.3 [9.6,20.7] Reported counseling on feeding or
breastfeeding during illness 19.4 [15.5,23.9] 22.9 [19.5,26.7] 21.6 [18.8,24.8] 22.4 [15.6,31.2]
Provider training6 Recent training on breastfeeding 12.0 [10.0,14.5] 38.4 [35.2,41.8] 36.7 [33.8,39.8] 7.4 [5.2,10.4] Recent training on early and exclusive
breastfeeding 10.4 [8.3,12.9] 25.6 [22.9,28.5] 24.7 [22.3,27.4] 6.8 [4.5,10.0] Recent training on complementary feeding 10.3 [8.4,12.5] 34.2 [31.0,37.6] 32.7 [29.8,35.8] 5.6 [3.8,8.2] Recent training on infant and young child
feeding 6.9 [5.4,8.8] 6.8 [5.4,8.6] 7.6 [6.2,9.2] 3.7 [2.5,5.4] 1 Or a digital standing scale with gradations of 250 grams or less on which an adult can hold a child to be weighed 2 Or a digital standing scale with gradations of 100 grams or less on which an adult can hold a child to be weighed 3 Filter for older surveys (Kenya, Namibia, Rwanda, and Uganda), question asked only if the above item was asked or performed; filter was applied to current surveys for the purposes of comparability in this report. 4 Breastfeeding and vitamin A items had n/a response options in older surveys; however, newer surveys do not have the n/a or skip option for these particular indicators. For comparability, n/a responses were coded as no for older surveys. 5 Only clients who agreed to be observed and interviewed and only at facilities where there were observations 6 Excludes providers who exclusively worked in the laboratory of the facility or in other non-qualifying positions n/a = not available; CI = confidence interval

55
Appendix Table 21 Percent of facilities with capacity to provide nutrition-related care in curative child care services, percent of clients observed and caretakers reporting nutrition-related counseling among clients attending sick child care visits, and percent of providers with training on child nutrition topics, by facility background characteristics, Rwanda SPA 2007
Facility type Managing authority Locale (n/a)
Hospital Other Public Private, other Rural Urban
% CI % CI % CI % CI % CI % CI Facilities with curative child care
Child weighing scale available1 87.5 [73.3,94.7] 68.7 [64.5,72.6] 69.5 [64.3,74.2] 87.5 [64.8,76.5] Infant scale available2 97.5 [82.9,99.7] 83.3 [80.2,86.0] 90.5 [86.9,93.2] 97.5 [70.3,80.4] Stadiometer/height rod available Tape measure available Vitamin A supplementation available (n/a) Iron supplementation available 77.5 [61.0,88.4] 67.6 [63.9,71.1] 74.8 [69.6,79.3] 59.3 [54.6,63.9] Zinc supplementation available (n/a)
Observation of sick child visits Child weight assessed 59.6 [45.0,72.7] 64.5 [60.0,68.7] 64.2 [59.0,69.2] 59.6 [56.7,70.8]
Child weight plotted on growth chart3 11.9 [3.1,36.2] 8.1 [5.7,11.4] 8.2 [5.2,12.6] 11.9 [5.0,14.0] Provider asked if child received vitamin A4 12.1 [4.1,30.7] 18.0 [14.8,21.6] 17.0 [13.3,21.4] 12.1 [13.8,25.0] Asked client about feeding or
breastfeeding when child is well4 39.4 [26.0,54.6] 28.8 [25.6,32.2] 27.9 [24.0,32.1] 39.4 [27.1,37.9] Asked client about feeding or
breastfeeding during illness4 50.5 [36.2,64.8] 41.9 [38.1,45.7] 38.2 [33.9,42.7] 50.5 [43.5,56.3]
Caretakers’ report of sick child visit5 Child weight assessed 67.7 [52.5,79.8] 70.7 [67.0,74.2] 70.1 [65.4,74.3] 67.7 [65.8,76.6] Discussed child’s growth 51.5 [36.3,66.4] 41.5 [37.6,45.5] 40.6 [35.9,45.4] 51.5 [38.4,51.4] Reported provider discussed feeding or
breastfeeding when child is not ill 10.1 [5.5,17.7] 9.1 [7.5,11.0] 8.8 [6.9,11.2] 9.7 [7.2,12.9] Reported counseling on feeding or
breastfeeding during illness 13.1 [5.8,27.1] 9.4 [7.7,11.4] 7.7 [5.8,10.2] 13.0 [9.9,16.9]
Provider training6 Recent training on breastfeeding 6.9 [4.3,10.8] 8.9 [7.6,10.5] 8.4 [6.9,10.2] 6.9 [7.1,11.6] Recent training on early and exclusive
breastfeeding 5.9 [3.5,9.9] 6.5 [5.3,7.9] 6.4 [5.0,8.1] 5.9 [4.6,8.7] Recent training on complementary feeding 5.9 [3.6,9.6] 7.5 [6.3,9.0] 7.4 [6.0,9.1] 5.9 [5.4,9.5] Recent training on infant and young child
feeding (n/a) 1 Or a digital standing scale with gradations of 250 grams or less on which an adult can hold a child to be weighed 2 Or a digital standing scale with gradations of 100 grams or less on which an adult can hold a child to be weighed 3 Filter for older surveys (Kenya, Namibia, Rwanda, and Uganda), question asked only if the above item was asked or performed; filter was applied to current surveys for the purposes of comparability in this report. 4 Breastfeeding and vitamin A items had NA response options in older surveys; however, newer surveys do not have the NA or skip option for these particular indicators. For comparability, NA responses were coded as no for older surveys. 5 Only clients who agreed to be observed and interviewed and only at facilities where there were observations 6 Excludes providers who exclusively worked in the laboratory of the facility or in other non-qualifying positions n/a = not available; CI = confidence interval

56
Appendix Table 22 Percent of facilities with capacity to provide nutrition-related care in curative child care services, percent of clients observed and caretakers reporting nutrition-related counseling among clients attending sick child care visits, and percent of providers with training on child nutrition topics, by facility background characteristics, Senegal SPA 2016
Facility type Managing authority Locale
Hospital Other Public Private, other Rural Urban
% CI % CI % CI % CI % CI % CI Facilities with curative child care
Child weighing scale available1 53.0 [33.7,71.4] 67.1 [62.8,71.1] 67.5 [63.1,71.6] 50.1 [38.3,62.0] 66.8 [61.9,71.3] 61.2 [53.3,68.6] Infant scale available2 87.1 [70.0,95.1] 95.3 [92.2,97.2] 97.3 [94.7,98.6] 81.6 [68.6,90.0] 98.2 [95.6,99.3] 88.0 [80.8,92.8] Stadiometer/height rod available 62.3 [40.9,79.8] 94.4 [91.4,96.4] 82.7 [78.6,86.2] 73.9 [62.7,82.7] 80.8 [76.1,84.7] 83.1 [76.1,88.4] Tape measure available 85.5 [67.6,94.3] 95.6 [92.8,97.4] 93.9 [90.0,96.3] 80.6 [68.9,88.6] 93.6 [88.9,96.4] 88.6 [82.1,92.9] Vitamin A supplementation available 14.4 [5.1,34.8] 63.8 [58.7,68.7] 51.3 [46.8,55.7] 36.0 [26.0,47.2] 50.5 [45.8,55.2] 46.0 [38.5,53.6] Iron supplementation available 6.5 [1.4,24.9] 5.5 [3.4,8.7] 3.9 [2.3,6.5] 7.3 [2.8,18.1] 4.6 [2.7,7.9] 3.9 [1.7,8.8] Zinc supplementation available 23.1 [12.1,39.5] 69.3 [64.3,73.9] 56.1 [51.7,60.4] 38.0 [27.4,49.9] 58.4 [53.8,62.7] 42.8 [34.5,51.5]
Observation of sick child visits Child weight assessed 67.8 [44.4,84.8] 86.0 [81.0,89.8] 87.3 [82.8,90.8] 69.6 [48.4,84.8] 84.6 [77.2,89.9] 85.4 [78.6,90.3]
Child weight plotted on growth chart3 32.5 [15.3,56.3] 60.3 [53.4,66.8] 60.6 [53.8,67.0] 46.8 [20.2,75.4] 58.9 [50.6,66.8] 59.3 [48.1,69.6] Provider asked if child received vitamin A4 1.2 [0.2,6.7] 31.2 [26.4,36.6] 32.4 [27.5,37.6] 11.5 [5.0,24.6] 28.7 [23.4,34.6] 30.7 [23.2,39.3] Asked client about feeding or
breastfeeding when child is well4 36.1 [23.6,50.7] 30.8 [26.6,35.3] 31.5 [27.0,36.3] 28.5 [19.5,39.5] 31.4 [26.4,36.9] 30.7 [24.2,38.1] Asked client about feeding or
breastfeeding during illness4 13.3 [6.5,25.4] 18.9 [15.5,23.0] 18.4 [14.9,22.6] 20.0 [12.3,31.0] 20.0 [16.0,24.8] 17.0 [12.0,23.6]
Caretakers’ report of sick child visit5 Child weight assessed 91.3 [78.7,96.8] 90.3 [86.0,93.4] 92.3 [88.8,94.8] 77.7 [55.3,90.8] 87.6 [80.5,92.4] 93.5 [89.2,96.2] Discussed child’s growth 31.0 [13.9,55.7] 27.4 [23.5,31.8] 28.2 [24.0,32.8] 24.1 [15.0,36.3] 28.7 [24.1,33.8] 26.4 [20.3,33.6] Reported provider discussed feeding or
breastfeeding when child is not ill 41.0 [25.2,58.9] 39.6 [35.1,44.4] 40.9 [36.1,45.8] 32.1 [21.8,44.4] 43.8 [37.9,50.0] 35.1 [28.4,42.3] Reported counseling on feeding or
breastfeeding during illness 31.2 [15.4,52.9] 25.8 [22.0,30.1] 26.7 [22.6,31.2] 22.2 [14.3,32.8] 27.9 [22.5,34.0] 24.1 [18.8,30.3]
Provider training6 Recent training on breastfeeding 30.3 [22.7,39.0] 41.7 [38.4,45.0] 45.4 [42.1,48.8] 26.1 [20.0,33.3] 49.8 [45.7,53.9] 34.8 [31.0,38.8] Recent training on early and exclusive
breastfeeding 36.2 [25.7,48.2] 32.6 [29.7,35.8] 32.7 [29.7,35.8] 25.4 [18.7,33.4] 35.1 [31.6,38.7] 27.9 [23.6,32.6] Recent training on complementary feeding 32.0 [23.1,42.4] 48.1 [44.7,51.5] 51.5 [48.1,54.8] 31.5 [23.5,40.7] 56.6 [52.7,60.5] 39.8 [35.3,44.4] Recent training on infant and young child
feeding 22.4 [16.8,29.3] 15.4 [13.7,17.2] 15.2 [13.6,17.0] 13.1 [9.2,18.3] 14.3 [12.2,16.6] 15.7 [13.5,18.1] 1 Or a digital standing scale with gradations of 250 grams or less on which an adult can hold a child to be weighed 2 Or a digital standing scale with gradations of 100 grams or less on which an adult can hold a child to be weighed 3 Filter for older surveys (Kenya, Namibia, Rwanda, and Uganda), question asked only if the above item was asked or performed; filter was applied to current surveys for the purposes of comparability in this report. 4 Breastfeeding and vitamin A items had n/a response options in older surveys; however, newer surveys do not have the n/a or skip option for these particular indicators. For comparability, n/a responses were coded as no for older surveys. 5 Only clients who agreed to be observed and interviewed and only at facilities where there were observations 6 Excludes providers who exclusively worked in the laboratory of the facility or in other non-qualifying positions CI = confidence interval
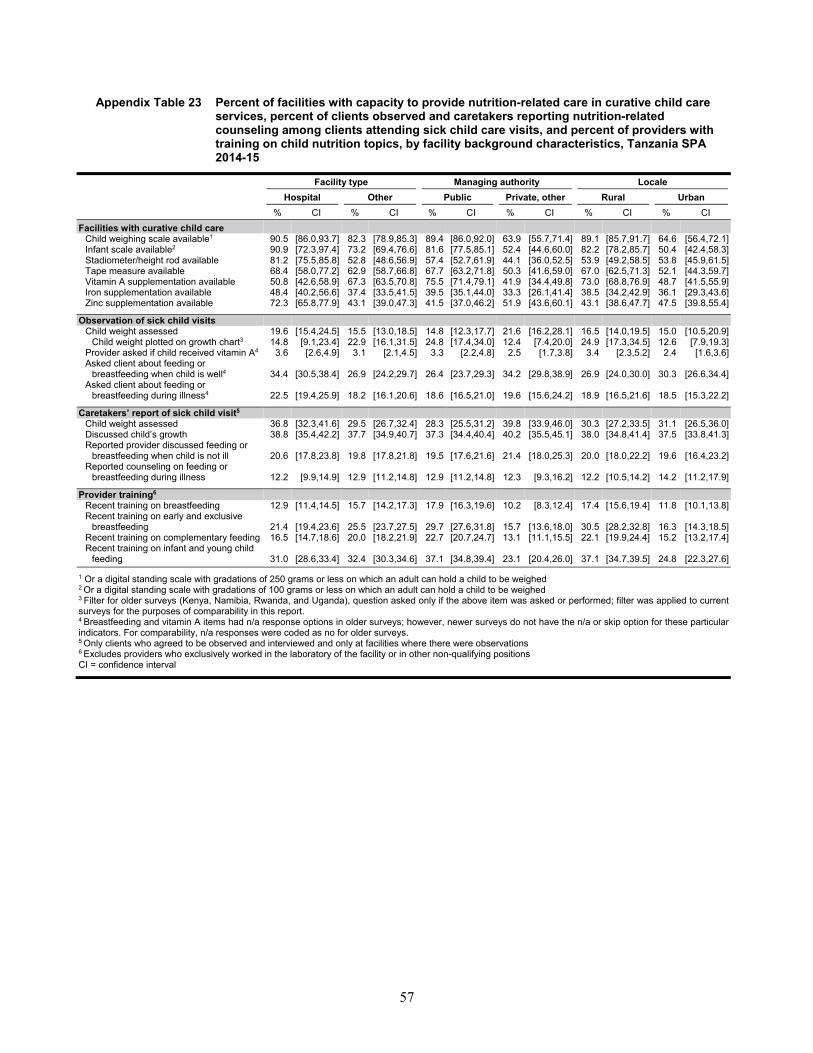
57
Appendix Table 23 Percent of facilities with capacity to provide nutrition-related care in curative child care services, percent of clients observed and caretakers reporting nutrition-related counseling among clients attending sick child care visits, and percent of providers with training on child nutrition topics, by facility background characteristics, Tanzania SPA 2014-15
Facility type Managing authority Locale
Hospital Other Public Private, other Rural Urban
% CI % CI % CI % CI % CI % CI Facilities with curative child care
Child weighing scale available1 90.5 [86.0,93.7] 82.3 [78.9,85.3] 89.4 [86.0,92.0] 63.9 [55.7,71.4] 89.1 [85.7,91.7] 64.6 [56.4,72.1] Infant scale available2 90.9 [72.3,97.4] 73.2 [69.4,76.6] 81.6 [77.5,85.1] 52.4 [44.6,60.0] 82.2 [78.2,85.7] 50.4 [42.4,58.3] Stadiometer/height rod available 81.2 [75.5,85.8] 52.8 [48.6,56.9] 57.4 [52.7,61.9] 44.1 [36.0,52.5] 53.9 [49.2,58.5] 53.8 [45.9,61.5] Tape measure available 68.4 [58.0,77.2] 62.9 [58.7,66.8] 67.7 [63.2,71.8] 50.3 [41.6,59.0] 67.0 [62.5,71.3] 52.1 [44.3,59.7] Vitamin A supplementation available 50.8 [42.6,58.9] 67.3 [63.5,70.8] 75.5 [71.4,79.1] 41.9 [34.4,49.8] 73.0 [68.8,76.9] 48.7 [41.5,55.9] Iron supplementation available 48.4 [40.2,56.6] 37.4 [33.5,41.5] 39.5 [35.1,44.0] 33.3 [26.1,41.4] 38.5 [34.2,42.9] 36.1 [29.3,43.6] Zinc supplementation available 72.3 [65.8,77.9] 43.1 [39.0,47.3] 41.5 [37.0,46.2] 51.9 [43.6,60.1] 43.1 [38.6,47.7] 47.5 [39.8,55.4]
Observation of sick child visits Child weight assessed 19.6 [15.4,24.5] 15.5 [13.0,18.5] 14.8 [12.3,17.7] 21.6 [16.2,28.1] 16.5 [14.0,19.5] 15.0 [10.5,20.9]
Child weight plotted on growth chart3 14.8 [9.1,23.4] 22.9 [16.1,31.5] 24.8 [17.4,34.0] 12.4 [7.4,20.0] 24.9 [17.3,34.5] 12.6 [7.9,19.3] Provider asked if child received vitamin A4 3.6 [2.6,4.9] 3.1 [2.1,4.5] 3.3 [2.2,4.8] 2.5 [1.7,3.8] 3.4 [2.3,5.2] 2.4 [1.6,3.6] Asked client about feeding or
breastfeeding when child is well4 34.4 [30.5,38.4] 26.9 [24.2,29.7] 26.4 [23.7,29.3] 34.2 [29.8,38.9] 26.9 [24.0,30.0] 30.3 [26.6,34.4] Asked client about feeding or
breastfeeding during illness4 22.5 [19.4,25.9] 18.2 [16.1,20.6] 18.6 [16.5,21.0] 19.6 [15.6,24.2] 18.9 [16.5,21.6] 18.5 [15.3,22.2]
Caretakers’ report of sick child visit5 Child weight assessed 36.8 [32.3,41.6] 29.5 [26.7,32.4] 28.3 [25.5,31.2] 39.8 [33.9,46.0] 30.3 [27.2,33.5] 31.1 [26.5,36.0] Discussed child’s growth 38.8 [35.4,42.2] 37.7 [34.9,40.7] 37.3 [34.4,40.4] 40.2 [35.5,45.1] 38.0 [34.8,41.4] 37.5 [33.8,41.3] Reported provider discussed feeding or
breastfeeding when child is not ill 20.6 [17.8,23.8] 19.8 [17.8,21.8] 19.5 [17.6,21.6] 21.4 [18.0,25.3] 20.0 [18.0,22.2] 19.6 [16.4,23.2] Reported counseling on feeding or
breastfeeding during illness 12.2 [9.9,14.9] 12.9 [11.2,14.8] 12.9 [11.2,14.8] 12.3 [9.3,16.2] 12.2 [10.5,14.2] 14.2 [11.2,17.9]
Provider training6 Recent training on breastfeeding 12.9 [11.4,14.5] 15.7 [14.2,17.3] 17.9 [16.3,19.6] 10.2 [8.3,12.4] 17.4 [15.6,19.4] 11.8 [10.1,13.8] Recent training on early and exclusive
breastfeeding 21.4 [19.4,23.6] 25.5 [23.7,27.5] 29.7 [27.6,31.8] 15.7 [13.6,18.0] 30.5 [28.2,32.8] 16.3 [14.3,18.5] Recent training on complementary feeding 16.5 [14.7,18.6] 20.0 [18.2,21.9] 22.7 [20.7,24.7] 13.1 [11.1,15.5] 22.1 [19.9,24.4] 15.2 [13.2,17.4] Recent training on infant and young child
feeding 31.0 [28.6,33.4] 32.4 [30.3,34.6] 37.1 [34.8,39.4] 23.1 [20.4,26.0] 37.1 [34.7,39.5] 24.8 [22.3,27.6] 1 Or a digital standing scale with gradations of 250 grams or less on which an adult can hold a child to be weighed 2 Or a digital standing scale with gradations of 100 grams or less on which an adult can hold a child to be weighed 3 Filter for older surveys (Kenya, Namibia, Rwanda, and Uganda), question asked only if the above item was asked or performed; filter was applied to current surveys for the purposes of comparability in this report. 4 Breastfeeding and vitamin A items had n/a response options in older surveys; however, newer surveys do not have the n/a or skip option for these particular indicators. For comparability, n/a responses were coded as no for older surveys. 5 Only clients who agreed to be observed and interviewed and only at facilities where there were observations 6 Excludes providers who exclusively worked in the laboratory of the facility or in other non-qualifying positions CI = confidence interval

58
Appendix Table 24 Percent of facilities with capacity to provide nutrition-related care in curative child care services, percent of clients observed and caretakers reporting nutrition-related counseling among clients attending sick child care visits, and percent of providers with training on child nutrition topics, by facility background characteristics, Uganda SPA 2007
Facility type Managing authority Locale (n/a)
Hospital Other Public Private, other Rural Urban
% CI % CI % CI % CI % CI % CI Facilities with curative child care
Child weighing scale available1 86.3 [78.6,91.6] 72.7 [67.3,77.6] 71.8 [65.6,77.2] 78.0 [66.8,86.2] Infant scale available2 98.3 [93.3,99.6] 62.8 [57.7,67.7] 64.3 [58.6,69.6] 64.0 [53.6,73.3] Stadiometer/height rod available (n/a) Tape measure available (n/a) Vitamin A supplementation available 71.8 [63.3,79.0] 74.8 [69.6,79.4] 75.6 [69.8,80.6] 71.6 [60.4,80.6] Iron supplementation available 70.1 [61.4,77.5] 39.3 [34.0,44.8] 34.2 [28.6,40.3] 60.6 [49.8,70.4] Zinc supplementation available (n/a)
Observation of sick child visits Child weight assessed 59.6 [49.9,68.5] 44.3 [37.4,51.5] 44.3 [37.3,51.5] 53.2 [37.0,68.8]
Child weight plotted on growth chart3 22.0 [14.3,32.3] 24.3 [16.3,34.7] 25.3 [16.8,36.2] 17.4 [8.1,33.5] Provider asked if child received vitamin A4 16.9 [12.4,22.7] 11.2 [8.1,15.4] 11.8 [8.6,16.0] 11.2 [5.2,22.4] Asked client about feeding or breastfeeding
when child is well4 59.0 [51.3,66.3] 48.0 [42.4,53.7] 48.6 [42.8,54.4] 50.9 [36.5,65.1] Asked client about feeding or breastfeeding
during illness4 50.3 [42.4,58.1] 43.4 [38.0,48.9] 44.5 [39.1,50.1] 39.8 [27.7,53.3]
Caretakers’ report of sick child visit5 Child weight assessed 68.6 [59.1,76.7] 44.8 [38.2,51.6] 44.9 [38.1,51.9] 58.2 [42.4,72.5] Discussed child’s growth 23.8 [17.1,32.0] 18.3 [14.2,23.4] 17.8 [13.5,23.0] 25.0 [15.3,38.1] Reported provider discussed feeding or
breastfeeding when child is not ill 24.0 [17.8,31.7] 25.1 [20.4,30.5] 24.1 [19.4,29.6] 31.1 [20.1,44.8] Reported counseling on feeding or
breastfeeding during illness 34.7 [27.2,43.1] 37.7 [32.5,43.2] 38.3 [33.0,43.9] 32.3 [20.8,46.5]
Provider training6 Recent training on breastfeeding 32.4 [28.1,37.0] 23.7 [19.0,29.0] 24.7 [20.2,29.9] 26.8 [19.7,35.3] Recent training on early and exclusive
breastfeeding 23.0 [19.6,26.8] 14.5 [10.6,19.5] 14.4 [10.4,19.8] 20.0 [14.6,26.7] Recent training on complementary feeding 27.6 [23.7,31.9] 20.2 [15.7,25.5] 21.4 [17.0,26.6] 22.1 [15.6,30.4] Recent training on infant and young child
feeding (n/a) 1 Or a digital standing scale with gradations of 250 grams or less on which an adult can hold a child to be weighed 2 Or a digital standing scale with gradations of 100 grams or less on which an adult can hold a child to be weighed 3 Filter for older surveys (Kenya, Namibia, Rwanda, and Uganda), question asked only if the above item was asked or performed; filter was applied to current surveys for the purposes of comparability in this report. 4 Breastfeeding and vitamin A items had n/a response options in older surveys; however, newer surveys do not have the n/a or skip option for these particular indicators. For comparability, n/a responses were coded as no for older surveys. 5 Only clients who agreed to be observed and interviewed and only at facilities where there were observations 6 Excludes providers who exclusively worked in the laboratory of the facility or in other non-qualifying positions n/a = not available; CI = confidence interval