diabetes changes the levels of ionotropic glutamate receptors in
TRANSCRIPT

Diabetes changes the levels of ionotropic glutamate receptors in therat retina
Ana R. Santiago,1,2 Joana M. Gaspar,1,2 Filipa I. Baptista,2 Armando J. Cristóvão,1,3 Paulo F. Santos,1,3
Willem Kamphuis,4 António F. Ambrósio1,2
1Center for Neuroscience and Cell Biology, Department of Zoology, University of Coimbra, Coimbra, Portugal; 2Center ofOphthalmology and Vision Sciences, Institute of Biomedical Research on Light and Image (IBILI), Faculty of Medicine, Universityof Coimbra, Coimbra, Portugal; 3Department of Zoology, University of Coimbra, Portugal; 4Netherlands Institute for Neuroscience(NIN)-KNAW, Department of Astrocyte Biology and Neurodegeneration, Amsterdam, The Netherlands
Purpose: Diabetic retinopathy (DR) is a leading cause of vision loss and blindness among adults between the age 20 to74. Changes in ionotropic glutamate receptor subunit composition can affect retinal glutamatergic neurotransmission and,therefore, contribute to visual impairment. The purpose of this study was to investigate whether diabetes leads to changesin ionotropic glutamate receptor subunit expression at the protein and mRNA level in the rat retina.Methods: Changes in the expression of ionotropic glutamate receptor subunits were investigated at the mRNA and proteinlevels in retinas of streptozotocin (STZ)-induced diabetic and age-matched control rats. Animals were euthanized one,four and 12 weeks after the onset of diabetes. Retinal protein extracts were prepared, and the receptor subunit levels wereassessed by western blotting. Transcript levels were assessed by real-time quantitative PCR.Results: Transcript levels of most ionotropic glutamate receptor subunits were not significantly changed in the retinas ofdiabetic rats, as compared to age-matched controls but protein levels of α-amino-3-hydroxyl-5-methyl-4-isoxazole-propionate (AMPA), kainate, and N-methyl-D-aspartic acid receptors (NMDA) receptors were found to be altered.Conclusions: The results provide evidence that diabetes affects the retinal content of ionotropic glutamate receptorsubunits at the protein level. The possible implications of these changes on retinal physiology and visual impairment inDR are discussed.
Diabetic retinopathy (DR) is a leading cause of vision lossand blindness among adults in developed countries. Themechanisms by which diabetes causes vision loss are still notclearly understood. Vascular changes in DR are welldocumented, and include blood-retinal barrier breakdown,loss of pericytes and endothelial cells, the formation ofmicroaneurysms and basement membrane thickening [1].Changes in the neural retina during diabetes have also beenreported [2-4]. These alterations may account for loss incontrast sensitivity and color vision and alterations in theelectroretinogram [5-8].
Glutamate is the main excitatory neurotransmitter in theretina. It is required for the transmission of visual signals fromthe photoreceptors to the ganglion cells. Glutamate receptorsare divided into two main groups: the fast-acting ligand-gatedionotropic channels and the slower-acting metabotropicreceptors. The ionotropic receptors are cation-specific ionchannels, and are subdivided into three groups: α-amino-3-hydroxy-5-methyl-4-isoxazolepropionate (AMPA), kainate,and N-methyl-D-aspartate (NMDA) receptor channels. In the
Correspondence to: António F. Ambrósio, Center of Ophthalmologyand Vision Sciences, IBILI, Faculty of Medicine, University ofCoimbra, Azinhaga de Santa Comba, 3004-548 Coimbra, Portugal;Phone: + 351 239 480 222; FAX: + 351 239 480 280; email:[email protected] or [email protected].
mammalian retina, AMPA, kainate, and NMDA receptorsubunits have been shown to have a widespread anddifferential distribution throughout the retina [9-14].
Several studies have indicated that diabetes induceschanges in glutamate receptors. The ob/ob mouse, a model oftype 2 diabetes, was found to have increased binding sites forNMDA and AMPA receptors in the gray matter of the spinalcord [15]. In the brain of streptozotocin (STZ)-induceddiabetic rats, the binding properties of AMPA receptors andthe expression of GluR1 subunit are decreased [16], withoutchanges in the transcript levels of GluR1, GluR2/3, NR1, andNR2A subunits after three months of diabetes [17]. In thehippocampus, immunoreactivity for NR2A and NR2Bsubunits are reduced in diabetic rats. These changes areprevented by insulin treatment [18,19]. Additionally,glutamatergic dysfunction in the hippocampus has beensuggested to be associated with cognitive impairment in theSTZ-induced diabetic rat [20]. Moreover, it was reported thatthe transcript levels for GluR1, GluR2, GluR3, NR2A, andNR2B subunits are significantly upregulated in the dorsalhorn of the spinal cord in STZ-induced diabetic rats [21].
Overactivation of glutamate receptors is considered to bepotentially involved in neurodegeneration in some retinaldiseases, such as glaucoma and retinitis pigmentosa [22,23],and it may be also implicated in retinal neurodegenerationduring diabetes. In the retina, it was shown that glutamate
Molecular Vision 2009; 15:1620-1630 <http://www.molvis.org/molvis/v15/a173>Received 15 December 2008 | Accepted 13 August 2009 | Published 17 August 2009
© 2009 Molecular Vision
1620

metabolism and concentration are altered after short-termexperimental diabetes. Diabetic rat retinas are less able toconvert glutamate into glutamine [24] and have higher levelsof glutamate [25], probably explaining increased vitreousglutamate concentration observed in patients withproliferative DR [26]. Moreover, the high-affinity L-glutamate/L-aspartate transporter (GLAST) is impaired inretinal Müller cells isolated from STZ-induced diabetic rats,probably due to oxidation of the glutamate transporter [27].Previously, we demonstrated that diabetes increases theevoked release of D-aspartate in the retina [28], suggestingthat glutamatergic neurotransmission can be affected in theretinas of diabetic rats. Moreover, we showed that elevatedglucose concentration changes the protein levels of GluR1,GluR2, GluR6/7, and KA2 subunits in cultured rat retinalneural cells [29], and more recently, we have demonstrated,in postmortem human retinas, that there are alterations in thelevels of ionotropic glutamate receptor subunits in diabeticpatients [30]. It was also demonstrated an increase in NR1 andGluR2/3 immunoreactivities in ganglion, amacrine, andbipolar cells in rats after 4 and 16 weeks of diabetes [31].
Taken together, these results support a role for glutamatein the pathogenesis of DR, suggesting that it may be involvedin retinal neural dysfunction during diabetes. Changes in thecomposition of ionotropic glutamate receptor subunits mayalter the properties of ionotropic glutamate receptors, andconsequently may change the glutamatergicneurotransmission in the retina, thus contributing to visualimpairment. In addition, those changes may alter thevulnerability of retinal neurons to neurodegeneration. Thus,the aim of this work was to investigate whether diabeteschanges ionotropic glutamate receptor subunits in the retinaat mRNA and protein levels.
METHODSAnimals: All procedures involving animals were conducted inaccordance with the Association for Research in Vision andOphthalmology (ARVO) statement for the use of animals inophthalmic and vision research. Two-month-old Wistar ratspurchased from Charles River (Barcelona, Spain) werehoused under a 12 h light/12 h dark cycle with standard chowand water ad libitum. Animals were randomly assigned tocontrol or diabetic groups. Diabetes was induced with anintraperitoneal injection of 65 mg/kg STZ (Sigma, St. Louis,MO), dissolved in citrate buffer, pH 4.5. Two days post-STZinjection, hyperglycemia was confirmed by blood glucoseexceeding 250 mg/dl with Ascensia Elite (Bayer, Portugal).Diabetic rats and age-matched controls were euthanized underdeep anesthesia followed by decapitation, one, four, and 12weeks after the onset of diabetes. Before sacrifice, rats wereweighed and blood glucose was measured.Sample preparation for western blot analysis: Each samplewas composed of both retinas from the same animal(n=number of animals). The animals were euthanized, the
eyes were enucleated, and the retinas were dissected in coldphosphate-buffered saline (PBS) that contained 137 mMNaCl, 2.7 mM KCl, 10 mM Na2HPO4, 1.8 mM KH2PO4, pH7.4. The retinas were then homogenized in 20 mM Tris-HCl,2 mM EDTA, 2 mM EGTA, pH 7.2, supplemented withcomplete miniprotease inhibitor cocktail tablets (Roche,Basel, Switzerland), at 4 °C. The homogenate was centrifugedat 960x g for 5 min at 4 °C. The supernatant was collected andcentrifuged at 15,800x g for 20 min at 4 °C. The pellet wasdissociated by sonication and resuspended in 20 mM Tris-HCl, 2 mM EDTA, 2 mM EGTA, 1% Triton X-100, 0.5%SDS, pH 7.2, supplemented with the protease inhibitorcocktail, at 4 °C. Protein concentration was determined by theBio-Rad Bradford method, and the samples were denaturatedfollowing addition of 2X concentrated sample buffer, whichcontained the following: 100 mM Tris-HCl:100 mM bicine,8 M urea, 2% SDS, 2% β-mercaptoethanol, 0.005%bromophenol blue. After heating for 5 min at 95 °C, thesamples were frozen at −20 °C until western blot analysis.Western blot analysis: Equivalent amounts of protein (15 μgfor GluR1, GluR6/7, and NR1 subunits; and 60 μg for GluR2,GluR2/3, GluR4, NR2C and NR3A subunits) were used forwestern blot analysis. The amounts of protein used were underthe saturation limit of the system.
Proteins were separated by SDS–PAGE (7.5%), andtransferred via electrophoresis to polyvinylidene fluoride(PVDF) membranes. The membranes were blocked for 1 h atroom temperature in Tris-buffered saline that contained137 mM NaCl, 20 Tris-HCl mM, pH 7.6, with 0.1% Tween-20(TBS-T) and 5% skimmed milk. Incubation with the primaryantibodies (Table 1) was performed overnight at 4 °C. Afterwashing four times during 1 h in TBS-T in TBS-T with 0.5%skimmed milk, the membranes were incubated for 1 h at roomtemperature with 1:20,000 anti-rabbit IgG (GE Healthcare,Buckinghamshire, UK), an alkaline phosphatase-linkedsecondary antibody, in TBS-T with 1% skimmed milk. Themembranes were processed for detection of ionotropicglutamate receptor subunits using the Enhanced Chemi-Fluorescence system (GE Healthcare) on a gel imager (VersaDoc Imaging System; Bio-Rad, Hercules, CA), and digitalquantification of bands intensity was performed (QuantityOne; Bio-Rad).
The membranes were then reprobed and tested for α-tubulin (Sigma-Aldrich, Lisboa, Portugal), which was used asa loading control. Briefly, the membranes were incubated for1 h at room temperature with a 0.1 M glycine buffer (pH 7.2),blocked as previously described and then incubated with1:3,000 mouse anti-α-tubulin antibody (Sigma). Themembranes were then washed and incubated with 1:20,000anti-mouse IgG (GE Healthcare), an alkaline phosphatise-linked secondary antibody in TBS-T with 1% skimmed milk.
Molecular Vision 2009; 15:1620-1630 <http://www.molvis.org/molvis/v15/a173> © 2009 Molecular Vision
1621
Isolation of total RNA from rat retinas—Each samplewas composed of one retina (n=number of animals). Theanimals were euthanized, the eyes were enucleated, and theretinas were dissected in cold PBS and stored at −80 °C.Retinal tissue was homogenized, and total RNA was isolatedby a single-step method, based on guanidine thiocyanateextraction, according to the manufacturer’s instructions(Ultraspec; Biotecx Laboratories, Inc., Houston, TX). IsolatedRNA was dissolved in 16 µl diethylpyrocarbonate (DEPC)-treated water. The concentration and quality of total retinalRNA were determined (2100 Bioanalyser; AgilentTechnologies Netherlands BV, Amstelveen, TheNetherlands). The integrity of RNA, expressed as RNAIntegrity Number (RIN) was around 9.0, indicating, high-quality, non-degraded RNA.
Reverse transcription—Total RNA was treated withDNase-I (1 unit DNase-I, Amplification Grade; InvitrogenBV, Breda, The Netherlands) to degrade possible genomicDNA contamination. Then, 5 μl of Dnase-I treated total RNAwere reverse transcribed into first-strand cDNA with 100 U/μl of RNase H- reverse transcriptase (Superscript III,Invitrogen) and 50 ng/μl random hexamer primers, for 60 minat 50 °C. The resultant cDNA sample was diluted 1:1 with100 mM Tris and 1 mM EDTA, and from all cDNA samplesa 1:20 dilution was prepared for qPCR analysis [32]. Allsamples were stored at −20 °C until analysis.
Genomic DNA contamination was assessed with aconventional end point PCR for β-actin, using intron-spanning primers, under the following conditions: annealingat 55 °C, elongation at 72 °C, denaturing at 94 °C, 90 s eachstep for 35 cycles, with 1.5 mM Mg2+ and 0.75 U Taq DNApolymerase (Qiagen, Westburg, The Netherlands). Theresultant PCR product was analyzed by agarose gelelectrophoresis. A single band of the anticipated exon-sizewas found in all samples, demonstrating the absence ofgenomic contamination. Nontemplate and nonampliconcontrols were subjected to PCR amplification, but they neveryielded PCR products.
qPCR primers—qPCR primer pairs were designedusing Primer Express V 2.0 software (PE Applied Biosystems,Warrington, UK). Details of the primers and the GenBankAccession numbers are given in Table 2.
Real-time quantitative PCR—Real-time qPCR is basedon the real-time monitoring of fluorescent SYBR Green I(Prism 5700; Applied Biosystems Inc., Nieuwekerk a/d IJssel,The Netherlands). The qPCR conditions were as follows: 1×SYBR Green PCR buffer; 3.5 mM MgCl2; 200 µM dATP,200 μM dGTP, and 200 μM dCTP, and 400 µM dUTP; 0.5 UTaq polymerase (AmpliTaq Gold; Applied Biosystems); 0.2U uracil-N-glycosylase (UNG; AmpErase; AppliedBiosystems), 2 pmol primers; and 2 µl of the 1:20 dilution ofcDNA in a total volume of 20 µl. An initial step of 50 °C for2 min was used for UNG incubation, followed by 10 min at95 °C to inactivate UNG and to activate the Taq polymerase.Cycling conditions were a melting step at 95 °C for 15 s andannealing–elongation at 60 °C for 1 min, for 40 cycles. Thereal-time detection of double-stranded DNA allows theconstruction of a dissociation curve at the end of the PCR runby ramping the temperature of the sample from 60 °C to 95 °C,while continuously collecting fluorescence data. The curvesof the melting profiles showed a single product and did notreveal accumulation of primer dimers. Nontemplate andnonamplicon controls were included for each primer pair tocheck for any significant levels of contaminants, whichresulted in a difference of at least five cycles of the Ct valuescompared to the template containing samples. Gelelectrophoresis of amplicons showed the correct size.
PCR amplification efficiency: In previous work, theamplification efficiency (E) of each primer pair wasdetermined on a dilution series of cDNA. The values of E werefound to be close to the optimal value of 2 for all pairs [32].For all calculations, E=2 was used.
Normalization: To correct for differences in cDNA loadbetween different samples, the target PCR has to benormalized to a reference PCR. The normalization wasperformed as described previously in detail [32]. Using the
TABLE 1. PRIMARY ANTIBODIES USED IN THIS STUDY
Primary antibody Dilution SourceRabbit anti-GluR1 1:500 Upstate (Lake Placid, NY)Rabbit anti-GluR2 1:500 BD Biosciences (Heidelberg, Germany)Rabbit anti-GluR2/3 1:500 Chemicon (Temecula, CA)Rabbit anti-GluR4 1:500 ChemiconRabbit anti-GluR6/7 1:500 UpstateRabbit anti-NR1 1:1 200 Tocris (Ellisville, MO)Rabbit anti-NR2C 1:1 000 BD PharMingen (San Diego, CA)Rabbit anti-NR3A 1:1 000 UpstateThe primary antibodies were prepared in TBS-T with 1% skimmed milk, diluted according the table. The brand name of theantibody is also listed.
Molecular Vision 2009; 15:1620-1630 <http://www.molvis.org/molvis/v15/a173> © 2009 Molecular Vision
1622
Real-time quantitative PCR:

TAB
LE 2
. PR
IMER
S FO
R Q
PCR
AN
ALY
SIS.
Gen
eG
enB
ank
Uni
Gen
ena
me
Uni
Gen
esy
mbo
lFo
rwar
d pr
imer
Rev
erse
Pri
mer
bp
Hpr
tN
M_0
1258
3H
prt
Rn.
47A
TGG
GA
GG
CC
ATC
AC
ATT
GT
ATG
TAA
TCC
AG
CA
GG
TCA
GC
AA
77Yw
haz
NM
_013
011
Yw
haz
Rn.
1292
CA
AG
CA
TAC
CA
AG
AA
GC
ATT
TGA
GG
GC
CA
GA
CC
CA
GTC
TGA
76Rh
oN
M_0
3344
1R
hoR
n.92
530
GC
AA
CA
GG
AG
TCG
GC
TAC
CA
GC
ATA
GG
GA
AG
CC
AG
CA
GA
TC99
Tbp
NM
_001
0041
98Tb
pR
n.22
712
AC
CA
GA
AC
AA
CA
GC
CTT
CC
AC
CTT
TGG
AG
TAA
GC
CC
TGTG
CC
GTA
AG
116
Ubc
NM
_017
314
Ubc
Rn.
3761
TCG
TAC
CTT
TCTC
AC
CA
CA
GTA
TCTA
GG
AA
AA
CTA
AG
AC
AC
CTC
CC
CA
TCA
82G
luR1
NM
_031
608
Gria
1R
n.29
971
GA
GC
AA
CG
AA
AG
CC
CTG
TGA
CC
CTT
GG
GTG
TCG
CA
ATG
80G
luR1
flip
M38
060
GA
AG
CA
AG
GA
CTC
CG
GA
AG
TAA
GTA
GA
AC
AC
GC
CTG
CC
AC
ATT
71G
luR1
flop
M36
418
GTC
CG
CC
CTG
AG
AA
ATC
CA
AG
CC
CC
TGC
TCG
TTC
AG
TT57
Glu
R2N
M_0
1726
1G
ria2
Rn.
9136
1A
AC
GA
GTA
CA
TCG
AG
CA
GA
GG
AA
GA
TGC
CG
TAG
CC
TTTG
GA
ATC
78G
luR2
shor
tM
3806
1
TT
GA
GTT
CTG
TTA
CA
AG
TCA
AG
GG
CA
GG
AA
GA
TGG
GTT
AA
TATT
CTG
TGG
A81
Glu
R2 lo
ngN
M_0
1726
1
G
CC
TTG
GTT
TGG
CA
ATG
CG
AC
ATC
AC
TCA
AG
GTC
ATC
TTC
ATT
C92
Glu
R2 fl
ipM
3806
1
G
GA
AC
CC
CA
GTA
AA
TCTT
GC
AG
TG
AG
TCC
TTG
GC
TCC
AC
ATT
CA
C10
7G
luR2
flop
M36
419
CA
TCG
CC
AC
AC
CTA
AA
GG
ATC
CA
ATT
TGTC
CA
AC
AG
GC
CTT
GT
88G
luR3
NM
_032
990
Gria
3R
n.74
049
TTC
GG
AA
GTC
CA
AG
GG
AA
AG
TC
AC
GG
CTT
TCTC
TGC
TCA
ATG
76G
luR3
flip
M38
062
GG
AA
TGTG
GA
GC
CA
AG
GA
CTC
GC
TCA
GG
CTT
AG
AG
CA
CTG
GTC
58G
luR3
flop
M36
420
GG
CA
AC
CC
CTA
AA
GG
CTC
AG
AA
TAC
TGC
CA
GG
TTA
AC
AG
CA
TTTC
51G
luR4
NM
_017
263
Gria
4R
n.10
938
GG
CTC
GTG
TCC
GC
AA
GTC
TTC
GC
TGC
TCA
ATG
TATT
CA
TTC
77G
luR4
shor
tS9
4371
TGA
TAG
AG
TTC
TGTT
AC
AA
GTC
CA
GG
GC
GA
GG
AA
GTT
GG
GTT
AA
AA
GTC
TGT
86G
luR4
long
NM
_017
263
CC
AG
GG
CA
GA
GG
CG
AA
GC
GTT
TTC
TCC
CA
CA
CTC
CC
A93
Glu
R4 fl
ipM
3806
3
TT
TTG
AA
AC
TCA
GTG
AG
GC
AG
GC
GTA
CC
AC
CA
TTTG
TTTT
TCA
GC
57G
luR4
flop
M36
421
CC
TCTT
GG
AC
AA
ATT
GA
AA
AA
CA
AC
CG
CTG
CC
AC
ATT
CTC
CTT
57G
luR7
NM
_181
373
Grik
3R
n.92
477
AA
GG
CA
AA
GG
AG
AC
CC
GA
AA
GC
ATG
GTT
TCC
CC
GG
TAG
GTA
AG
110
NR1
NM
_017
010
Grin
1R
n.98
40C
TGTT
CTT
CC
GC
TCA
GG
CTT
TA
TGA
AG
AC
CC
CTG
CC
ATG
TTC
200
NR2
CN
M_0
1257
5G
rin2c
Rn.
9709
GG
ATC
TGC
CA
GA
AC
GA
GA
AG
ATT
GTT
GC
CC
CA
GTT
CTC
GA
390
NR3
AA
F073
379
Grin
3aR
n.42
928
CA
GTC
TTC
GG
AA
AC
CTC
ATC
GTG
AC
AG
TTC
TCA
TGC
GC
TTG
T63
The
prim
ers u
sed
for q
PCR
wer
e as
show
n. T
he G
enB
ank
acce
ssio
n co
des a
nd th
e an
ticip
ated
size
of t
he a
mpl
ified
pro
duct
are
list
ed.
Molecular Vision 2009; 15:1620-1630 <http://www.molvis.org/molvis/v15/a173> © 2009 Molecular Vision
1623
data from all cDNA samples, for each gene the pair-wisevariation in relation to all other genes was determined as thestandard deviation of the logarithmically transformedexpression ratios. The internal gene stability measure M wasdefined as the average pair-wise variation with all othercontrol genes. Stepwise exclusion of the gene with the highestM value identified the combination of two constitutivelyexpressed genes that have the most stable expression in thetested samples. This analysis is facilitated by the use of thevirtual basic applet GeNorm developed by Vandesompele etal. [33]. In our model, ubiquitin C (Ubc) and TATA-boxbinding protein (Tbp) were identified as the most stable genes.Indeed, statistical analysis with Student’s t-test confirmed thatthese genes are not significantly altered by diabetes. Tomeasure expression levels accurately, normalization tomultiple reference genes is preferred. A normalization factorbased on the expression levels of Ubc and Tbp was calculatedby using the geometric mean of the Ct. In addition,normalization factors were calculated for Tbp-Ubc- Rho, andso forth. The pair-wise variation (V) was calculated betweenthese normalization factors; a large V value means that theadded gene has a significant effect and should be included forthe final normalization factor. After the suggested cut-offvalue of 0.15 by Vandesompele et al. [33], five genes wereselected as reference genes, and their transcript levels wereused to calculate the normalization factor: hypoxanthineguanine phosphoribosyl transferase (Hprt); tyrosine 3-monooxygenase/tryptophan 5-monooxygenase activationprotein, zeta polypeptide (Ywhaz); rhodopsin (Rho); Ubc; andTbp.Quantitative assessment of target gene expression: The qPCRCt values were converted to “absolute amounts” (C x E-Ct withC=1010) reflecting the amount of transcript in the cDNAsample (E-Ct). For normalization, the absolute amount of thetarget gene was divided by the normalization factor [32].Statistical analysis: Results are presented as mean±standarderror of the mean. Statistical analysis was performed using theStudent’s t-test. Significant difference was considered to bepresent for p<0.05.
RESULTSAnimals: The average weight and blood glucose values for therats at the time of death are given in Table 3. There was asignificant weight loss in STZ-diabetic rats, compared withage-matched controls, at one, four, and 12 weeks after theinduction of diabetes. Blood glucose levels were alsosignificantly increased at these time points.
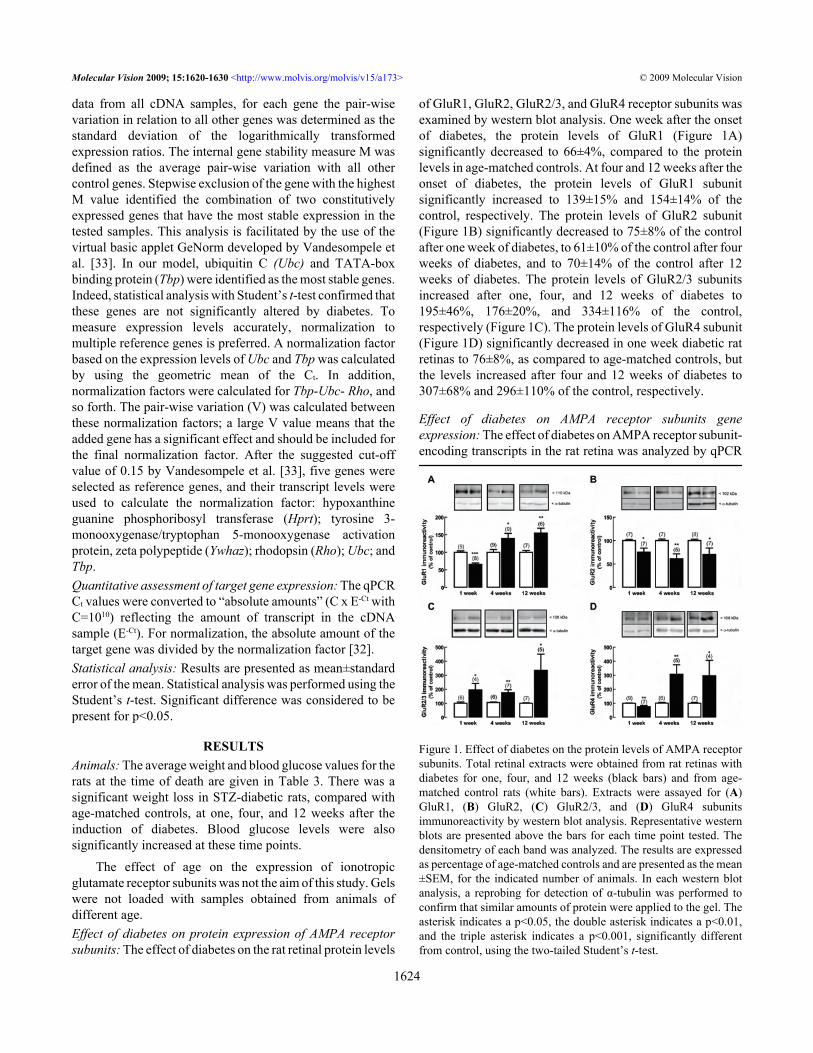
The effect of age on the expression of ionotropicglutamate receptor subunits was not the aim of this study. Gelswere not loaded with samples obtained from animals ofdifferent age.Effect of diabetes on protein expression of AMPA receptorsubunits: The effect of diabetes on the rat retinal protein levels
of GluR1, GluR2, GluR2/3, and GluR4 receptor subunits wasexamined by western blot analysis. One week after the onsetof diabetes, the protein levels of GluR1 (Figure 1A)significantly decreased to 66±4%, compared to the proteinlevels in age-matched controls. At four and 12 weeks after theonset of diabetes, the protein levels of GluR1 subunitsignificantly increased to 139±15% and 154±14% of thecontrol, respectively. The protein levels of GluR2 subunit(Figure 1B) significantly decreased to 75±8% of the controlafter one week of diabetes, to 61±10% of the control after fourweeks of diabetes, and to 70±14% of the control after 12weeks of diabetes. The protein levels of GluR2/3 subunitsincreased after one, four, and 12 weeks of diabetes to195±46%, 176±20%, and 334±116% of the control,respectively (Figure 1C). The protein levels of GluR4 subunit(Figure 1D) significantly decreased in one week diabetic ratretinas to 76±8%, as compared to age-matched controls, butthe levels increased after four and 12 weeks of diabetes to307±68% and 296±110% of the control, respectively.
Effect of diabetes on AMPA receptor subunits geneexpression: The effect of diabetes on AMPA receptor subunit-encoding transcripts in the rat retina was analyzed by qPCR
Figure 1. Effect of diabetes on the protein levels of AMPA receptorsubunits. Total retinal extracts were obtained from rat retinas withdiabetes for one, four, and 12 weeks (black bars) and from age-matched control rats (white bars). Extracts were assayed for (A)GluR1, (B) GluR2, (C) GluR2/3, and (D) GluR4 subunitsimmunoreactivity by western blot analysis. Representative westernblots are presented above the bars for each time point tested. Thedensitometry of each band was analyzed. The results are expressedas percentage of age-matched controls and are presented as the mean±SEM, for the indicated number of animals. In each western blotanalysis, a reprobing for detection of α-tubulin was performed toconfirm that similar amounts of protein were applied to the gel. Theasterisk indicates a p<0.05, the double asterisk indicates a p<0.01,and the triple asterisk indicates a p<0.001, significantly differentfrom control, using the two-tailed Student’s t-test.
Molecular Vision 2009; 15:1620-1630 <http://www.molvis.org/molvis/v15/a173> © 2009 Molecular Vision
1624

(Figure 2). The transcript levels of splice variants at the C-terminal (short and long) for GluR2 and GluR4 subunits, andthe flip and flop splice variants for GluR1–4 subunits werealso evaluated. Compared to the transcript levels in the retinaof age-matched control rats, there were no significant changesin GluR1 (Figure 2A), GluR2 (Figure 2B), GluR3 (Figure 2C),and GluR4 (Figure 2D) subunits expression, except for GluR4at the four weeks time point, which decreased to 68±9% ofthe control.
For GluR2 and GluR4 subunits alternative splicingoccurs at the C-terminal region [34-36]. The GluR2-shortsplice variant was much more abundant than the long splicevariant in all samples (Table 4). Diabetes did not causesignificant changes in the GluR2-short/-long ratio, except forthe four weeks time point (Table 4). The GluR4-long splicevariant was more abundant than the short splice variant in allsamples, but no changes were found in the diabetic groupscompared to age-matched controls (Table 4).
For all AMPA receptor subunits, so-called flip and flopversions are present [37]. Receptors containing flip subunitsexhibit significantly slower desensitization kinetics and agreater steady-state component in their response to glutamaterelatively to those containing flop subunits [37-40]. Overall,no significant changes were observed in flip/flop ratio due todiabetes (Table 4).
Figure 2. Effect of diabetes on the transcript levels of AMPA receptorsubunits. Total RNA was isolated from rat retinas with one, four and12 weeks of diabetes (black bars) and from rat retinas of age-matchedcontrols (white bars). The transcript levels of (A) GluR1, (B) GluR2,(C) GluR3, (D) GluR4 subunits were analyzed by qPCR. The resultsrepresent the normalized expression levels for each subunit, asexplained in Methods, and are presented as the mean±SEM, for theindicated number of animals. The asterisk indicates a p<0.05,significantly different from control, using the two-tailed Student’s t-test.
TABLE 3. WEIGHT AND BLOOD GLUCOSE LEVELS AT TIME OF DEATH.
Group n Weight (g) Blood glucose (mg/dl)Control 1 week 25 254.1±7.6 104.6±3.4Diabetic 1 week 24 189.9±9.9*** 401.7±25.5***Control 4 weeks 33 341.9±11.8 91.1±1.7Diabetic 4 weeks 25 225.8±7.8*** 437.9±11.9***Control 12 weeks 36 363.9±14.9 96.7±3.9Diabetic 12 weeks 30 237.3±11.2*** 479.1±8.8***
Animals were weighed and blood glucose levels were measured before sacrifice. The triple asterisk indicates a p<0.001,significantly different from control, using the two-tailed Student’s t-test.
TABLE 4. RATIOS OF THE FLIP:FLOP AND SHORT:LONG SPLICE VARIANTS FOR AMPA RECEPTOR SUBUNITS
AMPA receptor splice variants
1 week 4 weeks 12 weeksControl Diabetic Control Diabetic Control Diabetic
GluR1 flip:flop 1.19±0.05 1.24±0.04 1.08±0.02 1.06±0.02 1.30±0.05 1.08±0.03**GluR2-short:long 37.7±5.0 40.5±3.4 33.6±1.5 54.2±9.1** 37.6±2.2 43.9±2.3GluR2 flip:flop 2.69±0.23 2.43±0.13 2.54±0.24 2.71±0.11 2.49±0.12 2.85±0.16GluR3 flip:flop 1.01±0.06 1.01±0.05 1.13±0.09 1.14±0.10 1.11±0.08 1.03±0.05GluR4-short:long 0.72±0.08 0.68±0.04 0.61±0.04 0.61±0.02 0.75±0.05 0.71±0.05GluR4 flip:flop 0.40±0.04 0.44±0.03 0.51±0.06 0.50±0.08 0.54±0.07 0.63±0.08
The ratio is calculated using the normalized expression levels for each isoform for each animal and expressed as the mean±SEM.The double asterisk indicates a p<0.01, and the triple asterisk indicates a p<0.001, significantly different from control, usingthe two-tailed Student’s t-test.
Molecular Vision 2009; 15:1620-1630 <http://www.molvis.org/molvis/v15/a173> © 2009 Molecular Vision
1625

Effect of diabetes on protein and gene expression of kainatereceptor subunits: One week after the onset of diabetes, therewere no changes in the protein levels of GluR6/7 subunits(Figure 3A). After four weeks of diabetes, the protein levelsof GluR6/7 significantly decreased to 77±10%, whencompared to age-matched controls. However, after 12 weeksof diabetes, the protein levels of GluR6/7 subunitssignificantly increased to 148±18% of the control.
The transcript levels of GluR7 subunit (Figure 3B) wereunchanged in the rat retinas, one week after the induction ofdiabetes, as compared to age-matched controls. However, thetranscript levels of this subunit significantly decreased to69±10% of the control after four weeks of diabetes, andincreased after 12 weeks to 126±10% of the control.
The transcript levels of GluR5 and GluR6 subunits werebelow the detection level (data not shown).Effect of diabetes on protein and gene expression of NMDAreceptor subunits: Diabetes induced changes in the NR1subunit protein levels in the retina (Figure 4A). In retinas fromrats who had diabetes one week, the protein expression levelsof NR1 subunit significantly decreased to 41±7% of thecontrol. However, after four weeks of diabetes, the proteinlevels of NR1 subunit significantly increased to 186±23% ofthe control, and 12 weeks after the onset of diabetes, theprotein levels of NR1 subunit decreased to 74±3% of thecontrol.
The protein expression of NR2C (Figure 4B) was notsignificantly changed in retinas of rats with diabetes for oneweek, compared to age-matched controls; it significantlyincreased to 132±10% of the control after four weeks ofdiabetes. In rats who had 12 weeks of diabetes, the proteinlevels of NR2C subunit were similar to the control. Theprotein expression levels of NR3A subunit (Figure 4C)increased in the retinas of rats after one week of diabetes to170±16% of the control, to 153±22% of the control after fourweeks of diabetes, and to 142±19% of the control after 12weeks of diabetes.
The transcript levels of NR1 subunit (Figure 5A) wereupregulated after one and four weeks of diabetes, as comparedto age-matched controls, but were unchanged after 12 weeks.The transcript levels of NR2C (Figure 5B) and NR3A (Figure5C) subunits remained unchanged at the three time pointsinvestigated.
DISCUSSIONThere is evidence to support the involvement of glutamate inthe pathogenesis of DR. In the retina of diabetic animals, themetabolism of glutamate is impaired [24,25] and the release ofD-aspartate is increased [28]. Furthermore, in cultured retinalneural cells we previously found that elevated glucosechanges the content of AMPA and kainate glutamate receptorsubunits [29]. These findings led us to hypothesize that
ionotropic glutamate receptor subunits expression is changedin the retina of diabetic rats. Changes in subunit compositionmay alter glutamate receptor properties, therefore affectingretinal neurotransmission and consequently vision. Thus, themain purpose of this study was to investigate whether diabeteschanges the expression of ionotropic glutamate receptorsubunits in the retina, and to determine if changes at the
Figure 3. Effect of diabetes on kainate receptor subunits expression.Total protein extracts (A) and total RNA extracts (B) were preparedfrom rat retinas with one, four, and 12 weeks diabetic rat retinas(black bars) and from age-matched controls (white bars). A: Totalretinal extracts were assayed for GluR6/7 subunits immunoreactivityby western blot analysis. Representative western blots are presentedabove the graph. The densitometry of each band was analyzed. Theresults are expressed as percentage of age-matched controls and arepresented as the mean±SEM, for the indicated number of animals. Ineach western blot analysis, a reprobing for detection of α-tubulin wasperformed to confirm that similar amounts of protein were appliedto the gel. The asterisk indicates a p<0.05, significantly differentfrom control, using the two-tailed Student’s t-test. B: The transcriptlevels of GluR7 subunit were analyzed by qPCR. The resultsrepresent the normalized expression levels for GluR7 subunit, asexplained in Methods, and are presented as the mean±SEM, for theindicated number of animals. The asterisk indicates a p<0.05,significantly different from control, using the two-tailed Student’s t-test.
Molecular Vision 2009; 15:1620-1630 <http://www.molvis.org/molvis/v15/a173> © 2009 Molecular Vision
1626

protein level were associated with changes at the geneexpression level.
Our results demonstrate that diabetes does alter theexpression of ionotropic glutamate receptor subunits in theretina, but mainly at the protein level. Of particular interest isthe significant downregulation of GluR2 subunit proteinexpression, found at all three time points studied. AMPAreceptors are usually less permeable to calcium than theNMDA receptor. However, AMPA receptors lacking theGluR2 subunit are calcium-permeable [41-43]. Thedownregulation of GluR2 subunit may serve as a molecularswitch leading to the formation of calcium-permeable AMPAreceptors, which may enhance the toxicity of endogenousglutamate following a neurologic insult [44]. Previously, itwas reported that the calcium-binding proteins, calbindin andparvalbumin, are increased in the retina of STZ-induceddiabetic rats, probably to increase the buffering capacity ofretinal cells to maintain the calcium homeostasis and protectthem against the damaging effects of excessive calcium influxduring overstimulation of ionotropic glutamate receptors[31].
Figure 4. Effect of diabetes on the protein levels of NMDA receptorsubunits. Total retinal extracts were prepared from rat retinas withone, four, and 12 weeks of diabetes (black bars) and from age-matched control rats (white bars). Extracts were assayed for (A) NR1,(B) NR2C, and (C) NR3A subunits immunoreactivity by westernblot analysis. Representative western blots are presented above thegraphs for each time point tested. The densitometry of each band wasanalyzed. The results are expressed as percentage of age-matchedcontrols and are presented as the mean±SEM, for the indicatednumber of animals. In each western blot analysis, a reprobing fordetection of α-tubulin was performed to confirm that similar amountsof protein were applied to the gel. The asterisk indicates a p<0.05,the double asterisk indicates a p<0.01, and the triple asterisk indicatesa p<0.001, significantly different from control, using the two-tailedStudent’s t-test.
We have also found an increase in GluR2/3 subunits,suggesting that GluR3 subunit is upregulated in diabetic ratretinas. The lack of a suitable anti-GluR3 subunit antibody hasprevented us from testing this possibility in a more direct way.Previously, it was demonstrated that GluR2/3 subunits aremore abundant in the retinas of rats with diabetes four fourand 16 weeks in ganglion, amacrine and bipolar cells as wellas in the inner and outer plexiform layers [31]. The same workreported increased levels of NR1 subunit in the retinas of ratswho had diabetes for four or 16 weeks. In our case, we foundthat NR1 subunit protein levels were not elevated throughoutthe complete course of diabetes; NR1 subunit protein levelswere downregulated at one week, upregulated at four weeks,and downregulated at 12 weeks. This is particularly relevantsince most of the studies deal with only one time point ofdiabetes and, as we found, the diabetic rat retina is not a statictissue.
Another important finding of this study is the increase inNR3A subunit in the retinas of diabetic animals. In vitrostudies indicate that NR3A is a modulatory subunit that canalter NMDA receptor activity and function [45-48].Electrophysiological studies have shown that the NR3Asubunit can co-assemble with NR1 and NR2A to formfunctional NMDA receptors with decreased NMDA receptoractivity and decreased Ca2+ flux [47,48]; mice lacking theNR3A subunit show enhanced NMDA receptor activity [46].There is no data demonstrating that NR3A preferentiallyassembles with certain NMDA receptor subunits. However,
Figure 5. Effect of diabetes on the transcript levels of NMDAreceptor subunits. Total RNA extracts were prepared from rat retinaswith one, four, and 12 weeks of diabetes (black bars) and from age-matched controls (white bars), and the transcript levels of (A) NR1,(B) NR2C, and (C) NR3A subunits were analyzed by qPCR. Theresults represent the normalized expression levels for each subunit,as explained in Methods, and are presented as the mean±SEM, forthe indicated number of animals. The asterisk indicates a p<0.05,significantly different from control, using the two-tailed Student’s t-test.
Molecular Vision 2009; 15:1620-1630 <http://www.molvis.org/molvis/v15/a173> © 2009 Molecular Vision
1627

in NR3A-overexpressing transgenic mice, NR3A isincorporated into at least a subset of NMDA receptors,mitigating their responses in hippocampal neurons [49].Considering its suppressive effects on NMDA receptors,NR3A has been suggested to act as a neuroprotectivemodulator. NR3A subunit has been found in the inner retinafrom the rodent retina from an early postnatal age andpersisting into adulthood [50]. The same study reported thatNR3A may modulate NMDA receptor-mediated calciuminflux in retinal ganglion cells and amacrine cells, decreasingthe intracellular calcium changes concentration. We havepreviously reported an increase in glutamate release duringdiabetes [28], which may lead to glutamate excitotoxicity. Theincrease in NR3A subunit in diabetic rat retinas may be acompensatory mechanism to prevent calcium overload.
Previously, in cultured retinal neural cells, we found thatthe protein levels of GluR1 and GluR6/7 subunits decreaseand GluR2 and KA2 subunits increase [29]. Therefore, thedata obtained in this work does not completely fit with the invitro study, where we investigated only one time point ofelevated glucose incubation (seven days). Also, in diabetichuman postmortem retinas we have found that GluR2 andNR1 subunits are altered, mainly at the plexiform layers andganglion cell layer [30]. Thus, the main conclusion of thiswork is that hyperglycemia induces alterations in ionotropicglutamate receptors, which may have consequences inreceptor function and eventually in retinal cell viability.
Our results also show that in general there was nocorrelation between the results found for protein and mRNAexpression levels, indicating that the changes observed in theionotropic glutamate receptor subunits at the protein level arenot the result of changes at the transcript level. In this work,the data are derived from the total retina, giving an average ofthe expression level of a particular ionotropic glutamatereceptor subunit in the whole retina, losing the cell-to-cellvariation. The level of expression of each glutamate receptorsubunit is determined, at any particular time, by the balanceof the rates of gene transcription, mRNA translation, mRNAdegradation, and protein degradation. The most significantchanges are observed at the protein level, which suggests thatdiabetes changes the ratio of protein synthesis as well asdegradation. Recently, it was reported that genes for proteinsynthesis are upregulated in the retina of diabetic mice [51].At least in the STZ-induced diabetic rat model, thepresumption that changes at the mRNA expression aretranslated to similar changes at the protein level should not befollowed.
This work also addressed whether diabetes inducesalterations in the splicing mechanisms encoding for differentC-terminal variants of GluR2 and GluR4 and on the splicingmachinery of AMPA receptor subunits encoding for flip andflop isoforms. In control retinas, the short splice variant ofGluR2 is more abundant than the long splice variant, and
GluR4-long is also more abundant than GluR4-short, inaccordance with previous reports [32]. Our data did notprovide clear evidence for profound alterations in either theratio of the long and short variants or the ratio of flip and flopsplice variants, suggesting that the splicing mechanismsleading to these isoforms are not altered by diabetes.
In conclusion, the observed changes in ionotropicglutamate receptor subunits content show that diabetes affectsa main component of the excitatory neurotransmission,suggesting potential alterations in synaptic communicationthroughout the retina, which may contribute to color visiondefects or loss of contrast sensitivity [5,52]. Also, theexpression of ionotropic glutamate receptors with abnormalsubunit composition may cause neurons to become morevulnerable to excitotoxic stress. It remains to be determinedwhether these changes contribute to the subsequentneurodegeneration found in diabetic retinas.
ACKNOWLEDGMENTSThis work was supported by the Foundation for Science andTechnology, Portugal (Grant POCTI/CBO/38545/01) andF.E.D.E.R.
REFERENCES1. Cai J, Boulton M. The pathogenesis of diabetic retinopathy: old
concepts and new questions. Eye 2002; 16:242-60. [PMID:12032713]
2. Barber AJ. A new view of diabetic retinopathy: aneurodegenerative disease of the eye. ProgNeuropsychopharmacol Biol Psychiatry 2003; 27:283-90.[PMID: 12657367]
3. Barber AJ, Antonetti DA, Kern TS, Reiter CE, Soans RS, KradyJK, Levison SW, Gardner TW, Bronson SK. The Ins2Akitamouse as a model of early retinal complications in diabetes.Invest Ophthalmol Vis Sci 2005; 46:2210-8. [PMID:15914643]
4. Lieth E, Gardner TW, Barber AJ, Antonetti DA. Retinalneurodegeneration: early pathology in diabetes. ClinExperiment Ophthalmol 2000; 28:3-8. [PMID: 11345341]
5. Roy MS, Gunkel RD, Podgor MJ. Color vision defects in earlydiabetic retinopathy. Arch Ophthalmol 1986; 104:225-8.[PMID: 3484948]
6. Sokol S, Moskowitz A, Skarf B, Evans R, Molitch M, SeniorB. Contrast sensitivity in diabetics with and withoutbackground retinopathy. Arch Ophthalmol 1985; 103:51-4.[PMID: 3977675]
7. Bearse MA Jr, Han Y, Schneck ME, Barez S, Jacobsen C,Adams AJ. Local multifocal oscillatory potentialabnormalities in diabetes and early diabetic retinopathy.Invest Ophthalmol Vis Sci 2004; 45:3259-65. [PMID:15326149]
8. Parisi V, Uccioli L. Visual electrophysiological responses inpersons with type 1 diabetes. Diabetes Metab Res Rev 2001;17:12-8. [PMID: 11241887]
9. Dijk F, Kamphuis W. Ischemia-induced Alterations of AMPA-type glutamate receptor subunit. Expression patterns in the rat
Molecular Vision 2009; 15:1620-1630 <http://www.molvis.org/molvis/v15/a173> © 2009 Molecular Vision
1628
retina-an immunocytochemical study. Brain Res 2004;997:207-21. [PMID: 14706873]
10. Vandenbranden CA, Kamphuis W, Nunes Cardozo B,Kamermans M. Expression and localization of ionotropicglutamate receptor subunits in the goldfish retina–an in situhybridization and immunocytochemical study. J Neurocytol2000; 29:729-42. [PMID: 11387547]
11. Brandstatter JH. Glutamate receptors in the retina: themolecular substrate for visual signal processing. Curr Eye Res2002; 25:327-31. [PMID: 12789538]
12. Brandstatter JH, Koulen P, Wassle H. Diversity of glutamatereceptors in the mammalian retina. Vision Res 1998;38:1385-97. [PMID: 9667006]
13. Thoreson WB, Witkovsky P. Glutamate receptors and circuitsin the vertebrate retina. Prog Retin Eye Res 1999;18:765-810. [PMID: 10530751]
14. Ozawa S, Kamiya H, Tsuzuki K. Glutamate receptors in themammalian central nervous system. Prog Neurobiol 1998;54:581-618. [PMID: 9550192]
15. Li N, Young MM, Bailey CJ, Smith ME. NMDA and AMPAglutamate receptor subtypes in the thoracic spinal cord in leanand obese-diabetic ob/ob mice. Brain Res 1999; 849:34-44.[PMID: 10592285]
16. Gagné J, Milot M, Gélinas S, Lahsaïni A, Trudeau F, MartinoliMG, Massicotte G. Binding properties of glutamate receptorsin streptozotocin-induced diabetes in rats. Diabetes 1997;46:841-6. [PMID: 9133553]
17. Di Luca M, Ruts L, Gardoni F, Cattabeni F, Biessels GJ, GispenWH. NMDA receptor subunits are modified transcriptionallyand post-translationally in the brain of streptozotocin-diabeticrats. Diabetologia 1999; 42:693-701. [PMID: 10382589]
18. Delibas N, Kilinc I, Yonden Z, Sutcu R, Gultekin F, Koylu H.NMDA receptor subunits 2A and 2B decrease and lipidperoxidation increase in the hippocampus of streptozotocin-diabetic rats: effects of insulin and gliclazide treatments. IntJ Neurosci 2004; 114:391-401. [PMID: 14754663]
19. Gardoni F, Kamal A, Bellone C, Biessels GJ, Ramakers GM,Cattabeni F, Gispent WH, Di Luca M. Effects ofstreptozotocin-diabetes on the hippocampal NMDA receptorcomplex in rats. J Neurochem 2002; 80:438-47. [PMID:11908465]
20. Trudeau F, Gagnon S, Massicotte G. Hippocampal synapticplasticity and glutamate receptor regulation: influences ofdiabetes mellitus. Eur J Pharmacol 2004; 490:177-86. [PMID:15094084]
21. Tomiyama M, Furusawa K, Kamijo M, Kimura T, MatsunagaM, Baba M. Upregulation of mRNAs coding for AMPA andNMDA receptor subunits and metabotropic glutamatereceptors in the dorsal horn of the spinal cord in a rat modelof diabetes mellitus. Brain Res Mol Brain Res 2005;136:275-81. [PMID: 15893611]
22. Delyfer MN, Forster V, Neveux N, Picaud S, Leveillard T,Sahel JA. Evidence for glutamate-mediated excitotoxicmechanisms during photoreceptor degeneration in the rd1mouse retina. Mol Vis 2005; 11:688-96. [PMID: 16163266]
23. Osborne NN, Melena J, Chidlow G, Wood JP. A hypothesis toexplain ganglion cell death caused by vascular insults at theoptic nerve head: possible implication for the treatment ofglaucoma. Br J Ophthalmol 2001; 85:1252-9. [PMID:11567974]
24. Lieth E, Barber AJ, Xu B, Dice C, Ratz MJ, Tanase D, StrotherJM. Glial reactivity and impaired glutamate metabolism inshort-term experimental diabetic retinopathy. Penn StateRetina Research Group. Diabetes 1998; 47:815-20. [PMID:9588455]
25. Kowluru RA, Engerman RL, Case GL, Kern TS. Retinalglutamate in diabetes and effect of antioxidants. NeurochemInt 2001; 38:385-90. [PMID: 11222918]
26. Ambati J, Chalam KV, Chawla DK, D'Angio CT, Guillet EG,Rose SJ, Vanderlinde RE, Ambati BK. Elevated gamma-aminobutyric acid, glutamate, and vascular endothelialgrowth factor levels in the vitreous of patients withproliferative diabetic retinopathy. Arch Ophthalmol 1997;115:1161-6. [PMID: 9298058]
27. Li Q, Puro DG. Diabetes-induced dysfunction of the glutamatetransporter in retinal Müller cells. Invest Ophthalmol Vis Sci2002; 43:3109-16. [PMID: 12202536]
28. Santiago AR, Pereira TS, Garrido MJ, Cristovao AJ, Santos PF,Ambrosio AF. High glucose and diabetes increase the releaseof [(3)H]-d-aspartate in retinal cell cultures and in rat retinas.Neurochem Int 2006; 48:453-8. [PMID: 16513217]
29. Santiago AR, Rosa SC, Santos PF, Cristovao AJ, Barber AJ,Ambrosio AF. Elevated glucose changes the expression ofionotropic glutamate receptor subunits and impairs calciumhomeostasis in retinal neural cells. Invest Ophthalmol Vis Sci2006; 47:4130-7. [PMID: 16936133]
30. Santiago AR, Hughes JM, Kamphuis W, Schlingemann RO,Ambrosio AF. Diabetes changes ionotropic glutamatereceptor subunit expression level in the human retina. BrainRes 2008; 1198:153-9. [PMID: 18258217]
31. Ng YK, Zeng XX, Ling EA. Expression of glutamate receptorsand calcium-binding proteins in the retina of streptozotocin-induced diabetic rats. Brain Res 2004; 1018:66-72. [PMID:15262206]
32. Dijk F, Kraal-Muller E, Kamphuis W. Ischemia-inducedchanges of AMPA-type glutamate receptor subunitexpression pattern in the rat retina: a real-time quantitativePCR study. Invest Ophthalmol Vis Sci 2004; 45:330-41.[PMID: 14691192]
33. Vandesompele J, De Preter K, Pattyn F, Poppe B, Van Roy N,De Paepe A, Speleman F. Accurate normalization of real-timequantitative RT-PCR data by geometric averaging of multipleinternal control genes. Genome Biol 2002;3:RESEARCH0034. [PMID: 12184808]
34. Dev KK, Nishimune A, Henley JM, Nakanishi S. The proteinkinase C alpha binding protein PICK1 interacts with short butnot long form alternative splice variants of AMPA receptorsubunits. Neuropharmacology 1999; 38:635-44. [PMID:10340301]
35. Gallo V, Upson LM, Hayes WP, Vyklicky L Jr, Winters CA,Buonanno A. Molecular cloning and development analysis ofa new glutamate receptor subunit isoform in cerebellum. JNeurosci 1992; 12:1010-23. [PMID: 1372042]
36. Kohler M, Kornau HC, Seeburg PH. The organization of thegene for the functionally dominant alpha-amino-3-hydroxy-5-methylisoxazole-4-propionic acid receptorsubunit GluR-B. J Biol Chem 1994; 269:17367-70. [PMID:7545935]
37. Sommer B, Keinänen K, Verdoorn TA, Wisden W, BurnashevN, Herb A, Köhler M, Takagi T, Sakmann B, Seeburg PH.
Molecular Vision 2009; 15:1620-1630 <http://www.molvis.org/molvis/v15/a173> © 2009 Molecular Vision
1629

Flip and flop: a cell-specific functional switch in glutamate-operated channels of the CNS. Science 1990; 249:1580-5.[PMID: 1699275]
38. Hollmann M, Heinemann S. Cloned glutamate receptors. AnnuRev Neurosci 1994; 17:31-108. [PMID: 8210177]
39. Lambolez B, Ropert N, Perrais D, Rossier J, Hestrin S.Correlation between kinetics and RNA splicing of alpha-amino-3-hydroxy-5-methylisoxazole-4-propionic acidreceptors in neocortical neurons. Proc Natl Acad Sci USA1996; 93:1797-802. [PMID: 8700838]
40. Seeburg PH. The TINS/TiPS Lecture. The molecular biologyof mammalian glutamate receptor channels. Trends Neurosci1993; 16:359-65. [PMID: 7694406]
41. Jensen JB, Schousboe A, Pickering DS. Development ofcalcium-permeable alpha-amino-3-hydroxy-5-methyl-4-isoxazolepropionic acid receptors in cultured neocorticalneurons visualized by cobalt staining. J Neurosci Res 1998;54:273-81. [PMID: 9788286]
42. Kondo M, Okabe S, Sumino R, Okado H. A high GluR1: GluR2expression ratio is correlated with expression of Ca2+-binding proteins in rat forebrain neurons. Eur J Neurosci2000; 12:2812-22. [PMID: 10971623]
43. Oguro K, Oguro N, Kojima T, Grooms SY, Calderone A, ZhengX, Bennett MV, Zukin RS. Knockdown of AMPA receptorGluR2 expression causes delayed neurodegeneration andincreases damage by sublethal ischemia in hippocampal CA1and CA3 neurons. J Neurosci 1999; 19:9218-27. [PMID:10531425]
44. Pellegrini-Giampietro DE, Zukin RS, Bennett MV, Cho S,Pulsinelli WA. Switch in glutamate receptor subunit geneexpression in CA1 subfield of hippocampus following globalischemia in rats. Proc Natl Acad Sci USA 1992;89:10499-503. [PMID: 1438239]
45. Chatterton JE, Awobuluyi M, Premkumar LS, Takahashi H,Talantova M, Shin Y, Cui J, Tu S, Sevarino KA, NakanishiN, Tong G, Lipton SA, Zhang D. Excitatory glycine receptorscontaining the NR3 family of NMDA receptor subunits.Nature 2002; 415:793-8. [PMID: 11823786]
46. Das S, Sasaki YF, Rothe T, Premkumar LS, Takasu M, CrandallJE, Dikkes P, Conner DA, Rayudu PV, Cheung W, Chen HS,Lipton SA, Nakanishi N. Increased NMDA current and spinedensity in mice lacking the NMDA receptor subunit NR3A.Nature 1998; 393:377-81. [PMID: 9620802]
47. Ciabarra AM, Sullivan JM, Gahn LG, Pecht G, Heinemann S,Sevarino KA. Cloning and characterization of chi-1: adevelopmentally regulated member of a novel class of theionotropic glutamate receptor family. J Neurosci 1995;15:6498-508. [PMID: 7472412]
48. Sucher NJ, Akbarian S, Chi CL, Leclerc CL, Awobuluyi M,Deitcher DL, Wu MK, Yuan JP, Jones EG, Lipton SA.Developmental and regional expression pattern of a novelNMDA receptor-like subunit (NMDAR-L) in the rodentbrain. J Neurosci 1995; 15:6509-20. [PMID: 7472413]
49. Tong G, Takahashi H, Tu S, Shin Y, Talantova M, Zago W, XiaP, Nie Z, Goetz T, Zhang D, Lipton SA, Nakanishi N.Modulation of NMDA receptor properties and synaptictransmission by the NR3A subunit in mouse hippocampal andcerebrocortical neurons. J Neurophysiol 2008; 99:122-32.[PMID: 18003876]
50. Sucher NJ, Kohler K, Tenneti L, Wong HK, Gründer T, FauserS, Wheeler-Schilling T, Nakanishi N, Lipton SA, GuentherE. N-methyl-D-aspartate receptor subunit NR3A in the retina:developmental expression, cellular localization, andfunctional aspects. Invest Ophthalmol Vis Sci 2003;44:4451-6. [PMID: 14507892]
51. Adachi-Uehara N, Kato M, Nimura Y, Seki N, Ishihara A,Matsumoto E, Iwase K, Ohtsuka S, Kodama H, Mizota A,Yamamoto S, Adachi-Usami E, Takiguchi M. Up-regulationof genes for oxidative phosphorylation and protein turnoverin diabetic mouse retina. Exp Eye Res 2006; 83:849-57.[PMID: 16780836]
52. Daley ML, Watzke RC, Riddle MC. Early loss of blue-sensitivecolor vision in patients with type I diabetes. Diabetes Care1987; 10:777-81. [PMID: 3501362]
Molecular Vision 2009; 15:1620-1630 <http://www.molvis.org/molvis/v15/a173> © 2009 Molecular Vision
The print version of this article was created on 13 August 2009. This reflects all typographical corrections and errata to thearticle through that date. Details of any changes may be found in the online version of the article.
1630