diabetes in new york city 2007 dear fellow new yorkers: diabetes is epidemic in new york city....
TRANSCRIPT

PUBLIC HEALTH BURDEN AND DISPARITIES
DIABETES IN NEW YORK CITY:

Letter from the Commissioner
Executive Summary
Introduction
Chapter 1 – Prevalence ..................................................................1-1
Chapter 2 – obesity and related Risk factors ..........2-1
Chapter 3 – morbidity: Hospitalizations and
end-stage renal disease ..................................3-1
Chapter 4 – Mortality ....................................................................4-1
Chapter 5 – Health Care Indicators ..................................5-1
Chapter 6 – Diabetes During Pregnancy........................6-1
APPENDIX A – ABOUT THE DATA ............................................apxa-1
APPENDIX B – NEIGHBORHOOD TABLES AND MAPS ..apxb-1
references ..........................................................................................ref-1
Diabetes in New York City: Public Health Burden and Disparities
TABLE OF CONTENTS
Suggested Citation: Kim M, Berger D, Matte T. Diabetes in New York City: Public Health Burden and Disparities.
New York: New York City Department of Health and Mental Hygiene, 2006.
June 2007
Dear Fellow New Yorkers:
Diabetes is epidemic in New York City. Diabetes prevalence has more than doubled over the past 10 years. More than half a million adult New Yorkers have diagnosed diabetes and an additional 200,000have diabetes but do not yet know it. Diabetes and diabetes-associated cardiovascular disease are leadingcauses of death in NYC. About two-thirds of people with diabetes die from cardiovascular events. Thisreport, Diabetes in New York City: Public Health Burden and Disparities, captures the devastating effectsof the diabetes epidemic in NYC and the large disparities in its impact on different populations. Thisepidemic requires an effective public health response similar to that traditionally associated withcommunicable diseases.
Timely and complete population-level data on diabetes and its management are needed to support public health action and track its impact. Data compiled by the NYC Department of Health and Mental Hygiene (DOHMH) over the past few years, summarized in this first edition of Diabetes in New York City, are a good start but do not tell us enough about how well diabetes is being controlled. The two recent DOHMH initiatives detailed below will greatly enhance public health surveillance of the epidemic:
• As of January 15, 2006, the New York City Board of Health requires most clinical laboratories to report hemoglobin A1C test results electronically to the DOHMH. Laboratory data on A1C, akey measure of diabetes control, are being used to establish the first population-based A1C registryin the nation. The registry will enable the DOHMH to give clinicians and patients feedback andresources that can improve the quality of care and quality of life for New Yorkers with diabetes.
• The New York City Health and Nutrition Examination Survey (NYC HANES), conducted in 2004,provides data on A1C levels, blood pressure, lipids and smoking prevalence for a representativesample of New Yorkers with diabetes. For the first time, estimates on how well diabetes iscontrolled among NYC adults are available.
The DOHMH is working to provide clinical tools, diabetes resources and patient education materialsto New Yorkers with diabetes and their health care providers. Better data will help us provide moretimely and more focused resources, and will strengthen our partnership with patients and their healthcare providers.
Sincerely,
Thomas R. Frieden, MD, MPHCommissionerNew York City Department of Health and Mental Hygiene
Despite advances in knowledge of diabetes
care and control, diabetes was the 4th leading
cause of death in New York City (NYC) in 2003, directly
causing more than 1,800 deaths and contributing to
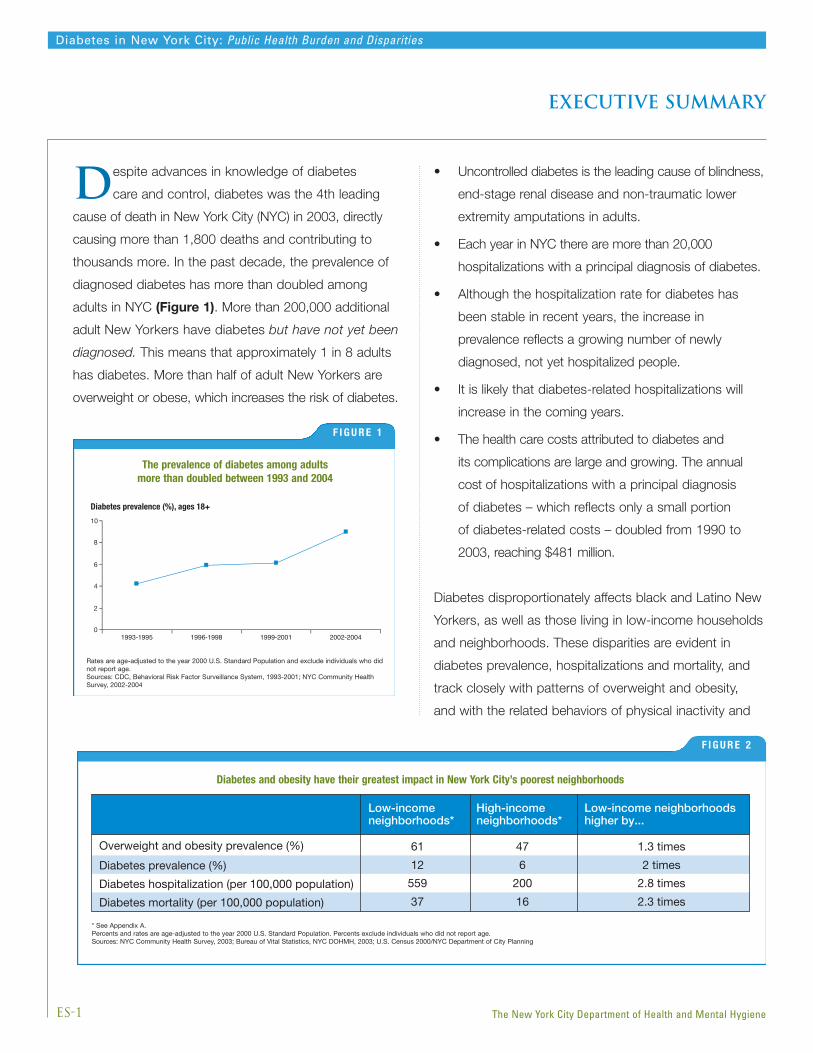
thousands more. In the past decade, the prevalence of
diagnosed diabetes has more than doubled among
adults in NYC (Figure 1). More than 200,000 additional
adult New Yorkers have diabetes but have not yet been
diagnosed. This means that approximately 1 in 8 adults
has diabetes. More than half of adult New Yorkers are
overweight or obese, which increases the risk of diabetes.
• Uncontrolled diabetes is the leading cause of blindness,
end-stage renal disease and non-traumatic lower
extremity amputations in adults.
• Each year in NYC there are more than 20,000
hospitalizations with a principal diagnosis of diabetes.
• Although the hospitalization rate for diabetes has
been stable in recent years, the increase in
prevalence reflects a growing number of newly
diagnosed, not yet hospitalized people.
• It is likely that diabetes-related hospitalizations will
increase in the coming years.
• The health care costs attributed to diabetes and
its complications are large and growing. The annual
cost of hospitalizations with a principal diagnosis
of diabetes – which reflects only a small portion
of diabetes-related costs – doubled from 1990 to
2003, reaching $481 million.
Diabetes disproportionately affects black and Latino New
Yorkers, as well as those living in low-income households
and neighborhoods. These disparities are evident in
diabetes prevalence, hospitalizations and mortality, and
track closely with patterns of overweight and obesity,
and with the related behaviors of physical inactivity and
Diabetes prevalence (%), ages 18+
Figure 1
1993-1995 1996-1998 1999-2001 2002-20040
2
4
6
8
10
ES-1
Diabetes in New York City: Public Health Burden and Disparities
The New York City Department of Health and Mental Hygiene
The prevalence of diabetes among adults more than doubled between 1993 and 2004
F I G U R E 1
Rates are age-adjusted to the year 2000 U.S. Standard Population and exclude individuals who didnot report age.Sources: CDC, Behavioral Risk Factor Surveillance System, 1993-2001; NYC Community HealthSurvey, 2002-2004
F I G U R E 2
Diabetes and obesity have their greatest impact in New York City’s poorest neighborhoods
Figure 2
Diabetes and obesity have their greatest impact in New York City’s poorest neighborhoods
Low-incomeneighborhoods*
High-incomeneighborhoods*
Low-income neighborhoodshigher by...
Overweight and obesity prevalence (%) 61 47 1.3 times
Diabetes prevalence (%) 12 6 2 times
Diabetes hospitalization (per 100,000 population) 559 200 2.8 times
Diabetes mortality (per 100,000 population) 37 16 2.3 times
* See Appendix A.Percents and rates are age-adjusted to the year 2000 U.S. Standard Population. Percents exclude individuals who did not report age.Sources: NYC Community Health Survey, 2003; Bureau of Vital Statistics, NYC DOHMH, 2003; U.S. Census 2000/NYC Department of City Planning
executive summary
unhealthy diet. However, neighborhood disparities in
diabetes mortality and hospitalization are partly, but not
completely, accounted for by differences in diabetes and
overweight/obesity prevalence (Figure 2). Neighborhood
disparities in diabetes morbidity and mortality may be
influenced by differences in diabetes severity, access
to health care or availability of healthy foods and places
to exercise.
Regular medical monitoring and patient involvement in
diabetes self-management can dramatically reduce rates
of diabetes-related morbidity and mortality. Unfortunately,
there is still a large gap between recommended health
services and current practices. For example, among NYC
adults with diabetes:
• More than one-third did not receive an eye or foot exam
in the past year
• 57% did not get a flu vaccine in the past year
• 72% have never been immunized against pneumonia
• 77% do not take aspirin regularly
• 56% have never taken a diabetes self-management class
Some good news is that the majority of adults with
diabetes report that during the past year they had a
routine checkup, had their blood pressure and cholesterol
levels checked, and were counseled on weight, nutrition
and exercise at their last doctor’s visit. However, while
4 in 5 adults with diabetes in NYC report having had at
least 1 hemoglobin A1C test in the past year, only 16%
of these adults know their A1C level. Furthermore, data
from the NYC HANES revealed that more than half of all
adults with diagnosed diabetes have hemoglobin A1C
levels of 7% or greater, indicating that their blood sugar
levels are not well controlled. In addition, most did not
have their blood pressure or cholesterol within
recommended levels.
Poorly controlled diabetes during pregnancy, whether
chronic (diagnosed before pregnancy) or gestational
(diagnosed during pregnancy), is associated with a
higher risk of poor birth outcomes. The prevalence of
diabetes during pregnancy grew 47% between 1990
and 2003, when it was present in more than 4% of all
pregnancies. Maternal obesity increases the risk of
diabetes during pregnancy.
The data in this report illustrate the magnitude of the
diabetes problem in NYC and its disproportionate impact
on low-income New Yorkers and the neighborhoods
where they live.
ES-2
Diabetes in New York City: Public Health Burden and Disparities
The New York City Department of Health and Mental Hygiene
Executive Summary
New York City, in parallel with the nation overall, is experiencing an epidemic of diabetes driven, in turn, by
another epidemic – obesity. Dramatic disparities are evident, with low-income populations, blacks and Hispanics
disproportionately affected.
Diabetes is a chronic condition characterized by high levels of blood glucose. It is caused by resistance to insulin
(a hormone that regulates levels of blood glucose), inadequate production of insulin, or both. There are 3 main types of
diabetes: type 1, type 2 and gestational. Type 1 diabetes has a peak incidence in puberty, but can develop at any age.
Type 2 diabetes usually occurs in adults aged 40 and older who have certain inherited and behavioral risk factors, such
as a family history of diabetes, or who are overweight, obese or physically inactive. However, with the rise in overweight
and obesity at young ages, type 2 diabetes is increasingly affecting adolescents. Gestational diabetes occurs during
pregnancy, when the body is less sensitive to insulin.
This report presents an overview of diabetes among New Yorkers as reflected in data from surveys, hospital discharge
records and birth and death records. The chapters are organized around the types of data presented – prevalence, risk
factors, hospitalizations, mortality, health care indicators and diabetes during pregnancy. Within the chapters, data on
time trends, demographic patterns and disparities are presented. Detailed neighborhood-specific tables and maps are
provided in Appendix B.
This report presents data on adults 18 and older, unless otherwise noted. Only statistically significant, robust findings
are discussed. Rates are age-standardized to the U.S. Standard Population 2000, unless otherwise noted, to allow
comparisons among populations within NYC, as well as to national data. For a complete description of the data used
in compiling this report, see Appendix A.
Facts and figures alone cannot capture the challenge faced by the hundreds of thousands of New Yorkers living
with diabetes. Nonetheless, these data serve to illuminate this complex problem and to guide a comprehensive
public health response.
I-1
Diabetes in New York City: Public Health Burden and Disparities
The New York City Department of Health and Mental Hygiene
The Diabetes Prevention and Control Program strives to improve the quality of care and quality of life for New Yorkers
with diabetes, and reduce the burden of diabetes, its complications, and of diabetes-related disparities in individuals, their
families and communities. The program has a 5-point plan focused on prevention, improvement of diabetes quality of care,
education, policy and advocacy, and surveillance and evaluation.
introduction
Non-Hispanic White155,000 adults
30%Non-Hispanic Black
156,000 adults31%
Hispanic143,000 adults
28%
Other19,000 adults
4%
Asian38,000 adults
7%
45-64 years old229,000 adults
46%
65+ years old195,000 adults
38%
18-24 years old7,000 adults
1% 25-44 years old76,000 adults
15%
P
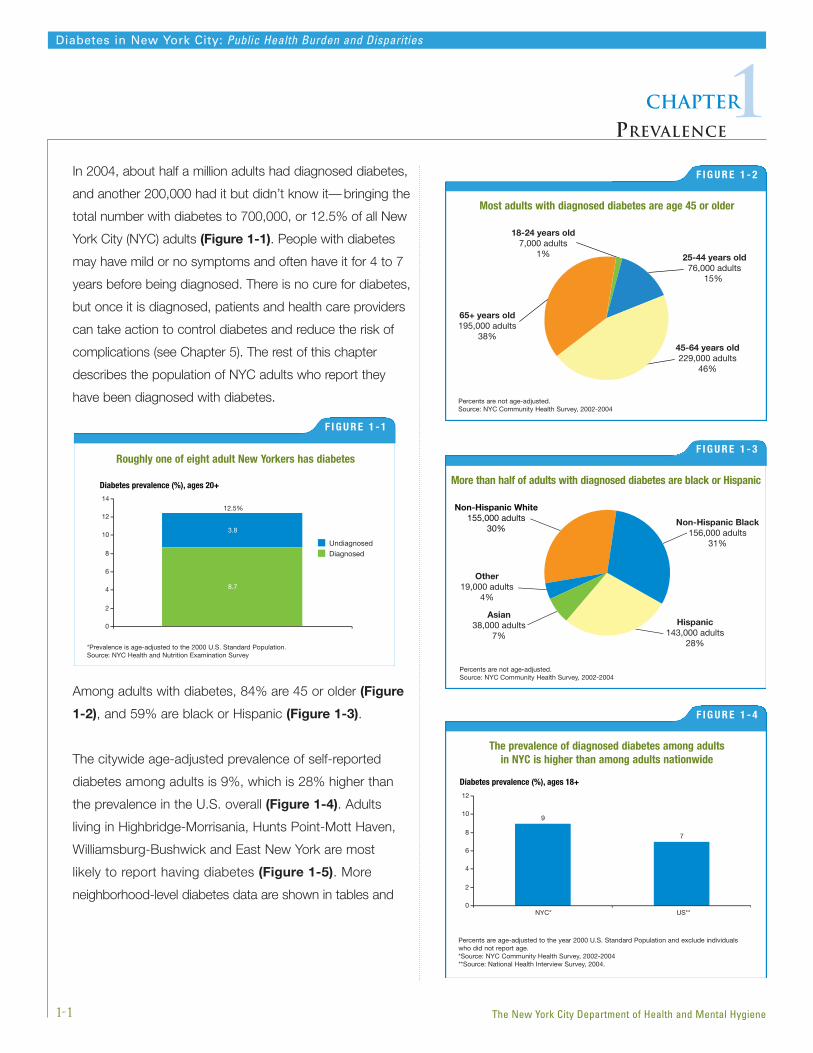
In 2004, about half a million adults had diagnosed diabetes,
and another 200,000 had it but didn’t know it— bringing the
total number with diabetes to 700,000, or 12.5% of all New
York City (NYC) adults (Figure 1-1). People with diabetes
may have mild or no symptoms and often have it for 4 to 7
years before being diagnosed. There is no cure for diabetes,
but once it is diagnosed, patients and health care providers
can take action to control diabetes and reduce the risk of
complications (see Chapter 5). The rest of this chapter
describes the population of NYC adults who report they
have been diagnosed with diabetes.
Among adults with diabetes, 84% are 45 or older (Figure
1-2), and 59% are black or Hispanic (Figure 1-3).
The citywide age-adjusted prevalence of self-reported
diabetes among adults is 9%, which is 28% higher than
the prevalence in the U.S. overall (Figure 1-4). Adults
living in Highbridge-Morrisania, Hunts Point-Mott Haven,
Williamsburg-Bushwick and East New York are most
likely to report having diabetes (Figure 1-5). More
neighborhood-level diabetes data are shown in tables and
9
0
2
4
6
8
10
1212.5%
14
UndiagnosedDiagnosed
3.8
8.7
Diabetes prevalence (%), ages 20+ More than half of adults with diagnosed diabetes are black or Hispanic
Percents are not age-adjusted.Source: NYC Community Health Survey, 2002-2004
1-1
Diabetes in New York City: Public Health Burden and Disparities
1Chapter
PREVALENCE
The New York City Department of Health and Mental Hygiene
Most adults with diagnosed diabetes are age 45 or older
F I G U R E 1 - 2
Percents are not age-adjusted.Source: NYC Community Health Survey, 2002-2004
Diabetes prevalence (%), ages 18+
NYC* US**
9
7
0
2
4
6
8
10
12
The prevalence of diagnosed diabetes among adults in NYC is higher than among adults nationwide
F I G U R E 1 - 4
Percents are age-adjusted to the year 2000 U.S. Standard Population and exclude individuals who did not report age.*Source: NYC Community Health Survey, 2002-2004**Source: National Health Interview Survey, 2004.
Roughly one of eight adult New Yorkers has diabetes
F I G U R E 1 - 1
*Prevalence is age-adjusted to the 2000 U.S. Standard Population.Source: NYC Health and Nutrition Examination Survey
F I G U R E 1 - 3
Highbridge-Morrisania
Hunts Point-Mott Haven
Williamsburg-Bushwick
East New York
3.2 - 6.97.0 - 9.69.7 - 12.913.0 - 16.9
1.7 - 3.1
Diabetes prevalence (%), ages 18+
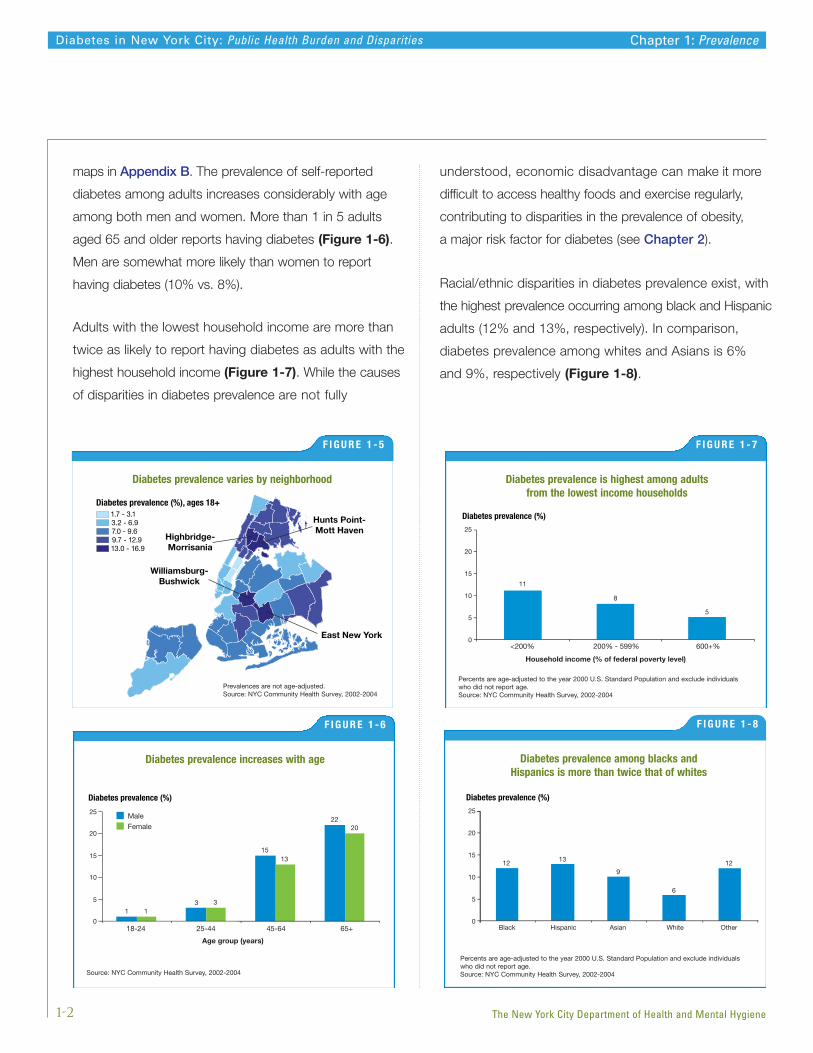
maps in Appendix B. The prevalence of self-reported
diabetes among adults increases considerably with age
among both men and women. More than 1 in 5 adults
aged 65 and older reports having diabetes (Figure 1-6).
Men are somewhat more likely than women to report
having diabetes (10% vs. 8%).
Adults with the lowest household income are more than
twice as likely to report having diabetes as adults with the
highest household income (Figure 1-7). While the causes
of disparities in diabetes prevalence are not fully
understood, economic disadvantage can make it more
difficult to access healthy foods and exercise regularly,
contributing to disparities in the prevalence of obesity,
a major risk factor for diabetes (see Chapter 2).
Racial/ethnic disparities in diabetes prevalence exist, with
the highest prevalence occurring among black and Hispanic
adults (12% and 13%, respectively). In comparison,
diabetes prevalence among whites and Asians is 6%
and 9%, respectively (Figure 1-8).
1-2
Diabetes in New York City: Public Health Burden and Disparities Chapter 1: Prevalence
The New York City Department of Health and Mental Hygiene
Diabetes prevalence (%)
Figure 1-5
13
15
22
13
13
20
0
5
10
15
20
25
18-24 25-44 45-64 65+
Age group (years)
MaleFemale
Diabetes prevalence increases with age
F I G U R E 1 - 6
Source: NYC Community Health Survey, 2002-2004
Diabetes prevalence (%)
Household income (% of federal poverty level)
11
8
5
<200% 200% - 599% 600+% 0
5
10
15
20
25
Diabetes prevalence is highest among adults from the lowest income households
F I G U R E 1 - 7
Percents are age-adjusted to the year 2000 U.S. Standard Population and exclude individuals who did not report age.Source: NYC Community Health Survey, 2002-2004
Diabetes prevalence (%)
Figure 1-7
12 13
9
6
12
Black Hispanic Asian White Other0
5
10
15
20
25
Diabetes prevalence among blacks and Hispanics is more than twice that of whites
F I G U R E 1 - 8
Percents are age-adjusted to the year 2000 U.S. Standard Population and exclude individuals who did not report age.Source: NYC Community Health Survey, 2002-2004
F I G U R E 1 - 5
Diabetes prevalence varies by neighborhood
Prevalences are not age-adjusted.Source: NYC Community Health Survey, 2002-2004

A number of studies have suggested that the risk of
diabetes varies among Asian populations, with those
of South Asian ancestry at highest risk. This pattern
appears to hold true for NYC adults born in South Asia,
among whom the prevalence of diabetes is more than 3
times higher than among those born in East Asia.1
Among adults aged 25 to 44, more than half have had
diabetes for less than 5 years. Not surprisingly, older adults
with diabetes are more likely to have had it longer, but
more than half of adults 65 and older have had diabetes
for 10 years or less (Figure 1-9). The large proportion
of recently diagnosed adults will contribute to a growing
burden of diabetes complications, which increase in
frequency over time.
Nearly half (46%) of adults with diabetes say that their
health is fair or poor, compared to 19% of adults without
diabetes. In addition, adults with diabetes are twice as likely
to report that their usual activity was limited by poor health
for at least 1 week in the past month. Adults with diabetes
were also twice as likely to report emotional distress,
compared to adults without diabetes (Figure 1-10).
1-3
Diabetes in New York City: Public Health Burden and Disparities
The New York City Department of Health and Mental Hygiene
Adults with diabetes (%), ages 25+
Figure 1-8
Age group (years)
2133
4621
28
29
58
3924
0
20
40
60
80
100
25-44 45-64 65+
Duration ofdiabetes
<5 years5-10 years>10 years
More than half of adults with diabetes have had it for 10 years or less
F I G U R E 1 - 9
Source: NYC Community Health Survey, 2002, 2004
Adults (%)
Figure 1-9
DiabetesNo Diabetes
46
34
12
1915
6
0
10
20
30
40
50
60
Report fair orpoor health*
Report limited activityfor at least 1 week**
Report emotionaldistress*
Adults with diabetes are more likely to report poor health, emotionaldistress and physical activity limitations than those without diabetes
F IGURE 1-10
Percents are age-adjusted to the year 2000 U.S. Standard Population and exclude individuals who did not report age.*Source: NYC Community Health Survey, 2002-2004**Source: NYC Community Health Survey, Spring, Fall 2003
Chapter 1: Prevalence
1 Age-adjusted diabetes prevalence among those age < 65 years was 11% for South Asians compared with 3% for East Asians. There were too fewSouth Asians surveyed who were 65 and older for inclusion in this comparison.
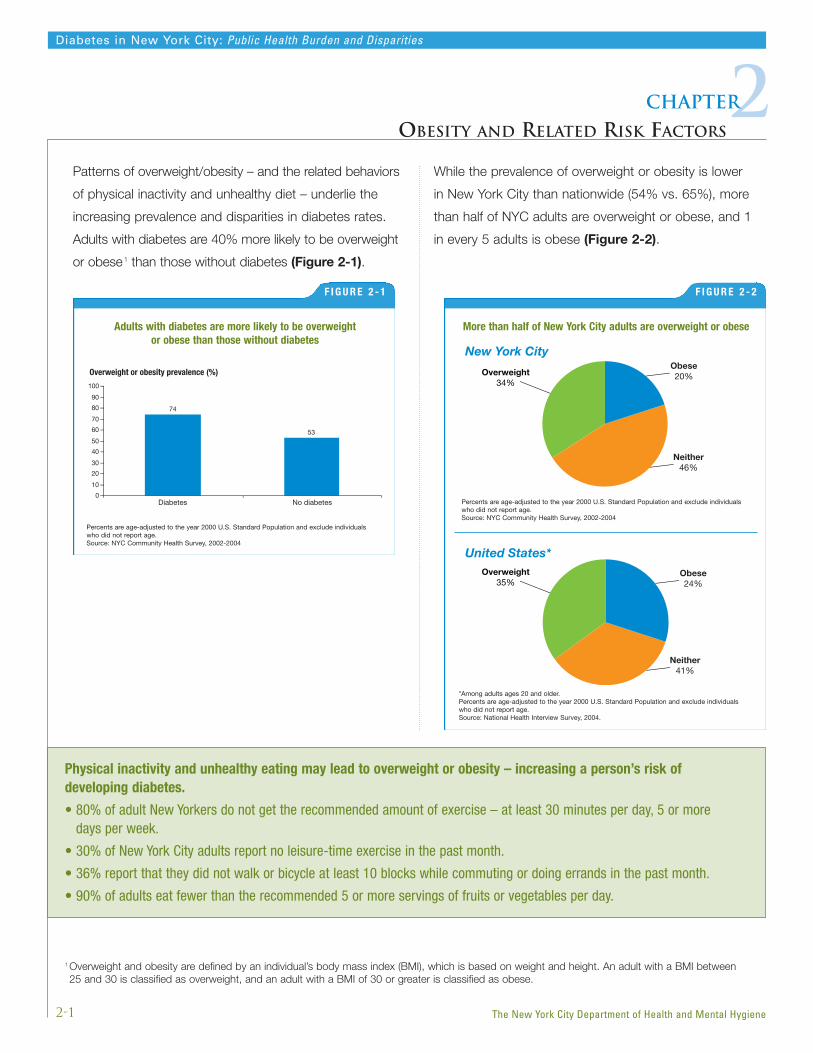
Patterns of overweight/obesity – and the related behaviors
of physical inactivity and unhealthy diet – underlie the
increasing prevalence and disparities in diabetes rates.
Adults with diabetes are 40% more likely to be overweight
or obese1 than those without diabetes (Figure 2-1).
While the prevalence of overweight or obesity is lower
in New York City than nationwide (54% vs. 65%), more
than half of NYC adults are overweight or obese, and 1
in every 5 adults is obese (Figure 2-2).
2-1
Diabetes in New York City: Public Health Burden and Disparities
2Chapter
OBESITY AND RELATED RISK FACTORS
The New York City Department of Health and Mental Hygiene
Overweight or obesity prevalence (%)
Figure 2-1
Diabetes No diabetes
74
53
0
10
20
30
40
50
60
70
80
90
100
Adults with diabetes are more likely to be overweight or obese than those without diabetes
F I G U R E 2 - 1
Percents are age-adjusted to the year 2000 U.S. Standard Population and exclude individuals who did not report age.Source: NYC Community Health Survey, 2002-2004
Figure 2-2
Overweight34%
Obese20%
Neither46%
Overweight35%
Obese24%
Neither41%
New York City
United States*
More than half of New York City adults are overweight or obese
F I G U R E 2 - 2
Percents are age-adjusted to the year 2000 U.S. Standard Population and exclude individualswho did not report age.Source: NYC Community Health Survey, 2002-2004
*Among adults ages 20 and older.Percents are age-adjusted to the year 2000 U.S. Standard Population and exclude individualswho did not report age.Source: National Health Interview Survey, 2004.
Physical inactivity and unhealthy eating may lead to overweight or obesity – increasing a person’s risk of developing diabetes.
• 80% of adult New Yorkers do not get the recommended amount of exercise – at least 30 minutes per day, 5 or more days per week.
• 30% of New York City adults report no leisure-time exercise in the past month.
• 36% report that they did not walk or bicycle at least 10 blocks while commuting or doing errands in the past month.
• 90% of adults eat fewer than the recommended 5 or more servings of fruits or vegetables per day.
1 Overweight and obesity are defined by an individual’s body mass index (BMI), which is based on weight and height. An adult with a BMI between25 and 30 is classified as overweight, and an adult with a BMI of 30 or greater is classified as obese.

Like diabetes, the prevalence of overweight or obesity
rises with age through age 64 and is greater in men
than in women (Figure 2-3). The gender difference
in overweight/obesity prevalence is driven by greater
prevalence of overweight in men, since men are less
likely than women to be obese.
Overweight or obesity is most common among adults with
the lowest household income, and prevalence decreases
with increasing income. Adults in the lowest income group
are also more likely to report having risk factors associated
with overweight or obesity – no leisure-time exercise, not
walking or biking more than 10 blocks while commuting or
doing errands and not eating the recommended servings
of fruit and vegetables per day – compared to adults in the
highest income group (Figure 2-4).
2-2
Diabetes in New York City: Public Health Burden and Disparities
The New York City Department of Health and Mental Hygiene
Overweight or obesity prevalence (%)*
Figure 2-4
5955
49
<200% 200-599% 600+%
Persons who report not exercising in past month (%)*
<200% 200-599% 600+%
Persons not walking or biking more than 10 blocks in past month (%)**
<200% 200-599% 600+%
Persons who do not eat 5 or more servings fruits or vegetables per day (%)***
<200% 200-599% 600+%
39
26
17
38 3628
9489
84
0
20
40
60
80
100
Household income (% of federal poverty level)
Percents are age-adjusted to the year 2000 U.S. Standard Population and exclud individuals who did not report age.*Source: NYC Community Health Survey, 2002-2004**Source: NYC Community Health Survey, 2003-2004***Source: NYC Community Health Survey, 2002, 2004
0
20
40
60
80
100
0
20
40
60
80
100
0
20
40
60
80
100
Overweight and obesity and their associated risk factors aremost common among adults in the lowest income group
F I G U R E 2 - 4
Percents are age-adjusted to the year 2000 U.S. Standard Population and exclude individuals whodid not report age.*Source: NYC Community Health Survey, 2002-2004**Source: NYC Community Health Survey, 2003-2004***Source: NYC Community Health Survey, 2002, 2004
Overweight or obesity prevalence (%)
Figure 2-3
40
58
6662
33
44
61 60
0
10
20
30
40
50
60
70
18-24 25-44 45-64 65+
MenWomen
Age group (years)
Men are more likely than women to be overweight or obese in every age group
F I G U R E 2 - 3
Source: NYC Community Health Survey, 2002-2004
Chapter 2: Obesity and Related Risk Factors

2-3
Diabetes in New York City: Public Health Burden and Disparities
The New York City Department of Health and Mental Hygiene
Overweight or obesity in NYC also differs by race/ethnicity.
Nearly two-thirds of black and Hispanic adults are
overweight or obese, compared to approximately half of
whites and one-third of Asians. Compared to their white
counterparts, blacks and Hispanics are also more likely
to report having risk factors associated with overweight
or obesity – no leisure-time exercise, not walking or
biking more than 10 blocks while commuting or doing
errands and not eating the recommended levels of fruit
and vegetables per day (Figure 2-5).
Overweight or obesity prevalence (%)*
Figure 2-5
Black Hispanic White Asian Other
Black Hispanic White Asian Other
Black Hispanic White Asian Other
Black Hispanic White Asian Other
Persons who report not exercising in past month (%)*
Persons not walking or biking more than 10 blocks in past month (%)**
Persons who do not eat 5 or more servings fruits or vegetables per day (%)***
Percents are age-adjusted to the year 2000 U.S. Standard Population and exclud individuals who did not report age.*Source: NYC Community Health Survey, 2002-2004**Source: NYC Community Health Survey, 2003-2004***Source: NYC Community Health Survey, 2002, 2004
64 64
49
33
52
31
41
22
3427
42 41
3039
34
93 95
8592
88
0
20
40
60
80
100
0
20
40
60
80
100
0
20
40
60
80
100
0
20
40
60
80
100
Overweight and obesity and their associated risk factors are most common among blacks and Hispanics
F I G U R E 2 - 5
Percents are age-adjusted to the year 2000 U.S. Standard Population and exclude individuals whodid not report age.*Source: NYC Community Health Survey, 2002-2004**Source: NYC Community Health Survey, 2003-2004***Source: NYC Community Health Survey, 2002, 2004
Chapter 2: Obesity and Related Risk Factors
Hospitalizations per 100,000 adults
F
0
100
200
300
400
500
600NYC population
Low income
Middle income
High income
1994 1995 1996 1997 1998 1999 2000 2001 2002 2003
Neighborhoodincome*
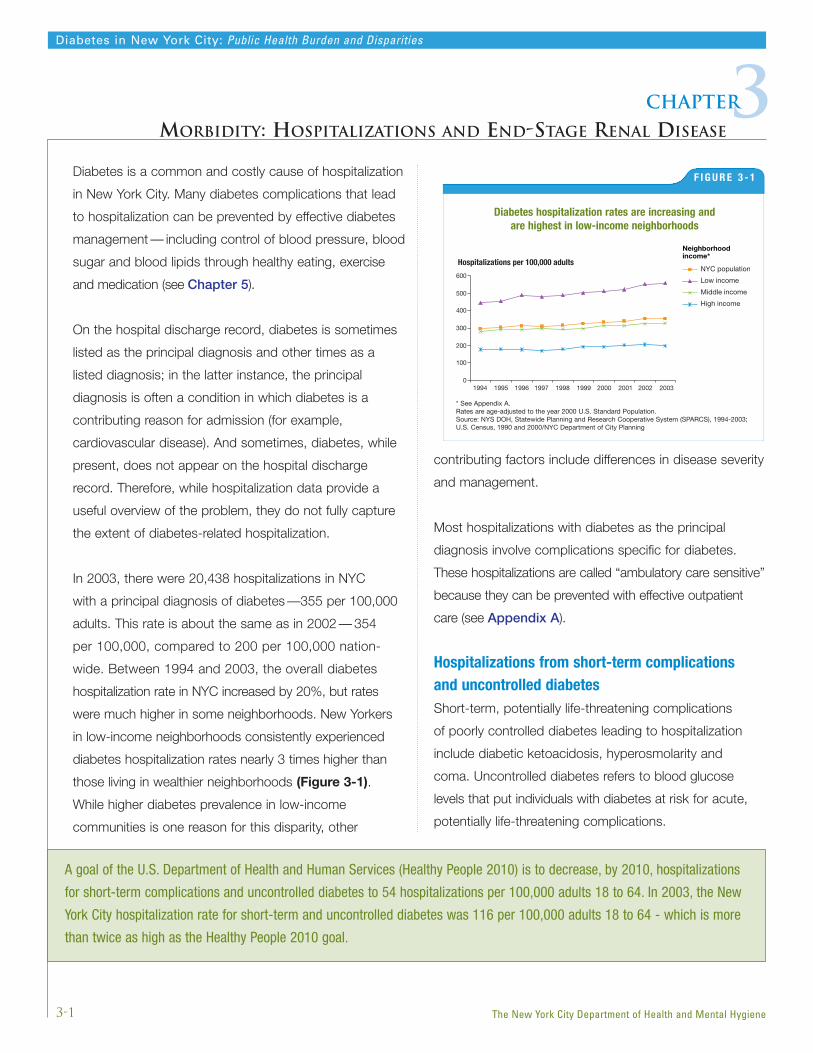
Diabetes is a common and costly cause of hospitalization
in New York City. Many diabetes complications that lead
to hospitalization can be prevented by effective diabetes
management — including control of blood pressure, blood
sugar and blood lipids through healthy eating, exercise
and medication (see Chapter 5).
On the hospital discharge record, diabetes is sometimes
listed as the principal diagnosis and other times as a
listed diagnosis; in the latter instance, the principal
diagnosis is often a condition in which diabetes is a
contributing reason for admission (for example,
cardiovascular disease). And sometimes, diabetes, while
present, does not appear on the hospital discharge
record. Therefore, while hospitalization data provide a
useful overview of the problem, they do not fully capture
the extent of diabetes-related hospitalization.
In 2003, there were 20,438 hospitalizations in NYC
with a principal diagnosis of diabetes —355 per 100,000
adults. This rate is about the same as in 2002 — 354
per 100,000, compared to 200 per 100,000 nation-
wide. Between 1994 and 2003, the overall diabetes
hospitalization rate in NYC increased by 20%, but rates
were much higher in some neighborhoods. New Yorkers
in low-income neighborhoods consistently experienced
diabetes hospitalization rates nearly 3 times higher than
those living in wealthier neighborhoods (Figure 3-1).
While higher diabetes prevalence in low-income
communities is one reason for this disparity, other
contributing factors include differences in disease severity
and management.
Most hospitalizations with diabetes as the principal
diagnosis involve complications specific for diabetes.
These hospitalizations are called “ambulatory care sensitive”
because they can be prevented with effective outpatient
care (see Appendix A).
Hospitalizations from short-term complications and uncontrolled diabetesShort-term, potentially life-threatening complications
of poorly controlled diabetes leading to hospitalization
include diabetic ketoacidosis, hyperosmolarity and
coma. Uncontrolled diabetes refers to blood glucose
levels that put individuals with diabetes at risk for acute,
potentially life-threatening complications.
3-1
Diabetes in New York City: Public Health Burden and Disparities
3Chapter
MORBIDITY: HOSPITALIZATIONS AND END-STAGE RENAL DISEASE
The New York City Department of Health and Mental Hygiene
Diabetes hospitalization rates are increasing and are highest in low-income neighborhoods
F I G U R E 3 - 1
* See Appendix A.Rates are age-adjusted to the year 2000 U.S. Standard Population.Source: NYS DOH, Statewide Planning and Research Cooperative System (SPARCS), 1994-2003;U.S. Census, 1990 and 2000/NYC Department of City Planning
A goal of the U.S. Department of Health and Human Services (Healthy People 2010) is to decrease, by 2010, hospitalizations
for short-term complications and uncontrolled diabetes to 54 hospitalizations per 100,000 adults 18 to 64. In 2003, the New
York City hospitalization rate for short-term and uncontrolled diabetes was 116 per 100,000 adults 18 to 64 - which is more
than twice as high as the Healthy People 2010 goal.

Of the 20,438 hospitalizations in 2003 with a principal
diagnosis of diabetes, 38% were a result of short-term
complications due to uncontrolled diabetes. NYC
hospitalization rates for these conditions have remained
fairly stable between 1994 and 2003, with 134
hospitalizations per 100,000 in 2003 (Figure 3-2).
Hospitalizations from long-term diabetes complicationsLong-term diabetes complications include kidney, eye,
neurological and circulatory disorders. Diabetes can also
lead to non-traumatic lower-extremity amputations (LEA)
by impairing circulation, sensation and resistance to
infection. In 2003, of the 20,438 hospitalizations with
a principal diagnosis of diabetes, 59% were a result
of long-term complications. Between 1994 and 2003,
hospitalizations for these conditions among persons with
diabetes steadily climbed from 172 per 100,000 adults
in 1994 to 212 per 100,000 adults in 2003, an increase of
23% (Figure 3-3). Since many adults in NYC have
recently-diagnosed diabetes, hospitalizations for long-
term complications will continue to rise as those New
Yorkers live with the condition over time.
Non-traumatic lower-extremity amputations A common long-term complication of diabetes is LEA,
but regular foot exams and care can prevent sores and
infections that lead to amputation. In 2003, 75% of all
LEAs occurred in adults with diabetes. Between 1994
and 2000, there was a general upward trend in diabetes-
related LEA hospitalization rates, which increased by 8%
to 53 per 100,000 population during this period. However,
rates then declined between 2000 and 2003. Since 1993,
diabetes-related LEA hospitalization rates in low-income
neighborhoods have been twice those in high-income
neighborhoods (Figure 3-4).
3-2
Diabetes in New York City: Public Health Burden and Disparities
The New York City Department of Health and Mental Hygiene
Hospitalizations per 100,000 adults
Figure 3-2
1994 1995 1996 1997 1998 1999 2000 2001 2002 20030
50
100
150
200
250
Hospitalizations for short-term diabetes complications due touncontrolled diabetes have remained stable over time
F I G U R E 3 - 2
Rates are age-adjusted to the year 2000 U.S. Standard Population.Source: NYS DOH, Statewide Planning and Research Cooperative System (SPARCS), 1994-2003;U.S. Census, 1990 and 2000/NYC Department of City Planning
Hospitalizations per 100,000 adults
Figure 3-3
Rates are age-adjusted to the year 2000 U.S. Standard Population.Source: NYS DOH, Statewide Planning and Research Cooperative System (SPARCS), 1994-2003; U.S. Census, 1990 and 2000/NYC Department of City Planning
1994 1995 1996 1997 1998 1999 2000 2001 2002 20030
50
100
150
200
250
Hospitalizations for long-term diabetes complications have increased over time
F I G U R E 3 - 3
Rates are age-adjusted to the year 2000 U.S. Standard Population.Source: NYS DOH, Statewide Planning and Research Cooperative System (SPARCS), 1994-2003;U.S. Census, 1990 and 2000/NYC Department of City Planning
Another way of expressing the LEA rate is per 1,000 persons with diabetes. In 2003, the LEA hospitalization rate was 4 per
1,000 persons with diabetes, a rate twice as high as the Healthy People 2010 goal of 1.8 per 1,000 persons with diabetes.
Chapter 3: Morbidity: Hospitalizations and End-Stage Renal Disease
Hospitalizations per 100,000 adults
Figure 3-4
1994 1995 1996 1997 1998 1999 2000 2001 2002 20030
10
20
30
40
50
60
70
80
90NYC population
Low income
Middle income
High income
Neighborhoodincome*
Hospitalizations per 100,000 adults
Figure 3-4
1994 1995 1996 1997 1998 1999 2000 2001 2002 20030
10
20
30
40
50
60
70
80
90NYC population
Low income
Middle income
High income
Neighborhoodincome*
19942003
0%
5%
10%
15%
20%
25%
30%
35%
40%
All Hospitalizations Circulatory Disorders Acute MI
13.5%
20.3%
25.7%
32.8%
29.4%
37.6%
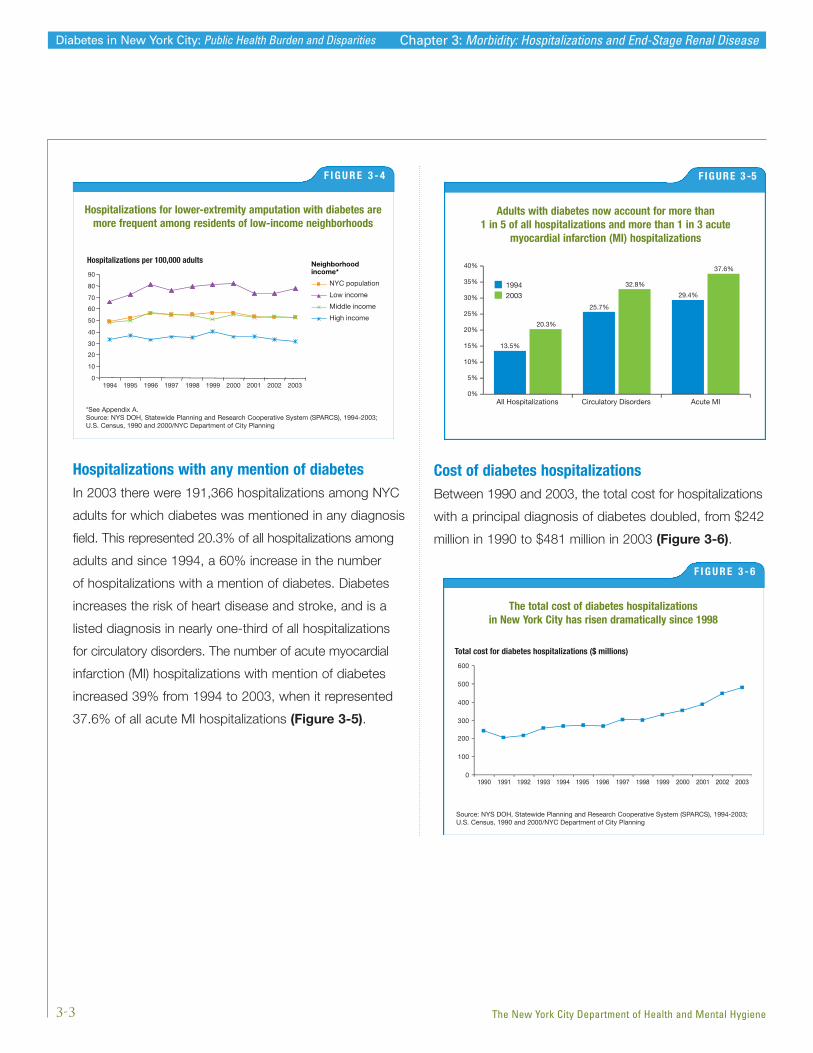
Hospitalizations with any mention of diabetesIn 2003 there were 191,366 hospitalizations among NYC
adults for which diabetes was mentioned in any diagnosis
field. This represented 20.3% of all hospitalizations among
adults and since 1994, a 60% increase in the number
of hospitalizations with a mention of diabetes. Diabetes
increases the risk of heart disease and stroke, and is a
listed diagnosis in nearly one-third of all hospitalizations
for circulatory disorders. The number of acute myocardial
infarction (MI) hospitalizations with mention of diabetes
increased 39% from 1994 to 2003, when it represented
37.6% of all acute MI hospitalizations (Figure 3-5).
Cost of diabetes hospitalizationsBetween 1990 and 2003, the total cost for hospitalizations
with a principal diagnosis of diabetes doubled, from $242
million in 1990 to $481 million in 2003 (Figure 3-6).
3-3
Diabetes in New York City: Public Health Burden and Disparities
The New York City Department of Health and Mental Hygiene
Total cost for diabetes hospitalizations ($ millions)
Figure 3-6
1990 1991 1992 1993 1994 1995 1996 1997 1998 1999 2000 2001 2002 20030
100
200
300
400
500
600
The total cost of diabetes hospitalizations in New York City has risen dramatically since 1998
F I G U R E 3 - 6
Source: NYS DOH, Statewide Planning and Research Cooperative System (SPARCS), 1994-2003;U.S. Census, 1990 and 2000/NYC Department of City Planning
Hospitalizations for lower-extremity amputation with diabetes aremore frequent among residents of low-income neighborhoods
F I G U R E 3 - 4
*See Appendix A.Source: NYS DOH, Statewide Planning and Research Cooperative System (SPARCS), 1994-2003;U.S. Census, 1990 and 2000/NYC Department of City Planning
Chapter 3: Morbidity: Hospitalizations and End-Stage Renal Disease
F IGURE 3 -5
Adults with diabetes now account for more than 1 in 5 of all hospitalizations and more than 1 in 3 acute
myocardial infarction (MI) hospitalizations
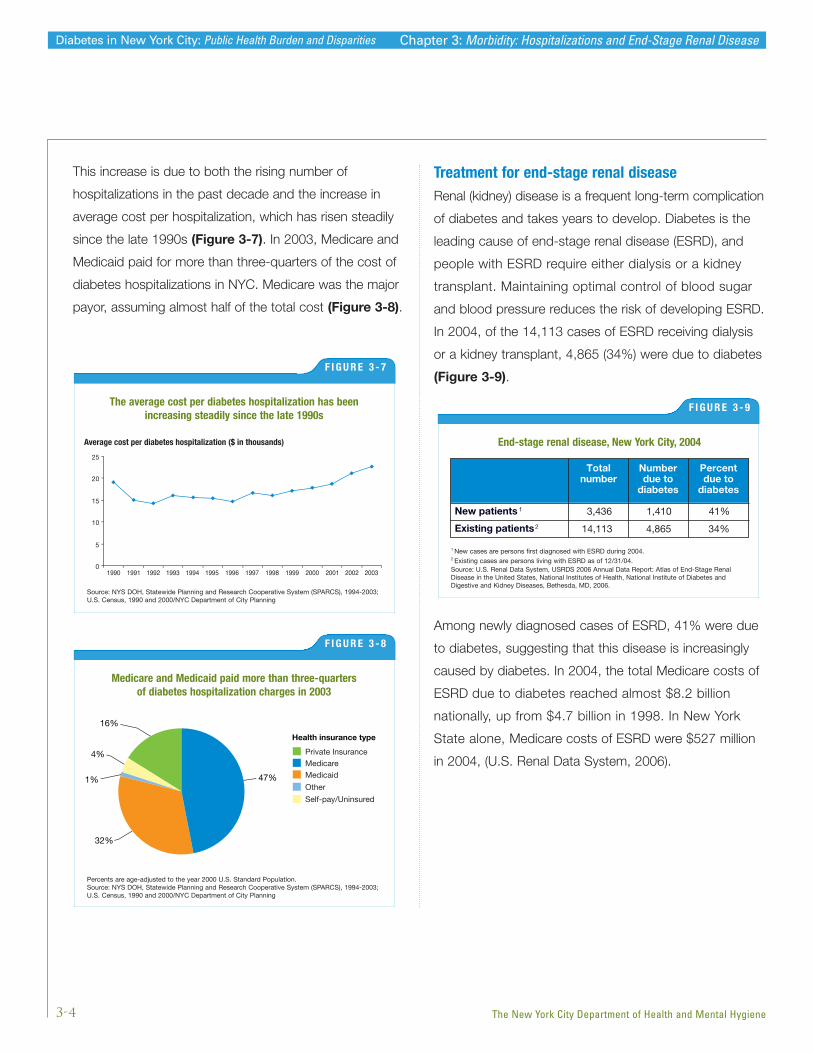
This increase is due to both the rising number of
hospitalizations in the past decade and the increase in
average cost per hospitalization, which has risen steadily
since the late 1990s (Figure 3-7). In 2003, Medicare and
Medicaid paid for more than three-quarters of the cost of
diabetes hospitalizations in NYC. Medicare was the major
payor, assuming almost half of the total cost (Figure 3-8).
Treatment for end-stage renal diseaseRenal (kidney) disease is a frequent long-term complication
of diabetes and takes years to develop. Diabetes is the
leading cause of end-stage renal disease (ESRD), and
people with ESRD require either dialysis or a kidney
transplant. Maintaining optimal control of blood sugar
and blood pressure reduces the risk of developing ESRD.
In 2004, of the 14,113 cases of ESRD receiving dialysis
or a kidney transplant, 4,865 (34%) were due to diabetes
(Figure 3-9).
Among newly diagnosed cases of ESRD, 41% were due
to diabetes, suggesting that this disease is increasingly
caused by diabetes. In 2004, the total Medicare costs of
ESRD due to diabetes reached almost $8.2 billion
nationally, up from $4.7 billion in 1998. In New York
State alone, Medicare costs of ESRD were $527 million
in 2004, (U.S. Renal Data System, 2006).
3-4
Diabetes in New York City: Public Health Burden and Disparities
The New York City Department of Health and Mental Hygiene
Figure 3-8
Rates are age-adjusted to the year 2000 U.S. Standard Population.Source: NYS DOH, Statewide Planning and Research Cooperative System (SPARCS), 1994-2003; U.S. Census, 1990 and 2000/NYC Department of City Planning
16%
4%
1% 47%
32%
Health insurance type
Private InsuranceMedicareMedicaid
Other
Self-pay/Uninsured
Medicare and Medicaid paid more than three-quarters of diabetes hospitalization charges in 2003
F I G U R E 3 - 8
Percents are age-adjusted to the year 2000 U.S. Standard Population.Source: NYS DOH, Statewide Planning and Research Cooperative System (SPARCS), 1994-2003;U.S. Census, 1990 and 2000/NYC Department of City Planning
Average cost per diabetes hospitalization ($ in thousands)
Figure 3-7
1990 1991 1992 1993 1994 1995 1996 1997 1998 1999 2000 2001 2002 20030
5
10
15
20
25
The average cost per diabetes hospitalization has been increasing steadily since the late 1990s
F I G U R E 3 - 7
Source: NYS DOH, Statewide Planning and Research Cooperative System (SPARCS), 1994-2003;U.S. Census, 1990 and 2000/NYC Department of City Planning
Chapter 3: Morbidity: Hospitalizations and End-Stage Renal Disease
Figure 3-5
Totalnumber
Numberdue to
diabetes
Percentdue to
diabetes
New patients 1 3,436 1,410 41%
Existing patients2 14,113 4,865 34%
End-stage renal disease, New York City, 2004End-stage renal disease, New York City, 2004
F I G U R E 3 - 9
1 New cases are persons first diagnosed with ESRD during 2004.2 Existing cases are persons living with ESRD as of 12/31/04.Source: U.S. Renal Data System, USRDS 2006 Annual Data Report: Atlas of End-Stage RenalDisease in the United States, National Institutes of Health, National Institute of Diabetes andDigestive and Kidney Diseases, Bethesda, MD, 2006.
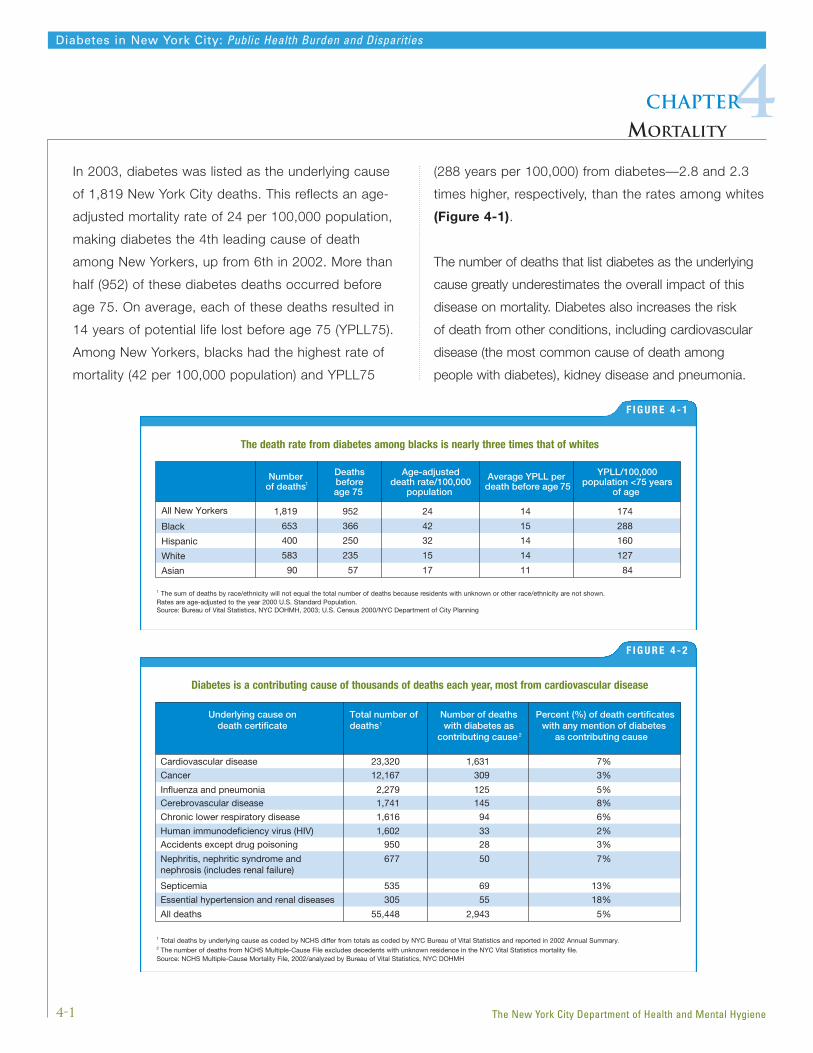
In 2003, diabetes was listed as the underlying cause
of 1,819 New York City deaths. This reflects an age-
adjusted mortality rate of 24 per 100,000 population,
making diabetes the 4th leading cause of death
among New Yorkers, up from 6th in 2002. More than
half (952) of these diabetes deaths occurred before
age 75. On average, each of these deaths resulted in
14 years of potential life lost before age 75 (YPLL75).
Among New Yorkers, blacks had the highest rate of
mortality (42 per 100,000 population) and YPLL75
(288 years per 100,000) from diabetes—2.8 and 2.3
times higher, respectively, than the rates among whites
(Figure 4-1).
The number of deaths that list diabetes as the underlying
cause greatly underestimates the overall impact of this
disease on mortality. Diabetes also increases the risk
of death from other conditions, including cardiovascular
disease (the most common cause of death among
people with diabetes), kidney disease and pneumonia.
4-1
Diabetes in New York City: Public Health Burden and Disparities
4Chapter
MORTALITY
The New York City Department of Health and Mental Hygiene
F I G U R E 4 - 1
The death rate from diabetes among blacks is nearly three times that of whites
Numberof deaths1
Deathsbeforeage 75
Age-adjusteddeath rate/100,000
population
Average YPLL per death before age 75
YPLL/100,000population <75 years
of age
All New Yorkers 1,819 24 14 174
Black 653 42 15 288
Hispanic 400 32 14 160
White 583 15 14 127
Asian 90
952
366
250
235
57 17 11 84
1 The sum of deaths by race/ethnicity will not equal the total number of deaths because residents with unknown or other race/ethnicity are not shown.Rates are age-adjusted to the year 2000 U.S. Standard Population.Source: Bureau of Vital Statistics, NYC DOHMH, 2003; U.S. Census 2000/NYC Department of City Planning
F I G U R E 4 - 2
Diabetes is a contributing cause of thousands of deaths each year, most from cardiovascular disease
Underlying cause ondeath certificate
Number of deaths with diabetes as
contributing cause 2
Percent (%) of death certificateswith any mention of diabetes
as contributing cause
Cardiovascular disease 23,320 1,631 7%
Cancer 12,167 309 3%
Influenza and pneumonia 2,279 125 5%Cerebrovascular disease 1,741 145 8%
Chronic lower respiratory disease 1,616 94 6%
Human immunodeficiency virus (HIV) 1,602 33 2%Accidents except drug poisoning 950 28 3%
Nephritis, nephritic syndrome andnephrosis (includes renal failure)
677 50 7%
Septicemia 535 69 13%
Essential hypertension and renal diseases 305 55 18%
All deaths 55,448 2,943 5%
Total number of deaths 1
1 Total deaths by underlying cause as coded by NCHS differ from totals as coded by NYC Bureau of Vital Statistics and reported in 2002 Annual Summary.2 The number of deaths from NCHS Multiple-Cause File excludes decedents with unknown residence in the NYC Vital Statistics mortality file.Source: NCHS Multiple-Cause Mortality File, 2002/analyzed by Bureau of Vital Statistics, NYC DOHMH

US
NYC
0
5
10
15
20
25
30
1990 1991 1992 1993 1994 1995 1996 1997 1998 1999 2000 2001 2002 2003
Diabetes mortality rate per 100,000 population, all ages
Diabetes mortality rate per 100,000 population, all ages
Figure 4-3
<=17 18-24 25-44 45-64 >=65
Male
Female
0
50
100
150
200
Age group (years)
In such cases, diabetes may be listed as a contributing
cause. In 2002, the most recent multiple-cause data avail-
able for NYC, diabetes was the underlying cause for 1,625
deaths and listed as a contributing cause on an additional
2,943 death certificates (NCHS, 2002) (Figure 4-2). Thus
measured, diabetes caused or contributed to 8% of NYC
deaths in 2002. This is likely to be an underestimate, as
diabetes is underreported as an underlying or contributing
cause of death nationwide. Among persons who die with
diabetes, it is estimated that only 10% to 15% of death
certificates list it as an underlying cause, and on 35% to
40% is it listed anywhere on the death certificate. (CDC,
National Diabetes Fact Sheet, 2003).
Diabetes mortality rates increase sharply with age in both
men and women. In 2003, the mortality rates among
men and women aged 65 years and older were 5 and 8
times higher, respectively, than among those aged 45 to
64 years (Figure 4-3).
In NYC, diabetes mortality rates increased by 71%
between 1990 and 2003, from 14 to 24 per 100,000
population. Historically, mortality rates have been lower
in New York City than nationwide. However, since 1994
mortality rates in the city have been approaching national
rates, and in 2003 the city and US rates were
virtually identical (Figure 4-4).
4-2
Diabetes in New York City: Public Health Burden and Disparities
The New York City Department of Health and Mental Hygiene
Diabetes mortality rates increase sharply at older ages
F I G U R E 4 - 3
Source: Bureau of Vital Statistics, NYC DOHMH, 2003; U.S. Census 2000/NYC Department of City Planning
Mortality rates due to diabetes have increased since 1990
F I G U R E 4 - 4
Rates are age-adjusted to the year 2000 U.S. Standard Population.Sources: Bureau of Vital Statistics, NYC DOHMH, 1990-2003; U.S. Census 2000/NYC Department ofCity Planning; CDC/NCHS, National Vital Statistics System, 1990-2003
Chapter 4: Mortality
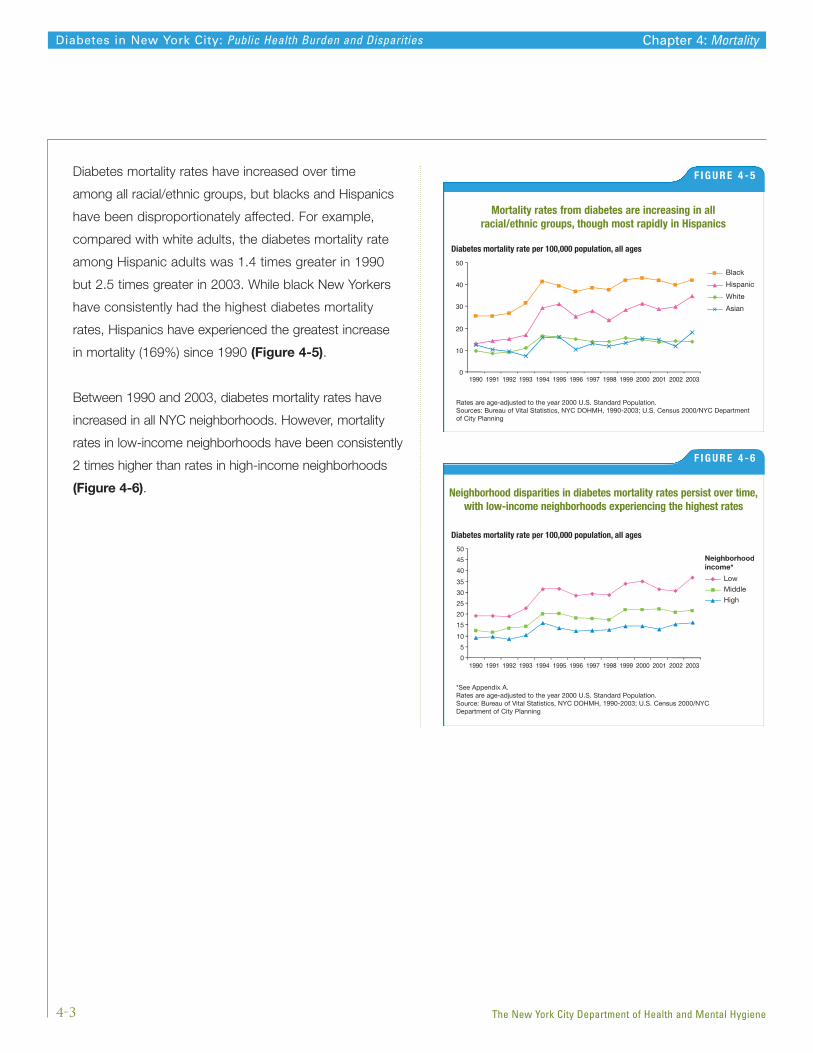
Diabetes mortality rates have increased over time
among all racial/ethnic groups, but blacks and Hispanics
have been disproportionately affected. For example,
compared with white adults, the diabetes mortality rate
among Hispanic adults was 1.4 times greater in 1990
but 2.5 times greater in 2003. While black New Yorkers
have consistently had the highest diabetes mortality
rates, Hispanics have experienced the greatest increase
in mortality (169%) since 1990 (Figure 4-5).
Between 1990 and 2003, diabetes mortality rates have
increased in all NYC neighborhoods. However, mortality
rates in low-income neighborhoods have been consistently
2 times higher than rates in high-income neighborhoods
(Figure 4-6).
4-3
Diabetes in New York City: Public Health Burden and Disparities
The New York City Department of Health and Mental Hygiene
Diabetes mortality rate per 100,000 population, all ages
Figure 4-6
Low
Neighborhoodincome*
Middle
High
1990 1991 1992 1993 1994 1995 1996 1997 1998 1999 2000 2001 2002 20030
5
10
15
20
25
30
35
40
45
50
Neighborhood disparities in diabetes mortality rates persist over time,with low-income neighborhoods experiencing the highest rates
F I G U R E 4 - 6
*See Appendix A.Rates are age-adjusted to the year 2000 U.S. Standard Population.Source: Bureau of Vital Statistics, NYC DOHMH, 1990-2003; U.S. Census 2000/NYCDepartment of City Planning
Diabetes mortality rate per 100,000 population, all ages
Figure 4-5
Black
Hispanic
White
Asian
0
10
20
30
40
50
1990 1991 1992 1993 1994 1995 1996 1997 1998 1999 2000 2001 2002 2003
Mortality rates from diabetes are increasing in all racial/ethnic groups, though most rapidly in Hispanics
F I G U R E 4 - 5
Rates are age-adjusted to the year 2000 U.S. Standard Population.Sources: Bureau of Vital Statistics, NYC DOHMH, 1990-2003; U.S. Census 2000/NYC Departmentof City Planning
Chapter 4: Mortality
Health insurance type
PrivateMedicaid/MedicareNo insurance
Other
Figure 5-2
6%
39%
43%
11%
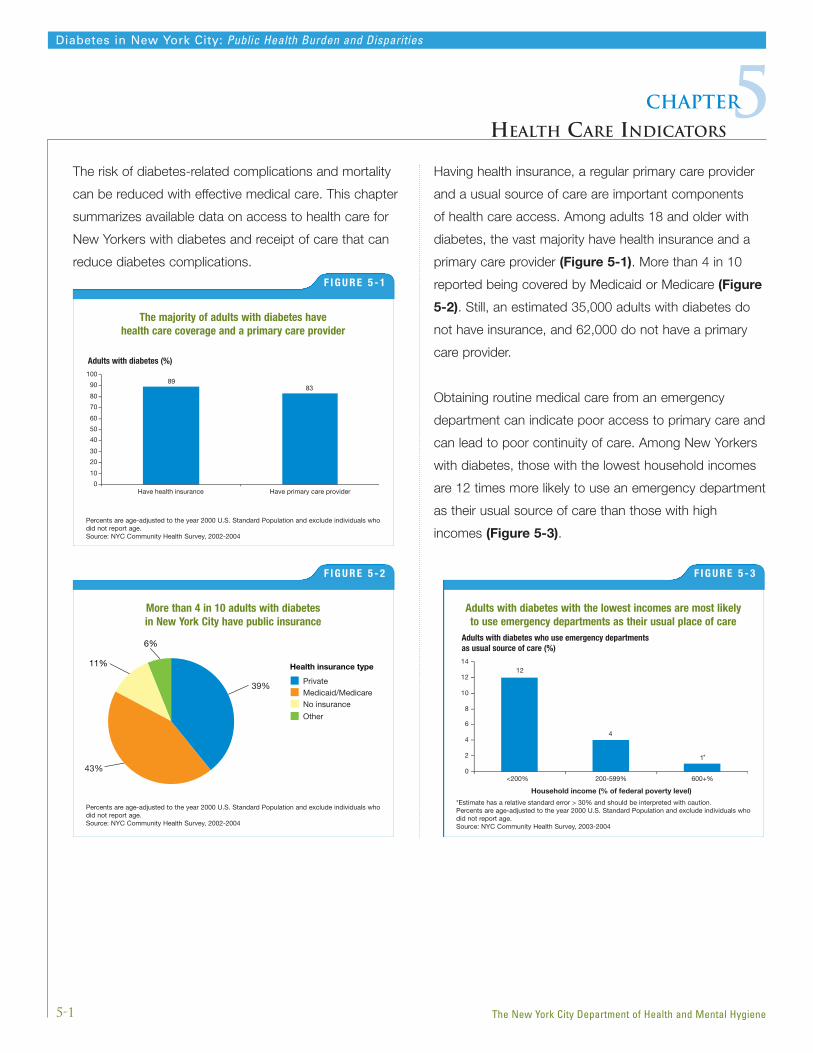
The risk of diabetes-related complications and mortality
can be reduced with effective medical care. This chapter
summarizes available data on access to health care for
New Yorkers with diabetes and receipt of care that can
reduce diabetes complications.
Having health insurance, a regular primary care provider
and a usual source of care are important components
of health care access. Among adults 18 and older with
diabetes, the vast majority have health insurance and a
primary care provider (Figure 5-1). More than 4 in 10
reported being covered by Medicaid or Medicare (Figure
5-2). Still, an estimated 35,000 adults with diabetes do
not have insurance, and 62,000 do not have a primary
care provider.
Obtaining routine medical care from an emergency
department can indicate poor access to primary care and
can lead to poor continuity of care. Among New Yorkers
with diabetes, those with the lowest household incomes
are 12 times more likely to use an emergency department
as their usual source of care than those with high
incomes (Figure 5-3).
5-1
Diabetes in New York City: Public Health Burden and Disparities
5Chapter
HEALTH CARE INDICATORS
The New York City Department of Health and Mental Hygiene
Adults with diabetes (%)
Figure 5-1
Have health insurance Have primary care provider
8983
0
10
20
30
40
50
60
70
80
90
100
The majority of adults with diabetes have health care coverage and a primary care provider
F I G U R E 5 - 1
Percents are age-adjusted to the year 2000 U.S. Standard Population and exclude individuals whodid not report age.Source: NYC Community Health Survey, 2002-2004
Adults with diabetes who use emergency departments as usual source of care (%)
Figure 5-3
<200% 200-599% 600+%
12
4
1
0
2
4
6
8
10
12
14
*
Household income (% of federal poverty level)
Adults with diabetes with the lowest incomes are most likely to use emergency departments as their usual place of care
F I G U R E 5 - 3
*Estimate has a relative standard error > 30% and should be interpreted with caution.Percents are age-adjusted to the year 2000 U.S. Standard Population and exclude individuals whodid not report age.Source: NYC Community Health Survey, 2003-2004
More than 4 in 10 adults with diabetes in New York City have public insurance
F I G U R E 5 - 2
Percents are age-adjusted to the year 2000 U.S. Standard Population and exclude individuals whodid not report age.Source: NYC Community Health Survey, 2002-2004

The majority of adults with diabetes had a checkup
in the past year and received counseling on weight,
nutrition or exercise at their last doctor’s visit. However,
only 44% have ever taken a diabetes self-management
class (Figure 5-4).
While good diabetes management involves many lifestyle
changes and health care measures, the most important
actions are described as the ABCs: controlling blood
sugar (defined as an A1C <7%), keeping Blood pressure
below 130/80, keeping the level of LDL or ‘bad’ Cholesterol
below 100, and quitting or abstaining from Smoking.
Improving control of blood glucose levels reduces the
risk of diabetes complications affecting the heart, eyes,
kidneys and nerves. A hemoglobin A1C test reflects the
average amount of glucose in the blood over the past 2
to 3 months and is recommended at least twice a year
for persons with diabetes. Four in 5 adults with diabetes
in New York City report having had at least 1 hemoglobin
A1C test in the past year, but only 16% of those reporting
a test know their A1C level. Eye and foot examinations
are also an important component of care, since those
with diabetes are vulnerable to a variety of serious
complications such as glaucoma, cataracts, retinopathy
and lower-extremity amputations. While many New
Yorkers with diabetes had an eye exam and at least
1 foot exam in the past year, more than 1 in 3 did
not receive these exams (Figure 5-5).
For people with diabetes, control of high blood pressure
and cholesterol levels to prevent cardiovascular disease
is especially important. The great majority of adults with
diabetes have had their blood pressure and cholesterol
level checked in the past year, but available data suggest
5-2
Diabetes in New York City: Public Health Burden and Disparities
The New York City Department of Health and Mental Hygiene
Adults with diabetes (%)
Figure 5-4
Had routine checkupin past 12 months
Received counseling on weight, nutrition, or exercise
at last doctor’s visit
Took diabetes management class
88
74
44
0
20
40
60
80
100
While most adults with diabetes had a routine checkup in the pastyear, fewer than half have taken a diabetes self-management class
F I G U R E 5 - 4
Percents are age-adjusted to the year 2000 U.S. Standard Population and exclude individuals whodid not report age.Source: NYC Community Health Survey, 2004
Adults with diabetes (%)
Figure 5-5
Had one or more hemoglobinA1C tests in past year*
Had eye exam in past year**
Had one or more foot exams in past year**
81
63 62
0
20
40
60
80
100
Four in 5 adults with diabetes had at least 1 hemoglobin A1Ctest in the past year, but more than 1 in 3 adults did not receive
an eye or foot exam
F I G U R E 5 - 5
Percents are age-adjusted to the year 2000 U.S. Standard Population and exclude individuals whodid not report age.*Source: NYC Community Health Survey, 2002**Source: NYC Community Health Survey, Spring, Fall 2003
Starting in January 2006, NYC DOHMH has mandated electronic laboratory reporting of hemoglobin A1C values to permit
surveillance on the extent to which A1C levels are under adequate control – see www.nyc.gov/health/diabetes.
Chapter 5: Health Care Indicators

most do not have these risk factors well controlled (see
page 5-4). Another strategy for preventing heart attacks
among adults with diabetes is regular use of aspirin.
Fewer than 1 in 4 New Yorkers with diabetes reports
taking aspirin daily or every other day (Figure 5-6).
Although people with diabetes are at increased risk of
complications or death from influenza and pneumonia,
only 43% of adults with diabetes report having had a
flu shot in the past year. Even fewer had ever received a
pneumonia shot (28%) (Figure 5-7).
Data for a subset of low-income NYC adults with
diabetes – those enrolled in Medicaid1 – indicate that the
vast majority received hemoglobin A1C tests in the past
year. However, only 57% of those tested had a recent
level of <9%, meaning that 43% had very poor control
of blood glucose levels. Similarly, while 88% of those
with diabetes had a cholesterol test in the past 2 years,
only 34% had an LDL (low-density lipoprotein, or “bad”
cholesterol) level less than 100 – the goal set in national
guidelines for those with diabetes (NHLBI, 2001). Other
diabetes care was not delivered consistently: 58% had
an eye exam in the past 2 years and 49% were screened
for kidney damage (Figure 5-8).
5-3
Diabetes in New York City: Public Health Burden and Disparities
The New York City Department of Health and Mental Hygiene
Adults with diabetes (%)
Figure 5-6
Blood pressure checkedin past year
Cholesterol testin past year
Aspirin taken daily or every other day
96 93
23
0
20
40
60
80
100
Most New Yorkers with diabetes had their blood pressureand cholesterol checked in the past year, but fewer than
1 in 4 takes aspirin regularly
F I G U R E 5 - 6
Percents are age-adjusted to the year 2000 U.S. Standard Population and exclude individuals whodid not report age.Source: NYC Community Health Survey, 2002
Adult with diabetes (%)
Figure 5-7
Had a flu shot in past year Ever had a pneumonia shot
43
28
0
20
40
60
80
100
Fewer than half of adults with diabetes had a flu shot in thepast year, and only 1 in 4 has ever had a pneumonia shot
F I G U R E 5 - 7
Percents are age-adjusted to the year 2000 U.S. Standard Population and exclude individuals whodid not report age.*Source: NYC Community Health Survey, 2002-2004
Adults with diabetes enrolled in Medicaid managed care plan (%)
Figure 5-8
83
57
88
58
34
58
49
0
20
40
60
80
100
HemoglobinA1C test inpast year
Most recenthemoglobin
A1C testindicated level
of <9%
Cholesteroltest in past
2 years
Most recentlevel of LDL
<130 mg/dL*
Most recentlevel of LDL
was controlled(LDL-C<100
mg/dL)*
Eye exam inpast 2 years
Screenedfor kidneydamage
QARR performance measures
Among Medicaid enrollees with diabetes, care is variable
F I G U R E 5 - 8
*Among persons who had a cholesterol test in past 2 years.Source: NYS DOH, Quality Assurance Reporting Requirements (QARR), 2004
1 New York State Department of Health’s Quality Assurance Reporting Requirements (QARR) consist of a set of clinical and administrative performanceindicators reported by managed care plans. For New York City adults with diabetes enrolled in Medicaid, QARR provides a way to assess the qualityof care and the extent to which diabetes is well managed.
Chapter 5: Health Care Indicators
Diagnosed DiabetesUndiagnosed Diabetes3.8
% of adults with diabetes
0
10
20
30
40
50
60
70
A1C ≥ 7% Elevated blood LDL ≥ 100 Current smoker pressure (≥ 130/80)
*A B C S
5550 50
63
22
32
65
30
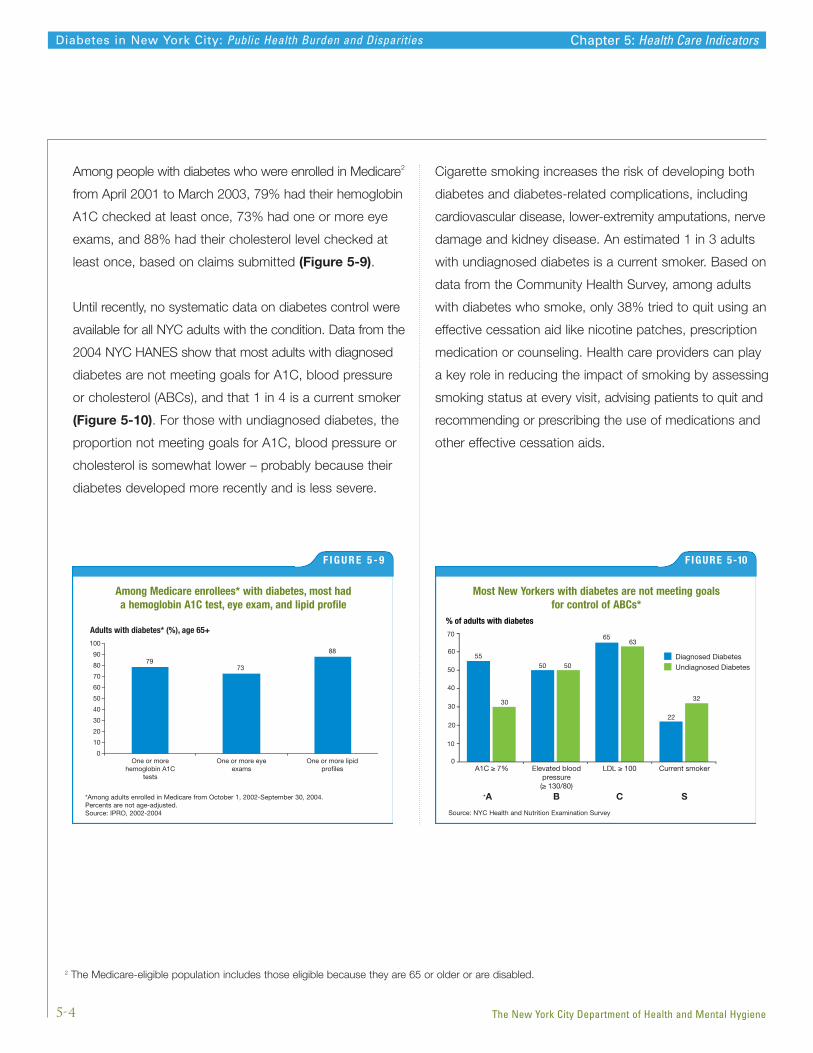
Among people with diabetes who were enrolled in Medicare2
from April 2001 to March 2003, 79% had their hemoglobin
A1C checked at least once, 73% had one or more eye
exams, and 88% had their cholesterol level checked at
least once, based on claims submitted (Figure 5-9).
Until recently, no systematic data on diabetes control were
available for all NYC adults with the condition. Data from the
2004 NYC HANES show that most adults with diagnosed
diabetes are not meeting goals for A1C, blood pressure
or cholesterol (ABCs), and that 1 in 4 is a current smoker
(Figure 5-10). For those with undiagnosed diabetes, the
proportion not meeting goals for A1C, blood pressure or
cholesterol is somewhat lower – probably because their
diabetes developed more recently and is less severe.
Cigarette smoking increases the risk of developing both
diabetes and diabetes-related complications, including
cardiovascular disease, lower-extremity amputations, nerve
damage and kidney disease. An estimated 1 in 3 adults
with undiagnosed diabetes is a current smoker. Based on
data from the Community Health Survey, among adults
with diabetes who smoke, only 38% tried to quit using an
effective cessation aid like nicotine patches, prescription
medication or counseling. Health care providers can play
a key role in reducing the impact of smoking by assessing
smoking status at every visit, advising patients to quit and
recommending or prescribing the use of medications and
other effective cessation aids.
5-4
Diabetes in New York City: Public Health Burden and Disparities
The New York City Department of Health and Mental Hygiene
Adults with diabetes* (%), age 65+
Figure 5-9
7973
88
0
10
20
30
40
50
60
70
80
90
100
One or morehemoglobin A1C
tests
One or more eyeexams
One or more lipidprofiles
Among Medicare enrollees* with diabetes, most had a hemoglobin A1C test, eye exam, and lipid profile
F I G U R E 5 - 9
*Among adults enrolled in Medicare from October 1, 2002-September 30, 2004.Percents are not age-adjusted.Source: IPRO, 2002-2004
Most New Yorkers with diabetes are not meeting goals for control of ABCs*
F IGURE 5-10
Source: NYC Health and Nutrition Examination Survey
2 The Medicare-eligible population includes those eligible because they are 65 or older or are disabled.
Chapter 5: Health Care Indicators
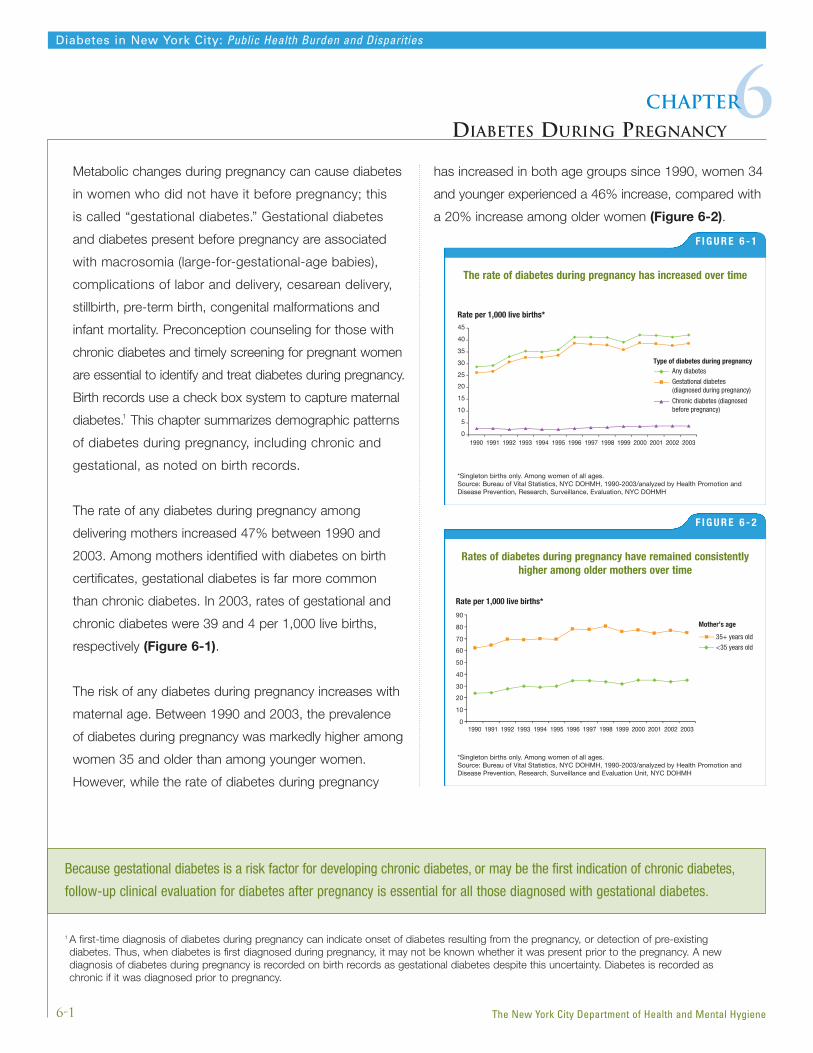
Metabolic changes during pregnancy can cause diabetes
in women who did not have it before pregnancy; this
is called “gestational diabetes.” Gestational diabetes
and diabetes present before pregnancy are associated
with macrosomia (large-for-gestational-age babies),
complications of labor and delivery, cesarean delivery,
stillbirth, pre-term birth, congenital malformations and
infant mortality. Preconception counseling for those with
chronic diabetes and timely screening for pregnant women
are essential to identify and treat diabetes during pregnancy.
Birth records use a check box system to capture maternal
diabetes.1 This chapter summarizes demographic patterns
of diabetes during pregnancy, including chronic and
gestational, as noted on birth records.
The rate of any diabetes during pregnancy among
delivering mothers increased 47% between 1990 and
2003. Among mothers identified with diabetes on birth
certificates, gestational diabetes is far more common
than chronic diabetes. In 2003, rates of gestational and
chronic diabetes were 39 and 4 per 1,000 live births,
respectively (Figure 6-1).
The risk of any diabetes during pregnancy increases with
maternal age. Between 1990 and 2003, the prevalence
of diabetes during pregnancy was markedly higher among
women 35 and older than among younger women.
However, while the rate of diabetes during pregnancy
has increased in both age groups since 1990, women 34
and younger experienced a 46% increase, compared with
a 20% increase among older women (Figure 6-2).
6-1
Diabetes in New York City: Public Health Burden and Disparities
6Chapter
DIABETES DURING PREGNANCY
The New York City Department of Health and Mental Hygiene
Rate per 1,000 live births*
Figure 6-1
1990 1991 1992 1993 1994 1995 1996 1997 1998 1999 2000 2001 2002 2003
Any diabetesType of diabetes during pregnancy
Gestational diabetes (diagnosed during pregnancy)
Chronic diabetes (diagnosed before pregnancy)
0
5
10
15
20
25
30
35
40
45
The rate of diabetes during pregnancy has increased over time
F I G U R E 6 - 1
*Singleton births only. Among women of all ages.Source: Bureau of Vital Statistics, NYC DOHMH, 1990-2003/analyzed by Health Promotion andDisease Prevention, Research, Surveillance, Evaluation, NYC DOHMH
Because gestational diabetes is a risk factor for developing chronic diabetes, or may be the first indication of chronic diabetes,
follow-up clinical evaluation for diabetes after pregnancy is essential for all those diagnosed with gestational diabetes.
1 A first-time diagnosis of diabetes during pregnancy can indicate onset of diabetes resulting from the pregnancy, or detection of pre-existing diabetes. Thus, when diabetes is first diagnosed during pregnancy, it may not be known whether it was present prior to the pregnancy. A newdiagnosis of diabetes during pregnancy is recorded on birth records as gestational diabetes despite this uncertainty. Diabetes is recorded aschronic if it was diagnosed prior to pregnancy.
Rate per 1,000 live births*
Figure 6-2
1990 1991 1992 1993 1994 1995 1996 1997 1998 1999 2000 2001 2002 20030
10
20
30
40
50
60
70
80
90Mother’s age
35+ years old
<35 years old
Rates of diabetes during pregnancy have remained consistentlyhigher among older mothers over time
F I G U R E 6 - 2
*Singleton births only. Among women of all ages.Source: Bureau of Vital Statistics, NYC DOHMH, 1990-2003/analyzed by Health Promotion andDisease Prevention, Research, Surveillance and Evaluation Unit, NYC DOHMH
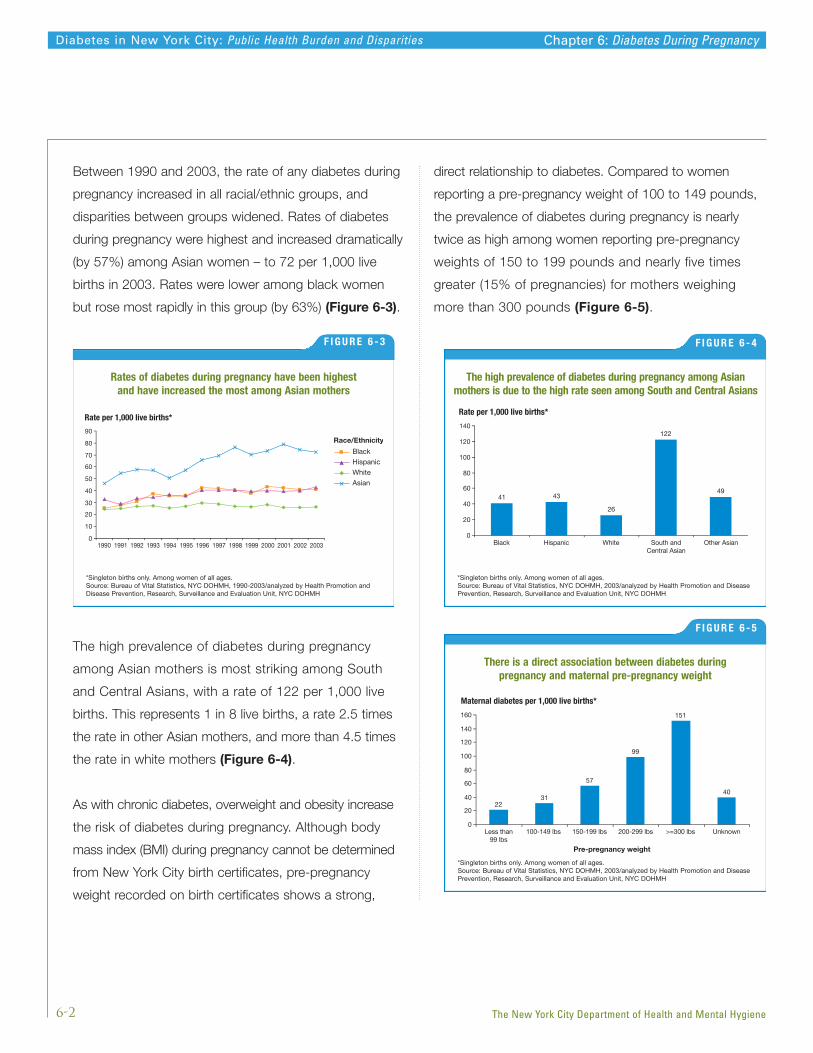
Between 1990 and 2003, the rate of any diabetes during
pregnancy increased in all racial/ethnic groups, and
disparities between groups widened. Rates of diabetes
during pregnancy were highest and increased dramatically
(by 57%) among Asian women – to 72 per 1,000 live
births in 2003. Rates were lower among black women
but rose most rapidly in this group (by 63%) (Figure 6-3).
The high prevalence of diabetes during pregnancy
among Asian mothers is most striking among South
and Central Asians, with a rate of 122 per 1,000 live
births. This represents 1 in 8 live births, a rate 2.5 times
the rate in other Asian mothers, and more than 4.5 times
the rate in white mothers (Figure 6-4).
As with chronic diabetes, overweight and obesity increase
the risk of diabetes during pregnancy. Although body
mass index (BMI) during pregnancy cannot be determined
from New York City birth certificates, pre-pregnancy
weight recorded on birth certificates shows a strong,
direct relationship to diabetes. Compared to women
reporting a pre-pregnancy weight of 100 to 149 pounds,
the prevalence of diabetes during pregnancy is nearly
twice as high among women reporting pre-pregnancy
weights of 150 to 199 pounds and nearly five times
greater (15% of pregnancies) for mothers weighing
more than 300 pounds (Figure 6-5).
6-2
Diabetes in New York City: Public Health Burden and Disparities
The New York City Department of Health and Mental Hygiene
Rate per 1,000 live births*
Figure 6-3
Black
Hispanic
White
Asian
1990 1991 1992 1993 1994 1995 1996 1997 1998 1999 2000 2001 2002 20030
10
20
30
40
50
60
70
80
90Race/Ethnicity
Rates of diabetes during pregnancy have been highest and have increased the most among Asian mothers
F I G U R E 6 - 3
*Singleton births only. Among women of all ages.Source: Bureau of Vital Statistics, NYC DOHMH, 1990-2003/analyzed by Health Promotion andDisease Prevention, Research, Surveillance and Evaluation Unit, NYC DOHMH
Rate per 1,000 live births*
Figure 6-4
Black Hispanic White South andCentral Asian
Other Asian
41 43
26
122
49
0
20
40
60
80
100
120
140
The high prevalence of diabetes during pregnancy among Asian mothers is due to the high rate seen among South and Central Asians
F I G U R E 6 - 4
*Singleton births only. Among women of all ages.Source: Bureau of Vital Statistics, NYC DOHMH, 2003/analyzed by Health Promotion and DiseasePrevention, Research, Surveillance and Evaluation Unit, NYC DOHMH
Chapter 6: Diabetes During Pregnancy
Maternal diabetes per 1,000 live births*
Figure 6-5
Less than99 lbs
100-149 lbs 150-199 lbs 200-299 lbs >=300 lbs Unknown
Pre-pregnancy weight
2231
57
99
151
40
0
20
40
60
80
100
120
140
160
There is a direct association between diabetes during pregnancy and maternal pre-pregnancy weight
F I G U R E 6 - 5
*Singleton births only. Among women of all ages.Source: Bureau of Vital Statistics, NYC DOHMH, 2003/analyzed by Health Promotion and DiseasePrevention, Research, Surveillance and Evaluation Unit, NYC DOHMH

Half of women with diabetes during pregnancy reported
a pre-pregnancy weight of 150 pounds or more, which
would be overweight (BMI>25) for a woman of average
height (5 feet, 4 inches) (Figure 6-6).
6-3
Diabetes in New York City: Public Health Burden and Disparities
The New York City Department of Health and Mental Hygiene
Figure 6-6
100-149 lbs46%
<100 lbs1%
Unknown2%
>300 lbs1%
200-299 lbs15%
150-199 lbs36%
Pre-pregnancy weight
Half of women with diabetes during pregnancy had a pre-pregnancy weight of 150 pounds or more*
F I G U R E 6 - 6
*Singleton births only. Among women of all ages.Source: Bureau of Vital Statistics, NYC DOHMH, 2003/analyzed by Health Promotion and DiseasePrevention, Research, Surveillance and Evaluation Unit, NYC DOHMH
Chapter 6: Diabetes During Pregnancy
Adult prevalence, health care indicators,risk factor dataThe New York City Community Health Survey (CHS) is a
telephone survey conducted among non-institutionalized
adults aged 18 and older. The survey is based on the
CDC Behavioral Risk Factor Surveillance System (BRFSS;
CDC, 2005). The CHS used a stratified random sample
of United Hospital Fund (UHF) neighborhoods in the city.
Households were selected at random using a random
digit dialing method. Interviews were conducted in many
languages, including Spanish.
New York City Health and Nutrition ExaminationSurvey (NYC HANES)NYC HANES was a household-based examination
survey conducted among non-institutionalized NYC adults
aged 20 and older. The survey is based on the National
Health and Nutrition Examination Survey (NHANES). NYC
HANES used a 3-stage cluster sample to achieve a
representative sample of NYC adults. Households and
participants were randomly selected from 144 city
neighborhoods. Those individuals comprising the sample
participated in a health interview and brief examination.
Interviews were conducted in English and Spanish;
interpreters were used for other languages.
Hospitalization dataThe Statewide Planning and Research Cooperative System
(SPARCS; New York State Department of Health, 2006)
data set consists of hospital discharge administrative
records for acute care hospitals in New York State.
Criteria for inclusion of SPARCS records in this fact book
included (1) a diagnosis code for diabetes (AHRQ, 2005)
and (2) residence in NYC as determined by zip code at
the time of the hospitalization.
Interpretation and presentation of the SPARCS data
present certain difficulties. The data represent numbers of
hospitalizations, not numbers of individuals hospitalized.
Since some persons with diabetes may be hospitalized
repeatedly in any given year, the numbers or rates may
overestimate the number of persons with diabetes
hospitalized.
Additionally, SPARCS data on the race and ethnicity
of individual patients are imprecise. These data are not
collected in a standardized manner across hospitals,
and large numbers of records have race listed as “other.”
Consequently, race/ethnicity-specific rates for diabetes
hospitalization could not be calculated.
We used SPARCS data to estimate ambulatory care-
sensitive hospitalizations (AHRQ, 2001) which were
identified and classified using the following ICD-9 codes:
Short-term diabetes complications and uncontrolled diabetes
250.10, 250.11, 250.12, 250.13, 250.20, 250.21, 250.22,
250.23, 250.30, 250.31, 250.32, 250.33
Long-term diabetes complications
250.40, 250.41, 250.42, 250.43, 250.50, 250.51, 250.52,
250.53, 250.60, 250.61, 250.62, 250.63, 250.70, 250.71,
250.72, 250.73, 250.80, 250.81, 250.82, 250.83, 250.90,
250.91, 250.92, 250.93
Hospital discharges that listed diabetes as a diagnosis
were used to examine discharges involving lower extremity
amputations (LEA) indicated by procedure code 84.10,
84.11, 84.12, 84.13, 84.14, 84.15, 84.16, 84.17, 84.18,
84.19. Discharges with a traumatic amputation diagnosis
code (ICD-9 codes 895.0, 895.1, 896.0, 896.1, 896.2,
896.3, 897.0, 897.1, 897.2, 897.3, 897.4, 897.5, 897.6,
897.7) were excluded.
APXA-1
Diabetes in New York City: Public Health Burden and Disparities
Aappendix
ABOUT THE DATA
The New York City Department of Health and Mental Hygiene

The LEA hospitalization rate per 1,000 persons with
diabetes in 2003 was calculated using an estimate of
the population with diabetes from the NYC Community
Health Survey.
Treatment of end-stage renal disease (ESRD)The United States Renal Data System (USRDS) is a
data system that collects and distributes national data
on end-stage renal disease (ESRD).The data reported
here have been supplied by USRDS. The interpretation
and reporting of these data are the responsibility of the
author(s) and in no way should be seen as an official
policy or interpretation of the U.S. government.
Mortality dataMortality data are based on deaths of NYC residents whose
underlying cause of death was diabetes. This categorization
is selected in accordance with rules issued by the National
Center for Health Statistics (NCHS) and codes of the
International Classification of Diseases, Tenth Revision (ICD-
10). Demographic data on death certificates are coded in
agreement with NCHS standards. Interpretation of mortality
data can be complicated because deaths with diabetes
listed as underlying cause greatly underestimate the overall
impact of diabetes on mortality. Studies have found that only
35% to 40% of persons who die with diabetes have it listed
anywhere on the death certificate (CDC, National Diabetes
Fact Sheet, 2003).
Census dataPopulation counts used as denominators for rates and
to compute weights for the Community Health Survey are
based on the year 2000 Census. Because of population
growth since 2000, hospitalization and mortality rates may
be overestimated, especially in neighborhoods where the
population has increased significantly in recent years.
Population estimates used to compute weights for the
NYC HANES were obtained from the 2004 American
Community Survey and Current Population Survey,
conducted by the Census Bureau.
Medicaid dataNew York State Department of Health’s Quality Assurance
Reporting Requirements (QARR) provided data on health
care indicators among Medicaid enrollees. QARR consist
of a set of clinical and administrative performance indicators
reported by managed care plans. For NYC adults with
diabetes who are enrolled in Medicaid, QARR provides a
way to assess the quality of care and the extent to which
diabetes is well managed.
Medicare dataData on health care indicators among Medicare enrollees
were compiled from summary claims data analyzed and
provided to NYC DOHMH by IPRO, Lake Success,
New York.
Comparison dataNational diabetes and obesity prevalence data were
based on the National Health Interview Survey 2004
(Lethbridge-Cejku et al, 2006).
Presentation of dataRates with relative standard errors (RSEs) of >30%
indicated low reliability. These rates are either not
presented or footnoted in the charts and/or tables.
These rates should be interpreted with caution.
In this report, neighborhoods are groups of zip codes
defined by the United Hospital Fund (UHF). Neighborhood
income is defined by the percent of households in the
neighborhood below 200% of the federal poverty guide-
lines and separated into thirds: low-income (45%-90%),
middle-income (30%-44%) and high-income (<30%).
APXA-2
Diabetes in New York City: Public Health Burden and Disparities
The New York City Department of Health and Mental Hygiene
Appendix A: About The Data
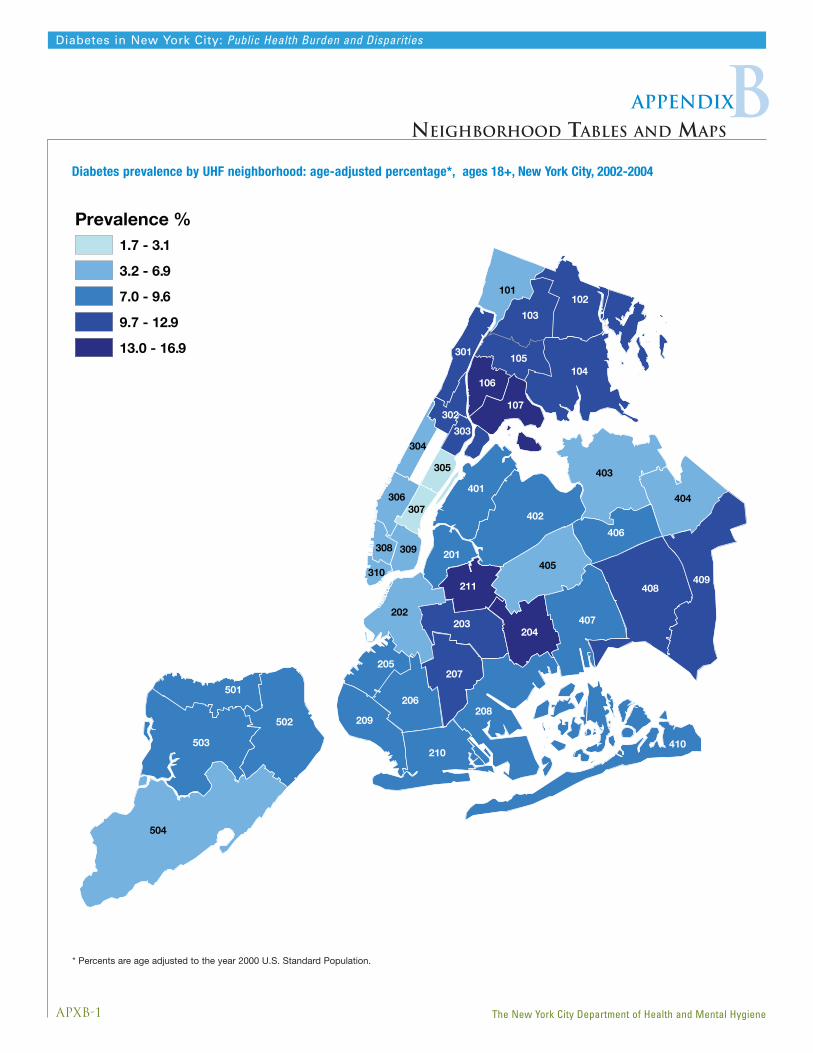
APXB-1
Diabetes in New York City: Public Health Burden and Disparities
The New York City Department of Health and Mental Hygiene
Bappendix
NEIGHBORHOOD TABLES AND MAPS
504
503
408409
208
402
403
502
104
407
405
210
404
410
202
401
102
206
207
203
406
209
204
501
103
101
211
107
105
205
201
301
106
306
309
305
308
303304
302
307
310
Prevalence %1.7 - 3.1
3.2 - 6.9
7.0 - 9.6
9.7 - 12.9
13.0 - 16.9
Diabetes prevalence by UHF neighborhood: age-adjusted percentage*, ages 18+, New York City, 2002-2004
* Percents are age adjusted to the year 2000 U.S. Standard Population.
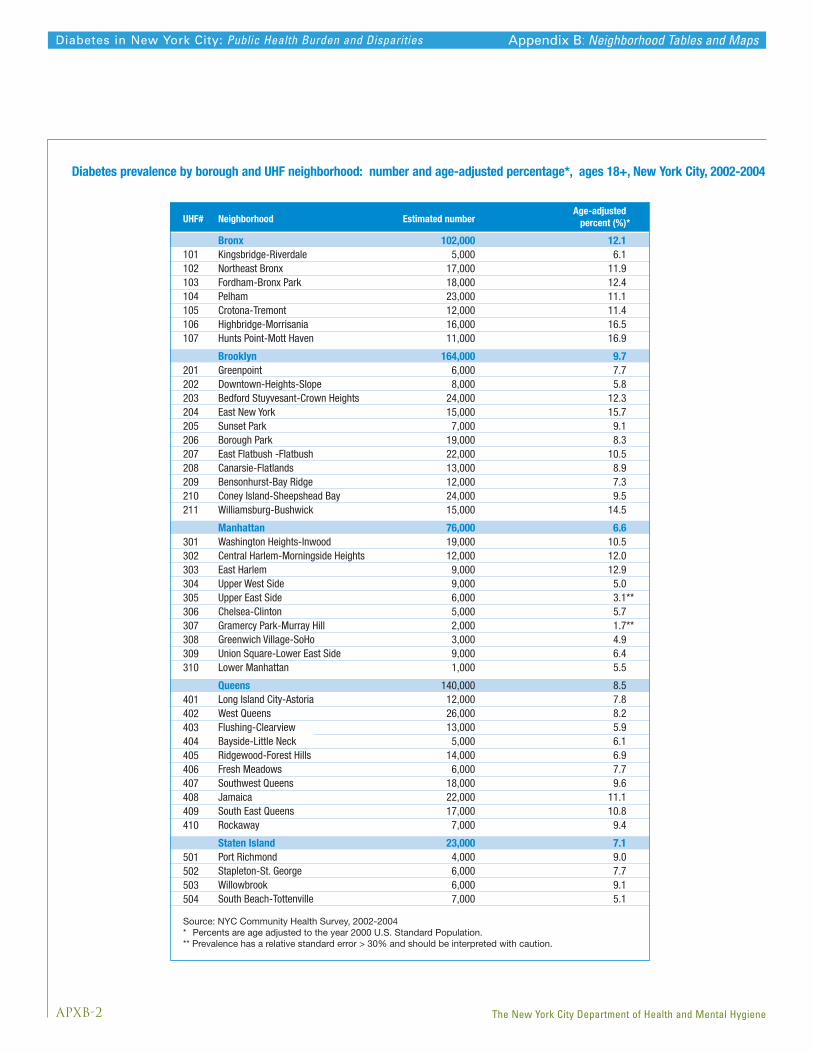
APXB-2
Diabetes in New York City: Public Health Burden and Disparities
The New York City Department of Health and Mental Hygiene
Appendix B: Neighborhood Tables and Maps
Neighborhood
Estimated number Age-adjusted
percent (%)*
Bronx 102,000 12.1Kingsbridge-Riverdale 5,000 6.1Northeast Bronx 17,000 11.9Fordham-Bronx Park 18,000 12.4Pelham 23,000 11.1Crotona-Tremont 12,000 11.4Highbridge-Morrisania 16,000 16.5Hunts Point-Mott Haven 11,000 16.9
Brooklyn 164,000 9.7Greenpoint 6,000 7.7Downtown-Heights-Slope 8,000 5.8Bedford Stuyvesant-Crown Heights 24,000 12.3East New York 15,000 15.7Sunset Park 7,000 9.1Borough Park 19,000 8.3East Flatbush -Flatbush 22,000 10.5Canarsie-Flatlands 13,000 8.9Bensonhurst-Bay Ridge 12,000 7.3Coney Island-Sheepshead Bay 24,000 9.5Williamsburg-Bushwick 15,000 14.5
Manhattan 76,000 6.6Washington Heights-Inwood 19,000 10.5Central Harlem-Morningside Heights 12,000 12.0East Harlem 9,000 12.9Upper West Side 9,000 5.0Upper East Side 6,000 3.1**Chelsea-Clinton 5,000 5.7Gramercy Park-Murray Hill 2,000 1.7**Greenwich Village-SoHo 3,000 4.9Union Square-Lower East Side 9,000 6.4Lower Manhattan 1,000 5.5
Queens 140,000 8.5Long Island City-Astoria 12,000 7.8West Queens 26,000 8.2Flushing-Clearview 13,000 5.9Bayside-Little Neck 5,000 6.1Ridgewood-Forest Hills 14,000 6.9Fresh Meadows 6,000 7.7Southwest Queens 18,000 9.6Jamaica 22,000 11.1South East Queens 17,000 10.8Rockaway 7,000 9.4
Staten Island 23,000 7.1Port Richmond 4,000 9.0Stapleton-St. George 6,000 7.7Willowbrook 6,000 9.1South Beach-Tottenville 7,000 5.1
101102103104105106107
201202203204205206207208209210211
301302303304305306307308309310
401402403404405406407408409410
501502503504
UHF#
Source: NYC Community Health Survey, 2002-2004 * Percents are age adjusted to the year 2000 U.S. Standard Population. ** Prevalence has a relative standard error > 30% and should be interpreted with caution.
Diabetes prevalence by borough and UHF neighborhood: number and age-adjusted percentage*, ages 18+, New York City, 2002-2004
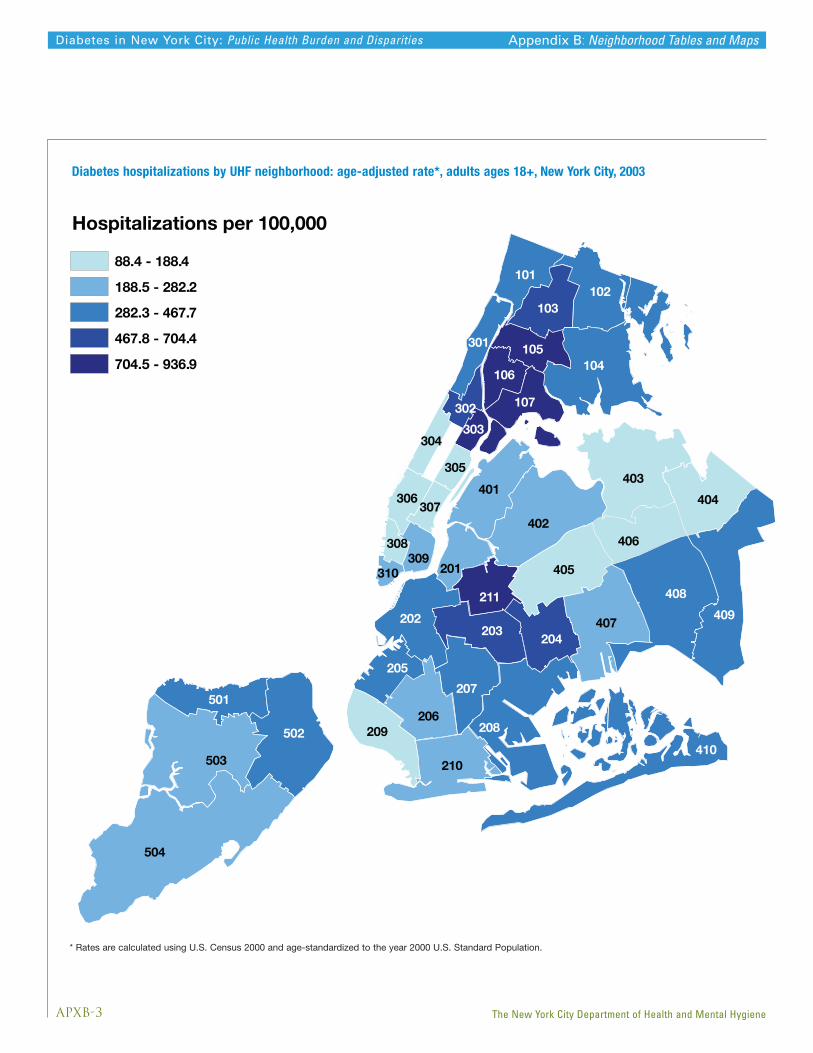
APXB-3
Diabetes in New York City: Public Health Burden and Disparities
The New York City Department of Health and Mental Hygiene
Appendix B: Neighborhood Tables and Maps
Diabetes hospitalizations by UHF neighborhood: age-adjusted rate*, adults ages 18+, New York City, 2003
* Rates are calculated using U.S. Census 2000 and age-standardized to the year 2000 U.S. Standard Population.
504
503
408
409
208
402
403
502
104
407
405
210
404
202
401
102
206
207
203
406
209
204
501
103
101
211
107
205
201
306
309
410
105301
106
304
302
307
305
308
303
310
Hospitalizations per 100,000
88.4 - 188.4
188.5 - 282.2
282.3 - 467.7
467.8 - 704.4
704.5 - 936.9

APXB-4
Diabetes in New York City: Public Health Burden and Disparities
The New York City Department of Health and Mental Hygiene
Appendix B: Neighborhood Tables and Maps
Neighborhood
101102103104105106107
201202203
204205206207208209210211
301302303304305306307308309310
401402403404405406407408409410
501502503504
UHF#
Bronx 3244 391 4870 566 45%Kingsbridge 172 214 262 329 54%Northeast Bronx 416 292 618 424 45%Fordham-Bronx Park 514 353 759 516 46%Pelham-Throgs Neck 625 309 849 406 32%Crotona-Tremont 529 555 894 863 56%Highbridge-Morrisania 592 632 930 914 45%Hunts Point-Mott Haven 394 622 558 837 35%
Brooklyn 5847 352 6962 404 15%Greenpoint 249 330 214 282 -14%Downtown-Heights-Slope 508 359 523 375 5%Bedford Stuyvesant - Crown Heights 1105 560 1390 704 26%East New York 504 551 628 652 18%Sunset Park 222 324 272 378 16%Borough Park 481 211 519 216 3%East Flatbush-Flatbush 696 347 937 468 35%Canarsie-Flatlands 380 269 501 345 28%Bensonhurst-Bay Ridge 329 197 306 178 -10%Coney Island 602 240 644 253 6%Williamsburg-Bushwick 764 705 1021 937 33%
Manhattan 3093 263 3424 290 10%Washington Heights-Inwood 595 338 748 420 24%Central Harlem 551 527 630 607 15%East Harlem 507 723 649 896 24%Upper West Side 328 181 316 175 -3%Upper East Side 142 77 166 88 15%Chelsea-Clinton 217 211 188 188 -11%Gramercy Park-Murray Hill 153 137 158 142 3%Greenwich Village-SoHo 102 158 64 103 -35%Union Square-Lower East Side 443 292 432 282 -4%Lower Manhattan 44 210 65 271 29%
Queens 3541 221 4242 254 15%Long Island City-Astoria 332 214 335 216 1%West Queens 563 191 702 223 17%Flushing-Clearview 301 145 373 169 16%Bayside-Little Neck 93 120 102 126 5%Ridgewood-Forest Hills 351 175 374 184 5%Fresh Meadows 123 169 120 155 -8%Southwest Queens 351 199 471 258 30%Jamaica 737 381 930 459 20%Southeast Queens 361 243 500 325 34%Rockaway 277 351 331 419 20%
Staten Island 768 270 940 290 7%Port Richmond 160 431 154 378 -12%Stapleton-St George 289 370 319 372 1%Willowbrook 115 200 175 262 31%South Beach-Tottenville 204 186 292 223 19%
Source: NYS DOH, Statewide Planning and Research Cooperative System, 1994-2003 (updated April 2004); * Rates are calculated using U.S. Census 1990, 2000 and age-standardized to the year 2000 U.S. Standard Population.
%changeNumber Number
2003 Age-adjusted rate/100,000*
1994 Age-adjusted rate/100,000*
Diabetes hospitalizations by borough and UHF neighborhood: number of hospitalizations and age-adjusted rate*,adults ages 18+, New York City, 1994 and 2003
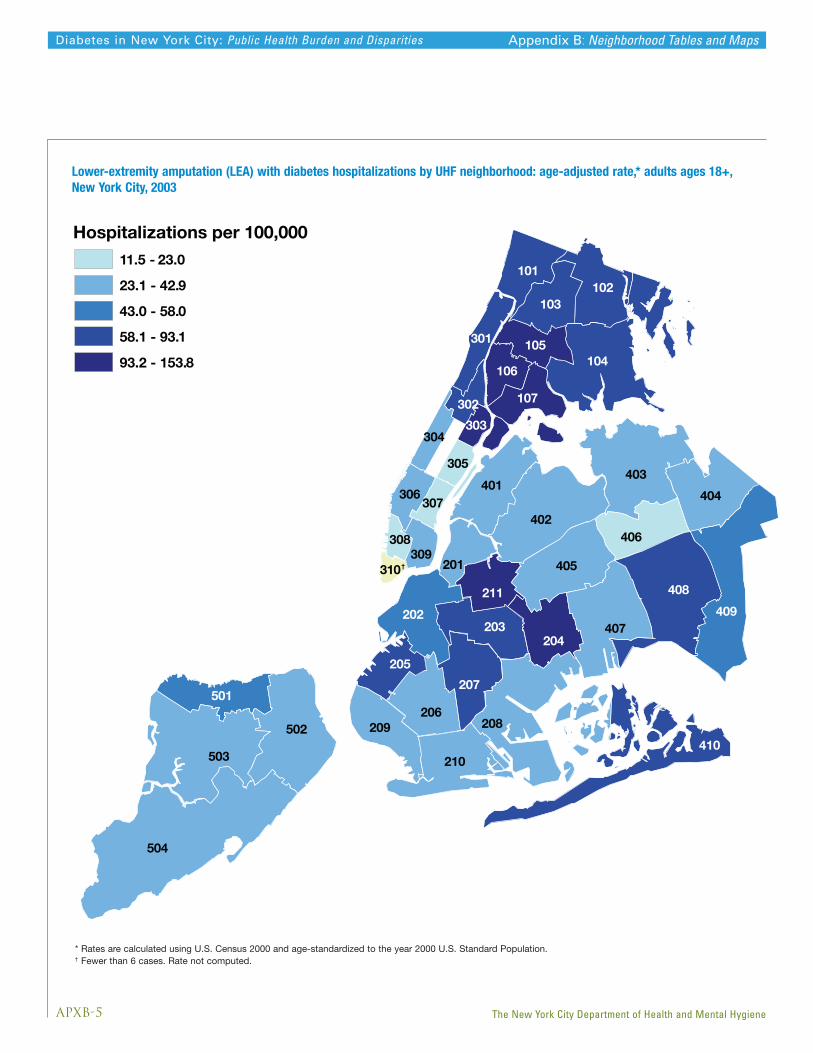
APXB-5
Diabetes in New York City: Public Health Burden and Disparities
The New York City Department of Health and Mental Hygiene
Appendix B: Neighborhood Tables and Maps
Lower-extremity amputation (LEA) with diabetes hospitalizations by UHF neighborhood: age-adjusted rate,* adults ages 18+,New York City, 2003
* Rates are calculated using U.S. Census 2000 and age-standardized to the year 2000 U.S. Standard Population.† Fewer than 6 cases. Rate not computed.
310†
504
503
408
409
208
402
403
502
104
407
405
210
404
202
401
102
206
207
203
406
209
204
501
103
101
211
107
205
201
306
309
410
105301
106
304
302
307
305
308
303
Hospitalizations per 100,000
11.5 - 23.0
23.1 - 42.9
43.0 - 58.0
58.1 - 93.1
93.2 - 153.8

APXB-6
Diabetes in New York City: Public Health Burden and Disparities
The New York City Department of Health and Mental Hygiene
101102103104105106107
201202203
204205206207208209210211
301302303304305306307308309310
401402403404405406407408409410
501502503504
UHF#
Source: NYS DOH, Statewide Planning and Research Cooperative System, 1994-2003 (updated April 2004) * Rates are calculated using U.S. Census 1990, 2000 and age-standardized to the year 2000 U.S. Standard Population. ** Cells represent <6 persons and are not reported.
Bronx 590 73.7 721 87.9 19%Kingsbridge 37 42.9 63 69.4 62%Northeast Bronx 109 74.4 118 78.7 6%Fordham-Bronx Park 95 69.7 126 93.1 34%Pelham-Throgs Neck 146 72.5 154 74.3 2%Crotona-Tremont 69 80.6 95 103.4 28%Highbridge-Morrisania 83 99.9 102 112.4 13%Hunts Point-Mott Haven 51 85.9 74 117.7 37%
Brooklyn 828 50.8 907 53.6 6%Greenpoint 27 37.9 29 38.4 1%Downtown-Heights-Slope 74 58.1 75 57.4 -1%Bedford Stuyvesant - Crown Heights 149 81.0 166 89.5 10%East New York 64 81.5 85 98.3 21%Sunset Park 18 27.5 46 68.2 148%Borough Park 90 38.3 72 30.5 -20%East Flatbush-Flatbush 88 49.2 130 69.1 40%Canarsie-Flatlands 59 41.0 58 40.0 -2%Bensonhurst-Bay Ridge 47 29.9 48 27.3 -9%Coney Island 109 40.9 90 33.1 -19%Williamsburg-Bushwick 103 104.6 108 106.4 2%
Manhattan 500 43.9 510 44.7 2%Washington Heights-Inwood 97 57.1 129 76.8 35%Central Harlem 65 62.3 74 73.8 18%East Harlem 78 115.9 108 153.8 33%Upper West Side 78 44.7 64 36.7 -18%Upper East Side 30 16.1 22 11.5 -29%Chelsea-Clinton 45 45.8 30 31.0 -32%Gramercy Park-Murray Hill 21 19.6 13 12.3 -37%Greenwich Village-SoHo 11 19.7 12 18.9 -4%Union Square-Lower East Side 66 44.1 55 36.8 -17%Lower Manhattan 6 32.4 ** ** **
Queens 620 38.8 695 42.0 8%Long Island City-Astoria 44 29.2 48 32.9 13%West Queens 86 30.3 122 40.1 32%Flushing-Clearview 69 32.9 76 33.5 2%Bayside-Little Neck 19 23.2 29 33.9 46%Ridgewood-Forest Hills 85 42.2 60 29.4 -30%Fresh Meadows 19 25.2 18 23.0 -9%Southwest Queens 60 34.7 72 39.8 15%Jamaica 116 61.4 134 67.2 9%Southeast Queens 45 30.3 72 47.0 55%Rockaway 69 83.5 63 79.6 -5%
Staten Island 128 46.2 125 38.5 -17%Port Richmond 22 60.7 23 58.0 -4%Stapleton-St George 36 46.4 36 42.9 -8%Willowbrook 30 53.5 25 36.4 -32%South Beach-Tottenville 39 36.7 41 30.9 -16%
Neighborhood %changeNumber Number
2003Age-adjustedrate/100,000
1994Age-adjustedrate/100,000
Appendix B: Neighborhood Tables and Maps
Lower-extremity amputation (LEA) with diabetes hospitalizations by borough and UHF neighborhood: number of hospitalizationsand age-adjusted rate per 100,000* adults ages 18+, New York City, 1994 and 2003

APXB-7
Diabetes in New York City: Public Health Burden and Disparities
The New York City Department of Health and Mental Hygiene
504
503
408409
208
402
403
502
104
407
405
210
404
202
401
102
206
207
203
406
209
204
501
103
101
211
107
205
201
306
309
410
105301
106
304
302
307
305
308
303
310
Deaths per 100,0007.9 - 12.4
12.5 - 19.2
19.3 - 28.1
28.2 - 40.9
41.0 - 57.6
Appendix B: Neighborhood Tables and Maps
Diabetes mortality by UHF neighborhood, age-adjusted death rate*, all ages, New York City, 2002-2003
* Rates are calculated using U.S. Census 2000 and age-standardized to the year 2000 U.S. Standard Population.
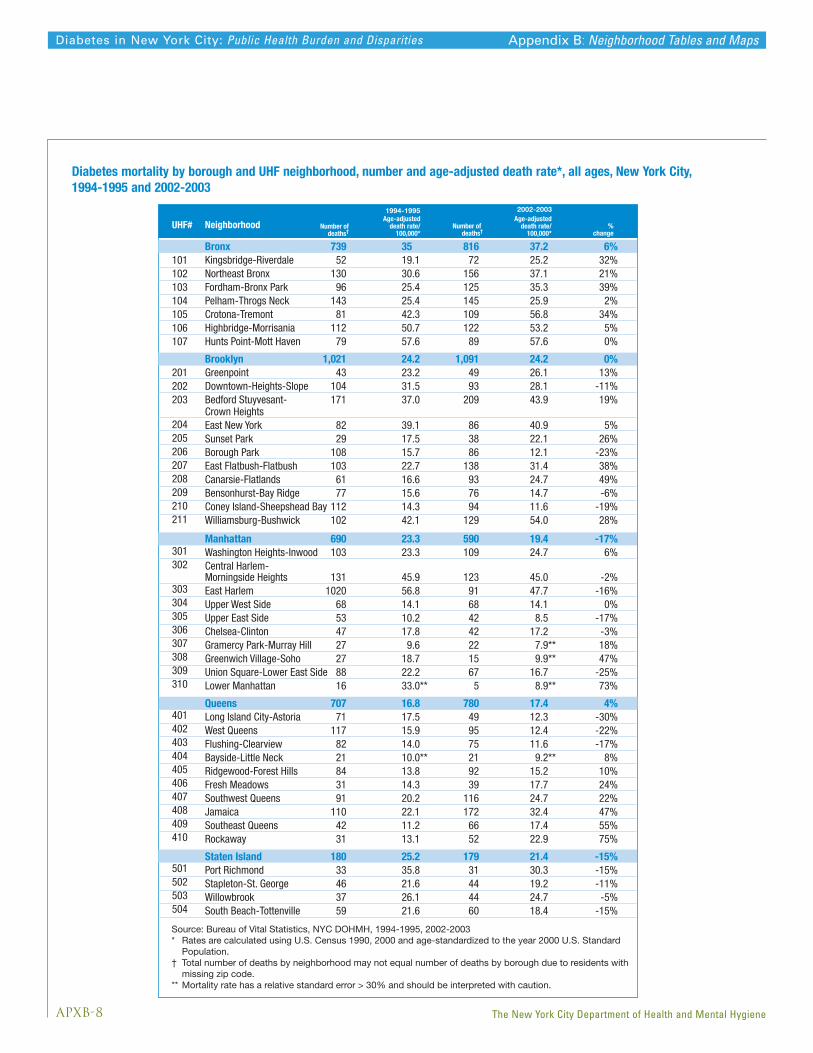
APXB-8
Diabetes in New York City: Public Health Burden and Disparities
The New York City Department of Health and Mental Hygiene
Neighborhood %change
Number ofdeaths†
Number of deaths†
2002-2003Age-adjusted
death rate/100,000*
1994-1995Age-adjusted
death rate/100,000*
Bronx 739 35 816 37.2 6%Kingsbridge-Riverdale 52 19.1 72 25.2 32%Northeast Bronx 130 30.6 156 37.1 21%Fordham-Bronx Park 96 25.4 125 35.3 39%Pelham-Throgs Neck 143 25.4 145 25.9 2%Crotona-Tremont 81 42.3 109 56.8 34%Highbridge-Morrisania 112 50.7 122 53.2 5%Hunts Point-Mott Haven 79 57.6 89 57.6 0%
Brooklyn 1,021 24.2 1,091 24.2 0%Greenpoint 43 23.2 49 26.1 13%Downtown-Heights-Slope 104 31.5 93 28.1 -11%Bedford Stuyvesant- 171 37.0 209 43.9 19%Crown Heights East New York 82 39.1 86 40.9 5%Sunset Park 29 17.5 38 22.1 26%Borough Park 108 15.7 86 12.1 -23%East Flatbush-Flatbush 103 22.7 138 31.4 38%Canarsie-Flatlands 61 16.6 93 24.7 49%Bensonhurst-Bay Ridge 77 15.6 76 14.7 -6%Coney Island-Sheepshead Bay 112 14.3 94 11.6 -19%Williamsburg-Bushwick 102 42.1 129 54.0 28%
Manhattan 690 23.3 590 19.4 -17%Washington Heights-Inwood 103 23.3 109 24.7 6%Central Harlem-Morningside Heights 131 45.9 123 45.0 -2%East Harlem 1020 56.8 91 47.7 -16%Upper West Side 68 14.1 68 14.1 0%Upper East Side 53 10.2 42 8.5 -17%Chelsea-Clinton 47 17.8 42 17.2 -3%Gramercy Park-Murray Hill 27 9.6 22 7.9** 18%Greenwich Village-Soho 27 18.7 15 9.9** 47%Union Square-Lower East Side 88 22.2 67 16.7 -25%Lower Manhattan 16 33.0** 5 8.9** 73%
Queens 707 16.8 780 17.4 4%Long Island City-Astoria 71 17.5 49 12.3 -30%West Queens 117 15.9 95 12.4 -22%Flushing-Clearview 82 14.0 75 11.6 -17%Bayside-Little Neck 21 10.0** 21 9.2** 8%Ridgewood-Forest Hills 84 13.8 92 15.2 10%Fresh Meadows 31 14.3 39 17.7 24%Southwest Queens 91 20.2 116 24.7 22%Jamaica 110 22.1 172 32.4 47%Southeast Queens 42 11.2 66 17.4 55%Rockaway 31 13.1 52 22.9 75%
Staten Island 180 25.2 179 21.4 -15%Port Richmond 33 35.8 31 30.3 -15%Stapleton-St. George 46 21.6 44 19.2 -11%Willowbrook 37 26.1 44 24.7 -5%South Beach-Tottenville 59 21.6 60 18.4 -15%
Source: Bureau of Vital Statistics, NYC DOHMH, 1994-1995, 2002-2003 * Rates are calculated using U.S. Census 1990, 2000 and age-standardized to the year 2000 U.S. Standard Population. † Total number of deaths by neighborhood may not equal number of deaths by borough due to residents with missing zip code. ** Mortality rate has a relative standard error > 30% and should be interpreted with caution.
101102103104105106107
201202203
204205206207208209210211
301302
303304305306307308309310
401402403404405406407408409410
501502503504
UHF#
Appendix B: Neighborhood Tables and Maps
Diabetes mortality by borough and UHF neighborhood, number and age-adjusted death rate*, all ages, New York City,1994-1995 and 2002-2003
REF-1
Diabetes in New York City: Public Health Burden and Disparities
referenceS
The New York City Department of Health and Mental Hygiene
1. Agency for Healthcare Research and Quality (2005). Healthcare Cost And Utilization Project (HCUP) Clinical
Classifications Software (CCS) for ICD-9-CM. Available at: www.hcup-us.ahrq.gov/toolssoftware/ccs/ccs.jsp.
Accessed May 30, 2007.
2. Agency for Healthcare Research and Quality, US Department of Health and Human Services; 2001. Agency for Healthcare
Research Quality Indicators: Guide to Prevention Quality Indicators. Rockville, Md; AHRQ Publication No. 0-R0203.
Available at: www.qualityindicators.ahrq.gov/downloads/pqi/pqi_guide_v31.pdf. Accessed May 30, 2007.
3. Centers for Disease Control and Prevention. Behavioral Risk Factor Surveillance System Operational and User’s Guide:
Version 3.0. Atlanta, GA; December 12, 2006. Available at: ftp://ftp.cdc.gov/pub/Data/Brfss/userguide.pdf.
Accessed May 30, 2007.
4. Centers for Disease Control and Prevention. National Diabetes Fact Sheet: United States, 2003. Atlanta, GA; 2003.
Available at: www.cdc.gov/diabetes/pubs/factsheet.htm. Accessed May 31, 2006.
5. Lethbridge-Çejku M, Rose D, Vickerie J. Summary Health Statistics for U.S. Adults: National Health Interview
Survey, 2004. National Center for Health Statistics. Vital Health Stat 10(228). 2006. Available at:
www.cdc.gov/nchs/data/series/sr_10/sr10_228.pdf. Accessed May 30, 2007.
6. National Center for Health Statistics. Mortality Data, Multiple Cause-of-Death Public-Use Data Files. Rockville, MD;
2006. Available at: www.cdc.gov/nchs/products/elec_prods/subject/mortmcd.htm#description1.
Accessed May 30, 2007.
7. National Heart, Lung, and Blood Institute: National Cholesterol Education Program. Third Report of the Expert Panel
on Detection, Evaluation, and Treatment of High Blood Cholesterol in Adults (Adult Treatment Panel III). National
Institutes of Health NIH Publication No. 01-3670. May 2001. Available at:
www.nhlbi.nih.gov/guidelines/cholesterol/. Accessed May 30, 2007.
8. New York State Department of Health. Statewide Planning and Research Cooperative System (SPARCS). Albany, NY;
2006. Available at: www.health.state.ny.us/statistics/sparcs/index.htm. Accessed May 30, 2007.
9. U.S. Census Bureau. American Community Survey: A Handbook for State and Local Officials. Washington, D.C.: U.S.
Census Bureau; 2004. Available at: www.census.gov/acs/www/Downloads/ACS04HSLO.pdf. Accessed May 30, 2007.
10. U.S. Census Bureau. Current Population Survey, 2004 Annual Social and Economic (ASEC) Supplement.
Washington, D.C.: U.S. Census Bureau; 2004. Available at: www.census.gov/apsd/techdoc/cps/cpsmar04.pdf.
Accessed May 30, 2007.
11. U.S. Department of Health and Human Services. Healthy People 2010: 2nd ed. With Understanding and Improving
Health and Objectives for Improving Health. 2 vols. Washington, DC: U.S. Government Printing Office, November 2000.
Available at: www.healthypeople.gov/document/html/tracking/contents.htm. Accessed May 30, 2007.
12. U.S. Renal Data System. USRDS 2006 Annual Data Report: Atlas of End-Stage Renal Disease in the United States.
Bethesda, MD; National Institutes of Health, National Institute of Diabetes and Digestive and Kidney Diseases; 2006.
Available at: www.usrds.org/adr.htm. Accessed May 30, 2007.

AcknowledgementsOur thanks to the following individuals who provided and/or analyzed data included in this report:
Donna Eisenhower, Joe Kennedy, Wen Hui Li, Cari Olson, Tejinder Singh, Xiaowu Lu, Mary Huynh,
Qun Jiang, John Jasek (NYC DOHMH Division of Epidemiology); Teri Mahotiere (IPRO).
Thanks also to Shadi Chamany, Lorna Thorpe, Lynn Silver and Bonnie Kerker for their careful
review of this report.
EditorialCortnie Lowe, Executive Editor, Bureau of Communications
Lise Millay Stevens, Senior Editor/Writer
Deborah Deitcher, Director of Communications, Division of Health Promotion and Disease Prevention