diabetes in the united kingdom: analysis of ... - … in the...diabetes in the united kingdom:...
TRANSCRIPT

http://www.qresearch.org
Diabetes in the United Kingdom: Analysis of QRESEARCH data
Authors: Professor Julia Hippisley-Cox Professor of Clinical Epidemiology and General Practice Ronan Ryan Research Fellow/Program Institution University of Nottingham Report reference number DH 12 Report version number 1.0 Final submission date August 2004 QRESEARCH Database version QRESEARCH version 3 Funding body Department of Health Web link http://www.qresearch.orgAcknowledgments QRESEARCH is a not-for-profit partnership between the University of Nottingham
and EMIS. We acknowledge the contribution of EMIS and to the practices which contribute data
Copyright © QRESEARCH 2007, all rights reserved Terms of usage These reports can be used for personal education, research, health service planning
and private study. Materials should not be further copied, photocopied or reproduced, or distributed in electronic form. Any material which is referenced should refer to QRESEARCH and the database version. Any use or distribution for commercial purposes is expressly forbidden and may constitute an infringement of the University's copyright and may lead to legal action.
© QRESEARCH 2007, all rights reserved. Any use or distribution for commercial purposes is expressly forbidden 1

http://www.qresearch.org
TABLE OF CONTENTS
1 AGREED SPECIFICATION..............................................................................................................3
2 OBJECTIVES ......................................................................................................................................3
3 METHOD FOR EPIDEMIOLOGY...................................................................................................4 3.1 Version of database ......................................................................................................................4 3.2 Case definition for diabetes mellitus ............................................................................................4 3.3 Patient eligibility criteria: ............................................................................................................4 3.4 Age standardisation: ....................................................................................................................4 3.5 Coverage ......................................................................................................................................4 3.6 Deprivation...................................................................................................................................5 3.7 Ethnicity .......................................................................................................................................5
4 RESULTS .............................................................................................................................................5 4.1 Incidence of diabetes ....................................................................................................................5
4.1.1 Incidence of diabetes by sex ....................................................................................................5 4.1.2 Incidence by age group............................................................................................................6 4.1.3 Incidence by Strategic Health Authority..................................................................................8 4.1.4 Incidence of diabetes by deprivation .......................................................................................9 4.1.5 Incidence of diabetes by ethnicity .........................................................................................10 4.1.6 Incidence of diabetes by type.................................................................................................11
4.2 Prevalence of diabetes................................................................................................................13 4.2.1 Prevalence of diabetes by sex ................................................................................................13 4.2.2 Prevalence of diabetes by age................................................................................................14 4.2.3 Prevalence of diabetes by Strategic Health Authority ...........................................................15 4.2.4 Prevalence of diabetes by deprivation ...................................................................................16 4.2.5 Prevalence of diabetes by ethnicity .......................................................................................17 4.2.6 Prevalence of diabetes by type...............................................................................................18
4.3 Mortality for diabetes .................................................................................................................21 4.3.1 Mortality rates of diabetes by sex ..........................................................................................21 4.3.2 Mortality rates of diabetes by deprivation .............................................................................23 4.3.3 Mortality rates of diabetes Strategic Health Authority ..........................................................25 4.3.4 Mortality rates by type of diabetes ........................................................................................26
5 DISCUSSION .....................................................................................................................................27
6 FUTURE WORK...............................................................................................................................28
7 REFERENCES...................................................................................................................................28
© QRESEARCH 2007, all rights reserved. Any use or distribution for commercial purposes is expressly forbidden 2

http://www.qresearch.org
1 AGREED SPECIFICATION “There is evidence for a substantial increase in the prevalence of diabetes which is more rapid than expected. This analysis will document trends in incidence, prevalence and mortality of diabetes over 10 years by five year age-sex band, by Strategic Health Authority area, by year, by quintile of Townsend and quintile of non white. This will be compared with mortality statistics. It will present the above for all patients with diabetes and for type one and type two diabetes separately. It will analyse the number (%) of patients with a body mass index recorded by age-sex, SHA, calendar year. We will present the results overall but also report on this for patients with and without diabetes. It will analyse the number (%) of patients with body mass index <25, 25-29.99, 30+ by five year age-sex bands, calendar year and SHA. We will present the results for patients also overall and also for patients with and without diabetes. It will describe the co-morbidity associated with diabetes and obesity– especially the proportion of patients with other diseases (some form the new GMS contract) such as hypertension, stroke, coronary heart disease, peripheral vascular disease and asthma. Results will be compared with published literature.”
2 OBJECTIVES
To describe 10 year trends in incidence, prevalence and mortality of diabetes and obesity by age, sex, SHA, deprivation and ethnicity
© QRESEARCH 2007, all rights reserved. Any use or distribution for commercial purposes is expressly forbidden 3

http://www.qresearch.org
3 METHOD FOR EPIDEMIOLOGY
3.1 Version of database This analysis has been conducted using the QRESEARCH National database (v3), covering approx 240 practices, 4 million patients, downloaded 10th May 2004.
3.2 Case definition for diabetes mellitus
Prevalent cases of diabetes mellitus are defined by the presence of a C10% code or more than 2 prescriptions for insulin or an oral antidiabetic in their record prior to the end of the analysis period. If the first such use of a C10% code or the first prescription is in the analysis year, then the person is also defined as an incident case.
Type 1 diabetes: age <= 35 at diagnosis and evidence of treatment with insulin,
including devices.
3.3 Patient eligibility criteria: must be in a practice that used EMIS for two years prior to the analysis year to be
included in the incidence, prevalence and BMI analyses. must be registered on 1 Jan in the analysis year and for the previous 6 months to
be included in the incidence analysis. must be registered on 1 Jan in the analysis year and for the previous 6 months to
be included in the prevalence analysis. must be registered in practice on Jan 1 in the analysis year and for the previous 6
months to be included in BMI analysis.
3.4 Age standardisation: direct age-standardisation in 5-year age groups, from age 0-4 years to ages 90 and
over, using one of the two standard populations below. prevalence: UK Census 2001 population UK population 2001 incidence: estimated number of people without diabetes mellitus in the UK in
2003. This was created using the age-specific prevalence of diabetes in 2003 and the UK Census 2001 population.
3.5 Coverage England, Wales, Scotland [Note transient connectivity problems in NI]
© QRESEARCH 2007, all rights reserved. Any use or distribution for commercial purposes is expressly forbidden 4

http://www.qresearch.org
3.6 Deprivation measured using quintile of Townsend score for output area (based on 2001
Census).
3.7 Ethnicity measured using quintile of non-white population for output area.
4 RESULTS
4.1 Incidence of diabetes 4.1.1 Incidence of diabetes by sex Chart one shows trends in the age standardized incidence of both types of diabetes per 1000 person years between 1994 and 2003. Overall, there were 29371 new cases of diabetes recorded over the ten year study period arising from 10.9 million person years of observation. This gives an overall crude incidence rate of 2.69 per 1000 person years. There was a steady increase in age standardised incidence from 1.82 cases per 1000 person years in 1994 to 3.31 cases per 1000 person years in 2003. The absolute age standardized incidence rates were higher in men than women in all years but the trend was similar in both sexes. Chart one: age standardized incidence of all diabetes per 1000 pyr
© QRESEARCH 2007, all rights reserved. Any use or distribution for commercial purposes is expressly forbidden 5

http://www.qresearch.org
0
0.5
1
1.5
2
2.5
3
3.5
4
1994 1995 1996 1997 1998 1999 2000 2001 2002 2003
BFM
Age standardised incidence rate of diabetes per 1000 pyr
Year
Sex
4.1.2 Incidence by age group Chart two shows the incidence of diabetes by age from 1994 to 2003. The greatest increase has occurred in patients over the age of 60. In 1994 the incidence of diabetes was 5.20 per 1000 person years in patients aged 65 to 69 years; in 2003 it had doubled to 10.66 per 1000 person years Chart two: incidence of diabetes by age
© QRESEARCH 2007, all rights reserved. Any use or distribution for commercial purposes is expressly forbidden 6

http://www.qresearch.org
0.00
2.00
4.00
6.00
8.00
10.00
12.00
0 to 4 years
5 to 9 years
10 to 14 years
15 to 19 years
20 to 24 years
25 to 29 years
30 to 34 years
35 to 39 years
40 to 44 years
45 to 49 years
50 to 54 years
55 to 59 years
60 to 64 years
65 to 69 years
70 to 74 years
75 to 79 years
80 to 84 years
85 to 89 years
90 and over
19941996199820012003
Sex B
Incidence Rate diabetes per 1000 pyr by age
Age group
Year
© QRESEARCH 2007, all rights reserved. Any use or distribution for commercial purposes is expressly forbidden 7

http://www.qresearch.org
4.1.3 Incidence by Strategic Health Authority Chart 3 shows variations in incidence by Strategic Health Authority in 2003 [full years are available in the Excel workbook]. In 2003, the highest incidence of diabetes was in Trent where the rate was 4.97 per 1000 person years and the lowest was in North West London where the rate was less than half this at 2.05 per 1000 person years.
© QRESEARCH 2007, all rights reserved. Any use or distribution for commercial purposes is expressly forbidden 8

http://www.qresearch.org
4.1.4 Incidence of diabetes by deprivation Chart 4 shows the variation in incidence of diabetes by quintile of deprivation (where quintile 5 is most deprived and quintile 1 is the most affluent). In all years, the incidence of diabetes was higher in areas of high deprivation. In 2003, the incidence of diabetes in the most deprived areas was 4.03 per 1000 person years compared with 2.76 per 1000 person years in affluent areas. Chart 4 – incidence of diabetes per 1000 person years by deprivation
0
0.5
1
1.5
2
2.5
3
3.5
4
4.5
1996 1997 1998 1999 2000 2001 2002 2003
Q1Q2Q3Q4Q5
Age standardised incidence rate per 1000 pyr by deprivation
Year
Quintile (1=least deprived, 5=most
© QRESEARCH 2007, all rights reserved. Any use or distribution for commercial purposes is expressly forbidden 9
http://www.qresearch.org
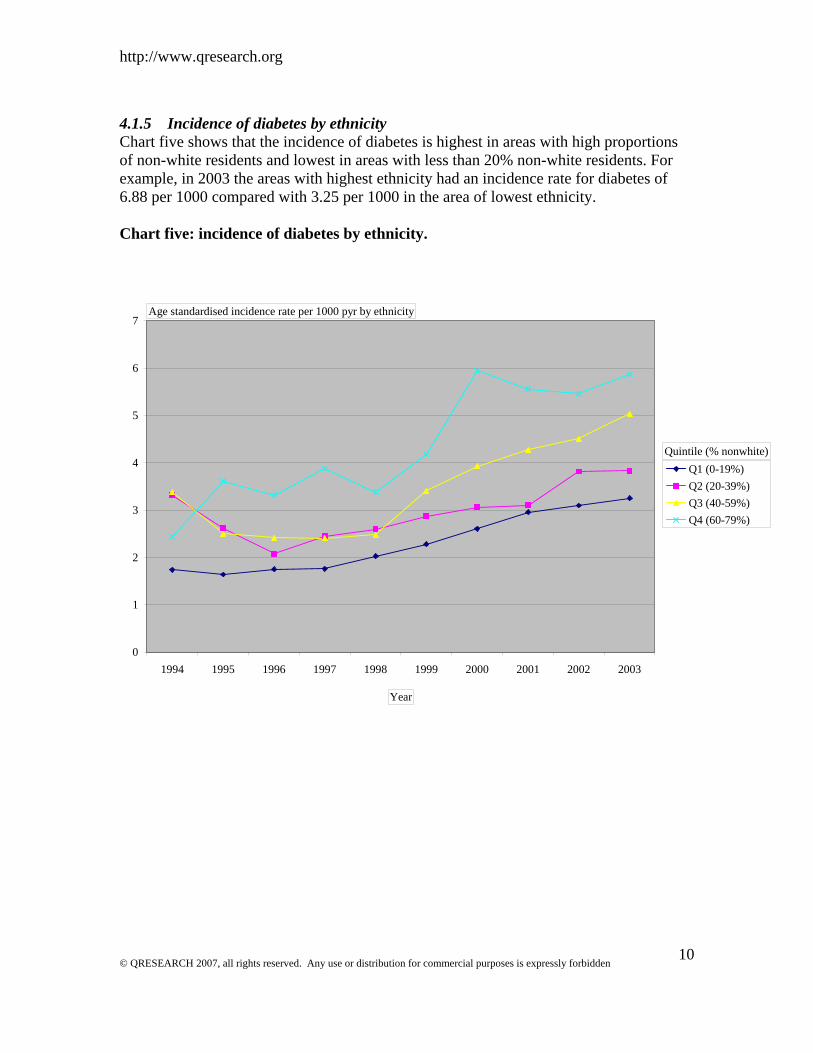
4.1.5 Incidence of diabetes by ethnicity Chart five shows that the incidence of diabetes is highest in areas with high proportions of non-white residents and lowest in areas with less than 20% non-white residents. For example, in 2003 the areas with highest ethnicity had an incidence rate for diabetes of 6.88 per 1000 compared with 3.25 per 1000 in the area of lowest ethnicity. Chart five: incidence of diabetes by ethnicity.
0
1
2
3
4
5
6
7
1994 1995 1996 1997 1998 1999 2000 2001 2002 2003
Q1 (0-19%)Q2 (20-39%)Q3 (40-59%)Q4 (60-79%)
Age standardised incidence rate per 1000 pyr by ethnicity
Year
Quintile (% nonwhite)
© QRESEARCH 2007, all rights reserved. Any use or distribution for commercial purposes is expressly forbidden 10

http://www.qresearch.org
4.1.6 Incidence of diabetes by type
4.1.6.1 Incidence of type one diabetes This shows only a modest increase in incidence of type one diabetes over the last ten years from 0.10 per 1000 in 1996 to 0.12 in 2003. The absolute numbers of patients with type one diabetes is low which creates some background noise in the rates especially at the beginning of the ten year period. Chart 6a: Age standardized incidence of type one diabetes
0
0.02
0.04
0.06
0.08
0.1
0.12
0.14
1996 1997 1998 1999 2000 2001 2002 2003
FM
Age standardised rate Type 1 diabetes per 1000 pyr
Year
Sex
Comparison with other studies
© QRESEARCH 2007, all rights reserved. Any use or distribution for commercial purposes is expressly forbidden 11
Table 1.7 gives the full details on incidence of diabetes mellitus by age, sex and type for each calendar year. Our figures compare well with the incidence of type one diabetes in children with a study conducted in Oxford between 1987 and 19951 which showed an

http://www.qresearch.org
incidence in children aged 0 to 4 of 0.13 per 1000 and with another study in 1992 which reported an incidence of 0.93 per 10002.
4.1.6.2 Incidence of type two diabetes Chart 6b shows trends in type two diabetes over the last ten years. The increase in incidence of type 2 diabetes is more marked than with type one diabetes and has increased from 1.64 per 1000 in 1994 to 3.07 per 1000 in 2003. In each year, the incidence of type two diabetes was marginally higher in males than in females (3.34 per 1000 person years in men compared with 2.82 per 1000 person years in women). .
0
0.5
1
1.5
2
2.5
3
3.5
4
1994 1995 1996 1997 1998 1999 2000 2001 2002 2003
BFM
Age standardised rate Type 2 diabetes per 1000 pyr
Year
Sex
Our results compare well with other studies conducted in the US which have shown an doubling or tripling of the incidence of type two diabetes over the last ten years despite adjustments for ethnicity, sex and age3. Our reported age standardized incidence of type two diabetes in men (3.49 per 1000) is similar to that reported in US male physicians aged 40-85 (2.81 per 1000)4.
© QRESEARCH 2007, all rights reserved. Any use or distribution for commercial purposes is expressly forbidden 12

http://www.qresearch.org
4.2 Prevalence of diabetes Given that health care utilization depends mainly on the number of existing patients with diabetes in any given year, the next section gives details on prevalence of diabetes. It follows the same pattern as the last section giving information on prevalence over time by sex, age, geographical area, deprivation, ethnicity and type of diabetes. 4.2.1 Prevalence of diabetes by sex The age standardised prevalence of recorded diabetes is approximately ten times the incidence rate and has risen consistently over the past ten years from 16.2 per 1000 person years in 1994 to 20.3 per 1000 person years in 1998 to 28.7 per 1000 person years in 2003. The age standardized prevalence is higher in men than women in each year. Chart 11:age standardized prevalence of diabetes
0
5
10
15
20
25
30
35
1994 1995 1996 1997 1998 1999 2000 2001 2002 2003
BFM
Age standardised prevalence of diabetes per 1000 persons
Year
Sex
© QRESEARCH 2007, all rights reserved. Any use or distribution for commercial purposes is expressly forbidden 13
Our figures are comparable to other reports. The prevalence rates derived from the General Practice research Database was 18.9 per 1000 person years in 1994 and 22.3 per 1000 person years in 19985; the RCGP weekly return service reported a prevalence of 16 per 1000 in 1993 in its network of 60 practices6 and a study of 17 practices in London reported a prevalence of 2.54 in 20037.

http://www.qresearch.org
4.2.2 Prevalence of diabetes by age This chart shows that the prevalence of diabetes rises very steeply with age and that the highest prevalence occurred in 2003. Prevalence has risen in all age groups and by 2003, 10% of patients aged 70-79 have a diagnosis of diabetes. Chart 12: prevalence of diabetes by age
0
20
40
60
80
100
120
0 to
4 y
ears
5 to
9 y
ears
10 to
14
year
s
15 to
19
year
s
20 to
24
year
s
25 to
29
year
s
30 to
34
year
s
35 to
39
year
s
40 to
44
year
s
45 to
49
year
s
50 to
54
year
s
55 to
59
year
s
60 to
64
year
s
65 to
69
year
s
70 to
74
year
s
75 to
79
year
s
80 to
84
year
s
85 to
89
year
s
90 a
nd o
ver
1995199820012003
Sex (All)
Prevalence rate diabetes per 1000 persons
Age group
Year
These prevalence rates compare well with that estimated from a meta-analyses of 15 individual studies8.
© QRESEARCH 2007, all rights reserved. Any use or distribution for commercial purposes is expressly forbidden 14

http://www.qresearch.org
4.2.3 Prevalence of diabetes by Strategic Health Authority Chart 13 shows variations in prevalence by Strategic Health Authority in 1996 and 2003. In 2003, the prevalence was highest in North East London where it was 45.01 per 1000 person years. The lowest was in South West London where the prevalence was 19.94 per 1000 person years showing a two fold variation compared with North East London. Chart 13: prevalence of diabetes by strategic Health Authority
© QRESEARCH 2007, all rights reserved. Any use or distribution for commercial purposes is expressly forbidden 15

http://www.qresearch.org
4.2.4 Prevalence of diabetes by deprivation Chart 14 (Excel work book) shows prevalence by deprivation. As expected, prevalence was highest in areas of high deprivation. For example, prevalence in the most deprived quintile was 66% higher in the most quintile compared with the most affluent (rate 38.70 vs 23.21 per 1000 person years). The gradient with deprivation is similar to that reported elsewhere even though we report on deprivation by assigning individuals to the characteristics of the output area of residence rather than self assigned measures or a composite measure for the patients general practice5. The association and type of diabetes is considered later in this report. Chart 14: Age standardized prevalence of diabetes per 1000 pyr by deprivation
0
5
10
15
20
25
30
35
40
45
1994 1995 1996 1997 1998 1999 2000 2001 2002 2003
Q1Q2Q3Q4Q5
Age standardised prevalence rate per 1000 persons by deprivation
Year
Quintile (1=least deprived, 5
© QRESEARCH 2007, all rights reserved. Any use or distribution for commercial purposes is expressly forbidden 16

http://www.qresearch.org
4.2.5 Prevalence of diabetes by ethnicity The next chart shows the variation in age standardised prevalence of diabetes by ethnicity using small area statistics assigned to the output area associated with the patients postcode from the 2001 census. Chart 15: Age standardized prevalence of diabetes per 1000 pyr by ethnicity
0
10
20
30
40
50
60
70
80
1994 1995 1996 1997 1998 1999 2000 2001 2002 2003
Q1Q2Q3Q4Q5
Age standardised prevalence rate per 1000 personsby ethnicity
Year
Quintile (1 = 0%-19% non-white, 5
As expected, prevalence of diabetes was highest in areas of high ethnicity. In 2003, the prevalence in areas of high ethnicity (ie 80-100% non white) was 74.31 per 1000 person years compare with 27.61 per 1000 person years in areas of low ethnicity (0-19% non white) – almost a 3 fold difference. Other studies have found similar variations in the prevalence of diabetes by ethnicity although these have used individual measures of ethnicity rater than small areas statistics. Two studies, for example, found a four fold higher prevalence in Asians compared with white people9 10.
© QRESEARCH 2007, all rights reserved. Any use or distribution for commercial purposes is expressly forbidden 17

http://www.qresearch.org
4.2.6 Prevalence of diabetes by type The following tables are derived from table 16 in the Excel work book and show the prevalence of type one and type two diabetes. In 2003, we identified 3744 patients with type one diabetes from a population of 1.39 million patients giving an age standardized prevalence of 2.68 per 1000 person years. We identified 39761 patients with type two diabetes giving an age standardized prevalence of 25.98 per 1000 person years. Chart 16 Prevalence of diabetes by type
Age standardised prevalence of type 1 and type 2 diabetes per 1000 person years
0.00
5.00
10.00
15.00
20.00
25.00
30.00
1994 1995 1996 1997 1998 1999 2000 2001 2002 2003
Years
Rat
er p
er 1
000
Type 1Type 2
In broad terms, the prevalence of type two diabetes is around ten times the prevalence of type one diabetes. This ratio is broadly similar to the ratio reported elsewhere11 . Type two diabetes are more common in men than women despite adjustments for age. The ratio of males to females in 2003 is 1.3 which is similar to the ratio described elsewhere in much smaller studies12. Whilst there has been a 30% increase in the prevalence of type one diabetes there has been a 53 % increase in the prevalence of type two diabetes over the ten years 1994 to 2003.
© QRESEARCH 2007, all rights reserved. Any use or distribution for commercial purposes is expressly forbidden 18

http://www.qresearch.org
4.2.6.1 Prevalence of type one diabetes by deprivation Table 19 (Excel workbook) shows the age standardized prevalence of type one and type two diabetes by deprivation. There is no clear relationship between deprivation and type one diabetes [the highest rates were in the middle quintile for most years]. There has been a modest increase in the prevalence in all quintiles over the past ten years. Chart 19a: Age standardized prevalence of type 1 diabetes by deprivation
0
0.5
1
1.5
2
2.5
3
3.5
1994 1995 1996 1997 1998 1999 2000 2001 2002 2003
Q1Q2Q3Q4Q5
Age standardised prevalence rate of type 1 diabetes per 1000 persons by deprivation
Year
Quintile (1=least deprived, 5=most
© QRESEARCH 2007, all rights reserved. Any use or distribution for commercial purposes is expressly forbidden 19

http://www.qresearch.org
4.2.6.2 Prevalence of type 2 diabetes by deprivation The following chart shows that the age standardized prevalence of type 2 diabetes is strongly related to deprivation with highest rates in the most deprived areas. In 1994, the prevalence was 78% higher in deprived compared with affluent areas and in 2003 it was 90% higher. Chart 19b: Age standardized prevalence of type 2 diabetes by deprivation
0
5
10
15
20
25
30
35
40
1994 1995 1996 1997 1998 1999 2000 2001 2002 2003
Q1Q2Q3Q4Q5
Age standardised prevalence rate type 2 diabetes per 1000 persons by deprivation
Year
Quintile (1=least deprived, 5=most
Three small studies confirm the association between deprivation and type two diabetes. The first study was conducted in 7 practices in Bristol in 1994 suggested that deprivation was correlated with type 2 but not type one diabetes13. The second study was conducted in 49 practices in the North East of England in 199414. An analysis of American Survey, NHANES II, between 1988 and 1994 also showed deprivation was associated with prevalence of type two diabetes15. This is the first time that the association has been confirmed on such a large population spread through out the UK and the first time trends over time have been reported. Possible explanations for the association are obesity and © QRESEARCH 2007, all rights reserved. Any use or distribution for commercial purposes is expressly forbidden 20

http://www.qresearch.org
physical inactivity, both of which are associated with type two diabetes and are more common in deprived areas.
4.3 Mortality for diabetes 4.3.1 Mortality rates of diabetes by sex Chart 21a and b shows trends in age standardized mortality rates by sex in patients with and without diabetes. Overall, there seems to be a marginal decline in death rates over the last 10 years in patients with diabetes. In 1994 the age standardized mortality rate was 16.73 per 1000 person years and in 2003 it was 14.72 per 1000 person years. The trend appears similar in both men and women although the actual death rate is higher in men than women. Chart 21a: Trends in age standardized mortality rates by sex in patients with diabetes
0
5
10
15
20
25
1996 1997 1998 1999 2000 2001 2002 2003
FM
Age standardised death rate per 1000 persons with diabetes
Year
Sex
© QRESEARCH 2007, all rights reserved. Any use or distribution for commercial purposes is expressly forbidden 21

http://www.qresearch.org
The trends observed here are consistent with earlier studies from America which found higher rates in male patients with diabetes than female patients16.. The study also found a decline in overall rates in patients with diabetes over time. Chart 21b: Age standardized death rates in patients without diabetes The graph below shows the mortality rates in patients without diabetes are higher in men compared with women and suggest a slight decline over the past 10 years. As expected, the age standardised mortality rates are twice as high in patients with diabetes compared with patients without diabetes. In 2003 the mortality rate in patients with diabetes was 14.72 per 1000 person years compared with 7.6 per 1000 person years in patients without diabetes.
0
2
4
6
8
10
12
1996 1997 1998 1999 2000 2001 2002 2003
BFM
Age standardised death rate per 1000 persons without diabetes
Year
Sex
© QRESEARCH 2007, all rights reserved. Any use or distribution for commercial purposes is expressly forbidden 22
http://www.qresearch.org
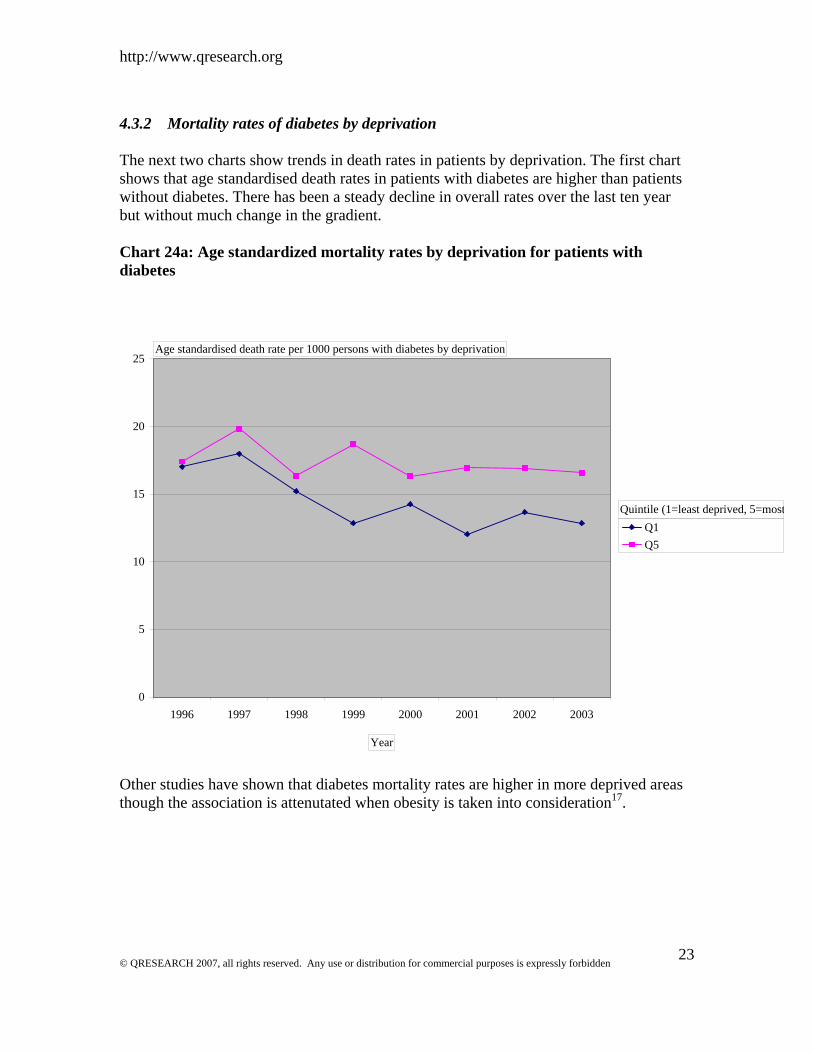
4.3.2 Mortality rates of diabetes by deprivation The next two charts show trends in death rates in patients by deprivation. The first chart shows that age standardised death rates in patients with diabetes are higher than patients without diabetes. There has been a steady decline in overall rates over the last ten year but without much change in the gradient. Chart 24a: Age standardized mortality rates by deprivation for patients with diabetes
0
5
10
15
20
25
1996 1997 1998 1999 2000 2001 2002 2003
Q1Q5
Age standardised death rate per 1000 persons with diabetes by deprivation
Year
Quintile (1=least deprived, 5=most
Other studies have shown that diabetes mortality rates are higher in more deprived areas though the association is attenutated when obesity is taken into consideration17.
© QRESEARCH 2007, all rights reserved. Any use or distribution for commercial purposes is expressly forbidden 23

http://www.qresearch.org
The next chart shows the age standardised death rates for all patients. There has been no change in death rates for patients from the most deprived areas whereas the death rates for patients from affluent areas have slightly declined over the ten years from 8.1 per 1000 in 1994 to 7.0 per 1000 person years in 2003. Chart 24b: Age standardized mortality rates by deprivation for all patients
0
2
4
6
8
10
12
1996 1997 1998 1999 2000 2001 2002 2003
Q1Q5
Age standardised death rate per 1000 persons without diabetes by deprivation
Year
Quintile (1=least deprived, 5=
© QRESEARCH 2007, all rights reserved. Any use or distribution for commercial purposes is expressly forbidden 24

http://www.qresearch.org
4.3.3 Mortality rates of diabetes Strategic Health Authority The next section reviews trend in death rates by Strategic Health Authority Area. The mortality rate for diabetes varies hugely across the country with the highest rates in Northumberland in 2003 (34.57 per 1000 person years) and the lowest rates in Wales. Chart 23: Age standardized mortality rates for diabetes by Strategic Health Authority
© QRESEARCH 2007, all rights reserved. Any use or distribution for commercial purposes is expressly forbidden 25

http://www.qresearch.org
4.3.4 Mortality rates by type of diabetes This chart shows that the age standardised mortality for patients with type one diabetes is higher than that for type two [and both are substantially higher than the rates for patients without diabetes]. There was a death for a child with type 2 diabetes in 2002 which has skewed the age standardised rates for type 2 in 2002. Chart 26 Age standardised death rates per 1000 for patients with type 1 and 2 diabetes
Age standardised death rates by type of diabetes
0
5
10
15
20
25
30
35
40
1996 1997 1998 1999 2000 2001 2002 2003
Year
rate
per
100
0
Type 1Type 2No diabetes
There is no clear trend for patients with type one diabetes over time though this probably reflects the smaller sample size of patients with type one diabetes.
This analysis, is however, among the first to be able to distinguish death rates by type of diabetes as previous studies have failed to do this16.
© QRESEARCH 2007, all rights reserved. Any use or distribution for commercial purposes is expressly forbidden 26

http://www.qresearch.org
5 DISCUSSION Understanding the rise in prevalence of diabetes Possible explanations for the increase in prevalence of diabetes 1. ascertainment The increase in prevalence of recorded diabetes could reflect better ascertainment of cases due to improved computer recording of diagnoses. 2. screening A higher proportion of patients with type 2 diabetes are now being diagnosed. This could be due to better screening as previous studies have suggested that less than half all tru cases have been diagnosed18. 3. Ageing population Changes in age structure of the population are unlikely to explain the rise in prevalence since there was an increase in age standardized rates 4. improved survival There is some evidence to support the hypothesis that the increase in prevalence is due to improved survival since the standardised mortality rates have declined over the last yen years. 5. change in diagnostic criteria There has been a shift in recommendations for the diagnosis of diabetes from a 2 hour glucose concentration of = 11.1 mmol/l to a fasting glucose of >=7.0 mmol/l and inevitably this will have contributed to the increase in diagnosed cases19. 5. true increase in incidence of type 2 diabetes
© QRESEARCH 2007, all rights reserved. Any use or distribution for commercial purposes is expressly forbidden 27
Analysis of prescription and mortality data from Denmark concluded that incidence was stable and that mortality was falling and that this accounted for the increase in observed prevalence20. However, the analysis had a number of clear limitations21 and the authors themselves called for further work using databases which allowed access to individual diagnoses. It had a risk of counting cases twice and omitted patients with diet treated diabetes. It didn’t account for type one or type two diabetes or for the effect of deprivation, ethnicity or obesity. The stable rate of incidence, for example, might have been explained by constant [rather than rising] levels of obesity21.

http://www.qresearch.org
6 FUTURE WORK
7 REFERENCES 1. Gardner S, Bingley P, Sawtell P, Weeks S, Gale E. Rising incidence of insulin
dependent diabeets in children aged under 5 years in the Oxford region: time trend analysis. BMJ 1997;315:713-717.
2. Wadsworth E, Sheild J, Hunt L, Baum D. Insulin dependent diabetes in children under 5: incidence and ascertainment validation for 1992. British Medical Journal 1995;310:700-703.
3. Burke J, Williams K, Gaskill S, Hazuda H, Haffner S. Rapid Rise in the Incidence of Type 2 Diabetes From 1987 to 1996: Results From the San Antonio Heart Study. Archives of Internal Medicine July 12, 1999;159(13):1450-1456.
4. Manson J, Anjani U, Lui S, Nathan D, Hennekens C. A prosepctive study of cigaretter smoking and the incidence of diabetes mellitus among US ale physicians. Am J Med 2000;109:538-542.
5. Newnham A, Ryan R, Khunti K, Majeed A. Prevalence of diagnosed diabetes mellitus in general practice in England and Wales. Health Statistics Quarterly 2002;14:5-13.
6. Fleming D. Diabetes Registers in general practice: College reports higher prevalence. BMJ 1994;308:134.
7. Gray J, Orr D, Majeed A. Use of Read codes in diabetes management in a south London primary care group: implications for establishing disease registers. BMJ 2003;326:1130.
8. Barendregt JJ, Baan CA, Bonneux L. An indirect estimate of the incidence of non-insulin-dependent diabetes mellitus. Epidemiology. 2000;11(3):274-9.
9. Simmons D, Williams DRR, Powell MJ. Prevalence of diabetics in a predominantly asian community: preliminary findings of the coventry diabetes study. British Medical Journal 1989;298:18-21.
10. Mather H, Keen H. The Southall diabetes survey: prevalence of known diabetes in Asians and Europeans. BMJ 1985;291:1081-1084.
11. Morris AD, Boyle DI, MacAlpine R, Emslie-Smith A, Jung RT, Newton RW, et al. The diabetes audit and research in Tayside Scotland (DARTS) study: electronic record linkage to create a diabetes register. DARTS/MEMO Collaboration. BMJ 1997;315(7107):524-8.
12. Harvey J, Craney L, Kelly D. Estimation of the prevalence of diagnosed diabetes from primary care and secondary care source data: comparison of record linkage with capture-recapture analysis. J Epidemiol Community Health 2002;56:18-23.
13. Meadows P. Variation of diabetes mellitus prevalence in general practice and its relation to deprivation. Diabetic Medicine 1995;12(8):696-700.
14. Connolly V, Unwin N, Sherriff P, Bilous R, Kelly W. Diabetes prevalence and socioeconomic status: a population based study showing increased prevalence of type 2 diabetes mellitus in deprived areas. JECH 2000;54(3):173-7.
© QRESEARCH 2007, all rights reserved. Any use or distribution for commercial purposes is expressly forbidden 28

http://www.qresearch.org
15. Robbins JM, Vaccarino V, Zhang H, Kasl SV. Socioeconomic status and type 2 diabetes in African American and non-Hispanic white women and men: evidence from the Third National Health and Nutrition Examination Survey. American Journal of Public Health 2001;91(1):76-83.
16. Gu K, Cowie CC, Harris MI. Diabetes and decline in heart disease mortality in US adults.[comment]. Jama. 1999;281(14):1291-7.
17. Cabrera C, Helgesson O, Wedel H, Bjorkelund C, Bengtsson C, Lissner L. Socioeconomic status and mortality in Swedish women: opposing trends for cardiovascular disease and cancer. Epidemiology. 2001;12(5):532-6.
18. Simmons D, Williams D, Powell M. The Coventry Diabetes Study: prevalence of diabetes and impaired glucose tolerance in Europids and Asian. QJM 1991;81:1021-1030.
19. Group. DS. Will new diagnostic critera for diabetes mellitus change phenotype of pateints with diabetes? Reanalysis of European epidemiological data. BMJ 1998;317:371-375.
20. stovring H, Andersen M, Beck-Nielsen H, Green A, Vach W. Rising prevalence of diabetes: evidence form a Danish pharmaco-epidemiological database. Lancet 2003;362:537-538.
21. Gale E. Is there really an epidemic of type 2 diabetes. Lancet 2003;362:503-504.
© QRESEARCH 2007, all rights reserved. Any use or distribution for commercial purposes is expressly forbidden 29