diabetes mellitus cases - staabsymposium.com€¦ · patients with diabetes remain at increased...
TRANSCRIPT

Robert S. Busch, MD, FACEDirector of Clinical ResearchAlbany Medical Faculty: Community Endocrine GroupAlbany, NY
2
Faculty

Disclosures
Robert S. Busch, MD, FACE serves as a speaker for Astra Zeneca, Eli Lilly, Boehringer Ingelheim and Novo Nordisk.
3

Learning Objectives
1. Recognize the importance of C-V risk management in the patient with Type 2 DM
2. Describe the mechanism of action and capabilities of PCSK-9 therapies
4

↑ Risk50 – 80%
PATIENTS WITH DIABETES REMAIN ATINCREASED RISK FOR ASCVD EVENTS
5
1. Gregg EW, Li Y, Wang J, et al. Changes in Diabetes-Related Complications in the United States, 1990-2010. N Engl J Med. 2014;370(16):1514-23. Epub 2014/04/18. doi: 10.1056/NEJMoa1310799. PubMed PMID: 24738668.
0
20
40
60
80
100
120
140
160
1990 1995 2000 2005 2010
Even
ts P
er 1
0,00
0 Am
ong
Adul
ts
Diabetes/Acute MINo Diabetes/Acute MIDiabetes/StrokeNo Diabetes/Stroke
4S(1994)
HOPE(2000)

Type 2 DM is a Progressive Disease
Adapted from Type 2 Diabetes BASICS: International Diabetes Center; 2000.Years -10 -5 0 5 10 15 20 25 30
35030025020015010050
InsulinLevel
Insulin Resistance
Decreasing β-cell Function
250200150100500
FastingGlucose
Post-prandialGlucose
Glucose (mg/dl)
CLINICAL DIAGNOSIS
ClinicalFeatures
Macrovascular changes
Obesity IGT Diabetes Uncontrolled hyperglycemia
Microvascular changes
Compensatedβ-cell Function
Relative Insulin Resistance
6
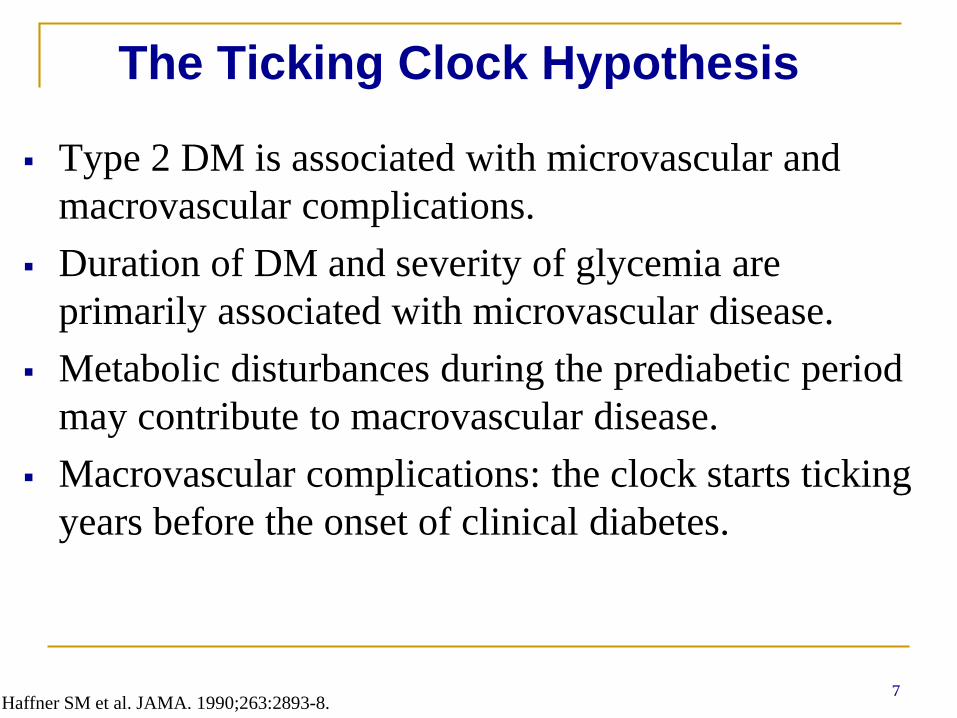
The Ticking Clock Hypothesis
Type 2 DM is associated with microvascular and macrovascular complications.
Duration of DM and severity of glycemia are primarily associated with microvascular disease.
Metabolic disturbances during the prediabetic period may contribute to macrovascular disease.
Macrovascular complications: the clock starts ticking years before the onset of clinical diabetes.
Haffner SM et al. JAMA. 1990;263:2893-8.7

The ABC’s of Diabetes
A1C (and ASA) < 7.0% (ACE < 6.5%)
Blood Pressure* < 140/90 mmHg (125/75 mmHg)
Cholesterol** LDL-C < 100 mg/dL (<70 mg/dL?) Non-HDL-C < 130 mg/dL (<100 mg/dL?) HDL-C > 40 mg/dL (> 50 mg/dL in women) TG’s < 150 mg/dL
Smoking Cessation* JNC 8: < 140/90 mmHg AACE: <130/80** NCEP 4: high-dose statin therapy
recommended; >50% LDL-C reduction ADA. Standards of Medical Care in Diabetes – 2016. Diabetes Care 2016;39:S1-S106.
12

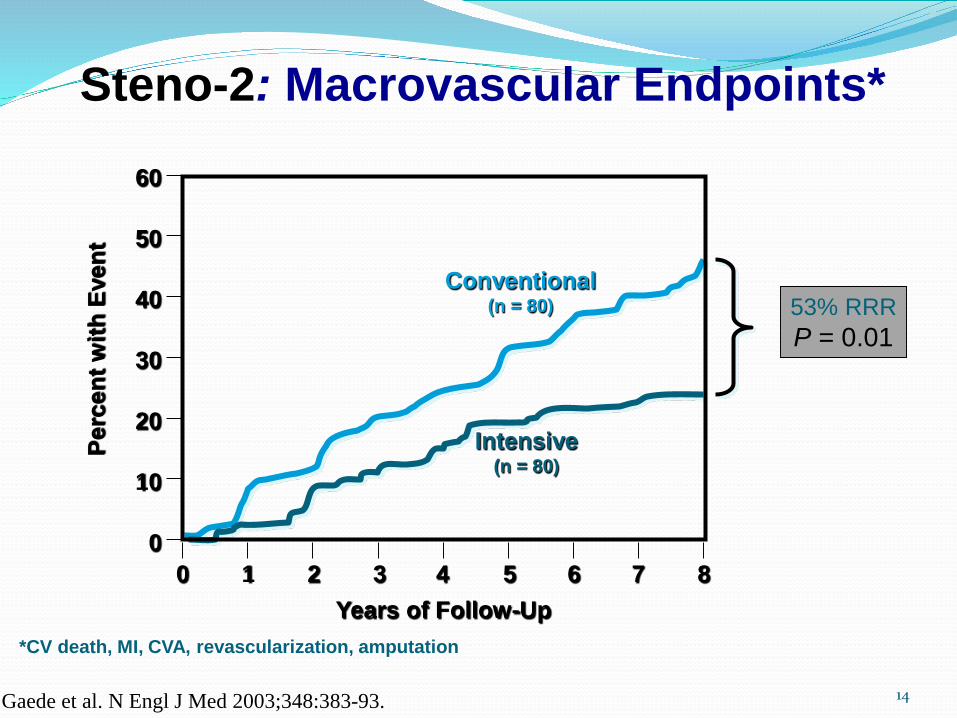
Steno Study Design
Gaede et al. N Engl J Med 2003;348:383-93.
160 type 2 diabetics with microalbuminuria Randomized treatment assignments
“Conventional”: Treatment for multiple risk factors from general practitioner, in accordance with 1988 Danish Medical Association guidelines
“Intensive”: Treatment for multiple risk factors by a project team (physician, nurse, dietician) at Steno Diabetes Center, involving strict treatment goals
Endpoints Primary: CV death, MI, CVA, revascularization, amputation Secondary: nephropathy, retinopathy, neuropathy
Eight-year follow-up
13
00 1 2 3 4 5 6 7 8
60
50
40
30
20
10
Conventional(n = 80)
Intensive(n = 80)
Years of Follow-Up
Perc
ent w
ith E
vent
53% RRRP = 0.01
Steno-2: Macrovascular Endpoints*
*CV death, MI, CVA, revascularization, amputation
Gaede et al. N Engl J Med 2003;348:383-93. 14

18

The Heart Outcomes Prevention Evaluation Study Investigators. NEJM. 2000;342:145-53.
22% RRR
19

20

SIMVASTATIN: MAJOR VASCULAR EVENT by YEAR
0 1 2 3 4 5 60
5
10
15
20
25
30
Years of follow-up
5(3) 20(4) 35(5)
SIMVASTATIN
PLACEBO
46(5) 54(7) 60(18)Benefit/1000 (SE):
Peop
le s
uffe
ring
even
ts (%
)
21

SIMVASTATIN: CAUSE-SPECIFIC MORTALITY
(10269) (10267)SIMVASTATIN PLACEBO Rate ratio & 95% CI
STATIN better PLACEBO betterCause ofdeath
Vascular
587 707Coronary194 230Other vascular
(7.6%) (9.1%)17% SE 4reduction
781 937
(2P<0.0001)
ANY VASCULAR
Non-vascular
359 345Neoplastic90 114Respiratory82 90Other medical16 21Non-medical
(5.3%) (5.6%)5% SE 6reduction
547 570
(NS)
NON-VASCULAR
(12.9%) (14.7%)13% SE 4reduction
1328 1507
(2P<0.001)
ALL CAUSES
0.4 0.6 0.8 1.0 1.2 1.422

SIMVASTATIN: MAJOR VASCULAR EVENTS
(10269) (10267)SIMVASTATIN PLACEBO Rate ratio & 95% CI
STATIN better PLACEBO betterVascularevent
898 1212Major coronary
444 585Any stroke
939 1205Revascularisation
(19.8%) (25.2%)24% SE 3reduction
2033 2585
(2P<0.00001)
ANY OF ABOVE
0.4 0.6 0.8 1.0 1.2 1.4
25

CARDS
26

CARDS Eligibility CriteriaType 2 diabetes
Males or females
40-75 years of age
No clinical history of coronary, cerebrovascular or severe peripheral vascular disease
LDL-C ≤4.14 mmol/L (≤160 mg/dL)
TG ≤6.78 mmol/L (≤600 mg/dL)
One of :– Hypertension defined as receiving antihypertensive treatment or SBP ≥140
mm Hg or DBP ≥90 mm Hg
– Retinopathy
– Microalbuminuria or macroalbuminuria
– Current smoking 27

CARDS Endpoints
• Acute CHD death• Non-fatal MI including silent MI• Hospitalised unstable angina• Resuscitated cardiac arrest• Coronary revascularisation• Stroke
Major coronary events
Primary Efficacy Parameters
Secondary Efficacy Parameters• Total mortality• Any cardiovascular endpoint• Lipid and lipoproteins

CARDS Patient Baseline Lipids*
1.3 (1.2-1.6)52 (45-60)
1.4 (1.2-1.6)53 (46-61)
HDL-cholesterol (mmol/L)(mg/dL)
3.1 (2.6-3.6)119 (100-138)
3.1 (2.6-3.6)118 (100-137)
LDL-cholesterol (mmol/L)(mg/dL)
5.4 (4.8-5.9)207 (186-228)
5.4 (4.8-5.9)207 (185-229)
Total cholesterol (mmol/L)(mg/dL)
AtorvastatinMedian (IQR)
PlaceboMedian (IQR)
* Subject to final verification

Lipid Levels by Treatment Total cholesterol (mmol/L) LDL cholesterol (mmol/L)
0 2 3 41 4.5 2 3 41 4.5
Years of Study Years of Study
00
1
2
3
4
0
2
4
6
Placebo Atorvastatin
Average difference 26%
1.4 mmol/L (54mg/dL) p<0.0001
Average difference 40%
1.2 mmol/L (46mg/dL) p<0.0001

Cumulative Hazard for Primary EndpointRelative Risk Reduction 37% (95% CI: 17-52)
Years
328305
694651
10741022
13611306
13921351
AtorvaPlacebo
14281410
Placebo127 events
Atorvastatin83 events
Cum
ulat
ive
Haz
ard
(%)
0
5
10
15
0 1 2 3 4 4.75
P=0.001

Cumulative Hazard for All Cause Mortality
Relative Risk Reduction 27% (95%CI: -1-48) p=0.059
Cum
ulat
ive
Haz
ard
(%)
Years
AtorvaPlacebo
Placebo82 deaths
Atorvastatin61 deaths
351332
730709
11101094
14011370
14181395
14281410
1 2 3 4 4.750
2
4
6
8
10
0

June 3, 201536

37

Ominous Octet
DeFronzo RA. Diabetes. 2009;58:773-795. 38

Pro-Active
Lancet 2005;366:1279-89. 39

40

41

42

NEJM Feb 17, 2016 DOI: 10.1056/NEJMoa1506930
24% RRR
43

44

45

White et al. N Engl J Med 2013;369:1327–35; Sciria et al. N Engl J Med 2013;369:1317–26; Green et al. N Engl J Med 2015;16;373:232–42; Pfeffer et al. N Engl J Med2015;373:2247–57
ACS, acute coronary syndrome; CI, confidence interval; CV, cardiovascular; EXAMINE, Examination of Cardiovascular Outcomes: Alogliptin vs. Standard of Care in Patients with Type 2 Diabetes Mellitus and Acute Coronary Syndrome; HR, hazard ratio; MI, myocardial infarction; SAVOR TIMI-53, Saxagliptin Assessment of Vascular Outcomes Recorded in Patients with Diabetes Mellitus–Thrombolysis in Myocardial Infarction 53; T2D, type 2 diabetes; TECOS, Trial Evaluating Cardiovascular Outcomes with Sitagliptin; UA, unstable angina
Alogliptin (6.25, 12.5 or 25 mg/day*) + standard of care
T2D; HbA1c 6.5–11.0%; ACS within 15–90 days (n=5380)
Placebo + standard of care
Saxagliptin (2.5 or 5 mg/day**) + standard of care
Placebo + standard of care
T2D; HbA1c 6.5–12.0%; ≥40 years + CVD; ≥55 (men) or ≥60 (women) years + CV risk factors (n=16,492)
Lixisenatide (10 or 20 µg/day†) + standard of care
Placebo + standard of care
T2D; HbA1c 5.5–11.0%; ACS within 180 days (n=6068)
T2D; HbA1c 6.5–8.0%; ≥50 years; CVD history (n=14,671)
Sitagliptin (100 or 50 mg/day***) + standard of care
Placebo + standard of care
SAVOR-TIMI-53 EXAMINE
TECOS ELIXA
Time (days) Time (months)
Time (months)
Time in the trial (months)
Pati
ents
wit
h en
dpoi
nt (
%)
Pati
ents
wit
h en
dpoi
nt (
%)
Pati
ents
wit
h en
dpoi
nt (
%)
Pati
ents
wit
h en
dpoi
nt (
%)

EMPA-REG1 LEADER4 SUSTAIN-65
Population T2D + high CV risk T2D + high CV risk T2D
Drug (Class)
Empagliflozin(SGLT-2i)
Liraglutide (GLP-1RA)
Semaglutide (GLP-1RA)
Objective Non-inferiority Non-inferiority Non-inferiority
Endpoint 3-point MACE 3-point MACE 3-point MACE
Results HR 0.86 HR 0.87 HR 0.74
Selected CVOTs:Assessing CV benefit with antiglycemic agents
1. Zinman et al. N Engl J Med 2015;373:2117–28; 2. Green et al. N Engl J Med 2015;373:232–42; 3. Pfeffer et al. N Engl J Med 2015;373:2247–57; 4. Marso et al. N Engl J Med 2016;375:311–22; 5. Marso et al. N Engl J Med 2016;375:1834–44
3-point MACE: first occurrence of CV death, nonfatal MI or nonfatal stroke; MACE+: CV death, nonfatal MI, nonfatal stroke and hospitalisation for UA procedure ACS, acute coronary syndrome; CV, cardiovascular; CVOT, cardiovascular outcomes trial; GLP-1RA, glucagon-like peptide-1 receptor agonist; HR, hazard ratio; LEADER, Liraglutide Effect and Action in Diabetes: Evaluation of Cardiovascular Outcome Results; MACE, major adverse cardiovascular event; MI, myocardial infarction; SGLT-2i, sodium-glucose cotransporter-2 inhibitor; T2D, type 2 diabetes; UA, unstable angina

Image: http://images.agoramedia.com/everydayhealth/gcms/10-Amazing-Facts-About-Blood-Vessels-722x406.jpg
48
CARDIOVASCULAR OUTCOMEDATA FOR SGLT2 INHIBITORS

SGLT-2 Inhibitors: Mechanism of Action (cont)
Juxtoglomerular Complex
Proximal Convoluted
Tubules
Loop of Henle
Free Filtration of Solute
Active Reabsorption
Glucose
SGLT-2
SGLT-1
Glucose
Type 2 Diabetes

SGLT2 Inhibition Lowers Tmax, Allowing Elimination of Excess Glucose
Overexpression of SGLT2 shifts Tmax to the right, allowing excess glucose to be reabsorbed
SGLT2 inhibition shifts Tmax to the left, eliminating excess glucose
Chao E, et al. Nature Rev Drug Discov. 2010;9:551-559; Bays H. Curr Med Res Opin. 2009;25:671-681; DeFronzoRA, et al. Diabetes Obes Metab. 2012;14:5-14; Gerich JE. Diabet Med. 2010;27:136-142; Kim Y, et al. Diabetes Metab Syndr Obes. 2012;5:313-327. 50
300250200150100500
25
50
75
100
125
Urin
ary
Glu
cose
Exc
retio
n
(g/d
ay)
Plasma Glucose (mg/dL)
Tmax
SGLT2inhibition
Normal
T2DM 240 mg/dL
T2DMBlockade of SGLT2

EMPA-REG
NEJM, Nov 26 2015;373:2117-28
14% reduction of primary composite outcome: death from cardiovascular causes, nonfatal myocardial infarction, or nonfatal stroke38% relative risk reduction of death from cardiovascular causes32% relative risk reduction of death from any cause35% relative risk reduction of hospitalization for heart failure
51

52
Primary Outcome ResultsEMPA-REG OUTCOME (EMPAGLIFLOZIN)8
1.6% ARR
14% RRR

53
Primary Outcome ResultsEMPA-REG OUTCOME (EMPAGLIFLOZIN)8
OutcomePooled
Empagliflozin(n = 4687)
Placebo(n = 2333)
Hazard Ratio(95% CI)
Primary Composite Outcome, n (%) 490 (10.5) 282 (12.1) 0.86
(0.74 to 0.99)
Assessment of Individual Primary Outcome Events
Death from CardiovascularCauses, n (%) 172 (3.7) 137 (5.9) 0.62
(0.49 to 0.77)
Nonfatal Myocardial Infarction, n (%) 213 (4.5) 121 (5.2) 0.87
(0.70 to 1.09)
Nonfatal Stroke, n (%) 150 (3.2) 60 (2.6) 1.24(0.92 to 1.67)
Abbreviation: CI – confidence interval

June 14, 2016
39% reduction of incident or worsening nephropathy 44% relative risk reduction of doubling of serum creatinine55% relative risk reduction of renal-replacement therapy
54
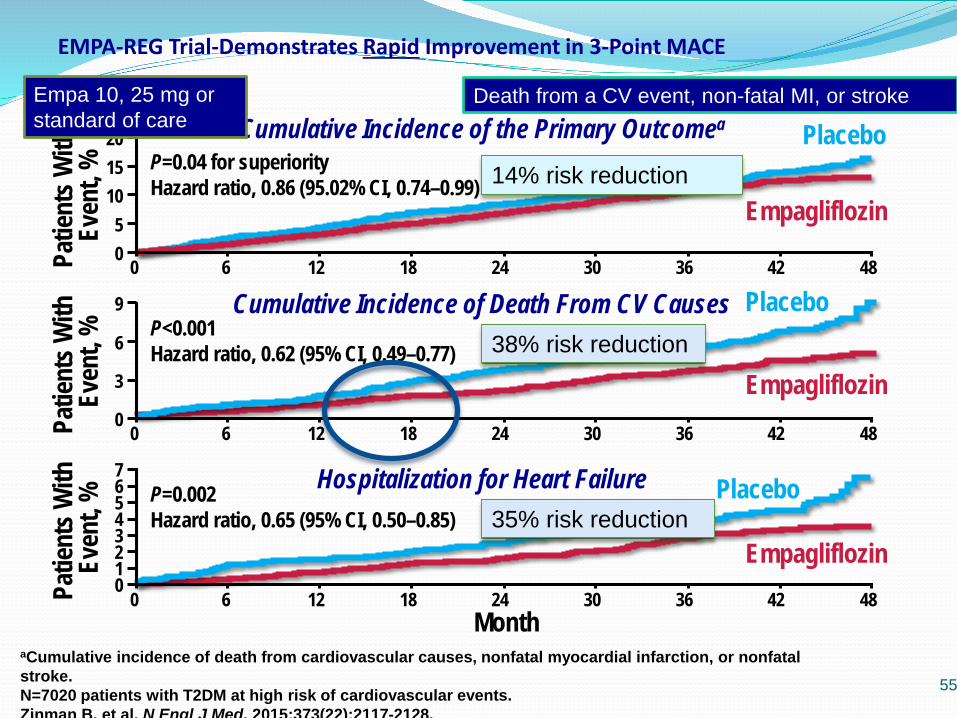
EMPA-REG Trial-Demonstrates Rapid Improvement in 3-Point MACE
aCumulative incidence of death from cardiovascular causes, nonfatal myocardial infarction, or nonfatal stroke.N=7020 patients with T2DM at high risk of cardiovascular events.Zinman B, et al. N Engl J Med. 2015;373(22):2117-2128.
Patie
nts W
ith
Even
t, %
Empagliflozin
P=0.04 for superiorityHazard ratio, 0.86 (95.02% CI, 0.74–0.99)
Placebo2015
510
00 126 18 24 30 36 42 48
Cumulative Incidence of the Primary Outcomea
Patie
nts W
ith
Even
t, %
Empagliflozin
P<0.001Hazard ratio, 0.62 (95% CI, 0.49–0.77)
Placebo9
3
6
00 126 18 24 30 36 42 48
Cumulative Incidence of Death From CV Causes
Patie
nts W
ith
Even
t, %
Empagliflozin
P=0.002Hazard ratio, 0.65 (95% CI, 0.50–0.85)
Placebo7645
00 126 18 24 30 36 42 48
Month
Hospitalization for Heart Failure
321
55
38% risk reduction
14% risk reduction
35% risk reduction
Death from a CV event, non-fatal MI, or strokeEmpa 10, 25 mg or standard of care

Empa-Reg Renal Data
56Warner C, et al. NEJM. DOI: 10.1056/NEJMoa1515920
Incidence of nephropathy by 39 %

Canagliflozin and Cardiovascular and Renal Events in Type 2 Diabetes
57
CANVAS and CANVAS-R
Image: https://www.google.com/search?q=canvas&safe=off&rlz=1C1NHXL_enUS702US702&source=lnms&tbm=isch&sa=X&ved=0ahUKEwjl6Obczr7UAhUMVT4KHZSUAakQ_AUICygC&biw=1364&bih=613#safe=off&tbm=isch&q=canvas+paint+clipart&imgrc=y4C-q7myhxZKjM:
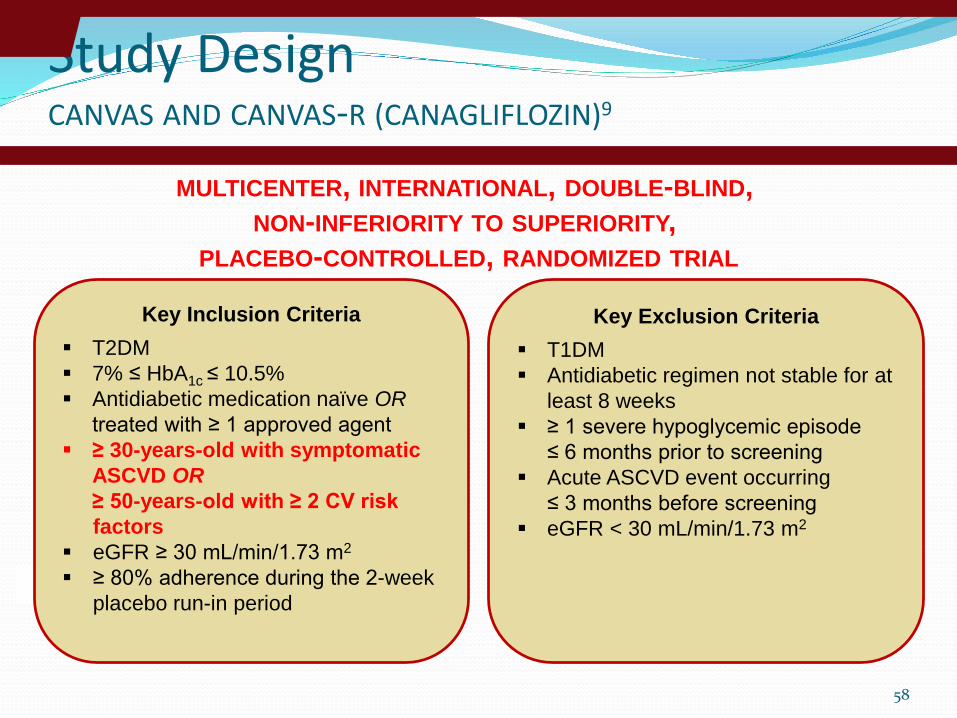
Study DesignCANVAS AND CANVAS-R (CANAGLIFLOZIN)9
58
Key Inclusion Criteria T2DM 7% ≤ HbA1c ≤ 10.5% Antidiabetic medication naïve OR
treated with ≥ 1 approved agent ≥ 30-years-old with symptomatic
ASCVD OR≥ 50-years-old with ≥ 2 CV risk factors
eGFR ≥ 30 mL/min/1.73 m2
≥ 80% adherence during the 2-week placebo run-in period
Key Exclusion Criteria T1DM Antidiabetic regimen not stable for at
least 8 weeks ≥ 1 severe hypoglycemic episode
≤ 6 months prior to screening Acute ASCVD event occurring
≤ 3 months before screening eGFR < 30 mL/min/1.73 m2
MULTICENTER, INTERNATIONAL, DOUBLE-BLIND, NON-INFERIORITY TO SUPERIORITY,
PLACEBO-CONTROLLED, RANDOMIZED TRIAL

59
Baseline CharacteristicsCANVAS AND CANVAS-R (CANAGLIFLOZIN)9
Baseline Characteristics Canagliflozin(n = 5795)
Placebo(n = 4347)
Male, n (%) 3759 (64.9) 2750 (63.3)
Age, years 63.2 ± 8.3 63.4 ± 8.2
Diabetes Duration, years 13.5 ± 7.7 13.7 ± 7.8
HbA1c (%) 8.2 ± 0.9 8.2 ± 0.9
Body Mass Index (kg/m2) 31.9 ± 5.9 32.0 ± 6.0
Established Cardiovascular Disease, n (%) 3756 (64.8) 2900 (66.7)
eGFR, MDRD (mL/min/1.73 m2) 76.7 ± 20.3 76.2 ± 20.8
Median Urine Albumin-to-Creatinine Ratio (mg/g), [interquartile range]
12.4[6.71 to 40.9]
12.1[6.57 to 43.9]
Neuropathy, n (%) 1787 (30.8) 1323 (30.4)
Current Smoker, n (%) 1020 (17.6) 786 (18.1)
Low-Density Lipoprotein Cholesterol (mg/dL) 88.9 ± 34.8 88.9 ± 34.8
Abbreviations: ± – standard deviation; eGFR – estimated glomerular filtration rate; MDRD – Modification of Diet in Renal Disease

60
Baseline MedicationsCANVAS AND CANVAS-R (CANAGLIFLOZIN)9
Baseline Class/Medication Use Canagliflozin(n = 5795)
Placebo(n = 4347)
Antihypertensives, n (%) Not Available Not AvailableRenin-Angiotensin-Aldosterone System Inhibitors, n (%) 4645 (80.2) 3471 (79.8)
Beta Blockers, n (%) 3039 (52.4) 2382 (54.8)
Diuretics, n (%) 2536 (43.8) 1954 (45.0)
Antilipemics, n (%) Not Available Not AvailableStatins, n (%) 4329 (74.7) 3270 (75.2)
Ezetimibe, n (%) Not Available Not Available
Antithrombotics, n (%) 4233 (73.0) 3233 (74.4)Aspirin, n (%) Not Available Not Available
Antihyperglycemics, n (%) Not Available Not AvailableInsulin, n (%) 2890 (49.9) 2205 (50.7)
Metformin, n (%) 4447 (76.7) 3378 (77.7)
Sulfonylureas, n (%) 2528 (43.6) 1833 (42.2)

61
Primary Outcome ResultsCANVAS AND CANVAS-R (CANAGLIFLOZIN)9
4.6*ARR
14% RRR
*Events per 1000 patient
years

62
Primary Outcome ResultsCANVAS AND CANVAS-R (CANAGLIFLOZIN)9
OutcomeCanagliflozin
(n = 5795)Placebo
(n = 4347) Hazard Ratio(95% CI)Number of Participants with an
Event per 1000 Patient Years
Primary Composite Outcome 26.9 31.5 0.86(0.75 to 0.97)
Assessment of Individual Primary Outcome Events
Death from Cardiovascular Causes 11.6 12.8 0.87
(0.72 to 1.06)
Nonfatal Myocardial Infarction 9.7 11.6 0.85(0.69 to 1.05)
Nonfatal Stroke 7.1 8.4 0.90(0.71 to 1.15)
Abbreviation: CI – confidence interval
Outcome Canagliflozin(Per 1000 Patient Years)
Placebo(Per 1000 Patient Years)
Hazard Ratio(95% CI)
History of Amputation
Yes 96.30 59.16 2.15(1.11 to 4.19)
No 4.68 2.48 1.88 (1.27 to 2.78)
History of Peripheral Vascular Disease
Yes 12.09 8.16 1.39(0.80 to 2.40)
No 5.20 2.41 2.34(1.53 to 3.58)
Abbreviation: CI – confidence interval
63
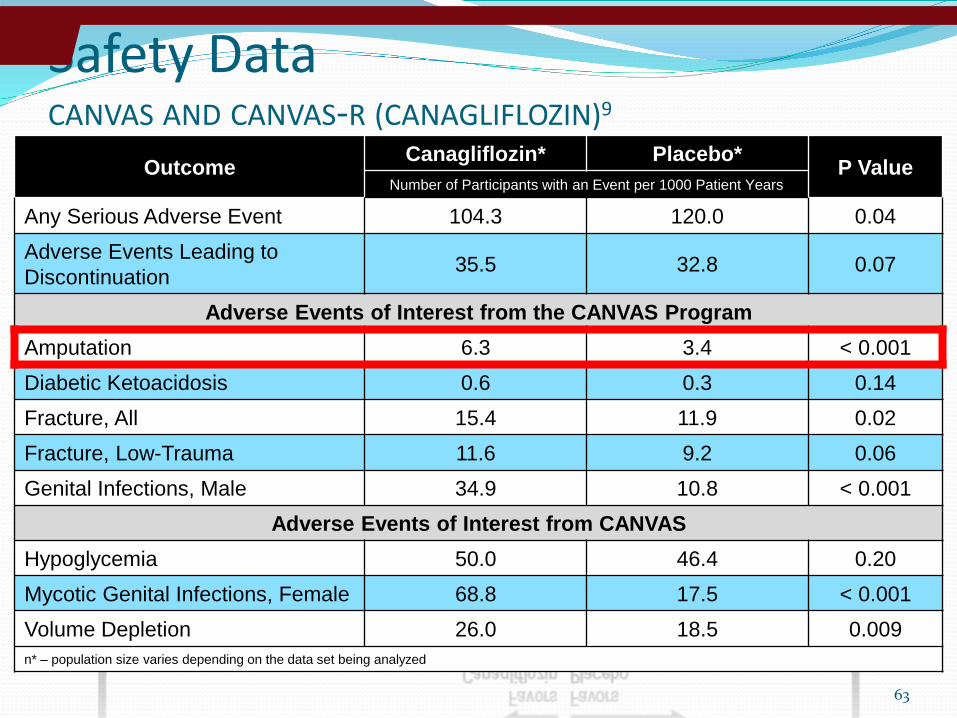
Safety DataCANVAS AND CANVAS-R (CANAGLIFLOZIN)9
EFFECTS OF CANAGLIFLOZIN ON ATRAUMATIC LOWERLIMB AMPUTATION IN KEY SUBGROUPS
HIGHEST LEVEL ATRAUMATIC LOWER-LIMBAMPUTATIONS IN THE CANVAS PROGRAM
Outcome Canagliflozin* Placebo* P ValueNumber of Participants with an Event per 1000 Patient Years
Any Serious Adverse Event 104.3 120.0 0.04Adverse Events Leading to Discontinuation 35.5 32.8 0.07
Adverse Events of Interest from the CANVAS ProgramAmputation 6.3 3.4 < 0.001Diabetic Ketoacidosis 0.6 0.3 0.14Fracture, All 15.4 11.9 0.02Fracture, Low-Trauma 11.6 9.2 0.06Genital Infections, Male 34.9 10.8 < 0.001
Adverse Events of Interest from CANVASHypoglycemia 50.0 46.4 0.20Mycotic Genital Infections, Female 68.8 17.5 < 0.001Volume Depletion 26.0 18.5 0.009n* – population size varies depending on the data set being analyzed

64
Cardiovascular Outcomes Data for Sodium-Glucose Cotransporter-2 InhibitorsAgent Empagliflozin (Jardiance) Canagliflozin (Invokana)
Clinical Trial EMPA-REG8 CANVAS/CANVAS-R9
Study Design DB, INT, MC, NI S,PC, R trial
DB, INT, MC, NI S, PC, R trial
Intervention Empagliflozin 10 or 25 mg PO once daily
Canagliflozin 100 mg to 300 mg PO once daily
Patient Population
≥ 18-years-old; acute coronary event> 2 months before informed consent; T2DM (57% > 10 years duration); baseline HbA1c: 8.1%; 99% with CV disease
≥ 30-years-old with a coexisting CV condition or ≥ 50-years-old with ≥ 2 CV risk factors; T2DM (mean: 14 years); baseline HbA1c: 8.2%; 65% with CV disease
Primary Composite Endpoint
Death from CV causes, nonfatal MI (excluding silent MI), nonfatal stroke
Death from CV causes, nonfatal MI (excluding silent MI), nonfatal stroke
Primary Composite Endpoint Outcome,
P vs. I
12.1% vs. 10.5%[HR 0.86; 95% CI: 0.74 – 0.99; p < 0.001 for NI; p = 0.04 for S]
31.5 vs. 26.9*[HR 0.86; 95% CI: 0.75 – 0.97;p < 0.001 for NI; p = 0.02 for S]
ARR / RRR 1.6% / 13.2% 4.6* / 14.6%
NumberNeeded to Treat 63 patients over 3.1 years
* Number of participants with an event per 1000 patient yearsAbbreviations: ARR – absolute risk reduction; CI – confidence interval; CV – cardiovascular; DB – double-blind; HR – hazard ratio; I – intervention; INT – international; MC – multi-center; MI – myocardial infarction; NI – noninferiority; P – placebo; PC – placebo-controlled; PO – by mouth; R – randomized; RRR – relative risk reduction; S – superiority; T2DM – type 2 diabetes mellitus

Proposed Cardioprotective Effects with SGLT2i15
SODIUM-GLUCOSE COTRANSPORTER-2 INHIBITORS
65
↑ Uric acid excretion
↓ Extracellular Fluid Volume
↓ Preload
↑ Angiotensin 1-7 AT2
↓ Afterload
↓ Blood pressure
↓ Systemic vascular resistance
Weight loss
ADIPOSE TISSUE
LIVER
↓ Aortic Stiffness and Wall Stress
Improvedglycemiccontrol
PANCREATICALPHA CELLS
↑ FFA
↑ Glucagon↑ Ketones
↑ NaCl/H2O excretion

Clinical ConsiderationsSODIUM-GLUCOSE COTRANSPORTER-2 INHIBITORS
66
Advantages Disadvantages
Appreciable reductions in HbA1c Decrease in blood pressure and serum
uric acid Placebo-like risk for hypoglycemia Positive cardiovascular outcomes
data8,9
Potential renal-9,12 and heart failure-protective13,14 effects
Weight loss
Amputationso Potentially unique to canagliflozin
Cost Diabetic ketoacidoisis Genitourinary tract infections Increased LDL-C Polyuria Transient increase in serum creatinine Urinary tract infections leading to
pyelonephritis and urosepsis Volume
depletion/dizziness/hypotension
Abbreviation: LDL-C – low-density lipoprotein cholesterol
10. American Diabetes Association. Pharmacologic Approaches to Glycemic Treatment. Sec. 8. In Standards of Medical Care in Diabetes-2017. Diabetes Care 2017;40(Suppl. 1):S64–S7411. Garber AJ, Abrahamson MJ, Barzilay JI, et al. Consensus Statement by the American Association of Clinical Endocrinologists and American College of Endocrinology on the Comprehensive Type 2 Diabetes Management Algorithm - 2017 Executive Summary. Endocr Pract. 2017;23(2):207-38. Epub 2017/01/18. doi: 10.4158/ep161682.cs. PubMed PMID: 28095040.

Patient education Polyuria Hydration Hygiene Signs and symptoms of DKA
When to hold therapy16
Patients at increased risk for amputations Glycosuria
2+
67
Image: http://www.nephrologynews.com/wp-content/uploads/2015/06/TS_Diabetes_167164767.jpg16. Handelsman Y, Henry RR, Bloomgarden ZT, et al. American Association of Clinical Endocrinologists and American College Of Endocrinology Position Statement on the Association of SGLT-2 Inhibitors and Diabetic Ketoacidosis. Endocr Pract. 2016;22(6):753-62. Epub 2016/04/16. doi: 10.4158/ep161292.ps. PubMed PMID: 27082665.
Clinical ConsiderationsSODIUM-GLUCOSE COTRANSPORTER-2 INHIBITORS

NEJM, Dec 3, 201568

ELIXA
69

13% reduction of primary composite outcome: death from cardiovascular causes, nonfatal myocardial infarction, or nonfatal stroke
22% relative risk reduction of death from cardiovascular causes
15% relative risk reduction of death from any causeNo change in relative risk reduction of hospitalization for
heart failure
NEJM June 13, 2016.
70

Study DesignTHE LEADER TRIAL (LIRAGLUTIDE)29
72
Key Inclusion Criteria T2DM HbA1c ≥ 7% Antidiabetic medication naïve OR
treated with ≥ 1 oral antidiabetic medication and/or long-acting, NPH or premixed insulin
≥ 50-years-old with established CVD or chronic renal failure OR≥ 60-years-old with ≥ 1 CV risk factor
Key Exclusion Criteria T1DM Use of a GLP-1 RA, DPP-4 inhibitor,
pramlintide or rapid-acting insulin Family or personal history of MEN2 or
medullary thyroid cancer Acute coronary or cerebrovascular
event occurring ≤ 14 days before randomization
MULTICENTER, INTERNATIONAL, DOUBLE-BLIND, NON-INFERIORITY TO SUPERIORITY, PLACEBO-CONTROLLED, RANDOMIZED TRIAL

Primary outcomes in LEADER and EMPA-REG Timing of separation of treatment arms suggest different cardioprotective MoAs
LEADER1
Placebo
Liraglutide
Prop
ortio
n of
indi
vidu
als
with
a M
AC
E ev
ent (
%)
Time from randomisation (months)
HR: 0.86 (95% CI: 0.74;0.99)p=0.04 (superiority)
HR: 0.87 (95% CI: 0.78;0.97)p=0.01 (superiority)
Placebo
Empaglifozin
20
15
10
5
0
0 6 12 18 24 30 36 42 48 54
20
15
10
5
0
0 6 12 18 24 30 36 42 48
EMPA-REG2
3-point MACE: first occurrence of CV death, nonfatal MI or nonfatal strokeCI, confidence interval; HR, hazard ratio; LEADER, Liraglutide Effect and Action in Diabetes: Evaluation of Cardiovascular Outcome Results; MACE, major adverse cardiovascular event; MoA, mode of action
1. Marso et al. N Engl J Med 2016;375:311–22; 2. Zinman et al. N Engl J Med 2015;373:2117–28
3 Point MACE improvement not driven by glycemic efficacy!

74
Primary Outcome ResultsTHE LEADER TRIAL (LIRAGLUTIDE)
Outcome Liraglutide(n = 4668)
Placebo(n = 4672)
Hazard Ratio(95% CI)
Primary Composite Outcome, n (%) 608 (13.0) 694 (14.9) 0.87
(0.78 to 0.97)
Assessment of Individual Primary Outcome Events
Death from CardiovascularCauses, n (%) 219 (4.7) 278 (6.0) 0.78
(0.66 to 0.93)Nonfatal Myocardial Infarction, n (%) 281 (6.0) 317 (6.8) 0.88
(0.75 to 1.03)
Nonfatal Stroke, n (%) 159 (3.4) 177 (3.8) 0.89(0.72 to 1.11)
Abbreviation: CI – confidence interval29. Marso SP, Daniels GH, Brown-Frandsen K, et al. Liraglutide and Cardiovascular Outcomes in Type 2 Diabetes. N Engl J Med. 2016;375(4):311-22. Epub 2016/06/14. doi: 10.1056/NEJMoa1603827. PubMed PMID: 27295427; PubMed Central PMCID: PMCPMC4985288.

GLP-1RA and SGLT-2iProposed cardioprotective MoA
Increased urinary glucose excretion
Glomeruli
Proximaltubule
Distaltubule
SGLT-2i
Empagliflozin
GLP-1RAIncreasedglucosefiltration
Liraglutide Vasodilation
Plaque stability
Blood flow
Endothelialfunction
Inflammation
Smooth muscle proliferation
Platelet aggregation
GLP-1R
Proposed cardioprotective MoA3
• Fluid reduction• Hemodynamic effects• Heart metabolism• Established effects
• Hyperglycaemia• Weight• Visceral adiposity• BP
Increased glucose uptake and glucagon synthesis (adipose, muscle, liver)
Decreased appetite and food intake (brain)
Increased insulin secretion, decreased glucagon secretion (pancreas)
Proposed cardioprotective MoA1,2
• Anti-atherosclerotic • Reduced platelet aggregation• Anti-inflammatory effects• Established effects
• Hyperglycaemia• Weight• Visceral adiposity• BP
BP, blood pressure; GLP-1RA, glucagon-like peptide-1 receptor agonist; MoA, mode of action; SGLT-2i, sodium-glucose cotransporter-2 inhibitor
1. Marso N Engl J Med 2016;375:311–22; 2. Drucker. Cell Metab 2016;24:15–30; 3. Zinman et al. N Engl J Med 2015;373:2117–28

NEJM, Sep 16, 2016
76

NEJM, Sep 16, 201678

Pending Diabetes CV Outcome Studies
Schnell et al. Cardiovasc Diabetol. 2016;15:139-51.
80

Diabetes CV Outcome Studies
81

PCSK9 (Proprotein convertase subtilisin/kexin type 9)
A secreted protein which targets the LDL receptor for degradation
Gain of function mutations cause high LDL-CLoss of function mutations cause low LDL-C Inhibition lowers LDL-C levelsUp-regulated by statin therapy
82

How is cholesterol removed from blood?
LIVER
Circulating LDL particles (which contain a large ApoBprotein) are “grabbed” by an
LDL receptor
83

How is cholesterol removed from blood?
LIVER
The entire complex is then internalized into the hepatocyte for LDL destruction
84

How is cholesterol removed from blood?
LIVER Before the LDL particle is destroyed, the LDL
receptor migrates back to the hepatocyte cell surface so that it can
grab more LDL molecules
Then the LDL particle is destroyed
85

How is cholesterol removed from blood?
LIVER
When PCSK9 is present, however, the LDL-C receptor
gets “stuck” and cannot migrate back to the surface
It therefore gets destroyed along
with the LDL
And the number of LDL-C receptors on the cell surface is depleted
86

The theory behind PCSK9 inhibitors
LIVER
If PCSK9 is inhibited, the LDL-C receptor can migrate
back to the cell surface
And surface LDL receptors will be restored which will reduce the
serum LDL-C level
X
87

90

DOI: 10.1056/NEJMoa1615664