diageo plc - stock prices, financial markets news, ftse 100 index
TRANSCRIPT

UNITED STATESSECURITIES AND EXCHANGE COMMISSION
Washington, D.C. 20549
FORM 20-F
ANNUAL REPORT PURSUANT TO SECTION 13 OR 15(d) OF THESECURITIES EXCHANGE ACT OF 1934
For the fiscal year ended: 30 June 2012
Commission file number 1-10691
DIAGEO plc(Exact name of Registrant as specified in its charter)
England and Wales(Jurisdiction of incorporation or organisation)
Lakeside Drive, Park Royal, London NW10 7HQ, England(Address of principal executive offices)
Paul Tunnacliffe, Company secretaryTel: +44 20 8978 6000
E-mail: [email protected] Drive, Park Royal, London NW10 7HQ, England
(Name, Telephone, E-mail and/or Facsimile number and Address of Company Contact Person)
Securities registered or to be registered pursuant to Section 12(b) of the Act:
Title of each class Name of each exchange on which registered
American Depositary Shares New York Stock ExchangeOrdinary shares of 28101⁄108 pence each New York Stock Exchange*
* Not for trading, but only in connection with the registration of American Depositary Shares representing such ordinaryshares, pursuant to the requirements of the Securities and Exchange Commission.
Securities registered or to be registered pursuant to Section 12(g) of the Act: None
Securities for which there is a reporting obligation pursuant to Section 15(d) of the Act: None
Indicate the number of outstanding shares of each of the issuer’s classes of capital or common stock as of the close of theperiod covered by the Annual Report: 2,754,115,985 ordinary shares of 28101⁄108 pence each.
Indicate by check mark if each registrant is a well-known seasoned issuer, as defined in Rule 405 of theSecurities Act. Yes � No �
If this report is an annual or transition report, indicate by check mark if each registrant is not required to file reportspursuant to Section 13 or 15(d) of the Securities Exchange Act of 1934. Yes � No �
Indicate by check mark whether the Registrant (1) has filed all reports required to be filed by Section 13 or 15(d) of theSecurities Exchange Act of 1934 during the preceding 12 months (or for such shorter period that the Registrant was required tofile such reports) and (2) has been subject to such filing requirements for the past 90 days. Yes � No �
Indicate by check mark whether the registrant has submitted electronically and posted on its corporate Web site, if any,every Interactive Data File required to be submitted and posted pursuant to Rule 405 of Regulation S-T (§232.405 of thischapter) during the preceding 12 months (or for such shorter period that the registrant was required to submit and post suchfiles). Yes � No �
Indicate by check mark whether each registrant is a large accelerated filer, an accelerated filer, or a non-accelerated filer.See definition of ‘‘accelerated filer and large accelerated filer’’ in Rule 12b-2 of the Exchange Act. (Check one):Large Accelerated Filer � Accelerated Filer � Non-Accelerated Filer �
Indicate by check mark which basis of accounting the registrant has used to prepare the financial statements included inthis filing:
U.S. GAAP � International Financial Reporting Standards Other �as issued by the International Accounting Standards Board �
If ‘‘Other’’ has been checked in response to the previous question, indicate by check mark which financial statement itemthe registrant has elected to follow. Item 17 � Item 18 �
If this is an annual report, indicate by check mark whether the registrant is a shell company (as defined in Rule 12b-2 ofthe Exchange Act). Yes � No �
This document comprises the annual report on Form 20-F and the annual report to shareholders for the year ended30 June 2012 of Diageo plc (the 2012 Form 20-F).


Contents
1 Historical information
5 Business description5 Strategy7 Business overview23 Risk factors30 Cautionary statement concerning forward-looking statements
33 Business review33 Introduction37 Operating results 2012 compared with 201161 Operating results 2011 compared with 201078 Trend information79 Liquidity and capital resources83 Capital commitments83 Other contractual obligations84 Post balance sheet events84 Off-balance sheet arrangements84 Risk management85 Critical accounting policies86 New accounting standards
87 Board of directors and company secretary89 Executive committee91 Directors’ remuneration report123 Corporate governance report139 Directors’ report
142 Financial statements143 Report of independent registered public accounting firm144 Consolidated income statement145 Consolidated statement of comprehensive income146 Consolidated balance sheet147 Consolidated statement of changes in equity148 Consolidated statement of cash flows149 Accounting policies of the group157 Notes to the consolidated financial statements
241 Principal group companies242 Report of independent registered public accounting firm – internal controls244 Unaudited computation of ratio of earnings to fixed charges
245 Additional information for shareholders245 Legal proceedings245 Related party transactions245 Share capital247 American depositary shares248 Articles of association253 Exchange controls254 Documents on display254 Taxation258 Warning to shareholders – share of fraud259 Signature260 Exhibits263 Cross reference to Form 20-F
266 Glossary of terms and US equivalents

Contents (continued)
This is the Annual Report on Form 20-F of Diageo plc for the year ended 30 June 2012. Theinformation set out in this Form 20-F does not constitute Diageo plc’s statutory accounts under theUK Companies Acts for the years ended 30 June 2012, 2011 or 2010. KPMG Audit Plc has reported onthose accounts; their audit reports were (i) unqualified, (ii) did not include a reference to any mattersto which the auditors drew attention by way of emphasis without qualifying their report and (iii) didnot contain a statement under section 498 (2) or (3) of the Companies Act 2006 in respect of theaccounts for the years ended 30 June 2012, 2011 or 2010. The accounts for 2011 and 2010 have beendelivered to the registrar of companies and those for 2012 will be delivered in due course.
This document contains forward-looking statements that involve risk and uncertainty. There are anumber of factors that could cause actual results and developments to differ materially from thoseexpressed or implied by these forward-looking statements, including factors beyond Diageo’s control.For more details, please refer to the cautionary statement concerning forward-looking statements onpages 30 to 32.
The content of the company’s website (www.diageo.com and www.diageoreports.com) should notbe considered to form a part of or be incorporated into this report. This report includes names ofDiageo’s products, which constitute trademarks or trade names which Diageo owns or which othersown and license to Diageo for use. In this report, the term ‘company’ refers to Diageo plc and terms‘group’ and ‘Diageo’ refer to the company and its consolidated subsidiaries, except as the contextotherwise requires. A glossary of terms used in this report is included at the end of the report.
Diageo’s consolidated financial statements have been prepared in accordance with InternationalFinancial Reporting Standards (IFRS) as endorsed and adopted for use in the European Union (EU)and IFRS as issued by the International Accounting Standards Board (IASB). References to IFRShereafter should be construed as references to both IFRS as adopted by the EU and IFRS as issued bythe IASB. Unless otherwise indicated, all financial information contained in this document has beenprepared in accordance with IFRS. The brand ranking information presented in this report, whencomparing volume information with competitors, has been sourced from data published during 2011 byImpact Databank. Market data information and competitive set classifications are taken fromindependent industry sources in the markets in which Diageo operates.
Information presented Unless otherwise stated in this document, percentage movements are organicmovements. These movements and operating margins are before exceptional items. Commentary, unlessotherwise stated, refers to organic movements. Share, unless otherwise stated, refers to value share. Seethe ‘Business review’ for an explanation of organic movement calculations. The market data andcompetitive set classifications contained in this document are taken from independent industry sourcesin the markets in which Diageo operates.

Historical information
The following table presents selected consolidated financial data for Diageo prepared underInternational Financial Reporting Standards (IFRS) as endorsed and adopted for use in the EuropeanUnion (EU) and IFRS as issued by the International Accounting Standards Board (IASB) for thefive years ended 30 June 2012 and as at the respective year ends. References to IFRS hereafter shouldbe construed as references to both IFRS as adopted by the EU and IFRS as issued by the IASB, unlessotherwise indicated. The data presented below has been derived from Diageo’s audited consolidatedfinancial statements.
Year ended 30 June
Notes 2012 2011 2010 2009 2008
£ million £ million £ million £ million £ million
Income statement dataSales . . . . . . . . . . . . . . . . . . . . . . . . . . . . . . . 14,594 13,232 12,958 12,283 10,643Operating profit . . . . . . . . . . . . . . . . . . . . . . 1,2 3,158 2,595 2,574 2,418 2,212Profit for the yearContinuing operations . . . . . . . . . . . . . . . . . . 1,2 2,083 2,017 1,762 1,704 1,560Discontinued operations . . . . . . . . . . . . . . . . . 3 (11) — (19) 2 26
Total profit for the year . . . . . . . . . . . . . . . . . 1,2 2,072 2,017 1,743 1,706 1,586
pence pence pence pence pence
Per share dataDividend per share . . . . . . . . . . . . . . . . . . . . 4 43.50 40.40 38.10 36.10 34.35Earnings per shareBasicContinuing operations . . . . . . . . . . . . . . . . . . 1 78.2 76.2 66.3 64.5 58.0Discontinued operations . . . . . . . . . . . . . . . . . (0.4) — (0.8) 0.1 1.0
Basic earnings per share . . . . . . . . . . . . . . . . 1 77.8 76.2 65.5 64.6 59.0
DilutedContinuing operations . . . . . . . . . . . . . . . . . . 1 77.8 76.0 66.2 64.3 57.6Discontinued operations . . . . . . . . . . . . . . . . . (0.4) — (0.8) 0.1 1.0
Diluted earnings per share . . . . . . . . . . . . . . . 1 77.4 76.0 65.4 64.4 58.6
million million million million million
Average shares . . . . . . . . . . . . . . . . . . . . . . . 2,495 2,493 2,486 2,485 2,566
As at 30 June
2012 2011 2010 2009 2008
£ million £ million £ million £ million £ million
Balance sheet dataTotal assets . . . . . . . . . . . . . . . . . . . . . . . . . . 1 22,350 19,777 19,454 18,018 15,992Net assets . . . . . . . . . . . . . . . . . . . . . . . . . . . 6,811 5,985 4,786 3,874 4,133Net borrowings . . . . . . . . . . . . . . . . . . . . . . . 5 7,570 6,450 6,954 7,419 6,447Equity attributable to the parent company’s
equity shareholders . . . . . . . . . . . . . . . . . . . 5,588 5,245 4,007 3,169 3,463Called up share capital . . . . . . . . . . . . . . . . . . 6 797 797 797 797 816
1
Historical information (continued)
Notes to the historical information
1 Accounting policies The consolidated financial statements for the five years ended 30 June 2012were prepared in accordance with IFRS. The IFRS accounting policies applied by the group to thefinancial information in this document are presented in ‘Accounting policies of the group’ in theconsolidated financial statements.
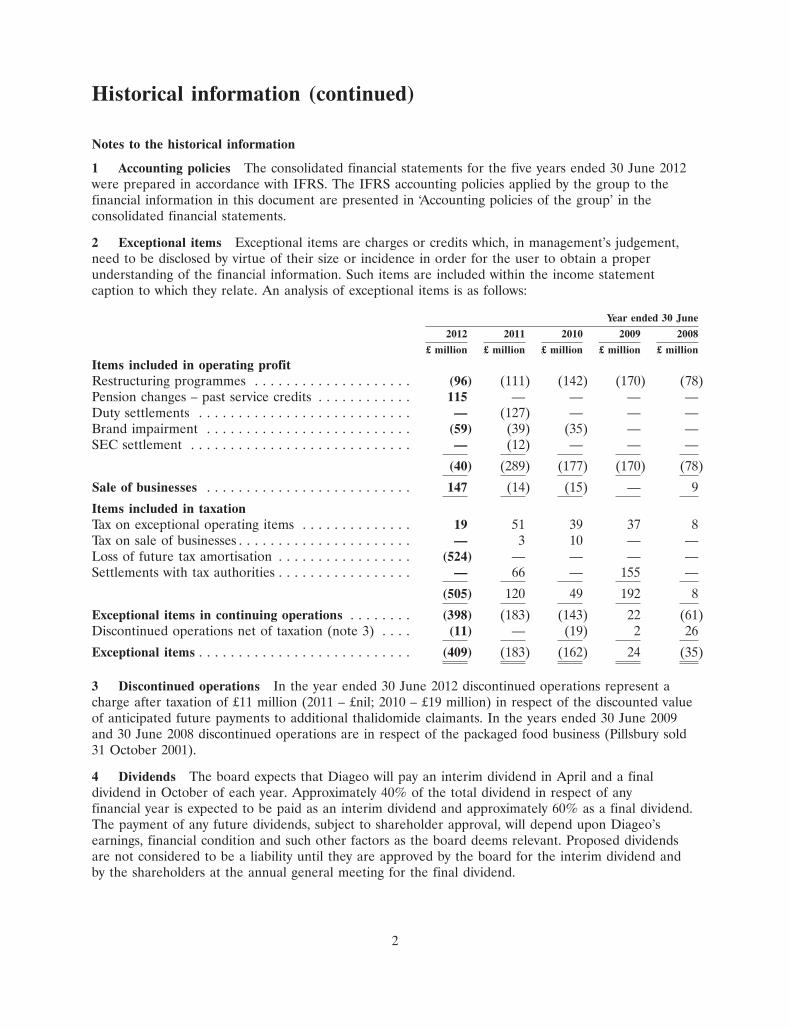
2 Exceptional items Exceptional items are charges or credits which, in management’s judgement,need to be disclosed by virtue of their size or incidence in order for the user to obtain a properunderstanding of the financial information. Such items are included within the income statementcaption to which they relate. An analysis of exceptional items is as follows:
Year ended 30 June
2012 2011 2010 2009 2008
£ million £ million £ million £ million £ million
Items included in operating profitRestructuring programmes . . . . . . . . . . . . . . . . . . . . (96) (111) (142) (170) (78)Pension changes – past service credits . . . . . . . . . . . . 115 — — — —Duty settlements . . . . . . . . . . . . . . . . . . . . . . . . . . . — (127) — — —Brand impairment . . . . . . . . . . . . . . . . . . . . . . . . . . (59) (39) (35) — —SEC settlement . . . . . . . . . . . . . . . . . . . . . . . . . . . . — (12) — — —
(40) (289) (177) (170) (78)
Sale of businesses . . . . . . . . . . . . . . . . . . . . . . . . . . 147 (14) (15) — 9
Items included in taxationTax on exceptional operating items . . . . . . . . . . . . . . 19 51 39 37 8Tax on sale of businesses . . . . . . . . . . . . . . . . . . . . . . — 3 10 — —Loss of future tax amortisation . . . . . . . . . . . . . . . . . (524) — — — —Settlements with tax authorities . . . . . . . . . . . . . . . . . — 66 — 155 —
(505) 120 49 192 8
Exceptional items in continuing operations . . . . . . . . (398) (183) (143) 22 (61)Discontinued operations net of taxation (note 3) . . . . (11) — (19) 2 26
Exceptional items . . . . . . . . . . . . . . . . . . . . . . . . . . . (409) (183) (162) 24 (35)
3 Discontinued operations In the year ended 30 June 2012 discontinued operations represent acharge after taxation of £11 million (2011 – £nil; 2010 – £19 million) in respect of the discounted valueof anticipated future payments to additional thalidomide claimants. In the years ended 30 June 2009and 30 June 2008 discontinued operations are in respect of the packaged food business (Pillsbury sold31 October 2001).
4 Dividends The board expects that Diageo will pay an interim dividend in April and a finaldividend in October of each year. Approximately 40% of the total dividend in respect of anyfinancial year is expected to be paid as an interim dividend and approximately 60% as a final dividend.The payment of any future dividends, subject to shareholder approval, will depend upon Diageo’searnings, financial condition and such other factors as the board deems relevant. Proposed dividendsare not considered to be a liability until they are approved by the board for the interim dividend andby the shareholders at the annual general meeting for the final dividend.
2

Historical information (continued)
The table below sets out the amounts of interim, final and total cash dividends paid by thecompany on each ordinary share. The dividends are translated into US dollars per ADS (each ADSrepresenting four ordinary shares) at the noon buying rate on each of the respective dividend paymentdates.
Year ended 30 June
2012 2011 2010 2009 2008
pence pence pence pence pence
Per ordinary share Interim . . . . . . . . . . . . . . . . . 16.60 15.50 14.60 13.90 13.20Final . . . . . . . . . . . . . . . . . 26.90 24.90 23.50 22.20 21.15
Total . . . . . . . . . . . . . . . . . 43.50 40.40 38.10 36.10 34.35
$ $ $ $ $Per ADS Interim . . . . . . . . . . . . . . . . . 1.05 1.02 0.90 0.82 1.05
Final . . . . . . . . . . . . . . . . . 1.69 1.59 1.48 1.46 1.46
Total . . . . . . . . . . . . . . . . . 2.74 2.61 2.38 2.28 2.51
Note: Subject to shareholders’ approval the final dividend for the year ended 30 June 2012 will be paidon 22 October 2012, and payment to US ADR holders will be made on 26 October 2012. In the tableabove, an exchange rate of £1 = $1.57 has been assumed for this dividend, but the exact amount of thepayment to US ADR holders will be determined by the rate of exchange on 22 October 2012.
5 Net borrowings definition Net borrowings are defined as gross borrowings (short term borrowingsand long term borrowings plus finance lease liabilities plus interest rate hedging instruments, crosscurrency interest rate swaps and funding foreign currency forwards and swaps used to manageborrowings) less cash and cash equivalents and other liquid resources.
6 Share capital During the year ended 30 June 2009 the company purchased 38 million (2008 –97 million) ordinary shares for cancellation or to be held as treasury shares at a cost of £354 million(2008 – £1,008 million) as part of a share buyback programme.
7 Exchange rates A substantial portion of the group’s assets, liabilities, revenues and expenses aredenominated in currencies other than pounds sterling. For a discussion of the impact of exchange ratefluctuations on the group’s financial position and results of operations, see note 23 to the consolidatedfinancial statements.
The following table shows period end and average US dollar/pound sterling noon buying exchangerates, for the periods indicated, expressed in US dollars per £1.
Year ended 30 June
2012 2011 2010 2009 2008
$ $ $ $ $
Year end . . . . . . . . . . . . . . . . . . . . . . . . . . . . . . . . . . . . . . . . . . . . . 1.57 1.61 1.50 1.65 1.99Average rate(a) . . . . . . . . . . . . . . . . . . . . . . . . . . . . . . . . . . . . . . . . 1.59 1.59 1.57 1.60 2.01
(a) The average of the noon buying rates on the last business day of each month during the yearended 30 June.
3

Historical information (continued)
The following table shows period end, high, low and average US dollar/pound sterling noon buyingexchange rates by month, for the six month period to 24 August 2012, expressed in US dollars per £1.The information in respect of the month of August is for the period up to and including 24 August2012. The US dollar/pound sterling noon buying exchange rate on 24 August 2012 was 1.58.
2012
August July June May April March
$ $ $ $ $ $
Month end . . . . . . . . . . . . . . . . . . . . . . . . . . . . . . . . . . . 1.58 1.57 1.57 1.54 1.62 1.60Month high . . . . . . . . . . . . . . . . . . . . . . . . . . . . . . . . . . . 1.59 1.57 1.57 1.62 1.63 1.60Month low . . . . . . . . . . . . . . . . . . . . . . . . . . . . . . . . . . . . 1.55 1.54 1.54 1.54 1.58 1.56Average rate(b) . . . . . . . . . . . . . . . . . . . . . . . . . . . . . . . . 1.57 1.56 1.56 1.59 1.60 1.58
(b) The average of the noon buying rates on each business day of the month.
These rates have been provided for information only. They are not necessarily the rates that have beenused in this document for currency translations or in the preparation of the consolidated financialstatements. See note 2(e) to the consolidated financial statements for the actual rates used in thepreparation of the consolidated financial statements.
4

Business description
Diageo is the world’s leading premium drinks business. Its geographic breadth and range of leadingbrands across categories is unparalleled. The business is balanced having a strong presence in theworld’s largest and most profitable beverage alcohol market, the United States; an integrated WesternEuropean business; and a large and increasing presence in the faster growing markets of Asia, Africa,Latin America, Russia and Eastern Europe. Diageo’s strong financial position has been built throughthe growth of its brands, the development of its routes to market and the value creating acquisitions ithas made. Diageo maintains the strength of its brands through excellence in marketing and innovation.Diageo has scale but acts with agility to deliver top line growth, margin improvement and improvingshareholder returns. Diageo is proud of the role its brands play in the social life and celebrations ofconsumers around the globe.
Diageo plc is incorporated as a public limited company in England and Wales. Diageo wasincorporated as Arthur Guinness Son & Company Limited on 21 October 1886. The group was formedby the merger of Grand Metropolitan Public Limited Company (GrandMet) and Guinness PLC (theGuinness Group) in December 1997. Diageo plc’s principal executive office is located at LakesideDrive, Park Royal, London NW10 7HQ and its telephone number is +44 (0) 20 8978 6000.
Strategy
Diageo’s strategy is to drive top line growth and margin improvement in a sustainable and responsibleway, to deliver consistent value creation for shareholders over the long term. It will do this through itsgeographic breadth, its outstanding brands across beverage alcohol categories and the expertise of itspeople.
Diageo’s broad range of leading brands covers all major categories. It owns seven of the world’stop 20 brands, including Smirnoff, the number one brand by volume and Johnnie Walker, the numberone brand by value and manages Jose Cuervo, making Diageo the leading premium spirits business inthe world by volume, net sales and operating profit. In beer, Diageo owns one of the truly global beerbrands, Guinness. Diageo’s wine brands are sold predominantly in North America and Great Britain.Diageo’s global brands are complemented by strong local brands to create category breadth. Diageo’sbrands cover a range of price points, from Diageo’s reserve brands, including Johnnie Walker BlueLabel, Cıroc and Ketel One vodka to more affordable brands, tailored for the growing number ofemerging middle class consumers, such as VAT69 in India, White Horse in Russia and 20cl bottles ofJohnnie Walker Red Label across Africa.
Diageo is a global company selling products in more than 180 markets around the world. In thedeveloped markets, primarily, in North America and Europe, Diageo has built scale and strong routesto market. In the emerging markets, Diageo is the number one international spirits company in Asia,Latin America and Africa. These rapidly growing markets now contribute nearly 40% of Diageo’s netsales, up from a fifth in 2005. These markets are expected to contribute 50% of Diageo’s net sales by2015 through double digit organic growth and targeted acquisitions.
Diageo, consistent with its current strategy, will continue to focus on growing its brands on aworldwide basis and expects to make selective acquisitions in both its developed and emerging markets.Diageo explores the potential to make acquisitions on an ongoing basis and is currently evaluating anumber of such opportunities of which some could be significant although no agreements orcommitments for any significant acquisitions currently exist. Funds for any such acquisitions would bedrawn from internally generated cash, bank borrowings or the issuance of equity or debt securities (inan amount that cannot now be determined) and the proceeds of any potential disposals. No materialdisposals are currently contemplated.
5

Business description (continued)
In evaluating financing of any such acquisitions, Diageo’s management remains committed toenhancing shareholder value in the long term, both by investing in the businesses and brands so as toimprove the return on investment and by managing the group’s capital structure. The acquisitions ofMey Icki in Turkey, Ypioca in Brazil, the Serengeti and Meta breweries in Africa and the investmentsin Shuijingfang and Halico in Asia were partially driven by this strategy.
Diageo leads the industry in marketing and innovation combining expertise and creative alliancesto engage consumers via digital and traditional media channels. This expertise and collaboration,combined with the benefits of global scale and consumer insights, delivers world class marketingcampaigns. For example, the global Johnnie Walker ‘Keep Walking’ campaign has been in place forover 10 years. While the campaign is based on the universal appeal of personal progress, each markethas local creative executions which reflect local insights.
Diageo’s innovation programme is also based on consumer insights. Recent launches have focusedon the consumers’ wish for luxury, the tastes and increasing affluence of the emerging middle classconsumer and have increased the accessibility of spirits through flavour extensions and packaging anddrink formats.
Diageo has strong routes to market which leverage local expertise. In the United States Diageo isrequired by law to operate via a three-tier distribution system which separates suppliers, distributorsand retailers. Diageo works with distributors who provide a substantial dedicated sales team of over2,900 people. Outside of the United States Diageo owns and controls the route to market in manymarkets, and where Diageo has not established its own subsidiary, the route to market is through jointventures, associates and third party distributors. Diageo works in collaboration with its customers todrive profitable category growth, by building partnerships with retailers and on-premise customers. The‘Diageo Way of Selling’ programme equips both Diageo and its customers with the tools to be the bestsales force in the industry and to create commercial and strategic value for all parties. The EuropeanCustomer Collaboration Centre provides a state of the art facility to bring consumer, shopper, retailerand distributor insights together to facilitate integrated planning with customers. These tools enableDiageo to realise its ambition to become an indispensable business partner to its customers.
Diageo has a history of being a sustainable and responsible company dating from Arthur Guinnesswho was responsible for philanthropic community programmes and through the 1930s when itspredecessor companies marketed their brands in a responsible manner. Diageo understands the social,environmental and economic impact of its activities and has adopted a structured approach to managethese impacts, to build engagement across stakeholders, to create value, especially in emerging markets;and to protect Diageo’s license to operate.
Diageo and its employees are proud of the responsible manner in which its brands are marketedand the role that moderate consumption of its brands can play as part of the balanced lifestyle formillions of people. Diageo seeks to be at the forefront of industry efforts to promote responsibledrinking and works with key stakeholders to combat alcohol misuse.
Diageo’s supply organisation is responsible for producing, distilling, brewing, bottling, packagingand distributing its brands. It is committed to efficient, sustainable production. Diageo has created acompetitive advantage in both its cost base and in the first class customer service it delivers. Investmentin production facilities is focused on building capacity for the production of scotch, beer and rum, withboth high speed and high volume, cost efficient production lines and with flexible production facilitiesto create an industry leading supply chain for innovation, especially in luxury products. The businessrecognises that it operates in a world where natural resources are limited. Diageo has set itself
6

Business description (continued)
challenging environmental targets covering water efficiency; increasing use of sustainable packaging andreduction in pollution, carbon emissions and waste-to-landfill. Diageo’s production teams have createdaward winning technologies to meet these targets with the aim of reducing Diageo’s environmentalfootprint, delivering business efficiencies and securing supply into the future.
Diageo is committed to generating prosperity in the communities in which it operates, especially inthe emerging markets by integrating its supply chain into the local community and via direct communityinitiatives such as ‘Learning for Life’ and ‘Water of Life’.
Diageo believes that industry leading performance will be delivered through a talented and diverseworkforce and great leadership. The company has active programmes that ensure the development ofits management and leaders. Great leadership combined with a culture of good governance and ethics,protect Diageo’s reputation and supports the sustainable efficient growth of the business.
Business overview
Market participation Diageo manages its business through five regions: North America, Europe,Africa, Latin America and Caribbean and Asia Pacific. North America is the biggest region by net salesand operating profit. Here the business is focused on using scale to drive cost advantage, to drivecontinued growth in the on trade, to deliver industry leading innovation and broaden its reach to themulticultural consumer. Europe comprises Western Europe, Russia and Eastern Europe and Turkey.The country teams within Western Europe focus on sales execution, whilst marketing and back officefunctions are integrated at a Western Europe level to drive flexibility and efficiency. The remainingemerging markets of Europe are resourced to capture the opportunity presented by the growingnumber of middle class consumers. The strategy in Africa is to grow Diageo’s leadership acrossbeverage alcohol, increasing its presence in beer and growing the international spirits business. In LatinAmerica and Caribbean the primary focus is continued leadership in scotch, whilst broadening categorybreadth to include vodka and liqueurs. The strategy in Asia Pacific is to drive net sales growth throughthe continued development of super and ultra premium scotch and leverage the emerging middle classconsumer opportunity in the faster growing markets via a combination of organic and inorganic growth.
Market leading brands In calendar year 2011, the Diageo brand range included eight of the top 20premium spirits brands worldwide by volume estimated by Impact Databank. Diageo classifies itsbrands as spirits, beer, wine and ready to drink.
An analysis of the group’s volume is as follows:
2012 2011 2010Volume Volume Volume
units million units million units million
Spirits . . . . . . . . . . . . . . . . . . . . . . . . . . . . . . . . . . . . . . . . . . . 121 113 109Beer . . . . . . . . . . . . . . . . . . . . . . . . . . . . . . . . . . . . . . . . . . . . 27 26 25Wine . . . . . . . . . . . . . . . . . . . . . . . . . . . . . . . . . . . . . . . . . . . . 3 3 3Ready to drink . . . . . . . . . . . . . . . . . . . . . . . . . . . . . . . . . . . . 6 6 6
Total . . . . . . . . . . . . . . . . . . . . . . . . . . . . . . . . . . . . . . . . . . . . 157 148 143
Strategic brands Diageo classifies 14 brands as strategic brands worldwide. These brands areconsidered to have the greatest current and future earnings potential. Figures for strategic brands
7

Business description (continued)
exclude related ready to drink products. In the year ended 30 June 2012, strategic brands accounted for61% of volume and 60% of net sales. 72% of the group’s marketing spend supports these brands.
2012Brand Volume
units million
Johnnie Walker Scotch whisky . . . . . . . . . . 19 The number one Scotch whisky in theworld*
Crown Royal Canadian whisky . . . . . . . . . . 5 The number one Canadian whisky in theworld**
JεB Scotch whisky . . . . . . . . . . . . . . . . . . . 5 The number five Scotch whisky in theworld*
Buchanan’s Scotch whisky . . . . . . . . . . . . . 2 The number two premium Scotch whisky inLatin America*
Windsor Premier Scotch whisky . . . . . . . . . 1 The number one super premium Scotchwhisky in Asia Pacific*
Bushmills Irish whiskey . . . . . . . . . . . . . . . 1 Distilled at Ireland’s oldest workingdistillery
Smirnoff vodka . . . . . . . . . . . . . . . . . . . . . 26 The number one premium vodka in theworld**
Ketel One vodka (exclusive worldwide The number two super premium vodka indistribution rights) . . . . . . . . . . . . . . . . . 2 the United States***
Cıroc vodka . . . . . . . . . . . . . . . . . . . . . . . 2 The number two ultra premium vodka inthe world*
Captain Morgan rum and rum based The number two brand in the rum categoryproducts . . . . . . . . . . . . . . . . . . . . . . . . 10 in the world**
Baileys Irish Cream liqueur . . . . . . . . . . . . 7 The number one liqueur in the world**Jose Cuervo tequila (agency brand in North The number one premium tequila in the
America and many other markets)† . . . . . 4 world**Tanqueray gin . . . . . . . . . . . . . . . . . . . . . . 2 The number one imported gin in the
United States****Guinness stout . . . . . . . . . . . . . . . . . . . . . 11 The number one stout in the world*****
* Source: IWSR 2011;
** Source: Impact Databank;
*** Source: IRI;
****Source: Adams Market Research Alcohol Beverage Industry;
*****Source: Plato Logic
† Portfolio of premium drinks comprises brands owned by the company as a principal and somebrands held by the company under agency or distribution agreements. Diageo’s principal agencybrand is Jose Cuervo in North America and many other markets (with distribution rights extendingto 1 July 2013).
8

Business description (continued)
Other spirits Ready to drink brandsbrands include Other beer brands include* Wine brands include include
Gordon’s gin and vodka Malta Guinness non-alcoholic malt Blossom Hill Smirnoff Ice
Old Parr Scotch whisky Harp lager Sterling Vineyards Smirnoff cocktails
Bundaberg rum Tusker lager Beaulieu Vineyard Bundaberg ready to drink
Seagram’s 7 Crownwhiskey Senator lager Jose Cuervo cocktails
Bell’s Scotch whisky Red Stripe lager
The Classic Malts Scotchwhiskies
Yeni Raki
* Diageo also brews and sells other companies’ beer brands under licence, including Budweiser and Carlsberglagers in Ireland, Heineken lager in Jamaica and Tiger beer in Malaysia. There can be no assurance thatDiageo will be able to prevent termination of distribution, manufacturing or licence agreements or torenegotiate distribution, manufacturing or licence agreements on favourable terms when they expire.
Production Diageo owns manufacturing production facilities across the globe, including maltings,distilleries, breweries, packaging plants, maturation warehouses, cooperages, vineyards, wineries anddistribution warehouses. Diageo’s brands are also produced at plants owned and operated by thirdparties and joint ventures at a number of locations internationally.
Approximately 84% of total manufacturing is undertaken by Global Supply organised into fourproduction centres: Europe Supply, America Supply, Global Beer Supply and Asia Pacific Supply. Theremaining production activities of the group are integrated into the distribution organisation, principallyin Africa. The locations, principal activities, products, packaging production capacity and packagingproduction volume of Diageo’s principal production centres in the year ended 30 June 2012 are set outin the table below:
9

Business description (continued)
ProductionProduction volume incapacity in 2012 inmillions of millions ofequivalent equivalent
Production centre Location Principal products units* units
Europe Supply . . . . . . . . . United Kingdom Scotch whisky, Irish 80 52whiskey, gin, vodka,rum, ready to drink
Ireland (Baileys) Irish cream liqueur, 12 8vodka
Italy (Santa Vittoria) Vodka, wine, rum, ready 10 6to drink
Turkey Raki, vodka, gin, 10 7liqueur, wine
America Supply . . . . . . . . . United States, Canada, Vodka, gin, tequila, 44 38US Virgin Islands rum, wine, Canadian
whisky, Americanwhiskey, progressiveadult beverages, readyto drink
United States Wine 2 1
Global Beer Supply . . . . . . Ireland (Guinness) Beer 9 8Jamaica Beer 1 1
Asia Pacific Supply . . . . . . Australia Rum, vodka, ready to 4 3drink
Singapore Finishing centre 4 2
Africa Supply . . . . . . . . . . Nigeria Beer 6 5South Africa Beer and spirits 3 3East Africa Beer 10 9Africa Regional Beer 3 3Markets
* Capacity represents ongoing production capacity at any production centre. The productioncapacities quoted in the table are based on actual production levels for the year ended 30 June2012 adjusted for the elimination of unplanned losses and inefficiencies, and taking into accountplanned manning levels for the coming year.
Spirits are produced in distilleries located worldwide. The group owns 29 Scotch whisky distilleries inScotland, an Irish whiskey distillery in Northern Ireland, two whisky distilleries in Canada and awhiskey distillery in the United States. Diageo produces Smirnoff internationally with the production ofsome brands such as Gordon’s vodka (United States) or Cıroc (France) being managed in one location.Ketel One vodka is purchased as finished product from The Nolet Group. Gin distilleries are located inboth the United Kingdom and the United States. Baileys is produced in the Republic of Ireland andNorthern Ireland. Rum is blended and bottled in the United States, Canada, Italy and the UnitedKingdom, and is distilled, blended and bottled in the US Virgin Islands, Australia, Venezuela and alsoas a result of an acquisition of a controlling interest in Zacapa in July 2011, in Guatemala. Diageo’s
10
Business description (continued)
maturing Scotch whisky is located in warehouses in Scotland (primarily at Blackgrange), its maturingCanadian whisky in La Salle and Gimli in Canada and its maturing American whiskey in Kentucky andTennessee in the United States.
In June 2012, Diageo acquired a controlling equity stake in Sichuan Shuijingfang Co., Ltd(Shuijingfang). Shuijingfang owns a distillery which produces a Chinese white sprit, in Chengdu,Sichuan province in China.
In August 2011 Diageo acquired Mey Icki which owns ten plants in Turkey. Six of these plants areintermediate and finishing plants for raki. Two plants are for vodka, gin and liqueur production andtwo for wine production.
In May 2011 Diageo announced the closure of the Menlo Park bottling plant in California and thespecialty product building at the Relay plant in Maryland, in the United States. New investment isbeing made in the North American spirits supply chain principally in the packaging plants at Plainfieldin Illinois and Relay in Maryland.
A restructuring of the group’s supply operations in Scotland was announced in July 2009. Thisresulted in the consolidation of production activities into fewer sites. The Kilmarnock packaging plantceased operations in March 2012 after production was moved to the newly expanded packaging facilityat Leven in Fife.
The group plans to lay down maturing scotch inventory in order to be able to meet future demandand to invest at a cost of over £500 million in maturing spirit over the next five years. This requires theconstruction of a new malt distillery and additional distillation and warehousing capacity in Scotland forover £500 million in the same period.
A distillery was opened in November 2010 in St. Croix as a result of a public/private initiativeformed by Diageo and the government of the US Virgin Islands. This new facility has the capacity todistil up to 13 million equivalent units annually and will supply all bulk rum used to produce CaptainMorgan branded products for the United States.
Diageo produces a range of ready to drink products mainly in the United Kingdom, Italy, SouthAfrica, Australia, the United States and Canada.
Diageo’s principal brewing facilities are at the St James’s Gate brewery in Dublin, Ireland and alsoin Nigeria, Kenya, Ghana, Cameroon, Tanzania, Malaysia and Jamaica. In addition, Diageo owns a 25%equity interest in Sedibeng brewery in South Africa and in January 2012 completed the acquisition ofMeta Abo Brewery in Ethiopia. Additionally, Guinness is brewed by more than 35 third parties aroundthe world under licence arrangements. Guinness flavour extract is shipped from Ireland to all overseasGuinness brewing operations. In January 2012 Diageo announced that its Irish breweries will becentralised in Dublin’s St James’s Gate site as part of an investment project at a cost of A153 million(£123 million). The brewing activities at Dundalk and Kilkenny are expected to cease by the end of2013.
All Guinness Draught production in the Republic of Ireland is at the St James’s Gate brewery inDublin. Guinness Draught in cans and bottles is packaged at Runcorn and Belfast in the UnitedKingdom. The Runcorn facility performs the kegging of Guinness Draught, transported to the UnitedKingdom in bulk for the Great Britain market.
11

Business description (continued)
Diageo’s principal wineries are in the United States and Argentina. For European markets, winesare mainly bottled in Diageo’s facilities in Italy. Wines are sold both in their local markets andoverseas.
Property, plant and equipment Diageo owns approximately 90% of the manufacturing, distilling,brewing, bottling and administration facilities it uses across the group’s worldwide operations. It holdsapproximately 5% of properties on leases in excess of 50 years. The principal production facilities aredescribed above. As at 30 June 2012, Diageo’s land and buildings are included in the group’sconsolidated balance sheet at a net book value of £877 million. Diageo’s two largest individual facilities,in terms of book value, are the Leven bottling and blending facility in Scotland and St James’s Gatebrewery in Dublin. Of the book value of Diageo’s lands and buildings approximately 37% areproperties located in Great Britain, 18% in Ireland and 16% in the United States.
During the years ended 30 June 2011 and 30 June 2010 a number of vineyards and facilitieslocated in Napa Valley, California were sold and leased back to Diageo under a 20-year lease, withDiageo holding options to extend the lease at fair value for up to 80 years in total. Diageo remains theoperator of the properties under the lease agreement and retains ownership of the brands, vines andgrapes, which remain a strategic part of Diageo’s wine business.
Raw materials and supply agreements The group has a number of long term contracts in place forthe purchase of significant raw materials including glass, other packaging, tequila, bulk whisky, neutralspirits, cream, rum and grapes. In addition, forward contracts are in place for the purchase of otherraw materials including sugar and cereals to minimise the effects of short term price fluctuations.
Cream is the principal raw material used in the production of Irish cream liqueur and is sourcedfrom Ireland. Grapes are used in the production of wine and are sourced from suppliers in the UnitedStates and Argentina. Other raw materials purchased in significant quantities for the production ofspirits and beer are molasses, cereals, sugar and a number of flavours (such as juniper berries, agave,aniseed, chocolate and herbs). These are sourced from suppliers around the world.
The majority of products are supplied to customers in glass bottles. Glass is purchased fromsuppliers located around the world, the principal supplier being the Owens Illinois group.
Diageo has a supply agreement with Casa Cuervo SA de CV, a Mexican company, for the supplyof bulk tequila used to make the Jose Cuervo line of tequilas and tequila drinks in the United States.The supply agreement extends to June 2013. Diageo is currently in negotiations with Casa Cuervo SAregarding the relationship between the two companies.
Diageo sources rum for its Captain Morgan products from the Diageo distillery in the US VirginIslands.
Marketing and distribution Diageo is committed to investing in its brands. In the year ended 30 June2012, £1,691 million was spent worldwide on marketing brands with a focus on its 14 strategic brandsthat accounted for 72% of total marketing spend.
Diageo makes extensive use of a diverse range of new and traditional media, from magazine,newspaper, point of sale and billboard advertising, and uses radio, cinema, television and onlineadvertising where appropriate and permitted by law to engage with consumers and customers. Diageoruns consumer promotional programmes in the on trade (for example, licensed bars and restaurants)and supports customers in both the on and off trades with shopper/consumer promotions.
12

Business description (continued)
Sponsorship also plays an important role in Diageo’s brand marketing and commercial profile.Diageo has formed innovative global partnerships in music with Madonna and Live Nation, theGuinness ‘Arthur’s Day’ concerts and the Buchanan’s ‘Share Yourself’ platform. Diageo also hasimportant partnerships in sport, such as the Vodafone McLaren Mercedes Formula One Team,Manchester United, in rugby, with the English, Irish, Scottish and Welsh rugby teams as well as the SixNations Championship, and in golf as title sponsor of the Johnnie Walker Championship and sponsorand host of the 2014 Ryder Cup at Gleneagles.
Business analysis In the year ended 30 June 2012, North America, Europe, Africa, Latin Americaand Caribbean and Asia Pacific contributed 40%, 27%, 11%, 11% and 10%, respectively, of the group’soperating profit before exceptional items and corporate costs.
An analysis of net sales and operating profit by operating segment for the year ended 30 June2012 is set out in the table below.
20112012 (restated)*
Operating Operatingprofit/(loss) profit/(loss)
before beforeexceptional Operating exceptional Operating
Net sales items profit/(loss) Net sales items profit/(loss)
£ million £ million £ million £ million £ million £ million
North America . . . . . . . . . . . . . . . 3,556 1,354 1,343 3,366 1,275 1,252Europe . . . . . . . . . . . . . . . . . . . . 2,949 925 966 2,703 796 639Africa . . . . . . . . . . . . . . . . . . . . . 1,447 380 375 1,357 333 326Latin America and Caribbean . . . . 1,239 383 381 1,063 318 312Asia Pacific . . . . . . . . . . . . . . . . . 1,501 342 332 1,377 299 249Global Supply . . . . . . . . . . . . . . . . — — (40) — — (35)Corporate . . . . . . . . . . . . . . . . . . 70 (186) (199) 70 (137) (148)
Total . . . . . . . . . . . . . . . . . . . . . . 10,762 3,198 3,158 9,936 2,884 2,595
* Restated for changes in reporting segments, see page 35.
North America North America is the largest market for Diageo in terms of operating profit, and thelargest market for premium drinks in the world. Diageo sells and markets its products through fouroperating units: US Spirits & Wines, Diageo-Guinness USA, Diageo Chateau & Estate Wines andDiageo Canada. From the year ended 30 June 2012, North America includes the North Americanoperations of Global Travel.
The United States Spirits & Wines business, while managed as a single business unit, executessales and marketing activities through seven divisions. Within the United States, there are generally twotypes of regulatory environments for spirits and wine: open states and control states. In open states,companies are permitted to sell spirits directly to independent distributors. In these open states, Diageogenerally trades through a three-tier distribution system, where the product is initially sold todistributors, who then sell it to on and off trade retailers. In most control states, Diageo sells its spiritsproducts to state liquor control boards through the bailment warehousing system, and from there tostate or agency liquor stores. There are variations – for example, certain states control distribution butnot retail sales. Generally, wines are treated in the same way as spirits, although most states that are
13

Business description (continued)
control states for spirits are open states for wines. Five of the US Spirits & Wine divisions executeagainst open states and two execute against control states.
National brand strategy and strategic accounts marketing are managed at the North America level.The Spirits & Wines divisions market Diageo’s collection of spirits and wine brands across the UnitedStates.
Diageo-Guinness USA markets Diageo’s US beer brands nationally as well as the group’sprogressive adult beverages. Beer distribution generally follows the three-tier open state regulationsacross the US.
Diageo Chateau & Estate Wines (DC&E) owns, leases and operates wineries in California. In theUS, the majority of the wine is sold through the Spirits & Wines divisions with the remainder soldthrough the winery visitors centres and club sales. In the year ended 30 June 2012, DC&E completedits portfolio rationalisation strategy disposing of certain brands and terminating other agency brands.
The Canada business unit distributes the group’s collection of spirits, beer and wine brands acrossall Canadian territories. In Canada, beer and spirits distribution laws are generally consistent andsimilar to those of control states in the United States. Diageo, however, has some licences to deliverkeg beer directly to licensed accounts, which account for approximately 20% of Diageo’s beer businessin Canada.
Across the United States, Diageo’s distributors and brokers have over 2,900 dedicated sales peoplefocused on selling its spirits and wine brands. Diageo has pursued a distribution strategy centred onconsolidating the distribution of Diageo’s US spirits and wine brands into a single distributor or brokerin each state where possible. The strategy is designed to provide a consolidated distribution network,which will limit the duplication of activities between Diageo and the distributor, improve sellingcapabilities and enable a number of alternative approaches to optimise product distribution. To date,Diageo has consolidated its business in 41 markets (40 states plus Washington DC), representing over80% of Diageo’s US spirits and wine volume. The remaining states will be consolidated asopportunities arise. Diageo continues to focus on building the capabilities and selling tools of thedistributors’ dedicated sales forces and creating a more efficient and effective value chain.
Europe In the year ended 30 June 2012 Europe comprises Western Europe, Russia and EasternEurope, Turkey and the European operations of Global Travel.
Western Europe comprises Great Britain, Ireland, Iberia, Italy, Switzerland, Germany, Austria,Benelux, Nordics, France, Greece, the Western European reserve brands, Diageo Guinness ContinentalEurope and European wines.
In Great Britain, Diageo sells and markets its products via three business units: Diageo GB(spirits, beer and ready to drink), Percy Fox & Co (wines) and Justerini & Brooks Retail (private clientwines). Products are distributed both through independent wholesalers and directly to the majorgrocers, convenience and specialist stores. In the on trade (for example, licensed bars and restaurants),products are sold through the major brewers, multiple retail groups and smaller regional independentbrewers and wholesalers. The customer base in Great Britain has seen consolidation in recent years inboth the on trade and home consumption channels.
Ireland comprises the Republic of Ireland and Northern Ireland. In both territories, Diageo sellsand distributes directly to both the on trade and the off trade (for example, retail shops andwholesalers) through a telesales operation, extensive sales calls to outlets and third party logisticsproviders.
14

Business description (continued)
Across the remainder of Western Europe, Diageo distributes its spirits brands primarily through itsown distribution companies with the following exceptions. In France Diageo sells its spirits and wineproducts through a joint arrangement with Moet Hennessy, and its beer products through BrasseriesKronenbourg (part of the Carlsberg group). In the Nordic countries Diageo has sales offices in Sweden,Norway and Denmark, and representation through third party distributors in Finland and Iceland. Inall Nordic markets except Denmark, off trade sales are controlled by state monopolies, with alcohol taxrates among the highest in the world, and border trade and duty free are important sources of sales.Smirnoff Ice is sold in Nordic countries through Carlsberg.
A specialist unit, Diageo Guinness Continental Europe, has been established for the distribution ofDiageo’s beer brands in mainland Europe in order to achieve synergies in the marketing anddistribution of the Guinness and Kilkenny brands. The distribution of these brands is managed by thisspecialist unit with particular focus on Germany, Russia and France, which are the largest mainlandEuropean beer markets by size for Diageo.
Russia and Eastern Europe comprises Russia, Poland and 32 distributor serviced countries inCentral and Eastern Europe. In Russia and Poland Diageo operates through wholly owned subsidiaries.Throughout the whole of the former Soviet Union and Eastern Block (excluding Russia and Poland)plus Iceland, Finland, Malta, Cyprus and Israel, Diageo sells and markets its brands via localdistributors. In Hungary, Diageo sells its brands through its associate company Zwack.
In Turkey, Diageo sells its products via the distribution network of its wholly owned subsidiary,Mey Icki. Mey Icki distributes both local brands which are produced in its distilleries (raki, other spiritsand wine) and Diageo’s global spirits brands. Sales to traditional on and off trade outlets are madethrough Mey Icki’s exclusive distributors and sales to some large store chains are made directly by MeyIcki.
Africa In the year ended 30 June 2012, Africa comprises Nigeria, East Africa (Kenya, Tanzania,Uganda, Burundi, Rwanda and South Sudan), South Africa, Africa Regional Markets (including Ghana,Cameroon, Ethiopia, Angola and Mozambique) and the African operations of Global Travel. Diageohas 14 breweries in Africa including Sedibeng in South Africa which is 25% owned by Diageo. Inaddition, Diageo’s beer and spirits brands are produced by third parties in 20 other African countries.Diageo also owns six other manufacturing facilities including glass manufacturing, blending, malting andcider plants.
In Nigeria, Guinness, Harp and Malta are principal brands that are brewed and distributed byGuinness Nigeria plc. Diageo owns 53.8% of the company, which has been brewing Guinness locallysince 1962. Diageo’s spirits brands are distributed by a wholly owned subsidiary.
East African Breweries Limited (EABL) is the leading premium drinks business in East Africa andproduces and distributes beer and spirits brands to a range of consumers. Diageo owns 50.03% ofEABL which in turn owns 100% of Kenya Breweries Limited, 98% of Uganda Breweries Limited and51% of Serengeti Breweries Limited in Tanzania. South Sudan, Rwanda and Burundi are servicedthrough third party arrangements. EABL also owns a glass manufacturer and a malting business.
In South Africa Diageo’s business consists of its spirits business through its wholly ownedsubsidiary Diageo South Africa Limited (DSA); a 42.25% share in DHN Drinks (Pty) Ltd (DHN), ajoint venture with Heineken International (Heineken) and Namibia Breweries Ltd in respect of beer,cider and ready to drink brands; and a 25% interest in Sedibeng Brewery (Pty) Ltd, the remainderbeing owned by Heineken. The route to market for DSA and DHN’s brands in South Africa ismanaged by brandhouse Beverages (Pty) Ltd (brandhouse). Brandhouse is a cost sharing joint venture
15

Business description (continued)
owned equally between DSA and DHN. Diageo also owns 15.01% of Namibia Breweries Ltd. NamibiaBreweries is the producer of Windhoek lager which is sold mainly in Namibia and through DHN inSouth Africa.
Within Africa Regional Markets, Diageo has wholly owned subsidiaries in Cameroon, Ethiopia andReunion and majority owned subsidiaries in Ghana and the Seychelles. Angola and Mozambique arecurrently supplied by third party arrangements. In 2012 Diageo acquired 100% of the equity of MetaAbo Brewery from the Ethiopian government, of which Meta beer is the principal brand.
Diageo has brewing arrangements with the Castel Group to license brew and distribute Guinnessin the Democratic Republic of Congo, Gambia, Gabon, Ivory Coast, Togo, Benin, Burkina Faso, Chad,Mali and Guinea. Diageo sells spirits through distributors in most other sub-Saharan countries.
Latin America and Caribbean In the year ended 30 June 2012, Latin America and Caribbean comprisesPUB (Paraguay, Uruguay, Brazil), West LAC, Andean (Venezuela, Colombia), Mexico and the LACoperations of Global Travel.
In Latin America and Caribbean, distribution is achieved through a mixture of Diageo companiesand third party distributors. In addition, Diageo owns a controlling interest in Desnoes & GeddesLimited, the Jamaican brewer of Red Stripe lager.
In PUB, Diageo sells directly to international retailers in Brazil, while selling through distributorsand wholesalers for the remainder of the business. In Paraguay the majority of customers are served byDiageo with a portion of sales completed through wholesalers. In Uruguay, Diageo´s distributioncompany manages approximately half of the sales in the market with the other half managed throughwholesalers. In August 2012 Diageo completed the acquisition of 100% of Ypioca, the leading producerand distributor of a cachaca brand from Ypioca Agroindustrial Limitada.
West LAC comprises Central America and Caribbean, Jamaica, Argentina, Chile, Peru, Ecuadorand Bolivia. In select markets such as the Free Trade Zone, Bolivia and Ecuador, sales are manageddirectly by Diageo. Key markets such as Costa Rica and the Dominican Republic sell via exclusivedistributors, while in Puerto Rico, Trinidad, Guatemala and Panama, third party distributors purchasedirectly from Diageo and sell on to the local trade. In Chile, Diageo sells directly to internationalretailers, partnering with an exclusive distributor in the remainder of the country for other channels. InArgentina, Diageo´s business is managed through a combination of wholesalers and distributors outsideof major grocers, to whom Diageo sells directly. Diageo Argentina also owns and operates the NavarroCorreas winery in Mendoza, Argentina. The winery sells directly to consumers. Jamaica sells towholesalers and directly to retail trade accounts on the island.
In Andean, all products in Venezuela are sold through dedicated third party distributors. InColombia, Diageo sells directly to major grocers, serving all other accounts and channels throughdistributors.
In Mexico, distribution of Smirnoff is managed by Casa Cuervo SA. All other brands are solddirectly by Diageo, either through direct sales to international accounts or through wholesalers anddistributors.
Asia Pacific In the year ended 30 June 2012, Asia Pacific comprises South East Asia (Vietnam,Thailand, Philippines, Indonesia, Malaysia and Singapore), Australia, North Asia (Korea and Japan),Greater China (China, Taiwan, Hong Kong and Macau), India and Global Travel Asia and MiddleEast. Diageo operates via a combination of Diageo companies, joint ventures and third partydistributors in the region.
16

Business description (continued)
In South East Asia, Diageo distributes its spirits brands through joint venture arrangements withMoet Hennessy in Thailand, Malaysia and Singapore. In Indonesia, Guinness is brewed by PT MultiBintang Indonesia, and is distributed through a distribution agreement with PT Dima Indonesia whilespirit brands are distributed by government licensed distributors. In Malaysia, Diageo’s own and thirdparty beers are brewed and distributed by a listed business (Guinness Anchor Berhad) in which Diageoand its partner, Asia Pacific Breweries, have a majority share through a jointly controlled entity. InSingapore, Diageo’s beer brands are brewed and distributed by Asia Pacific Breweries. In Vietnam,Diageo’s brands are distributed through its own distribution company. Diageo entered into a strategicpartnership agreement with Hanoi Liquor Joint Stock Company (Halico) in January 2011. Duringthe year Diageo acquired additional shares that increased its equity stake to 45.5% in Halico. Diageoalso increased its ownership in Diageo Philippines Inc, a company that distributes Diageo’s spiritsbrands in the Philippines, by 49% to 100%.
In Australia, Diageo has its own production and distribution company. The previous distributionagreement with VOK Beverages that included a number of smaller brands like JεB and Dimple wasterminated on 31 January 2012. Diageo also has a licensed brewing arrangement with Foster’s whichwill transfer to Lion Nathan from November 2012. In New Zealand, Diageo operates through thirdparty distributors and has a licensed brewing arrangement with Lion Nathan.
In North Asia, Diageo has its own distribution company in Korea. In Japan, the joint venture withMoet Hennessy distributes super premium brands such as the super deluxe variants of Johnnie Walker,while the joint venture with Kirin distributes Diageo’s other premium spirits such as Johnnie WalkerBlack Label and Smirnoff, as well as Guinness and Smirnoff Ice. Other spirit brands, which are notdistributed by either Moet Hennessy or the Kirin joint venture, are distributed by third parties.
In Greater China, Diageo distributes the majority of its spirits brands through a joint venturearrangement with Moet Hennessy in China, Hong Kong and Macau. Diageo also owns a wholly ownedsubsidiary in China that distributes brands not included in the joint venture such as Smirnoff, Windsorand Baileys. Diageo’s beer brands are sold through a distribution agreement with Carlsberg in Chinaand Hong Kong. In July 2011, Diageo acquired an additional 4% equity stake in Sichuan ChengduQuanxing Company Ltd. (Quanxing) bringing its equity stake to 53%. Quanxing is a holding companycontrolling a 39.7% equity stake in Shuijingfang a super premium Chinese white spirits company whichitself became a subsidiary of Diageo following the appointment of additional directors in June 2012.Diageo is the sole distributor of Shuijingfang’s Chinese white spirits outside of China. In Taiwan,Diageo has its own distribution company for spirits.
In India, Diageo has its own spirits distribution company.
Airport shops and airline customers in Asia Pacific are serviced through a dedicated Diageo salesand marketing organisation. In the Middle East, distribution is achieved through third partydistributors. Lebanon is an exception, where a Diageo subsidiary distributes the majority of the Diageobrands sold there.
Global Supply Global Supply is responsible for the production of approximately 81% of Diageo’sproducts sold globally, for sourcing materials and services through global procurement, for providingconsistent technical support through the global technical function and providing logistic and customerservices through the global supply chain organisation.
Global procurement has responsibility for sourcing goods and services on behalf of the Diageogroup. A global network of suppliers provides for a wide range of raw materials and packaging itemsthat are necessary to ensure consistency of quality to support the brands. With the high level of
17
Business description (continued)
dependency on agricultural commodities such as cereals, hops and sugar, forward-buying takes place tominimise value at risk. In marketing, global procurement supports the business in sourcing creativemedia solutions, sponsorship and point of sale activities. Global procurement also supports businessservices, facilities and computer services.
The global technical function develops and implements consistent engineering solutions across theGlobal Supply organisation and in other production sites in Africa and Asia. The global supply chainfunction also provides logistics services in Europe and is responsible for a consistent customer serviceglobally.
Corporate Corporate costs which cannot be directly allocated to the business areas are reportedseparately within Corporate in the analysis of business performance. Also included in Corporate are therevenues and costs related to rents receivable in respect of properties not used by Diageo in themanufacture, sale or distribution of premium drink products and the results of Gleneagles Hotel.
Seasonal impacts Approximately 40% of annual net sales occur in the last four months of eachcalendar year.
Employees Diageo’s people, its culture and its values are at the heart of the company’s strategy andDiageo’s directors believe this to be a source of competitive advantage. It continues to be Diageo’s goalto release the potential of all of its people.
Diageo’s review of its operating model during the past year and the resulting changes havepresented new challenges for its employees. In developed markets the new operating model has meanta focus on efficiency and customer orientation. For emerging markets, it has resulted in a greater focuson investment in brands and in commercial and leadership capability. As a consequence, there has beenan internal shift of employees and resources to the areas of greatest potential growth. Early indicatorssuggest that Diageo’s employees feel that they have benefited from this new and focused approach.Diageo has been committed to providing its employees with appropriate support during this transitionperiod, both in the case of employees that have left the company following the changes and those thathave taken on new roles within the company.
Diageo prides itself on creating an environment that is both welcoming and inspirational for itsemployees and is proud to have been included in the prestigious Great Place to Work Institute’s‘25 Best Multinational Workplaces’, achieving an 11th place ranking confirming its place as a leadingglobal employer. Diageo has also been recognised in reports published by Great Place to WorkInstitute as a leading workplace in Argentina, Australia, Brazil, Canada, Colombia, the EuropeanUnion, Germany, Ireland, the Latin America region, Mexico, the Netherlands, Nigeria, Portugal,Uganda, the United Kingdom, Uruguay and Venezuela. These achievements have only been possiblethrough the commitment of the thousands of talented and inspirational employees who have collectivelymade Diageo a great place to work.
Diageo values diversity in its workforce and works to ensure that the group is inclusive of allpeople, regardless of their background or style. To enhance diversity, Diageo aims to createopportunities that are attractive to a wide range of candidates, including those with disabilities, andseeks to make working for Diageo compatible with a variety of lifestyles. Diageo sponsors an evergrowing number of employee networks around the world that seek to support diverse interest groups.The company also seeks to design and adjust roles to accommodate people’s lifestyles and increasinglyencourages flexible working. Not only is this approach to inclusion and diversity consistent withDiageo’s values, it is also believed to be important for the long term health of the organisation. As part
18
Business description (continued)
of Diageo’s global policies, Diageo emphasises the importance of treating individuals justly and in anon-discriminatory manner in all aspects of employment, including recruitment, compensation andbenefits, training, promotion, transfer and termination. Accordingly, factors not relevant to therequirements of a role, including without limitation race, religion, colour, ethnic or national origin,disability, sexual orientation, gender or marital status, are not considered, and reasonable adjustmentsare considered (and if necessary appropriate training provided) so that no individual is disadvantaged.
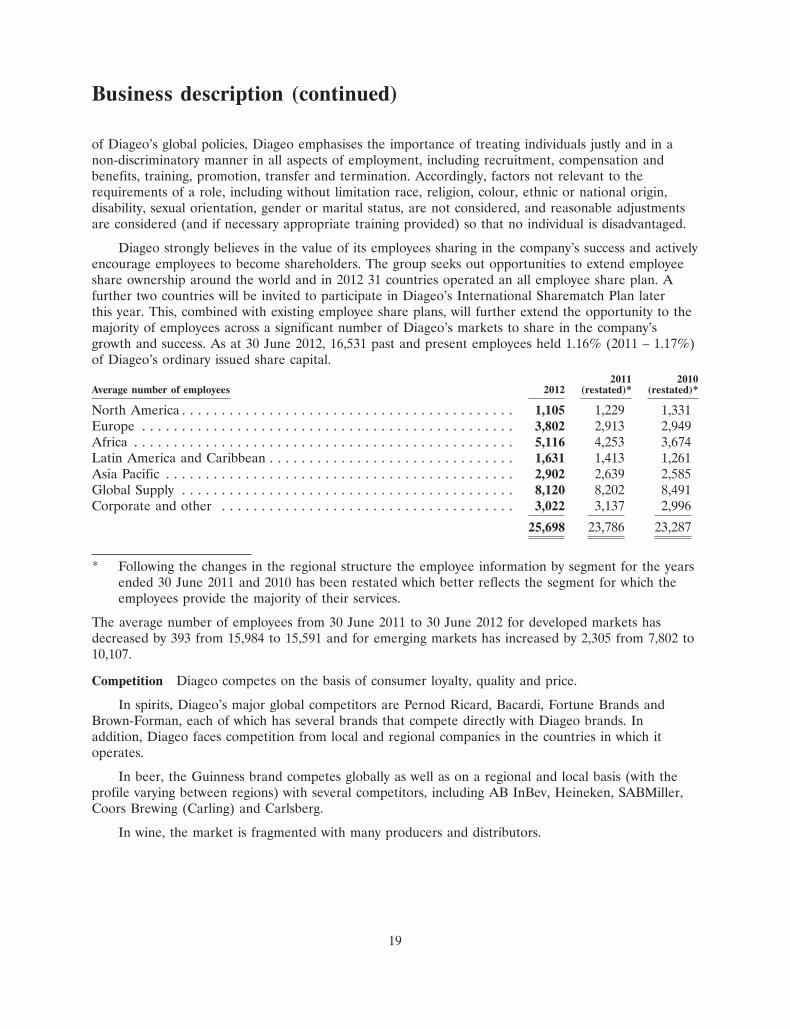
Diageo strongly believes in the value of its employees sharing in the company’s success and activelyencourage employees to become shareholders. The group seeks out opportunities to extend employeeshare ownership around the world and in 2012 31 countries operated an all employee share plan. Afurther two countries will be invited to participate in Diageo’s International Sharematch Plan laterthis year. This, combined with existing employee share plans, will further extend the opportunity to themajority of employees across a significant number of Diageo’s markets to share in the company’sgrowth and success. As at 30 June 2012, 16,531 past and present employees held 1.16% (2011 – 1.17%)of Diageo’s ordinary issued share capital.
2011 2010Average number of employees 2012 (restated)* (restated)*
North America . . . . . . . . . . . . . . . . . . . . . . . . . . . . . . . . . . . . . . . . . . 1,105 1,229 1,331Europe . . . . . . . . . . . . . . . . . . . . . . . . . . . . . . . . . . . . . . . . . . . . . . . 3,802 2,913 2,949Africa . . . . . . . . . . . . . . . . . . . . . . . . . . . . . . . . . . . . . . . . . . . . . . . . 5,116 4,253 3,674Latin America and Caribbean . . . . . . . . . . . . . . . . . . . . . . . . . . . . . . . 1,631 1,413 1,261Asia Pacific . . . . . . . . . . . . . . . . . . . . . . . . . . . . . . . . . . . . . . . . . . . . 2,902 2,639 2,585Global Supply . . . . . . . . . . . . . . . . . . . . . . . . . . . . . . . . . . . . . . . . . . 8,120 8,202 8,491Corporate and other . . . . . . . . . . . . . . . . . . . . . . . . . . . . . . . . . . . . . 3,022 3,137 2,996
25,698 23,786 23,287
* Following the changes in the regional structure the employee information by segment for the yearsended 30 June 2011 and 2010 has been restated which better reflects the segment for which theemployees provide the majority of their services.
The average number of employees from 30 June 2011 to 30 June 2012 for developed markets hasdecreased by 393 from 15,984 to 15,591 and for emerging markets has increased by 2,305 from 7,802 to10,107.
Competition Diageo competes on the basis of consumer loyalty, quality and price.
In spirits, Diageo’s major global competitors are Pernod Ricard, Bacardi, Fortune Brands andBrown-Forman, each of which has several brands that compete directly with Diageo brands. Inaddition, Diageo faces competition from local and regional companies in the countries in which itoperates.
In beer, the Guinness brand competes globally as well as on a regional and local basis (with theprofile varying between regions) with several competitors, including AB InBev, Heineken, SABMiller,Coors Brewing (Carling) and Carlsberg.
In wine, the market is fragmented with many producers and distributors.
19

Business description (continued)
Research and development The overall nature of the group’s business does not demand substantialexpenditure on research and development. However, the group has ongoing programmes for developingnew drinks products. Innovation forms an important part of Diageo’s growth strategy, playing a keyrole in positioning its brands for continued growth in both the developed and emerging worlds. Thestrength and depth of Diageo’s brand range provide solid platforms from which to drive innovation,while insights into shopper trends and changing consumer habits inform product and packagingdevelopment.
In the year ended 30 June 2012, the group’s research and development expenditure amounted to£18 million (2011 – £17 million; 2010 – £13 million). Research and development expenditure isgenerally written off in the year in which it is incurred.
Trademarks Diageo produces, sells and distributes branded goods and is therefore substantiallydependent on the maintenance and protection of its trademarks. All brand names mentioned in thisdocument are trademarks. The group also holds numerous licences and trade secrets, as well as havingsubstantial trade knowledge related to its products. The group believes that its significant trademarksare registered and/or otherwise protected (insofar as legal protections are available) in all materialrespects in its most important markets. Diageo also owns valuable patents and trade secrets fortechnology and takes all reasonable steps to protect these rights.
Regulations and taxes Diageo’s worldwide operations are subject to extensive regulatory requirementsregarding production, product liability, distribution, importation, marketing, promotion, sales, pricing,labelling, packaging, advertising, labour, pensions, compliance and control systems and environmentalissues. In the United States, the beverage alcohol industry is subject to strict federal and stategovernment regulations covering virtually every aspect of its operations, including production,distribution, marketing, promotion, sales, pricing, labelling, packaging and advertising.
Spirits, beer and wine are subject to national import and excise duties in many markets around theworld. Most countries impose excise duties on beverage alcohol products, although the form of suchtaxation varies significantly from a simple application to units of alcohol by volume, to advancedsystems based on imported or wholesale value of the product. Several countries impose additionalimport duty on distilled spirits, often discriminating between categories (such as Scotch whisky orbourbon) in the rate of such tariffs. Within the European Union, such products are subject to differentrates of excise duty in each country, but within an overall European Union framework, there areminimum rates of excise duties that can be applied.
Import and excise duties can have a significant impact on the final pricing of Diageo’s products toconsumers. These duties have an impact on the competitive position as compared to other brands. Thegroup devotes resources to encouraging the equitable taxation treatment of all beverage alcoholcategories and to reducing government-imposed barriers to fair trading.
Advertising, marketing and sales of alcohol are subject to various restrictions in markets aroundthe world. These range from a complete prohibition of alcohol in certain countries and cultures,through the prohibition of the import of spirits, wine and beer, to restrictions on the advertising style,media and messages used. In a number of countries, television is a prohibited medium for spiritsbrands and in other countries, television advertising, while permitted, is carefully regulated.
Spirits, beer and wine are also regulated in distribution. In many countries, alcohol may only besold through licensed outlets, both on and off trade, varying from government or state operated
20

Business description (continued)
monopoly outlets (for example, Canada, Norway and certain US states) to the common system oflicensed on trade outlets (for example, licensed bars and restaurants) which prevails in much of thewestern world (for example, most US states and the European Union). In about one-third of the statesin the United States, price changes must be filed or published 30 days to three months, depending onthe state, before they become effective.
Labelling of beverage alcohol products is also regulated in many markets, varying from healthwarning labels to importer identification, alcohol strength and other consumer information. As well asproducer, importer or bottler identification, specific warning statements related to the risks of drinkingbeverage alcohol products are required to be included on all beverage alcohol products sold in theUnited States and in other countries where Diageo operates. Expressions of political concern signifythe uncertain future of beverage alcohol products advertising on network television in the UnitedStates. Any prohibitions on advertising or marketing could have an adverse impact on sales of thegroup.
Regulatory decisions and changes in the legal and regulatory environment could increase Diageo’scosts and liabilities or impact on its business activities.
Business services Diageo continues to standardise its key business activities with customers,consumers, suppliers and the processes that summarise and report financial performance. In thatregard, global processes have been designed, built and implemented across a number of markets andoperational entities.
Diageo uses shared services operations to deliver transaction processing and certain central financeactivities, using captive and outsourced centres. A captive business service centre in Budapest, Hungary,performs various process tasks for markets and operational entities. In the year ended 30 June 2012,Diageo announced the opening of new captive business service centres in Nairobi, Kenya and Bogota,Colombia. Diageo also uses third party service centres in Manila, Shanghai and Bucharest to performtasks for basic processes. Certain central finance activities, including elements of group financialplanning and reporting and treasury, are performed in the business service centre in Budapest.
Associates Diageo’s principal associate is Moet Hennessy. It also owns shares in a number of otherassociates. In the year ended 30 June 2012, the share of profits of associates after tax was £213 million(2011 – £176 million; 2010 – £142 million), of which Moet Hennessy accounted for £205 million (2011 –£179 million; 2010 – £134 million).
Diageo owns 34% of Moet Hennessy, the spirits and wine subsidiary of LVMH Moet Hennessy –Louis Vuitton SA (LVMH). LVMH is based in France and is listed on the Paris Stock Exchange.Moet Hennessy is also based in France and is a producer and exporter of a number of brands in itsmain business areas of champagne and cognac. Its principal champagne brands are Moet & Chandon(including Dom Perignon), Veuve Clicquot and Mercier, all of which are included in the top 10champagne brands worldwide by volume. Moet Hennessy also owns Hennessy, which is the top cognacbrand worldwide by volume, and Glenmorangie, a malt whisky.
Since 1987, a number of joint distribution arrangements have been established with LVMH,principally covering distribution of Diageo’s premium brands of Scotch whisky and gin andMoet Hennessy’s premium champagne and cognac brands in the Asia Pacific region and France.Diageo and LVMH have each undertaken not to engage in any champagne or cognac activitiescompeting with those of Moet Hennessy. The arrangements also contain certain provisions for the
21

Business description (continued)
protection of Diageo as a minority shareholder in Moet Hennessy. The operations of Moet Hennessy inFrance are conducted through a partnership in which Diageo has a 34% interest and, as a partner,Diageo pays any tax due on its share of the results of the partnership to the tax authorities.
Acquisitions and disposals Diageo has made a number of acquisitions of brands, distribution rightsand equity interests in premium drinks businesses. Since 1 July 2009 the following acquisitions anddisposals have been made:
Consideration* PrincipalAcquisitions Date acquired £ million Location brands acquired Status
Ypioca 9 August 2012 284 Brazil Ypioca cachaca Acquisition of 100% of theequity share capital of YpiocaAgroindustrial Limitada
Meta 9 January 2012 153 Ethiopia Meta beer Acquisition of 100% of theequity share capital of MetaAbo Brewery ShareCompany SC
Philippines 14 December 2011 15 Philippines Distribution company Acquisition of 49% of DiageoPhilippines Inc not alreadyowned by the group
Kenya 25 November 2011 134 Kenya Distribution company Acquisition of 20% of KenyaBreweries Breweries Ltd not already
owned by the group
Halico 13 May 2011 – 60 Vietnam Vodka Hanoi Acquisition of 45.5% of the24 June 2012 equity share capital of Hanoi
Joint Stock Company (Halico)
Mey Icki 23 August 2011 1,260 Turkey Yeni raki, Terkirdag raki Acquisition of 100% of theand Istanblue vodka equity share capital of Mey
Icki Sanayi ve Ticaret A.S.
Quanxing and 27 January 2007 – 69** China Shui Jing Fang Chinese Acquisition of 53% equityShuijingfang 14 July 2011 white spirit stake in Sichuan Chengdu
(control of Quanxing GroupShuijingfang from Company Ltd (Quanxing).29 June 2012) Quanxing owns a 39.7%
controlling equity interest inSichuan Shuijingfang Co., Ltd.
Zacapa 5 July 2011 148 Guatemala Zacapa rum Acquisition of a 50%controlling equity stake inRum Creations Products Inc.
Serengeti 22 October 2010 60 Tanzania Serengeti lager Acquisition of a 51% equitystake in Serengeti BreweriesLimited via a 50.03% equityowned subsidiary
22 Marquis 30 September 2010 6 United States 22 Marquis sparkling Acquisition of a 20% equityliqueur stake in LNJ Group
Nuvo 29 June 2010 29 United States Nuvo – vodka based Acquisition of an additionalsparkling liqueur 28.75% equity interest in the
London Group taking thegroup’s interest to 71.25%
* Includes net borrowings acquired but excludes the value of put options and transaction costs.
** Excludes cash acquired in Shuijingfang when first consolidated.
22

Business description (continued)
ConsiderationDisposals Date disposed of £ million Location Status
Tanzania Breweries 18 January 2012 47 Tanzania Disposal of 20% equity in TanzaniaBreweries Ltd
Wine brands Years ended 30 June 25 United States Disposal of a number of2011 and 2012 and France non-strategic wine businesses
Gilbeys distribution 31 August 2010 7 Ireland Disposal of Gilbeys winedistribution and wholesale drinksbusiness
Risk factors
Diageo believes the following to be the principal risks and uncertainties facing the group. If any ofthese risks occur, Diageo’s business, financial condition and results of operations could suffer and thetrading price and liquidity of securities could decline.
In the ongoing uncertain economic environment, certain risks may gain more prominence eitherindividually or when taken together. The following are examples of ways that any of the risks belowmay become exacerbated. Demand for beverage alcohol products, in particular luxury or superpremium products, may decrease with a reduction in consumer spending levels. Costs of operationsmay increase if inflation were to become prevalent, or upon an increase in the costs of raw materials.These factors may also lead to intensified competition for market share, with consequential potentiallyadverse effects on volumes and prices. The financial and economic situation may have a negativeimpact on third parties with whom Diageo does, or may do, business. Any of these factors may affectthe group’s results of operations, financial condition and liquidity. Diageo has taken and may takefurther steps to manage its business through this challenging economic environment and position itsbusiness to benefit from economic recovery as and when it may occur in the various markets in whichDiageo operates, but there can be no assurance that the steps taken will have the intended results.
If there is an extended period of constraint in the capital markets, with debt markets in particularexperiencing a lack of liquidity, at a time when cash flows from Diageo’s business may be underpressure, this may have an impact on Diageo’s ability to maintain current long term strategies, with aconsequent effect on the group’s growth rate. Such developments may adversely affect shareholderreturns or share price. Additionally, continued volatility in exchange rates used to translate foreigncurrencies into pounds sterling may have a significant impact on Diageo’s reported results. Decreases inthe trustees’ valuations of Diageo’s pension plans may also increase pension funding requirements.
Risks related to the global economy
Diageo’s business may be adversely impacted by unfavourable economic conditions or political or otherdevelopments and risks in the countries in which it operates Diageo may be adversely affected bypolitical and economic developments or industrial action in any of the countries where Diageo hasdistribution networks, production facilities or marketing companies. Diageo’s business is dependent ongeneral economic conditions in the United States, countries that form the European Union and otherimportant markets. If the economy in the United States or in the countries that form the EuropeanUnion do not recover as forecast or if there is a significant deterioration in the economic conditions inany of Diageo’s important markets, including any resulting social unrest, reduction in consumerconfidence and spending levels, customer destocking, the failure of customer, supplier or financial
23
Business description (continued)
counterparties or a reduction in the availability of, or an increase in the cost of financing to, Diageo, itcould have a material adverse effect on Diageo’s business and results of operations. In particular, theongoing sovereign debt crisis in certain countries in Europe has increased concerns that, were one ormore countries to leave the euro, Diageo’s investment in any countries concerned could be impairedand may be subject to redenomination and other risks going forward. This crisis, as well as othereconomic events, may lead to reduced economic growth and, in turn, reduced demand for Diageo’sproducts, in Europe and other markets in which Diageo operates, which could have a material adverseeffect on Diageo’s business and results of operations.
Diageo’s operations are also subject to a variety of other risks and uncertainties related to tradingin numerous foreign countries, including political or economic upheaval and the imposition of anyimport, investment or currency restrictions, including tariffs and import quotas or any restrictions onthe repatriation of earnings and capital. Political and/or social unrest, potential health issues (includingpandemic issues), natural disasters and terrorist threats and/or acts may also occur in various placesaround the world, which will have an impact on trade, tourism and travel. Many of these risks areheightened, or occur more frequently, in emerging markets. These disruptions can affect Diageo’sability to import or export products and to repatriate funds, as well as affecting the levels of consumerdemand (for example, in duty free outlets at airports or in on trade premises in affected regions) andtherefore Diageo’s levels of sales or profitability. A substantial portion of Diageo’s operations,representing nearly 40% of Diageo’s net sales for the year ended 30 June 2012, are carried out inemerging markets, including Brazil, Venezuela, Mexico, Russia and emerging markets in Africa andAsia. Emerging markets are also generally exposed to relatively higher risk of liquidity, inflation,devaluation, price volatility, currency convertibility and sovereign default. Due to Diageo’s specificexposures, any or all of the aforementioned factors may affect Diageo disproportionately or in adifferent manner as compared to its competitors.
Part of Diageo’s growth strategy includes expanding its business in certain countries whereconsumer spending in general, and spending on Diageo’s products in particular, has not historicallybeen as great but where there are prospects for growth. There is no guarantee that this strategy will besuccessful and some of the markets represent a higher risk in terms of their changing regulatoryenvironments and higher degree of uncertainty over levels of consumer spending.
Risks related to the industry
Demand for Diageo’s products may be adversely affected by many factors, including changes inconsumer preferences and tastes and adverse impacts of a declining economy Diageo’s collection ofbrands includes some of the world’s leading beverage alcohol brands as well as brands of localprominence. Maintaining Diageo’s competitive position depends on its continued ability to offerproducts that have a strong appeal to consumers. Consumer preferences may shift due to a variety offactors including changes in demographic and social trends, public health regulations, changes in travel,vacation or leisure activity patterns, weather effects and a downturn in economic conditions, which mayreduce consumers’ willingness to purchase premium branded products. The competitive position ofDiageo’s brands could also be affected adversely by any failure to achieve consistent, reliable quality inthe product or service levels to customers.
In addition, the social acceptability of Diageo’s products may decline due to public concerns aboutalcohol consumption, including alcohol abuse, drink driving, underage drinking or potential healthconsequences. These concerns may also result in regulatory action, litigation or customer complaintsagainst companies in the industry and may have an adverse effect on Diageo’s profitability.
24

Business description (continued)
The launch and ongoing success of new products is inherently uncertain, especially as to theirappeal to consumers. The failure to launch a new product successfully can give rise to inventorywrite-offs and other costs and can affect consumer perception of an existing brand. Growth in Diageo’sbusiness has been based on both the launch of new products and the creation of brand extensions, andcan impact growth of existing products. Product innovation remains a significant aspect of Diageo’splans for growth. There can be no assurance as to Diageo’s continuing ability to develop and launchsuccessful new products or variants of existing products or as to the profitable lifespan of newly orrecently developed products. Any significant changes in consumer preferences and failure to anticipateand react to such changes could result in reduced demand for Diageo’s products and erosion of itscompetitive and financial position. Continued economic pressures could lead to consumer selection ofproducts at lower price points, whether Diageo’s or those of competitors, which may have an adverseeffect on Diageo’s profitability.
Diageo is subject to litigation directed at the beverage alcohol industry and other litigationCompanies in the beverage alcohol industry are, from time to time, exposed to class action or otherlitigation relating to alcohol advertising, product liability, alcohol abuse problems or healthconsequences from the misuse of alcohol. Diageo may be subject to litigation with tax, customs andother regulatory authorities, including with respect to the methodology for assessing importation value,transfer pricing and compliance matters, and Diageo is routinely subject to litigation in the ordinarycourse of its operations. Diageo may also be subject to litigation arising from legacy and discontinuedactivities. Such litigation may result in damages, penalties or fines as well as reputational damage toDiageo or its brands, and as a result, Diageo’s business could be materially adversely affected. Foradditional information with respect to legal proceedings, see ‘Additional information for shareholders –Legal proceedings’ and note 31 to the consolidated financial statements.
Climate change, or legal, regulatory or market measures to address climate change, may negativelyaffect Diageo’s business or operations, and water scarcity or poor quality could negatively impactDiageo’s production costs and capacity There is a growing concern that carbon dioxide and othergreenhouse gases in the atmosphere may have an adverse impact on global temperatures, weatherpatterns and the frequency and severity of extreme weather and natural disasters. In the event thatsuch climate change has a negative effect on agricultural productivity, Diageo may be subject todecreased availability or less favourable pricing for certain raw materials that are necessary for Diageo’sproducts, such as sugar, cereals, hops, agave and grapes. Water is the main ingredient in substantiallyall of Diageo’s products. It is also a limited resource in many parts of the world, facing unprecedentedchallenges from climate change, overexploitation, increasing pollution, and poor management. Asdemand for water continues to increase around the world, and as water becomes scarcer and thequality of available water deteriorates, Diageo may be affected by increasing production costs orcapacity constraints, which could adversely affect Diageo’s results of operations and profitability.
An increase in the cost of raw materials or energy could affect Diageo’s profitability The componentsthat Diageo uses for the production of its beverage products are largely commodities that are subject toprice volatility caused by changes in global supply and demand, weather conditions, agriculturaluncertainty and/or governmental controls. Commodity price changes may result in unexpected increasesin the cost of raw materials, glass bottles, flavours and other packaging materials and Diageo’s beverageproducts. Diageo may also be adversely affected by shortages of such materials. In addition, energy costincreases result in higher transportation, freight and other operating costs. Diageo may not be able toincrease its prices to offset these increased costs without suffering reduced volume, sales and operatingprofit. Diageo may experience significant increases in commodity costs and energy costs.
25

Business description (continued)
Risks related to regulation
Regulatory decisions and changes in the legal and regulatory environment could increase Diageo’scosts and liabilities or limit its business activities Diageo’s operations are subject to extensiveregulatory requirements which include those in respect of production, product liability, distribution,importation, marketing, promotion, sales, pricing, labelling, packaging, advertising, labour, pensions,compliance and control systems, and environmental issues. Changes in laws, regulations orgovernmental or regulatory policies and/or practices could cause Diageo to incur material additionalcosts or liabilities that could adversely affect its business. In particular, governmental bodies incountries where Diageo operates may impose new labelling, product or production requirements,limitations on the advertising and/or promotion activities used to market beverage alcohol, restrictionson retail outlets, other restrictions on marketing, promotion, importation and distribution or otherrestrictions on the locations or occasions where beverage alcohol is sold which directly or indirectlylimit the sales of Diageo products. Regulatory authorities under whose laws Diageo operates may alsohave enforcement power that can subject the group to actions such as product recall, seizure ofproducts or other sanctions, which could have an adverse effect on its sales or damage its reputation.An increase in the stringency of the regulatory environment could cause Diageo to incur materialadditional costs or liabilities that could adversely affect its business.
In addition, beverage alcohol products are the subject of national excise, import duty and otherduties in most countries around the world. An increase in any such duties could have a significantadverse effect on Diageo’s sales revenue or margin, both through reducing overall consumption and byencouraging consumers to switch to lower-taxed categories of beverage alcohol.
Diageo’s reported after tax income is calculated based on extensive tax and accountingrequirements in each of its relevant jurisdictions of operation. Changes in tax law (including tax rates),accounting policies and accounting standards could materially reduce Diageo’s reported after taxincome.
Risks related to Diageo’s business
Diageo faces competition that may reduce its market share and margins Diageo faces substantialcompetition from several international companies as well as local and regional companies in thecountries in which it operates. Diageo competes with drinks companies across a wide range ofconsumer drinking occasions. Within a number of categories, consolidation or realignment is stillpossible. Consolidation is also taking place amongst Diageo’s customers in many countries. Increasedcompetition and unanticipated actions by competitors or customers could lead to downward pressure onprices and/or a decline in Diageo’s market share in any of these categories, which would adverselyaffect Diageo’s results and hinder its growth potential.
Diageo may not be able to derive the expected benefits from its strategy to focus on premium drinks orfrom its acquisitions or cost-saving and restructuring programmes designed to enhance earningsDiageo’s strategy is to focus on premium drinks to grow its business through organic sales, operatingprofit growth and the acquisition of premium drinks brands that add value for shareholders. There canbe no assurance that Diageo’s strategic focus on premium drinks will result in opportunities for growthand improved margins.
It is possible that the pursuit of this strategic focus on premium drinks could give rise to furtherbusiness combinations, acquisitions, disposals, joint ventures and/or partnerships (including any
26

Business description (continued)
associated financing or the assumption of actual or potential liabilities, depending on the transactioncontemplated). There can be no assurance that any transaction will be completed. The success of anytransaction will depend in part on Diageo’s ability to successfully integrate new businesses withDiageo’s existing operations and realise the anticipated benefits, cost savings or synergies. There can beno guarantee that any such business combination, acquisition, disposal, joint venture or partnershipwould deliver the benefits, cost savings or synergies anticipated, if any.
Similarly, there can be no assurance that the cost-saving or restructuring programmes implementedby Diageo in order to improve efficiencies and deliver cost-savings will deliver the expected benefits.
Contamination, counterfeiting or other events could harm the integrity of customer support forDiageo’s brands and adversely affect the sales of those brands The success of Diageo’s brandsdepends upon the positive image that consumers have of those brands, and contamination, whetherarising accidentally, or through deliberate third party action, or other events that harm the integrity orconsumer support for those brands, could adversely affect their sales. Diageo purchases most of the rawmaterials for the production and packaging of its products from third party producers or on the openmarket. Diageo may be subject to liability if contaminants in those raw materials or defects in thedistillation, fermentation or bottling process lead to low beverage quality or illness among, or injury to,Diageo’s consumers. In addition, Diageo may voluntarily recall products in the event of contaminationor damage. A significant product liability judgement or a widespread product recall may negativelyimpact on sales and profitability of the affected brand or all Diageo brands for a period of timedepending on product availability, competitive reaction and consumer attitudes. Even if a productliability claim is unsuccessful or is not fully pursued, resulting negative publicity could adversely affectDiageo’s reputation with existing and potential customers and its corporate and brand image.
In addition, to the extent that third parties sell products which are either counterfeit versions ofDiageo brands or inferior brands that look like Diageo brands, consumers of Diageo brands couldconfuse Diageo products with them. This could cause them to refrain from purchasing Diageo brandsin the future and in turn could impair brand equity, adversely affecting Diageo’s business.
Diageo’s operating results may be adversely affected by increased costs or shortages of labourDiageo’s operating results could be adversely affected by labour or skill shortages or increased labourcosts due to increased competition for employees, higher employee turnover or increased employeebenefit costs. Diageo’s success is dependent on the capability of its employees. There is no guaranteethat Diageo will continue to be able to recruit, retain and develop the capabilities that it requires todeliver its strategy, for example in relation to sales, marketing and innovation capability within marketsor in its senior management. The loss of senior management or other key personnel or the inability toidentify, attract and retain qualified personnel in the future could make it difficult to manage thebusiness and could adversely affect operations and financial results.
Diageo’s operating results may be adversely affected by disruption to production facilities, businessservice centres or information systems and change programs may not deliver the benefits intendedDiageo would be affected if there were a catastrophic failure of its major production facilities orbusiness service centres. See ‘Business description – Premium drinks – Production’ for details ofDiageo’s principal production areas. Diageo operates production facilities around the world. If therewere a technical integrity failure, fire or explosion at one of Diageo’s production facilities, it couldresult in damage to the facilities, plant or equipment, their surroundings or the environment, could leadto a loss in production capacity, or could result in regulatory action, legal liability or damage to
27
Business description (continued)
Diageo’s reputation. In addition, the maintenance and development of information systems may resultin systems failures which may adversely affect business operations.
Diageo has a substantial inventory of aged product categories, principally Scotch whisky andCanadian whisky, which may mature over periods of up to 30 years or more. The maturing inventory isstored primarily in Scotland, and the loss through contamination, fire or other natural disaster of all ora portion of the stock of any one of those aged product categories could result in a significantreduction in supply of those products, and consequently, Diageo would not be able to meet consumerdemand for those products as it arises. There can be no assurance that insurance proceeds would coverthe replacement value of Diageo’s maturing inventory or other assets, were such assets to be lost dueto contamination, fire or natural disasters or destruction resulting from negligence or the acts of thirdparties. In addition, there is an inherent risk of forecasting error in determining the quantity ofmaturing stock to lay down in a given year for future consumption. This could lead to an inability tosupply future demand or lead to a future surplus of inventory and consequent write down in value ofmaturing stocks.
Any failure of information systems could adversely impact Diageo’s ability to operate. As with alllarge systems, Diageo’s information systems could be penetrated by outside parties’ intent on extractinginformation, corrupting information or disrupting business processes. Such unauthorised access coulddisrupt Diageo’s business and/or lead to loss of assets or to outside parties having access to privilegeddata or strategic information of Diageo and its employees, customers and consumers, or to making suchinformation public in a manner that harms Diageo’s reputation. The concentration of processes inbusiness service centres also means that any disruption arising from system failure or physical plantissues could impact a large portion of Diageo’s global business.
Certain change programmes designed to improve the effectiveness and efficiency of end-to-endoperating, administrative and financial systems and processes continue to be undertaken. This includesmoving transaction processing from a number of markets to business service centres. There can be nocertainty that these programmes will deliver the expected operational benefits. There may be disruptioncaused to production processes and to administrative and financial systems as further changes to suchprocesses are effected. They could also lead to adverse customer or consumer reaction.
Diageo’s operations and financial results may be adversely affected by movements in the value of itspension funds, fluctuations in exchange rates and fluctuations in interest rates Diageo has significantpension funds. These funds may be affected by, among other things, the performance of assets ownedby these plans, the underlying actuarial assumptions used to calculate the surplus or deficit in the plans,in particular the discount rate and long term inflation rates used to calculate the liabilities of thepension funds, and any changes in applicable laws and regulations. If there are significant declines infinancial markets and/or deterioration in the value of fund assets or changes in discount rates orinflation rates, Diageo may need to make significant contributions to the pension funds in the future.Furthermore, if the market values of the assets held by Diageo’s pension funds decline, or if thevaluations of those assets by the pension trustees decline, pension expenses may increase and, as aresult, could materially adversely affect Diageo’s financial position. There is no assurance that interestrates or inflation rates will remain constant or that pension fund assets can earn the assumed rate ofreturn annually, and Diageo’s actual experience may be significantly more negative.
Diageo may be adversely affected by fluctuations in exchange rates. In particular, anyredenomination of the euro or its constituent parts could materially adversely affect Diageo. The resultsof operations of Diageo are accounted for in pounds sterling. Approximately 37% of sales in the year
28

Business description (continued)
ended 30 June 2012 were in US dollars, approximately 13% were in euros and approximately 10% werein sterling. Movements in exchange rates used to translate foreign currencies into pounds sterling mayhave a significant impact on Diageo’s reported results of operations from year to year.
Diageo may also be adversely impacted by fluctuations in interest rates, mainly through anincreased interest expense. To partly delay any adverse impact from interest rate movements, thegroup’s policy is to maintain fixed rate borrowings within a certain percentage of forecast netborrowings, and the overall net borrowings portfolio is managed according to a duration measure. Seenote 23 to the consolidated financial statements.
Diageo’s operations may be adversely affected by failure to maintain or renegotiate distribution,supply, manufacturing or licence agreements on favourable terms Diageo’s business has a number ofdistribution, supply, manufacturing or licence agreements for brands owned by it or by othercompanies. These agreements vary depending on the particular brand, but tend to be for a fixednumber of years. There can be no assurance that Diageo will be able to renegotiate its rights onfavourable terms when they expire or that these agreements will not be terminated. Failure to renewthese agreements on favourable terms could have an adverse impact on Diageo’s sales and operatingprofit. In addition, Diageo’s sales and operating profit may be adversely affected by any disputes withdistributors of its products or with suppliers of raw materials.
Diageo may not be able to protect its intellectual property rights Given the importance of brandrecognition to its business, Diageo has invested considerable effort in protecting its intellectual propertyrights, including trademark registration and domain names. Diageo’s patents cover some of its processtechnology, including some aspects of its bottle marking technology. Diageo also uses security measuresand agreements to protect its confidential information and trade secrets. However, Diageo cannot becertain that the steps it has taken will be sufficient or that third parties will not infringe on ormisappropriate its intellectual property rights in its brands or products. Moreover, some of thecountries in which Diageo operates offer less intellectual property protection than Europe or NorthAmerica. Given the attractiveness of Diageo’s brands to consumers, it is not uncommon for counterfeitproducts to be manufactured and traded. Diageo cannot be certain that the steps it takes to assist theauthorities to prevent, detect and eliminate counterfeit products will be effective in preventing materialloss of profits or erosion of brand equity resulting from lower quality or even dangerous counterfeitproduct reaching the market. If Diageo is unable to protect its intellectual property rights againstinfringement or misappropriation, this could materially harm its future financial results and ability todevelop its business.
The value of Diageo’s brands and its net sales may be negatively affected by its failure to maintain itsbrand image and corporate reputation The value of Diageo’s brands and its profitability dependsheavily on its ability to maintain its brand image and corporate reputation. Adverse publicity, whetheror not justified, may tarnish Diageo’s reputation and cause consumers to choose products offered by itscompetitors. Such adverse publicity could arise as a result of a perceived failure by Diageo to makeadequate positive social contributions, any tax disputes or failures of internal controls or compliancebreaches leading to a breach of Diageo’s Code of Business Conduct, its other key policies or of thelaws or regulations in the jurisdictions in which it operates.
Diageo also maintains an online presence as part of its business operations. Diageo’s reputationmay suffer if it is perceived to fail to appropriately restrict access to its online content or if it breachesany marketing regulation, code or policy. In addition, the proliferation of new methods of mass
29

Business description (continued)
communication facilitated by the internet makes it easier for false or unfounded allegations to adverselyaffect Diageo’s brand image and reputation, which may in turn affect Diageo’s profitability.
Data security and reliability is important to maintaining Diageo’s business operations, and a breach ofDiageo’s data security could negatively affect Diageo The security and reliability of Diageo’s datainfrastructure are critical to maintaining the availability and reliable operation of Diageo’s businessapplications, including technology used in Diageo’s business operations, in the collection and processingof financial and operational data and in the maintenance of the confidentiality of certain third-partyinformation. A breach of the security or reliability of Diageo’s data infrastructure, whether byintentional actions, negligence or otherwise, could result in interruption of and serious damage toDiageo’s business operations and, in some circumstances, could result in property damage, breaches ofregulations, litigation, legal liabilities and reparation costs.
Risks related to Diageo’s securities
It may be difficult to effect service of US process and enforce US legal process against the directors ofDiageo Diageo is a public limited company incorporated under the laws of England and Wales. Themajority of Diageo’s directors and officers, and some of the experts named in this document, resideoutside of the United States, principally in the United Kingdom. A substantial portion of Diageo’sassets, and the assets of such persons, are located outside of the United States. Therefore, it may notbe possible to effect service of process within the United States upon Diageo or these persons in orderto enforce judgements of US courts against Diageo or these persons based on the civil liabilityprovisions of the US federal securities laws. There is doubt as to the enforceability in England andWales, in original actions or in actions for enforcement of judgements of US courts, of civil liabilitiessolely based on the US federal securities laws.
Cautionary statement concerning forward-looking statements
This document contains ‘forward-looking statements’. These statements can be identified by the factthat they do not relate only to historical or current facts. In particular, forward-looking statementsinclude all statements that express forecasts, expectations, plans, outlook and projections with respect tofuture matters, including trends in results of operations, margins, growth rates, overall market trends,the impact of changes in interest or exchange rates, the availability or cost of financing to Diageo,anticipated cost savings or synergies, expected investments, the completion of Diageo’s strategictransactions and restructuring programmes, anticipated tax rates, expected cash payments, outcomes oflitigation, anticipated deficit reductions in relation to pension schemes and general economicconditions. By their nature, forward-looking statements involve risk and uncertainty because they relateto events and depend on circumstances that will occur in the future. There are a number of factors thatcould cause actual results and developments to differ materially from those expressed or implied bythese forward-looking statements, including factors that are outside Diageo’s control. These factorsinclude, but are not limited to:
• global and regional economic downturns;
• increased competitive product and pricing pressures and unanticipated actions by competitorsthat could impact Diageo’s market share, increase expenses and hinder growth potential;
30

Business description (continued)
• the effects of Diageo’s strategic focus on premium drinks, the effects of business combinations,partnerships, acquisitions or disposals, existing or future, and the ability to realise expectedsynergies and/or costs savings;
• Diageo’s ability to complete existing or future business combinations, restructuring programmes,acquisitions and disposals;
• legal and regulatory developments, including changes in regulations regarding production,product liability, distribution, importation, labelling, packaging, consumption, or advertising;changes in tax law, rates or requirements (including with respect to the impact of excise taxincreases) or accounting standards; and changes in environmental laws, health regulations andthe laws governing labour and pensions;
• developments in any litigation or other similar proceedings (including with tax, customs andother regulatory authorities) directed at the drinks and spirits industry generally or at Diageo inparticular, or the impact of a product recall or product liability claim on Diageo’s profitability orreputation;
• developments in the Colombian litigation, Korean customs dispute, thalidomide litigation or anysimilar proceedings;
• changes in consumer preferences and tastes, demographic trends or perceptions about healthrelated issues, or contamination, counterfeiting or other circumstances which could harm theintegrity or sales of Diageo’s brands;
• changes in the cost or supply of raw materials, labour, energy and/or water;
• changes in political or economic conditions in countries and markets in which Diageo operates,including changes in levels of consumer spending, failure of customer, supplier and financialcounterparties or imposition of import, investment or currency restrictions;
• levels of marketing, promotional and innovation expenditure by Diageo and its competitors;
• renewal of supply, distribution, manufacturing or licence agreements (or related rights) andlicenses on favourable terms when they expire;
• termination of or failure to renegotiate existing distribution or licence manufacturing rights onagency brands;
• disruption to production facilities or business service centres, and systems change programmes,existing or future, and the ability to derive expected benefits from such programmes;
• technological developments that may affect the distribution of products or impede Diageo’sability to protect its intellectual property rights; and
• changes in financial and equity markets, including significant interest rate and foreign currencyexchange rate fluctuations and changes in the cost of capital, which may reduce or eliminateDiageo’s access to or increase the cost of financing or which may affect Diageo’s financial resultsand movements in the value of Diageo’s pension funds.
All oral and written forward-looking statements made on or after the date of this document andattributable to Diageo are expressly qualified in their entirety by the above factors and those described
31

Business description (continued)
in ‘Business description – Risk factors’. Any forward-looking statements made by or on behalf ofDiageo speak only as of the date they are made. Diageo does not undertake to update forward-lookingstatements to reflect any changes in Diageo’s expectations with regard thereto or any changes in events,conditions or circumstances on which any such statement is based. The reader should, however, consultany additional disclosures that Diageo may make in any documents which it publishes and/or files withthe US Securities and Exchange Commission. All readers, wherever located, should take note of thesedisclosures.
This document includes names of Diageo’s products, which constitute trademarks or tradenames which Diageo owns, or which others own and license to Diageo for use. All rights reserved.� Diageo plc 2012.
The information in this document does not constitute an offer to sell or an invitation to buy sharesin Diageo plc or an invitation or inducement to engage in any other investment activities.
This document includes information about Diageo’s target debt rating. A security rating is not arecommendation to buy, sell or hold securities and may be subject to revision or withdrawal at any timeby the assigning rating organisation. Each rating should be evaluated independently of any other rating.
Past performance cannot be relied upon as a guide to future performance.
32
Business review
Introduction
Information presented Diageo is the world’s leading premium drinks business and operates on aninternational scale selling all types of beverage alcohol. It is one of a small number of premium drinkscompanies that operate across spirits, beer and wine. Diageo’s brands have broad consumer appealacross geographies, and as a result, the business is organised under the business areas of NorthAmerica, Europe, Africa, Latin America and Caribbean, Asia Pacific and Global Supply. In view of thefocus on reporting results by the location of third party customers in explaining the group’sperformance in the business review, the results of the Global Supply segment have been allocated tothe geographic segments. The following discussion is based on Diageo’s results for the year ended30 June 2012 compared with the year ended 30 June 2011, and the year ended 30 June 2011 comparedwith the year ended 30 June 2010.
In the discussion of the performance of the business, net sales, defined as sales after deductingexcise duties, are presented in addition to sales, as sales figures include significant excise duties whichare set by external regulators and over which Diageo has no control. Diageo incurs excise dutiesthroughout the world. In some countries, excise duties are based on sales and are separately identifiedon the face of the invoice to the external customer. In others, it is effectively a production tax, which isincurred when the spirit is removed from bonded warehouses. In these countries, excise duties are partof the cost of goods sold and are not separately identified on the sales invoice. Changes in the level ofexcise duties can significantly affect the level of reported sales and cost of sales without directlyreflecting changes in volume, mix or profitability, which are the variables that have an impact on theelement of sales retained by the group.
References to emerging markets comprise Russia and Eastern Europe, Turkey, Africa, LatinAmerica and Caribbean and Asia Pacific excluding Australia, Korea and Japan.
References to reserve brands include Johnnie Walker Green Label, Johnnie Walker Gold Label18 year old, Johnnie Walker Gold Label Reserve, Johnnie Walker Blue Label, Johnnie Walker BlueLabel King George V, Johnnie Walker Platinum Label 18 year old, The John Walker, Classic Malts,Buchanan’s Special Reserve, Buchanan’s Red Seal, Dimple 18 year old, Bulleit Bourbon, TanquerayNo. TEN, Cıroc, Ketel One vodka, Don Julio, Zacapa, Godiva and Nuvo.
References to ready to drink also include ready to serve products, such as pre mix cans in somemarkets, and progressive adult beverages in the United States and certain markets supplied by theUnited States.
Price/mix is the number of percentage points by which the organic movement in net sales exceedsthe organic movement in volume. The difference arises because of changes in the composition of salesbetween higher and lower priced variants or as price changes are implemented.
Presentation of information in relation to the business In addition to describing the significant factorsthat have impacted the income statement for the years ended 30 June 2012 and 30 June 2011, in eachcase as compared to the immediately preceding year, additional information is also presented on theoperating performance and cash flows of the group.
There are several principal financial key performance indicators not specifically used in theconsolidated financial statements themselves (non-GAAP measures) that are used by the group’smanagement to assess the performance of the group in addition to income statement performance
33

Business review (continued)
measures. These are volume, organic movements in volume, sales, net sales, marketing spend, operatingprofit and operating margin and free cash flow. These key performance indicators are described below:
Volume is a non-GAAP measure that has been measured on an equivalent units basis to nine-litrecases of spirits. An equivalent unit represents one nine-litre case of spirits, which is approximately 272servings. A serving comprises 33ml of spirits, 165ml of wine, or 330ml of ready to drink or beer.Therefore, to convert volume of products, other than spirits, to equivalent units, the following guidehas been used: beer in hectolitres divide by 0.9, wine in nine-litre cases divide by five, ready to drink innine-litre cases divide by 10 and certain pre-mixed products that are classified as ready to drink innine-litre cases divide by five.
Organic movements in volume, sales, net sales, marketing spend, operating profit and operating marginare non-GAAP measures. The performance of the group is discussed using these measures.
In the discussion of the performance of the business, organic information is presented usingpounds sterling amounts on a constant currency basis. This retranslates prior year reported numbers atcurrent year exchange rates and enables an understanding of the underlying performance of the marketthat is most closely influenced by the actions of that market’s management. The risk from exchangerate movements is managed centrally and is not a factor over which local managers have any control.Residual exchange impacts are reported within Corporate.
Acquisitions, disposals and exceptional items also impact the reported performance and thereforethe reported movement in any year in which they arise. Management adjusts for the impact of suchtransactions in assessing the performance of the underlying business.
The underlying performance on a constant currency basis and excluding the impact of exceptionalitems, acquisitions and disposals is referred to as ‘organic’ performance. Organic movement calculationsenable the reader to focus on the performance of the business which is common to both years.
Diageo’s strategic planning and budgeting process is based on organic movements in volume, sales,net sales, marketing spend, operating profit and operating margin, and these measures closely reflectthe way in which operating targets are defined and performance is monitored by the group’smanagement.
These measures are chosen for planning, budgeting, reporting and incentive purposes since theyrepresent those measures which local managers are most directly able to influence and they enableconsideration of the underlying business performance without the distortion caused by fluctuatingexchange rates, exceptional items and acquisitions and disposals.
The group’s management believes these measures provide valuable additional information for usersof the financial statements in understanding the group’s performance since they provide information onthose elements of performance which local managers are most directly able to influence and they focuson that element of the core brand portfolio which is common to both years. They should be viewed ascomplementary to, and not replacements for, the comparable GAAP measures and reportedmovements therein.
Organic operating margin improvement is the movement in the group’s organic operating margin.Organic operating margin is the ratio calculated by dividing organic operating profit by organic netsales expressed as a percentage.
Free cash flow is a non-GAAP measure that comprises the net cash flow from operating activitiesaggregated with the net purchase and disposal of investments, property, plant and equipment and
34

Business review (continued)
computer software that form part of net cash flow from investing activities. The group’s managementbelieves the measure assists users of the financial statements in understanding the group’s cashgenerating performance as it comprises items which arise from the running of the ongoing business.
The remaining components of net cash flow from investing activities that do not form part of freecash flow, as defined by the group’s management, are in respect of the acquisition and sale ofsubsidiaries, associates and businesses. The group’s management regards the purchase and disposal ofproperty, plant and equipment and computer software as ultimately non-discretionary since ongoinginvestment in plant, machinery and technology is required to support the day-to-day operations,whereas acquisitions and sales of businesses are discretionary. However, free cash flow does notnecessarily reflect all amounts which the group has either a constructive or legal obligation to incur.Where appropriate, separate discussion is given for the impacts of acquisitions and sale of businesses,equity dividends paid and the purchase of own shares, each of which arises from decisions that areindependent from the running of the ongoing underlying business.
The free cash flow measure is used by management for their own planning, budgeting, reportingand incentive purposes since it provides information on those elements of performance which localmanagers are most directly able to influence.
Exceptional items Exceptional items are items which, in management’s judgement, need to bedisclosed by virtue of their size or incidence in order for the user to obtain a proper understanding ofthe financial information. Some figures are presented before exceptional items such as operating profitbefore exceptional items, taxation before exceptional items, the tax rate before exceptional items andearnings per share before exceptional items. The amounts before exceptional items are non-GAAPmeasures, used by management for their own reporting and incentive purposes since they provideinformation on the underlying performance of the group. The tax rate before exceptional items iscalculated by dividing the tax charge on continuing operations before tax charges and credits in respectof exceptional items by profit before taxation, adjusted to exclude the impact of the sale of businessesand exceptional operating costs before taxation, expressed as a percentage.
Revised segmental information for prior reporting periods On 25 May 2011 Diageo announcedchanges to its regional structure. From 1 July 2011 two autonomous regions, Africa and Latin Americaand Caribbean replaced the International region. The Global Travel and duty free operations are nowreported within the five geographical regions in which the external sales take place. The Middle Eastbusiness has become part of Asia Pacific.
As a result of this change Diageo now reports the following operating segments externally: NorthAmerica, Europe, Africa, Latin America and Caribbean, Asia Pacific and Corporate. In addition, forthe year ended 30 June 2012, changes have been made to the allocation of specific corporate itemsbetter reflecting the geographic segments for which they are in respect of. As a consequence of thesechanges the figures for the operating segments for prior years have been restated. Revised segmentalinformation for the years ended 30 June 2011 and 2010 are as follows.
35
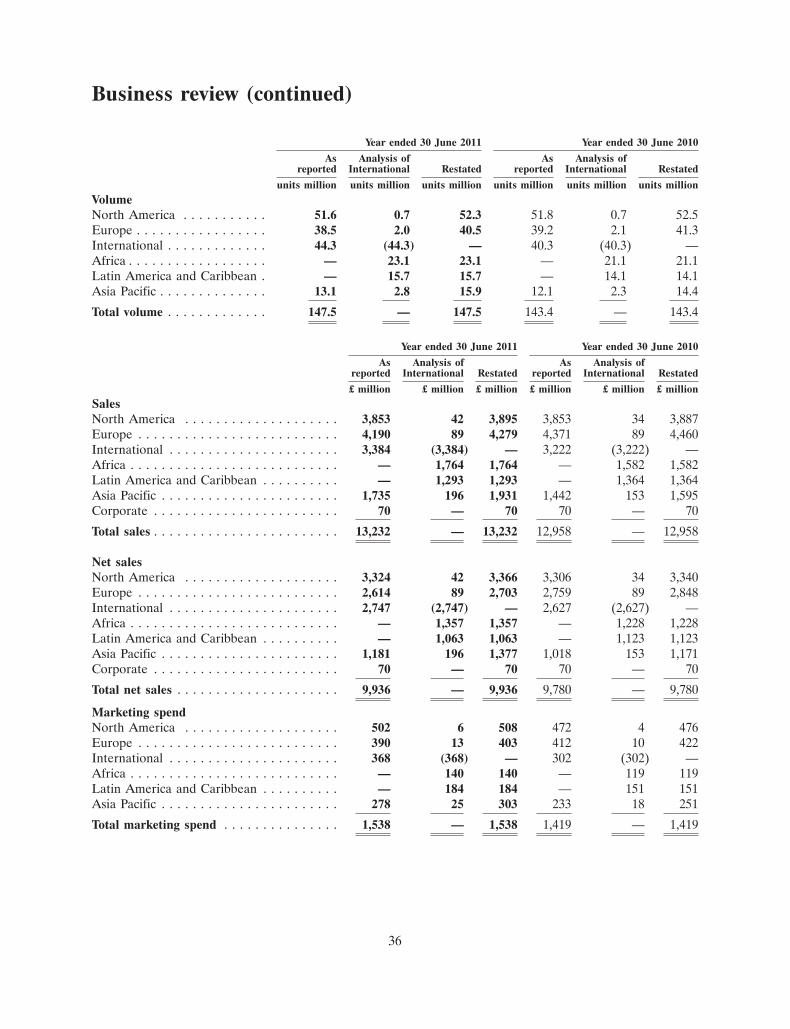
Business review (continued)
Year ended 30 June 2011 Year ended 30 June 2010
As Analysis of As Analysis ofreported International Restated reported International Restated
units million units million units million units million units million units millionVolumeNorth America . . . . . . . . . . . 51.6 0.7 52.3 51.8 0.7 52.5Europe . . . . . . . . . . . . . . . . . 38.5 2.0 40.5 39.2 2.1 41.3International . . . . . . . . . . . . . 44.3 (44.3) — 40.3 (40.3) —Africa . . . . . . . . . . . . . . . . . . — 23.1 23.1 — 21.1 21.1Latin America and Caribbean . — 15.7 15.7 — 14.1 14.1Asia Pacific . . . . . . . . . . . . . . 13.1 2.8 15.9 12.1 2.3 14.4
Total volume . . . . . . . . . . . . . 147.5 — 147.5 143.4 — 143.4
Year ended 30 June 2011 Year ended 30 June 2010
As Analysis of As Analysis ofreported International Restated reported International Restated
£ million £ million £ million £ million £ million £ millionSalesNorth America . . . . . . . . . . . . . . . . . . . . 3,853 42 3,895 3,853 34 3,887Europe . . . . . . . . . . . . . . . . . . . . . . . . . . 4,190 89 4,279 4,371 89 4,460International . . . . . . . . . . . . . . . . . . . . . . 3,384 (3,384) — 3,222 (3,222) —Africa . . . . . . . . . . . . . . . . . . . . . . . . . . . — 1,764 1,764 — 1,582 1,582Latin America and Caribbean . . . . . . . . . . — 1,293 1,293 — 1,364 1,364Asia Pacific . . . . . . . . . . . . . . . . . . . . . . . 1,735 196 1,931 1,442 153 1,595Corporate . . . . . . . . . . . . . . . . . . . . . . . . 70 — 70 70 — 70
Total sales . . . . . . . . . . . . . . . . . . . . . . . . 13,232 — 13,232 12,958 — 12,958
Net salesNorth America . . . . . . . . . . . . . . . . . . . . 3,324 42 3,366 3,306 34 3,340Europe . . . . . . . . . . . . . . . . . . . . . . . . . . 2,614 89 2,703 2,759 89 2,848International . . . . . . . . . . . . . . . . . . . . . . 2,747 (2,747) — 2,627 (2,627) —Africa . . . . . . . . . . . . . . . . . . . . . . . . . . . — 1,357 1,357 — 1,228 1,228Latin America and Caribbean . . . . . . . . . . — 1,063 1,063 — 1,123 1,123Asia Pacific . . . . . . . . . . . . . . . . . . . . . . . 1,181 196 1,377 1,018 153 1,171Corporate . . . . . . . . . . . . . . . . . . . . . . . . 70 — 70 70 — 70
Total net sales . . . . . . . . . . . . . . . . . . . . . 9,936 — 9,936 9,780 — 9,780
Marketing spendNorth America . . . . . . . . . . . . . . . . . . . . 502 6 508 472 4 476Europe . . . . . . . . . . . . . . . . . . . . . . . . . . 390 13 403 412 10 422International . . . . . . . . . . . . . . . . . . . . . . 368 (368) — 302 (302) —Africa . . . . . . . . . . . . . . . . . . . . . . . . . . . — 140 140 — 119 119Latin America and Caribbean . . . . . . . . . . — 184 184 — 151 151Asia Pacific . . . . . . . . . . . . . . . . . . . . . . . 278 25 303 233 18 251
Total marketing spend . . . . . . . . . . . . . . . 1,538 — 1,538 1,419 — 1,419
36

Business review (continued)
Year ended 30 June 2011 Year ended 30 June 2010
As Analysis of Corporate As Analysis of Corporatereported International costs Restated reported International costs Restated
£ million £ million £ million £ million £ million £ million £ million £ millionOperating profit before
exceptional itemsNorth America . . . . . . . . 1,255 17 3 1,275 1,170 13 1 1,184Europe . . . . . . . . . . . . . . 778 28 (10) 796 859 30 (8) 881International . . . . . . . . . . 804 (804) — — 771 (771) — —Africa . . . . . . . . . . . . . . — 330 3 333 — 304 (3) 301Latin America and
Caribbean . . . . . . . . . . — 336 (18) 318 — 355 (19) 336Asia Pacific . . . . . . . . . . . 208 93 (2) 299 176 69 (5) 240Corporate . . . . . . . . . . . . (161) — 24 (137) (225) — 34 (191)
Total operating profitbefore exceptional items 2,884 — — 2,884 2,751 — — 2,751
Operating results 2012 compared with 2011
Summary consolidated income statementYear ended 30 June
2012 2011
£ million £ million
Sales . . . . . . . . . . . . . . . . . . . . . . . . . . . . . . . . . . . . . . . . . . . . . . . . . . . . . . . . . . 14,594 13,232Excise duties . . . . . . . . . . . . . . . . . . . . . . . . . . . . . . . . . . . . . . . . . . . . . . . . . . . . (3,832) (3,296)
Net sales . . . . . . . . . . . . . . . . . . . . . . . . . . . . . . . . . . . . . . . . . . . . . . . . . . . . . . . 10,762 9,936Operating costs before exceptional items . . . . . . . . . . . . . . . . . . . . . . . . . . . . . . . . (7,564) (7,052)
Operating profit before exceptional items . . . . . . . . . . . . . . . . . . . . . . . . . . . . . . . 3,198 2,884Exceptional operating items . . . . . . . . . . . . . . . . . . . . . . . . . . . . . . . . . . . . . . . . . (40) (289)
Operating profit . . . . . . . . . . . . . . . . . . . . . . . . . . . . . . . . . . . . . . . . . . . . . . . . . 3,158 2,595Sale of businesses . . . . . . . . . . . . . . . . . . . . . . . . . . . . . . . . . . . . . . . . . . . . . . . . 147 (14)Net finance charges . . . . . . . . . . . . . . . . . . . . . . . . . . . . . . . . . . . . . . . . . . . . . . . (397) (397)Share of associates’ profits after tax . . . . . . . . . . . . . . . . . . . . . . . . . . . . . . . . . . . 213 176
Profit before taxation . . . . . . . . . . . . . . . . . . . . . . . . . . . . . . . . . . . . . . . . . . . . . . 3,121 2,360Taxation . . . . . . . . . . . . . . . . . . . . . . . . . . . . . . . . . . . . . . . . . . . . . . . . . . . . . . . (1,038) (343)
Profit from continuing operations . . . . . . . . . . . . . . . . . . . . . . . . . . . . . . . . . . . . . 2,083 2,017Discontinued operations . . . . . . . . . . . . . . . . . . . . . . . . . . . . . . . . . . . . . . . . . . . . (11) —
Profit for the year . . . . . . . . . . . . . . . . . . . . . . . . . . . . . . . . . . . . . . . . . . . . . . . . 2,072 2,017
Attributable to:Equity shareholders of the parent company . . . . . . . . . . . . . . . . . . . . . . . . . . . . . . 1,942 1,900Non-controlling interests . . . . . . . . . . . . . . . . . . . . . . . . . . . . . . . . . . . . . . . . . . . 130 117
2,072 2,017
Sales and net sales On a reported basis, sales increased by £1,362 million from £13,232 million inthe year ended 30 June 2011 to £14,594 million in the year ended 30 June 2012 and net sales increased
37

Business review (continued)
by £826 million from £9,936 million in the year ended 30 June 2011 to £10,762 million in the yearended 30 June 2012. Exchange rate movements decreased reported sales by £123 million and reportednet sales by £90 million. Acquisitions increased reported sales by £741 million and reported net sales by£320 million. Disposals decreased reported sales by £31 million and reported net sales by £29 million.
Operating costs before exceptional items On a reported basis, operating costs before exceptionalitems increased by £512 million from £7,052 million in the year ended 30 June 2011 to £7,564 million inthe year ended 30 June 2012 due to an increase in cost of sales of £245 million from £3,983 million to£4,228 million, an increase in marketing spend of £153 million from £1,538 million to £1,691 million,and an increase in other operating expenses before exceptional costs of £114 million, from£1,531 million to £1,645 million. Exchange rate movements benefited total operating costs beforeexceptional items by £80 million.
Exceptional operating items Exceptional operating charges of £40 million for the year ended 30 June2012 comprised:
• a gain of £115 million (2011 – £nil) in respect of changes in the calculation of future pensionincreases for Diageo’s principal UK and Irish pension schemes;
• a brand impairment charge of £59 million (2011 – £39 million);
• a charge of £69 million (2011 – £77 million) for the operating model review announced in May2011; and
• £27 million (2011 – £34 million) for the restructuring of the group’s Global Supply operations inScotland, Ireland and in the United States.
In the year ended 30 June 2011 exceptional operating items also included a charge of £139 millionin respect of duty settlements with the Turkish and the Thai customs authorities and settlements withthe Securities and Exchange Commission (SEC) in respect of various regulatory and control matters.
In the year ended 30 June 2012 total restructuring cash expenditure was £158 million (2011 –£118 million). In the year ended 30 June 2011 cash payments of £141 million were also made for theduty and the SEC settlements. An exceptional charge of approximately £50 million is expected to beincurred in the year ending 30 June 2013 in respect of the restructuring of Global Supply operationsprincipally in Ireland, while cash expenditure is expected to be approximately £80 million.
Post employment plans The deficit in respect of post employment plans before taxation increased by£247 million from £838 million at 30 June 2011 to £1,085 million at 30 June 2012 primarily as a resultof a decrease in the discount rate assumptions used to calculate the liabilities of the plans partly offsetby a decrease in the inflation assumptions and changes in the calculation of future pension increases.Cash contributions to the group’s UK and Irish pension plans in the year ended 30 June 2012 were£133 million (2011 – £151 million) and are expected to be approximately £140 million for the yearending 30 June 2013.
Operating profit Reported operating profit for the year ended 30 June 2012 increased by £563 millionto £3,158 million from £2,595 million in the prior year. Before exceptional operating items, operatingprofit for the year ended 30 June 2012 increased by £314 million to £3,198 million from £2,884 millionin the prior year. Exchange rate movements decreased both operating profit and operating profitbefore exceptional items for the year ended 30 June 2012 by £10 million. Acquisitions increasedreported operating profit by £79 million and disposals decreased reported operating profit by£3 million.
38
Business review (continued)
Exceptional non-operating items In the year ended 30 June 2012 gain on sale of businesses of£147 million included a step up gain of £124 million on the revaluation of the group’s equity holdingsin Quanxing and Shuijingfang to fair value as the associates became subsidiaries during the year. Inaddition, exceptional non-operating items include a gain of £23 million on the sale of the group’sinvestment in Tanzania Breweries. In the year ended 30 June 2011 a net loss before taxation of£14 million on sale of businesses arose on the disposal of a number of small wine businesses in Europeand in the United States and on the termination of a joint venture in India.
Net finance charges Net finance charges amounted £397 million in the year ended 30 June 2012(2011 – £397 million).
Net interest charge increased by £13 million from £369 million in the prior year to £382 million inthe year ended 30 June 2012. The effective interest rate was 4.7% (2011 – 4.9%) in the year ended30 June 2012 and average net borrowings increased by £1.1 billion compared to the prior year. For thecalculation of effective interest rate, the net interest charge excludes fair value adjustments to derivativefinancial instruments and borrowings and average monthly net borrowings include the impact of interestrate swaps that are no longer in a hedge relationship but exclude the market value adjustment for crosscurrency interest rate swaps. The income statement interest cover was 8.9 times and cash interest coverwas 9.4 times (2011 – 8.3 times and 10.6 times, respectively).
Net other finance charges for the year ended 30 June 2012 were £15 million (2011 – £28 million).There was a change of £10 million in finance charges in respect of post employment plans from acharge of £3 million in the year ended 30 June 2011 to an income of £7 million in the year ended30 June 2012. Other finance charges also included £17 million (2011 – £16 million) on unwinding ofdiscounts on liabilities, a hyperinflation adjustment of £3 million (2011 – £9 million) in respect of thegroup’s Venezuela operations and £2 million (2011 – £nil) in respect of net exchange movements oncertain financial instruments. In the year ending 30 June 2013 the finance charge in respect of postemployment plans is expected to be £12 million.
Associates The group’s share of associates’ profits after interest and tax was £213 million for the yearended 30 June 2012 compared to £176 million in the prior year. Diageo’s 34% equity interest inMoet Hennessy contributed £205 million (2011 – £179 million) to share of associates’ profits afterinterest and tax.
Profit before taxation Profit before taxation increased by £761 million from £2,360 million in theprior year to £3,121 million in the year ended 30 June 2012.
Taxation The reported tax rate increased from 14.5% in the year ended 30 June 2011 to 33.3% inthe year ended 30 June 2012. During the year tax authority negotiations were concluded resulting in afavourable change to the taxation basis of certain overseas profit and intangible assets which hasreduced the ongoing tax rate but which resulted in the loss of future tax amortisation deductions givingrise to an exceptional write off of the related deferred tax assets of £524 million. The tax rate beforeexceptional items for the year ended 30 June 2012 was 17.7% compared with 17.4% in the year ended30 June 2011. In the future it is expected that the tax rate before exceptional items will remain atapproximately 18%.
39

Business review (continued)
The tax rates from continuing operations before exceptional and after exceptional items forthe years ended 30 June 2012 and 30 June 2011 were calculated as follows:
Year ended 30 June
2012 2011
£ million £ million
Taxation on profit from continuing operations (A) . . . . . . . . . . . . . . . . . . . . . . . . . 1,038 343Tax credits in respect of exceptional items . . . . . . . . . . . . . . . . . . . . . . . . . . . . . . . 19 54Exceptional tax (charges)/credits . . . . . . . . . . . . . . . . . . . . . . . . . . . . . . . . . . . . . . (524) 66
Tax before exceptional items (B) . . . . . . . . . . . . . . . . . . . . . . . . . . . . . . . . . . . . . . 533 463
Profit before taxation (C) . . . . . . . . . . . . . . . . . . . . . . . . . . . . . . . . . . . . . . . . . . . 3,121 2,360(Gains)/losses on sale of businesses . . . . . . . . . . . . . . . . . . . . . . . . . . . . . . . . . . . . (147) 14Exceptional operating costs . . . . . . . . . . . . . . . . . . . . . . . . . . . . . . . . . . . . . . . . . 40 289
Profit from continuing operations before taxation and exceptional items (D) . . . . . 3,014 2,663
Tax rate after exceptional items (A/C) . . . . . . . . . . . . . . . . . . . . . . . . . . . . . . . . . . 33.3% 14.5%Tax rate before exceptional items (B/D) . . . . . . . . . . . . . . . . . . . . . . . . . . . . . . . . 17.7% 17.4%
Discontinued operations Discontinued operations in the year ended 30 June 2012 represent a chargeafter taxation of £11 million in respect of anticipated future payments to additional thalidomideclaimants.
Exchange rate and other movements Foreign exchange movements in the year ended 30 June 2012decreased net sales, operating profit before exceptional items and profit from associates by £90 million,£10 million and £2 million, respectively, and reduced net finance charges by £19 million.
For the year ending 30 June 2013 foreign exchange movements are not expected to materiallyaffect operating profit or net finance charge based on applying current exchange rates (£1 = $1.57 :£1 = A1.28). This guidance excludes the impact of IAS 21 and IAS 39.
Dividend The directors recommend a final dividend of 26.9 pence per share, an increase of 8% fromthe year ended 30 June 2011. The full dividend will therefore be 43.5 pence per share, an increase of8% from the year ended 30 June 2011. Subject to approval by shareholders, the final dividend will bepaid on 22 October 2012 to shareholders on the register on 7 September 2012. Payment to US ADRholders will be made on 26 October 2012. A dividend reinvestment plan is available in respect of thefinal dividend and the plan notice date is 1 October 2012.
Analysis by business area and brand
In order to assist the reader of the financial statements, the following comparison of 2012 with 2011includes tables which present the exchange, acquisitions and disposals and organic components ofthe year on year movement for each of volume, sales, net sales, marketing spend and operating profit.Organic movements in the tables below are calculated as follows:
(a) The organic movement percentage is the amount in the column headed ‘Organic movement’ inthe tables below expressed as a percentage of the aggregate of the amount in the column headed‘2011 Reported’, the amount in the column headed ‘Exchange’ and the amount, if any, in respect ofacquisitions and disposals that have impacted the comparable prior year included in the column headed‘Acquisitions and disposals’. The inclusion of the column headed ‘Exchange’ in the organic movement
40

Business review (continued)
calculation reflects the adjustment to recalculate the prior year results as if they had been generated atthe current year’s exchange rates.
(b) Where a business, brand, brand distribution right or agency agreement was disposed of, orterminated, in the current or prior year, the group, in organic movement calculations, excludes theresults for that business from the current year and prior year. In the calculation of operating profit, theoverheads included in disposals are only those directly attributable to the businesses disposed of, anddo not result from subjective judgements of management. For acquisitions in the current year, the postacquisition results are excluded from the organic movement calculations. For acquisitions in theprior year, post acquisition results are included in full in the prior year but are included in the organicmovement calculation from the anniversary of the acquisition date in the current year. The acquisitioncolumn also eliminates the impact of transaction costs that have been charged to operating profit in thecurrent or prior year in respect of acquisitions that in management assessment are expected tocomplete.
The organic movement calculations for volume, sales, net sales, marketing spend and operatingprofit for the year ended 30 June 2012 were as follows:
2011 AcquisitionsReported and Organic 2012 Organic
(restated) disposals(2) movement Reported movement
units million units million units million units million %
VolumeNorth America . . . . . . . . . . . . . . . . . . . 52.3 (0.1) 0.8 53.0 2Europe . . . . . . . . . . . . . . . . . . . . . . . . . 40.5 5.1 (0.4) 45.2 (1)Africa . . . . . . . . . . . . . . . . . . . . . . . . . 23.1 0.6 1.2 24.9 5Latin America and Caribbean . . . . . . . . 15.7 — 1.5 17.2 10Asia Pacific . . . . . . . . . . . . . . . . . . . . . . 15.9 — 0.3 16.2 2
Total volume . . . . . . . . . . . . . . . . . . . . . 147.5 5.6 3.4 156.5 2
2011 AcquisitionsReported and Organic 2012 Organic
(restated) Exchange(1) disposals(2) movement Reported movement
£ million £ million £ million £ million £ million %
SalesNorth America . . . . . . . . . . . . . . . . 3,895 22 (26) 203 4,094 5Europe . . . . . . . . . . . . . . . . . . . . . 4,279 (35) 700 22 4,966 1Africa . . . . . . . . . . . . . . . . . . . . . . 1,764 (106) 36 175 1,869 11Latin America and Caribbean . . . . . 1,293 (32) — 230 1,491 18Asia Pacific . . . . . . . . . . . . . . . . . . 1,931 29 — 144 2,104 7Corporate . . . . . . . . . . . . . . . . . . . 70 (1) — 1 70 1
Total sales . . . . . . . . . . . . . . . . . . . 13,232 (123) 710 775 14,594 6
41
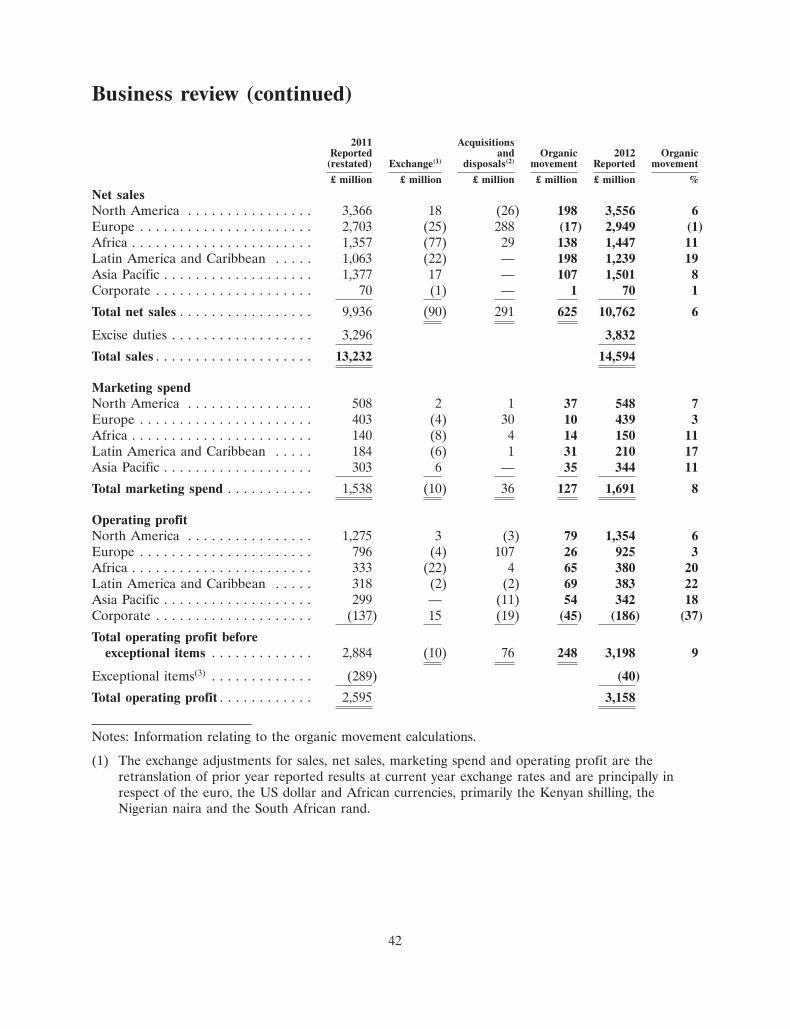
Business review (continued)
2011 AcquisitionsReported and Organic 2012 Organic
(restated) Exchange(1) disposals(2) movement Reported movement
£ million £ million £ million £ million £ million %
Net salesNorth America . . . . . . . . . . . . . . . . 3,366 18 (26) 198 3,556 6Europe . . . . . . . . . . . . . . . . . . . . . . 2,703 (25) 288 (17) 2,949 (1)Africa . . . . . . . . . . . . . . . . . . . . . . . 1,357 (77) 29 138 1,447 11Latin America and Caribbean . . . . . 1,063 (22) — 198 1,239 19Asia Pacific . . . . . . . . . . . . . . . . . . . 1,377 17 — 107 1,501 8Corporate . . . . . . . . . . . . . . . . . . . . 70 (1) — 1 70 1
Total net sales . . . . . . . . . . . . . . . . . 9,936 (90) 291 625 10,762 6
Excise duties . . . . . . . . . . . . . . . . . . 3,296 3,832
Total sales . . . . . . . . . . . . . . . . . . . . 13,232 14,594
Marketing spendNorth America . . . . . . . . . . . . . . . . 508 2 1 37 548 7Europe . . . . . . . . . . . . . . . . . . . . . . 403 (4) 30 10 439 3Africa . . . . . . . . . . . . . . . . . . . . . . . 140 (8) 4 14 150 11Latin America and Caribbean . . . . . 184 (6) 1 31 210 17Asia Pacific . . . . . . . . . . . . . . . . . . . 303 6 — 35 344 11
Total marketing spend . . . . . . . . . . . 1,538 (10) 36 127 1,691 8
Operating profitNorth America . . . . . . . . . . . . . . . . 1,275 3 (3) 79 1,354 6Europe . . . . . . . . . . . . . . . . . . . . . . 796 (4) 107 26 925 3Africa . . . . . . . . . . . . . . . . . . . . . . . 333 (22) 4 65 380 20Latin America and Caribbean . . . . . 318 (2) (2) 69 383 22Asia Pacific . . . . . . . . . . . . . . . . . . . 299 — (11) 54 342 18Corporate . . . . . . . . . . . . . . . . . . . . (137) 15 (19) (45) (186) (37)
Total operating profit beforeexceptional items . . . . . . . . . . . . . 2,884 (10) 76 248 3,198 9
Exceptional items(3) . . . . . . . . . . . . . (289) (40)
Total operating profit . . . . . . . . . . . . 2,595 3,158
Notes: Information relating to the organic movement calculations.
(1) The exchange adjustments for sales, net sales, marketing spend and operating profit are theretranslation of prior year reported results at current year exchange rates and are principally inrespect of the euro, the US dollar and African currencies, primarily the Kenyan shilling, theNigerian naira and the South African rand.
42

Business review (continued)
(2) The impacts of acquisitions and disposals are excluded from the organic movement. In the yearended 30 June 2012 the acquisitions and disposals that materially affected volume, sales, net sales,marketing spend and operating profit were as follows:
Net Marketing OperatingVolume Sales sales spend profit
units million £ million £ million £ million £ million
Mey Icki . . . . . . . . . . . . . . . . . . . . . . . 5.1 705 291 27 95Zacapa . . . . . . . . . . . . . . . . . . . . . . . . — — — 6 8Meta . . . . . . . . . . . . . . . . . . . . . . . . . . 0.3 16 13 1 —Quanxing . . . . . . . . . . . . . . . . . . . . . . . — — — — (19)Serengeti . . . . . . . . . . . . . . . . . . . . . . . 0.3 20 16 2 (2)Other acquisitions* . . . . . . . . . . . . . . . . — — — — (28)Acquisitions – 2012 . . . . . . . . . . . . . . . 5.7 741 320 36 54Acquisitions – 2011** . . . . . . . . . . . . . . — — — — 25Disposals . . . . . . . . . . . . . . . . . . . . . . . (0.1) (31) (29) — (3)
5.6 710 291 36 76
* Includes transaction costs in respect of acquisitions not yet completed.
** Represents transaction and integration costs in respect of acquisitions incurred in the yearended 30 June 2011.
In the year ended 30 June 2012 there were no material disposals impacting organic growth butadjustment is made to exclude the impact of the disposals completed under the reorganisation ofthe group’s US wines operations and the Gilbeys wholesale wine business in Ireland in the yearended 30 June 2011.
(3) Exceptional operating charges of £40 million for the year ended 30 June 2012 (2011 –£289 million) comprised a gain of £115 million (2011 – £nil) in respect of changes in thecalculation of future pension increases for Diageo’s principal UK and Irish pension schemes, abrand impairment charge of £59 million (2011 – £39 million), a charge of £69 million (2011 –£77 million) for the operating model review announced in May 2011 and £27 million (2011 –£34 million) for the restructuring of the group’s Global Supply operations in Scotland, Ireland andin the United States. In the year ended 30 June 2011 exceptional operating items also included acharge of £139 million in respect of duty settlements with the Turkish and the Thai customsauthorities and settlements with the Securities and Exchange Commission (SEC) regarding variousregulatory and control matters.
Cost of sales
Reported cost of sales for the year ended 30 June 2012 increased by £249 million from £4,010 millionin the year ended 30 June 2011 to £4,259 million in the year ended 30 June 2012. Included in cost ofsales in the year ended 30 June 2012 were exceptional items of £31 million (2011 – £27 million).Acquisitions and disposals added £91 million, with Mey Icki being the principal contributor, andfavourable exchange movements reduced cost of sales by £38 million. The 2% volume increase togetherwith some mix benefits added £110 million to cost of sales. Cost increases on materials, utilities andlogistics amounted to 5% of cost of sales, and half of this increase was offset by cost reductionsthrough asset rationalisation, procurement benefits and operational efficiencies.
43

Business review (continued)
Corporate revenue and costs
Net sales were £70 million in the year ended 30 June 2012, flat relative to the comparable prior period.Net operating charges were £186 million in the year ended 30 June 2012 having been £137 million inthe year ended 30 June 2011. The movement was made up of:
• a charge of £12 million versus a benefit of £21 million in the year ended 30 June 2011, arisingfrom currency transaction hedging which is controlled centrally;
• £19 million in respect of transaction costs incurred on acquisitions; and
• a £3 million reduction in underlying corporate costs.
44
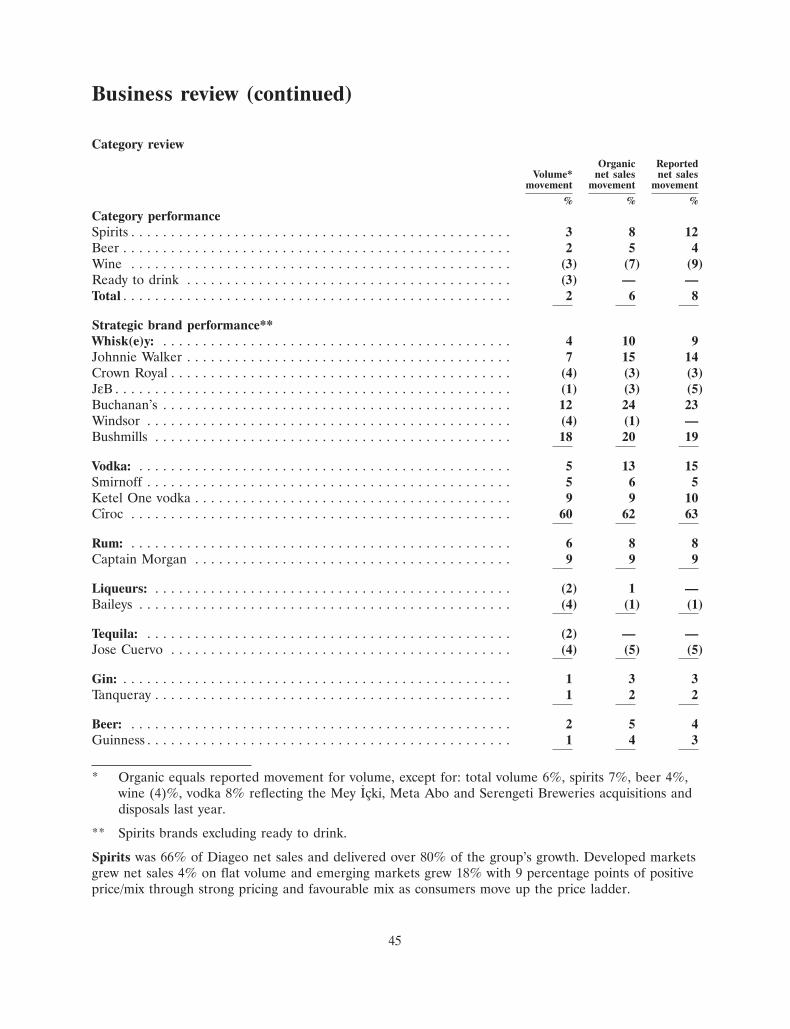
Business review (continued)
Category reviewOrganic Reported
Volume* net sales net salesmovement movement movement
% % %
Category performanceSpirits . . . . . . . . . . . . . . . . . . . . . . . . . . . . . . . . . . . . . . . . . . . . . . . . 3 8 12Beer . . . . . . . . . . . . . . . . . . . . . . . . . . . . . . . . . . . . . . . . . . . . . . . . . 2 5 4Wine . . . . . . . . . . . . . . . . . . . . . . . . . . . . . . . . . . . . . . . . . . . . . . . . (3) (7) (9)Ready to drink . . . . . . . . . . . . . . . . . . . . . . . . . . . . . . . . . . . . . . . . . (3) — —Total . . . . . . . . . . . . . . . . . . . . . . . . . . . . . . . . . . . . . . . . . . . . . . . . . 2 6 8
Strategic brand performance**Whisk(e)y: . . . . . . . . . . . . . . . . . . . . . . . . . . . . . . . . . . . . . . . . . . . . 4 10 9Johnnie Walker . . . . . . . . . . . . . . . . . . . . . . . . . . . . . . . . . . . . . . . . . 7 15 14Crown Royal . . . . . . . . . . . . . . . . . . . . . . . . . . . . . . . . . . . . . . . . . . . (4) (3) (3)JεB . . . . . . . . . . . . . . . . . . . . . . . . . . . . . . . . . . . . . . . . . . . . . . . . . . (1) (3) (5)Buchanan’s . . . . . . . . . . . . . . . . . . . . . . . . . . . . . . . . . . . . . . . . . . . . 12 24 23Windsor . . . . . . . . . . . . . . . . . . . . . . . . . . . . . . . . . . . . . . . . . . . . . . (4) (1) —Bushmills . . . . . . . . . . . . . . . . . . . . . . . . . . . . . . . . . . . . . . . . . . . . . 18 20 19
Vodka: . . . . . . . . . . . . . . . . . . . . . . . . . . . . . . . . . . . . . . . . . . . . . . . 5 13 15Smirnoff . . . . . . . . . . . . . . . . . . . . . . . . . . . . . . . . . . . . . . . . . . . . . . 5 6 5Ketel One vodka . . . . . . . . . . . . . . . . . . . . . . . . . . . . . . . . . . . . . . . . 9 9 10Cıroc . . . . . . . . . . . . . . . . . . . . . . . . . . . . . . . . . . . . . . . . . . . . . . . . 60 62 63
Rum: . . . . . . . . . . . . . . . . . . . . . . . . . . . . . . . . . . . . . . . . . . . . . . . . 6 8 8Captain Morgan . . . . . . . . . . . . . . . . . . . . . . . . . . . . . . . . . . . . . . . . 9 9 9
Liqueurs: . . . . . . . . . . . . . . . . . . . . . . . . . . . . . . . . . . . . . . . . . . . . . (2) 1 —Baileys . . . . . . . . . . . . . . . . . . . . . . . . . . . . . . . . . . . . . . . . . . . . . . . (4) (1) (1)
Tequila: . . . . . . . . . . . . . . . . . . . . . . . . . . . . . . . . . . . . . . . . . . . . . . (2) — —Jose Cuervo . . . . . . . . . . . . . . . . . . . . . . . . . . . . . . . . . . . . . . . . . . . (4) (5) (5)
Gin: . . . . . . . . . . . . . . . . . . . . . . . . . . . . . . . . . . . . . . . . . . . . . . . . . 1 3 3Tanqueray . . . . . . . . . . . . . . . . . . . . . . . . . . . . . . . . . . . . . . . . . . . . . 1 2 2
Beer: . . . . . . . . . . . . . . . . . . . . . . . . . . . . . . . . . . . . . . . . . . . . . . . . 2 5 4Guinness . . . . . . . . . . . . . . . . . . . . . . . . . . . . . . . . . . . . . . . . . . . . . . 1 4 3
* Organic equals reported movement for volume, except for: total volume 6%, spirits 7%, beer 4%,wine (4)%, vodka 8% reflecting the Mey Icki, Meta Abo and Serengeti Breweries acquisitions anddisposals last year.
** Spirits brands excluding ready to drink.
Spirits was 66% of Diageo net sales and delivered over 80% of the group’s growth. Developed marketsgrew net sales 4% on flat volume and emerging markets grew 18% with 9 percentage points of positiveprice/mix through strong pricing and favourable mix as consumers move up the price ladder.
45

Business review (continued)
Total Whisk(e)y was 35% of Diageo portfolio by net sales. Scotch delivered strong growth with netsales up 12%. Premium and super premium drove this growth and price/mix was up 7 percentage pointsas a result. In the developed markets, weakness in Southern Europe led to declines in value andstandard scotch brands. These segments grew double digit in the emerging markets as Diageocontinued to drive recruitment through the more affordable brands. Premium and super premiumbrands grew in all regions on the back of successful innovations and strong marketing. The Singletonmore than doubled net sales in Germany and France behind the ‘Best tasting Single Malt – You decide’campaign and Old Parr grew 23% with 10 percentage points of positive price/mix through exceptionalgrowth in PUB and Colombia. In the growing North America whiskey segment Bulleit delivered over60% growth in net sales on the back of the success of Bulleit Rye.
Johnnie Walker had another exceptional year, posting 15% net sales growth, with the fastestgrowth coming from super deluxe variants. The growth of Red Label was driven by the emergingmiddle class recruitment programmes with the ‘Step Up’ activation delivering almost 60% net salesgrowth in South Africa and the ‘Keep Walking Brazil’ campaign driving 16% net sales growth in PUB.The continued success of Johnnie Walker Double Black, priced at a 20% premium to Black Label,together with price increases drove 15% net sales growth for the Black Label variant. Super deluxegrew 28% in the year as the brand experienced a significant shift to higher marks in North America,driven by the new Blue Label packaging and the successful engraving advertising campaign, and asGold Label net sales more than doubled in Asia Pacific. Johnnie Walker XR21 was also very successfulwithin its core geographical target region of Asia Pacific, reaching near 20% share in its segment sincelaunch. Total marketing spend increased 11% with over 80% of the incremental investment directedtowards emerging markets, especially Asia Pacific and Latin America, and behind proven global growthdrivers, including the ‘Walk with Giants’ and ‘Step Inside the Circuit’ campaigns and ongoing grandprix sponsorships.
While the economic challenges in Europe have resulted in a 3% reduction in J�B net salesglobally, this represented a significant slowing in the rate of decline versus last year as the JεB businessis rebalancing between developed and emerging markets. Slowdown in the second half reflected thereversal of the pre excise duty increase buy-in in France, while underlying consumption trends did notchange materially. Turkey posted 21% net sales growth and Africa and Latin America also saw doubledigit top line growth on the back of the ‘City Remix’ programme significantly increasing consumerengagement with the brand.
Buchanan’s delivered strong double digit net sales growth for the third consecutive year, supportedby the launch of the ‘Share Yourself’ campaign and the solid growth of Buchanan’s Special Reserve,especially in Venezuela and Colombia. The 12 percentage points of positive price/mix was a result ofprice increases and premiumisation across the Americas, helped by the successful roll-out ofBuchanan’s Master, trading consumers up beyond deluxe at an 18% price premium. The brand posted11% net sales growth in North America.
Windsor grew share and remained the leading scotch brand in Korea, net sales however declined1% as the whisky market contracted further in the country. Share gain has been achieved through the‘Share the Vision’ campaign in the first half, followed by point of sale promotions in the second half.Windsor 12 and 17 variants enjoyed 4 and 2 percentage points of positive price/mix, respectively on theback of price increases put through last year.
While Crown Royal held share in the highly competitive non flavoured North America whiskeysegment, the brand’s performance was impacted by the lapping of the successful launch of Crown RoyalBlack last year and also by its segment losing share to flavoured whiskey. Marketing spend was focused
46

Business review (continued)
behind the launch of the ‘Crown Life’ programme appealing to the African-American and Hispanicconsumers in the United States.
Bushmills delivered double digit increases in both volume and net sales. Its performance wasparticularly strong in Eastern Europe, where it made some important share gains. Bushmills Honey waslaunched successfully in the United States and delivered a third of the brand’s growth globally.
Vodka, 12% of Diageo net sales, saw 13% growth with positive price/mix as value vodka brandsdeclined and super premium brands grew strongly with volume up almost 30%. The category drove aquarter of the group net sales growth with the super premium segment delivering 74% of that increasethrough the continued strong performance of Cıroc.
Smirnoff returned to strong growth, driven by a marked acceleration in developed markets anddouble digit growth in Africa and Latin America. Marketing spend increased 10% focusing on provengrowth drivers. Fifty countries participated in the Smirnoff ‘Nightlife Exchange Project’, which in itssecond year was expanded by the collaboration with Live Nation and Madonna. In the United States,Smirnoff grew volume share with the highly successful innovation launches of Smirnoff Whipped Creamand Fluffed Marshmallow and also as a result of the Smirnoff 21 ‘I Choose’ campaign. Great Britain,Germany and the Benelux led Smirnoff’s growth in Europe through the execution of ‘MadonnaLimited Edition’ campaigns.
Ketel One vodka delivered 8% net sales growth in North America with continued share gainsfuelled by the highly successful ‘Gentlemen, this is Vodka’ campaign. Ketel One vodka is now sold in63 markets. Latin America and Asia Pacific posted net sales growth over 50%, with PUB, Australia andSouth East Asia being the key drivers of growth in these regions on the back of leveraging the brand’sassociation with cocktail culture through the media.
Cıroc had another outstanding year with 62% global top line growth supported by 52% increase inmarketing spend, mainly behind the ‘Cıroc the New Year’ campaign and in the digital space. The highlysuccessful launch of Cıroc Peach together with the continued double digit growth of Red Berry andCoconut depletions helped the brand to gain further share and it is the fastest growing ultra premiumvodka in the United States. Outside North America, the brand more than doubled its net sales.
Rum, which was 6% of Diageo net sales, posted 8% growth with 2 percentage points of positiveprice/mix helped by 32% growth in Latin America and a 7% increase in North America.
The leading brand of the portfolio, Captain Morgan posted 9% net sales growth. In NorthAmerica, the new ‘Life, Love and Loot’ campaign supplemented with the launch of Captain MorganBlack Spiced and marketing innovations, such as the ‘Captain’s Conquest’, resulted in share gains and7% net sales growth. Elsewhere the brand continued to benefit from the long running ‘Got a LittleCaptain in You?’ and the ‘Captain’s Island’ campaigns, which drove the 15% increase in marketingspend globally and resulted in strong double digit top line growth in Germany, Ireland, Russia andEastern Europe, and the brand almost tripled in the Benelux.
The wider rum category saw very strong double digit growth in Zacapa due to Latin America,Europe and North America. The successful extension of Bundaberg into the white rum segment andthe launch of the limited edition premium Bundy Masters Distillers Collection drove growth ofBundaberg in Australia.
Liqueurs were 5% of Diageo net sales. The challenging commercial environment in Western Europetogether with the reduction in the depth and frequency of promotions in Great Britain continued to
47
Business review (continued)
impact Baileys’ performance. However, Baileys posted 6% growth outside Europe with net sales up42% in China on the back of a new marketing campaign aimed at female consumers.
Tequila represented 3% of Diageo net sales. Don Julio continued its strong performance with 26%growth, outperforming the fast growing super premium tequila segment with the continued accelerationof 1942, Reposado, Anejo and the successful launch of Tequila Don Julio 70, the world’s first AnejoClaro.
Jose Cuervo Especial declined 5%, driven by the impact of distributor destocking on Jose CuervoEspecial Gold in the first half and also by consumers shifting away from dark tequilas. This waspartially offset by an increase in Jose Cuervo Especial Silver net sales, helped by consumer trends andthe recruitment from the ProBeach Volleyball Series.
Gin represented 3% of Diageo net sales and grew 3%. Emerging market consumer demand drovedouble digit net sales growth of value gin brands in Africa, while super premium gin grew over 20% inAsia Pacific and Latin America as the category saw a resurgence as the ‘white spirit of choice’ withbartenders.
Tanqueray grew net sales 2% globally, despite a slight decline in its biggest market, NorthAmerica, as the brand grew over 10% in its new markets across Western Europe, with Iberia up 24%,and grew 17% in the emerging markets, with both Africa and Latin America posting double digitgrowth. The new brand strategy and the supporting ‘Tonight We Tanqueray’ communications campaigndrove 11% increase in marketing spend.
Premium local spirits: During the year Diageo completed the acquisition and integration of Mey Icki,the leading spirits company in Turkey. Mey Icki posted £291 million net sales in the year with5.1 million equivalent units of volume. Raki is the main spirits category in the Turkish market andMey Icki is a clear market leader in the category with Yeni Raki being the most recognised brand.Mey Icki gained share during the year as marketing spend was focused on modern and traditional rakioccasions, building strong brand equities and maintaining executional excellence in store. Diageo alsoincreased its shareholding in Quanxing by 4% and from 29 June has control of Shuijingfang, fiscal 2013will be the first full year Diageo consolidates the company’s results. Chinese white spirits delivered 36%net sales growth outside China, driven by price increases and expanded distribution footprint with ShuiJing Fang now available in the duty free channel at forty airports and on two airlines worldwide andalso in seven domestic markets. During the year Diageo also acquired an additional 20.6% stake inHanoi Liquor Joint Stock Company in Vietnam and agreed to acquire Ypioca, the leading premiumcachaca brand in Brazil.
Beer brands represented 21% of Diageo net sales and grew 5% with the developed markets up 1%despite declining volumes and emerging markets growing 9% with 6 percentage points of positiveprice/mix.
Guinness made up 52% of Diageo’s beer business by net sales. The brand delivered 2% net salesgrowth in the developed markets as the successful launch of Guinness Black Lager together with priceincreases on Guinness Kegs drove 9% net sales growth for Guinness in North America. In theemerging markets, net sales were up 8% with strong growth across Africa and continued share gainsand price increases in Indonesia. Nigeria is now the biggest market for Guinness by net sales and thebrand further extended its footprint this year with double digit growth across the other Africa markets.Marketing spend behind the ‘Guinness The Match’ and ‘Guinness Football Challenge’ campaignstapped into African consumers’ fervent love of football, and the launch of a landmark new TVcampaign ‘The Ticket’, and ‘Guinness VIP’, a mobile phone relationship marketing programme withthe participation of 2.4 million consumers, drove 7% increase in spend globally.
48

Business review (continued)
Local African beers continued to perform strongly, with Tusker and Harp posting strong doubledigit top line growth supported by innovations, such as the launch of Harp Lime in Nigeria and TuskerLite in Kenya. Senator delivered more than a quarter of the beer net sales growth, driven by priceincreases and footprint expansion in Kenya.
Wine was 4% of Diageo net sales. It remained a challenging category with volume declining in NorthAmerica and Europe and with a shift to the lower end of the portfolio.
Ready to drink, 7% of Diageo net sales, was flat. Emerging markets posted a 7% increase, offset by a2% reduction in developed markets, driven by a decline in Australia despite share gains. The transferof production and sales of Smirnoff ready to drink in South Africa to Diageo’s associate had a fullpoint impact on growth rates. Excluding this the category grew 1% globally. Smirnoff Ice posted stronggrowth across the emerging middle class consumers of Africa and Latin America and the launch ofParrot Bay and Smirnoff Frozen Pouches proved to be a huge success in the United States. The launchof Smirnoff Ice Green Apple and Raspberry Splash revived the Smirnoff Ice portfolio in Asia drivingaccessibility and recruiting female consumers to the category.
2012
North America
‘‘The North American business has delivered another strong set of results. We have continued to driveprice/mix by staying focused on: disciplined promotional spend, growth of our strategic brands and thecontinued growth of our premium and super premium brands, most notably Johnnie Walker and Cıroc.We’ve achieved this through consistent investment in targeted campaigns that have improved brandequities. Innovation continues to be a competitive strength and we have both sustained past launchesand delivered exciting new products. Previously identified enhancements to our distribution system wereimplemented in the year and will benefit our future growth. Strong pricing and mix shift to premiumproducts, coupled with our continued focus on cost, drove margin improvement, however this was offsetby higher marketing. These measures, taken together, have delivered efficient growth and strengthenedour business.’’
Larry SchwartzPresident, Diageo North America
Key highlights
• Strong delivery of the strategic brands in the United States resulted in spirits net sales growth of7% and drove performance in North America. Incremental net sales were driven by Cıroc, up61%, as the strong performance of existing variants was amplified by the launch of Cıroc Peach,Diageo’s most successful North American product launch to date.
• The performance of beer improved overall as Guinness more than offset softness in other beerbrands. The launch of Guinness Black Lager, the performance of Guinness and selective priceincreases across the brand drove price/mix improvements in beer, and Guinness gained share inthe imported beer segment.
• Ready to drink net sales returned to growth, as the strong performance of innovation launchessuch as Parrot Bay and Smirnoff pouches, and cocktails, including Jose Cuervo Light Margarita,Zero Calorie Margarita Mix and Light Margarita Flavours offset declines on Smirnoff ready todrink.
49

Business review (continued)
• The wine restructuring is complete, improving the economics of the business. Wine continues toplay a valuable role in the route to market, but it remains a challenging category and pricingpressure is intense.
• Marketing investment was up 7%, an increase of 20 basis points as a percentage of net sales,primarily behind strategic brands. Captain Morgan and Smirnoff regained momentum on theback of compelling new advertising campaigns ‘To Life, Love and Loot’ and a new version of‘I choose’ which included the launch of Smirnoff Whipped Cream and Fluffed Marshmallow.The strong performance of Johnnie Walker was the result of a scotch marketing spend increaseof 24%, as the launch of Johnnie Walker Double Black in October, the ‘Say it without saying it’campaign and Blue Label engraving, drove a significant shift into higher priced variants and netsales increased 18%.
• Net sales growth of 5% in Canada was driven by category leaders Smirnoff and Captain Morganwhich delivered increases of 5% and 8% respectively. Guinness net sales grew 8% supported bya national television campaign in English and French, the first of its kind in three years.
Performance
2011 AcquisitionsReported and Organic 2012 Reported
Key financials (restated) Exchange disposals movement Reported movement
£ million £ million £ million £ million £ million %
Net sales . . . . . . . . . . . . . . . . . . . . . . 3,366 18 (26) 198 3,556 6Marketing spend . . . . . . . . . . . . . . . . 508 2 1 37 548 8Operating profit before exceptional
items . . . . . . . . . . . . . . . . . . . . . . . 1,275 3 (3) 79 1,354 6Exceptional items . . . . . . . . . . . . . . . . (23) (11)
Operating profit . . . . . . . . . . . . . . . . . 1,252 1,343 7
50

Business review (continued)
Organic ReportedVolume net sales net sales
movement* movement movement
% % %
Key markets and categories:North America . . . . . . . . . . . . . . . . . . . . . . . . . . . . . . . . . . . . . . . . 2 6 6United States . . . . . . . . . . . . . . . . . . . . . . . . . . . . . . . . . . . . . . . . . . 1 6 6Canada . . . . . . . . . . . . . . . . . . . . . . . . . . . . . . . . . . . . . . . . . . . . . . 2 5 5
Spirits . . . . . . . . . . . . . . . . . . . . . . . . . . . . . . . . . . . . . . . . . . . . . . . 2 7 7Beer . . . . . . . . . . . . . . . . . . . . . . . . . . . . . . . . . . . . . . . . . . . . . . . . 1 4 5Wine . . . . . . . . . . . . . . . . . . . . . . . . . . . . . . . . . . . . . . . . . . . . . . . . (5) (7) (17)Ready to drink . . . . . . . . . . . . . . . . . . . . . . . . . . . . . . . . . . . . . . . . . — 3 3
The strategic brands:**Johnnie Walker . . . . . . . . . . . . . . . . . . . . . . . . . . . . . . . . . . . . . . . . 9 18 18Crown Royal . . . . . . . . . . . . . . . . . . . . . . . . . . . . . . . . . . . . . . . . . . (4) (3) (2)Buchanan’s . . . . . . . . . . . . . . . . . . . . . . . . . . . . . . . . . . . . . . . . . . . 9 11 11Smirnoff . . . . . . . . . . . . . . . . . . . . . . . . . . . . . . . . . . . . . . . . . . . . . 3 4 5Ketel One vodka . . . . . . . . . . . . . . . . . . . . . . . . . . . . . . . . . . . . . . . 8 8 8Cıroc . . . . . . . . . . . . . . . . . . . . . . . . . . . . . . . . . . . . . . . . . . . . . . . . 58 61 62Captain Morgan . . . . . . . . . . . . . . . . . . . . . . . . . . . . . . . . . . . . . . . . 5 7 7Baileys . . . . . . . . . . . . . . . . . . . . . . . . . . . . . . . . . . . . . . . . . . . . . . 3 5 5Jose Cuervo . . . . . . . . . . . . . . . . . . . . . . . . . . . . . . . . . . . . . . . . . . . (6) (7) (7)Tanqueray . . . . . . . . . . . . . . . . . . . . . . . . . . . . . . . . . . . . . . . . . . . . (2) (1) (1)Guinness . . . . . . . . . . . . . . . . . . . . . . . . . . . . . . . . . . . . . . . . . . . . . 9 9 10
* Organic equals reported movement for volume except for: total North America volume 1% andwine (13)% due to disposals.
** Spirits brands excluding ready to drink.
2012
Europe
‘‘The economy remains very uneven in Europe. We continue to deliver substantial sales and profitgrowth in Europe’s emerging countries of Russia, Eastern Europe and Turkey, as well as a goodperformance across Northern Europe. Clearly though, Southern Europe remains challenging. From acategory point of view, scotch remained very strong in the emerging markets offsetting decline inSouthern Europe. Smirnoff continued to grow in Great Britain and Captain Morgan continued toperform strongly with 18% net sales growth. Weaker Baileys performance was driven by the change inpromotional strategy in Great Britain and the challenges in Southern Europe. Overall marketingcampaign activity has been maintained and the reinvestment rate increased as we spent more behindscotch and emerging markets while improving effectiveness in Western Europe. In Turkey, theintegration of Mey Icki has been completed successfully and the enhanced route to market will be akey growth driver as we bring our international brands to the expanding middle class consumer basethere. Finally, the new operating model has delivered further efficiencies and improved operatingmargin.’’
Andrew MorganPresident, Diageo Europe
51

Business review (continued)
Key highlights
• In increasingly challenging economic conditions in Southern Europe, Diageo Europe’s underlyingperformance remained relatively consistent throughout the year. Organic net sales growth inTurkey was (12)% in the second half against 114% in the first half as it lapped the customsdispute that was resolved in April 2011. The second half was also impacted by the decision toincrease H1 shipments into Eastern European markets to avoid custom administration delayswhich had occurred in H2 in prior years.
• Formerly material markets for Diageo, Iberia, Greece and Italy in total represent 5% of netsales globally after a number of years of tough trading. These Southern European marketsdeclined 6% in volume and 9% in net sales as deeper austerity measures put additional pressureon consumption and sales mix. JεB and Baileys were the brands impacted most, both declining8% in net sales in these markets. However, growth of Tanqueray, Captain Morgan and Bushmillspartially offset these declines.
• In Ireland, Guinness Draught and Smithwick’s grew share in the on trade and Harp in the offtrade, but the beer market remains in decline and net sales fell 5%.
• In Great Britain, reduced promotional activities across the portfolio drove 2% decline in netsales with 4 percentage points of positive price/mix. Smirnoff delivered 6% net sales growth,driven by Smirnoff Red gaining share despite the promotional reductions. Beer net sales grew6% with price increases on Guinness and a successful year for Red Stripe as the brand’s sales,distribution and marketing were brought in house.
• The rest of Western Europe delivered 6% growth in spirits, fuelled by double digit top linegrowth of Smirnoff and Captain Morgan. Germany maintained strong momentum on the back ofincreased customer marketing focus and benefited from the premiumisation trend forinternational spirits. Captain Morgan saw almost 60% net sales growth with 4 percentage pointsof share gain. Net sales in France were flat as the second half saw the reversal of the pre excisetax increase buy in coupled with difficult market conditions. The Singleton more than doubled innet sales as the brand gained share in France supported by improved distribution.
• In Russia and Eastern Europe, double digit net sales growth was driven by scotch, withJohnnie Walker up 11%, Bell’s up 57% and White Horse up 17%. Marketing spend was focusedbehind Johnnie Walker and also on launching the first ever local campaign for White Horse, thebiggest whisky brand in Russia. Black & White, targeting consumers seeking a more affordableentry into the scotch category, performed well following its launch last August. As a result ofbroadening from scotch into other categories in these fast growing markets, Captain Morgan andBushmills also contributed to top line growth with net sales growth over 30% for both and sharegains within the growing rum and Irish whiskey categories.
• In Turkey the integration of Mey Icki has been completed successfully. Net sales growth of 28%reflected the resolution in 2011 of the customs dispute which had impacted imports and also theshare gains made as a result of marketing investment behind Johnnie Walker, JεB and Smirnoff.The inorganic part of the Turkish business delivered £291 million of net sales as Yeni Rakicontinued to be the market leader and while the recent duty increase impacted sales in thecategory, Mey Icki gained 3 percentage points of share on the back of very effective on trademarketing activities and increased penetration into beer led outlets.
52
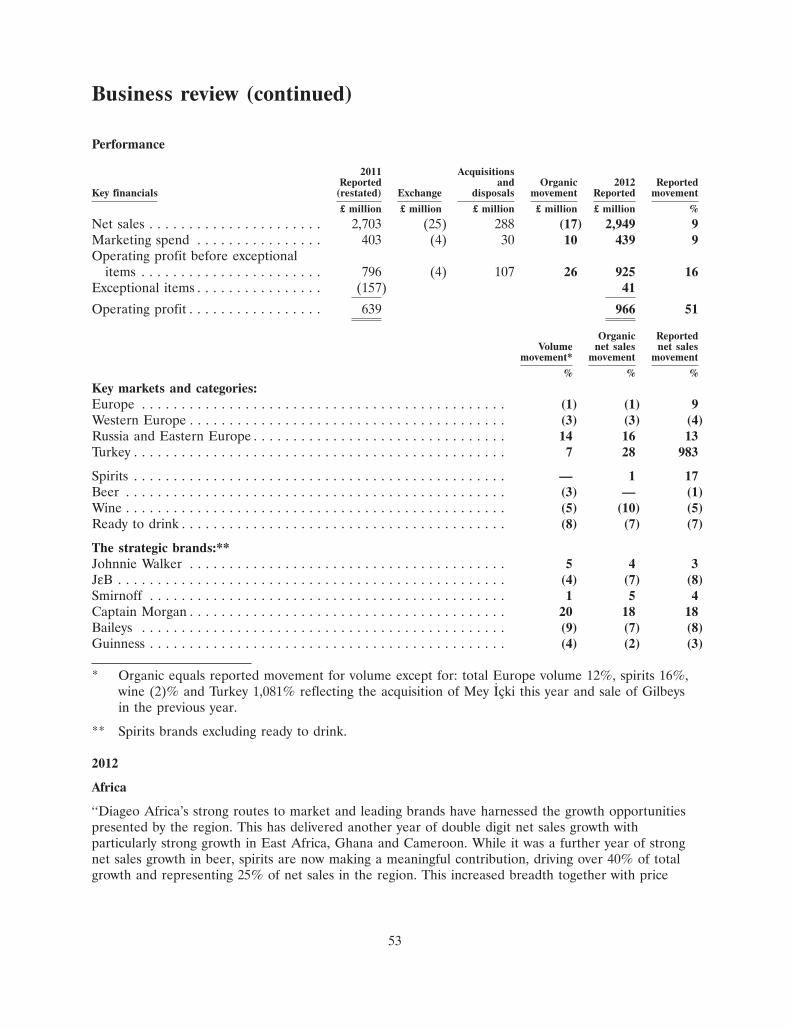
Business review (continued)
Performance
2011 AcquisitionsReported and Organic 2012 Reported
Key financials (restated) Exchange disposals movement Reported movement
£ million £ million £ million £ million £ million %
Net sales . . . . . . . . . . . . . . . . . . . . . . 2,703 (25) 288 (17) 2,949 9Marketing spend . . . . . . . . . . . . . . . . 403 (4) 30 10 439 9Operating profit before exceptional
items . . . . . . . . . . . . . . . . . . . . . . . 796 (4) 107 26 925 16Exceptional items . . . . . . . . . . . . . . . . (157) 41
Operating profit . . . . . . . . . . . . . . . . . 639 966 51
Organic ReportedVolume net sales net sales
movement* movement movement
% % %
Key markets and categories:Europe . . . . . . . . . . . . . . . . . . . . . . . . . . . . . . . . . . . . . . . . . . . . . . (1) (1) 9Western Europe . . . . . . . . . . . . . . . . . . . . . . . . . . . . . . . . . . . . . . . . (3) (3) (4)Russia and Eastern Europe . . . . . . . . . . . . . . . . . . . . . . . . . . . . . . . . 14 16 13Turkey . . . . . . . . . . . . . . . . . . . . . . . . . . . . . . . . . . . . . . . . . . . . . . . 7 28 983
Spirits . . . . . . . . . . . . . . . . . . . . . . . . . . . . . . . . . . . . . . . . . . . . . . . — 1 17Beer . . . . . . . . . . . . . . . . . . . . . . . . . . . . . . . . . . . . . . . . . . . . . . . . (3) — (1)Wine . . . . . . . . . . . . . . . . . . . . . . . . . . . . . . . . . . . . . . . . . . . . . . . . (5) (10) (5)Ready to drink . . . . . . . . . . . . . . . . . . . . . . . . . . . . . . . . . . . . . . . . . (8) (7) (7)
The strategic brands:**Johnnie Walker . . . . . . . . . . . . . . . . . . . . . . . . . . . . . . . . . . . . . . . . 5 4 3JεB . . . . . . . . . . . . . . . . . . . . . . . . . . . . . . . . . . . . . . . . . . . . . . . . . (4) (7) (8)Smirnoff . . . . . . . . . . . . . . . . . . . . . . . . . . . . . . . . . . . . . . . . . . . . . 1 5 4Captain Morgan . . . . . . . . . . . . . . . . . . . . . . . . . . . . . . . . . . . . . . . . 20 18 18Baileys . . . . . . . . . . . . . . . . . . . . . . . . . . . . . . . . . . . . . . . . . . . . . . (9) (7) (8)Guinness . . . . . . . . . . . . . . . . . . . . . . . . . . . . . . . . . . . . . . . . . . . . . (4) (2) (3)
* Organic equals reported movement for volume except for: total Europe volume 12%, spirits 16%,wine (2)% and Turkey 1,081% reflecting the acquisition of Mey Icki this year and sale of Gilbeysin the previous year.
** Spirits brands excluding ready to drink.
2012
Africa
‘‘Diageo Africa’s strong routes to market and leading brands have harnessed the growth opportunitiespresented by the region. This has delivered another year of double digit net sales growth withparticularly strong growth in East Africa, Ghana and Cameroon. While it was a further year of strongnet sales growth in beer, spirits are now making a meaningful contribution, driving over 40% of totalgrowth and representing 25% of net sales in the region. This increased breadth together with price
53

Business review (continued)
increases was reflected in operating margin improvement. Fiscal 2012 was another year of investmentfor growth. We invested in marketing our brands, primarily Guinness, Tusker and Johnnie Walker, andbehind innovations such as the launch of Harp Lime in Nigeria. We invested in capital expenditure toexpand capacity in Nigeria and East Africa and we broadened our presence across Africa, with theacquisition of the Meta Abo Brewery in Ethiopia.’’
Nick BlazquezPresident, Diageo Africa
Key highlights
• Net sales in Nigeria grew 4%. Harp delivered another year of double digit net sales growth,however, net sales of Guinness declined slightly as price increases were implemented to maintainits premium position in a difficult economic environment. Strong spirits net sales growth resultedfrom more volume of premium plus brands and price increases across the portfolio, deliveringpositive price/mix. Marketing spend increased 3% driven by the successful launch of Harp Lime.
• East Africa delivered a strong performance driven by Senator, Tusker, Guinness and the stronggrowth of spirits. Investment behind marketing, innovation such as Tusker Lite and improveddistribution drove the strong beer performance. Increased sales focus on international spirits andKenya Cane in new glass bottles drove very strong double digit growth across spirits.
• Cameroon and Ghana represent three quarters of Diageo’s Africa Regional Markets anddelivered approximately 90% of incremental net sales. This was driven by Guinness inCameroon, and Malta, Guinness and Star in Ghana. Marketing spend increased 5% acrossAfrica Regional Markets, principally focused on Johnnie Walker, with a campaign that includedoutdoor advertising, trade visibility and mentoring programmes. During the year Diageocompleted the acquisition of the Meta Abo Brewery in Ethiopia and continued to build thespirits business in Angola, expanding the distribution footprint in the region.
• Increased headcount and outlet coverage delivered improvements in the route to market inSouth Africa. This drove strong double digit net sales growth of Smirnoff and Johnnie Walker,which offset a decline in ready to drink. Price increases followed a 20% increase in excise dutyand net sales grew 7%. Marketing spend was focused behind Johnnie Walker with the ‘Step Up’campaign, contributing to brandhouse’s 70 basis points of volume share gain in the off tradescotch category. Overall brandhouse grew share of total beverage alcohol by 90 basis points.
Performance
2011 AcquisitionsReported and Organic 2012 Reported
Key financials (restated) Exchange disposals movement Reported movement
£ million £ million £ million £ million £ million %
Net sales . . . . . . . . . . . . . . . . . . . . . . 1,357 (77) 29 138 1,447 7Marketing spend . . . . . . . . . . . . . . . . 140 (8) 4 14 150 7Operating profit before exceptional
items . . . . . . . . . . . . . . . . . . . . . . . 333 (22) 4 65 380 14Exceptional items . . . . . . . . . . . . . . . . (7) (5)
Operating profit . . . . . . . . . . . . . . . . . 326 375 15
54

Business review (continued)
Organic ReportedVolume net sales net sales
movement* movement movement
% % %
Key markets and categories:Africa . . . . . . . . . . . . . . . . . . . . . . . . . . . . . . . . . . . . . . . . . . . . . . . 5 11 7Nigeria . . . . . . . . . . . . . . . . . . . . . . . . . . . . . . . . . . . . . . . . . . . . . . (1) 4 1East Africa . . . . . . . . . . . . . . . . . . . . . . . . . . . . . . . . . . . . . . . . . . . 8 19 16Africa Regional Markets . . . . . . . . . . . . . . . . . . . . . . . . . . . . . . . . . . 7 15 13South Africa . . . . . . . . . . . . . . . . . . . . . . . . . . . . . . . . . . . . . . . . . . 8 7 (3)
Spirits . . . . . . . . . . . . . . . . . . . . . . . . . . . . . . . . . . . . . . . . . . . . . . . 9 20 11Beer . . . . . . . . . . . . . . . . . . . . . . . . . . . . . . . . . . . . . . . . . . . . . . . . 4 9 6Ready to drink . . . . . . . . . . . . . . . . . . . . . . . . . . . . . . . . . . . . . . . . . (11) — (6)
The strategic brands:**Johnnie Walker . . . . . . . . . . . . . . . . . . . . . . . . . . . . . . . . . . . . . . . . 35 39 31JεB . . . . . . . . . . . . . . . . . . . . . . . . . . . . . . . . . . . . . . . . . . . . . . . . . 18 12 4Smirnoff . . . . . . . . . . . . . . . . . . . . . . . . . . . . . . . . . . . . . . . . . . . . . 25 20 10Captain Morgan . . . . . . . . . . . . . . . . . . . . . . . . . . . . . . . . . . . . . . . . 1 — (9)Baileys . . . . . . . . . . . . . . . . . . . . . . . . . . . . . . . . . . . . . . . . . . . . . . 22 26 21Guinness . . . . . . . . . . . . . . . . . . . . . . . . . . . . . . . . . . . . . . . . . . . . . 3 7 3
* Organic equals reported movement for volume except for: Africa 8%, East Africa 11%, AfricaRegional Markets 14%, beer 8% and Smirnoff 26% reflecting the acquisition of Serengeti andMeta Abo Breweries.
** Spirits brands excluding ready to drink.
2012
Latin America and Caribbean
‘‘Our performance in Latin America and Caribbean during the year demonstrated the strength andsustainability of our business. In order to capture the consumer opportunity in the emerging middleclass, we increased marketing spend to enhance our brand equities in scotch, increase the resonance ofvodka and support innovation. We enhanced our routes to market with more dedicated distributors inBrazil, a new distributor agreement in Costa Rica and a new supply distribution centre in Panama.Additionally we have helped more than 12,000 people acquire vocational skills through our Learningfor Life programme. We finished the year with the exciting acquisition of Ypioca, which willdramatically expand our presence in Brazil. This sustained investment is building a strong andsuccessful business.’’
Randy MillianPresident, Diageo Latin America and Caribbean
Key highlights
• Price increases and accelerated reserve brand performance drove 9 percentage points of positiveprice/mix in Paraguay, Uruguay and Brazil (PUB). Over 60% of net sales growth was driven byscotch, primarily Johnnie Walker and Old Parr. Investment continued behind the route to
55

Business review (continued)
market, with more distributors on an exclusive basis and behind brands with a 14% increase inmarketing spend, over half of which was focused behind Johnnie Walker and the ‘Keep WalkingBrazil’ campaign, driving 17% net sales growth for the brand. The balance of spend focused onvodka, which accounted for over 20% of incremental net sales, driven by both the impressivegrowth of Smirnoff and Cıroc.
• Venezuela and Colombia make up the Andean market. Here growth was driven by a recovery ofVenezuelan imports in line with currency availability and a 32% increase in net sales inColombia. Scotch delivered over two thirds of the market growth while double digit net salesgrowth in rum and liqueurs also made significant contributions. Diageo gained share in bothdeluxe and super deluxe scotch, with two thirds of the increase in marketing spend directedtowards the scotch category, principally Buchanan’s in Venezuela, Old Parr in Colombia andJohnnie Walker and the launch of Haig Supreme across the market.
• Strong growth of scotch drove 16% net sales growth in Mexico. Solid growth of Captain Morganand Zacapa coupled with the launch of Nuvo drove double digit growth in rum and liqueurs.This increased Diageo’s category breadth and increased its share of total spirits. Marketingspend increased 12% and focused on both scotch and rum.
• A very good performance in West Latin America and Caribbean was delivered by strong growthin Argentina, Chile, Peru, the free trade zones, Costa Rica and Jamaica. Price increases anddouble digit net sales growth of scotch and reserve brands delivered 7 percentage points ofpositive price/mix. Marketing spend focused on Johnnie Walker and Smirnoff which grew netsales 9%.
Performance
2011 AcquisitionsReported and Organic 2012 Reported
Key financials (restated) Exchange disposals movement Reported movement
£ million £ million £ million £ million £ million %
Net sales . . . . . . . . . . . . . . . . . . . . . . 1,063 (22) — 198 1,239 17Marketing spend . . . . . . . . . . . . . . . . 184 (6) 1 31 210 14Operating profit before exceptional
items . . . . . . . . . . . . . . . . . . . . . . . 318 (2) (2) 69 383 20Exceptional items . . . . . . . . . . . . . . . . (6) (2)
Operating profit . . . . . . . . . . . . . . . . . 312 381 22
56

Business review (continued)
Organic ReportedVolume net sales net sales
movement* movement movement
% % %
Key markets and categories:Latin America and Caribbean . . . . . . . . . . . . . . . . . . . . . . . . . . . . . . 10 19 17PUB . . . . . . . . . . . . . . . . . . . . . . . . . . . . . . . . . . . . . . . . . . . . . . . . 11 20 15Andean . . . . . . . . . . . . . . . . . . . . . . . . . . . . . . . . . . . . . . . . . . . . . . 18 42 44Mexico . . . . . . . . . . . . . . . . . . . . . . . . . . . . . . . . . . . . . . . . . . . . . . 15 16 9West Latin America and Caribbean . . . . . . . . . . . . . . . . . . . . . . . . . . 9 16 16
Spirits . . . . . . . . . . . . . . . . . . . . . . . . . . . . . . . . . . . . . . . . . . . . . . . 11 20 18Beer . . . . . . . . . . . . . . . . . . . . . . . . . . . . . . . . . . . . . . . . . . . . . . . . (2) 8 7Wine . . . . . . . . . . . . . . . . . . . . . . . . . . . . . . . . . . . . . . . . . . . . . . . . 15 21 16Ready to drink . . . . . . . . . . . . . . . . . . . . . . . . . . . . . . . . . . . . . . . . . 2 15 10
The strategic brands:**Johnnie Walker . . . . . . . . . . . . . . . . . . . . . . . . . . . . . . . . . . . . . . . . 5 14 12Buchanan’s . . . . . . . . . . . . . . . . . . . . . . . . . . . . . . . . . . . . . . . . . . . 13 28 25Smirnoff . . . . . . . . . . . . . . . . . . . . . . . . . . . . . . . . . . . . . . . . . . . . . 18 19 13Baileys . . . . . . . . . . . . . . . . . . . . . . . . . . . . . . . . . . . . . . . . . . . . . . 3 9 6
* Organic equals reported movement for volume.
** Spirits brands excluding ready to drink.
2012
Asia Pacific
‘‘We had another successful year in Asia Pacific maintaining our leadership position in internationalspirits and gaining share in all key markets and categories. The emerging markets of Asia grew doubledigit with South East Asia up 15%, Greater China 13% and India 24%. Uncertainty around the globaleconomy led to further contraction of the whisky market in Korea and weaker consumer confidence inAustralia which led to roughly flat net sales in developed Asia Pacific. The price increases weimplemented in South East Asia, China and Global Travel Asia drove more than half of ourincremental top line, and this together with the premiumisation of our portfolio delivered 6 percentagepoints of positive price/mix. Scotch remained the growth engine of the region delivering more than80% of net sales growth and almost half of this growth came from our super deluxe brands. Otherreserve brands also performed well, with very strong net sales growth from Zacapa, Ketel One vodkaand Cıroc. I am also proud of the performance of Guinness, delivering 12% net sales growth throughshare gains and strong pricing. We continued to invest in infrastructure, sales execution, innovation andacquisitions, including our increased stake in Shuijingfang in China and Halico in Vietnam, creating astronger platform for future growth. Despite these investments and as a result of our successfulpremiumisation strategy and focus on pricing, operating margin improved in the year.’’
Gilbert GhostinePresident, Diageo Asia Pacific
57

Business review (continued)
Key highlights
• Underlying consumption trends continued to be strong in emerging Asia as reflected in the 14%increase in full year net sales. In the fourth quarter route to market changes were implementedin South East Asia which reduced shipments in the period and adversely impacted the market’ssecond half performance. The global slowdown affected consumer sentiment in Australia and thesecond half was weaker. Diageo Korea net sales also slowed from the first half but Diageogained share in scotch and vodka.
• South East Asia delivered 3% volume growth with 12 percentage points of price/mix as a resultof price increases and premiumisation and the market was the biggest contributor to pricing,deluxe and above scotch growth and margin improvement in the region. Deluxe and superdeluxe launches, such as Platinum, XR21 and Double Black helped the Johnnie Walker portfolioto gain further share which together with price increases resulted in 23% net sales growth.Guinness had another strong year, breaking the £100 million barrier, with 13% net sales growththrough strong pricing and continued share gains in Indonesia on the back of St Patrick’s andArthur’s Day and World Series of Pool activations.
• Net sales growth of 13% in Greater China, and 16% in China, with 5 and 6 percentage points ofpositive price/mix, respectively, was due to the successful premiumisation strategy and priceincreases across the portfolio. Reserve brands net sales increased over 60% in China withcontinued strong performance from Johnnie Walker super deluxe variants and The Singleton.Baileys posted 37% net sales growth with 18 percentage points of positive price/mix, supportedby increased marketing spend, in particular the Baileys ‘Perfect Place’ participation platform.The launch of Guinness Original in January in Shanghai together with the strategy of superpremium pricing drove 17% net sales increase for Guinness. Marketing spend increased aheadof net sales at 20%, with most of the incremental investment going behind Johnnie WalkerDeluxe and Super Deluxe in China. Strong premiumisation momentum continued in the secondhalf of the year as reflected in the 7 percentage points of price/mix achieved and underlyingconsumption trends remained robust. Lower top line growth in the second half was driven bylapping an unusually strong third quarter last year together with shipment phasing in Taiwan.
• Strong momentum across the scotch portfolio, with share gains in every segment, was the maindriver of 24% net sales growth in India. VAT69 delivered 39% top line growth with10 percentage points of price/mix, supported by increased marketing spend and the launch ofVAT69 Black. Johnnie Walker Black Label net sales increased over 40%, driven by the Formula1 sponsorship programme, along with the ‘Step Inside the Circuit’ campaign. Rowson’s Reserve,launched in the prestige Indian Made Foreign Liquor segment in October, gained distributionand share.
• Diageo’s Global Travel Asia and Middle East remained strong. Volume in the Middle East wasimpacted by price increases and despite 9% positive price/mix, net sales declined 2% as a result.In Global Travel Asia, reserve brands net sales increased 37% supported by the successfullaunch of Johnnie Walker Platinum, Gold Label Reserve, XR21 and the Blue Label CasksEdition. The increased focus on reserve brands together with price increases and productdifferentiation strategy for duty free consumers resulted in 31% net sales growth for GlobalTravel Asia.
• In a weaker market Diageo Australia net sales declined slightly, however the business deliveredshare gains in spirits and ready to drink. The market is expected to return to growth on the
58

Business review (continued)
basis of strong fundamentals. Increased focus and marketing spend delivered over 80% net salesgrowth of reserve brands, with Johnnie Walker’s ultra premium brands the main contributors.Innovation extended Bundaberg into new segments with the launch of Bundaberg Five intowhite rum and the limited edition Bundy Masters Distillers Collection into premium to drive 5%growth. Smirnoff also grew 5% on the back of a successful advertising campaign. Baileys gainedshare but declined in a tough category.
• In North Asia strong share gains in a declining scotch category and in the growing beer categoryin Korea, together with share gains in vodka, resulted in 1% net sales growth. Windsor gainedfurther market share in Korea, however the brand’s net sales remained in decline as thecontraction of the whisky market accelerated. Guinness grew 18% in Korea and Smirnoff morethan doubled with increased marketing spend behind vodka and beer as part of the strategy tobuild Diageo’s footprint outside of the whisky category. Japan delivered 3% net sales growth,lapping the launch of I.W. Harper ready to drink, with strategic brands growing double digit,with Guinness up 17% and Smirnoff up 33%, as the brand increased market share on the backof improved distribution and successful brand activations.
Performance
2011 AcquisitionsReported and Organic 2012 Reported
Key financials (restated) Exchange disposals movement Reported movement
£ million £ million £ million £ million £ million %
Net sales . . . . . . . . . . . . . . . . . . . . . . 1,377 17 — 107 1,501 9Marketing spend . . . . . . . . . . . . . . . . 303 6 — 35 344 14Operating profit before exceptional
items . . . . . . . . . . . . . . . . . . . . . . . 299 — (11) 54 342 14Exceptional items . . . . . . . . . . . . . . . . (50) (10)
Operating profit . . . . . . . . . . . . . . . . . 249 332 33
59

Business review (continued)
Organic ReportedVolume net sales net sales
movement* movement movement
% % %
Key markets and categories:Asia Pacific . . . . . . . . . . . . . . . . . . . . . . . . . . . . . . . . . . . . . . . . . . . 2 8 9South East Asia . . . . . . . . . . . . . . . . . . . . . . . . . . . . . . . . . . . . . . . . 3 15 14Greater China . . . . . . . . . . . . . . . . . . . . . . . . . . . . . . . . . . . . . . . . . 8 13 16India . . . . . . . . . . . . . . . . . . . . . . . . . . . . . . . . . . . . . . . . . . . . . . . . 17 24 13Global Travel Asia and Middle East . . . . . . . . . . . . . . . . . . . . . . . . . (5) 11 11Australia . . . . . . . . . . . . . . . . . . . . . . . . . . . . . . . . . . . . . . . . . . . . . — (1) 3North Asia . . . . . . . . . . . . . . . . . . . . . . . . . . . . . . . . . . . . . . . . . . . (1) 1 3
Spirits . . . . . . . . . . . . . . . . . . . . . . . . . . . . . . . . . . . . . . . . . . . . . . . 3 10 12Beer . . . . . . . . . . . . . . . . . . . . . . . . . . . . . . . . . . . . . . . . . . . . . . . . 1 11 11Ready to drink . . . . . . . . . . . . . . . . . . . . . . . . . . . . . . . . . . . . . . . . . (6) (6) (2)
The strategic brands:**Johnnie Walker . . . . . . . . . . . . . . . . . . . . . . . . . . . . . . . . . . . . . . . . 4 17 18Windsor . . . . . . . . . . . . . . . . . . . . . . . . . . . . . . . . . . . . . . . . . . . . . (4) (1) —Smirnoff . . . . . . . . . . . . . . . . . . . . . . . . . . . . . . . . . . . . . . . . . . . . . 1 3 2Guinness . . . . . . . . . . . . . . . . . . . . . . . . . . . . . . . . . . . . . . . . . . . . . 10 12 12
* Organic equals reported movement for volume.
** Spirits brands excluding ready to drink.
60

Business review (continued)
Operating results 2011 compared with 2010
Summary consolidated income statement
Year ended 30 June
2011 2010
£ million £ million
Sales . . . . . . . . . . . . . . . . . . . . . . . . . . . . . . . . . . . . . . . . . . . . . . . . . . . . . . . . . . 13,232 12,958Excise duties . . . . . . . . . . . . . . . . . . . . . . . . . . . . . . . . . . . . . . . . . . . . . . . . . . . . (3,296) (3,178)
Net sales . . . . . . . . . . . . . . . . . . . . . . . . . . . . . . . . . . . . . . . . . . . . . . . . . . . . . . . 9,936 9,780Operating costs before exceptional items . . . . . . . . . . . . . . . . . . . . . . . . . . . . . . . . (7,052) (7,029)
Operating profit before exceptional items . . . . . . . . . . . . . . . . . . . . . . . . . . . . . . . 2,884 2,751Exceptional operating items . . . . . . . . . . . . . . . . . . . . . . . . . . . . . . . . . . . . . . . . . (289) (177)
Operating profit . . . . . . . . . . . . . . . . . . . . . . . . . . . . . . . . . . . . . . . . . . . . . . . . . 2,595 2,574Sale of businesses . . . . . . . . . . . . . . . . . . . . . . . . . . . . . . . . . . . . . . . . . . . . . . . . (14) (15)Net finance charges . . . . . . . . . . . . . . . . . . . . . . . . . . . . . . . . . . . . . . . . . . . . . . . (397) (462)Share of associates’ profits after tax . . . . . . . . . . . . . . . . . . . . . . . . . . . . . . . . . . . 176 142
Profit before taxation . . . . . . . . . . . . . . . . . . . . . . . . . . . . . . . . . . . . . . . . . . . . . . 2,360 2,239Taxation . . . . . . . . . . . . . . . . . . . . . . . . . . . . . . . . . . . . . . . . . . . . . . . . . . . . . . . (343) (477)
Profit from continuing operations . . . . . . . . . . . . . . . . . . . . . . . . . . . . . . . . . . . . . 2,017 1,762Discontinued operations . . . . . . . . . . . . . . . . . . . . . . . . . . . . . . . . . . . . . . . . . . . . — (19)
Profit for the year . . . . . . . . . . . . . . . . . . . . . . . . . . . . . . . . . . . . . . . . . . . . . . . . 2,017 1,743
Attributable to:Equity shareholders of the parent company . . . . . . . . . . . . . . . . . . . . . . . . . . . . . . 1,900 1,629Non-controlling interests . . . . . . . . . . . . . . . . . . . . . . . . . . . . . . . . . . . . . . . . . . . 117 114
2,017 1,743
Sales and net sales On a reported basis, sales increased by £274 million from £12,958 million inthe year ended 30 June 2010 to £13,232 million in the year 30 June 2011 and net sales increased by£156 million from £9,780 million in the year ended 30 June 2010 to £9,936 million in the year ended30 June 2011. Exchange rate movements decreased reported sales by £252 million and reported netsales by £221 million. Acquisitions increased reported sales by £38 million and reported net sales by£30 million for the year. Disposals decreased reported sales by £94 million and reported net sales by£85 million for the year.
Operating costs before exceptional items On a reported basis, operating costs before exceptionalitems increased by £23 million in the year ended 30 June 2011 due to a decrease in cost of sales of£70 million from £4,053 million to £3,983 million, an increase in marketing spend of £119 million from£1,419 million to £1,538 million, and a decrease in other operating expenses before exceptional costs of£26 million, from £1,557 million to £1,531 million. The impact of exchange rate movements decreasedtotal operating costs before exceptional items by £239 million.
Exceptional operating items Exceptional operating costs of £289 million for the year ended 30 June2011 (2010 – £177 million) comprised a net charge of £111 million (2010 – £142 million) in respect ofrestructuring programmes, an impairment charge of £39 million (2010 – £35 million) in respect of theUrsus brand reflecting the impact of the significant downturn in the economy in one of its principal
61

Business review (continued)
markets, Greece, a charge of £92 million (2010 – £nil) in respect of the settlement of the dispute withthe Turkish customs authorities regarding import duty payable on beverage alcohol products sold in thedomestic channel in Turkey, a charge of £35 million (2010 – £nil) in respect of the settlement with theThai customs authorities regarding a dispute over the price of imported goods and a charge of£12 million (2010 – £nil) in respect of the settlement with the Securities and Exchange Commissionregarding various regulatory and control matters.
Restructuring programmes totalling £111 million comprised £77 million (2010 – £nil) for theoperating model review announced in May 2011 primarily in respect of employee termination charges,£24 million (2010 – £93 million) for the restructuring of Global Supply operations in Scotland and theUnited States primarily in respect of accelerated depreciation and redundancies and £10 million(2010 – £12 million) for the restructuring of the group’s brewing operations in Ireland announced in2008 in respect of accelerated depreciation. In the year ended 30 June 2010 restructuring programmesalso included a charge of £85 million for the global restructuring programme and a £48 million netcredit for the restructuring of the wines business in the United States.
In the year ended 30 June 2011 total restructuring cash expenditure was £118 million (2010 –£145 million) and the cash payments made for the exceptional SEC and duty settlements amounted to£141 million (2010 – £nil).
Post employment plans Post employment net costs for the year ended 30 June 2011 were a charge of£105 million (2010 – £133 million) comprising £110 million (2010 – £92 million) included in operatingcosts before exceptional items, pension curtailment gains of £8 million (2010 – £6 million) inexceptional items and a charge of £3 million (2010 – £47 million) in net finance charges.
The deficit in respect of post employment plans before taxation decreased by £367 million from£1,205 million at 30 June 2010 to £838 million at 30 June 2011 primarily as a result of an increase inthe market value of assets held by the post employment plans. Cash contributions to the group’sUK and Irish pension schemes in the year ended 30 June 2011 were £151 million.
Operating profit Reported operating profit for the year ended 30 June 2011 increased by £21 millionto £2,595 million from £2,574 million in the prior year. Before exceptional operating items, operatingprofit for the year ended 30 June 2011 increased by £133 million to £2,884 million from £2,751 millionin the prior year. Exchange rate movements increased both operating profit and operating profit beforeexceptional items for the year ended 30 June 2011 by £18 million. Acquisitions decreased reportedoperating profit by £13 million for the year. Disposals decreased reported operating profit by £1 millionfor the year.
Exceptional non-operating items A net loss before taxation of £14 million on sale of businesses aroseon the disposal of a number of small wine businesses in Europe and in the United States and on thetermination of a joint venture in India. In the year ended 30 June 2010 sale of businesses comprised acharge of £26 million in respect of the anticipated loss on the disposal of certain non-strategic winebrands in the United States and a gain of £11 million arising on the revaluation of the equity holdingin the London Group, the owner of the Nuvo brand, following the acquisition of a majority equitystake in the London Group.
Net finance charges Net finance charges decreased from £462 million in the year ended 30 June 2010to £397 million in the year ended 30 June 2011.
Net interest charge decreased by £6 million from £375 million in the prior year to £369 million inthe year ended 30 June 2011. The effective interest rate was 4.9% in the year ended 30 June 2011
62

Business review (continued)
(2010 – 4.8%) and average net borrowings excluding interest rate related fair value adjustmentsdecreased by £0.7 billion compared to the prior year. The income statement interest cover was8.3 times and cash interest cover was 10.6 times (2010 – 7.7 times and 10.3 times, respectively).
Net other finance charges for the year ended 30 June 2011 were £28 million (2010 – £87 million).There was a decrease of £44 million in finance charges in respect of post employment plans from£47 million in the year ended 30 June 2010 to £3 million in the year ended 30 June 2011. Otherfinance charges also included £16 million (2010 – £18 million) on unwinding of discounts on liabilitiesand a hyperinflation adjustment of £9 million (2010 – £16 million) in respect of the group’s Venezuelaoperations. In the year ended 30 June 2010 an additional £4 million other finance income wasrecognised and a £10 million charge in respect of exchange rate translation differences on inter-company funding arrangements where hedge accounting was not applicable.
Associates The group’s share of associates’ profits after interest and tax was £176 million for the yearended 30 June 2011 compared to £142 million in the prior year. Diageo’s 34% equity interest inMoet Hennessy contributed £179 million (2010 – £134 million) to share of associates’ profits afterinterest and tax.
Profit before taxation Profit before taxation increased by £121 million from £2,239 million in theprior year to £2,360 million in the year ended 30 June 2011.
Taxation The reported tax rate for the year ended 30 June 2011 was 14.5% compared with 21.3% forthe year ended 30 June 2010. Factors that reduced the reported tax rate included settlements agreedwith tax authorities that gave rise to releases of tax provisions and an increase of £115 million in thecarrying value of deferred tax assets in respect of brands under the taxation basis applicable at 30 June2011. The tax rate before exceptional items for the year ended 30 June 2011 was 17.4% compared with21.6% for the year ended 30 June 2010.
The tax rates from continuing operations before exceptional and after exceptional items forthe years ended 30 June 2011 and 30 June 2010 were calculated as follows:
Year ended 30 June
2011 2010
£ million £ million
Taxation on profit from continuing operations (A) . . . . . . . . . . . . . . . . . . . . . . . . . 343 477Tax credits in respect of exceptional items . . . . . . . . . . . . . . . . . . . . . . . . . . . . . . . 54 49Exceptional tax credits . . . . . . . . . . . . . . . . . . . . . . . . . . . . . . . . . . . . . . . . . . . . . 66 —
Tax before exceptional items (B) . . . . . . . . . . . . . . . . . . . . . . . . . . . . . . . . . . . . . . 463 526
Profit before taxation (C) . . . . . . . . . . . . . . . . . . . . . . . . . . . . . . . . . . . . . . . . . . . 2,360 2,239Losses on sale of businesses . . . . . . . . . . . . . . . . . . . . . . . . . . . . . . . . . . . . . . . . . 14 15Exceptional operating costs . . . . . . . . . . . . . . . . . . . . . . . . . . . . . . . . . . . . . . . . . 289 177
Profit from continuing operations before taxation and exceptional items (D) . . . . . 2,663 2,431
Tax rate after exceptional items (A/C) . . . . . . . . . . . . . . . . . . . . . . . . . . . . . . . . . . 14.5% 21.3%Tax rate before exceptional items (B/D) . . . . . . . . . . . . . . . . . . . . . . . . . . . . . . . . 17.4% 21.6%
Discontinued operations Discontinued operations in the year ended 30 June 2010 comprised a chargeafter taxation of £19 million in respect of anticipated future payments to thalidomide claimants.
63
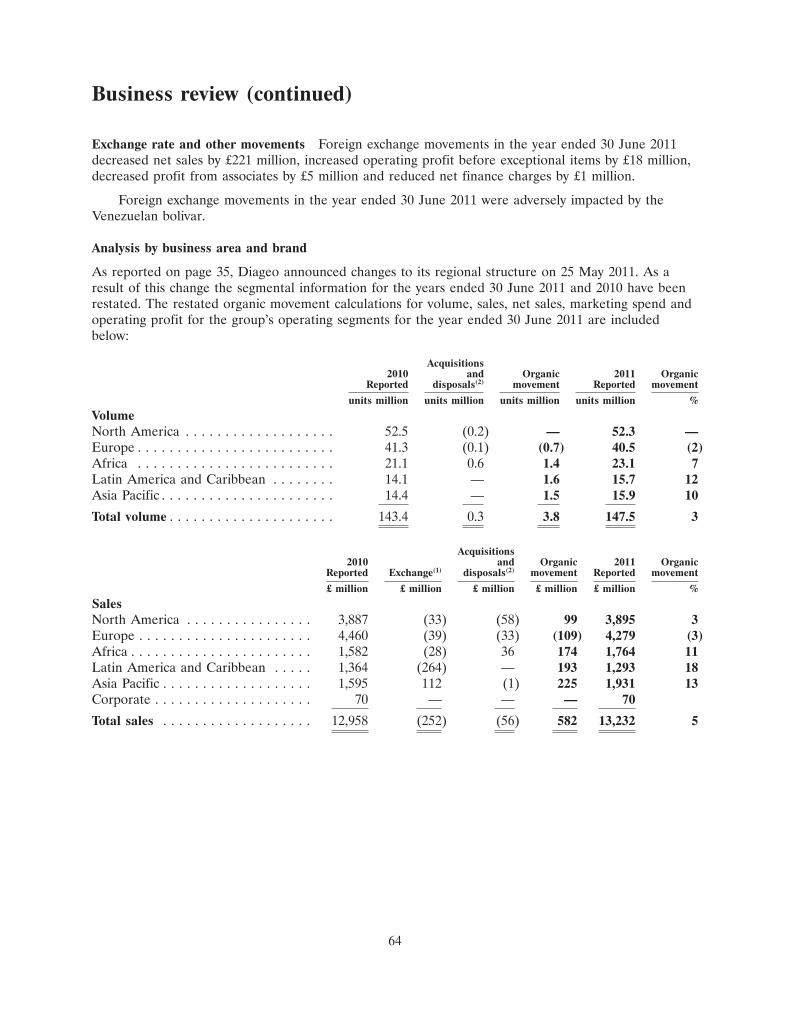
Business review (continued)
Exchange rate and other movements Foreign exchange movements in the year ended 30 June 2011decreased net sales by £221 million, increased operating profit before exceptional items by £18 million,decreased profit from associates by £5 million and reduced net finance charges by £1 million.
Foreign exchange movements in the year ended 30 June 2011 were adversely impacted by theVenezuelan bolivar.
Analysis by business area and brand
As reported on page 35, Diageo announced changes to its regional structure on 25 May 2011. As aresult of this change the segmental information for the years ended 30 June 2011 and 2010 have beenrestated. The restated organic movement calculations for volume, sales, net sales, marketing spend andoperating profit for the group’s operating segments for the year ended 30 June 2011 are includedbelow:
Acquisitions2010 and Organic 2011 Organic
Reported disposals(2) movement Reported movement
units million units million units million units million %
VolumeNorth America . . . . . . . . . . . . . . . . . . . 52.5 (0.2) — 52.3 —Europe . . . . . . . . . . . . . . . . . . . . . . . . . 41.3 (0.1) (0.7) 40.5 (2)Africa . . . . . . . . . . . . . . . . . . . . . . . . . 21.1 0.6 1.4 23.1 7Latin America and Caribbean . . . . . . . . 14.1 — 1.6 15.7 12Asia Pacific . . . . . . . . . . . . . . . . . . . . . . 14.4 — 1.5 15.9 10
Total volume . . . . . . . . . . . . . . . . . . . . . 143.4 0.3 3.8 147.5 3
Acquisitions2010 and Organic 2011 Organic
Reported Exchange(1) disposals(2) movement Reported movement
£ million £ million £ million £ million £ million %
SalesNorth America . . . . . . . . . . . . . . . . 3,887 (33) (58) 99 3,895 3Europe . . . . . . . . . . . . . . . . . . . . . . 4,460 (39) (33) (109) 4,279 (3)Africa . . . . . . . . . . . . . . . . . . . . . . . 1,582 (28) 36 174 1,764 11Latin America and Caribbean . . . . . 1,364 (264) — 193 1,293 18Asia Pacific . . . . . . . . . . . . . . . . . . . 1,595 112 (1) 225 1,931 13Corporate . . . . . . . . . . . . . . . . . . . . 70 — — — 70
Total sales . . . . . . . . . . . . . . . . . . . 12,958 (252) (56) 582 13,232 5
64

Business review (continued)
Acquisitions2010 and Organic 2011 Organic
Reported Exchange(1) disposals(2) movement Reported movement
£ million £ million £ million £ million £ million %
Net salesNorth America . . . . . . . . . . . . . . . . 3,340 (25) (58) 109 3,366 3Europe . . . . . . . . . . . . . . . . . . . . . . 2,848 (32) (25) (88) 2,703 (3)Africa . . . . . . . . . . . . . . . . . . . . . . . 1,228 (22) 29 122 1,357 10Latin America and Caribbean . . . . . 1,123 (219) (1) 160 1,063 17Asia Pacific . . . . . . . . . . . . . . . . . . . 1,171 77 — 129 1,377 11Corporate . . . . . . . . . . . . . . . . . . . . 70 — — — 70
Total net sales . . . . . . . . . . . . . . . . . 9,780 (221) (55) 432 9,936 5
Excise duties . . . . . . . . . . . . . . . . . . 3,178 3,296
Total sales . . . . . . . . . . . . . . . . . . . . 12,958 13,232
Marketing spendNorth America . . . . . . . . . . . . . . . . 476 (3) (1) 36 508 8Europe . . . . . . . . . . . . . . . . . . . . . . 422 (5) (1) (13) 403 (3)Africa . . . . . . . . . . . . . . . . . . . . . . . 119 — 4 17 140 15Latin America and Caribbean . . . . . 151 (6) — 39 184 27Asia Pacific . . . . . . . . . . . . . . . . . . . 251 12 1 39 303 15
Total marketing spend . . . . . . . . . . . 1,419 (2) 3 118 1,538 8
Operating profitNorth America . . . . . . . . . . . . . . . . 1,184 (12) (1) 104 1,275 9Europe . . . . . . . . . . . . . . . . . . . . . . 881 (12) (7) (66) 796 (8)Africa . . . . . . . . . . . . . . . . . . . . . . . 301 (17) (2) 51 333 18Latin America and Caribbean . . . . . 336 (73) (3) 58 318 22Asia Pacific . . . . . . . . . . . . . . . . . . . 240 8 (1) 52 299 20Corporate . . . . . . . . . . . . . . . . . . . . (191) 124 — (70) (137)
Total operating profit beforeexceptional items . . . . . . . . . . . . . 2,751 18 (14) 129 2,884 5
Exceptional items(3) . . . . . . . . . . . . . (177) (289)
Total operating profit . . . . . . . . . . . 2,574 2,595
Notes: Information relating to the organic movement calculations(1) The exchange adjustments for sales, net sales, marketing spend and operating profit are the
retranslation of prior year reported results at current year exchange rates and are principally inrespect of the Venezuelan bolivar, the euro and the US dollar.
(2) The impacts of acquisitions and disposals are excluded from the organic movement. In the yearended 30 June 2011 the only acquisition that affected volume, sales, net sales, marketing spendand operating profit was the acquisition of Serengeti Breweries which contributed volume, sales,net sales and operating loss of 0.6 million equivalent units, £38 million, £30 million and £7 million,respectively. Disposals in the year ended 30 June 2011 were the disposals as a result of thereorganisation of the group’s US wines operations and the disposal of the Gilbeys wholesale winebusiness in Ireland. An adjustment is also made to exclude directly attributable transaction costs
65

Business review (continued)
incurred in the year ended 30 June 2011 of £22 million, netted against acquisition costs of£12 million incurred in the year ended 30 June 2010 primarily in respect of the acquisition ofSerengeti Breweries, Zacapa, Mey Icki and the additional equity stake in Quanxing.
(3) Exceptional operating costs of £289 million for the year ended 30 June 2011 (2010 – £177 million)comprised a net charge of £111 million (2010 – £142 million) in respect of restructuringprogrammes, an impairment charge of £39 million (2010 – £35 million) in respect of the Ursusbrand reflecting the impact of the significant downturn in the economy in one of its principalmarkets, Greece, a charge of £92 million (2010 – £nil) in respect of the settlement of the disputewith the Turkish customs authorities regarding import duty payable on beverage alcohol productssold in the domestic channel in Turkey, a charge of £35 million (2010 – £nil) in respect of thesettlement with the Thai customs authorities regarding a dispute over the price of imported goodsand a charge of £12 million (2010 – £nil) in respect of the settlement with the Securities andExchange Commission regarding various regulatory and control matters.
Corporate revenue and costs Net sales were £70 million in the year ended 30 June 2011, flat relativeto the comparable prior period. Net operating charges were £137 million in the year ended 30 June2011 having been £191 million in the year ended 30 June 2010. The movement was made up of:
• included in corporate was a benefit of £21 million, versus a charge of £40 million in the yearended 30 June 2010 arising from currency transaction hedging which is controlled centrally;
• an £8 million increase in underlying corporate costs; and
• beneficial exchange differences of £123 million which arose on the movement betweentransaction exchange rates achieved in 2011 and those achieved in 2010.
66

Business review (continued)
Category review
Organic ReportedVolume* net sales net sales
movement movement movement
% % %
Category performanceSpirits . . . . . . . . . . . . . . . . . . . . . . . . . . . . . . . . . . . . . . . . . . . . . . . 3 6 3Beer . . . . . . . . . . . . . . . . . . . . . . . . . . . . . . . . . . . . . . . . . . . . . . . . 1 4 3Wine . . . . . . . . . . . . . . . . . . . . . . . . . . . . . . . . . . . . . . . . . . . . . . . . (2) 6 (11)Ready to drink . . . . . . . . . . . . . . . . . . . . . . . . . . . . . . . . . . . . . . . . . (3) (1) —Total . . . . . . . . . . . . . . . . . . . . . . . . . . . . . . . . . . . . . . . . . . . . . . . . 3 5 2
Strategic brand performance**Whisk(e)y: . . . . . . . . . . . . . . . . . . . . . . . . . . . . . . . . . . . . . . . . . . . . 4 7 2Johnnie Walker . . . . . . . . . . . . . . . . . . . . . . . . . . . . . . . . . . . . . . . . 11 11 11Crown Royal . . . . . . . . . . . . . . . . . . . . . . . . . . . . . . . . . . . . . . . . . . 1 3 2JεB . . . . . . . . . . . . . . . . . . . . . . . . . . . . . . . . . . . . . . . . . . . . . . . . . (6) (8) (8)Buchanan’s . . . . . . . . . . . . . . . . . . . . . . . . . . . . . . . . . . . . . . . . . . . 2 14 (21)Windsor . . . . . . . . . . . . . . . . . . . . . . . . . . . . . . . . . . . . . . . . . . . . . 3 8 12Bushmills . . . . . . . . . . . . . . . . . . . . . . . . . . . . . . . . . . . . . . . . . . . . . 9 10 11
Vodka: . . . . . . . . . . . . . . . . . . . . . . . . . . . . . . . . . . . . . . . . . . . . . . . 2 7 7Smirnoff . . . . . . . . . . . . . . . . . . . . . . . . . . . . . . . . . . . . . . . . . . . . . 1 (1) (1)Ketel One vodka . . . . . . . . . . . . . . . . . . . . . . . . . . . . . . . . . . . . . . . 1 1 —Cıroc . . . . . . . . . . . . . . . . . . . . . . . . . . . . . . . . . . . . . . . . . . . . . . . . 123 126 122
Liqueurs: . . . . . . . . . . . . . . . . . . . . . . . . . . . . . . . . . . . . . . . . . . . . . 3 1 7Baileys . . . . . . . . . . . . . . . . . . . . . . . . . . . . . . . . . . . . . . . . . . . . . . 3 1 —
Rum: . . . . . . . . . . . . . . . . . . . . . . . . . . . . . . . . . . . . . . . . . . . . . . . . 2 2 (3)Captain Morgan . . . . . . . . . . . . . . . . . . . . . . . . . . . . . . . . . . . . . . . . 4 4 4
Tequila: . . . . . . . . . . . . . . . . . . . . . . . . . . . . . . . . . . . . . . . . . . . . . . 5 5 3Jose Cuervo . . . . . . . . . . . . . . . . . . . . . . . . . . . . . . . . . . . . . . . . . . . 4 3 1
Gin: . . . . . . . . . . . . . . . . . . . . . . . . . . . . . . . . . . . . . . . . . . . . . . . . — 2 1Tanqueray . . . . . . . . . . . . . . . . . . . . . . . . . . . . . . . . . . . . . . . . . . . . 3 4 3
Beer: . . . . . . . . . . . . . . . . . . . . . . . . . . . . . . . . . . . . . . . . . . . . . . . . 1 4 3Guinness . . . . . . . . . . . . . . . . . . . . . . . . . . . . . . . . . . . . . . . . . . . . . 2 3 2
* Organic equals reported movement except for beer which was 3% and wine which was (11)% dueto acquisitions and disposals.
** Spirits brands excluding ready to drink.
Spirits: Net sales grew across all spirits categories and across all price segments, with the superpremium segment growing significantly faster than the others.
Whisk(e)y: The growth of whisk(e)y delivered almost half of Diageo’s incremental net sales, driven bysuccess in emerging markets. Johnnie Walker is Diageo’s biggest brand and was the biggest contributorto total net sales growth, with the fastest growth coming from super deluxe variants, up 25%. Emergingmarkets net sales were up 20% supported by incremental marketing investment behind proven global
67

Business review (continued)
growth drivers, including the ‘Walk with Giants’ and ‘Step Inside the Circuit’ campaigns and ongoingGrand Prix sponsorships.
Innovation drove the growth of Crown Royal, with the successful launch of Crown Royal Black, avariant which attracts super premium bourbon consumers. Sold at a higher price point than the basebrand, Crown Royal Black improved brand mix, and, together with a reduction in discounting, deliveredtwo percentage points of price/mix improvement as the brand gained share in the growing NorthAmerican whiskey category.
Overall J�B brand performance was impacted by the weak scotch market in Spain, the brand’slargest market. However, in its second largest market, France, the brand performed well with net salesup 9% supported by increased marketing spend and campaigns advertising new bottle formats.
Price increases on Buchanan’s in Latin America, the success of the new Buchanan’s Master andincreased marketing investment drove double digit net sales growth. In the United States net sales grew41%. Up-weighted marketing investment and rapidly expanded distribution allowed Buchanan’s toreach more of its core multi-cultural consumers and Buchanan’s is now the fastest growing scotch inthe market.
Windsor extended its scotch leadership position in Korea. Windsor 12 continued to performstrongly and price increases across the variants delivered positive price/mix. Marketing spend wasfocused on the ‘World’s No.1’ campaign which built on Windsor’s gold medal at the prestigious 2010International Wines and Spirits Competition.
Bushmills grew net sales in all regions with a particularly strong second half, primarily driven by a29% net sales increase in Russia and Eastern Europe. Marketing spend was focused behind globalgrowth drivers, the ‘Bushmills Brothers’ campaign and the launch of new packaging for Bushmills singlemalt.
Vodka: Diageo’s vodka portfolio grew net sales 7% in a competitive category. Strong Smirnoff growthin Latin America and Caribbean, Africa and Asia partially offset net sales decline in the United Statesand Europe. The decision to reduce promotional activity in the United States resulted in share loss. InEurope, net sales declined due to lower volume and negative channel mix in Great Britain andchallenging economic conditions in Spain and Greece. Marketing spend increased 11% behind theSmirnoff ‘Nightlife Exchange Project’ globally. The majority of the increase focused on emergingmarkets, especially Latin America and India to position the brand for emerging middle classconsumers.
In the United States, Ketel One vodka net sales and share were maintained as the brand held itsprice positioning. There was some weakness in flavours but Ketel One vodka grew, supported by the‘Gentlemen this is vodka’ campaign. The roll out of Ketel One vodka into markets outside the UnitedStates, particularly in Latin America, drove the net sales growth of the brand globally.
The performance of Diageo’s vodka brands was led by Cıroc, which more than doubled its netsales. Innovation on the brand, the new Coconut and Red Berry flavours, is supporting growth. Thebrand’s appeal continues to increase and it gained share in the ultra premium vodka segment followingdistribution gains and the success of its multicultural marketing programmes. Cıroc is now sold in over70 countries outside its United States base.
Liqueur: Baileys returned to growth with the launch of the new campaign ‘Baileys. Let’s do thisagain’. It was supported by strong sales programmes that drove increased visibility and gifting, and the
68

Business review (continued)
launch of the new Hazelnut flavour. Performance improved in North America and in emerging marketsnet sales grew 30%.
Rum: Diageo’s largest rum brand, Captain Morgan, grew net sales in every region outside the UnitedStates. Growth was particularly strong in Canada, Great Britain and Germany where the brand gainedshare and delivered double digit growth. In the United States, the brand’s net sales declined as smallercompetitors have gained share by pricing and discounting aggressively in a flat category. However,Captain Morgan is one of the strongest and most enduring industry icons and the new marketingcampaign will build on this.
Net sales of Diageo’s second largest rum brand, Cacique, declined as growth in Venezuela wasoffset by decline in its largest market, Spain. Bundaberg grew in Australia driven by innovation, led bythe launch of Bundy 5, a white rum, and Bundaberg limited editions. In July, Diageo acquired acontrolling stake in the super premium rum, Zacapa. The brand grew strongly in every regiondelivering double digit net sales growth on the back of targeted distribution expansion and superpremium sampling activities.
Tequila: Despite lower competitor pricing Jose Cuervo grew in the United States as a result of asuccessful on trade events programme, innovation in on trade dispense and the strong growth of thesuper premium segment. Jose Cuervo price/mix was negative but this was offset by the growth of superpremium Don Julio and price/mix was flat for the category. Don Julio’s net sales growth accounted forroughly half of the category growth.
Gin: Growth of Tanqueray was driven by Spain, Canada and Global Travel Asia. Spain contributedmore than a third of growth, where despite the difficult economic conditions, premium gin brandsperformed well and Tanqueray gained volume share through strong promotional sales drivers in the offtrade. In contrast, the United States gin category declined. Tanqueray reduced discounting and focusedon visibility drivers to maintain net sales.
Beer: The 4% net sales growth in beer was driven by the emerging markets of Africa and Asia Pacificwhere incremental marketing spend on Guinness and local lager brands, and price increases in selectedmarkets drove positive price/mix for the category. Africa net sales grew 11% and Guinness returned togrowth led by Nigeria and Cameroon, supported by an 18% increase in marketing spend across theregion. Net sales of Guinness declined in Ireland and Great Britain where the beer category was weak,particularly in the on trade. Local lager brands such as Harp, Senator and Tusker in Africa, and Tigerin Malaysia delivered further growth for the category.
Wine: Volume declined in North America, offset by improved price/mix. In Great Britain, a strongBordeaux campaign and price increases delivered net sales growth of 14%.
Ready to drink: Weakness in Europe and North America led to a 1% drop in net sales. In the UnitedStates, a successful programme of innovation slowed the rate of decline. In Australia, there was areturn to growth driven by Smirnoff Ice and the emergence of the new ready to serve segment throughinnovations such as Smirnoff Signature Serves. Ready to drink continued to grow in emerging marketssuch as Nigeria and Brazil.
69

Business review (continued)
2011
North America
Key highlights
• Performance in North America was driven by the growth of spirits in the United States, wherenet sales were up 4%.
• Spirits volume in the United States remained flat as the reduction in promotional spend andheavy competition in the vodka and rum categories resulted in share loss.
• Positive price/mix in the United States was driven by the growth of Cıroc, Crown Royal Black,Buchanan’s and the silver and super premium variants of Jose Cuervo.
• Marketing spend increased 8% mainly behind the strategic brands and campaigns such as Cıroc’s‘Smooth Talk’ and ‘Cıroc the New Year’ television campaigns; Smirnoff’s continued sponsorshipof ‘Master of the Mix’ in the United States and the Smirnoff ‘Nightlife Exchange Project’ inCanada; new television activations of the ‘Gentlemen, this is vodka’ campaign for Ketel Onevodka; and dedicated television advertising behind the silver variants of Jose Cuervo Especialand Tradicional.
• Improved operating margin was driven by positive price/mix and ongoing initiatives to reduceproduction costs which resulted in cost of goods savings.
• Beer volume and net sales growth was driven by Guinness, which offset weakness in Harp andSmithwick’s. Price increases on Guinness drove price/mix improvements in beer.
• The wine division has been restructured, a number of wine brands sold and the final sale andleaseback of vineyards and facilities in California completed. Price increases on BeaulieuVineyards reserve tier wines and distribution gains by Acacia Vineyard drove three percentagepoints of price/mix in wines.
• Ready to drink net sales declined 3%. Smirnoff Ice volume was weak but innovations have beensuccessful including Baileys Mudslide, Jeremiah Weed malt based beverages, Jose Cuervo LightMargaritas and Smirnoff Mixed Drinks.
• In Canada net sales grew 3% and Diageo gained share led by the strong performance ofSmirnoff and Captain Morgan.
Performance*Acquisitions
2010 and Organic 2011 ReportedKey financials Reported Exchange disposals movement Reported movement
£ million £ million £ million £ million £ million %
Net sales . . . . . . . . . . . . . . . . . . . . . . 3,340 (25) (58) 109 3,366 1Marketing spend . . . . . . . . . . . . . . . . . 476 (3) (1) 36 508 7Operating profit before exceptional
items . . . . . . . . . . . . . . . . . . . . . . . 1,184 (12) (1) 104 1,275 8Exceptional items . . . . . . . . . . . . . . . . (38) (23)
Operating profit . . . . . . . . . . . . . . . . . 1,146 1,252 9
70

Business review (continued)
Organic ReportedVolume** net sales net salesmovement movement movement
% % %
Key countries and categories:North America . . . . . . . . . . . . . . . . . . . . . . . . . . . . . . . . . . . . . . . . . — 3 1United States . . . . . . . . . . . . . . . . . . . . . . . . . . . . . . . . . . . . . . . . . . — 3 —Canada . . . . . . . . . . . . . . . . . . . . . . . . . . . . . . . . . . . . . . . . . . . . . . . 3 3 8
Spirits . . . . . . . . . . . . . . . . . . . . . . . . . . . . . . . . . . . . . . . . . . . . . . . . — 4 3Beer . . . . . . . . . . . . . . . . . . . . . . . . . . . . . . . . . . . . . . . . . . . . . . . . . 1 2 2Wine . . . . . . . . . . . . . . . . . . . . . . . . . . . . . . . . . . . . . . . . . . . . . . . . (4) (1) (21)Ready to drink . . . . . . . . . . . . . . . . . . . . . . . . . . . . . . . . . . . . . . . . . (3) (3) (4)
The strategic brands:***Johnnie Walker . . . . . . . . . . . . . . . . . . . . . . . . . . . . . . . . . . . . . . . . . (1) 2 1Smirnoff . . . . . . . . . . . . . . . . . . . . . . . . . . . . . . . . . . . . . . . . . . . . . . — (1) (2)Baileys . . . . . . . . . . . . . . . . . . . . . . . . . . . . . . . . . . . . . . . . . . . . . . . 1 — —Captain Morgan . . . . . . . . . . . . . . . . . . . . . . . . . . . . . . . . . . . . . . . . (2) (2) (2)Jose Cuervo . . . . . . . . . . . . . . . . . . . . . . . . . . . . . . . . . . . . . . . . . . . 3 3 2Tanqueray . . . . . . . . . . . . . . . . . . . . . . . . . . . . . . . . . . . . . . . . . . . . . 1 1 —Crown Royal . . . . . . . . . . . . . . . . . . . . . . . . . . . . . . . . . . . . . . . . . . . 1 3 2Ketel One vodka . . . . . . . . . . . . . . . . . . . . . . . . . . . . . . . . . . . . . . . . (1) — (1)Buchanan’s . . . . . . . . . . . . . . . . . . . . . . . . . . . . . . . . . . . . . . . . . . . . 42 44 42Cıroc . . . . . . . . . . . . . . . . . . . . . . . . . . . . . . . . . . . . . . . . . . . . . . . . 124 128 125Guinness . . . . . . . . . . . . . . . . . . . . . . . . . . . . . . . . . . . . . . . . . . . . . . 3 4 3
* Restated for changes in reporting segments, see page 35.
** Organic equals reported movement for volume, except for wine where reported movementwas (19)% due to disposals in the year.
*** Spirits brands excluding ready to drink.
2011
Europe
Key highlights
• Volume in Europe declined 2%. The challenging pricing environment and on trade weaknessacross most of Europe coupled with the decline of scotch in Southern Europe led to negativeprice/mix.
• In Great Britain, VAT and duty increases and the channel shift from the on to the off tradewere the main drivers in the beverage alcohol market. Within this context, Diageo spiritsperformed well and gained share while price increases on beer and wine resulted in small sharelosses. Positive price/mix was primarily a result of the growth of wine, where net sales grew 14%.The growth of wine had a negative impact on gross margin. Marketing spend increased and theincremental investment was focused on super premium brands and innovation. Net sales ofreserve brands grew 30% driven by super deluxe scotch. The launch of three new products and a
71

Business review (continued)
strong media campaign led to share gains in the fast growing premix segment and Diageofinished the year with over 50% of the segment.
• High levels of unemployment and personal tax increases in Ireland continued to restrictconsumer spending, particularly in the on trade. Guinness remained the best selling beer inIreland, but net sales declined due to lower sales in the on trade, while the volume of Diageo’spackaged beer increased in the growing off trade. Marketing spend on the brand increased,reflecting the growing momentum of ‘Arthur’s Day’ and the Irish rugby sponsorship. Net sales ofspirits grew 2% and Diageo gained share led by the continued success of Captain Morgan withinvestment behind on trade sampling and promotional activity.
• Net sales in Iberia declined 18%, a deterioration from the first half. This was due to a furtherreduction in consumer spending in the on trade, which accounts for the majority of scotch andrum sales, as well as some destocking at both the wholesale and retail level. Despiteimplementing a price increase on spirits in the second half, price/mix remained flat, reflectingthe higher proportion of sales through the off trade. There was a strict control of costs resultingin an increase in operating margin for the year.
• Net sales in Greece declined 38% as significant rises in excise duties on spirits and otherausterity measures dramatically reduced consumer spending and confidence. As consumersswitched to at home consumption, Diageo increased its focus on the off trade, growing volumeshare of spirits in the off trade and this year was rated number one supplier among all beveragealcohol suppliers. Marketing spend was reduced broadly in line with net sales and activity wasfocused on supporting the launch of ready to serve cocktails and premix brands. Overheads werealso reduced, but operating margin declined.
• In Russia and Eastern Europe, Diageo delivered double digit net sales growth and positiveprice/mix due to price increases on spirits and an improvement in brand mix as many Russianconsumers began to trade back up in spirits. There was strong growth on Johnnie Walker in allmarkets, while Bell’s and White Horse also performed well in Russia, appealing to thoseconsumers seeking a more affordable entry into the scotch category. Marketing spend wasfocused on premium and super premium scotch, the roll out of Captain Morgan and driving newpremium innovation launches such as White Horse 1900.
• Elsewhere in Europe, international spirits continued to gain momentum. In Germany, Diageogrew net sales 13% and gained share led by Johnnie Walker and the continued success of theCaptain Morgan roll out. Diageo resumed shipments to Turkey in the second half havingreached settlement in a dispute with Turkish customs authorities for which there was anexceptional charge of £92 million.
72
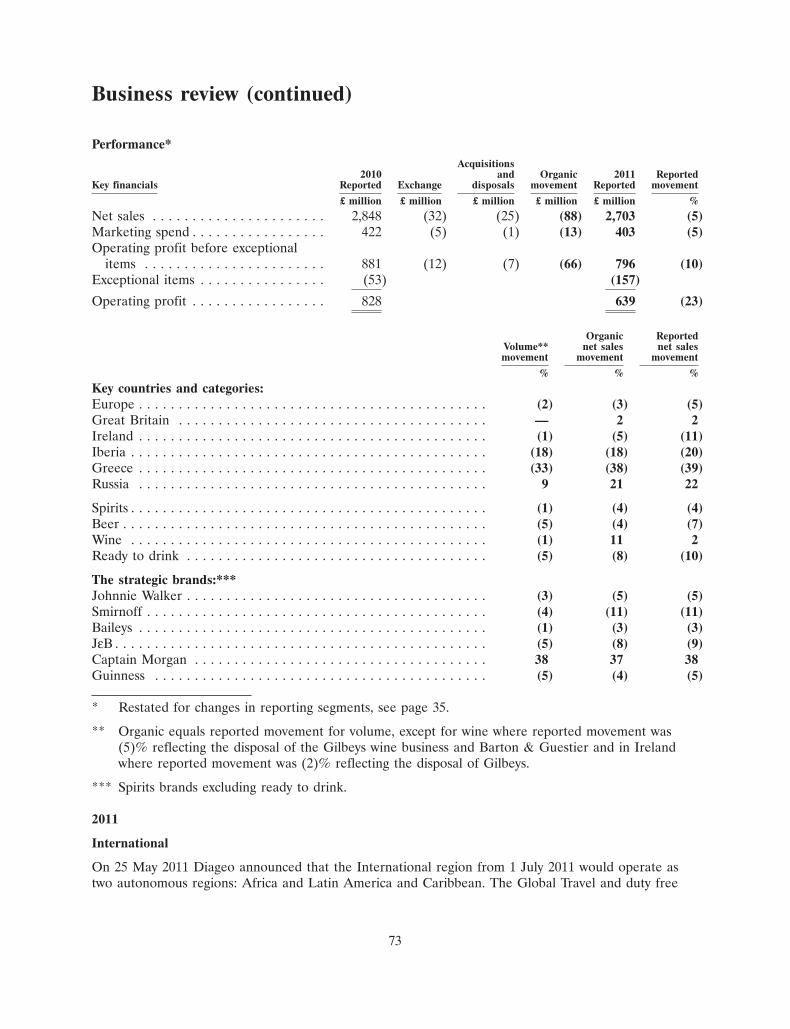
Business review (continued)
Performance*Acquisitions
2010 and Organic 2011 ReportedKey financials Reported Exchange disposals movement Reported movement
£ million £ million £ million £ million £ million %
Net sales . . . . . . . . . . . . . . . . . . . . . . 2,848 (32) (25) (88) 2,703 (5)Marketing spend . . . . . . . . . . . . . . . . . 422 (5) (1) (13) 403 (5)Operating profit before exceptional
items . . . . . . . . . . . . . . . . . . . . . . . 881 (12) (7) (66) 796 (10)Exceptional items . . . . . . . . . . . . . . . . (53) (157)
Operating profit . . . . . . . . . . . . . . . . . 828 639 (23)
Organic ReportedVolume** net sales net salesmovement movement movement
% % %
Key countries and categories:Europe . . . . . . . . . . . . . . . . . . . . . . . . . . . . . . . . . . . . . . . . . . . . (2) (3) (5)Great Britain . . . . . . . . . . . . . . . . . . . . . . . . . . . . . . . . . . . . . . . — 2 2Ireland . . . . . . . . . . . . . . . . . . . . . . . . . . . . . . . . . . . . . . . . . . . . (1) (5) (11)Iberia . . . . . . . . . . . . . . . . . . . . . . . . . . . . . . . . . . . . . . . . . . . . . (18) (18) (20)Greece . . . . . . . . . . . . . . . . . . . . . . . . . . . . . . . . . . . . . . . . . . . . (33) (38) (39)Russia . . . . . . . . . . . . . . . . . . . . . . . . . . . . . . . . . . . . . . . . . . . . 9 21 22
Spirits . . . . . . . . . . . . . . . . . . . . . . . . . . . . . . . . . . . . . . . . . . . . . (1) (4) (4)Beer . . . . . . . . . . . . . . . . . . . . . . . . . . . . . . . . . . . . . . . . . . . . . . (5) (4) (7)Wine . . . . . . . . . . . . . . . . . . . . . . . . . . . . . . . . . . . . . . . . . . . . . (1) 11 2Ready to drink . . . . . . . . . . . . . . . . . . . . . . . . . . . . . . . . . . . . . . (5) (8) (10)
The strategic brands:***Johnnie Walker . . . . . . . . . . . . . . . . . . . . . . . . . . . . . . . . . . . . . . (3) (5) (5)Smirnoff . . . . . . . . . . . . . . . . . . . . . . . . . . . . . . . . . . . . . . . . . . . (4) (11) (11)Baileys . . . . . . . . . . . . . . . . . . . . . . . . . . . . . . . . . . . . . . . . . . . . (1) (3) (3)JεB . . . . . . . . . . . . . . . . . . . . . . . . . . . . . . . . . . . . . . . . . . . . . . . (5) (8) (9)Captain Morgan . . . . . . . . . . . . . . . . . . . . . . . . . . . . . . . . . . . . . 38 37 38Guinness . . . . . . . . . . . . . . . . . . . . . . . . . . . . . . . . . . . . . . . . . . (5) (4) (5)
* Restated for changes in reporting segments, see page 35.
** Organic equals reported movement for volume, except for wine where reported movement was(5)% reflecting the disposal of the Gilbeys wine business and Barton & Guestier and in Irelandwhere reported movement was (2)% reflecting the disposal of Gilbeys.
*** Spirits brands excluding ready to drink.
2011
International
On 25 May 2011 Diageo announced that the International region from 1 July 2011 would operate astwo autonomous regions: Africa and Latin America and Caribbean. The Global Travel and duty free
73
Business review (continued)
business would be allocated to the geographic regions and the Middle East business would become partof Asia Pacific.
Key highlights
• In Africa continued investment behind marketing and distribution, driving the strong growth ofbeer and momentum behind spirits brands, delivered another successful year with double digitnet sales growth.
• Volume grew 9% in Nigeria as Guinness returned to growth, double digit growth of Harpcontinued and Smirnoff Ice grew strongly as the new can format increased accessibility. Priceincreases and product mix drove an increase in net sales of 14%. Marketing spend increased,driven by sponsorship of ‘Guinness. The Match’ and relationship marketing as Guinnessreinforced its association with football. Spend also increased behind ‘Malta Guinness StreetDance’.
• 8% volume growth in East Africa was primarily driven by spirits, following a duty reduction onspirits in Kenya and growth in Senator lager. The increase in the volume of local spirits brandsnegatively impacted price/mix and net sales grew 7%. Increased marketing spend was focusedbehind Tusker and Guinness.
• In South Africa ready to drink contributed to an overall volume decline of 2%. Net sales growthof scotch more than offset the decline in ready to drink and total net sales increased 1%.Increased marketing spend was focused principally behind Johnnie Walker Red Label and thebrand grew volume share.
• Elsewhere in Africa there was double digit volume and net sales growth in beer and spirits. Priceincreases and sales force focus on execution at the point of purchase drove strong Guinnessgrowth and share gains in Cameroon. In Ghana, Guinness, Malta Guinness and Star drovestrong double digit net sales growth despite some continuing supply issues due to watershortages.
• In Latin America and Caribbean, there was strong performance in both scotch and other spiritscategories. All markets posted double digit net sales growth with the exception of Venezuelawhich held net sales flat in difficult market conditions and Colombia which grew 5%. Marketingspend increased as a percentage of net sales to 17.3%.
• A great performance in Brazil was buoyed by increased employment and average income andthe wider distribution and sales focus across major cities. Growth accelerated as volumeincreased 23% driven by double digit growth of scotch and vodka. The growth of scotchdelivered positive mix and net sales increased by 27%. The market’s core innovation, SmirnoffCaipiroska, continued its strong performance with 18% net sales growth. Marketing spend wasincreased significantly, focused on the Johnnie Walker ‘Keep Walking’ campaign, on traderecruitment and strong point of sale execution across all channels.
• In North Latin America and Caribbean net sales grew 15%. Increased consumer demand in keyCaribbean and Central American markets, improved customer relationships and pricing drove astrong performance. Johnnie Walker Black Label led net sales growth followed by Buchanan’s,Baileys and Smirnoff. A 9% increase in marketing spend was focused on scotch.
• Volume in Mexico grew 20% driven by scotch and rum. The faster growth of non-scotch brands,as the business increased its category breadth, led to negative price/mix and net sales increased
74

Business review (continued)
18%. Marketing spend increased significantly, mainly behind scotch, rum and vodka and Diageogrew its volume share of total spirits.
• In Venezuela a challenging economic environment with currency restrictions led to lower scotchvolume. Diageo’s locally produced rum brands, Cacique and Pampero, delivered strong net salesgrowth. Marketing spend as a percentage of net sales declined as a fall in scotch spend was onlypartially offset by increased spend behind local brands.
Africa
Performance*Acquisitions
2010 and Organic 2011 ReportedKey financials Reported Exchange disposals movement Reported movement
£ million £ million £ million £ million £ million %
Net sales . . . . . . . . . . . . . . . . . . . . . . 1,228 (22) 29 122 1,357 11Marketing spend . . . . . . . . . . . . . . . . . 119 — 4 17 140 18Operating profit before exceptional
items . . . . . . . . . . . . . . . . . . . . . . . 301 (17) (2) 51 333 11Exceptional items . . . . . . . . . . . . . . . . (3) (7)
Operating profit . . . . . . . . . . . . . . . . . 298 326 9
Organic ReportedVolume** net sales net salesmovement movement movement
% % %
Key countries and categories:Africa . . . . . . . . . . . . . . . . . . . . . . . . . . . . . . . . . . . . . . . . . . . . . . . . 7 10 11Nigeria . . . . . . . . . . . . . . . . . . . . . . . . . . . . . . . . . . . . . . . . . . . . . . . 9 14 11East Africa . . . . . . . . . . . . . . . . . . . . . . . . . . . . . . . . . . . . . . . . . . . . 8 7 8Africa Regional Markets . . . . . . . . . . . . . . . . . . . . . . . . . . . . . . . . . . 13 20 17South Africa . . . . . . . . . . . . . . . . . . . . . . . . . . . . . . . . . . . . . . . . . . . (2) 1 9
Spirits . . . . . . . . . . . . . . . . . . . . . . . . . . . . . . . . . . . . . . . . . . . . . . . . 15 13 19Beer . . . . . . . . . . . . . . . . . . . . . . . . . . . . . . . . . . . . . . . . . . . . . . . . . 4 11 10Ready to drink . . . . . . . . . . . . . . . . . . . . . . . . . . . . . . . . . . . . . . . . . (19) (2) —
The strategic brands:***Johnnie Walker . . . . . . . . . . . . . . . . . . . . . . . . . . . . . . . . . . . . . . . . . 19 15 22Smirnoff . . . . . . . . . . . . . . . . . . . . . . . . . . . . . . . . . . . . . . . . . . . . . . 4 7 14Baileys . . . . . . . . . . . . . . . . . . . . . . . . . . . . . . . . . . . . . . . . . . . . . . . 39 64 61Guinness . . . . . . . . . . . . . . . . . . . . . . . . . . . . . . . . . . . . . . . . . . . . . . 11 11 8
* Restated for changes in reporting segments, see page 35.
** Organic equals reported movement for volume, except for Africa, East Africa and beer wherereported movement was 9%, 16% and 8%, respectively, reflecting the acquisition of SerengetiBreweries, and Baileys where reported movement was 40%.
*** Spirits brands excluding ready to drink.
75

Business review (continued)
Latin America and Caribbean
Performance*Acquisitions
2010 and Organic 2011 ReportedKey financials Reported Exchange disposals movement Reported movement
£ million £ million £ million £ million £ million %
Net sales . . . . . . . . . . . . . . . . . . . . . . 1,123 (219) (1) 160 1,063 (5)Marketing spend . . . . . . . . . . . . . . . . . 151 (6) — 39 184 22Operating profit before exceptional
items . . . . . . . . . . . . . . . . . . . . . . . 336 (73) (3) 58 318 (5)Exceptional items . . . . . . . . . . . . . . . . (2) (6)
Operating profit . . . . . . . . . . . . . . . . . 334 312 (7)
Organic ReportedVolume** net sales net salesmovement movement movement
% % %
Key countries and categories:Latin America and Caribbean . . . . . . . . . . . . . . . . . . . . . . . . . . . . . . 12 17 (5)West Latin America and Caribbean . . . . . . . . . . . . . . . . . . . . . . . . . . 15 18 24Brazil . . . . . . . . . . . . . . . . . . . . . . . . . . . . . . . . . . . . . . . . . . . . . . . . 23 27 35Andean . . . . . . . . . . . . . . . . . . . . . . . . . . . . . . . . . . . . . . . . . . . . . . (13) 1 (59)Mexico . . . . . . . . . . . . . . . . . . . . . . . . . . . . . . . . . . . . . . . . . . . . . . . 20 18 24
Spirits . . . . . . . . . . . . . . . . . . . . . . . . . . . . . . . . . . . . . . . . . . . . . . . . 13 20 (6)Beer . . . . . . . . . . . . . . . . . . . . . . . . . . . . . . . . . . . . . . . . . . . . . . . . . (3) (2) —Wine . . . . . . . . . . . . . . . . . . . . . . . . . . . . . . . . . . . . . . . . . . . . . . . . (7) 17 7Ready to drink . . . . . . . . . . . . . . . . . . . . . . . . . . . . . . . . . . . . . . . . . 8 6 (10)
The strategic brands:***Johnnie Walker . . . . . . . . . . . . . . . . . . . . . . . . . . . . . . . . . . . . . . . . . 23 26 16Buchanan’s . . . . . . . . . . . . . . . . . . . . . . . . . . . . . . . . . . . . . . . . . . . . (3) 9 (29)Smirnoff . . . . . . . . . . . . . . . . . . . . . . . . . . . . . . . . . . . . . . . . . . . . . . 12 25 22Baileys . . . . . . . . . . . . . . . . . . . . . . . . . . . . . . . . . . . . . . . . . . . . . . . 11 14 2
* Restated for changes in reporting segments, see page 35.
** Organic equals reported movement for volume, except for wine where reported movementwas (9)%.
*** Spirits brands excluding ready to drink.
2011
Asia Pacific
Key highlights
• Growth in Asia Pacific was driven by scotch, in particular the super deluxe segment in emergingmarkets. In the developed markets of Asia Pacific, there were strong performances in Australiaand Korea.
76

Business review (continued)
• Marketing spend increased 15% driven by investments in proven Johnnie Walker growthdrivers. Activities included ongoing Grand Prix sponsorships, mentoring programmes to buildbrand equity and digital campaigns that drove 15% net sales growth for the brand.
• Diageo’s business in Australia grew in a challenging market, delivering share gains in spirits andready to drink through increased focus on customer marketing with the largest off tradeaccounts, a successful innovation programme and selective price re-positioning. Spirits net saleswere up 6% with positive price/mix and ready to drink net sales grew 4%.
• In Korea, Diageo outperformed a declining scotch market with Windsor 12 extending itsleadership position and generating eight percentage points of positive price/mix.
• In response to pressure from parallel imports, Diageo adjusted its prices in China which led to anet sales decline of 4%. These imports caused a distortion between sell in and underlyingconsumer demand which was up as investment increased behind the brands. Diageo’s scotchgained volume share in the standard, deluxe and especially the super deluxe segment whereincremental marketing spend drove 41% net sales growth in the segment.
• The route to market changes which have been implemented in India resulted in strongerrelationships with customers and strong double digit net sales growth. Increased marketinginvestment in Johnnie Walker Black Label and super deluxe variants; the re-launch of VAT69and innovation in Smirnoff with the introduction of Smirnoff Lime drove this growth.
• The strong performance of the South East Asia markets was driven by growth in scotch andGuinness. In Thailand, increased marketing spend behind Johnnie Walker led to share gains onBlack and Red Label and 23% net sales growth across the brand. Super deluxe scotch, notablyJohnnie Walker Blue Label and The Singleton, drove 36% net sales growth in Vietnam.Guinness continued to perform well in Indonesia and Malaysia with share gains in both marketsand 7% and 8% net sales growth respectively.
• Elsewhere in Asia, Japan was weakened as a result of the earthquake and tsunami and net salesdeclined 5% but Diageo gained volume share in key spirits categories. The Singleton is now thesecond largest single malt brand in Taiwan with net sales growth of 45%, and along with JohnnieWalker super deluxe variants, drove 16% net sales growth for the market.
Performance*Acquisitions
2010 and Organic 2011 ReportedKey financials Reported Exchange disposals movement Reported movement
£ million £ million £ million £ million £ million %
Net sales . . . . . . . . . . . . . . . . . . . . . . 1,171 77 — 129 1,377 18Marketing spend . . . . . . . . . . . . . . . . . 251 12 1 39 303 21Operating profit before exceptional
items . . . . . . . . . . . . . . . . . . . . . . . 240 8 (1) 52 299 25Exceptional items . . . . . . . . . . . . . . . . (30) (50)
Operating profit . . . . . . . . . . . . . . . . . 210 249 19
77
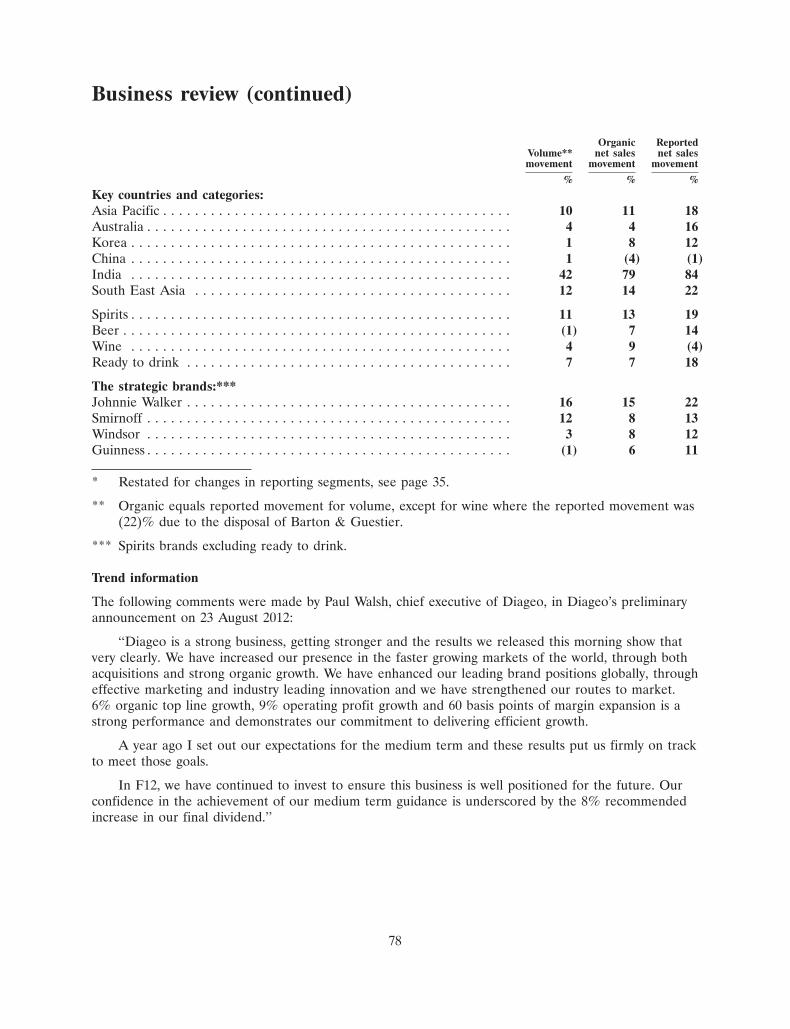
Business review (continued)
Organic ReportedVolume** net sales net salesmovement movement movement
% % %
Key countries and categories:Asia Pacific . . . . . . . . . . . . . . . . . . . . . . . . . . . . . . . . . . . . . . . . . . . . 10 11 18Australia . . . . . . . . . . . . . . . . . . . . . . . . . . . . . . . . . . . . . . . . . . . . . . 4 4 16Korea . . . . . . . . . . . . . . . . . . . . . . . . . . . . . . . . . . . . . . . . . . . . . . . . 1 8 12China . . . . . . . . . . . . . . . . . . . . . . . . . . . . . . . . . . . . . . . . . . . . . . . . 1 (4) (1)India . . . . . . . . . . . . . . . . . . . . . . . . . . . . . . . . . . . . . . . . . . . . . . . . 42 79 84South East Asia . . . . . . . . . . . . . . . . . . . . . . . . . . . . . . . . . . . . . . . . 12 14 22
Spirits . . . . . . . . . . . . . . . . . . . . . . . . . . . . . . . . . . . . . . . . . . . . . . . . 11 13 19Beer . . . . . . . . . . . . . . . . . . . . . . . . . . . . . . . . . . . . . . . . . . . . . . . . . (1) 7 14Wine . . . . . . . . . . . . . . . . . . . . . . . . . . . . . . . . . . . . . . . . . . . . . . . . 4 9 (4)Ready to drink . . . . . . . . . . . . . . . . . . . . . . . . . . . . . . . . . . . . . . . . . 7 7 18
The strategic brands:***Johnnie Walker . . . . . . . . . . . . . . . . . . . . . . . . . . . . . . . . . . . . . . . . . 16 15 22Smirnoff . . . . . . . . . . . . . . . . . . . . . . . . . . . . . . . . . . . . . . . . . . . . . . 12 8 13Windsor . . . . . . . . . . . . . . . . . . . . . . . . . . . . . . . . . . . . . . . . . . . . . . 3 8 12Guinness . . . . . . . . . . . . . . . . . . . . . . . . . . . . . . . . . . . . . . . . . . . . . . (1) 6 11
* Restated for changes in reporting segments, see page 35.
** Organic equals reported movement for volume, except for wine where the reported movement was(22)% due to the disposal of Barton & Guestier.
*** Spirits brands excluding ready to drink.
Trend information
The following comments were made by Paul Walsh, chief executive of Diageo, in Diageo’s preliminaryannouncement on 23 August 2012:
‘‘Diageo is a strong business, getting stronger and the results we released this morning show thatvery clearly. We have increased our presence in the faster growing markets of the world, through bothacquisitions and strong organic growth. We have enhanced our leading brand positions globally, througheffective marketing and industry leading innovation and we have strengthened our routes to market.6% organic top line growth, 9% operating profit growth and 60 basis points of margin expansion is astrong performance and demonstrates our commitment to delivering efficient growth.
A year ago I set out our expectations for the medium term and these results put us firmly on trackto meet those goals.
In F12, we have continued to invest to ensure this business is well positioned for the future. Ourconfidence in the achievement of our medium term guidance is underscored by the 8% recommendedincrease in our final dividend.’’
78

Business review (continued)
Liquidity and capital resources
Cash flows and movement in net borrowings A summary of the cash flow and reconciliation tomovement in net borrowings for the three years ended 30 June 2012 is as follows:
Year ended 30 June
2011 20102012 (restated) (restated)
£ million £ million £ million
Operating profit . . . . . . . . . . . . . . . . . . . . . . . . . . . . . . . . . . . . . . . . 3,158 2,595 2,574Depreciation, amortisation and impairment . . . . . . . . . . . . . . . . . . . . 411 352 372Net movements in working capital . . . . . . . . . . . . . . . . . . . . . . . . . . . (529) (110) 329Dividend income . . . . . . . . . . . . . . . . . . . . . . . . . . . . . . . . . . . . . . . . 166 138 111Other items . . . . . . . . . . . . . . . . . . . . . . . . . . . . . . . . . . . . . . . . . . . (201) (116) (211)
Cash generated from operations . . . . . . . . . . . . . . . . . . . . . . . . . . . . 3,005 2,859 3,175Net interest paid . . . . . . . . . . . . . . . . . . . . . . . . . . . . . . . . . . . . . . . . (391) (311) (305)Taxation paid . . . . . . . . . . . . . . . . . . . . . . . . . . . . . . . . . . . . . . . . . . (521) (365) (474)
Net cash from operating activities . . . . . . . . . . . . . . . . . . . . . . . . . . . 2,093 2,183 2,396Net investment in property, plant and equipment and computer
software . . . . . . . . . . . . . . . . . . . . . . . . . . . . . . . . . . . . . . . . . . . . (445) (372) (231)Movements in loans and other investments . . . . . . . . . . . . . . . . . . . . . (1) 1 (43)
Free cash flow . . . . . . . . . . . . . . . . . . . . . . . . . . . . . . . . . . . . . . . . . . 1,647 1,812 2,122Net acquisition of businesses . . . . . . . . . . . . . . . . . . . . . . . . . . . . . . . (1,369) (63) (196)Proceeds from issue of share capital . . . . . . . . . . . . . . . . . . . . . . . . . . 1 1 —Net (purchase)/sale of own shares for share schemes . . . . . . . . . . . . . . — (9) 85Dividends paid to equity non-controlling interests . . . . . . . . . . . . . . . . (118) (112) (107)Proceeds from non-controlling interests . . . . . . . . . . . . . . . . . . . . . . . 11 — —Purchase of shares of non-controlling interests . . . . . . . . . . . . . . . . . . (155) — —Net increase/(decrease) in loans . . . . . . . . . . . . . . . . . . . . . . . . . . . . . 512 (414) (422)Equity dividends paid . . . . . . . . . . . . . . . . . . . . . . . . . . . . . . . . . . . . (1,036) (973) (914)
Net (decrease)/increase in cash and cash equivalents . . . . . . . . . . . . . (507) 242 568Net (increase)/decrease in loans . . . . . . . . . . . . . . . . . . . . . . . . . . . . . (512) 414 422Exchange differences on net borrowings . . . . . . . . . . . . . . . . . . . . . . . 152 (17) (429)Borrowings acquired through acquisition of businesses . . . . . . . . . . . . (5) (22) —Other non-cash items . . . . . . . . . . . . . . . . . . . . . . . . . . . . . . . . . . . . (248) (113) (96)
(Increase)/decrease in net borrowings . . . . . . . . . . . . . . . . . . . . . . . . . (1,120) 504 465Net borrowings at the beginning of the year . . . . . . . . . . . . . . . . . . . . (6,450) (6,954) (7,419)
Net borrowings at the end of the year . . . . . . . . . . . . . . . . . . . . . . . . (7,570) (6,450) (6,954)
The group has revised the disclosure of certain prior year amounts in the consolidated statementof cash flows. In the year ended 30 June 2012 directly attributable acquisition transaction costs of£47 million (2011 – £20 million; 2010 – £9 million) have been included in cash flow from operatingactivities rather than cash flow from investing activities and dividends paid to non-controlling interestsof £118 million (2011 – £112 million; 2010 – £107 million) are now disclosed as part of cash flows fromfinancing activities rather than cash flow from operating activities. This revised presentation isconsidered to be more consistent with the treatment of these items in the consolidated income
79

Business review (continued)
statement and the consolidated statement of changes in equity. The revision had no impact on priorperiod increase or decrease in cash and cash equivalents, net assets or net profit.
The primary source of the group’s liquidity over the last three financial years has been cashgenerated from operations. These funds have generally been used to pay interest, taxes and dividends,and to fund capital expenditure, acquisitions and share repurchases.
Net cash from operating activities Cash generated from operations increased from £2,859 million inthe year ended 30 June 2011 to £3,005 million in the year ended 30 June 2012. This increase of£146 million is primarily due to an increase in operating profit, higher dividends received from MoetHennessy partially offset by an increase in working capital due to business growth, higher finishedgoods levels to smooth the impact of upcoming supply chain changes and higher debtors as a result ofexcise duty increases. Cash generated from operations is after exceptional restructuring costs of£158 million. Other items include £200 million of cash contributions to post employment schemes inexcess of the income statement impact and gains on sale of property, included in operating profit, of£19 million partially offset by the fair value charge in respect of share-based incentive plans of£36 million. The increase in net interest paid was driven by the impact of the renegotiation of theterms of certain interest rate swaps in the prior year while higher tax payments are a result of increasedprofits and tax settlements paid during the year.
Cash generated from operations decreased from £3,175 million in the year ended 30 June 2010 to£2,859 million in the year ended 30 June 2011. This decrease of £316 million was primarily due to alower increase in payables in the year compared with the previous year. Cash generated fromoperations was reduced by exceptional restructuring costs of £118 million. Other items included£119 million of cash contributions to post employment schemes in excess of the income statementcharge and gains on sale of property, included in operating profit, of £20 million partly offset by thefair value charge in respect of share-based incentive plans of £34 million. Net interest paid includedcash receipts of £71 million following the renegotiation of the terms of certain interest rate swaps. Taxpayments in the year ended 30 June 2011 were lower than in the year ended 30 June 2010 primarily asa result of beneficial timing of settlement payments agreed with tax authorities.
Net cash from investing activities The purchase of tangible fixed assets and computer software increasedfrom £419 million in the year ended 30 June 2011 to £484 million in the year ended 30 June 2012. Theexpenditure was incurred on a number of projects throughout the world with the largest investmentsmade to increase capacity in Africa, to enhance operations in Scotland and to increase efficiencies inNorth America. In the year ended 30 June 2012, the group also incurred expenditure of £1,420 millionin connection with business acquisitions. This included the acquisition of 100% of the equity sharecapital of Mey Icki (£1,260 million) and Meta Breweries (£145 million) and a 50% controlling equitystake in Zacapa (£118 million). In May 2012 Diageo received back the deposit of $185 million relatingto the acquisition of Shuijingfang from China’s securities depositary and clearing agency.
In the year ended 30 June 2011, the group incurred expenditure of £97 million in connection withbusiness acquisitions. This included £32 million on the purchase of a controlling stake in SerengetiBreweries in Tanzania, £34 million on the purchase of an equity stake in Halico, an associate companyin Vietnam and an additional equity investment of £18 million in DHN Drinks, an associate companyin South Africa.
In the year ended 30 June 2010 the group spent £197 million on acquisitions of which $185 millionwas deposited with China’s securities depositary and clearing agency, Shanghai branch in connectionwith a possible tender offer to the shareholders of Shuijingfang, £25 million in respect of the purchase
80
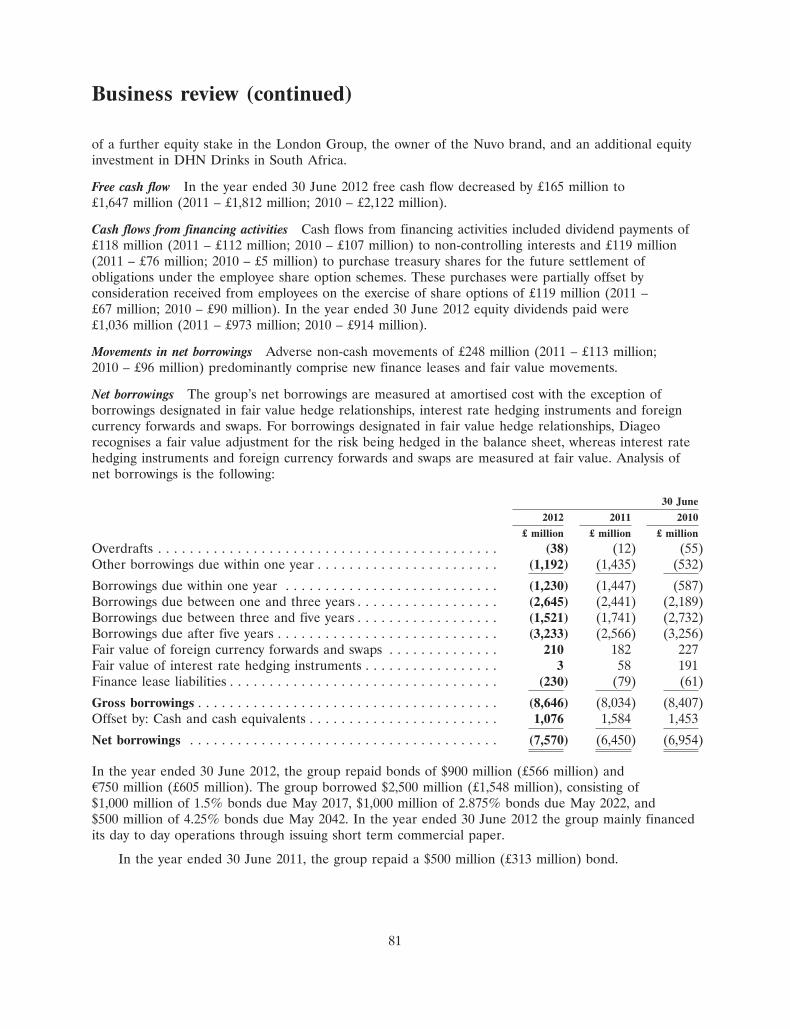
Business review (continued)
of a further equity stake in the London Group, the owner of the Nuvo brand, and an additional equityinvestment in DHN Drinks in South Africa.
Free cash flow In the year ended 30 June 2012 free cash flow decreased by £165 million to£1,647 million (2011 – £1,812 million; 2010 – £2,122 million).
Cash flows from financing activities Cash flows from financing activities included dividend payments of£118 million (2011 – £112 million; 2010 – £107 million) to non-controlling interests and £119 million(2011 – £76 million; 2010 – £5 million) to purchase treasury shares for the future settlement ofobligations under the employee share option schemes. These purchases were partially offset byconsideration received from employees on the exercise of share options of £119 million (2011 –£67 million; 2010 – £90 million). In the year ended 30 June 2012 equity dividends paid were£1,036 million (2011 – £973 million; 2010 – £914 million).
Movements in net borrowings Adverse non-cash movements of £248 million (2011 – £113 million;2010 – £96 million) predominantly comprise new finance leases and fair value movements.
Net borrowings The group’s net borrowings are measured at amortised cost with the exception ofborrowings designated in fair value hedge relationships, interest rate hedging instruments and foreigncurrency forwards and swaps. For borrowings designated in fair value hedge relationships, Diageorecognises a fair value adjustment for the risk being hedged in the balance sheet, whereas interest ratehedging instruments and foreign currency forwards and swaps are measured at fair value. Analysis ofnet borrowings is the following:
30 June
2012 2011 2010
£ million £ million £ million
Overdrafts . . . . . . . . . . . . . . . . . . . . . . . . . . . . . . . . . . . . . . . . . . . (38) (12) (55)Other borrowings due within one year . . . . . . . . . . . . . . . . . . . . . . . (1,192) (1,435) (532)
Borrowings due within one year . . . . . . . . . . . . . . . . . . . . . . . . . . . (1,230) (1,447) (587)Borrowings due between one and three years . . . . . . . . . . . . . . . . . . (2,645) (2,441) (2,189)Borrowings due between three and five years . . . . . . . . . . . . . . . . . . (1,521) (1,741) (2,732)Borrowings due after five years . . . . . . . . . . . . . . . . . . . . . . . . . . . . (3,233) (2,566) (3,256)Fair value of foreign currency forwards and swaps . . . . . . . . . . . . . . 210 182 227Fair value of interest rate hedging instruments . . . . . . . . . . . . . . . . . 3 58 191Finance lease liabilities . . . . . . . . . . . . . . . . . . . . . . . . . . . . . . . . . . (230) (79) (61)
Gross borrowings . . . . . . . . . . . . . . . . . . . . . . . . . . . . . . . . . . . . . . (8,646) (8,034) (8,407)Offset by: Cash and cash equivalents . . . . . . . . . . . . . . . . . . . . . . . . 1,076 1,584 1,453
Net borrowings . . . . . . . . . . . . . . . . . . . . . . . . . . . . . . . . . . . . . . . (7,570) (6,450) (6,954)
In the year ended 30 June 2012, the group repaid bonds of $900 million (£566 million) andA750 million (£605 million). The group borrowed $2,500 million (£1,548 million), consisting of$1,000 million of 1.5% bonds due May 2017, $1,000 million of 2.875% bonds due May 2022, and$500 million of 4.25% bonds due May 2042. In the year ended 30 June 2012 the group mainly financedits day to day operations through issuing short term commercial paper.
In the year ended 30 June 2011, the group repaid a $500 million (£313 million) bond.
81
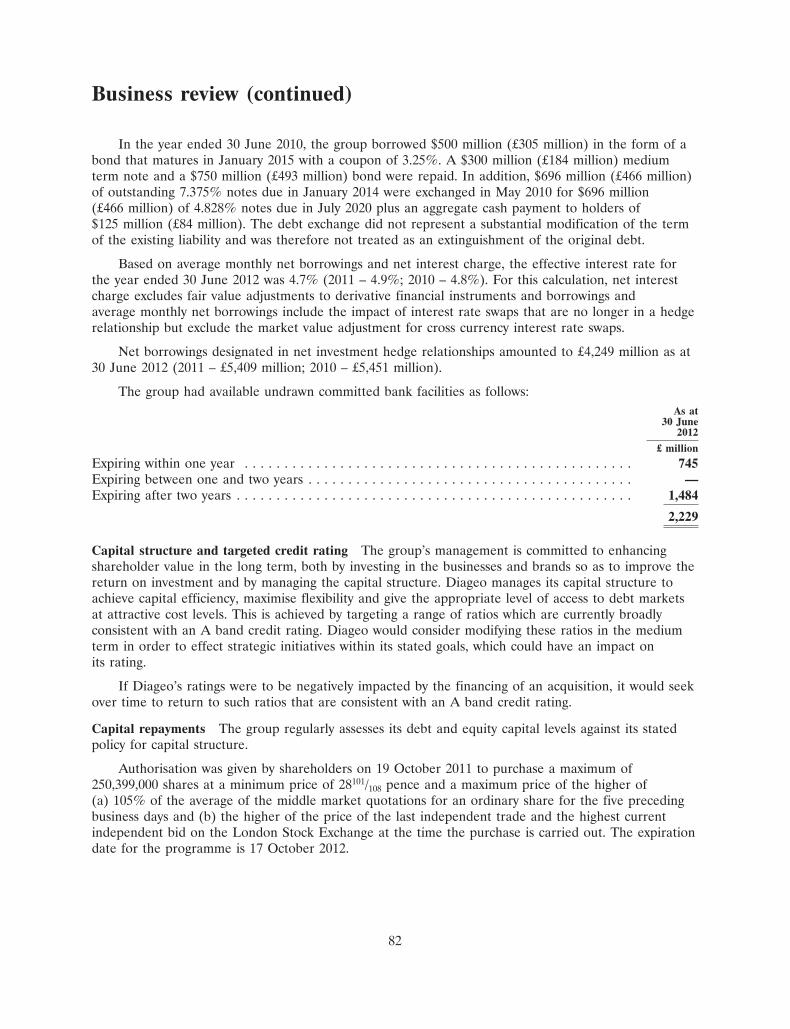
Business review (continued)
In the year ended 30 June 2010, the group borrowed $500 million (£305 million) in the form of abond that matures in January 2015 with a coupon of 3.25%. A $300 million (£184 million) mediumterm note and a $750 million (£493 million) bond were repaid. In addition, $696 million (£466 million)of outstanding 7.375% notes due in January 2014 were exchanged in May 2010 for $696 million(£466 million) of 4.828% notes due in July 2020 plus an aggregate cash payment to holders of$125 million (£84 million). The debt exchange did not represent a substantial modification of the termof the existing liability and was therefore not treated as an extinguishment of the original debt.
Based on average monthly net borrowings and net interest charge, the effective interest rate forthe year ended 30 June 2012 was 4.7% (2011 – 4.9%; 2010 – 4.8%). For this calculation, net interestcharge excludes fair value adjustments to derivative financial instruments and borrowings andaverage monthly net borrowings include the impact of interest rate swaps that are no longer in a hedgerelationship but exclude the market value adjustment for cross currency interest rate swaps.
Net borrowings designated in net investment hedge relationships amounted to £4,249 million as at30 June 2012 (2011 – £5,409 million; 2010 – £5,451 million).
The group had available undrawn committed bank facilities as follows:As at
30 June2012
£ million
Expiring within one year . . . . . . . . . . . . . . . . . . . . . . . . . . . . . . . . . . . . . . . . . . . . . . . . . 745Expiring between one and two years . . . . . . . . . . . . . . . . . . . . . . . . . . . . . . . . . . . . . . . . . —Expiring after two years . . . . . . . . . . . . . . . . . . . . . . . . . . . . . . . . . . . . . . . . . . . . . . . . . . 1,484
2,229
Capital structure and targeted credit rating The group’s management is committed to enhancingshareholder value in the long term, both by investing in the businesses and brands so as to improve thereturn on investment and by managing the capital structure. Diageo manages its capital structure toachieve capital efficiency, maximise flexibility and give the appropriate level of access to debt marketsat attractive cost levels. This is achieved by targeting a range of ratios which are currently broadlyconsistent with an A band credit rating. Diageo would consider modifying these ratios in the mediumterm in order to effect strategic initiatives within its stated goals, which could have an impact onits rating.
If Diageo’s ratings were to be negatively impacted by the financing of an acquisition, it would seekover time to return to such ratios that are consistent with an A band credit rating.
Capital repayments The group regularly assesses its debt and equity capital levels against its statedpolicy for capital structure.
Authorisation was given by shareholders on 19 October 2011 to purchase a maximum of250,399,000 shares at a minimum price of 28101/108 pence and a maximum price of the higher of(a) 105% of the average of the middle market quotations for an ordinary share for the five precedingbusiness days and (b) the higher of the price of the last independent trade and the highest currentindependent bid on the London Stock Exchange at the time the purchase is carried out. The expirationdate for the programme is 17 October 2012.
82

Business review (continued)
Capital commitments
Other capital commitments not provided for at 30 June 2012 are estimated at £145 million (2011 –£148 million; 2010 – £112 million). Diageo management believes that it has sufficient funding for itsworking capital requirements.
Other contractual obligationsPayments due by period
Less than More than1 year 1-3 years 3-5 years 5 years Total
£ million £ million £ million £ million £ million
As at 30 June 2012Long term debt obligations . . . . . . . . . . . . . . . . . 1,025 2,590 1,511 3,155 8,281Interest obligations . . . . . . . . . . . . . . . . . . . . . . . 442 663 392 1,399 2,896Credit support obligations . . . . . . . . . . . . . . . . . . 130 — — — 130Operating leases . . . . . . . . . . . . . . . . . . . . . . . . . 94 156 100 325 675Purchase obligations . . . . . . . . . . . . . . . . . . . . . . 754 434 153 9 1,350Finance leases . . . . . . . . . . . . . . . . . . . . . . . . . . 39 72 57 165 333Deferred consideration payable . . . . . . . . . . . . . . 24 20 149 — 193Provisions and other non-current payables . . . . . . 124 166 61 134 485
2,632 4,101 2,423 5,187 14,343
Long term debt obligations comprise the principal amount of borrowings (excluding foreign currencyswaps) with an original maturity of greater than one year. Interest obligations comprise interest payableon these borrowings. Where interest payments are on a floating rate basis, rates of each cash flow untilmaturity of the instruments are calculated based on the forward yield curve prevailing at 30 June 2012.Credit support obligations represent liabilities to counterparty banks in respect of cash received ascollateral under credit support agreements. Purchase obligations include various long term purchasecontracts entered into for the supply of certain raw materials, principally bulk whisky, grapes, cereals,cans and glass bottles. The contracts are used to guarantee supply of raw materials over the long termand to enable more accurate predictions of future costs. Provisions and other non-current payablesexclude £7 million in respect of vacant properties.
Potential income tax exposures included within corporate tax payable of £317 million and deferredtax liabilities are not included in the table above, as the ultimate timing of settlement cannot bereasonably estimated.
Post employment benefit liabilities are also not included in the table above. The group makesservice-based cash contributions to the UK Scheme which in the year ending 30 June 2013, areexpected to be approximately £45 million. In addition, during the year ended 30 June 2011, thecompany agreed a deficit funding plan with the trustee of the UK Scheme based on the trustee’sactuarial valuation at 31 March 2009 which provided for annual payments of approximately £25 millionto be made to the UK Scheme. In 2024, depending upon the funding position of the UK Scheme atthat time, the group will be required to pay an amount that is expected to be no greater than thedeficit at that time, up to a maximum £430 million in cash, to the UK Scheme. In addition, as part ofthis funding plan, the company agreed to make conditional contributions into escrow of up to£338 million if an equivalent reduction in the deficit is not achieved over the 10 year term of thefunding plan. The triennial valuation as at 31 March 2012 is in progress and may result in the paymentof up to £127 million in three equal annual instalments, into escrow.
83

Business review (continued)
Diageo also agreed a deficit funding arrangement with the trustee in respect of the GuinnessIreland Group Pension Scheme (the Irish Scheme). This deficit funding arrangement is expected toresult in additional annual contributions to the Irish Scheme of approximately A21 million (£17 million)until the year ending 30 June 2029, and provides for additional cash contributions into escrow of up toA188 million (£152 million) if an equivalent reduction in the deficit is not achieved over the 18 yearperiod. The first contribution was made in the year ended 30 June 2011. In addition to the deficitfunding the group expects to make cash contributions of A29 million (£23 million) to the Irish Schemein the year ending 30 June 2013. Contributions to other plans in the year ending 30 June 2013 areexpected to be approximately £90 million.
Capital commitments at 30 June 2012 are excluded from the table above.
Post balance sheet events
On 9 August 2012, Diageo completed the acquisition of 100% of the equity of Ypioca Bebidas S.A.(Ypioca) from Ypioca Agroindustrial Limitada for a cash consideration of BRL 900 million(£284 million). Ypioca is a leading producer and distributor of a cachaca brand, Ypioca in Brazil.See note 30 to the consolidated financial statements for further details.
Off-balance sheet arrangements
Neither Diageo plc nor any member of the Diageo group has any off-balance sheet financingarrangements that currently have or are reasonably likely to have a material future effect on thegroup’s financial condition, changes in financial condition, results of operations, liquidity, capitalexpenditure or capital resources.
Risk management
The group’s funding, liquidity and exposure to foreign currency and interest rate risks are managed bythe group’s treasury department. The treasury department uses a range of financial instruments tomanage these underlying risks.
Treasury operations are conducted within a framework of board approved policies and guidelines,which are recommended and subsequently monitored by the finance committee. This committee isdescribed in the corporate governance report. The policies and guidelines include benchmark exposureand/or hedge cover levels for key areas of treasury risk. The benchmarks, hedge cover levels and overallappropriateness of Diageo’s risk management policies are reviewed by the board following, forexample, significant business, strategic or accounting changes. The framework provides for limiteddefined levels of flexibility in execution to allow for the optimal application of the board-approvedstrategies. Transactions arising on the application of this flexibility may give rise to exposures differentfrom the defined benchmark levels that are separately monitored on a daily basis using value at riskanalysis. These transactions are carried at fair value and gains or losses are taken to the incomestatement as they arise.
The finance committee receives monthly reports on the activities of the treasury department,including any exposures different from the defined benchmarks.
The group purchases insurance for commercial or, where required, for legal or contractual reasons.In addition, the group retains insurable risk where external insurance is not considered an economicmeans of mitigating these risks.
84

Business review (continued)
For a detailed analysis of the group’s funding, liquidity and exposure to foreign exchange andinterest rate risks see note 23 to the consolidated financial statements.
Critical accounting policies
This section on critical accounting policies forms part of the audited financial statements.
The consolidated financial statements are prepared in accordance with IFRS. Diageo’s accountingpolicies are set out in the notes to the consolidated financial statements. In applying these policies, thedirectors are required to make estimates and subjective judgements that may affect the reportedamounts of assets and liabilities at the balance sheet date and reported profit for the year. Thedirectors base these on a combination of past experience and any other evidence that is relevant to theparticular circumstance. The actual outcome could differ from those estimates. Of Diageo’s accountingpolicies, the directors consider that policies in relation to the following areas are particularly subject toestimates and the exercise of judgement.
Brands, goodwill and other intangibles Acquired intangible assets are held on the consolidatedbalance sheet at cost. Where these assets are regarded as having indefinite useful economic lives, theyare not amortised. Assessment of the useful economic life of an asset, or that an asset has an indefinitelife, requires management judgement.
Impairment reviews are carried out to ensure that intangible assets, including brands, are notcarried at above their recoverable amounts. In particular, the group performs a discounted cash flowanalysis at least annually to compare discounted estimated future operating cash flows to the netcarrying value of each acquired brand. The analysis is based on forecast cash flows with terminal valuesbeing calculated using the long term growth rate (the long term inflation rate of the country) of theprincipal markets in which the majority of the profits of each brand are or will be generated. Theestimated cash flows are discounted at the weighted average cost of capital reflecting the industry andcountry specific risks in the relevant country.
In assessing whether goodwill is carried at above its recoverable amount, a discounted cash flowanalysis is performed annually to compare the discounted estimated future operating cash flows of cashgenerating units of the group to the net assets attributable to the cash generating units includinggoodwill. The discounted cash flow review for goodwill is consistent with the brand review in its use ofestimated future operating cash flows, weighted average cost of capital for the cash generating unitconcerned and long term growth rates.
The tests are dependent on management’s estimates and judgements, in particular in relation tothe forecasting of future cash flows, the discount rates applied to those cash flows and the expectedlong term growth rates. Such estimates and judgements are subject to change as a result of changingeconomic conditions. Management attempts to make the most appropriate estimates, but actual cashflows and rates may be different.
See note 11 to the consolidated financial statements for the impact of a change in the keyassumptions to the more sensitive brands.
Post employment benefits Diageo accounts for post employment benefits in accordance with IAS 19 –Employee benefits. Application of IAS 19 requires the exercise of judgement in relation to variousassumptions including future pay rises in excess of inflation, employee and pensioner demographics andthe future expected returns on assets.
85

Business review (continued)
Diageo determines the assumptions to be adopted in discussion with its actuaries, and believesthese assumptions to be in line with UK practice generally, but the application of different assumptionscould have a significant effect on the amounts reflected in the income statement, other comprehensiveincome and balance sheet in respect of post employment benefits. The assumptions vary among thecountries in which the group operates, and there may be an interdependency between some of theassumptions. The major assumptions used by the group for the three years ended 30 June 2012 are setout in note 4 to the consolidated financial statements and the sensitivity to these assumptions are givenin note 4(h) to the consolidated financial statements.
Exceptional items These are items which, in management’s judgement, need to be disclosed by virtueof their size or incidence in order for the user to obtain a proper understanding of the financialinformation. The determination of which items are separately disclosed as exceptional items requires asignificant degree of judgement.
Taxation The group is required to estimate the corporate tax in each of the jurisdictions in which itoperates. This requires an estimation of the current tax liability together with an assessment of thetemporary differences which arise as a consequence of different accounting and tax treatments. Thesetemporary differences result in deferred tax assets or liabilities which are included within the balancesheet. Deferred tax assets and liabilities are calculated on the basis of taxation substantively enacted atthe balance sheet date. Deferred tax assets are not recognised where it is more likely than not that theasset will not be realised in the future. This evaluation requires judgements to be made including theforecast of future taxable income.
Tax benefits are not recognised unless it is probable that the tax positions are sustainable. Onceconsidered to be probable, management reviews each material tax benefit to assess whether a provisionshould be taken against full recognition of the benefit on the basis of potential settlement throughnegotiation and/or litigation.
The group operates in many countries in the world and is subject to many tax jurisdictions andrules. As a consequence the group is subject to tax audits, which by their nature are often complex andcan require several years to conclude. Management judgement is required to determine the totalprovision for income tax. Amounts accrued are based on management’s interpretation of countryspecific tax law and the likelihood of settlement. However the actual tax liabilities could differ from theprovision and in such event the group would be required to make an adjustment in a subsequent periodwhich could have a material impact on the group’s profit and loss and/or cash position.
New accounting standards
During the year a number of accounting standards, amendments and interpretations have been issuedby the IASB or IFRIC. Those that are of relevance to the group are discussed in note 1 to theconsolidated financial statements.
86

Board of directors and company secretary
Dr Franz B Humer Chairman, Non-executive director3*, Swiss/Austrian (66)
Appointed chairman of Diageo plc in July 2008, having been a non-executive director since April2005. He is also chairman of F. Hoffmann-La Roche Ltd in Switzerland, chairman of INSEAD’s boardof directors and a non-executive director of CitiGroup Inc. He was formerly chief operating director ofGlaxo Holdings plc and has held a number of other non-executive directorships.
Paul S Walsh Chief executive officer, executive director2*, British (57)
Appointed chief executive of Diageo plc in September 2000. He has served in a number ofmanagement roles since joining GrandMet’s brewing division in 1982, including chief executive officerof The Pillsbury Company. He was appointed to the GrandMet board in October 1995 and to theDiageo plc board in December 1997. He is lead non-executive and deputy chair of the board of theDepartment of Energy and Climate Change, a non-executive director of Avanti CommunicationGroup plc, a non-executive director of Unilever PLC and a non-executive director of FedExCorporation in the United States. He was appointed a business ambassador on the UK Government’sBusiness Ambassador network on 9 August 2012 and is also a member of the UK Government’sBusiness Advisory Group and a member of the Council of the Scotch Whisky Association.
Deirdre Mahlan Chief financial officer, executive director2, American (50)
Appointed chief financial officer and a director of Diageo plc in October 2010, prior to which shewas deputy chief financial officer and before that head of tax and treasury. She joined the company in2001, having held various senior finance positions in Joseph E Seagram & Sons Inc since 1992 andhaving formerly been a senior manager with Pricewaterhouse. She was appointed as a non-executivedirector of Experian plc with effect from September 2012 and is also a member of the Main Committeeof the 100 Group of Finance Directors.
Ivan Menezes Chief operating officer2, Executive director, American/British (53)
Appointed a director of Diageo plc in July 2012 and appointed chief operating officer in March2012 having been president, North America since January 2004, chairman, Diageo Asia Pacific sinceOctober 2008 and chairman, Diageo Latin America and Caribbean since July 2011. Formerly he heldvarious senior management positions with Guinness and then Diageo and worked across a variety ofsales, marketing and strategy roles with Nestle in Asia, Booz Allen Hamilton Inc in the United Statesand Whirlpool in Europe. He is also a non-executive director of Coach Inc., in the United States.
Lord Davies of Abersoch Senior non-executive director1,3,4*, British (59)
Appointed a non-executive director of Diageo plc in September 2010 and senior non-executivedirector and chairman of the remuneration committee in October 2011. Lord Davies is a partner ofCorsair Capital, non executive chairman of Pinebridge Investments Limited and chair of the advisoryboard of Moelis & Co. He is also a trustee of the Royal Academy of Arts and chair of the Council,University of Wales Bangor. Previously he was a non-executive director of Bharti Airtel Limited,Minister for Trade, Investment and Small Business for the UK Government between January 2009 andMay 2010 and prior to this role, Lord Davies was chairman of Standard Chartered PLC.
87

Board of directors and company secretary (continued)
Peggy B Bruzelius Non-executive director1,3,4, Swedish (62)
Appointed a non-executive director of Diageo plc in April 2009. She is chairman of Lancelot AssetManagement in Sweden and sits on the boards of Akzo Nobel NV in the Netherlands, Syngenta AG inSwitzerland, Axfood AB and Skandia Mutual Life Insurance AB, both in Sweden. She was formerlymanaging director of ABB Financial Services AB, headed the asset management arm of SkandinaviskaEnskilda Banken AB and a non-executive director of Scania AB.
Laurence M Danon Non-executive director1,3,4, French (56)
Appointed a non-executive director of Diageo plc in January 2006. She is chairman of theexecutive board of Edmond de Rothschild Corporate Finance and a non-executive director of GroupeBPCE and TF1, both in France. Formerly she served with the French Ministry of Industry and Energy,held a number of senior management posts with Total Fina Elf and was chairman and chief executiveofficer of France Printemps. She was also a non-executive director of Experian Group Limited, PlasticOmnium SA and Rhodia SA.
Betsy D Holden Non-executive director1,3,4, American (56)
Appointed a non-executive director of Diageo in September 2009. She is a senior adviser toMcKinsey & Company and holds non-executive directorships of Tribune Company and Western UnionCompany, both in the United States. She is a member of the board of trustees at Duke University anda member of the Dean’s advisory board at the Kellogg School of Management. She was formerlypresident, global marketing and category development and co-chief executive officer of KraftFoods, Inc.
Philip G Scott Non-executive director1*,3,4, British (58)
Appointed a non-executive director of Diageo plc and chairman of the Audit Committee inOctober 2007. He is the president of the Institute and Faculty of Actuaries and is a non-executivedirector of the Royal Bank of Scotland Group plc. He was previously chief financial officer ofAviva plc.
H Todd Stitzer Non-executive director1,3,4, American (60)
Appointed a non-executive director of Diageo plc in June 2004. He is chairman and anon-executive director of Signet Limited and a non-executive director of Massachusetts Mutual LifeInsurance Company. He is also a member of the advisory board of Hamlin Capital Management, LLC,a New York based investment advisory firm, and a member of the advisory committee of Virgin GroupHoldings Limited. He was previously chief executive of Cadbury plc.
Paul D Tunnacliffe Company secretary, British (50)
Appointed company secretary of Diageo plc in January 2008. He was formerly company secretaryof Hanson PLC.
Key to committees:1 Audit2 Executive (comprising senior management)3 Nomination4 Remuneration
* Chairman of committee
88
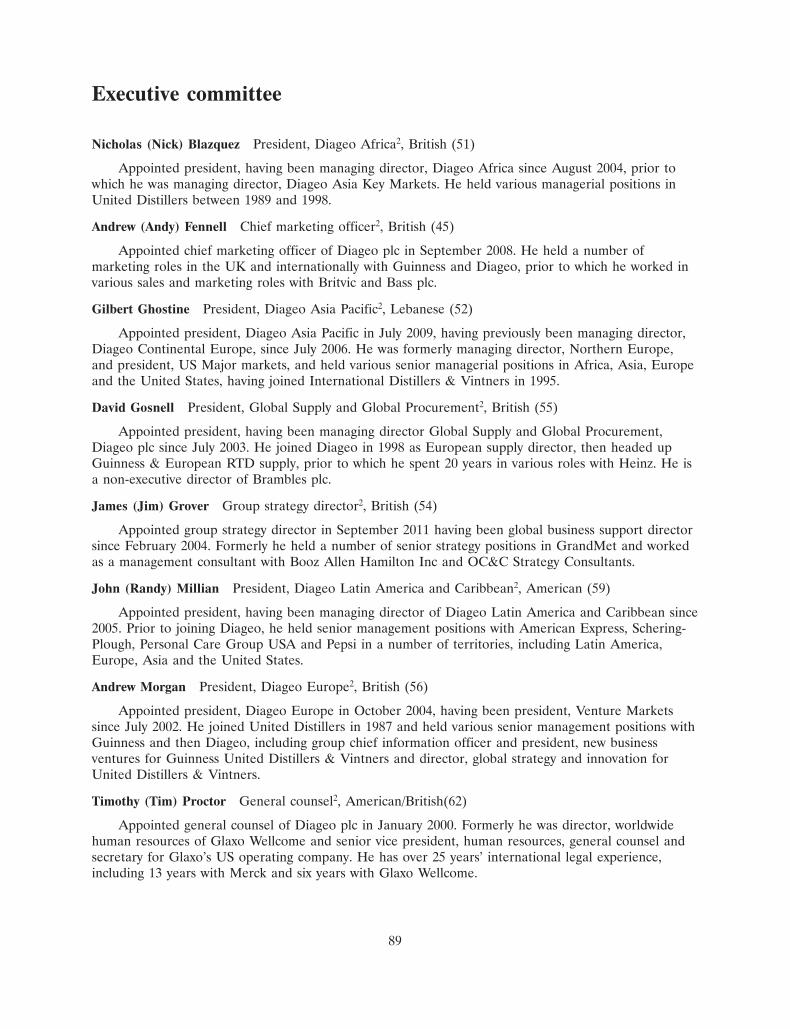
Executive committee
Nicholas (Nick) Blazquez President, Diageo Africa2, British (51)
Appointed president, having been managing director, Diageo Africa since August 2004, prior towhich he was managing director, Diageo Asia Key Markets. He held various managerial positions inUnited Distillers between 1989 and 1998.
Andrew (Andy) Fennell Chief marketing officer2, British (45)
Appointed chief marketing officer of Diageo plc in September 2008. He held a number ofmarketing roles in the UK and internationally with Guinness and Diageo, prior to which he worked invarious sales and marketing roles with Britvic and Bass plc.
Gilbert Ghostine President, Diageo Asia Pacific2, Lebanese (52)
Appointed president, Diageo Asia Pacific in July 2009, having previously been managing director,Diageo Continental Europe, since July 2006. He was formerly managing director, Northern Europe,and president, US Major markets, and held various senior managerial positions in Africa, Asia, Europeand the United States, having joined International Distillers & Vintners in 1995.
David Gosnell President, Global Supply and Global Procurement2, British (55)
Appointed president, having been managing director Global Supply and Global Procurement,Diageo plc since July 2003. He joined Diageo in 1998 as European supply director, then headed upGuinness & European RTD supply, prior to which he spent 20 years in various roles with Heinz. He isa non-executive director of Brambles plc.
James (Jim) Grover Group strategy director2, British (54)
Appointed group strategy director in September 2011 having been global business support directorsince February 2004. Formerly he held a number of senior strategy positions in GrandMet and workedas a management consultant with Booz Allen Hamilton Inc and OC&C Strategy Consultants.
John (Randy) Millian President, Diageo Latin America and Caribbean2, American (59)
Appointed president, having been managing director of Diageo Latin America and Caribbean since2005. Prior to joining Diageo, he held senior management positions with American Express, Schering-Plough, Personal Care Group USA and Pepsi in a number of territories, including Latin America,Europe, Asia and the United States.
Andrew Morgan President, Diageo Europe2, British (56)
Appointed president, Diageo Europe in October 2004, having been president, Venture Marketssince July 2002. He joined United Distillers in 1987 and held various senior management positions withGuinness and then Diageo, including group chief information officer and president, new businessventures for Guinness United Distillers & Vintners and director, global strategy and innovation forUnited Distillers & Vintners.
Timothy (Tim) Proctor General counsel2, American/British(62)
Appointed general counsel of Diageo plc in January 2000. Formerly he was director, worldwidehuman resources of Glaxo Wellcome and senior vice president, human resources, general counsel andsecretary for Glaxo’s US operating company. He has over 25 years’ international legal experience,including 13 years with Merck and six years with Glaxo Wellcome.
89

Executive committee (continued)
Larry Schwartz President, Diageo North America2, American (59)
Appointed president, Diageo North America in 2012 having been president, Diageo USA sinceSeptember 2008. He joined the company in 2001, as president of Joseph E Seagram & Sons, havingheld a variety of senior management positions with Seagram.
Gareth Williams Human Resources director2, British (59)
Appointed human resources director in January 1999. Formerly he held a number of seniorpersonnel management positions with GrandMet and then United Distillers & Vintners and spent10 years with Ford of Britain in a number of personnel and employee relations positions.
Ian Wright Corporate Relations director2, British (54)
Appointed corporate relations director of Diageo plc in July 2004, having previously held positionswith a number of public relations consultancies and The Boots Company.
Key to committees:2 Executive (comprising senior management)
90

Directors’ remuneration report
Dear Shareholder
I am pleased to present the directors’ remuneration report for the year ended 30 June 2012. In myfirst year as the chairman of the remuneration committee, I have taken the opportunity to complete athorough review of the company’s executive remuneration arrangements, with a focus on competitivepay and the link to performance. Whilst I am satisfied that the arrangements we have in place areappropriate and that rewards received under the company’s incentive plans reflect performancedelivered, the committee will review the remuneration arrangements in more detail during the newfinancial year to ensure they continue to incentivise our performance goals through simple, transparentlinks to our strategic objectives.
I have also engaged directly with a wide range of shareholders and their representative bodies inorder to understand their perspectives on the company’s reward schemes and to foster robust two-waydialogue. The remuneration committee has considered how we can respond to these differentperspectives and, at the same time, maintain a competitive and relevant approach to the remunerationof our executive directors and senior management team. We have, as a result, sought opportunities toimprove transparency in our disclosures both on the processes and governance supporting the executionof executive remuneration at Diageo, and on the targets and outcomes for the measures associated withthe company’s incentive plans. Other key actions and decisions that we have taken during thefinancial year include:
• Introducing a clawback condition to future long term incentive awards that enables thecommittee to reduce unvested awards in circumstances that result in performance beingmaterially adversely impacted. As a result of discussions during the recent consultation with ourshareholders, a clawback provision is also being introduced into the bonus arrangements for theexecutive directors. These are the only changes to remuneration policy being put into effect atthis time.
• Increasing targets for the measures used in the long term incentive plans to ensure that theyremain appropriately stretching in the context of both the company’s current medium termoutlook and the difficulties and uncertainties in the wider macro-economic environment. Inresponse to shareholder requests for greater visibility, we will disclose targets for the company’sPerformance Share Plan at the start of the performance period in the directors’ remunerationreport going forward.
As described in the ‘Business review’, the company has delivered strong year on year organic topline growth, profit growth and margin expansion in the year ended 30 June 2012, and has also delivereda high level of free cash flow. This performance reflects an improved growth trajectory and deliveryagainst the commitment to deliver growth efficiently, and, consequently, positions the business well forthe future. The combination of strong company and individual performance has resulted in an abovetarget outcome for the short term incentive plan with the chief executive (CEO) and chief financialofficer (CFO) receiving a bonus in September equivalent to 148% and 146% of base pay, respectively.In view of the company’s strong results, I am satisfied that this is appropriate.
The company has similarly delivered strong three year total shareholder return performancerelative to its peer group for the performance period that ended on 30 June 2012, resulting in Diageoplacing fifth out of 16 companies. Consequently, 65% of the performance shares awarded in September2009 will vest in September 2012. For share options awarded in September 2009, three year compoundannual growth in adjusted earnings per share has exceeded the maximum target at 10.2% (equivalent tototal growth over three years of 33.9%) and, consequently, the options will vest in full in September
91
Directors’ remuneration report (continued)
2012. Over the same period, Diageo’s share price grew by 88%, from 871 pence to 1641 pence and thecompany paid a total dividend of 117 pence per share. I am comfortable, therefore, that these incentiveplan outcomes fairly reflect the strong performance delivered for our shareholders.
Finally, we have made some changes to the structure and layout of the directors’ remunerationreport this year to improve transparency and to provide additional information about how ourremuneration arrangements are aligned with our strategy. In addition, in line with emerging guidancefrom the United Kingdom government and the Financial Reporting Council, we have introduced a newtable at the start of the report that summarises the annual earnings of the executive directorsculminating in a ‘single remuneration figure’. We hope that this evolution of our disclosure practicehelps to create a fuller understanding of our reward practices and forms a transparent basis forengagement with our key stakeholders going forward.
We look forward to receiving your support at the AGM in October 2012.
Lord Davies of Abersoch
Senior independent non-executive director and chairman of the remuneration committee
Executive directors’ remuneration summary for the year ended 30 June 2012 (unaudited)
Performance highlights
• 2012 annual bonus payout is marginally lower than in 2011 despite higher growth rates havingbeen delivered on sales (6%) and profit (9%).
• For the first time since 2008, both share plans will vest together, driven by financial performanceand substantial share price growth over the last three years.
• Over the performance period 1 July 2009 to 30 June 2012:
• Diageo has generated £8.8 billion in profit and over £30 billion in sales.
• The share price has increased by 88% resulting in an increase in Diageo’s marketcapitalisation of over £19 billion to £42 billion.
• Diageo has paid a total dividend of 117 pence per share to shareholders.
• Diageo has achieved its best position in its peer group for total shareholder return since2005.
92

Directors’ remuneration report (continued)
PS Walsh
• Base salary to be held flat for the CEO in the annual salary review for the year ending 30 June2013.
• 72% of the CEO’s total remuneration is linked to share price performance.
% of total % of totalPS Walsh 2012 pay 2011 pay Commentary
£000 £000Total fixed pay . . . . . . . . . . . . . . . . 1,278 12% 1,299 29% Representing base salary and benefits
earned in the year ended 30 June 2012.
Annual bonus . . . . . . . . . . . . . . . . . 1,821 16% 1,884 43% Exceeded target on all financialmeasures and individual objectives.
Sub total – short term remuneration(cash) . . . . . . . . . . . . . . . . . . . . 3,099 28% 3,183 72%
Long term incentive plan –performance element(a) . . . . . . . . . 3,060 27% 0 0% Represents the value of long term
incentives vesting for the performanceperiod 2009 – 2012 as a result ofoutperformance of the peer group ontotal shareholder return.
Long term incentive plan – shareappreciation element(b) . . . . . . . . . 5,055 45% 1,266 28% Represents the impact of the significant
increase in Diageo’s share price sinceaward in 2009.
Sub total – long term share price basedremuneration (non-cash) . . . . . . . . 8,115 72% 1,266 28%
Total . . . . . . . . . . . . . . . . . . . . . . 11,214 100% 4,449 100%
93

28AUG201217275442 28AUG201217274934
Directors’ remuneration report (continued)
D Mahlan
• Base salary to be increased by 8.8% in the annual salary review for the year ending 30 June2013, offset by a reduction in the value of the pension cash supplement from 40% to 35% ofbase salary. The overall increase to fixed pay is 5%.
% of total % of totalD Mahlan 2012 pay 2011(c) pay Commentary
£000 £000Total fixed pay . . . . . . . . . . . . . . . . 887 28% 757 40% Representing base salary, benefits and
cash supplement in lieu of pensionearned in the year ended 30 June 2012.
Annual bonus . . . . . . . . . . . . . . . . 912 28% 920 48% Exceeded target on all financialmeasures and individual objectives.
Sub total – short term remuneration(cash) . . . . . . . . . . . . . . . . . . . . 1,799 56% 1,677 88%
Long term incentive plan –performance element(a) . . . . . . . . 517 16% 0 0% Represents the value of long term
incentives vesting for the performanceperiod 2009 – 2012 as a result ofoutperformance of the peer group ontotal shareholder return.
Long term incentive plan – shareappreciation element(b) . . . . . . . . . 891 28% 230 12% Represents the impact of the significant
increase in Diageo’s share price sinceaward in 2009.
Sub total – long term share price basedremuneration (non-cash) . . . . . . . . 1,408 44% 230 12%
Total . . . . . . . . . . . . . . . . . . . . . . 3,207 100% 1,907 100%
Proposition of LTIPs vesting attributable to share price appreciation
PS Walsh D Mahlan
Shares
Options
0 1,000 2,000 3,000 6,000
3,060 2,294
2,761
4,000 5,000Thousands
Performance element Share appreciation element
Shares
Options
0 200 400 600 1,000
517 387
504
800Thousands
Performance element Share appreciation element
Notes to tables
(a) Performance element – The options vesting and performance shares due to be released in September 2012 at the grantprice after applying the performance condition.
(b) Share appreciation element – The estimated additional value generated through share price growth for options vesting andperformance shares due to be released in September 2012 at the average market value of Diageo shares between 1 Apriland 30 June 2012 of 1559 pence. The estimated share price used is in line with the principles for estimating the gains for
94

Directors’ remuneration report (continued)
awards vesting after publication of the annual report as outlined by the Financial Reporting Lab on ‘A single figure forremuneration’.
(c) For the purposes of year on year comparison, 2011 numbers for the CFO include earnings prior to her appointment to theboard. The disclosure in the 2011 directors’ remuneration report was on a pro-rata basis from her date of appointment tothe board. The long term incentive awards vesting in September 2012 were awarded to the CFO prior to her appointmentto the board.
New executive director appointment
As announced on 2 July 2012, the company has appointed Ivan Menezes, chief operatingofficer (COO), to Diageo’s board with effect from 2 July 2012. Subject to shareholder approval,I Menezes will be formally appointed as a director at the company’s AGM on 17 October 2012. It isproposed that I Menezes is paid a base salary of $1,400,000 per annum and that he will participate inthe annual bonus and long term incentive plans on the same basis as the CEO.
Governance
What is the role of the remuneration committee? The remuneration committee consists of thefollowing independent non-executive directors: PB Bruzelius, LM Danon, Lord Davies, BD Holden,PG Scott, HT Stitzer, Lord Hollick (retired 19 October 2011) and P Walker (retired 19 October 2011).Lord Davies is the chairman of the remuneration committee. With effect from 1 October 2012,Mr Ho KwonPing will also become a member of the remuneration committee, subject to shareholderapproval of his appointment at the company’s AGM on 17 October 2012. The chairman of the boardand the CEO may, by invitation, attend remuneration committee meetings except when their ownremuneration is discussed.
The remuneration committee’s principal responsibilities are:
• making recommendations to the board on remuneration policy as applied to the executivedirectors and the executive committee;
• setting, reviewing and approving individual remuneration arrangements for the chairman of theboard, executive directors and executive committee members including terms and conditions ofemployment;
• determining arrangements in relation to termination of employment of each executive directorand other designated senior executives; and
• making recommendations to the board concerning the introduction of any new share incentiveplans which require approval by shareholders.
Full terms of reference for the committee are available at www.diageo.com and on request fromthe company secretary.
95

30AUG201216413456
Directors’ remuneration report (continued)
What has the remuneration committee done during the year? The remuneration committee met fivetimes during the year to consider and, where applicable, approve key remuneration items including thefollowing:
Governance and forward planning• Reviewed AGM outcomes and
feedback from institutional shareholders, giving consideration to implications for future remuneration policy.
• Reviewed updated United Kingdomgovernance requirements, including the government consultation on narrative reporting and executive remuneration; assessed Diageo’s compliance.
• Approved shareholder consultationapproach and extended invitation to meet with some of Diageo’s major shareholders.
• Reviewed and approved the directors’remuneration report taking into account feedback from shareholder meetings.
•
•
PayApproved methodology and
any benchmarking requirements.Reviewed and approved proposals for
and benefits).
approach to pay review and identified
salary reviews and any adjustments to other remuneration elements (e.g. levels of share award, pension
Incentive plans• Considered and approved plan
design, performance measures and targets to be used in short and long term incentive plans to ensure measures are aligned with strategy and that targets are appropriately stretching.
• Tracked performance for annualbonus and long term incentive measures during the year.
• Reviewed policy changes for thelong term incentives and approved introduction of a clawback condition for future awards.
• Reviewed year-end businessperformance and performance linked reward. Determined bonus payouts and vesting of long term incentives.
Further information on meetings held and director attendance is disclosed in the corporate governancereport.
Who provides advice to the remuneration committee? During the year ended 30 June 2012, theremuneration committee received advice from the following independent consultants:
• Deloitte LLP – provided advice on remuneration best practice and senior executiveremuneration. Deloitte LLP also provided a range of non-related tax, corporate finance andconsulting services during the year.
• Kepler Associates – reviewed and confirmed the TSR of Diageo and the peer group companiesfor the award under the September 2008 Performance Share Plan (for which the performancecycle ended on 30 June 2011) and provided periodic performance updates on all outstandingperformance cycles. After 30 June 2012, they also reviewed and confirmed the TSR outcome forthe award under the September 2009 Performance Share Plan (for which the performance cycleended on 30 June 2012). They provided no other services to Diageo during the year.
Additional remuneration survey data published by Aon Hewitt Associates, Towers Watson, andPricewaterhouseCoopers LLP were presented to the remuneration committee during the year.
Diageo’s human resources director and director of performance and reward were also invited bythe remuneration committee to provide their views and advice. The human resources director is notpresent when his own remuneration is discussed. The CFO may also attend to provide performancecontext to the committee during its discussions about target setting.
What was the outcome of the vote on the 2011 directors’ remuneration report at the company’s AGM?The 2011 directors’ remuneration report received a majority ‘for’ vote of 80% (2010 – 88%).
96
Directors’ remuneration report (continued)
How has the remuneration committee responded to shareholder feedback during the year? Thecommittee actively considered feedback received from shareholders prior to and following the2011 AGM and also closely monitored guidance and directional themes emerging from institutionalshareholder bodies and the United Kingdom government during the year on the subject of executiveremuneration. On the basis of this, the committee has taken the following actions:
• In response to shareholder requests for visibility of targets used in the performance share planat the start of the performance period, the remuneration committee will disclose targets forfuture awards in the relevant directors’ remuneration report.
• In line with guidance from institutional shareholders, the remuneration committee hasintroduced a clawback condition in the company’s long term incentive plans; this enables theremuneration committee to reduce unvested awards in circumstances that result in performancebeing materially adversely impacted. Following consultation with shareholders, a clawbackcondition will also be introduced to the annual bonus arrangements for executive directors.
• In view of the emerging desire for clearer narrative reporting, the remuneration committee hasreviewed the structure and content of the directors’ remuneration report with a view toimproving clarity and understanding. The remuneration committee expects this to be an ongoingevolving process as more details become available from the United Kingdom government on anychanges to remuneration disclosure requirements and legislative changes to shareholder votingrights in the United Kingdom following their consultations during the year on these topics.
The remuneration committee also provided the opportunity for some of Diageo’s majorshareholders and their representative bodies to meet with the remuneration committee chairman duringthe year to discuss remuneration matters generally.
What will the remuneration committee be focused on for the year ending 30 June 2013?
• Preparing for legislative changes on reporting requirements and shareholder voting rights to beimplemented by the United Kingdom government.
• Reviewing and assessing the ongoing appropriateness of current executive remuneration plandesign and target stretch.
• Ensuring that remuneration arrangements continue to attract and retain talent, and rewardcompany performance with a focus on maintaining the link between performance and reward.
• Understanding and responding to shareholder feedback and fostering more continuous opendialogue.
97

Directors’ remuneration report (continued)
What is the philosophy underpinning executive remuneration? The plans in which Diageo’s executivedirectors and senior management participate are designed to reflect the principles detailed below:
What Why How
Performance-related It influences and supports • Short and long termcompensation performance and the creation of incentives conditional upon
a high-performing organisation. achieving stretchingperformance targets.
Rewarding sustainable It is at the heart of Diageo’s • A combination of absoluteperformance corporate strategy and is vital to and relative performance
meeting stakeholder interests. measures for short and longterm incentives that reflectsustainable profit growth andunderlying financialperformance.
• Shareholding requirementsthat align the interests ofsenior executives with those ofshareholders and that are acondition of full participationin long term incentive plans.
Measuring performance over It aligns with the time cycle over • Long term incentives thatthree years which management decisions are comprise a combination of
reflected in the creation of value share option grants and sharein this business. awards in each year and vary
with three year eps, and TSR,organic net sales and organicoperating marginperformance, respectively.
Providing a balanced mix of It enables focus on long term • Base salary, benefits,remuneration value creation while avoiding retirement savings, short term
disproportionate risk-taking. cash incentives and long termequity incentives.
Providing a competitive total It helps Diageo attract and • Reward levels considered inremuneration opportunity retain the best global talent. the context of total
remuneration packages paidin relevant globalcomparators, reflecting thesize, complexity and globalscope of Diageo’s business.
Simplicity and transparency It allows targets to be • Targets that are within amotivating and demonstrably sphere of direct influence andlinked to company performance. that align with the company’s
short and long term goals.
98
28AUG201217275186
Directors’ remuneration report (continued)
How does executive remuneration link to business strategy? Diageo’s strategy is to drive top linegrowth and margin improvement in a sustainable and responsible way and to deliver consistent valuecreation for shareholders over the long term. It will do this through its geographic breadth, itsoutstanding brands across beverage alcohol categories and the expertise of its people. In support of thisobjective, the company seeks to accelerate value creation through medium term goals that are centredon delivering faster organic net sales growth, strong organic operating margin improvement and double-digit growth in core earnings per share over the medium term. The remuneration structures andperformance measures used in executive incentive plans are designed to support Diageo’s businessstrategy as follows:
Focused on sustainable As a public limited company, Diageo has a fiduciary responsibility togrowth drivers maximise long term value for shareholders. Thus, variable elements of
remuneration are dependent upon the achievement of performancemeasures that are identified as key sustainable growth drivers for thebusiness and that are aligned with the creation of shareholder value.
Variable with performance A significant proportion of total remuneration for the executive directorsis linked to individual and business performance so that remunerationwill increase or decrease in line with performance. The fixed versusvariable pay mix is illustrated on the following page.
Share ownership Full participation in incentives is conditional upon building up asignificant personal shareholding in Diageo to ensure the company’sleaders think and act like owners.
Cost effectiveness Fixed elements of remuneration are determined by reference to themedian of the market, individual experience and performance, and otherrelevant factors to ensure competitiveness while controlling fixed costs tomaximise efficiency.
How do the incentive plan measures link to business strategy? The following table describes theperformance measures that are used in the company’s short and long term executive incentive plansand the business performance that they drive:
Short term incentive plan measuresNet sales – year-on-year organic net sales growth is a key performance measure.
returns that can be delivered to shareholders through increases in share price and dividend income.
health of the business and critical to enabling infrastructure investment, marketing investment, capital expenditure and acquisition opportunities in line with Diageo’s strategy. A proportion of this metric is focused on average cash performance to enhance focus on sustained cash generation throughout the year.
deliverables that are specific to the individual and are focused on
Profit before exceptional items and taxation – stretching profittargets drive operational efficiency and influence the level of
Free cash flow – positive cash flow is an indicator of the financial
Individual business objectives – these are measurable
supporting the delivery of key strategic objectives.
Long term incentive plan measuresNet sales – sustained year-on-year organic net sales growth is a key performance measure. Operating margin – organic operating margin measures the
Earnings per share (eps) – reflects profitability and is a keymeasure for shareholders; an adjusted measure of eps is used in the share option plan.
efficiency of the business in delivering top line growth.
Relative total shareholder return (TSR) – reflects the value ofshare price growth plus dividends, thus measuring the value returned on shareholder investments; Diageo’s performance relative to its selected peer group determines how much reward is delivered to plan participants.
99

28AUG201217275310 28AUG201217275058
Directors’ remuneration report (continued)
How is pay for performance achieved? The board of directors sets stretching performance targets forthe business and its leaders. To achieve these targets and deliver performance requires exceptionalbusiness management and strategic execution. This approach to target setting reflects the aspirationalperformance environment that Diageo wishes to create.
The annual incentive plan aims to reward the delivery of short term financial and individualbusiness performance goals with commensurate levels of remuneration. Long term incentive plans aimto reward long term sustained performance and create alignment with the delivery of value forshareholders. Under both sets of plans, if the demanding targets are achieved, high levels of rewardmay be earned. All incentives are capped in order that inappropriate risk-taking is neither encouragednor rewarded.
What is the proportion of fixed to variable pay? The balance between fixed and variable elements ofremuneration changes with performance. Based on expected values at target and the average ofremuneration elements for both executive directors, the mix between fixed and variable remunerationfor executive directors is that for £100 of remuneration earned, £33 will be fixed remuneration and £67will be performance-related remuneration, excluding pensions and other benefits. At maximum, the mixincreases the weighting on variable pay (and in particular, long term variable pay) so that for £100 ofremuneration earned, £14 will be fixed remuneration and £86 will be performance-relatedremuneration, excluding pensions and other benefits. This mix is illustrated in the following charts.
Fixed vs variable pay mix
Target Maximum1 – Fixed – base salary 33%2 – Variable – long term 34%3 – Variable – short term 33%
1
23
1 – Fixed – base salary 14%2 – Variable – long term 57%3 – Variable – short term 29%
1
2
3
How is risk managed in the incentive plans? The remuneration committee considers the managementof risk to be important to the process of designing and implementing sustainable remunerationstructures and to setting appropriate performance targets for incentive plans. The members of theremuneration committee also constitute the membership of the audit committee, thus ensuring fulloversight of any risk factors that may be relevant to remuneration arrangements and target settingspecifically. Before agreeing bonus payments and approving the vesting under long term incentive plans,the remuneration committee, in conjunction with the audit committee, considers the underlyingperformance of the business during the relevant period to ensure that the level of reward is appropriateand aligned with shareholder interests. A clawback condition has been introduced to future long termincentive plan awards such that outstanding awards may be reduced in the event of a materialperformance failure.
100

Directors’ remuneration report (continued)
Summary of current remuneration policy for executive directors
A breakdown of the reward programmes in which Diageo’s executive directors participate, theremuneration strategy that they support and the policy governing their execution is detailed in the tablebelow:
What Why How
Base salary Reflects the value of the • Reviewed annually withindividual, their skills and changes usually taking effectexperience, and performance. from 1 October.
• Benchmarked against the top30 companies in theFTSE 100 by marketcapitalisation excludingcompanies in the financialservices sector and Unilever.
• Generally positioned at themedian of the relevant marketor, in certain circumstances,positioned above median ifjustified by the requirement torecruit or retain keyexecutives.
Annual incentive plan Incentivises year on year • Targets set by reference to thedelivery of short term annual operating plan.performance goals. Provides • Level of award determined byfocus on key financial metrics Diageo’s overall financialincluding profit growth and cash performance.performance.
• Annual incentive plan awardsbased 80% on financialmeasures (net sales, profitand cash flow) and 20% onspecific individual businessobjectives related to businessstrategy and operationaltargets.
• Up to 100% of salary earnedfor on target performancewith a maximum of 200% ofsalary payable for outstandingperformance.
101

Directors’ remuneration report (continued)
What Why How
Share options (SESOP 2008) Incentivises three year earnings • A discretionary annual grantgrowth above a minimum of market price share optionsthreshold. Provides focus on subject to a performance testincreasing Diageo’s share price based on annual compoundover the medium to longer term. growth in adjusted eps over
three years.
• Stretching growth targets setannually by the remunerationcommittee.
• Maximum annual grant of375% of salary.
• Threshold vesting level of25% with pro rata vesting upto 100% maximum.
102

Directors’ remuneration report (continued)
What Why How
Performance share awards Incentivises three year total • A discretionary annual award(PSP 2008) shareholder return relative to a of shares subject to a
selected peer group of three year performance test.companies and the achievement • Maximum annual award ofof organic net sales and organic 375% of salary.operating margin targets thatsupport the delivery of the • Threshold vesting of 25% upcompany’s medium term growth to a maximum of 100%.ambitions. Provides focus on • Based on three equallydelivering superior returns to weighted measures: TSRshareholders. performance against a peer
group of companies, organicnet sales growth (compoundannual growth) and totalorganic operating marginimprovement.
• Threshold vesting for medianTSR performance (ninthposition), up to 100% vesting(equivalent to 33.3% of thetotal award) for achievingthird or above in the peergroup.
• Organic net sales and organicoperating margin targets setannually by the remunerationcommittee for each newaward.
• Notional dividends accrue onawards, delivered as shares orcash at the discretion of theremuneration committee.
Benefits Provides market competitive • Provision of benefits such asnon-cash benefits company car and driver,
product allowance, medicalinsurance and financialcounselling.
103

Directors’ remuneration report (continued)
What Why How
Pension Provides competitive post • Provision of marketretirement benefits or cash competitive pensionalternative arrangements or a cash
alternative based on apercentage of base salary.
• Bonus and other benefitsexcluded from calculation ofcash supplement.
• ‘Flexible pension access’allows individuals over the ageof 55 to draw their pensionearly while remaining inemployment.
Base salaries
How are base salaries determined? The previous summary table sets out the policy on base salary forthe executive directors. In addition to market data, base salaries are determined with reference toindividual experience and performance, and the level and structure of remuneration for otheremployees and the external environment.
How is benchmarking used? Benchmarking is primarily referenced if there is a perceived gap betweenthe individual’s base salary positioning and relevant market peers, where there is a known retention riskor where an individual is newly appointed to role. When used, benchmarking data is consideredholistically, looking at salary in the context of total package value, and is referenced as a guide tosupport the committee’s judgement taking into account a number of other factors including theimportance of the role in delivering the company’s strategy, the performance of the individual, and thepay and employment conditions of the general employee population.
The peer group that is referenced comprises the top 30 companies in the FTSE 100 by marketcapitalisation, excluding companies in the financial services sector and also excluding Unilever, forwhich PS Walsh is the chairman of the remuneration committee. Benchmarking also makes reference toother relevant global comparators where appropriate recognising the global mobility of the senior talentpool.
What increases have been applied during the year? During the year ended 30 June 2012, the basesalaries for the CEO and CFO were increased by 4.5% and 8.7% respectively.
In August 2012, the remuneration committee reviewed base salaries for senior management andagreed new salaries which will apply from 1 October 2012. In determining these salaries, theremuneration committee took into consideration the experience, performance, and the external andinternal relative positioning for total reward (taking into account both pay and incentives) of theindividuals, and also took into account the pay context for general staff. The overall pay budget for thebusiness in the United Kingdom in the year ending 30 June 2013 is 3.5% of base salary. As a result ofthese considerations, the remuneration committee, in consultation with the CEO, determined that thebase salary for the CEO will not be increased in October 2012.
104
Directors’ remuneration report (continued)
The CFO was appointed to the board on 1 October 2010. As outlined in the 2011 directors’remuneration report, on her appointment, the CFO’s salary was initially set at below typical marketlevels for comparable roles reflecting her level of experience at the time. In setting this initial salarylevel, the remuneration committee’s intention was to allow scope for future increases to both recogniseperformance and bring her closer in line with the market with increasing experience. The remunerationcommittee has awarded an increase that recognises her strong performance since appointment and thatprovides ongoing progression towards a market-competitive package in line with the company’s policyon base salary positioning; with effect from 1 October 2012, the base salary for the CFO will increaseby 8.8% to £680,000.
D Mahlan PS Walsh
Salary at 1 October (£000) 2012 2011 2010 2012 2011 2010
Base salary . . . . . . . . . . . . . . . . . . . . . . . . . . . . . . . . . . 680 625 575 1,231 1,231 1,178% increase (over previous year) . . . . . . . . . . . . . . . . . . . 8.8% 8.7% — 0% 4.5% 2.0%
Annual incentive plan
How does the annual incentive plan work? The annual incentive plan is designed to incentivise yearon year delivery of short term performance goals that are determined by pre-set stretching targets andmeasures agreed by the remuneration committee with reference to the annual operating plan. Theremuneration committee determines the level of performance achieved based on Diageo’s overallfinancial performance after the end of the financial year. With effect from 1 July 2012, the annualincentive plan will be subject to a clawback arrangement for executive directors. Under thisarrangement, the remuneration committee will have discretion to clawback a bonus if exceptionalcircumstances, such as gross misconduct or gross negligence, are discovered to have occurred during theperformance period that applied to the bonus award.
The targets for the year ended 30 June 2012 were a combination of measures including net sales,profit before exceptional items and taxation, and free cash flow. As discussed earlier in the report,these measures focus on key drivers of Diageo’s growth strategy while supporting sustainability and theunderlying financial health of the company. The executive directors were also measured against anumber of individual business objectives (IBOs) that were derived from a set of common goalsconsidered to be key imperatives supporting the delivery of the business plan and that were relevant totheir specific area of accountability.
How did the company perform against annual incentive plan targets in the year ended 30 June 2012?In the year under review, the company has delivered organic top line growth of 6%, operating profitgrowth of 9% and 60 basis points of operating margin improvement. This is a strong performance thatensures the business is well positioned for the future. The company’s performance is reflected in abovetarget outcomes under the net sales and profit measures used in the annual incentive plan, and astrong cash performance also delivered an above target outcome for this measure. The remunerationcommittee assessed the performance of the CEO and the CFO against this performance context andagainst their specific IBOs and concluded that, overall, the performance against the IBOs warranted anabove target level of payout. The overall level of performance achieved resulted in an annual incentiveplan award equating to 148% of base salary for the CEO and 146% of salary for the CFO. Thefollowing charts illustrate how the outcomes for the different bonus measures contribute to the overallbonus payout and compare this to the target and maximum potential outcome (based on an average ofthe IBOs for the executive directors). The actual awards received by the executive directors are shownin this report in the table ‘Directors’ remuneration for the year ended 30 June 2012’.
105

30AUG201216461636
28AUG201216543557
Directors’ remuneration report (continued)
Outcome
Net sales Average cash Individual businessobjectives
0
2.00
1.50
1.00
0.50
Profit before exceptionalitems and tax
Free cash flow
On target vs actual bonus outcome vs potential maximum as % of target opportunity
On target
Actual outcome
0 25 50 75 100 125 150 175 200
30% 30% 13% 7% 20%
35% 59% 15% 8% 29%
Potentialmaximum
60% 60% 26% 14% 40%
Net salesProfit before exceptional items and taxFree cash flow
Average cashIndividual business objectives
The business results for the year ended 30 June 2012 are described in the Business review.
Long term incentive plans (LTIPs)
How do the company’s LTIPs work? Long term incentives are a combination of share options underthe SESOP and performance share awards under the PSP and are designed to incentivise executivedirectors and senior managers to strive for long term sustainable performance. These awards are madeon an annual basis with the level of award considered each year in light of individual and businessperformance. Awards made under both sets of plans are subject to performance conditions normallymeasured over a three year period. The regular review of the performance measures and the vestingschedule used in each plan are designed to ensure that the LTIPs continue to support business
106

Directors’ remuneration report (continued)
objectives and are in line with current best practice. All of Diageo’s share plans operate within theAssociation of British Insurers’ dilution guidelines for share-based remuneration.
Senior executive share option plan 2008 (SESOP 2008)
Options granted under the SESOP 2008 are subject to a performance condition based oncompound annual growth in adjusted eps over a three year period, with growth targets set by thecompany’s remuneration committee for each grant. For the purpose of the SESOP, an adjusted measureof eps is used to ensure that items such as exceptional items and the impact of movements in exchangerates are excluded from year on year comparisons of performance. Options will only vest whenstretching adjusted eps targets are achieved. Vesting is on a pro rata basis currently ranging from athreshold level of 25% to a maximum level of 100%. The remuneration committee reviewed the targetsfor the SESOP awards to be made in 2012 and decided to increase their stretch to ensure that theyremain aligned with long term shareholder value creation.
What are the targets, award levels and vesting profile for SESOP awards? The adjusted eps growthtargets for the current outstanding awards are set out below:
Award 2012 Award 2011 Award 2010 Award 20091 Jul 2012 – 30 Jun 1 Jul 2011 – 30 Jun 1 Jul 2010 – 30 Jun 1 Jul 2009 – 30 Jun
Performance period 2015 2014 2013 2012
% % % %
Compound annual growthThreshold . . . . . . . . . . . . . . 8 6 3 3Max . . . . . . . . . . . . . . . . . . 12 10 7 7Equivalent total overthree yearsThreshold . . . . . . . . . . . . . . 26 19 9 9Max . . . . . . . . . . . . . . . . . . 40 33 23 23Percentage of award vestingThreshold . . . . . . . . . . . . . . 25 25 25 25Max . . . . . . . . . . . . . . . . . . 100 100 100 100
For the 2012 award, 62.5% of the award (the vesting midpoint) will vest for achieving compoundannual growth of 10% in adjusted eps.
The maximum annual grant under the plan is 375% of base salary. However, the remunerationcommittee has the discretion to grant awards in excess of the maximum limit in exceptionalcircumstances. It is intended that awards equivalent to 375% of base salary will be made to the CEO,COO and CFO in September 2012.
The remuneration committee also has discretion to extend the option exercise period from 12 to18 months for share options awarded to qualifying leavers. The remuneration committee did notexercise this discretion during the year ended 30 June 2012.
107

23AUG201205132565
Directors’ remuneration report (continued)
How is adjusted eps performance tracking for outstanding SESOP awards? The following table showsadjusted eps performance for each year that forms all or part of the performance period foroutstanding SESOP awards:
Annual adjusted eps performance
Adjustedeps
Year ended growth
30 June 2010 . . . . . . . . . . . . . . . . . . . . . . . . . . . . . . . . . . . . . . . . . . . . . . . . . . . . . . . . . . . 5.9%30 June 2011 . . . . . . . . . . . . . . . . . . . . . . . . . . . . . . . . . . . . . . . . . . . . . . . . . . . . . . . . . . . 12.9%30 June 2012 . . . . . . . . . . . . . . . . . . . . . . . . . . . . . . . . . . . . . . . . . . . . . . . . . . . . . . . . . . . 12.1%
The following chart shows the performance targets, minimum and maximum vesting percentagesfor awards made in 2009, 2010, 2011 and 2012. It also shows the compound annual growth performancefor adjusted eps as it is currently tracking for each outstanding award. On the basis of thisperformance, the 2009 award, which is due to vest in September 2012, has exceeded the performancecondition and consequently, the shares under award will vest at 100% of the initial award.
Adjusted eps compound annual growth (%)
0.01.02.03.04.05.06.07.08.09.010.011.012.013.0
2009–2012
eps target growth range+ Compound annual growth rate to date
2010–2013
100% vest
25% vest
10.2% CAGR
+
2011–2014
100% vest
25% vest
12.5% CAGR
+
12.1% CAGR
+
2012–2015
100% vest
25% vest
100% vest
25% vest
Performance share plan (PSP 2008)
Under this plan, participants are granted a discretionary, conditional right to receive shares. Allconditional rights awarded vest after a three year period subject to the achievement of specifiedperformance tests. Notional dividends accrue on awards and are paid out either in cash or shares inaccordance with the vesting schedule. As discussed in the 2011 directors’ remuneration report, the planwas reviewed during the year ended 30 June 2011 resulting in the introduction of two new financialmeasures to the performance condition for awards made from September 2011 onwards. By introducingthese two new financial measures, the remuneration committee has sought to create closer alignmentwith business strategy, as outlined earlier in this report.
108

Directors’ remuneration report (continued)
What performance measures are used in the PSP?
For outstanding awards made up to and including September 2010
The primary performance test is a comparison of Diageo’s three year TSR – the percentagegrowth in Diageo’s share price (assuming all dividends and capital distributions are reinvested) – withthe TSR of a peer group of international drinks and consumer goods companies. TSR calculations areconverted to a common currency (US dollars). The second performance test requires that there hasbeen an underlying improvement in Diageo’s three year financial performance, typically measured byan adjusted eps measure, for the remuneration committee to recommend the release of awards.
For awards made from September 2011 onwards
The primary performance test is split equally between three performance measures:
1) TSR, as defined above;
2) growth in organic net sales on a compound annual basis; and
3) total organic operating margin improvement.
For any of the award apportioned to the TSR condition to be released, there must be animprovement in the underlying performance of the company. In addition, the remuneration committeerequires a minimum level of performance in both organic net sales and organic operating marginbefore any of the award apportioned to these measures can be released.
In line with shareholder feedback seeking greater visibility of targets at the start of theperformance period, the remuneration committee will disclose targets under the two financial measuresfor future awards. The remuneration committee will also disclose how vesting outcomes relate toperformance at the end of the three year performance period in the relevant directors’ remunerationreport.
What are the targets, award levels and vesting profile for PSP awards?
The targets and vesting profile are shown in the following tables:
Organic net sales Organic operatingTotal shareholder return (CAGR) margin improvement Vesting profile
2012 award– Threshold . . . . . . . . Median ranking (ninth) 5.0% 100bps 25%– Mid-point . . . . . . . . — 6.5% 150bps 62.5%– Maximum . . . . . . . . Upper quintile (third or 8.0% 175bps 100%
above)
There is straight line vesting between 25% and 100% for the net sales measure; the operating marginvesting profile is intended to incentivise further outperformance so it will vest in a straight line betweenthreshold and the midpoint for achieving 100bps to 150bps improvement (25% to 62.5% vesting), and
109

Directors’ remuneration report (continued)
will then vest in a straight line between midpoint and maximum for achieving 150bps to 175bpsimprovement (62.5% to 100% vesting). The full vesting profile for TSR is shown below:
From 2011 From 2008awards awards
TSR ranking % vesting % vesting
1st . . . . . . . . . . . . . . . . . . . . . . . . . . . . . . . . . . . . . . . . . . . . . . . . . . . . . . . . . 100% 100%2nd . . . . . . . . . . . . . . . . . . . . . . . . . . . . . . . . . . . . . . . . . . . . . . . . . . . . . . . . . 100% 100%3rd . . . . . . . . . . . . . . . . . . . . . . . . . . . . . . . . . . . . . . . . . . . . . . . . . . . . . . . . . 100% 95%4th . . . . . . . . . . . . . . . . . . . . . . . . . . . . . . . . . . . . . . . . . . . . . . . . . . . . . . . . . 95% 75%5th . . . . . . . . . . . . . . . . . . . . . . . . . . . . . . . . . . . . . . . . . . . . . . . . . . . . . . . . . 75% 65%6th . . . . . . . . . . . . . . . . . . . . . . . . . . . . . . . . . . . . . . . . . . . . . . . . . . . . . . . . . 65% 55%7th . . . . . . . . . . . . . . . . . . . . . . . . . . . . . . . . . . . . . . . . . . . . . . . . . . . . . . . . . 55% 45%8th . . . . . . . . . . . . . . . . . . . . . . . . . . . . . . . . . . . . . . . . . . . . . . . . . . . . . . . . . 45% 25%9th . . . . . . . . . . . . . . . . . . . . . . . . . . . . . . . . . . . . . . . . . . . . . . . . . . . . . . . . . 25% 0%10th or below . . . . . . . . . . . . . . . . . . . . . . . . . . . . . . . . . . . . . . . . . . . . . . . . . 0% 0%
TSR peer group
There are 15 other companies in the peer group for the outstanding 2009 and 2010 awards, and 16other companies in the peer group for awards made from 2011 onwards:
AB InBev Kraft FoodsBrown-Forman NestleCarlsberg PepsiCoCoca-Cola Pernod RicardColgate-Palmolive Procter & GambleGroupe Danone Reckitt Benckiser (2011 onwards)Heineken SABMillerHJ Heinz Unilever
The maximum annual award under the plan is 375% of salary. However, the remuneration committeehas discretion to grant awards in excess of this maximum in exceptional circumstances. It is intendedthat awards equivalent to 375% of base salary will be made to the CEO and COO, and an awardequivalent to 300% of base salary will be made to the CFO in September 2012.
How does the remuneration committee use discretion to ensure a fair outcome? The remunerationcommittee will review the vesting outcome of an LTIP award to ensure that it fairly reflects thecompany’s actual underlying performance and may adjust vesting levels if it considers it appropriate.Additionally, for awards made from September 2012 onwards, the plan rules for both SESOP and PSPwill provide the remuneration committee with the discretion to apply a clawback condition in order toreduce the number of shares under award in the event of a material performance failure (for example,material restatement to the accounts).
What happens in the event of a change of control? In the event of a change of control and at theremuneration committee’s discretion, outstanding PSP awards would be released and outstanding shareoptions would become exercisable based on the extent to which the relevant performance conditionshad been met and, if the remuneration committee determines, the time elapsed since the initial awardor grant, respectively.
110

Directors’ remuneration report (continued)
All employee share plans
The executive directors are eligible to participate in the United Kingdom HM Revenue & Customsapproved share incentive and sharesave plans that Diageo operates on the same terms as for all eligibleemployees.
What is the shareholding requirement for the executive directors? Senior executives are currentlyrequired to build up significant holdings of shares in Diageo from their own resources over a definedperiod of time. Full participation in the share option and share award plans is conditional uponmeeting this requirement. This policy reflects Diageo’s belief that its most senior leaders should also beshareholders. The holding requirement for the CFO and CEO and the status of that requirement as at30 June 2012 is shown in the following table. Under the company’s shareholding requirement policy, DMahlan has five years from her appointment to the board in which to build up her shareholding tomeet and maintain her new requirement.
D Mahlan PS Walsh
Value of shareholdings (£000) . . . . . . . . . . . . . . . . . . . . . . . . . . . . . . . . . . . . . . 1,328 9,083Minimum shareholding requirement as % of salary . . . . . . . . . . . . . . . . . . . . . . . 250% 300%Actual shareholding as % of salary . . . . . . . . . . . . . . . . . . . . . . . . . . . . . . . . . . . 217% 746%
This information is based on the share interests disclosed in the table ‘Share and other interests’ inthis report, base salary earned in the year ended 30 June 2012, and an average share price for the sameperiod of 1394 pence.
What pension provision is made for executive directors? CEO – PS Walsh was a member of theUK Scheme (the ‘Scheme’) until 31 March 2011, at which point he stopped accruing pension rights.From 1 May 2011, PS Walsh began to receive his pension benefits under the company’s policy of‘flexible pension access’. The rules of the Scheme at the time that PS Walsh began to receive hisbenefits required pensions in payment to be increased each year in line with increases in the RPI,subject to a maximum of 5% per year and a minimum of 3% per year.
In the event of death in service, a lump sum of four times pensionable pay plus a spouse’s pensionof two-thirds of the member’s pension before commutation would be payable. Upon death after leavingthe company, a spouse’s pension of two-thirds of the member’s pension before commutation is payable.
CFO – Since her appointment to the board, D Mahlan has not been a member of any Diageogroup company pension scheme and instead has received a cash supplement in lieu of pensionprovision equivalent to 40% of base salary. With effect from 1 July 2012, it is proposed that thecompany contribution is reduced to 35% of base salary and that this benefit is delivered in the form ofa contribution into the Diageo North America Inc. Supplemental Executive Retirement Plan (SERP).The SERP is an unfunded, non qualified supplemental retirement programme. Under the plan, accruedcompany contributions are subject to quarterly interest credits based on the interest rate set out in theUS internal revenue code. Under the rules of the SERP, D Mahlan can withdraw the balance of theplan in the form of five equal annual instalments or a lump sum upon reaching age 55 and having leftservice with Diageo (within six months of separation from service). Upon death in service, a lump sumof four times base salary is payable.
What are the service contracts and terms of employment for the executive directors? The executivedirectors have rolling service contracts which provide for six months’ notice by the director or12 months’ notice by the company and contain non-compete obligations. In the event of earlytermination by the company without cause, the agreements provide for a termination payment to be
111

Directors’ remuneration report (continued)
paid (in respect of that part of the notice period not provided to the director by the company) toPS Walsh equivalent to 12 months’ base salary for the notice period and an equal amount in respect ofall benefits, and to D Mahlan equivalent to 12 months’ base salary for the notice period and the cost tothe company of providing contractual benefits (excluding incentive plans). Any such payments would besubject to tax and other statutory deductions. The remuneration committee may exercise its discretionto require half of the termination payment to be paid in monthly instalments and, upon the executivecommencing new employment, to be subject to mitigation. If the board determines that the executivehas failed to perform his or her duties competently, the remuneration committee may exercise itsdiscretion to reduce the termination payment on the grounds of poor performance. PS Walsh’s servicecontract with the company is dated 1 November 2005. D Mahlan’s service contract with the company isdated 1 July 2010.
What happens to share awards when executive directors leave? On cessation of employment,outstanding awards under share incentive arrangements will be treated in accordance with the relevantplan rules approved by shareholders in 2008. As set out in last year’s remuneration report, in light ofthe role of the CEO in the delivery of shareholder value, the committee proposes to enable vesting ofPSPs granted to the CEO from 2011 to be based entirely on the delivery of that performance.Accordingly, awards will be capable of vesting in full at the end of the performance period, ifperformance goals are delivered in full, without providing time pro-rating to the point of retirement.Such consideration would be at the sole discretion of the remuneration committee, taking into accountall the circumstances it considers relevant at the time.
What external appointments are held by the executive directors? Executive directors may acceptexternal appointments as non-executive directors of other companies and retain any related fees paid tothem, subject to the specific approval of the board in each case.
During the year ended 30 June 2012, PS Walsh served as a non-executive director of Unilever NVand PLC, and FedEx Corporation and, with effect from January 2012, was appointed as anon-executive director of Avanti. He retained the fees paid to him for his services. At the government’srequest, PS Walsh also served as lead non-executive director and deputy chair on the board of theDepartment of Energy and Climate Change (DECC). PS Walsh has committed to donating all fees thathe receives for this directorship to a charitable educational trust. The total amounts of such fees paidin the year ended 30 June 2012 are set out in the table below. D Mahlan did not hold any externalappointments during the year ended 30 June 2012. With effect from 1 September 2012, D Mahlan willserve as a non-executive director for Experian Plc.
PS Walsh
£000
Unilever(a) . . . . . . . . . . . . . . . . . . . . . . . . . . . . . . . . . . . . . . . . . . . . . . . . . . . . . . . . . . . . 106FedEx Corporation(a) . . . . . . . . . . . . . . . . . . . . . . . . . . . . . . . . . . . . . . . . . . . . . . . . . . . . 65DECC . . . . . . . . . . . . . . . . . . . . . . . . . . . . . . . . . . . . . . . . . . . . . . . . . . . . . . . . . . . . . . . 20Avanti (with effect from January 2012) . . . . . . . . . . . . . . . . . . . . . . . . . . . . . . . . . . . . . . . . 17
208
Notes(a) Fees paid in currencies other than sterling are converted using average exchange rates for the year
ended 30 June 2012.
112

Directors’ remuneration report (continued)
In line with the FedEx Corporation policy for outside directors, PS Walsh is eligible to be grantedshare options. During the year ended 30 June 2012, he was granted 5,970 options at an option price of$68.765. He exercised 8,000 FedEx options during the year, which were granted at an option price of$49.23 and sold at an average price of $90.27.
Chairman of the board and non-executive directors
What is the policy on chairman of the board and non-executive directors’ fees?
• The fees should be sufficient to attract, motivate and retain world-class talent.
• Fee practice should be consistent with recognised best practice standards for such positions.
• The chairman and non-executive directors should not participate in any of the company’sincentive plans.
• Part of the chairman’s fees should be used for the purchase of Diageo shares.
• Fees for non-executive directors should be within the limits set by the shareholders from time totime, currently £1,000,000, as approved by shareholders at the October 2005 Annual GeneralMeeting. The limit excludes remuneration paid for special services performed by directors.
What terms and conditions apply to the chairman of the board? The chairman of the board,Dr Franz B Humer, commenced his appointment on 1 July 2008. Dr Humer has a letter ofappointment for an initial five year term from 1 July 2008. It is terminable on six months’ notice byeither party or, if terminated by the company, by payment of six months’ fees in lieu of notice.
The chairman’s fee is normally reviewed every two years and any changes would normally takeeffect from 1 January. As recommended by the UK Corporate Governance Code, any changes to thisfee have to be approved by the remuneration committee. The last scheduled review of fees wasundertaken in December 2010 and the next review is anticipated to take place in December 2012 withany changes taking effect on 1 January 2013. Fees are reviewed in the light of market practice in largecompanies in the United Kingdom and anticipated workload, tasks and potential liabilities. In line withDiageo’s policy, a proportion of the chairman’s annual fee is used for the monthly purchase of Diageoordinary shares, which have to be retained until the chairman retires from the company or ceases to bea director for any other reason. The chairman’s current fee is shown in the following summary table.No changes were made to the chairman’s fee during the year ended 30 June 2012.
What terms and conditions apply to the non-executive directors? All non-executive directors haveletters of appointment. A summary of their terms and conditions of appointment is available atwww.diageo.com.
The last scheduled review of fees for non-executive directors was undertaken in December 2011.At this time, fees were benchmarked against market practice in large companies in the UnitedKingdom and reviewed in light of anticipated workload, tasks and potential liabilities. As a result ofthis review, the base fee paid to non-executive directors was increased by £2,000 from £78,000 to£80,000 per annum and the fee for the chairman of the remuneration committee was increased by£5,000 from £15,000 to £20,000 per annum to reflect market practice in comparable companies. It wasdecided after this last review that fees for non-executive directors would be reviewed every two yearsgoing forward (previously, annually). Therefore, the next review of the non-executive director fees isanticipated to take place in December 2013 with any changes expected to take effect on 1 January
113

Directors’ remuneration report (continued)
2014. A full summary of the current non-executive directors’ fees is shown in the following summarytable.
Chairman of the board and non-executive directors’ remuneration for the year ended 30 June 2012
Per annum fees effective from January 2012 January 2011
£ £
Chairman of the board . . . . . . . . . . . . . . . . . . . . . . . . . . . . . . . . . . . . . . . 500,000 500,000
Non executive directorsBase fee . . . . . . . . . . . . . . . . . . . . . . . . . . . . . . . . . . . . . . . . . . . . . . . . . . 80,000 78,000Senior non executive director . . . . . . . . . . . . . . . . . . . . . . . . . . . . . . . . . . . 20,000 20,000Chairman of the audit committee . . . . . . . . . . . . . . . . . . . . . . . . . . . . . . . . 25,000 25,000Chairman of the remuneration committee . . . . . . . . . . . . . . . . . . . . . . . . . . 20,000 15,000
The emoluments received by the chairman of the board and the non-executive directors in the yearended 30 June 2012 are shown in the table ‘Directors’ remuneration for the year ended 30 June 2012’.
114

Directors’ remuneration report (continued)
Directors’ remuneration for the year ended 30 June 2012
2012 2011
Annual Share Cash inBase incentive incentive lieu of Other
Emoluments salary plan plan pension(b) benefits(c) Total Total
£000 £000 £000 £000 £000 £000 £000
Chairman – feesDr FB Humer(a) . . . . . . . . . . . . . . . 500 — — — 7 507 459
Executive directorsD Mahlan . . . . . . . . . . . . . . . . . . . . . 612 912 3 245 27 1,799 1,353PS Walsh . . . . . . . . . . . . . . . . . . . . . 1,217 1,821 3 — 58 3,099 3,183Former executive directorsNC Rose (retired from the board on
14 October 2010) . . . . . . . . . . . . . . — — — — — — 732
Sub total . . . . . . . . . . . . . . . . . . . . . 1,829 2,733 6 245 85 4,898 5,268
Non-executive directors – feesPB Bruzelius . . . . . . . . . . . . . . . . . . . 79 — — — 1 80 77LM Danon . . . . . . . . . . . . . . . . . . . . 79 — — — 1 80 77Lord Davies . . . . . . . . . . . . . . . . . . . 105 — — — 1 106 65BD Holden . . . . . . . . . . . . . . . . . . . 79 — — — 1 80 77PG Scott . . . . . . . . . . . . . . . . . . . . . 104 — — — 1 105 102HT Stitzer . . . . . . . . . . . . . . . . . . . . 79 — — — 1 80 77
Former non-executive directors – feesLord Hollick (retired 19 October
2011) . . . . . . . . . . . . . . . . . . . . . . 33 — — — — 33 112PA Walker (retired 19 October 2011) . 23 — — — — 23 77
Sub total . . . . . . . . . . . . . . . . . . . . . 581 — — — 6 587 664
Total . . . . . . . . . . . . . . . . . . . . . . . . 2,910 2,733 6 245 98 5,992 6,391
Notes(a) £200,000 of Dr Franz B Humer’s remuneration in the year ended 30 June 2012 was used for
the monthly purchase of Diageo ordinary shares, which must be retained until he retires from thecompany or ceases to be a director for any other reason.
(b) D Mahlan does not participate in the company’s pension scheme and received a monthly cashsupplement equivalent to 40% of base pay during the year ended 30 June 2012.
(c) Other benefits may include company car and driver, product allowance, financial counselling andmedical insurance.
115

Directors’ remuneration report (continued)
Long term incentive plans
Payments and gains
In the year ended 30 June 2012, the executive directors received payments and made gains under longterm incentive plans as follows:
2012 2011
Executive September Septembershare option 2008 2007
exercises PSP award DIP award Total Total
£000 £000 £000 £000 £000
Executive directorsD Mahlan(a) . . . . . . . . . . . . . . . . . . . . . . . . . . . . — — 126 126 215PS Walsh . . . . . . . . . . . . . . . . . . . . . . . . . . . . . . . 3,208 — — 3,208 1,225
Total . . . . . . . . . . . . . . . . . . . . . . . . . . . . . . . . . . 3,208 — 126 3,334 1,440
Notes(a) D Mahlan received a release under the Discretionary Incentive Plan (DIP) in September 2011.
The award was made in 2007 prior to D Mahlan’s appointment to the board, and vested inSeptember 2010 with two equal releases in September 2010 and September 2011. The award wasmade in the form of American Depository Shares (ADS) and the gain value was converted fromUS dollars into sterling using the exchange rate as at 30 June 2012. Executive directors are noteligible to participate in the DIP and D Mahlan has no further outstanding DIP awards.
Directors’ share options over ordinary shares
The following table shows the number of options held under all executive share option plans andsavings-related schemes for the directors who held office during the year.
Market priceOption at date of Date from
30 June 30 June price in exercise in which first2011 Granted Exercised Lapsed 2012 pence pence exercisable Expiry date
D Mahlan . . DSOP 1999(a),(b) 1,576 1,576 815 20 Sep 2008 20 Sep 2015DSOP 1999(a),(b) 45,352 45,352 930 19 Sep 2009 19 Sep 2016DSOP 1999(a),(b) 37,560 37,560 1051 18 Sep 2010 18 Sep 2017DSOP 1999(a),(b) 52,588 52,588 1035 16 Sep 2011 16 Sep 2018
SESOP 2008(b),(c) 83,160 83,160 952 17 Sep 2012 17 Sep 2019SESOP 2008 199,652 199,652 1080 20 Sep 2013 20 Sep 2020SESOP 2008 190,239 190,239 1232 22 Sep 2014 22 Sep 2021
SAYE(d) 937 937 960 01 Dec 2014 31 May 2015
419,888 191,176 — — 611,064
PS Walsh . . . SESOP 1999 20,553 (20,553) — 759 1247 11 Oct 2005 11 Oct 2012SESOP 1999 455,521 (150,000) — 815 1363 20 Sep 2008 20 Sep 2015
(155,521) — 815 1383 20 Sep 2008 20 Sep 2015(150,000) — 815 1335 20 Sep 2008 20 Sep 2015
SESOP 1999 423,387 423,387 930 19 Sep 2009 19 Sep 2016SESOP 1999 392,483 392,483 1051 18 Sep 2010 18 Sep 2017SESOP 2008 493,871 (100,000) (207,426) 186,445 877 1500 27 Oct 2011 27 Oct 2018
SESOP 2008(c) 454,963 454,963 952 17 Sep 2012 17 Sep 2019SESOP 2008 409,062 409,062 1080 20 Sep 2013 20 Sep 2020
SAYE(d) 1,617 1,617 941 01 Dec 2015 31 May 2016SESOP 2008 374,695 374,695 1232 22 Sep 2014 22 Sep 2021
2,651,457 374,695 (576,074) (207,426)2,242,652
116
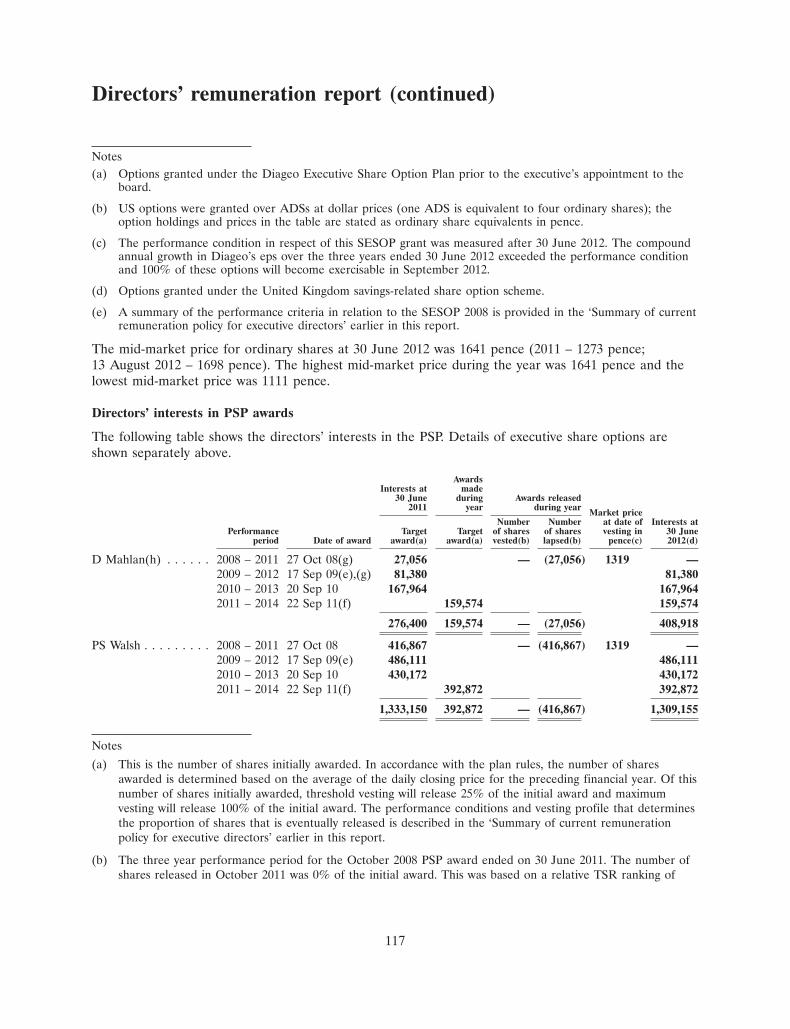
Directors’ remuneration report (continued)
Notes(a) Options granted under the Diageo Executive Share Option Plan prior to the executive’s appointment to the
board.
(b) US options were granted over ADSs at dollar prices (one ADS is equivalent to four ordinary shares); theoption holdings and prices in the table are stated as ordinary share equivalents in pence.
(c) The performance condition in respect of this SESOP grant was measured after 30 June 2012. The compoundannual growth in Diageo’s eps over the three years ended 30 June 2012 exceeded the performance conditionand 100% of these options will become exercisable in September 2012.
(d) Options granted under the United Kingdom savings-related share option scheme.
(e) A summary of the performance criteria in relation to the SESOP 2008 is provided in the ‘Summary of currentremuneration policy for executive directors’ earlier in this report.
The mid-market price for ordinary shares at 30 June 2012 was 1641 pence (2011 – 1273 pence;13 August 2012 – 1698 pence). The highest mid-market price during the year was 1641 pence and thelowest mid-market price was 1111 pence.
Directors’ interests in PSP awards
The following table shows the directors’ interests in the PSP. Details of executive share options areshown separately above.
AwardsInterests at made
30 June during Awards released2011 year during year Market price
Number Number at date of Interests atPerformance Target Target of shares of shares vesting in 30 June
period Date of award award(a) award(a) vested(b) lapsed(b) pence(c) 2012(d)
D Mahlan(h) . . . . . . 2008 – 2011 27 Oct 08(g) 27,056 — (27,056) 1319 —2009 – 2012 17 Sep 09(e),(g) 81,380 81,3802010 – 2013 20 Sep 10 167,964 167,9642011 – 2014 22 Sep 11(f) 159,574 159,574
276,400 159,574 — (27,056) 408,918
PS Walsh . . . . . . . . . 2008 – 2011 27 Oct 08 416,867 — (416,867) 1319 —2009 – 2012 17 Sep 09(e) 486,111 486,1112010 – 2013 20 Sep 10 430,172 430,1722011 – 2014 22 Sep 11(f) 392,872 392,872
1,333,150 392,872 — (416,867) 1,309,155
Notes
(a) This is the number of shares initially awarded. In accordance with the plan rules, the number of sharesawarded is determined based on the average of the daily closing price for the preceding financial year. Of thisnumber of shares initially awarded, threshold vesting will release 25% of the initial award and maximumvesting will release 100% of the initial award. The performance conditions and vesting profile that determinesthe proportion of shares that is eventually released is described in the ‘Summary of current remunerationpolicy for executive directors’ earlier in this report.
(b) The three year performance period for the October 2008 PSP award ended on 30 June 2011. The number ofshares released in October 2011 was 0% of the initial award. This was based on a relative TSR ranking of
117
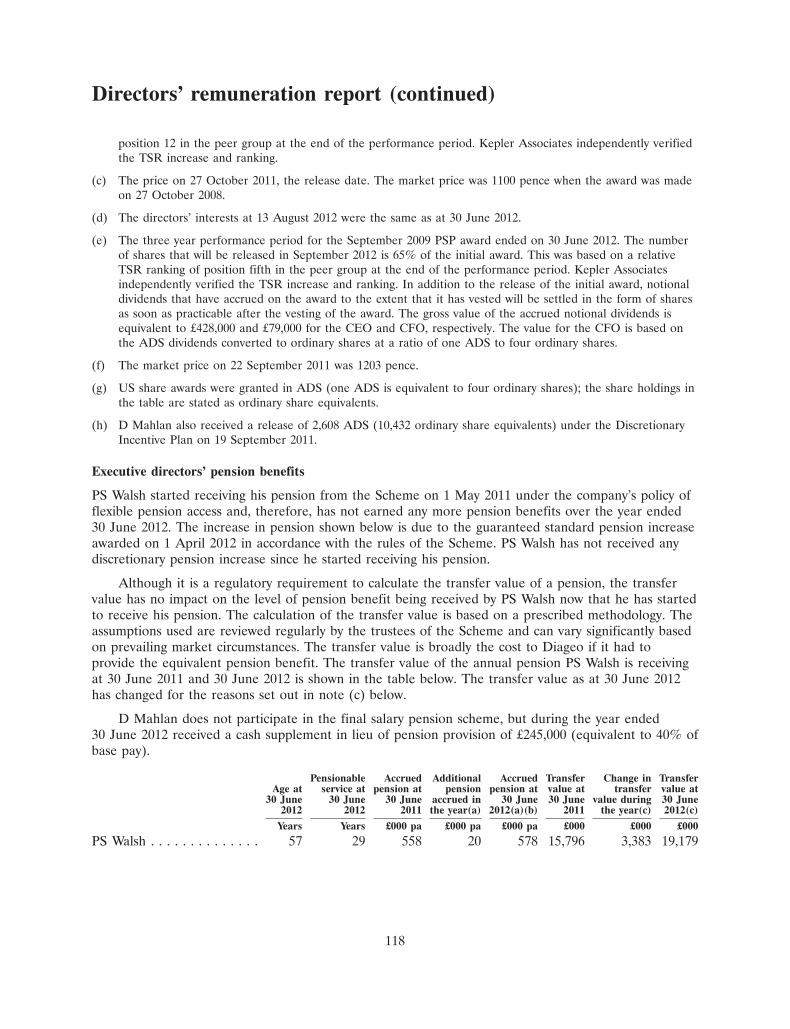
Directors’ remuneration report (continued)
position 12 in the peer group at the end of the performance period. Kepler Associates independently verifiedthe TSR increase and ranking.
(c) The price on 27 October 2011, the release date. The market price was 1100 pence when the award was madeon 27 October 2008.
(d) The directors’ interests at 13 August 2012 were the same as at 30 June 2012.
(e) The three year performance period for the September 2009 PSP award ended on 30 June 2012. The numberof shares that will be released in September 2012 is 65% of the initial award. This was based on a relativeTSR ranking of position fifth in the peer group at the end of the performance period. Kepler Associatesindependently verified the TSR increase and ranking. In addition to the release of the initial award, notionaldividends that have accrued on the award to the extent that it has vested will be settled in the form of sharesas soon as practicable after the vesting of the award. The gross value of the accrued notional dividends isequivalent to £428,000 and £79,000 for the CEO and CFO, respectively. The value for the CFO is based onthe ADS dividends converted to ordinary shares at a ratio of one ADS to four ordinary shares.
(f) The market price on 22 September 2011 was 1203 pence.
(g) US share awards were granted in ADS (one ADS is equivalent to four ordinary shares); the share holdings inthe table are stated as ordinary share equivalents.
(h) D Mahlan also received a release of 2,608 ADS (10,432 ordinary share equivalents) under the DiscretionaryIncentive Plan on 19 September 2011.
Executive directors’ pension benefits
PS Walsh started receiving his pension from the Scheme on 1 May 2011 under the company’s policy offlexible pension access and, therefore, has not earned any more pension benefits over the year ended30 June 2012. The increase in pension shown below is due to the guaranteed standard pension increaseawarded on 1 April 2012 in accordance with the rules of the Scheme. PS Walsh has not received anydiscretionary pension increase since he started receiving his pension.
Although it is a regulatory requirement to calculate the transfer value of a pension, the transfervalue has no impact on the level of pension benefit being received by PS Walsh now that he has startedto receive his pension. The calculation of the transfer value is based on a prescribed methodology. Theassumptions used are reviewed regularly by the trustees of the Scheme and can vary significantly basedon prevailing market circumstances. The transfer value is broadly the cost to Diageo if it had toprovide the equivalent pension benefit. The transfer value of the annual pension PS Walsh is receivingat 30 June 2011 and 30 June 2012 is shown in the table below. The transfer value as at 30 June 2012has changed for the reasons set out in note (c) below.
D Mahlan does not participate in the final salary pension scheme, but during the year ended30 June 2012 received a cash supplement in lieu of pension provision of £245,000 (equivalent to 40% ofbase pay).
Pensionable Accrued Additional Accrued Transfer Change in TransferAge at service at pension at pension pension at value at transfer value at
30 June 30 June 30 June accrued in 30 June 30 June value during 30 June2012 2012 2011 the year(a) 2012(a)(b) 2011 the year(c) 2012(c)
Years Years £000 pa £000 pa £000 pa £000 £000 £000
PS Walsh . . . . . . . . . . . . . . 57 29 558 20 578 15,796 3,383 19,179
118
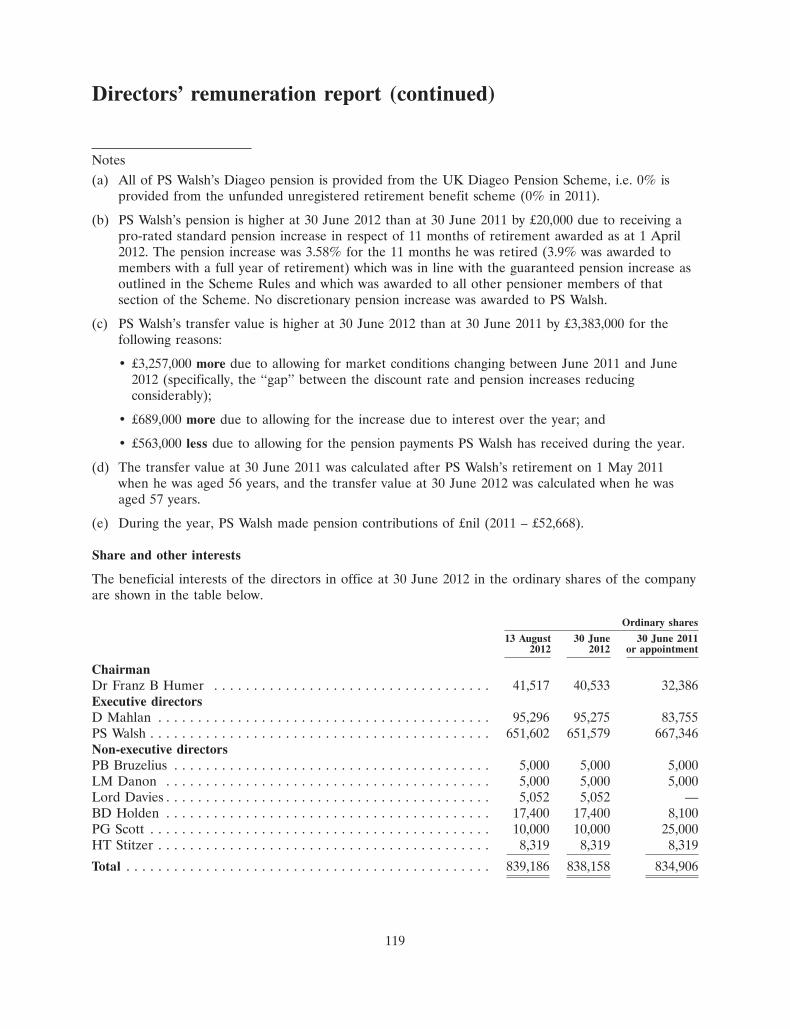
Directors’ remuneration report (continued)
Notes(a) All of PS Walsh’s Diageo pension is provided from the UK Diageo Pension Scheme, i.e. 0% is
provided from the unfunded unregistered retirement benefit scheme (0% in 2011).
(b) PS Walsh’s pension is higher at 30 June 2012 than at 30 June 2011 by £20,000 due to receiving apro-rated standard pension increase in respect of 11 months of retirement awarded as at 1 April2012. The pension increase was 3.58% for the 11 months he was retired (3.9% was awarded tomembers with a full year of retirement) which was in line with the guaranteed pension increase asoutlined in the Scheme Rules and which was awarded to all other pensioner members of thatsection of the Scheme. No discretionary pension increase was awarded to PS Walsh.
(c) PS Walsh’s transfer value is higher at 30 June 2012 than at 30 June 2011 by £3,383,000 for thefollowing reasons:
• £3,257,000 more due to allowing for market conditions changing between June 2011 and June2012 (specifically, the ‘‘gap’’ between the discount rate and pension increases reducingconsiderably);
• £689,000 more due to allowing for the increase due to interest over the year; and
• £563,000 less due to allowing for the pension payments PS Walsh has received during the year.
(d) The transfer value at 30 June 2011 was calculated after PS Walsh’s retirement on 1 May 2011when he was aged 56 years, and the transfer value at 30 June 2012 was calculated when he wasaged 57 years.
(e) During the year, PS Walsh made pension contributions of £nil (2011 – £52,668).
Share and other interests
The beneficial interests of the directors in office at 30 June 2012 in the ordinary shares of the companyare shown in the table below.
Ordinary shares
13 August 30 June 30 June 20112012 2012 or appointment
ChairmanDr Franz B Humer . . . . . . . . . . . . . . . . . . . . . . . . . . . . . . . . . . . 41,517 40,533 32,386Executive directorsD Mahlan . . . . . . . . . . . . . . . . . . . . . . . . . . . . . . . . . . . . . . . . . . 95,296 95,275 83,755PS Walsh . . . . . . . . . . . . . . . . . . . . . . . . . . . . . . . . . . . . . . . . . . . 651,602 651,579 667,346Non-executive directorsPB Bruzelius . . . . . . . . . . . . . . . . . . . . . . . . . . . . . . . . . . . . . . . . 5,000 5,000 5,000LM Danon . . . . . . . . . . . . . . . . . . . . . . . . . . . . . . . . . . . . . . . . . 5,000 5,000 5,000Lord Davies . . . . . . . . . . . . . . . . . . . . . . . . . . . . . . . . . . . . . . . . . 5,052 5,052 —BD Holden . . . . . . . . . . . . . . . . . . . . . . . . . . . . . . . . . . . . . . . . . 17,400 17,400 8,100PG Scott . . . . . . . . . . . . . . . . . . . . . . . . . . . . . . . . . . . . . . . . . . . 10,000 10,000 25,000HT Stitzer . . . . . . . . . . . . . . . . . . . . . . . . . . . . . . . . . . . . . . . . . . 8,319 8,319 8,319
Total . . . . . . . . . . . . . . . . . . . . . . . . . . . . . . . . . . . . . . . . . . . . . . 839,186 838,158 834,906
119
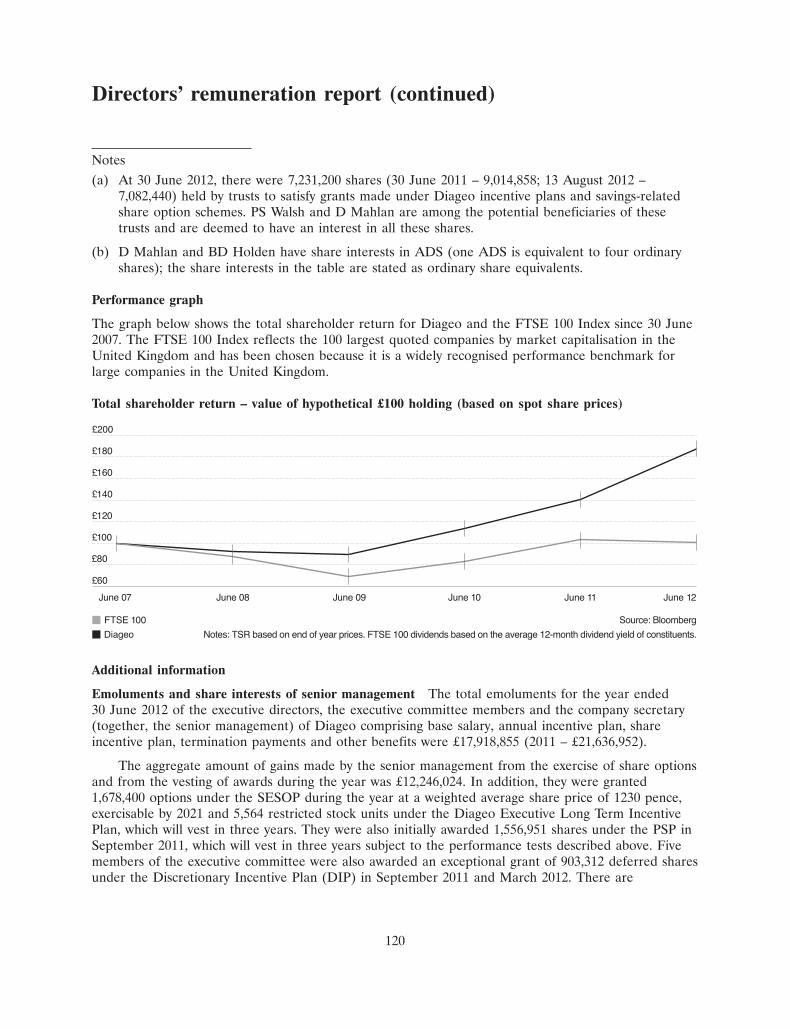
30AUG201217072074
Directors’ remuneration report (continued)
Notes(a) At 30 June 2012, there were 7,231,200 shares (30 June 2011 – 9,014,858; 13 August 2012 –
7,082,440) held by trusts to satisfy grants made under Diageo incentive plans and savings-relatedshare option schemes. PS Walsh and D Mahlan are among the potential beneficiaries of thesetrusts and are deemed to have an interest in all these shares.
(b) D Mahlan and BD Holden have share interests in ADS (one ADS is equivalent to four ordinaryshares); the share interests in the table are stated as ordinary share equivalents.
Performance graph
The graph below shows the total shareholder return for Diageo and the FTSE 100 Index since 30 June2007. The FTSE 100 Index reflects the 100 largest quoted companies by market capitalisation in theUnited Kingdom and has been chosen because it is a widely recognised performance benchmark forlarge companies in the United Kingdom.
Total shareholder return – value of hypothetical £100 holding (based on spot share prices)
FTSE 100
Diageo
June 07 June 08 June 09 June 10 June 11 June 12
£60
£100
£140
£120
£160
£180
£200
£80
Source: Bloomberg
Notes: TSR based on end of year prices. FTSE 100 dividends based on the average 12-month dividend yield of constituents.
Additional information
Emoluments and share interests of senior management The total emoluments for the year ended30 June 2012 of the executive directors, the executive committee members and the company secretary(together, the senior management) of Diageo comprising base salary, annual incentive plan, shareincentive plan, termination payments and other benefits were £17,918,855 (2011 – £21,636,952).
The aggregate amount of gains made by the senior management from the exercise of share optionsand from the vesting of awards during the year was £12,246,024. In addition, they were granted1,678,400 options under the SESOP during the year at a weighted average share price of 1230 pence,exercisable by 2021 and 5,564 restricted stock units under the Diageo Executive Long Term IncentivePlan, which will vest in three years. They were also initially awarded 1,556,951 shares under the PSP inSeptember 2011, which will vest in three years subject to the performance tests described above. Fivemembers of the executive committee were also awarded an exceptional grant of 903,312 deferred sharesunder the Discretionary Incentive Plan (DIP) in September 2011 and March 2012. There are
120

Directors’ remuneration report (continued)
performance conditions attached to the release of these awards and they will be released, subject toachievement of the performance conditions, in phased tranches between September 2014 andSeptember 2019.
Senior management options over ordinary shares At 13 August 2012, the senior management had anaggregate beneficial interest in 2,127,887 ordinary shares in the company and in the following optionsover ordinary shares in the company:
Weightedaverage
Number of exercise priceoptions in pence Option period
D Mahlan . . . . . . . . . . . . . . . . . . . . . . . . . . . . . . . . 611,064 1092 Sep 2008 – Sep 2021PS Walsh . . . . . . . . . . . . . . . . . . . . . . . . . . . . . . . . 2,242,652 1029 Sep 2009 – Sep 2021Other* . . . . . . . . . . . . . . . . . . . . . . . . . . . . . . . . . . 5,614,897 1128 Oct 2005 – Sep 2021
8,468,613
* Other members of the executive committee and the company secretary.
Key management personnel related party transactions Key management personnel of the groupcomprises the executive and non-executive directors, the members of the executive committee and thecompany secretary. As previously disclosed, PS Walsh and G Williams have informed the company thatthey have purchased seasonal developments at Gleneagles from a subsidiary of the company,Gleneagles Resort Developments Limited. The transactions were priced on the same basis as all theexternal seasonal development transactions and were at arm’s length. The values of the transactions atthe date of purchase were as follows: PS Walsh – £43,000 and G Williams – £19,400. Each directorcontinued to hold these seasonal developments at 30 June 2012.
Diageo plc has granted rolling indemnities to the directors and the company secretary, uncappedin amount, in relation to certain losses and liabilities which they may incur in the course of acting asdirectors or company secretary (as applicable) of Diageo plc or of one or more of its subsidiaries.These indemnities continue to be in place at 30 June 2012.
Other than disclosed in this report, no director had any interest, beneficial or non-beneficial, in theshare capital of the company. Save as disclosed above, no director has or has had any interest in anytransaction which is or was unusual in its nature, or which is or was significant to the business of thegroup and which was effected by any member of the group during the financial year, or which havingbeen effected during an earlier financial year, remains in any respect outstanding or unperformed.There have been no material transactions during the last three years to which any director or officer, or3% or greater shareholder, or any spouse or dependent thereof, was a party. There is no significantoutstanding indebtedness to the company from any directors or officer or 3% or greater shareholder.
Statutory and audit requirements This report was approved by a duly authorised committee of theboard of directors, on 21 August 2012 and was signed on its behalf by Lord Davies of Abersoch who issenior non-executive director and chairman of the remuneration committee. As required by theCompanies Act 2006, a resolution to approve the directors’ remuneration report will be proposed atthe AGM and will be subject to an advisory shareholder vote.
The board has followed and complied with the requirements of the Companies Act 2006 withreference to Schedules 5 and 8 of the Large and Medium-sized Companies and Groups (Accounts and
121
Directors’ remuneration report (continued)
Reports) Regulations 2008 and section D of the UK Corporate Governance Code in preparing thisreport and in designing performance-related remuneration for senior executives.
KPMG Audit Plc has audited the report to the extent required by the Regulations, being thesections headed ‘Directors’ remuneration for the year ended 30 June 2012’, ‘Long term incentive plans’,‘Directors’ share options over ordinary shares’, ‘Directors’ interests in PSP and TSR plan awards’ and‘Executive directors’ pension benefits’. In addition, the following sections form part of the auditedfinancial statements: ‘Share and other interests’ and ‘Key management personnel related partytransactions’.
Terms defined in this remuneration report are used solely herein.
Definitions
Adjusted eps – for the purpose of the SESOP, an underlying measure of eps is used, calculated asreported eps adjusted to exclude exceptional items and the impact of changes in exchange rates, toapply a tax rate before exceptional items for each year and to exclude the impacts of IAS 19, 21 and39 from net finance charges.
Average cash – for the purpose of the AIP, average cash is a metric where free cash flow deliveryin each month is weighted by time.
Organic net sales growth – for the purpose of the PSP, the growth in the group’s sales net of exciseduties and calculated on a constant currency basis excluding the impact of acquisitions, in the year inwhich they arise, and disposals.
Organic operating margin improvement – for the purpose of the PSP, the movement in the group’sorganic operating margin. Organic operating margin is the ratio calculated by dividing organicoperating profit by organic net sales expressed as a percentage. Organic operating profit is calculatedon a constant currency basis excluding the impact of exceptional items, acquisitions, in the year inwhich they arise, and disposals.
TSR – for the purpose of the PSP, total shareholder return is the percentage growth in Diageo’s shareprice assuming all dividends and capital distributions are reinvested.
122

Corporate governance report
Dear Shareholder
On behalf of the board, I am pleased to present the corporate governance report for the year ended30 June 2012.
Diversity on boards of directors and elsewhere in corporate life continues to be a significant themein corporate governance. At Diageo, we have long believed that supporting and respecting all aspects ofthe diversity of our people is an important contributor to business performance as well as being theright thing to do. There are five nationalities represented on our board and four of the 10 directors arewomen. In addition to the individual skill sets that each director brings, we continue to believe that thishelps to provide an appropriate perspective on business issues and a balance of the skills, experience,independence and knowledge of the company needed to enable the board to: discharge effectively itsresponsibilities for governance of the company, including setting the company’s strategic aims and itsvalues; providing the leadership to put them into effect; supervising and constructively challenging themanagement who are responsible for the day to day operational running of the business; and reportingto shareholders on their stewardship.
We endeavour in this report to give a sense of how these responsibilities are approached bydescribing our corporate governance structures and procedures and the work of the board and theexecutive committee.
The principal corporate governance rules applying to UK companies listed on the London StockExchange (LSE) for the year ended 30 June 2012 are contained in The UK Corporate GovernanceCode as updated and published by the Financial Reporting Council (FRC) in May 2010 (the Code) andthe UK Financial Services Authority (FSA) Listing Rules, which require companies listed on the MainMarket of the LSE to describe, in their annual report, their corporate governance from two points ofview: the first dealing generally with their application of the Code’s main principles and the seconddealing specifically with non-compliance with any of the Code’s provisions. The two descriptionstogether are designed to give shareholders a picture of governance arrangements in relation to theCode as a criterion of good practice. Diageo has complied with all relevant provisions set out in theCode throughout the year. The Code is publicly available under the heading ‘Corporate Governance’ atthe website of the FRC, www.frc.org.uk.
Diageo must also comply with corporate governance rules contained in the FSA Disclosure andTransparency Rules as well as certain related provisions in the Companies Act 2006 (the Act).
As well as being subject to UK legislation and practice, as a company listed on the New YorkStock Exchange (NYSE), Diageo is subject to the listing requirements of the NYSE and the rules ofthe Securities and Exchange Commission (SEC). Compliance with the provisions of the US Sarbanes-Oxley Act of 2002 (SOX), as it applies to foreign issuers, is continually monitored. Whilst the directorsbelieve that the group’s corporate governance policies continue to be robust, changes have been andwill continue to be made in light of the rules that are in place at any point in time. Diageo followsUK corporate governance practice; differences from the NYSE corporate governance standards aresummarised below within this report and on the company’s website at www.diageo.com.
The way in which the Code’s principles of good governance and relevant provisions of SOX andapplicable laws and regulations are applied is described within this corporate governance report.
PD TunnacliffeCompany secretary
123

Corporate governance report (continued)
Board of directors
Membership of the board and board committees, other directorships and attendance at meetings Thechairmen, senior non-executive director and other members of the board, audit committee, nominationcommittee and remuneration committee are as set out above in the biographies of directors andmembers of the executive committee. The directors’ biographies also show the significant othercommitments of the chairman and other directors and whether there have been any changes to themduring the year. Directors’ attendance during the year at board meetings, meetings of the audit,nomination and remuneration committees and at the annual general meeting was as set out in the tableat the end of this report.
The board considers that it is beneficial for the executive directors to hold an external directorshipto broaden their experience and normally this would be limited to one company. The chief executive,PS Walsh, holds UK non-executive directorships in Unilever PLC and Avanti CommunicationsGroup plc and a US non-executive directorship in FedEx Corporation. The time commitment for thesethree directorships is not considered to be onerous and the board considers that, given the importanceof the United States to the company’s business, the FedEx directorship is of benefit to Mr Walsh interms of market awareness, US business practices and networking. The chief operating officer, IMMenezes, appointed a director on 2 July 2012, holds a US non-executive directorship in Coach, Inc.The chief financial officer, D Mahlan holds a UK non-executive directorship in Experian plc effective1 September 2012.
There is a clear separation of the roles of the chairman and the chief executive. The chairman,Dr FB Humer, is responsible for the running of the board and for ensuring all directors are fullyinformed of matters sufficient to make informed judgements. As chief executive, PS Walsh hasresponsibility for implementing the strategy agreed by the board and for managing the group. He issupported in this role by the executive committee.
The non-executive directors, all of whom the board has determined are independent, areexperienced and influential individuals from a range of industries, backgrounds and countries. Theirdiverse mix of skills and business experience is a major contribution to the proper functioning of theboard and its committees, ensuring that matters are fully debated and that no individual or groupdominates the board’s decision-making processes.
Through the nomination committee, the board ensures that plans are in place for the succession ofthe executive and non-executive directors.
A summary of the terms and conditions of appointment of the non-executive directors is availableat www.diageo.com or on request from the company secretary.
Activities of the board It is the responsibility of the chairman and the company secretary to workclosely together in planning the annual programme and agendas for meetings. During the year, sixscheduled board meetings were held, five in the United Kingdom and one in Turkey, whichincorporated a specific Turkey and Western Europe business focus and involved visits to customers. Inaddition, an annual strategy conference with the full executive committee was held offsite at which thegroup’s strategy was reviewed in depth.
When directors were unable to attend a meeting, they were advised of the matters to be discussedand took advantage of the opportunity to make their views known to the chairman prior to themeeting. The board manages overall control of the company’s affairs with reference to the formalschedule of matters reserved for the board for decision. The schedule was last revised in June 2012.
124
Corporate governance report (continued)
The board makes decisions and reviews and approves key policies and decisions of the company, inparticular in relation to: group strategy and operating plans; corporate governance; compliance withlaws, regulations and the company’s code of business conduct; business development, including majorinvestments and disposals; financing and treasury; appointment or removal of directors and thecompany secretary; risk management; financial reporting and audit; corporate sustainability andresponsibility, ethics and the environment; and pensions.
The Act sets out directors’ general duties concerning conflicts of interest and related matters. Theboard has agreed an approach and adopted guidelines for dealing with conflicts of interest and hasadded responsibility for authorising conflicts of interest to the schedule of matters reserved for theboard. The board confirmed that it was aware of no situations that may or did give rise to conflictswith the interests of the company other than those that may arise from directors’ other appointments asdisclosed in their biographies above. In accordance with the articles, the board authorised the chairmanor the company secretary, as appropriate, to receive notifications of conflicts of interest on behalf ofthe board and to make recommendations as to whether the relevant matters should be authorised bythe board. The company has complied with these procedures during the year.
All directors are equally accountable for the proper stewardship of the company’s affairs.
The non-executive directors have a particular responsibility for ensuring that the business strategiesproposed are fully discussed and critically reviewed. This enables the directors to promote the successof the company for the benefit of its shareholders as a whole, whilst having regard to, among othermatters, the interests of employees, the fostering of business relationships with customers, suppliers andothers, and the impact of the company’s operations on the communities in which the business operatesand the environment.
The non-executive directors also oversee the operational performance of the whole group. To dothis they have full and timely access to all relevant information, with updates also provided ongovernance and regulatory matters affecting the company. In addition, executive committee membersand other senior executives are invited, as appropriate, to board and strategy meetings to makepresentations on their areas of responsibility. The chairman and non-executive directors are also invitedto attend the executive committee members’ senior leadership meetings to gain further insight intodifferent aspects of the business.
In order to fulfil their duties, procedures are in place for directors to seek both independentadvice and the advice and services of the company secretary who is responsible for advising the board,through the chairman, on all governance matters. The non-executive directors meet independentlywithout the chairman present, and also meet with the chairman independently of management, on aregular basis.
The non-executive directors fulfil a key role in corporate accountability. The remits of the audit,the nomination and the remuneration committees of the board are set out below and membership ofthese committees is as set out above in the ‘Board of directors and executive committee’ section of thisannual report. The company secretary acts as secretary to all of these committees. The terms ofreference of the committees are available on the company’s website at www.diageo.com/en-row/ourbusiness/aboutus/corporategovernance.
Induction, training and business engagement There is a formal induction programme for newdirectors; they meet with the executive committee members individually and receive orientation trainingfrom the relevant senior executive in relation to the group and its business, for example in relation toits assurance processes, environmental and social policies, corporate responsibility policies and practices
125

Corporate governance report (continued)
and governance matters. Following this initial induction, appropriate business engagements arearranged for the chairman and the non-executive directors. In addition to those associated withoverseas board meetings, during the year these included: visits to the supply operations in Scotland; thechairman of the audit committee’s visit to the Nigerian operations; the chairman and seniorindependent director taking advantage of overseas business commitments to meet with localmanagement; and visits to the customer collaboration centre in the UK.
All directors are provided with the opportunity, and encouraged to attend regular training toensure they are kept up to date on relevant legal developments or changes and best practice andchanging commercial and other risks. Typical training experience for directors includes attendance atseminars, forums, conferences and working groups and, during the year ended 30 June 2012, alsoincluded internally led training on compliance, information security and business continuity. Trainingfor directors is kept under review during the year and forms part of the chairman’s individual meetingsheld with each director, with feedback sought from directors on areas and topics that they want to becovered.
Performance evaluation During the year, an evaluation of the board’s effectiveness, including theeffectiveness of the audit committee, the nomination committee and the remuneration committee wasundertaken internally by way of a written questionnaire followed by the chairman of the board meetingindividually with all directors.
The board questionnaire focused on the performance of the board throughout the past year in theareas of: strategy, and how effective the board had been in supporting the development of strategy;performance management; management succession, and talent; risk management; ensuring appropriateknowledge of the business and its people; the board’s collective judgement; boardroom dynamics; areasin which the board felt it could improve its performance; and external factors that the board shouldremain particularly alert to.
The questionnaires for the committees focused on the performance of the respective committeesthroughout the past year; whether the agendas appropriately covered the remits of the committees; howthe performance of the respective committees could be enhanced and areas of focus for theforthcoming year.
A report was prepared for the board on its effectiveness and that of its committees. The reportconcluded that the board and its committees continued to operate effectively, meeting the requirementsand spirit of the Code. Processes were seen to have improved to allow a focus and time spent on themost important matters for the company, including the development of strategy, and the climate in theboardroom continued to create the optimum conditions for good decision making and sound guidance.The importance of ensuring appropriate succession to the board to maintain boardroom dynamics andthe appropriate balance of skills, knowledge, diversity and experience was recognised in the search fornon-executive directors and the appointment, with effect from 1 October 2012, of Ho KwonPing.
Areas identified for the board and committees to maintain the appropriate governance for anddevelopment of the business have been integrated into the evolving annual agendas of the board and itscommittees.
The performance of each director was evaluated by the chairman based on self-analysis and inputfrom the other directors. A report on the individual performance evaluation process was given to thenomination committee. Following the performance evaluation of individual directors, the chairman hasconfirmed that the non-executive directors standing for re-election at this year’s annual general meetingcontinue to perform effectively and demonstrate commitment to their roles. The chairman’s
126

Corporate governance report (continued)
performance was evaluated by the directors, using an internally produced questionnaire which wascompleted and returned to the senior non-executive director, who discussed the feedback in a meetingwith the executive and non-executive directors and then privately with the chairman.
It is the board’s intention to continue to review annually its performance and that of itscommittees and individual directors. In respect of the evaluation process in 2013, it is likely that thesame method of internal facilitation will be used.
Audit committee
Role of the audit committee The audit committee is responsible for monitoring and reviewing:
• the integrity of the financial statements, including a review of the significant financial reportingjudgements contained in them;
• the effectiveness of the group’s internal control and risk management and of control overfinancial reporting;
• the effectiveness of the global audit and risk function, including the programme of workundertaken by that function;
• the group’s policies and practices concerning business conduct and ethics, includingwhistleblowing;
• the group’s overall approach to securing compliance with laws, regulations and company policiesin areas of risk; and
• the company’s relationship with the external auditor, including its independence andmanagement’s response to any major external audit recommendations.
For the purposes of the Code and the relevant rule under the US Securities Exchange Act of 1934(Exchange Act), the board has determined that PG Scott is independent and may be regarded as anaudit committee financial expert.
The chairman, the chief financial officer, the group controller, the head of global audit and risk,the group chief accountant and the external auditor are normally invited to attend meetings.
The audit committee met privately with the external auditor and with the head of global audit andrisk as appropriate.
Work of the audit committee During the year, the audit committee formally reviewed the annualreports and associated preliminary year-end results announcement, focusing on key areas of judgement,provisioning and complexity, critical accounting policies and any changes required in these areas orpolicies. In addition, the audit committee reviewed the interim results announcement, which includedthe interim financial statements and the company’s interim management statements. The auditcommittee also reviewed the work of the filings assurance committee described below and was updatedon litigation risks by the group’s general counsel.
The audit committee received detailed presentations from certain senior executives on themanagement of key risk and control issues in their respective business areas, reviewed the effectivenessand findings from internal control and risk management processes described below and reviewed thework of the compliance programme and the work of the audit and risk committee, described below.
127

Corporate governance report (continued)
The audit committee had available to it the resources of the global audit and risk function, theactivities of which are described below.
During the year, the audit committee reviewed the external audit strategy and the findings of theexternal auditor from its review of the interim results and its audit of the consolidated financialstatements.
The audit committee reviews annually the appointment of the auditor and, on the auditcommittee’s recommendation, the board agreed in August 2012 to recommend to shareholders at theannual general meeting in 2012, the re-appointment of the external auditor for a period of one year.The current overall tenure of the external auditor dates from 1997. Any decision to open the externalauditor to tender is taken on the recommendation of the audit committee, based on the results of theeffectiveness review described below. There are no contractual obligations that restrict the company’scurrent choice of external auditor.
The audit committee assessed the ongoing effectiveness of the external auditor and audit processon the basis of meetings and a questionnaire-based internal review with finance and global audit andrisk staff and other senior executives. In reviewing the independence of the external auditor, the auditcommittee considered a number of factors. These include: the standing, experience and tenure of theexternal audit director; the nature and level of services provided by the external auditor; andconfirmation from the external auditor that it has complied with relevant UK and US independencestandards.
The group has a policy on auditor independence and on the use of the external auditor fornon-audit services, which is reviewed annually, most recently in June 2012. Under this policy theprovision of any non-audit service must be approved by the audit committee, unless the proposedservice is both expected to cost less than £250,000 and also falls within one of a number of servicecategories which the audit committee has pre-approved. These pre-approved service categories may besummarised as follows:
• accounting advice, employee benefit plan audits, and audit or other attestation services, nototherwise prohibited;
• due diligence and other support in respect of acquisitions, disposals, training and other businessinitiatives; and
• certain specified tax services, including tax compliance, tax planning and related implementationadvice in relation to acquisitions, disposals and other reorganisations.
Fees paid to the auditor for audit, audit related and other services are analysed in note 3(c) to theconsolidated financial statements. The main non-audit related services provided by the auditor duringthe year were in respect of due diligence work for potential acquisitions, a review of internal controls,process review and tax advice. The auditor was considered to be best placed to provide these servicesand was the provider that offered the best value. The nature and level of all services provided by theexternal auditor is a factor taken into account by the audit committee when it reviews annually theindependence of the external auditor.
Nomination committee
Role of the nomination committee The nomination committee is responsible for keeping under reviewthe composition of the board and succession to it, and succession planning for senior managementpositions. It makes recommendations to the board concerning appointments to the board, whether of
128

Corporate governance report (continued)
executive or non-executive directors, having regard to the balance and structure of the board and therequired blend of skills, experience, independence and diversity.
The nomination committee also makes recommendations to the board concerning there-appointment of any non-executive director at the conclusion of his or her specified term and there-election of any director by shareholders under the retirement provisions of the company’s articles ofassociation. No director is involved in determining his or her own re-appointment or re-election.
Any new directors are appointed by the board and, in accordance with the company’s articles ofassociation, they must be elected at the next AGM to continue in office. All existing directors retire byrotation every year, as required by the Code.
Activities of the nomination committee The principal activities of the nomination committee duringthe year were: the review of individual performance; a review of the executive committee structure,membership and succession planning for it and senior leadership positions; and the consideration ofpotential non-executive directors.
In respect of the appointment of Ho KwonPing to the board with effect from 1 October 2012, therecruitment process included the development of a candidate profile and the engagement of aprofessional search agency specialising in the recruitment of high calibre non-executive directors.Reports on potential appointees were provided to the committee, which, after careful consideration,made a recommendation to the board.
In respect of the appointment of IM Menezes to the board and his appointment as chief operatingofficer, the committee made a recommendation to the board, believing that the appointmentsstrengthened the executive leadership of the business.
Diageo supports diversity within its board of directors, including gender diversity. Currently thereare four female directors, out of a total of 10 board members. We believe that all four bring a wealthof international business experience and are an asset to the company and the board.
Without seeking to set a specific goal for female representation on the board, it remains ouraspiration to maintain a high level of diversity, including gender diversity, within the boardroom,appropriate to and reflecting the global nature of the company and the strategic imperatives the boardhas agreed upon.
For similar reasons, Diageo has set itself a goal to increase the number of women in leadershippositions in the company. Currently 26% (2011: 27%) fill leadership positions. The aim of the board isto continue to ensure that the company has the right balance of skills, diversity, in all forms, andexperience.
This approach has led Diageo to be well represented by women on the board and having fullyconsidered the succession to the executive committee and to leadership positions over theensuing years, the board is confident it will continue to be able to report progress on the genderdiversity agenda.
Remuneration committee
Role of the remuneration committee The role of the remuneration committee and details of how thecompany applies the principles of the Code in respect of directors’ remuneration are set out in thedirectors’ remuneration report.
129
Corporate governance report (continued)
The chairman and the chief executive may, by invitation, attend remuneration committee meetings,except when their own remuneration is discussed. No director is involved in determining his or her ownremuneration.
Executive direction and control
Executive committee The executive committee, appointed and chaired by the chief executive, consistsof the individuals responsible for the key components of the business: the North America, Europe,Africa, Latin America and Caribbean and Asia Pacific markets, global supply and global functions. Themembers of the committee and their biographies are set out above in the ‘Board of directors andexecutive committee’ section of this annual report. During the year, IM Menezes was appointed chiefoperating officer and L Schwartz was appointed president of North America.
The executive committee met, fully, five times during the year, and spent most of its timediscussing strategy, including individual market and brand (and category) strategies, managementsuccession and talent and other people matters, and financial and operational performance. Meetingswere held in the US, the UK (three meetings) and India. In addition, scheduled interim updatemeetings were held by teleconference throughout the year. Responsibility and authority (within thefinancial limits set by the board) are delegated by the chief executive to individual members of theexecutive committee who are accountable to him for the performance of their business units.
Executive direction and control procedures include approval of annual strategic plans submittedby each business unit executive and periodic business reviews. These reviews are generally attended bythe regional president responsible for the market (and in certain cases additional members of theexecutive committee) and are held in the relevant market. The reviews focus on business performancemanagement and specific issues around brands, people, key business decisions and risk management.
The chief executive has created several executive working groups to which are delegated particulartasks, generally with specific time spans and success criteria. He has also created committees, intendedto have an ongoing remit, including the following.
Audit and risk committee Chaired by the chief executive and responsible for: overseeing the approachto securing effective internal control and risk management in the group; reviewing the adequacy of thegroup’s sources of assurance over the management of key risks; reviewing management’sself-assessment process over internal controls; reviewing the effectiveness of the group’s complianceprogramme; and reporting periodically on the above to the audit committee or to the board. Inaddition, the audit and risk committee is responsible for promoting the culture and processes thatsupport effective compliance with the group’s codes of conduct, global policies and business guidelinesthroughout the business and supports the audit committee, board and executive committee in satisfyingits corporate governance responsibilities relating to internal control and risk management within thegroup.
Corporate citizenship committee Chaired by the chief executive and responsible for making decisionsor, where appropriate, recommendations to the board or executive committee concerning policies,issues and measurement and reporting for the following impacts across Diageo’s value chain: alcohol insociety; water; broader environmental sustainability; community; our people and governance and ethics.Progress in these areas is reported periodically to the board and publicly through a separateSustainability & Responsibility Report, selected aspects of which are subject to external assurance. Thisreport and the group’s social, ethical and environmental policies are published on the Diageo website.
130

Corporate governance report (continued)
Two executive working groups (one on alcohol in society, chaired by the corporate relationsdirector, and one on environmental performance, chaired by the president, global supply and globalprocurement) assist the committee with decisions on specific issues.
Finance committee Chaired by the chief financial officer and including the chief executive, thiscommittee is responsible for making recommendations to the board on funding strategy, capitalstructure and management of financial risks and the policies and control procedures (including financialissues relating to treasury and taxation) required to implement the company’s financial strategy andfinancial risk management policies. In certain specific circumstances, the board has delegated authorityto the finance committee to make decisions in these areas. Treasury activity is managed centrally withintightly defined dealing authorities and procedures recommended by the finance committee andapproved by the board.
Filings assurance committee Chaired by the chief financial officer and including the chief executive,this committee is responsible for implementing and monitoring the processes which are designed toensure that the company complies with relevant UK, US and other regulatory reporting and filingprovisions, including those imposed by SOX or derived from it. As at the end of the period covered bythis report, the filings assurance committee, with the participation of the chief executive and chieffinancial officer, carried out an evaluation of the effectiveness of the design and operation of disclosurecontrols and procedures. These are defined as those controls and procedures that are designed toensure that information required to be disclosed in reports filed under the Exchange Act is recorded,processed, summarised and reported within specified time periods. As of the date of the evaluation, thechief executive and the chief financial officer concluded that the design and operation of thesedisclosure controls and procedures were effective to ensure that information required to be disclosed inthe reports that the company files or submits under the Exchange Act is accumulated andcommunicated to the management, including the company’s chief executive and chief financial officer,as appropriate, to allow timely decisions regarding disclosure.
Additional information
Internal control and risk management
Diageo’s aim is to manage risk and to control its business and financial activities cost-effectively and ina manner that enables it to: exploit profitable business opportunities in a disciplined way; avoid orreduce risks that can cause loss, reputational damage or business failure; support operationaleffectiveness; and enhance resilience to external events. To achieve this, an ongoing process has beenestablished for identifying, evaluating and managing risks faced by the group. This process, whichcomplies with the requirements of the Code, has been in place for the full financial year and up to thedate the financial statements were approved and accords with the guidance issued by the FinancialReporting Council in October 2005, ‘Internal Control: Revised Guidance for Directors on theCombined Code’, also known as the Turnbull guidance (as amended by the Flint review).
The board acknowledges that it is responsible for the company’s systems of internal control andrisk management and for reviewing their effectiveness. The board confirms that, through the activitiesof the audit committee described above, it has reviewed the effectiveness of the company’s systems ofinternal control and risk management described below.
All business units and the executive committee are required to maintain a process to ensure keyrisks are identified, evaluated and managed appropriately. This process is also applied to majorbusiness decisions or initiatives, such as systems implementations, new product development, business
131

Corporate governance report (continued)
combination activity or significant business strategy implementation. Additional risk managementactivity is focused directly towards operational risks within the business, including health and safety,product quality and environmental risk management.
Business unit risk assessments, and the activities planned to manage those risks, are reviewed byrelevant executives, for example at periodic business reviews. The oversight of primary level risks, asdetailed in the executive committee risk assessment, is allocated as appropriate between the board,board committees and the executive committee. The executive committee risk assessment, and selectedkey risk assessments, are reviewed by the audit and risk committee and by the audit committee.
In addition, business units are required to self-assess the effectiveness of the design of theirinternal control framework. Relevant executives review the results of these self-assessments andsummary reporting is provided to the audit and risk committee and audit committee. Risk managementand internal control processes encompass activity to mitigate financial, operational, compliance andreputational risk. Specific processes are also in place to ensure management maintain adequate internalcontrol over financial reporting, as separately reported below.
A network of risk management committees is in place across the group, which has overallaccountability for supporting the audit and risk committee in its corporate governance responsibilitiesby proactively and effectively identifying and managing risk and monitoring the effectiveness of internalcontrols.
Processes are in place to ensure appropriate action is taken, where necessary, to remedy anydeficiencies identified through the group’s internal control and risk management processes.
The global governance and control and global audit and risk functions give the audit committee,board and executive committee visibility and understanding of the group’s key risks and riskmanagement capability and provide assurance over the quality of the group’s internal control andmanagement of key risks in line with a plan agreed by the audit committee.
The above risk management processes and systems of internal control, together with the filingsassurance processes, are designed to manage, rather than eliminate, the risk of failure to achieve thegroup’s strategic objectives. It should be recognised that such systems can only provide reasonable, notabsolute, assurance against material misstatement or loss.
During the year, in line with the revised principles of the Code, the board considered the natureand extent of the risks it was willing to take to achieve its strategic goals and reviewed the existinginternal statement of risk appetite, which describes existing risk behaviours and identifies a set of highlevel risk statements underpinning them. The statement of risk appetite serves to complement Diageo’srisk policy and was considered and recommended to the board by both the audit and risk committeeand the audit committee.
The company has in place internal control and risk management systems in relation to thecompany’s financial reporting process and the group’s process for preparation of consolidated accounts.These systems are described above and under the headings ‘Filings assurance committee’, ‘Audit andrisk committee’ and ‘Management’s report on internal control over financial reporting’. Diageo’s filingsassurance committee and audit and risk committee are each responsible for overseeing elements ofthese internal control and risk management systems. Furthermore, a review of the consolidatedfinancial statements is completed by management to ensure that the financial position and results ofthe group are appropriately reflected therein.
132

Corporate governance report (continued)
Compliance and ethics programme
Diageo is committed to conducting its business responsibly and in accordance with all laws andregulations to which its business activities are subject. The board has a comprehensive training andeducation programme for both employees and the network of compliance and ethics ambassadors,whose role it is to be the key point of contact for compliance within each market and function. Thecode of business conduct is also supported by a set of global policies. Work commenced during the yearto simplify these policies and to make access and governance of the policies easier.
The Diageo marketing code together with Diageo’s digital code of practice remain the principlesthat Diageo follows in relation to marketing and promotional activities of its brands and products.
In addition, in accordance with the requirements of SOX (and related SEC rules), Diageo hasadopted a code of ethics covering its chief executive, chief financial officer, regional presidents andother identifiable persons in the group, including those performing senior accounting and controllerfunctions. No amendments to, or waivers in respect of, the code of ethics were made during the year.The full texts of the code of ethics, code of business conduct, marketing code and other Diageo policiesthat comprise the compliance programme are available on the company’s website at www.diageo.com/en-row/ourbusiness/aboutus/corporategovernance.
Compliance and ethics programme guidelines specify the manner in which any potential violationsof these codes should be dealt with, including line manager reporting and an independent ‘SpeakUp’employee help line. The latter is operated independently and all reports are sent, in confidence, to theglobal compliance and ethics director and head of corporate security for review, and where appropriate,investigation and escalation to the audit committee as required. There is an annual certificationrequirement for all management level employees to confirm compliance with the code of businessconduct and to identify areas of possible non-compliance to the global compliance and ethics director.To reinforce our stand against bribery or corruption in any form and to create greater simplicity in ourguidance in this area, Diageo launched a new global anti-corruption policy during the year.
Both the audit and risk committee and the audit committee review the operation of thecompliance programme.
Relations with shareholders
The company values its dialogue with both institutional and private investors. The board’s primarycontact with institutional shareholders is through the chief executive and chief financial officer.
The chief executive and chief financial officer are supported by the investor relations department,who are in regular contact with institutional shareholders and sell-side analysts. Coverage of thecompany by sell-side analysts is circulated to the board. The board also ensures that all directorsdevelop an understanding of the views of major institutional shareholders through an independentsurvey of shareholder opinion. In addition, major shareholders are invited to raise any company mattersof interest to them at an annual meeting with the chairman and senior non-executive director. Thechairman reports on any meeting to the board. As reported in the remuneration report, shareholderengagement meetings were also held with the chairman of the remuneration committee.
Investor seminars and analyst presentations, including those following the announcement of interimresults and preliminary year end results, are webcast and other presentations made to institutionalinvestors are available on the company’s website.
133

Corporate governance report (continued)
For the year ended 30 June 2012, Diageo produced an annual report, which is available to allshareholders on its website, or in paper form by election or on request. As an alternative to receiving apaper notification through the post, shareholders may elect to receive email notification that thedocuments are available to be accessed on the company’s website. Shareholders can also choose toreceive email notification when new company information is published on www.diageo.com. Thewebsite also provides private shareholders with the facility to check their shareholdings online and tosend any questions they may have to the company. Private shareholders are invited to write to thechairman or any other director and express their views on any issues of concern at any time and theAGM provides an opportunity for private shareholders to put their questions in person.
The chairmen of the audit, nomination and remuneration committees are normally available atthe AGM to take any relevant questions and all other directors attend, unless illness or anotherpressing commitment precludes them from doing so. At general meetings, a schedule of the proxy votescast is made available to all shareholders and is published on www.diageo.com. The company proposesa separate resolution on each substantially separate issue and does not bundle resolutions togetherinappropriately. Non-binding resolutions on the receipt of the reports and accounts and the approval ofthe directors’ remuneration report are put to shareholders at the AGM.
Charitable and political donations
During the year, total charitable donations made by the group were £28.7 million (2011 –£28.0 million). UK group companies made donations of £12.0 million (2011 – £10.5 million) tocharitable organisations including £1.1 million (2011 – £1.1 million) to the Diageo Foundation and£8.1 million (2011 – £7.7 million) to the Thalidomide Trust. In the rest of the world, group companiesmade charitable donations of £16.7 million (2011 – £17.5 million) including £1.5 million to theThalidomide Foundation Ltd in Australia (2011 – £3.0 million).
The group has not given any money for political purposes in the United Kingdom and made nodonations to EU political organisations and incurred no EU political expenditure during the year. Thegroup made contributions to non-EU political parties totalling £0.4 million during the year (2011 –£0.6 million). These were all made, consistent with applicable laws, to federal and state candidates andcommittees in North America, where it is common practice to make political contributions. Noparticular political persuasion was supported and contributions were made with the aim of promoting abetter understanding of the group and its views on commercial matters, as well as a generally improvedbusiness environment.
Supplier payment policies and performance
Given the international nature of the group’s operations, there is no group standard in respect ofpayments to suppliers. The group has moved to a standard term of 60 days in respect of payments tothe majority of suppliers. Where this standard term does not yet apply, operating companies areresponsible for agreeing terms and conditions for their business transactions when orders for goods andservices are placed, so that suppliers are aware of the terms of payment and the relevant terms areincluded in contracts where appropriate. Creditor days for Diageo plc have not been calculated, as thecompany had no material trade creditors at 30 June 2012. The majority of the company’s invoices forgoods and services are settled by subsidiaries acting on its behalf.
134

Corporate governance report (continued)
Going concern
The group’s business activities together with significant risk factors are set out above in the ‘Businessdescription’ section of this annual report. The liquidity position, capital resources and risk managementprocesses covering exposure to currency, interest rate, credit, liquidity and price risk are described inthe notes to the consolidated financial statements.
The group has significant financial resources, strong cash generation from operations and goodaccess to debt markets. Consequently, the directors believe that the group is well placed to manage itsbusiness risks despite the current uncertain economic environment.
The directors confirm that, after making appropriate enquiries, they have reasonable expectationthat the group has adequate resources to continue in operational existence for the foreseeable future.Accordingly, they continue to adopt the going concern basis in preparing the financial statements.
Management’s report on internal control over financial reporting
Management, under the supervision of the chief executive and chief financial officer, is responsible forestablishing and maintaining adequate control over the group’s financial reporting. Diageo’s internalcontrol over financial reporting includes policies and procedures that: pertain to the maintenance ofrecords that, in reasonable detail, accurately and fairly reflect transactions and dispositions of assets;provide reasonable assurance that transactions are recorded as necessary to permit the preparation offinancial statements in accordance with International Financial Reporting Standards (IFRS) asendorsed and adopted for use in the European Union (EU) and IFRS as issued by the InternationalAccounting Standards Board (IASB); provide reasonable assurance that receipts and expenditures aremade only in accordance with authorisation of management and the directors of the company; andprovide reasonable assurance regarding prevention or timely detection of any unauthorised acquisition,use or disposition of assets that could have a material effect on the consolidated financial statements.
Management has assessed the effectiveness of Diageo’s internal control over financial reporting (asdefined in Rules 13(a)-13(f) and 15(d)-15(f) under the Exchange Act) based on the framework in‘Internal Control – Integrated Framework’, issued by the Committee of Sponsoring Organisations of theTreadway Commission (COSO). Based on this assessment, management concluded that, as at 30 June2012, internal control over financial reporting was effective.
Any internal control framework, no matter how well designed, has inherent limitations, includingthe possibility of human error and the circumvention or overriding of controls and procedures and maynot prevent or detect misstatements. Also, projections of any evaluation of effectiveness to futureperiods are subject to the risk that controls may become inadequate because of changes in conditionsor because the degree of compliance with the policies or procedures may deteriorate.
During the period covered by this report, there were no changes in internal control over financialreporting that have materially affected or are reasonably likely to materially affect the effectiveness ofinternal control over financial reporting.
KPMG Audit Plc, an independent registered public accounting firm, who also audit the group’sconsolidated financial statements, has audited the effectiveness of the group’s internal control overfinancial reporting, and has issued an unqualified report thereon, which is included on the page 242and 243 of this document.
135

Corporate governance report (continued)
Directors’ responsibilities in respect of the annual report and financial statements
The directors are responsible for preparing the annual report, the information filed with the SEC onForm 20-F and the group and parent company financial statements in accordance with applicable lawand regulations.
Company law requires the directors to prepare group and parent company financial statementsfor each financial year. Under that law they are required to prepare the group financial statements inaccordance with IFRS as adopted for use in the EU and applicable law and have elected to preparethe parent company financial statements in accordance with UK Accounting Standards and applicablelaw (UK Generally Accepted Accounting Practice). The directors have taken responsibility to preparethe group financial statements also in accordance with IFRS as issued by the IASB. The directors havealso presented certain additional information required by the SEC for the purposes of the company’sForm 20-F.
The group financial statements are required by law and IFRS to present fairly the financialposition and the performance of the group; the Act provides in relation to such financial statementsthat references in the relevant part of the Act to financial statements giving a true and fair view arereferences to their achieving a fair presentation.
The parent company financial statements are required by law to give a true and fair view of thestate of affairs of the parent company.
In preparing each of the group and parent company financial statements, the directors arerequired to:
• select suitable accounting policies and then apply them consistently;
• make judgements and estimates that are reasonable and prudent;
• for the group financial statements, state whether they have been prepared in accordance withIFRS as adopted for use in the EU and IFRS as issued by the IASB;
• for the parent company financial statements, state whether applicable UK Accounting Standardshave been followed, subject to any material departures disclosed and explained in the parentcompany financial statements; and
• prepare the financial statements on the going concern basis unless it is inappropriate to presumethat the group and the parent company will continue in business.
The directors are responsible for keeping proper accounting records that are sufficient to show andexplain the parent company’s transactions and disclose with reasonable accuracy at any time thefinancial position of the parent company and enable them to ensure that its financial statements complywith the Companies Act 2006 and, with regard to group consolidated financial statements, Article 4 ofthe IAS Regulation. They have general responsibility for taking such steps as are reasonably open tothem to safeguard the assets of the group and to prevent and detect fraud and other irregularities.
Under applicable UK and US law and regulations, the directors are also responsible for preparinga directors’ report, a directors’ remuneration report and a corporate governance report that complywith that law and those regulations.
Legislation in the United Kingdom governing the preparation and dissemination of financialstatements may differ from legislation in other jurisdictions.
136
Corporate governance report (continued)
Responsibility statement
Each of the directors, whose names are set out above in the ‘Board of directors and executivecommittee’ section of this annual report, confirms that to the best of his or her knowledge:
• the consolidated financial statements contained in the annual report for the year ended 30 June2012, which have been prepared in accordance with IFRS as issued by the IASB and asendorsed and adopted for use in the EU, give a true and fair view of the assets, liabilities,financial position and profit of the group; and
• the management report represented by the directors’ report contained in the annual report forthe year ended 30 June 2012 includes a fair review of the development and performance of thebusiness and the position of the group, together with a description of the principal risks anduncertainties that the group faces.
The responsibility statement was approved by the board of directors on 22 August 2012.
New York Stock Exchange corporate governance rules
Under applicable SEC rules and the NYSE’s corporate governance rules for listed companies, Diageomust disclose any significant ways in which its corporate governance practices differ from thosefollowed by US companies under NYSE listing standards.
Diageo believes the following to be the significant areas in which there are differences between itscorporate governance practices and NYSE corporate governance rules applicable to US companies.This information is also provided on the company’s website at www.diageo.com.
• Basis of regulation: UK listed companies are required to include in their annual report anarrative statement of (i) how they have applied the principles of the Code and (ii) whether ornot they have complied with the best practice provisions of the Code. NYSE listed companiesmust adopt and disclose their corporate governance guidelines. Diageo complied throughout theyear with the best practice provisions of the Code.
• Director independence: the Code requires at least half the board (excluding the chairman) to beindependent non-executive directors, as determined by affirmatively concluding that a director isindependent of management and free from any relationship that could materially interfere withthe exercise of independent judgement. NYSE rules require a majority of independent directors,according to the NYSE’s own ‘brightline’ tests and an affirmative determination by the boardthat the director has no material relationship with the listed company. Diageo’s board hasdetermined that, in its judgement and without taking into account the NYSE brightline tests, allof the non-executive directors are independent. As such, currently six of Diageo’s 10 directorsare independent.
• Chairman and chief executive: the Code requires these roles to be separate. There is nocorresponding requirement for US companies. Diageo has a separate chairman and chiefexecutive.
• Non-executive director meetings: NYSE rules require non-management directors to meetregularly without management and independent directors to meet separately at least once a year.The Code requires non-executive directors to meet without the chairman present at leastannually to appraise the chairman’s performance. During the year, Diageo’s chairman and
137

Corporate governance report (continued)
non-executive directors met four times as a group without executive directors being present, andthe independent directors met once without the chairman.
• Board committees: Diageo has a number of board committees that are similar in purpose andconstitution to those required by NYSE rules. Diageo’s audit, remuneration and nominationcommittees consist entirely of independent non-executive directors (save that the chairman ofthe nomination committee, Dr FB Humer, is not independent). Under NYSE standards,companies are required to have a nominating/corporate governance committee, which developsand recommends a set of corporate governance principles and is composed entirely ofindependent directors. The terms of reference for Diageo’s nomination committee, which complywith the Code, do not contain such a requirement. In accordance with the requirements of theCode, Diageo discloses in its annual report the results and means of evaluation of the board, itscommittees and the directors, and it provides extensive information regarding directors’compensation in the directors’ remuneration report.
• Code of ethics: NYSE rules require a code of business conduct and ethics to be adopted fordirectors, officers and employees and disclosure of any waivers for executive directors or officers.Diageo has adopted a code of business conduct for all directors, officers and employees, as wellas a code of ethics for senior officers in accordance with the requirements of SOX. Currently, nowaivers have been granted to directors or executive officers.
• Compliance certification: NYSE rules require CEOs to certify to the NYSE their awareness ofany NYSE corporate governance violations. Diageo is exempt from this as a foreign privateissuer but is required to notify the NYSE if any executive officer becomes aware of anynon-compliance with NYSE corporate governance standards. No such notification was necessaryduring the period covered by this report.
Directors’ attendance record at the annual general meeting, board meetings and board committeemeetings, for the year ended 30 June 2012 was as set out in the table below. For board and boardcommittee meetings, attendance is expressed as the number of meetings attended out of the numberthat each director was eligible to attend.
AnnualGeneral Audit Nomination RemunerationMeeting Board committee committee committee
2011 (maximum 6) (maximum 6) (maximum 5) (maximum 5)
Dr FB Humer . . . . . . . . . . . . . . . . . . . � 6/6 6/6* 5/5 5/5PS Walsh . . . . . . . . . . . . . . . . . . . . . . � 6/6 3/6** 5/5* 5/5D Mahlan . . . . . . . . . . . . . . . . . . . . . . � 6/6 6/6* n/a 1/5**Lord Hollick . . . . . . . . . . . . . . . . . . . . � 2/2 2/2 2/2 1/1PB Bruzelius . . . . . . . . . . . . . . . . . . . . � 6/6 5/6 5/5 4/5LM Danon . . . . . . . . . . . . . . . . . . . . . � 6/6 5/6 5/5 5/5Lord Davies . . . . . . . . . . . . . . . . . . . . � 6/6 6/6 5/5 5/5BD Holden . . . . . . . . . . . . . . . . . . . . . � 6/6 6/6 5/5 5/5PG Scott . . . . . . . . . . . . . . . . . . . . . . . � 6/6 6/6 4/5 5/5HT Stitzer . . . . . . . . . . . . . . . . . . . . . � 6/6 6/6 5/5 5/5PA Walker . . . . . . . . . . . . . . . . . . . . . � 2/2 2/2 2/2 1/1
* Attended by invitation.
** Attended by invitation, for part only.
138
Directors’ report
The directors have pleasure in submitting their Annual Report for the year ended 30 June 2012.
Annual General Meeting
The AGM will be held at Church House Conference Centre, Dean’s Yard, Westminster, LondonSW1P 3NZ at 2.30pm on Wednesday, 17 October 2012.
Dividends
Diageo paid an interim dividend of 16.60 pence per ordinary share on 10 April 2012. The directorsrecommend a final dividend of 26.90 pence per ordinary share. Subject to approval by shareholders, thefinal dividend will be paid on 22 October 2012 to ordinary shareholders on the register on 7 September2012. Payment to US ADR holders will be made on 26 October 2012. A dividend reinvestment plan,which enables ordinary shareholders to invest their dividends in ordinary shares, is available in respectof the final dividend and the plan notice date is 1 October 2012.
Directors
The directors of the company who served during the year are shown in the section ‘Board of directorsand company secretary’ and ‘Executive committee’ above.
In accordance with the UK Corporate Governance Code, all the directors retire by rotation atthe AGM and offer themselves for re-election. The non-executive directors proposed for re-election donot have service contracts.
Further details of directors’ contracts, remuneration and their interests in the shares of thecompany at 30 June 2012 are given in the directors’ remuneration report above.
The directors’ powers are determined by UK legislation and Diageo’s articles of association. Thedirectors may exercise all the company’s powers provided that Diageo’s articles of association orapplicable legislation do not stipulate that any powers must be exercised by the members.
Auditor
The auditor, KPMG Audit Plc, is willing to continue in office and a resolution for its re-appointment asauditor of the company will be submitted to the AGM.
Disclosure of information to the auditor
The directors who held office at the date of approval of this directors’ report confirm that, so far asthey are each aware, there is no relevant audit information of which the company’s auditor is unaware;and each director has taken all reasonable steps to ascertain any relevant audit information and toensure that the company’s auditor is aware of that information.
Business review
The review of the business of the company and the description of the principal risks and uncertaintiesfacing the company, prepared in accordance with the Companies Act 2006, comprises the followingsections of the Annual Report: the Chief executive’s review, the Business description and the Businessreview.
139

Directors’ report (continued)
Corporate governance statement
The corporate governance statement, prepared in accordance with rule 7.2 of the FSA’s Disclosure andTransparency Rules, comprises the following sections of the Annual Report: the ‘Corporate governancereport’ and the ‘Additional information for shareholders.’
Significant agreements – change of control
The following significant agreements contain certain termination and other rights for Diageo’scounterparties upon a change of control of the company.
Under the agreement governing the company’s 34% investment in Moet Hennessy SNC (MH) andMoet Hennessy International SAS (MHI), if a competitor (as defined therein) directly or indirectlytakes control of the company (which, for these purposes, would occur if such competitor acquired morethan 34% of the voting rights or equity interests in the company), LVMH Moet Hennessy – LouisVuitton SA (LVMH) may require the company to sell its shares in MH and MHI to LVMH.
The master agreement governing the operation of the group’s regional joint ventures with LVMHstates that upon a change of control of the company (being, for these purposes, the acquisition by athird party of 30% or more of the issued share capital having voting rights in the company), LVMHmay either appoint and remove the chairman of each joint venture entity governed by such masteragreement, who shall be given a casting vote, or require each joint venture entity to be wound up.
Agreements for the distribution of the Jose Cuervo tequila brands allow Casa Cuervo SA de C.V.and certain of its affiliates (jointly, Cuervo) the right to terminate such agreements upon a change ofcontrol of the company, if Cuervo’s advance written consent to the change of control is not obtained.
140

Directors’ report (continued)
Other information
Other information relevant to the directors’ report may be found in the following sections of theAnnual Report:
Information Location in Annual ReportAmendment of articles of association Additional information for shareholders – Articles of
associationCharitable and political donations Corporate governance reportCorporate citizenship Corporate governance reportDirectors – appointment and powers Additional information for shareholders – Articles of
associationDirectors’ indemnities and compensation Directors’ remuneration reportEmployment policies Business description – Business overview – EmployeesEvents since 30 June 2012 Financial statements – note 35 Post balance sheet eventsFinancial risk management Financial statements – note 23 Financial instruments and
risk managementFuture developments Business review – Trend informationPurchase of own shares Business review – Liquidity and capital resources and
Financial statements – note 28 Share capital and reservesPrincipal activities of the company and its Financial statements – Principal group companiessubsidiary undertakings in the course of theyearResearch and development Business description – Business overview – Research and
developmentShare capital – structure, voting and other Additional information for shareholders – Share capitalrights and Articles of associationShare capital – employee share plan voting Financial statements – note 34 Employee sharerights compensationShareholdings in the company Additional information for shareholders – Share capitalSupplier payment policies and performance Corporate governance report
The directors’ report of Diageo plc for the year ended 30 June 2012 comprises these pages and thesections of the Annual Report referred to under ‘Directors’, ‘Business review’, ‘Corporate governancestatement’ and ‘Other information’ above, which are incorporated into the directors’ report byreference.
The directors’ report was approved by a duly appointed and authorised committee of the board ofdirectors on 22 August 2012 and signed on its behalf by PD Tunnacliffe, the company secretary.
141

Financial statements – contents
143 Report of independent registered public accounting firm
144 Consolidated income statement
145 Consolidated statement of comprehensive income
146 Consolidated balance sheet
147 Consolidated statement of changes in equity
148 Consolidated statement of cash flows
149 Accounting policies of the group
157 Notes to the consolidated financial statements
142

Report of independent registered public accounting firm
The board of directors and shareholdersDiageo plc:
We have audited the accompanying consolidated balance sheets of Diageo plc and subsidiaries asof 30 June 2012 and 2011, and the related consolidated income statements, consolidated statements ofcomprehensive income, consolidated statements of changes in equity and consolidated statements ofcash flows for each of the years in the three-year period ended 30 June 2012 on pages 144 to 240,including the disclosures identified as ‘part of the audited financial statements’ within the ‘Criticalaccounting policies’ section on pages 85 to 86, the ‘Share and other interests’ on page 119 to 120, the‘Key management personnel related party transactions’ on page 121 and the ‘Principal groupcompanies’ on page 241. These consolidated financial statements are the responsibility of theDiageo plc’s management. Our responsibility is to express an opinion on these consolidated financialstatements based on our audits.
We conducted our audits in accordance with the standards of the Public Company AccountingOversight Board (United States). Those standards require that we plan and perform the audit to obtainreasonable assurance about whether the financial statements are free of material misstatement. Anaudit includes examining, on a test basis, evidence supporting the amounts and disclosures in thefinancial statements. An audit also includes assessing the accounting principles used and significantestimates made by management, as well as evaluating the overall financial statement presentation. Webelieve that our audits provide a reasonable basis for our opinion.
In our opinion, the consolidated financial statements referred to above present fairly, in allmaterial respects, the financial position of Diageo plc and subsidiaries as of 30 June 2012, and 2011,and the results of their operations and their cash flows for each of the years in the three-year periodended 30 June 2012, in conformity with International Financial Reporting Standards (IFRS) as issuedby the International Accounting Standards Board and IFRS as adopted by the European Union.
We also have audited, in accordance with the standards of the Public Company AccountingOversight Board (United States), Diageo plc’s internal control over financial reporting as of 30 June2012, based on criteria established in Internal Control – Integrated Framework issued by the Committeeof Sponsoring Organisations of the Treadway Commission (COSO), and our report dated 22 August2012 expressed an unqualified opinion on the effectiveness of the company’s internal control overfinancial reporting.
KPMG Audit PlcLondon, England22 August 2012
143

Consolidated income statement
Year ended Year ended Year ended30 June 30 June 30 June
Notes 2012 2011 2010
£ million £ million £ million
Sales . . . . . . . . . . . . . . . . . . . . . . . . . . . . . . . . . . . . . . . . . . 2 14,594 13,232 12,958Excise duties . . . . . . . . . . . . . . . . . . . . . . . . . . . . . . . . . . . . 3 (3,832) (3,296) (3,178)
Net sales . . . . . . . . . . . . . . . . . . . . . . . . . . . . . . . . . . . . . . . 2 10,762 9,936 9,780Cost of sales . . . . . . . . . . . . . . . . . . . . . . . . . . . . . . . . . . . . 3,5 (4,259) (4,010) (4,099)
Gross profit . . . . . . . . . . . . . . . . . . . . . . . . . . . . . . . . . . . . 6,503 5,926 5,681Marketing . . . . . . . . . . . . . . . . . . . . . . . . . . . . . . . . . . . . . . 3 (1,691) (1,538) (1,419)Other operating expenses . . . . . . . . . . . . . . . . . . . . . . . . . . . 3,5 (1,654) (1,793) (1,688)
Operating profit . . . . . . . . . . . . . . . . . . . . . . . . . . . . . . . . . 2 3,158 2,595 2,574Sale of businesses . . . . . . . . . . . . . . . . . . . . . . . . . . . . . . . . 5 147 (14) (15)Interest receivable . . . . . . . . . . . . . . . . . . . . . . . . . . . . . . . . 6 262 278 469Interest payable . . . . . . . . . . . . . . . . . . . . . . . . . . . . . . . . . . 6 (644) (647) (844)Other finance income . . . . . . . . . . . . . . . . . . . . . . . . . . . . . 6 8 — 4Other finance charges . . . . . . . . . . . . . . . . . . . . . . . . . . . . . 6 (23) (28) (91)Share of associates’ profits after tax . . . . . . . . . . . . . . . . . . . 7 213 176 142
Profit before taxation . . . . . . . . . . . . . . . . . . . . . . . . . . . . . . 3,121 2,360 2,239Taxation . . . . . . . . . . . . . . . . . . . . . . . . . . . . . . . . . . . . . . . 8 (1,038) (343) (477)
Profit from continuing operations . . . . . . . . . . . . . . . . . . . . . 2,083 2,017 1,762Discontinued operations . . . . . . . . . . . . . . . . . . . . . . . . . . . . 9 (11) — (19)
Profit for the year . . . . . . . . . . . . . . . . . . . . . . . . . . . . . . . . 2,072 2,017 1,743
Attributable to:Equity shareholders of the parent company . . . . . . . . . . . . . . 1,942 1,900 1,629Non-controlling interests . . . . . . . . . . . . . . . . . . . . . . . . . . . 130 117 114
2,072 2,017 1,743
Basic earnings per share . . . . . . . . . . . . . . . . . . . . . . . . . . . 10Continuing operations . . . . . . . . . . . . . . . . . . . . . . . . . . . . . 78.2p 76.2p 66.3pDiscontinued operations . . . . . . . . . . . . . . . . . . . . . . . . . . . . (0.4)p — (0.8)p
77.8p 76.2p 65.5p
Diluted earnings per share . . . . . . . . . . . . . . . . . . . . . . . . . . 10Continuing operations . . . . . . . . . . . . . . . . . . . . . . . . . . . . . 77.8p 76.0p 66.2pDiscontinued operations . . . . . . . . . . . . . . . . . . . . . . . . . . . . (0.4)p — (0.8)p
77.4p 76.0p 65.4p
The accompanying notes are an integral part of these consolidated financial statements.
144

Consolidated statement of comprehensive income
Year ended Year ended Year ended30 June 30 June 30 June
Notes 2012 2011 2010
£ million £ million £ million
Other comprehensive incomeExchange differences on translation of foreign operations
excluding borrowings– group . . . . . . . . . . . . . . . . . . . . . . . . . . . . . . . . . . . . . . . (74) (133) 494– associates and non-controlling interests* . . . . . . . . . . . . . . (222) 93 37Exchange differences on borrowings and derivative net
investment hedges . . . . . . . . . . . . . . . . . . . . . . . . . . . . . . 210 (51) (429)Effective portion of changes in fair value of cash flow hedges– gains/(losses) taken to other comprehensive income . . . . . . 29 25 (27)– transferred to income statement . . . . . . . . . . . . . . . . . . . . (15) 56 (26)Hyperinflation adjustment . . . . . . . . . . . . . . . . . . . . . . . . . . 3 6 25Net actuarial (loss)/gain on post employment plans . . . . . . . . 4 (495) 272 8Tax on other comprehensive income . . . . . . . . . . . . . . . . . . . 27 103 (65) (16)
Other comprehensive (loss)/income, net of tax, for the year . . (461) 203 66Profit for the year . . . . . . . . . . . . . . . . . . . . . . . . . . . . . . . . 2,072 2,017 1,743
Total comprehensive income for the year . . . . . . . . . . . . . . . . 1,611 2,220 1,809
Attributable to:Equity shareholders of the parent company . . . . . . . . . . . . . . 1,463 2,167 1,628Non-controlling interests . . . . . . . . . . . . . . . . . . . . . . . . . . . 148 53 181
Total comprehensive income for the year . . . . . . . . . . . . . . . . 1,611 2,220 1,809
* Includes £30 million exchange gain recycled to the consolidated income statement on theacquisition of a majority equity stake in Quanxing and obtaining control of Shuijingfang in the yearended 30 June 2012.
The accompanying notes are an integral part of these consolidated financial statements.
145

Consolidated balance sheet
Notes 30 June 2012 30 June 2011
£ million £ million £ million £ millionNon-current assetsIntangible assets . . . . . . . . . . . . . . . . . . . . . . . . . . . . . . . . 11 8,821 6,545Property, plant and equipment . . . . . . . . . . . . . . . . . . . . . . 12 2,972 2,552Biological assets . . . . . . . . . . . . . . . . . . . . . . . . . . . . . . . . 13 34 33Investments in associates . . . . . . . . . . . . . . . . . . . . . . . . . . 14 2,198 2,385Other investments . . . . . . . . . . . . . . . . . . . . . . . . . . . . . . . 16 97 102Other receivables . . . . . . . . . . . . . . . . . . . . . . . . . . . . . . . 18 119 118Other financial assets . . . . . . . . . . . . . . . . . . . . . . . . . . . . . 22 505 305Deferred tax assets . . . . . . . . . . . . . . . . . . . . . . . . . . . . . . 26 329 516Post employment benefit assets . . . . . . . . . . . . . . . . . . . . . . 4 22 60
15,097 12,616Current assetsInventories . . . . . . . . . . . . . . . . . . . . . . . . . . . . . . . . . . . . 17 3,955 3,473Trade and other receivables . . . . . . . . . . . . . . . . . . . . . . . . 18 2,103 1,977Assets held for sale . . . . . . . . . . . . . . . . . . . . . . . . . . . . . . 19 77 38Other financial assets . . . . . . . . . . . . . . . . . . . . . . . . . . . . . 22 42 89Cash and cash equivalents . . . . . . . . . . . . . . . . . . . . . . . . . 20 1,076 1,584
7,253 7,161Total assets . . . . . . . . . . . . . . . . . . . . . . . . . . . . . . . . . . . 22,350 19,777Current liabilitiesBorrowings and bank overdrafts . . . . . . . . . . . . . . . . . . . . . . 21 (1,230) (1,447)Other financial liabilities . . . . . . . . . . . . . . . . . . . . . . . . . . . 22 (113) (90)Trade and other payables . . . . . . . . . . . . . . . . . . . . . . . . . . 24 (2,997) (2,838)Liabilities held for sale . . . . . . . . . . . . . . . . . . . . . . . . . . . . 19 — (10)Corporate tax payable . . . . . . . . . . . . . . . . . . . . . . . . . . . . 8 (317) (381)Provisions . . . . . . . . . . . . . . . . . . . . . . . . . . . . . . . . . . . . . 25 (127) (149)
(4,784) (4,915)Non-current liabilitiesBorrowings . . . . . . . . . . . . . . . . . . . . . . . . . . . . . . . . . . . . 21 (7,399) (6,748)Other financial liabilities . . . . . . . . . . . . . . . . . . . . . . . . . . . 22 (466) (147)Other payables . . . . . . . . . . . . . . . . . . . . . . . . . . . . . . . . . 24 (85) (41)Provisions . . . . . . . . . . . . . . . . . . . . . . . . . . . . . . . . . . . . . 25 (274) (266)Deferred tax liabilities . . . . . . . . . . . . . . . . . . . . . . . . . . . . 26 (1,424) (777)Post employment benefit liabilities . . . . . . . . . . . . . . . . . . . . 4 (1,107) (898)
(10,755) (8,877)Total liabilities . . . . . . . . . . . . . . . . . . . . . . . . . . . . . . . . . (15,539) (13,792)Net assets . . . . . . . . . . . . . . . . . . . . . . . . . . . . . . . . . . . . 6,811 5,985
EquityCalled up share capital . . . . . . . . . . . . . . . . . . . . . . . . . . . . 28 797 797Share premium . . . . . . . . . . . . . . . . . . . . . . . . . . . . . . . . . 1,344 1,343Other reserves . . . . . . . . . . . . . . . . . . . . . . . . . . . . . . . . . 3,213 3,300Retained earnings/(deficit) . . . . . . . . . . . . . . . . . . . . . . . . . 234 (195)Equity attributable to equity shareholders of the parent
company . . . . . . . . . . . . . . . . . . . . . . . . . . . . . . . . . . . . 5,588 5,245Non-controlling interests . . . . . . . . . . . . . . . . . . . . . . . . . . 1,223 740Total equity . . . . . . . . . . . . . . . . . . . . . . . . . . . . . . . . . . . 6,811 5,985
The accompanying notes are an integral part of these consolidated financial statements.
These consolidated financial statements were approved by a duly appointed and authorised committeeof the board of directors on 22 August 2012 and were signed on its behalf by PS Walsh and D Mahlan,directors.
146

Consolidated statement of changes in equity
EquityRetained earnings/(deficit)Hedging attributable
Capital and Other to parent Non-Share Share redemption exchange Own retained company controlling Total
capital premium reserve reserve shares earnings Total shareholders interests equity
£ million £ million £ million £ million £ million £ million £ million £ million £ million £ million
At 30 June 2009 . . . . . . . . . . . . 797 1,342 3,146 133 (2,342) 93 (2,249) 3,169 705 3,874Total comprehensive income . . . . — — — (34) — 1,662 1,662 1,628 181 1,809Employee share schemes . . . . . . — — — — 89 (3) 86 86 — 86Share-based incentive plans . . . . — — — — — 31 31 31 — 31Share-based incentive plans in
respect of associates . . . . . . . . — — — — — 3 3 3 — 3Tax on share-based incentive
plans . . . . . . . . . . . . . . . . . . — — — — — 4 4 4 — 4Dividends paid . . . . . . . . . . . . . — — — — — (914) (914) (914) (107) (1,021)
At 30 June 2010 . . . . . . . . . . . . 797 1,342 3,146 99 (2,253) 876 (1,377) 4,007 779 4,786Total comprehensive income . . . . — — — 55 — 2,112 2,112 2,167 53 2,220Employee share schemes . . . . . . — — — — (4) (5) (9) (9) — (9)Share-based incentive plans . . . . — — — — — 34 34 34 — 34Share-based incentive plans in
respect of associates . . . . . . . . — — — — — 3 3 3 — 3Tax on share-based incentive
plans . . . . . . . . . . . . . . . . . . — — — — — 15 15 15 — 15Shares issued . . . . . . . . . . . . . . — 1 — — — — — 1 — 1Acquisitions . . . . . . . . . . . . . . . — — — — — — — — 20 20Dividends paid . . . . . . . . . . . . . — — — — — (973) (973) (973) (112) (1,085)
At 30 June 2011 . . . . . . . . . . . . 797 1,343 3,146 154 (2,257) 2,062 (195) 5,245 740 5,985Total comprehensive income . . . . — — — (87) — 1,550 1,550 1,463 148 1,611Share-based incentive plans . . . . — — — — — 35 35 35 — 35Share-based incentive plans in
respect of associates . . . . . . . . — — — — — 2 2 2 — 2Tax on share-based incentive
plans . . . . . . . . . . . . . . . . . . — — — — — 29 29 29 — 29Shares issued . . . . . . . . . . . . . . — 1 — — — — — 1 — 1Acquisitions . . . . . . . . . . . . . . . — — — — — — — — 452 452Proceeds from non-controlling
interests . . . . . . . . . . . . . . . . — — — — — — — — 11 11Change in fair value of put option — — — — — (6) (6) (6) — (6)Purchase of non-controlling
interests . . . . . . . . . . . . . . . . — — — — — (145) (145) (145) (10) (155)Dividends paid . . . . . . . . . . . . . — — — — — (1,036) (1,036) (1,036) (118) (1,154)
At 30 June 2012 . . . . . . . . . . . . 797 1,344 3,146 67 (2,257) 2,491 234 5,588 1,223 6,811
The accompanying notes are an integral part of the consolidated financial statements.
147

Consolidated statement of cash flows
Year ended Year endedYear ended 30 June 2011 30 June 2010
Notes 30 June 2012 (restated) (restated)
£ million £ million £ million £ million £ million £ million
Cash flow from operating activitiesCash generated from operations . . . . . . . . . . . 29 3,005 2,859 3,175Interest received . . . . . . . . . . . . . . . . . . . . . . 158 213 307Interest paid . . . . . . . . . . . . . . . . . . . . . . . . . (549) (524) (612)Taxation paid . . . . . . . . . . . . . . . . . . . . . . . . (521) (365) (474)
Net cash from operating activities . . . . . . . . . 2,093 2,183 2,396Cash flows from investing activitiesDisposal of property, plant and equipment and
computer software . . . . . . . . . . . . . . . . . . . 39 47 143Purchase of property, plant and equipment
and computer software . . . . . . . . . . . . . . . . (484) (419) (374)Movements in loans and other investments . . . (1) 1 (43)Sale of businesses . . . . . . . . . . . . . . . . . . . . . 51 34 1Acquisition of businesses . . . . . . . . . . . . . . . . 30 (1,420) (97) (197)
Net cash outflow from investing activities . . . . (1,815) (434) (470)Cash flows from financing activitiesProceeds from issue of share capital . . . . . . . . 1 1 —Net (purchase)/sale of own shares for share
schemes . . . . . . . . . . . . . . . . . . . . . . . . . . . — (9) 85Dividends paid to non-controlling interests . . . (118) (112) (107)Proceeds from non-controlling interests . . . . . 11 — —Purchase of shares of non-controlling interests (155) — —Net increase/(decrease) in loans . . . . . . . . . . . 512 (414) (422)Equity dividends paid . . . . . . . . . . . . . . . . . . (1,036) (973) (914)
Net cash outflow from financing activities . . . . (785) (1,507) (1,358)
Net (decrease)/increase in net cash and cashequivalents . . . . . . . . . . . . . . . . . . . . . . . . (507) 242 568
Exchange differences . . . . . . . . . . . . . . . . . . . (27) (68) (16)Net cash and cash equivalents at beginning of
the year . . . . . . . . . . . . . . . . . . . . . . . . . . . 1,572 1,398 846
Net cash and cash equivalents at end ofthe year . . . . . . . . . . . . . . . . . . . . . . . . . . . 1,038 1,572 1,398
Net cash and cash equivalents consist of:Cash and cash equivalents . . . . . . . . . . . . . . . 20 1,076 1,584 1,453Bank overdrafts . . . . . . . . . . . . . . . . . . . . . . . 21 (38) (12) (55)
1,038 1,572 1,398
The accompanying notes are an integral part of these consolidated financial statements.
Comparatives have been restated following a change in the disclosure of dividends paid tonon-controlling interests and transaction costs incurred in respect of business acquisitions. For anexplanation of the effect of the restatement see note 1.
148

Accounting policies of the group
Basis of preparation
The consolidated financial statements are prepared in accordance with International FinancialReporting Standards (IFRS) as endorsed and adopted for use in the European Union (EU) and IFRSas issued by the International Accounting Standards Board (IASB). References to IFRS hereaftershould be construed as references to both IFRS as adopted by the EU and IFRS as issued by theIASB.
The consolidated financial statements are prepared on a going concern basis under the historicalcost convention, except that biological assets and certain financial instruments are stated at their fairvalue.
The preparation of financial statements in conformity with IFRS requires management to makeestimates and assumptions that affect the reported amounts of assets and liabilities, the disclosure ofcontingent assets and liabilities at the date of the financial statements, and the reported amounts ofrevenues and expenses during the year. Actual results could differ from those estimates.
The critical accounting policies, which the directors consider are of greater complexity and/orparticularly subject to the exercise of judgement, are set out under ‘Critical accounting policies’ in theBusiness review section of this Annual Report.
The information set out in these accounts does not constitute the statutory accounts of thegroup within the meaning of the Companies Acts for the years ended 30 June 2012, 2011 or 2010.KPMG Audit Plc has reported on those accounts; their audit reports were (i) unqualified, (ii) did notinclude a reference to any matters to which the auditors drew attention by way of emphasis withoutqualifying their report and (iii) did not contain a statement under section 498(2) or (3) of theCompanies Act 2006 in respect of the accounts for the year ended 30 June 2012, 2011 or 2010. Theaccounts for 2011 and 2010 have been delivered to the registrar of companies and those for 2012 willbe delivered in due course.
Basis for preparation of financial statements on a going concern basis
Information on the business environment that the group operates in, the group’s strategy and theprincipal risk factors that the group faces is contained in the Business review. The financial position ofthe group, its cash flows, borrowings, borrowing facilities, commitments and the group’s policies tomanage its financial risks are described in the Business review under ‘Liquidity and capital resources’,‘Contractual obligations’ and notes 21, 22 and 23 to the consolidated financial statements.
At 30 June 2012 the group has cash and cash equivalents of £1,076 million and committed bankfacilities of £2,229 million, with borrowings and bank overdrafts due within one year of £1,230 million.The group owns a diverse portfolio of beverage alcohol assets and operates in numerous countriesaround the world. The group also has a wide diversity of customers and suppliers. The directors believethat the group is well positioned to manage its business and financial risks successfully.
The directors have a reasonable expectation that the group has adequate resources to continue inoperational existence for the foreseeable future. Accordingly, they continue to adopt the going concernbasis in preparing the consolidated financial statements.
Business combinations
Business combinations are accounted for using the acquisition method. Identifiable assets, liabilities andcontingent liabilities acquired are measured at fair value at acquisition date. The consideration
149

Accounting policies of the group (continued)
transferred is measured at fair value and includes the fair value of any contingent consideration. Theconsolidated financial statements include the results of the company and its subsidiaries together withthe group’s attributable share of the results of associates and joint ventures. The results of subsidiariessold or acquired are included in the income statement up to, or from, the date that control passes. Asubsidiary is an entity controlled, directly or indirectly, by Diageo plc. Control is the power to governthe operating and financial policies of the subsidiary so as to obtain benefits from its activities.
On the acquisition of a business, or of an interest in an associate or joint venture, fair values,reflecting conditions at the date of acquisition, are attributed to the net assets including identifiableintangible assets and contingent liabilities acquired. Adjustments to fair values include those made tobring accounting policies into line with those of the group. Directly attributable acquisition costs arerecognised in other external charges as incurred.
The interests of non-controlling interests on the date of acquisition can be measured either at thefair value or at the non-controlling shareholder’s proportion of the net fair value of the identifiableassets assumed. This choice is made separately for each acquisition.
Where the group has issued a put option over shares held by a non-controlling interest, the groupderecognises the non-controlling interests and instead recognises a contingent deferred considerationliability for the estimated amount likely to be paid to the non-controlling interest on the exercise ofthose options. Movements in the estimated liability after initial recognition are recognised in reserves.
Transactions with non-controlling interests are recorded directly in equity.
Sales
Sales comprise revenue from the sale of goods, royalties receivable and rents receivable. Revenue fromthe sale of goods includes excise and other duties which the group pays as principal but excludesamounts collected on behalf of third parties, such as value added tax. Sales are recognised dependingupon individual customer terms at the time of despatch, delivery or some other specified point whenthe risk of loss transfers. Provision is made for returns where appropriate. Sales are stated net of pricediscounts, allowances for customer loyalty and certain promotional activities and similar items.
Advertising and promotion costs
Advertising costs, point of sale materials and sponsorship payments are charged to marketing inoperating profit when the company has a right of access to the goods or services acquired.
Research and development
Research expenditure in respect of new drinks products and package design is written off in the year inwhich it is incurred. Any subsequent development expenditure in the period leading up to productlaunch that meets the recognition criteria set out in the relevant standard is capitalised. If capitalised,any intangible asset is amortised on a straight-line basis over the period of the expected benefit.
Share-based payments – employee benefits
The fair value of equity settled share options and share grants is initially measured at grant date basedon the binomial or Monte Carlo models and is charged in the income statement over the vestingperiod. For equity settled shares the credit is included in retained earnings in equity whereas for cashsettled share-based payments a liability is recognised in the balance sheet, measured initially at the fair
150

Accounting policies of the group (continued)
value of the liability. For cash settled share options and share grants, the fair value of the liability isremeasured at the end of each reporting period until the liability is settled, and at the date ofsettlement, with any changes in the fair value recognised in the income statement. Cancellations ofshare options are treated as an acceleration of the vesting period and any outstanding charge isrecognised in operating profit immediately. Shares of Diageo plc held by the company for the purposeof fulfilling obligations in respect of various employee share plans around the group are deducted fromequity in the consolidated balance sheet. Any surplus or deficit arising on the sale of the Diageo plcshares held by the group is included as a movement in equity.
Pensions and other post employment benefits
The group’s principal pension funds are defined benefit plans. In addition, the group has definedcontribution plans, unfunded post employment medical benefit liabilities and other unfunded definedbenefit post employment liabilities. For post employment plans, other than defined contribution plans,the amount charged in the income statement is the cost of accruing pension benefits promised toemployees over the year, plus any fully vested benefit improvements granted to members by the groupduring the year. The income statement also includes a credit equivalent to the group’s expected returnon the pension plans’ assets over the year, offset by a charge equal to the expected increase in theplans’ liabilities over the year. The differences between the fair value of the plans’ assets and thepresent value of the plans’ liabilities are disclosed as an asset or liability on the consolidated balancesheet as appropriate. Any differences between the expected return on assets and those actuallyachieved, and any changes in the liabilities over the year due to changes in assumptions or experiencewithin the plans, are recognised in other comprehensive income. The amount of any pension fund assetrecognised on the balance sheet is limited to any future refunds from the plan or the present value ofreductions in future contributions to the plan.
Contributions payable by the group in respect of defined contribution plans are charged tooperating profit as incurred.
Capitalisation of finance costs
Finance costs directly attributable to the acquisition, construction or production of a qualifying asset,being an asset that necessarily takes a substantial period of time to get ready for its intended use orsale, are added to the cost of that asset. All other finance costs are recognised as charges in the incomestatement for the period in which they are incurred.
Exceptional items
Exceptional items are those that in management’s judgement need to be disclosed by virtue of theirsize or incidence. Such items are included within the income statement caption to which they relate,and are separately disclosed either in the notes to the consolidated financial statements or on the faceof the consolidated income statement.
Foreign currencies
Items included in the financial statements of the group’s subsidiaries, associates and joint ventures aremeasured using the currency of the primary economic environment in which each entity operates (itsfunctional currency). The consolidated financial statements are presented in sterling, which is thefunctional currency of the parent company.
151
Accounting policies of the group (continued)
The income statements and cash flows of overseas entities are translated into sterling at weightedaverage rates of exchange, other than substantial transactions that are translated at the rate on the dateof the transaction. The adjustment to closing rates is taken to the exchange reserve.
Balance sheets are translated at closing rates. Exchange differences arising on the retranslation atclosing rates of the opening balance sheets of overseas entities are taken to the exchange reserve, asare exchange differences arising on foreign currency borrowings and financial instruments designated asnet investment hedges, to the extent that they are effective. Tax charges and credits arising on suchitems are also taken to the exchange reserve. Gains and losses accumulated in the exchange reserve arerecycled to the income statement when the foreign operation is sold. Other exchange differences aretaken to the income statement.
The results of operations in hyperinflationary economies are adjusted to reflect the changes in thepurchasing power of the local currency of the entity before being translated to sterling.
Transactions in foreign currencies are recorded at the rate of exchange at the date of thetransaction. If hedged, the impact of hedging is recognised, where permitted, under hedge accounting(see accounting policy for derivative financial instruments).
Brands, goodwill and other intangible assets
Goodwill represents the excess of the aggregate of the consideration transferred, the value of anynon-controlling interest in the company acquired and the fair value of any previously held equityinterest in the subsidiary acquired over the fair value of the identifiable net assets acquired. Goodwillarising on acquisitions prior to 1 July 1998 was eliminated against reserves, and this goodwill has notbeen restated. Goodwill arising subsequent to 1 July 1998 has been capitalised.
Acquired brands and other intangible assets are recognised when they are controlled throughcontractual or other legal rights, or are separable from the rest of the business, and the fair value canbe reliably measured.
Intangible assets that are regarded as having limited useful economic lives are amortised on astraight-line basis over those lives and reviewed for impairment whenever events or circumstancesindicate that the carrying amount may not be recoverable. Goodwill and intangible assets that areregarded as having indefinite useful economic lives are not amortised. These assets are reviewed forimpairment at least annually or when there is an indication that the assets may be impaired. To ensurethat assets are not carried at above their recoverable amounts, the impairment reviews compare the netcarrying value with the recoverable amount, where the recoverable amount is the value in use.Amortisation and any impairment writedowns are charged to other operating expenses in the incomestatement.
Computer software is amortised on a straight-line basis to estimated residual value over itsexpected useful life. Residual values and useful lives are reviewed each year. Subject to these reviews,the estimated useful lives are up to five years.
Property, plant and equipment
Land and buildings are stated at cost less depreciation. Freehold land is not depreciated. Leaseholdsare depreciated over the unexpired period of the lease. Other property, plant and equipment aredepreciated on a straight-line basis to estimated residual values over their expected useful lives, andthese values and lives are reviewed each year. Subject to these reviews, the estimated useful lives fall
152

Accounting policies of the group (continued)
within the following ranges: buildings – 10 to 50 years; within plant and equipment casks andcontainers – 15 to 50 years, other plant and equipment – 5 to 10 years; fixtures and fittings – 5 to10 years; and returnable bottles and crates – 5 to 10 years.
Reviews are carried out if there is some indication that impairment may have occurred, to ensurethat property, plant and equipment are not carried at above their recoverable amounts.
Government grants
Government grants are not recognised until there is reasonable assurance that the group will complywith the conditions pursuant to which they have been granted and that the grants will be received.Government grants in respect of property, plant and equipment are deducted from the asset that theyrelate to and reduce the depreciation expense charged to the income statement.
Leases
Where the group has substantially all the risks and rewards of ownership of an asset subject to a lease,the lease is treated as a finance lease. Assets held under finance leases are recognised as assets of thegroup at their fair value at the inception of the lease. The corresponding liability to the lessor isincluded in other financial liabilities on the consolidated balance sheet. Lease payments areapportioned between interest expense and a reduction of the lease obligation so as to achieve aconstant rate of interest on the remaining balance of the liability. Other leases are treated as operatingleases, with payments and receipts taken to the income statement on a straight-line basis over the lifeof the lease.
Biological assets
Grape cultivation by the group’s wine businesses are accounted for as an agricultural activity.Accordingly, the group’s biological assets (grape vines and grapes on the vine) are carried at fair valuewhich, in the absence of third party valuations, is computed on the basis of a discounted cash flowcalculation. Agricultural produce (harvested grapes) is valued at market value on transfer intoinventory.
Associates and joint ventures
An associate is an undertaking in which the group has a long term equity interest and over which it hasthe power to exercise significant influence. The group’s interest in the net assets of associates isincluded in investments in the consolidated balance sheet and its interest in their results is included inthe consolidated income statement below the group’s operating profit. Investments in associates arereviewed for impairment whenever events or circumstances indicate that the carrying amount may notbe recoverable. The impairment review compares the net carrying value with the recoverable amount,where the recoverable amount is the higher of the value in use calculated as the present value of thegroup’s share of the associate’s future cash flows and its fair value less cost to sell. Joint ventures,where there is contractual joint control over the entity, are accounted for by including on a line-by-linebasis the attributable share of the results, assets and liabilities.
Inventories
Inventories are stated at the lower of cost and net realisable value. Cost includes raw materials, directlabour and expenses, an appropriate proportion of production and other overheads, but not borrowing
153

Accounting policies of the group (continued)
costs. Cost is calculated on the weighted average cost incurred in acquiring inventories. Maturinginventories which are retained for more than one year are classified as current assets.
Assets held for sale
Non-current assets and disposal groups are classified as held for sale if their net book value is expectedto be recovered through sale rather than continuing use. This condition is only met when the sale ishighly probable and the non-current asset, or disposal group, is available for immediate sale in itspresent condition. Non-current assets and disposal groups classified as held for sale are measured atthe lower of the fair value less selling costs and net book value.
Financial assets
Trade, other receivables and loans are recognised when it is probable that a future economic benefit willflow to the group. Trade, other receivables and loans are carried at original invoice or contract amountless any provisions for discounts and doubtful debts. Provisions are made where there is evidence of arisk of non payment taking into account ageing, previous experience and general economic conditions.
Cash and cash equivalents comprise cash in hand and deposits which are readily convertible to knownamounts of cash and which are subject to insignificant risk of changes in value and have an originalmaturity of three months or less at acquisition, including money market deposits, commercial paper andinvestments.
Available-for-sale financial assets are non-derivatives that are either designated in this category or notclassified in any of the other categories. They are included in non-current assets unless managementintends to dispose of the investment within 12 months of the balance sheet date.
Financial liabilities
Financial liabilities are initially recognised at fair value less any directly related transaction costs.Certain bonds are designated as being part of a fair value hedge relationship. In these cases, the bondis carried at amortised cost, adjusted for the fair value of the risk being hedged, with changes in valuerecognised in the income statement. The fair value adjustment is calculated using a discounted cashflow technique based on unadjusted market data applied consistently for similar types of instruments.Other financial liabilities, excluding derivatives, are subsequently carried at amortised cost. Thedifference between the initial carrying amount of the financial liabilities and their redemption value isrecognised in the income statement over the contractual terms using the effective interest rate method.
Derivative financial instruments
Derivative financial instruments are carried at fair value that is calculated using a discounted cash flowtechnique based on market data applied consistently for similar types of instruments. Gains and losseson derivatives that do not qualify for hedge accounting treatment are taken to the income statement asthey arise.
The purpose of hedge accounting is to mitigate the impact of potential volatility in the incomestatement due to changes in exchange or interest rates, by matching the impact of the hedged item andthe hedging instrument in the income statement. To qualify for hedge accounting, the hedgingrelationship must meet several conditions with respect to documentation, probability of occurrence,hedge effectiveness and reliability of measurement. At the inception of the transaction, the groupdocuments the relationship between hedged items and hedging instruments, as well as its risk
154

Accounting policies of the group (continued)
management objective and strategy for undertaking the hedge transaction. This process includes linkingall derivatives designated as hedges to specific assets and liabilities or to specific firm commitments orforecast transactions. The group also documents its assessment, at hedge inception and at least on aquarterly basis, as to whether the derivatives that are used in hedging transactions have been, and arelikely to continue to be, effective in offsetting changes in fair value or cash flows of hedged items.
The group designates derivatives which qualify for hedge accounting as either: (a) a hedge of thefair value of a recognised asset or liability (fair value hedge); (b) a hedge of a forecast transaction orthe cash flow risk from a change in exchange or interest rates (cash flow hedge); or (c) a hedge of anet investment in foreign operations.
The method of recognising the resulting gains or losses from movements in fair values isdependent on whether the derivative contract is designated to hedge a specific risk and qualifies forhedge accounting.
Fair value hedges are used to manage the currency and/or interest rate risks to which the fair valueof certain assets and liabilities are exposed. Changes in the fair value of derivatives that are fair valuehedges are recognised in the income statement, along with any changes in the relevant fair value of theunderlying hedged asset or liability. If such a hedge relationship is de-designated, fair value movementson the derivative continue to be taken to the income statement while any fair value adjustments madeto the underlying hedged item to that date are amortised through the income statement over itsremaining life using the effective interest rate method.
Cash flow hedges are used to hedge the foreign currency risk of highly probable future foreigncurrency cash flows, as well as the cash flow risk from changes in exchange or interest rates. Theeffective portion of the gain or loss on the hedges is recognised in other comprehensive income, whileany ineffective part is recognised in the income statement. Amounts recorded in other comprehensiveincome are recycled to the income statement in the same period in which the underlying foreigncurrency or interest exposure affects the income statement.
Net investment hedges take the form of either foreign currency borrowings or derivatives. Allforeign exchange gains or losses arising on translation of net investments are recorded in othercomprehensive income and included in the exchange reserve. Liabilities used as hedging instruments ina net investment hedge are revalued at closing exchange rates and the resulting gains or losses arerecognised in other comprehensive income to the extent that they are effective, with any ineffectivenesstaken to the income statement. Foreign exchange contracts hedging net investments in foreignoperations are carried at fair value. Effective fair value movements are recognised in othercomprehensive income, with any ineffectiveness taken to the income statement.
Provisions
Provisions are liabilities of uncertain timing or amount. A provision is recognised if, as a result of apast event, the group has a present legal or constructive obligation that can be estimated reliably, and itis probable that an outflow of economic benefits will be required to settle the obligation. Provisions arecalculated on a discounted basis, where the difference from the original undiscounted provision ismaterial. The carrying amounts of provisions are reviewed at each balance sheet date and adjusted toreflect the current best estimate.
155

Accounting policies of the group (continued)
Taxation
Current tax is based on taxable profit for the year. This requires an estimation of the current taxliability together with an assessment of the temporary differences which arise as a consequence ofdifferent accounting and tax treatments.
Full provision for deferred tax is made for temporary differences between the carrying value ofassets and liabilities in the consolidated financial statements and their tax bases. The amount ofdeferred tax reflects the expected recoverable amount and is based on the expected manner ofrealisation or settlement of the carrying amount of assets and liabilities, using the basis of taxationenacted or substantively enacted by the balance sheet date. Deferred tax assets are not recognisedwhere it is more likely than not that the asset will not be realised in the future. No deferred tax liabilityis provided in respect of any future remittance of earnings of foreign subsidiaries where the group isable to control the remittance of earnings and it is probable that such earnings will not be remitted inthe foreseeable future, or where no liability would arise on the remittance.
Tax benefits are not recognised unless it is probable that the tax positions are sustainable. Onceconsidered to be probable, management reviews each material tax benefit to assess whether a provisionshould be taken against full recognition of the benefit on the basis of potential settlement throughnegotiation and/or litigation. Any interest and penalties on tax liabilities are provided for in the taxcharge.
Discontinued operations
Discontinued operations comprise disposal groups where they represent a major line of business orgeographical area of operations or business activities that the group no longer participates in or did notform part of the group’s operations.
156
Notes to the consolidated financial statements
1. New accounting policies
(a) Adopted by the group The following accounting standards and amendments, issued by theInternational Accounting Standards Board (IASB) or International Financial Reporting InterpretationsCommittee (IFRIC), are effective for the first time in the current financial year and have been adoptedby the group with no impact on its consolidated results or financial position:
Amendment to IAS 1 – Presentation of financial statements
IAS 24 (Revised) – Related party disclosures
Amendment to IAS 34 – Interim financial reporting
Amendment to IFRS 7 – Disclosure of the financial effect of the extent to which collateral and other creditenhancements mitigate credit risk
Amendment to IFRS 7 – Transfers of financial assets
Amendment to IFRIC 13 – Customer loyalty programmes
Amendment to IFRIC 14 – IAS 19: The limit on defined benefit assets, minimum funding requirements andtheir interaction
Statement of cash flows – The group has revised the disclosure of certain prior year amounts in theconsolidated statement of cash flows. In the year ended 30 June 2012 directly attributable acquisitiontransaction costs of £47 million (2011 – £20 million; 2010 – £9 million) have been included in cash flowfrom operating activities rather than cash flow from investing activities and dividends paid tonon-controlling interests of £118 million (2011 – £112 million; 2010 – £107 million) are now disclosedas part of cash flows from financing activities rather than cash flow from operating activities. Thisrevised presentation is considered to be more consistent with the treatment of these items in theconsolidated income statement and the consolidated statement of changes in equity. The revision hadno impact on prior period increase or decrease in cash and cash equivalents, net assets or net profit.
(b) Not adopted by the group The following standards and amendments, issued by the IASB but notyet endorsed by the EU unless stated otherwise, have not yet been adopted by the group. Thestandards or interpretations will have to be adopted by the group in the year ending 30 June 2014unless stated otherwise, though the group may determine to adopt them earlier. The group does notcurrently believe the adoption of these standards or interpretations will have a material impact on itsconsolidated results or financial position, unless stated otherwise.
IFRS 9 – Financial instruments (effective in the year ending 30 June 2016) removes the multipleclassification and measurement models for financial assets required by IAS 39 and introduces a modelthat has only two classification categories: amortised cost and fair value. Classification is determined bythe business model used to manage the financial assets and the contractual cash flow characteristics ofthe financial assets. The accounting and presentation of financial liabilities and for derecognisingfinancial instruments has been transferred from IAS 39 without any significant changes. Theamendment to IFRS 7 – Financial instruments: Disclosures requires additional disclosures on transitionfrom IAS 39 to IFRS 9. The group is currently assessing the impact this standard would have on itsconsolidated results and financial position.
IFRS 10 – Consolidated financial statements replaces the guidance of control and consolidation inIAS 27 and SIC-12 – Consolidation – special purpose entities. The core principle that a consolidated
157

Notes to the consolidated financial statements (continued)
1. New accounting policies (continued)
entity presents a parent and its subsidiaries as if they were a single entity remains unchanged, as do themechanics of consolidation.
IFRS 11 – Joint arrangements requires joint arrangements to be accounted for as a joint operation or asa joint venture depending on the rights and obligations of each party to the arrangement. Proportionateconsolidation for joint ventures will be eliminated and equity accounting will be mandatory. It isanticipated that the application of the standard will result in an immaterial decrease in net sales, totalassets and total liabilities of the group but have no impact on the group’s net profit or net assets.
IFRS 12 – Disclosure of interests in other entities requires enhanced disclosures of the nature, risks andfinancial effects associated with the group’s interests in subsidiaries, associates, joint arrangements andunconsolidated structured entities.
IFRS 13 – Fair value measurement explains how to measure fair value and aims to enhance fair valuedisclosures. The standard does not materially change the measurement of fair value but codifies it inone place.
Amendments to IAS 19 – Employee benefits (endorsed by the EU in June 2012) changes a number ofdisclosure requirements for post employment arrangements and restricts the options currently availableon how to account for defined benefit pension plans. The most significant change that will impact thegroup is that the amendment requires the expected returns on pension plan assets, currently calculatedbased on management’s estimate of expected returns, to be replaced by a credit on the pension planassets calculated at the liability discount rate. The group estimates the adoption of the revised IAS 19would result in an additional charge to the income statement in the year ended 30 June 2012 ofapproximately £65 million. The change does not impact the group’s net assets.
Amendment to IAS 1 – Presentation of items of other comprehensive income (effective in the year ending30 June 2013, endorsed by the EU in June 2012)
Amendment to IAS 1 – Clarification of the requirements for comparative information
Limited scope amendment to IAS 12 – Income taxes (effective in the year ending 30 June 2013)
Amendment to IAS 16 – Classification of servicing equipment
IAS 27 (Revised) – Separate financial statements
IAS 28 (Revised) – Investments in associates and joint ventures
Amendment to IAS 32 – Offsetting financial assets and financial liabilities (effective in the year ending30 June 2015)
Amendment to IAS 32 – Tax effect of distribution to holders of equity instruments
Amendment to IAS 34 – Interim financial reporting
Amendment to IFRS 7 – Disclosures – Offsetting financial assets and financial liabilities
2. Segmental information
Diageo is an international manufacturer and distributor of premium drinks. The group produces,markets and distributes a wide range of premium brands, including Johnnie Walker, Smirnoff, Baileys,
158
Notes to the consolidated financial statements (continued)
2. Segmental information (continued)
Crown Royal, Captain Morgan and Guinness. In addition, Diageo also owns the distribution rights forthe Jose Cuervo tequila brands in North America and many other markets.
Diageo also owns a number of investments in unconsolidated associates, the principal investmentbeing a 34% interest in Moet Hennessy, the spirits and wines subsidiary of LVMH Moet Hennessy –Louis Vuitton SA. Moet Hennessy is based in France and is a leading producer and exporter ofchampagne and cognac.
On 25 May 2011 Diageo announced changes to its regional structure. From 1 July 2011 twoautonomous regions, Africa and Latin America and Caribbean, replaced the International region. TheGlobal Travel and duty free operations are now reported within the five geographical regions in whichthe external sales take place. The Middle East business has become part of Asia Pacific.
As a result of this change Diageo now reports the following operating segments externally: NorthAmerica, Europe, Africa, Latin America and Caribbean, Asia Pacific and Corporate. In addition, formanagement reporting for the year ended 30 June 2012, changes have been made to the allocation ofspecific corporate items reflecting the geographic segments for which they are in respect of. Restatedsegmental information for the years ended 30 June 2011 and 30 June 2010 has been disclosed in thetables below.
Diageo presents segmental information for the manufacture, distribution and selling of premiumdrinks in operating segments based on the geographical location of third party customers. Theinformation presented is consistent with management reporting provided to the chief operating decisionmaker, which has been identified as the executive committee.
The executive committee considers the business principally from a geographical perspective andthe business analysis is presented under the operating segments of North America, Europe, Africa,Latin America and Caribbean and Asia Pacific. In addition to these geographical selling segments, afurther segment reviewed by the executive committee is Global Supply which manufactures anddistributes premium drinks within the group. Continuing operations also include the Corporatefunction. In view of the focus on the geographical segments in explaining the group’s performance inthe Business review, the results of the Global Supply segment have been allocated to the geographicalsegments. Corporate revenues and costs are in respect of central costs, including finance, humanresources and legal, as well as certain information systems, facilities and employee costs that do notrelate to the geographical segments or to Global Supply and hence are not allocated. They also includerents receivable in respect of properties not used by the group in the manufacture, sale or distributionof premium drinks and the results of Gleneagles Hotel.
The segmental information for net sales and operating profit before exceptional items is reportedat budgeted exchange rates in line with management reporting. For management reporting purposes thegroup measures the current year at, and restates the prior year net sales and operating profit to, thecurrent year’s budgeted exchange rates. These exchange rates are set prior to the financial year as partof the financial planning process and provide a consistent exchange rate to measure the performance ofthe business throughout the year. The adjustments required to retranslate the segmental information toactual exchange rates and to reconcile it to the group’s reported results are shown in the tables below.The comparative segmental information, prior to retranslation, has not been restated at thecurrent year’s budgeted exchange rates but is presented at the budgeted rates for the years ended30 June 2011 and 30 June 2010, respectively.
159

Notes to the consolidated financial statements (continued)
2. Segmental information (continued)
In addition, for management reporting purposes Diageo excludes the impact of acquisitions anddisposals completed in the current and prior year from the results of the geographical segments inorder to provide comparable results. The impact of acquisitions and disposals on net sales andoperating profit is allocated to the appropriate geographical segments in the tables below. Theseacquisitions and disposals are the same as those disclosed in the organic growth reconciliations in theBusiness review but for management reporting purposes they are disclosed here at budgeted exchangerates.
(a) Segmental information for the consolidated income statement – continuing operations
Latin EliminateAmerica inter- Total Corporate
North and Asia Global segment operating andAmerica Europe Africa Caribbean Pacific Supply sales segments other Total
£ million £ million £ million £ million £ million £ million £ million £ million £ million £ million
2012Sales . . . . . . . . . . . . . . . . . 4,094 4,966 1,869 1,491 2,104 2,652 (2,652) 14,524 70 14,594
Net salesAt budgeted exchange rates* . 3,544 2,648 1,444 1,242 1,451 2,792 (2,665) 10,456 70 10,526Acquisitions and disposals . . . 1 337 32 — — — — 370 — 370Global Supply allocation . . . . 56 47 3 11 10 (127) — — — —Retranslation to actual
exchange rates . . . . . . . . . (45) (83) (32) (14) 40 (13) 13 (134) — (134)
Net sales . . . . . . . . . . . . . . 3,556 2,949 1,447 1,239 1,501 2,652 (2,652) 10,692 70 10,762
Operating profit/(loss)At budgeted exchange rates* . 1,311 756 390 386 351 158 — 3,352 (154) 3,198Acquisitions and disposals . . . — 119 (3) (8) (19) — — 89 (19) 70Global Supply allocation . . . . 60 80 3 9 6 (158) — — — —Retranslation to actual
exchange rates . . . . . . . . . (17) (30) (10) (4) 4 — — (57) (13) (70)
Operating profit/(loss) beforeexceptional items . . . . . . . 1,354 925 380 383 342 — — 3,384 (186) 3,198
Exceptional items . . . . . . . . (11) 41 (5) (2) (10) (40) — (27) (13) (40)
Operating profit/(loss) . . . . . 1,343 966 375 381 332 (40) — 3,357 (199) 3,158
Sale of businesses . . . . . . . . 147Net finance charges . . . . . . . (397)Share of associates’ profits
after tax– Moet Hennessy . . . . . . . . . 205– Other associates . . . . . . . . 8
Profit before taxation . . . . . . 3,121
* These items represent the IFRS 8 performance measures for the geographical and Global Supply segments.
160

Notes to the consolidated financial statements (continued)
2. Segmental information (continued)
Latin EliminateAmerica inter- Total Corporate
North and Asia Global segment operating andAmerica Europe Africa Caribbean Pacific Supply sales segments other Total
£ million £ million £ million £ million £ million £ million £ million £ million £ million £ million
2011 (restated)Sales . . . . . . . . . . . . . . . . . 3,895 4,279 1,764 1,293 1,931 2,678 (2,678) 13,162 70 13,232
Net salesAt budgeted exchange rates* . 3,330 2,649 1,313 1,119 1,270 2,785 (2,682) 9,784 70 9,854Acquisitions and disposals . . . 27 3 35 — 1 — — 66 — 66Global Supply allocation . . . . 31 46 3 12 11 (103) — — — —Retranslation to actual
exchange rates . . . . . . . . . (22) 5 6 (68) 95 (4) 4 16 — 16
Net sales . . . . . . . . . . . . . . 3,366 2,703 1,357 1,063 1,377 2,678 (2,678) 9,866 70 9,936
Operating profit/(loss)At budgeted exchange rates* . 1,218 741 349 352 291 146 — 3,097 (157) 2,940Acquisitions and disposals . . . 4 (8) (7) (3) (8) — — (22) — (22)Global Supply allocation . . . . 65 65 4 8 4 (146) — — — —Retranslation to actual
exchange rates . . . . . . . . . (12) (2) (13) (39) 12 — — (54) 20 (34)
Operating profit/(loss) beforeexceptional items . . . . . . . 1,275 796 333 318 299 — — 3,021 (137) 2,884
Exceptional items . . . . . . . . (23) (157) (7) (6) (50) (35) — (278) (11) (289)
Operating profit/(loss) . . . . . 1,252 639 326 312 249 (35) — 2,743 (148) 2,595
Sale of businesses . . . . . . . . (14)Net finance charges . . . . . . . (397)Share of associates’ profits
after tax– Moet Hennessy . . . . . . . . . 179– Other associates . . . . . . . . (3)
Profit before taxation . . . . . . 2,360
* These items represent the IFRS 8 performance measures for the geographical and Global Supply segments.
161

Notes to the consolidated financial statements (continued)
2. Segmental information (continued)
Latin EliminateAmerica inter- Total Corporate
North and Asia Global segment operating andAmerica Europe Africa Caribbean Pacific Supply sales segments other Total
£ million £ million £ million £ million £ million £ million £ million £ million £ million £ million
2010 (restated)Sales . . . . . . . . . . . . . . . . . 3,887 4,460 1,582 1,364 1,595 2,628 (2,628) 12,888 70 12,958
Net salesAt budgeted exchange rates* . 3,012 2,595 1,256 1,028 1,073 2,561 (2,460) 9,065 68 9,133Acquisitions and disposals . . . 47 9 7 — — — — 63 — 63Global Supply allocation . . . . 18 55 3 13 12 (101) — — — —Retranslation to actual
exchange rates . . . . . . . . . 263 189 (38) 82 86 167 (167) 582 2 584
Net sales . . . . . . . . . . . . . . 3,340 2,848 1,228 1,123 1,171 2,627 (2,627) 9,710 70 9,780
Operating profit/(loss)At budgeted exchange rates* . 1,048 762 313 352 229 142 — 2,846 (147) 2,699Acquisitions and disposals . . . (3) 1 (5) — (7) — — (14) — (14)Global Supply allocation . . . . 59 72 2 8 1 (142) — — — —Retranslation to actual
exchange rates . . . . . . . . . 80 46 (9) (24) 17 — — 110 (44) 66
Operating profit/(loss) beforeexceptional items . . . . . . . 1,184 881 301 336 240 — — 2,942 (191) 2,751
Exceptional items . . . . . . . . (38) (53) (3) (2) (30) (39) — (165) (12) (177)
Operating profit/(loss) . . . . . 1,146 828 298 334 210 (39) — 2,777 (203) 2,574
Sale of businesses . . . . . . . . (15)Net finance charges . . . . . . . (462)Share of associates’ profits
after tax– Moet Hennessy . . . . . . . . . 134– Other associates . . . . . . . . 8
Profit before taxation . . . . . . 2,239
* These items represent the IFRS 8 performance measures for the geographical and Global Supply segments.
(i) The segmental analysis of sales and operating profit/(loss) is based on the location of the thirdparty customers.
(ii) The net sales figures for Global Supply reported to the executive committee primarily compriseinter-segment sales and these are eliminated in a separate column in the above segmental analysis.Apart from sales by the Global Supply segment to the other operating segments, inter-segmentalsales are not material.
(iii) The group’s net finance charges are managed centrally and are not attributable to individualoperating segments.
162

Notes to the consolidated financial statements (continued)
2. Segmental information (continued)
(b) Other segmental information
LatinAmerica Corporate
North and Asia Global andAmerica Europe Africa Caribbean Pacific Supply other Total
£ million £ million £ million £ million £ million £ million £ million £ million
2012Capital expenditure . . . . . . . . . . 2 18 137 15 23 211 78 484Depreciation, intangible asset
amortisation and impairment . . (16) (23) (82) (4) (22) (128) (48) (323)Exceptional accelerated
depreciation . . . . . . . . . . . . . . (2) — — — — (27) — (29)Exceptional impairment of
intangible assets . . . . . . . . . . . — (59) — — — — — (59)
2011Capital expenditure . . . . . . . . . . 2 18 126 11 24 176 62 419Depreciation and intangible asset
amortisation . . . . . . . . . . . . . . (3) (16) (72) (4) (22) (129) (40) (286)Exceptional accelerated
depreciation . . . . . . . . . . . . . . — — — — — (27) — (27)Exceptional impairment of
intangible assets . . . . . . . . . . . — (39) — — — — — (39)
2010Capital expenditure . . . . . . . . . . 1 16 88 3 14 193 59 374Depreciation and intangible asset
amortisation . . . . . . . . . . . . . . (3) (16) (64) (4) (20) (143) (41) (291)Exceptional accelerated
depreciation . . . . . . . . . . . . . . — — — — — (44) (2) (46)Exceptional impairment of
intangible assets . . . . . . . . . . . — (35) — — — — — (35)
(c) Geographical information
Great United Nether- Rest ofBritain States lands World Total
£ million £ million £ million £ million £ million
2012Sales . . . . . . . . . . . . . . . . . . . . . . . . . . . . . . . . . . . . . . . . . 1,666 3,795 57 9,076 14,594Non-current assets . . . . . . . . . . . . . . . . . . . . . . . . . . . . . . . 1,392 3,282 2,228 7,339 14,241
2011Sales . . . . . . . . . . . . . . . . . . . . . . . . . . . . . . . . . . . . . . . . . 1,669 3,581 45 7,937 13,232Non-current assets . . . . . . . . . . . . . . . . . . . . . . . . . . . . . . . 1,226 3,150 2,196 5,163 11,735
2010Sales . . . . . . . . . . . . . . . . . . . . . . . . . . . . . . . . . . . . . . . . . 1,680 3,615 46 7,617 12,958Non-current assets . . . . . . . . . . . . . . . . . . . . . . . . . . . . . . . 1,122 3,348 2,327 4,655 11,452
163

Notes to the consolidated financial statements (continued)
2. Segmental information (continued)
(i) The geographical analysis of sales is based on the location of third party customers.
(ii) The geographical analysis of non-current assets is based on the geographical location of the assetsand comprises intangible assets, property, plant and equipment, biological assets, investments inassociates, other investments and non-current other receivables.
(d) Sales by category
ReadySpirits Beer Wine to drink Other Total
£ million £ million £ million £ million £ million £ million
2012 . . . . . . . . . . . . . . . . . . . . . . . . . . . . . 10,051 2,923 507 934 179 14,5942011 . . . . . . . . . . . . . . . . . . . . . . . . . . . . . 8,742 2,829 561 940 160 13,2322010 . . . . . . . . . . . . . . . . . . . . . . . . . . . . . 8,475 2,752 642 917 172 12,958
(e) Foreign exchange rates The principal foreign exchange rates used in the translation of financialstatements for the three years ended 30 June 2012, expressed in US dollars and euros per £1, wereas follows:
US dollar Euro
2012 2011 2010 2012 2011 2010
$ $ $ E E E
Weighted average rates used to translate income statements . . . 1.58 1.59 1.57 1.18 1.16 1.13Year end rates used to translate assets and liabilities . . . . . . . . 1.57 1.61 1.50 1.24 1.11 1.22
The group uses foreign exchange transaction hedges to mitigate the effect of exchange rate movements.
(f) Assets and liabilities The management information provided to the chief operating decisionmaker does not include an analysis by geographical segment of assets and liabilities andaccordingly no analysis by geographical segment of total assets or total liabilities is disclosed.
164
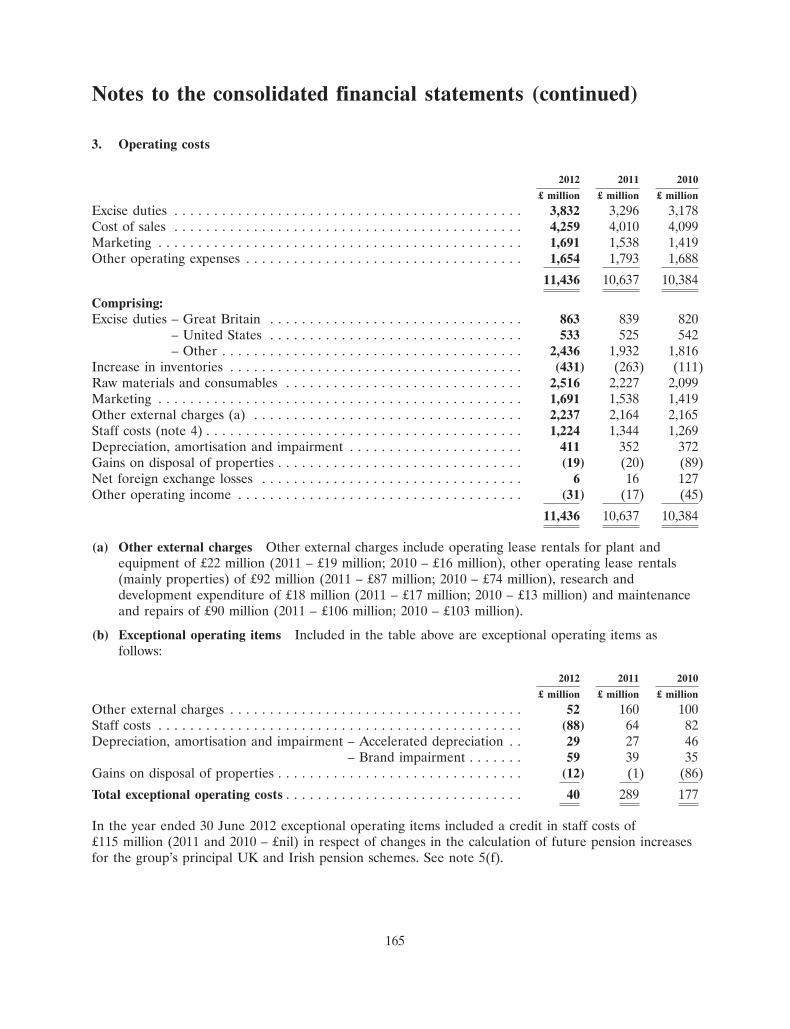
Notes to the consolidated financial statements (continued)
3. Operating costs
2012 2011 2010
£ million £ million £ million
Excise duties . . . . . . . . . . . . . . . . . . . . . . . . . . . . . . . . . . . . . . . . . . . . 3,832 3,296 3,178Cost of sales . . . . . . . . . . . . . . . . . . . . . . . . . . . . . . . . . . . . . . . . . . . . 4,259 4,010 4,099Marketing . . . . . . . . . . . . . . . . . . . . . . . . . . . . . . . . . . . . . . . . . . . . . . 1,691 1,538 1,419Other operating expenses . . . . . . . . . . . . . . . . . . . . . . . . . . . . . . . . . . . 1,654 1,793 1,688
11,436 10,637 10,384
Comprising:Excise duties – Great Britain . . . . . . . . . . . . . . . . . . . . . . . . . . . . . . . . 863 839 820
– United States . . . . . . . . . . . . . . . . . . . . . . . . . . . . . . . . 533 525 542 – Other . . . . . . . . . . . . . . . . . . . . . . . . . . . . . . . . . . . . . . 2,436 1,932 1,816
Increase in inventories . . . . . . . . . . . . . . . . . . . . . . . . . . . . . . . . . . . . . (431) (263) (111)Raw materials and consumables . . . . . . . . . . . . . . . . . . . . . . . . . . . . . . 2,516 2,227 2,099Marketing . . . . . . . . . . . . . . . . . . . . . . . . . . . . . . . . . . . . . . . . . . . . . . 1,691 1,538 1,419Other external charges (a) . . . . . . . . . . . . . . . . . . . . . . . . . . . . . . . . . . 2,237 2,164 2,165Staff costs (note 4) . . . . . . . . . . . . . . . . . . . . . . . . . . . . . . . . . . . . . . . . 1,224 1,344 1,269Depreciation, amortisation and impairment . . . . . . . . . . . . . . . . . . . . . . 411 352 372Gains on disposal of properties . . . . . . . . . . . . . . . . . . . . . . . . . . . . . . . (19) (20) (89)Net foreign exchange losses . . . . . . . . . . . . . . . . . . . . . . . . . . . . . . . . . 6 16 127Other operating income . . . . . . . . . . . . . . . . . . . . . . . . . . . . . . . . . . . . (31) (17) (45)
11,436 10,637 10,384
(a) Other external charges Other external charges include operating lease rentals for plant andequipment of £22 million (2011 – £19 million; 2010 – £16 million), other operating lease rentals(mainly properties) of £92 million (2011 – £87 million; 2010 – £74 million), research anddevelopment expenditure of £18 million (2011 – £17 million; 2010 – £13 million) and maintenanceand repairs of £90 million (2011 – £106 million; 2010 – £103 million).
(b) Exceptional operating items Included in the table above are exceptional operating items asfollows:
2012 2011 2010
£ million £ million £ million
Other external charges . . . . . . . . . . . . . . . . . . . . . . . . . . . . . . . . . . . . . 52 160 100Staff costs . . . . . . . . . . . . . . . . . . . . . . . . . . . . . . . . . . . . . . . . . . . . . . (88) 64 82Depreciation, amortisation and impairment – Accelerated depreciation . . 29 27 46
– Brand impairment . . . . . . . 59 39 35Gains on disposal of properties . . . . . . . . . . . . . . . . . . . . . . . . . . . . . . . (12) (1) (86)
Total exceptional operating costs . . . . . . . . . . . . . . . . . . . . . . . . . . . . . . 40 289 177
In the year ended 30 June 2012 exceptional operating items included a credit in staff costs of£115 million (2011 and 2010 – £nil) in respect of changes in the calculation of future pension increasesfor the group’s principal UK and Irish pension schemes. See note 5(f).
165

Notes to the consolidated financial statements (continued)
3. Operating costs (continued)
Of the total exceptional operating costs of £40 million (2011 – £289 million; 2010 – £177 million),£31 million (2011 – £27 million; 2010 – £46 million) is included in cost of sales and £9 million (2011 –£262 million; 2010 – £131 million) in other operating expenses.
(c) Auditor fees The group has revised the analysis of auditor fees in accordance with StatutoryInstrument 2011/2198.
The fees of the principal auditor of the group, KPMG Audit Plc, and its affiliates were as follows:
United Rest of 2011 2010Kingdom World 2012 (restated) (restated)
£ million £ million £ million £ million £ million
Audit of these financial statements . . . . . . . . . . . . . 2.3 0.8 3.1 3.8 3.4Audit of financial statements of subsidiaries
pursuant to legislation . . . . . . . . . . . . . . . . . . . . 0.3 2.4 2.7 2.6 2.8Audit related assurance services(i) . . . . . . . . . . . . . 0.4 1.2 1.6 1.8 1.7
Total audit fees . . . . . . . . . . . . . . . . . . . . . . . . . . . 3.0 4.4 7.4 8.2 7.9Other services relevant to taxation(ii) . . . . . . . . . . . 0.3 0.8 1.1 0.5 0.6Other assurance services(iii) . . . . . . . . . . . . . . . . . . 0.5 0.5 1.0 0.5 1.1All other non-audit fees(iv) . . . . . . . . . . . . . . . . . . 1.7 0.2 1.9 0.9 0.4
5.5 5.9 11.4 10.1 10.0
(i) Audit-related assurances services relate principally to reporting required under section 404 of theUS Sarbanes-Oxley Act and audit services for the review of the interim financial information.
(ii) Other services relevant to taxation comprise principally tax advice in respect of transactions.
(iii) Other assurance services comprise the aggregate fees billed for assurance and related services thatare reasonably related to the performance of the audit or review of the financial statements andare not reported under ‘total audit fees’.
(iv) All other non-audit fees relate principally to advisory services, including services in respect of duediligence and services in relation to acquisitions and disposals.
Under the US disclosure requirements the auditor fees are classified as follows:
United Rest ofKingdom World 2012 2011 2010
£ million £ million £ million £ million £ million
Audit fees . . . . . . . . . . . . . . . . . . . . . . . . . . . . . . . 2.7 4.4 7.1 7.8 7.6Tax fees(i) . . . . . . . . . . . . . . . . . . . . . . . . . . . . . . . 0.3 0.8 1.1 0.5 0.6Audit related fees(ii) . . . . . . . . . . . . . . . . . . . . . . . . 0.8 0.5 1.3 0.9 1.4All other fees(iii) . . . . . . . . . . . . . . . . . . . . . . . . . . 1.7 0.2 1.9 0.9 0.4
5.5 5.9 11.4 10.1 10.0
(i) Tax fees comprise principally tax advice in respect of transactions.
(ii) Audit related fees comprise the aggregate fees billed for assurance and related services that arereasonably related to the performance of the audit or review of the financial statements and are
166
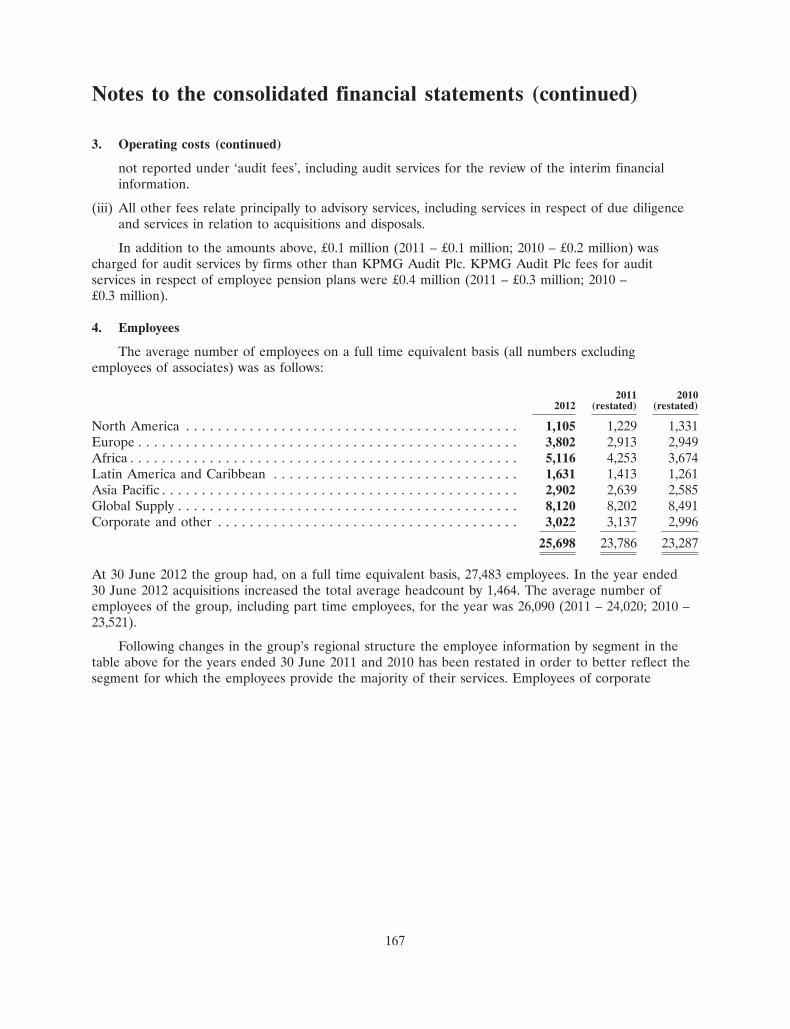
Notes to the consolidated financial statements (continued)
3. Operating costs (continued)
not reported under ‘audit fees’, including audit services for the review of the interim financialinformation.
(iii) All other fees relate principally to advisory services, including services in respect of due diligenceand services in relation to acquisitions and disposals.
In addition to the amounts above, £0.1 million (2011 – £0.1 million; 2010 – £0.2 million) wascharged for audit services by firms other than KPMG Audit Plc. KPMG Audit Plc fees for auditservices in respect of employee pension plans were £0.4 million (2011 – £0.3 million; 2010 –£0.3 million).
4. Employees
The average number of employees on a full time equivalent basis (all numbers excludingemployees of associates) was as follows:
2011 20102012 (restated) (restated)
North America . . . . . . . . . . . . . . . . . . . . . . . . . . . . . . . . . . . . . . . . . . 1,105 1,229 1,331Europe . . . . . . . . . . . . . . . . . . . . . . . . . . . . . . . . . . . . . . . . . . . . . . . . 3,802 2,913 2,949Africa . . . . . . . . . . . . . . . . . . . . . . . . . . . . . . . . . . . . . . . . . . . . . . . . . 5,116 4,253 3,674Latin America and Caribbean . . . . . . . . . . . . . . . . . . . . . . . . . . . . . . . 1,631 1,413 1,261Asia Pacific . . . . . . . . . . . . . . . . . . . . . . . . . . . . . . . . . . . . . . . . . . . . . 2,902 2,639 2,585Global Supply . . . . . . . . . . . . . . . . . . . . . . . . . . . . . . . . . . . . . . . . . . . 8,120 8,202 8,491Corporate and other . . . . . . . . . . . . . . . . . . . . . . . . . . . . . . . . . . . . . . 3,022 3,137 2,996
25,698 23,786 23,287
At 30 June 2012 the group had, on a full time equivalent basis, 27,483 employees. In the year ended30 June 2012 acquisitions increased the total average headcount by 1,464. The average number ofemployees of the group, including part time employees, for the year was 26,090 (2011 – 24,020; 2010 –23,521).
Following changes in the group’s regional structure the employee information by segment in thetable above for the years ended 30 June 2011 and 2010 has been restated in order to better reflect thesegment for which the employees provide the majority of their services. Employees of corporate
167
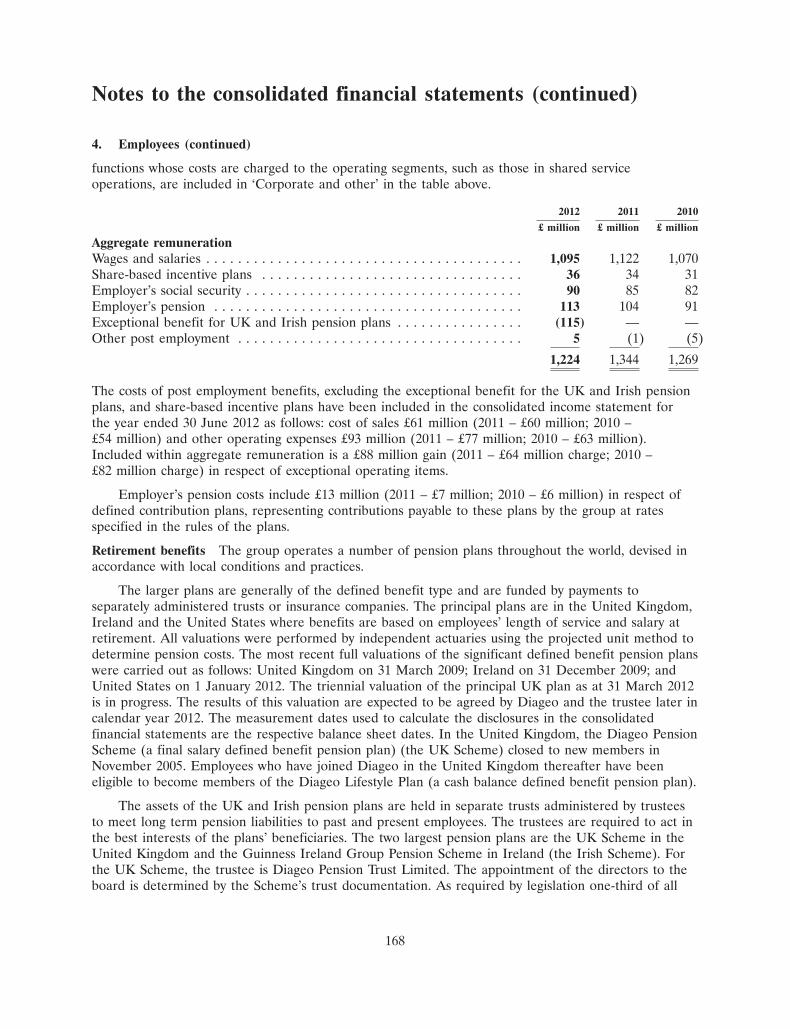
Notes to the consolidated financial statements (continued)
4. Employees (continued)
functions whose costs are charged to the operating segments, such as those in shared serviceoperations, are included in ‘Corporate and other’ in the table above.
2012 2011 2010
£ million £ million £ million
Aggregate remunerationWages and salaries . . . . . . . . . . . . . . . . . . . . . . . . . . . . . . . . . . . . . . . . 1,095 1,122 1,070Share-based incentive plans . . . . . . . . . . . . . . . . . . . . . . . . . . . . . . . . . 36 34 31Employer’s social security . . . . . . . . . . . . . . . . . . . . . . . . . . . . . . . . . . . 90 85 82Employer’s pension . . . . . . . . . . . . . . . . . . . . . . . . . . . . . . . . . . . . . . . 113 104 91Exceptional benefit for UK and Irish pension plans . . . . . . . . . . . . . . . . (115) — —Other post employment . . . . . . . . . . . . . . . . . . . . . . . . . . . . . . . . . . . . 5 (1) (5)
1,224 1,344 1,269
The costs of post employment benefits, excluding the exceptional benefit for the UK and Irish pensionplans, and share-based incentive plans have been included in the consolidated income statement forthe year ended 30 June 2012 as follows: cost of sales £61 million (2011 – £60 million; 2010 –£54 million) and other operating expenses £93 million (2011 – £77 million; 2010 – £63 million).Included within aggregate remuneration is a £88 million gain (2011 – £64 million charge; 2010 –£82 million charge) in respect of exceptional operating items.
Employer’s pension costs include £13 million (2011 – £7 million; 2010 – £6 million) in respect ofdefined contribution plans, representing contributions payable to these plans by the group at ratesspecified in the rules of the plans.
Retirement benefits The group operates a number of pension plans throughout the world, devised inaccordance with local conditions and practices.
The larger plans are generally of the defined benefit type and are funded by payments toseparately administered trusts or insurance companies. The principal plans are in the United Kingdom,Ireland and the United States where benefits are based on employees’ length of service and salary atretirement. All valuations were performed by independent actuaries using the projected unit method todetermine pension costs. The most recent full valuations of the significant defined benefit pension planswere carried out as follows: United Kingdom on 31 March 2009; Ireland on 31 December 2009; andUnited States on 1 January 2012. The triennial valuation of the principal UK plan as at 31 March 2012is in progress. The results of this valuation are expected to be agreed by Diageo and the trustee later incalendar year 2012. The measurement dates used to calculate the disclosures in the consolidatedfinancial statements are the respective balance sheet dates. In the United Kingdom, the Diageo PensionScheme (a final salary defined benefit pension plan) (the UK Scheme) closed to new members inNovember 2005. Employees who have joined Diageo in the United Kingdom thereafter have beeneligible to become members of the Diageo Lifestyle Plan (a cash balance defined benefit pension plan).
The assets of the UK and Irish pension plans are held in separate trusts administered by trusteesto meet long term pension liabilities to past and present employees. The trustees are required to act inthe best interests of the plans’ beneficiaries. The two largest pension plans are the UK Scheme in theUnited Kingdom and the Guinness Ireland Group Pension Scheme in Ireland (the Irish Scheme). Forthe UK Scheme, the trustee is Diageo Pension Trust Limited. The appointment of the directors to theboard is determined by the Scheme’s trust documentation. As required by legislation one-third of all
168
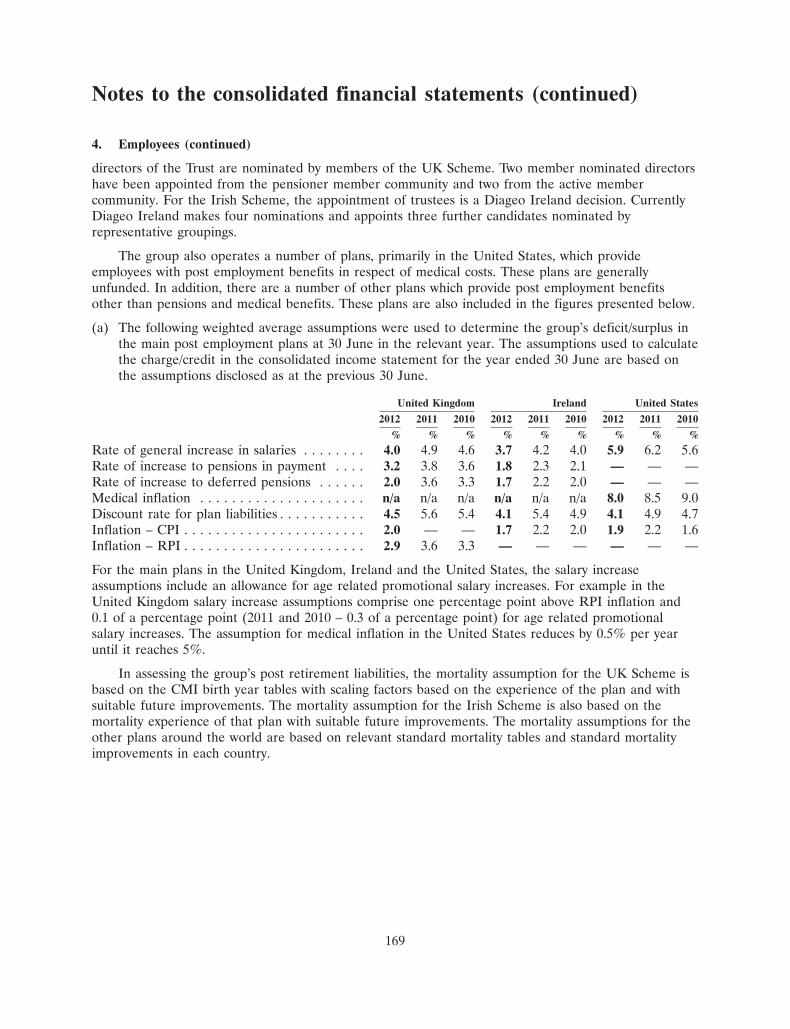
Notes to the consolidated financial statements (continued)
4. Employees (continued)
directors of the Trust are nominated by members of the UK Scheme. Two member nominated directorshave been appointed from the pensioner member community and two from the active membercommunity. For the Irish Scheme, the appointment of trustees is a Diageo Ireland decision. CurrentlyDiageo Ireland makes four nominations and appoints three further candidates nominated byrepresentative groupings.
The group also operates a number of plans, primarily in the United States, which provideemployees with post employment benefits in respect of medical costs. These plans are generallyunfunded. In addition, there are a number of other plans which provide post employment benefitsother than pensions and medical benefits. These plans are also included in the figures presented below.
(a) The following weighted average assumptions were used to determine the group’s deficit/surplus inthe main post employment plans at 30 June in the relevant year. The assumptions used to calculatethe charge/credit in the consolidated income statement for the year ended 30 June are based onthe assumptions disclosed as at the previous 30 June.
United Kingdom Ireland United States
2012 2011 2010 2012 2011 2010 2012 2011 2010
% % % % % % % % %
Rate of general increase in salaries . . . . . . . . 4.0 4.9 4.6 3.7 4.2 4.0 5.9 6.2 5.6Rate of increase to pensions in payment . . . . 3.2 3.8 3.6 1.8 2.3 2.1 — — —Rate of increase to deferred pensions . . . . . . 2.0 3.6 3.3 1.7 2.2 2.0 — — —Medical inflation . . . . . . . . . . . . . . . . . . . . . n/a n/a n/a n/a n/a n/a 8.0 8.5 9.0Discount rate for plan liabilities . . . . . . . . . . . 4.5 5.6 5.4 4.1 5.4 4.9 4.1 4.9 4.7Inflation – CPI . . . . . . . . . . . . . . . . . . . . . . . 2.0 — — 1.7 2.2 2.0 1.9 2.2 1.6Inflation – RPI . . . . . . . . . . . . . . . . . . . . . . . 2.9 3.6 3.3 — — — — — —
For the main plans in the United Kingdom, Ireland and the United States, the salary increaseassumptions include an allowance for age related promotional salary increases. For example in theUnited Kingdom salary increase assumptions comprise one percentage point above RPI inflation and0.1 of a percentage point (2011 and 2010 – 0.3 of a percentage point) for age related promotionalsalary increases. The assumption for medical inflation in the United States reduces by 0.5% per yearuntil it reaches 5%.
In assessing the group’s post retirement liabilities, the mortality assumption for the UK Scheme isbased on the CMI birth year tables with scaling factors based on the experience of the plan and withsuitable future improvements. The mortality assumption for the Irish Scheme is also based on themortality experience of that plan with suitable future improvements. The mortality assumptions for theother plans around the world are based on relevant standard mortality tables and standard mortalityimprovements in each country.
169
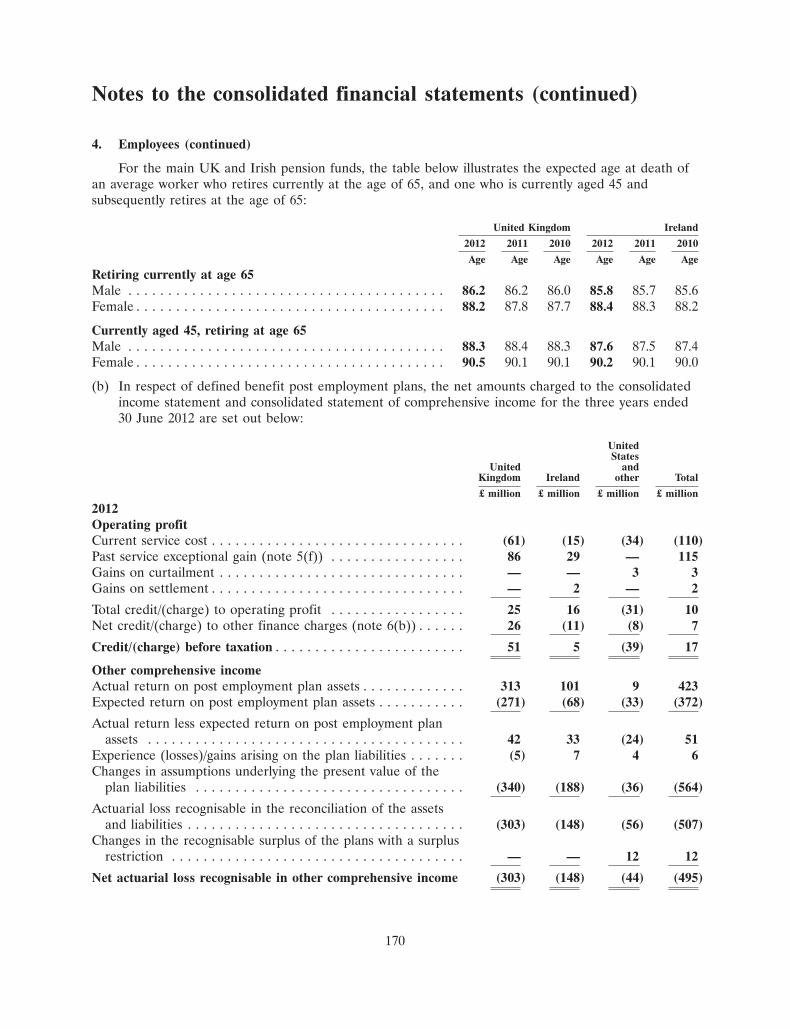
Notes to the consolidated financial statements (continued)
4. Employees (continued)
For the main UK and Irish pension funds, the table below illustrates the expected age at death ofan average worker who retires currently at the age of 65, and one who is currently aged 45 andsubsequently retires at the age of 65:
United Kingdom Ireland
2012 2011 2010 2012 2011 2010
Age Age Age Age Age Age
Retiring currently at age 65Male . . . . . . . . . . . . . . . . . . . . . . . . . . . . . . . . . . . . . . . . 86.2 86.2 86.0 85.8 85.7 85.6Female . . . . . . . . . . . . . . . . . . . . . . . . . . . . . . . . . . . . . . . 88.2 87.8 87.7 88.4 88.3 88.2
Currently aged 45, retiring at age 65Male . . . . . . . . . . . . . . . . . . . . . . . . . . . . . . . . . . . . . . . . 88.3 88.4 88.3 87.6 87.5 87.4Female . . . . . . . . . . . . . . . . . . . . . . . . . . . . . . . . . . . . . . . 90.5 90.1 90.1 90.2 90.1 90.0
(b) In respect of defined benefit post employment plans, the net amounts charged to the consolidatedincome statement and consolidated statement of comprehensive income for the three years ended30 June 2012 are set out below:
UnitedStates
United andKingdom Ireland other Total
£ million £ million £ million £ million
2012Operating profitCurrent service cost . . . . . . . . . . . . . . . . . . . . . . . . . . . . . . . . (61) (15) (34) (110)Past service exceptional gain (note 5(f)) . . . . . . . . . . . . . . . . . 86 29 — 115Gains on curtailment . . . . . . . . . . . . . . . . . . . . . . . . . . . . . . . — — 3 3Gains on settlement . . . . . . . . . . . . . . . . . . . . . . . . . . . . . . . . — 2 — 2
Total credit/(charge) to operating profit . . . . . . . . . . . . . . . . . 25 16 (31) 10Net credit/(charge) to other finance charges (note 6(b)) . . . . . . 26 (11) (8) 7
Credit/(charge) before taxation . . . . . . . . . . . . . . . . . . . . . . . . 51 5 (39) 17
Other comprehensive incomeActual return on post employment plan assets . . . . . . . . . . . . . 313 101 9 423Expected return on post employment plan assets . . . . . . . . . . . (271) (68) (33) (372)
Actual return less expected return on post employment planassets . . . . . . . . . . . . . . . . . . . . . . . . . . . . . . . . . . . . . . . . 42 33 (24) 51
Experience (losses)/gains arising on the plan liabilities . . . . . . . (5) 7 4 6Changes in assumptions underlying the present value of the
plan liabilities . . . . . . . . . . . . . . . . . . . . . . . . . . . . . . . . . . (340) (188) (36) (564)
Actuarial loss recognisable in the reconciliation of the assetsand liabilities . . . . . . . . . . . . . . . . . . . . . . . . . . . . . . . . . . . (303) (148) (56) (507)
Changes in the recognisable surplus of the plans with a surplusrestriction . . . . . . . . . . . . . . . . . . . . . . . . . . . . . . . . . . . . . — — 12 12
Net actuarial loss recognisable in other comprehensive income (303) (148) (44) (495)
170

Notes to the consolidated financial statements (continued)
4. Employees (continued)
UnitedStates
United andKingdom Ireland other Total
£ million £ million £ million £ million
2011Operating profitCurrent service cost . . . . . . . . . . . . . . . . . . . . . . . . . . . . . . . . (59) (19) (32) (110)Past service gain . . . . . . . . . . . . . . . . . . . . . . . . . . . . . . . . . . 2 — 3 5Gains on curtailments . . . . . . . . . . . . . . . . . . . . . . . . . . . . . . 2 4 3 9
Total charge to operating profit . . . . . . . . . . . . . . . . . . . . . . . (55) (15) (26) (96)Net credit/(charge) to other finance charges (note 6(b)) . . . . . . 14 (4) (13) (3)
Charge before taxation . . . . . . . . . . . . . . . . . . . . . . . . . . . . . (41) (19) (39) (99)
Other comprehensive incomeActual return on post employment plan assets . . . . . . . . . . . . . 575 37 63 675Expected return on post employment plan assets . . . . . . . . . . . (242) (70) (27) (339)
Actual return less expected return on post employment planassets . . . . . . . . . . . . . . . . . . . . . . . . . . . . . . . . . . . . . . . . 333 (33) 36 336
Experience losses arising on the plan liabilities . . . . . . . . . . . . (49) (14) (11) (74)Changes in assumptions underlying the present value of the
plan liabilities . . . . . . . . . . . . . . . . . . . . . . . . . . . . . . . . . . (54) 67 7 20
Actuarial gain recognisable in the reconciliation of the assetsand liabilities . . . . . . . . . . . . . . . . . . . . . . . . . . . . . . . . . . . 230 20 32 282
Changes in the recognisable surplus of the plans with a surplusrestriction . . . . . . . . . . . . . . . . . . . . . . . . . . . . . . . . . . . . . — — (10) (10)
Net actuarial gain recognisable in other comprehensive income 230 20 22 272
171
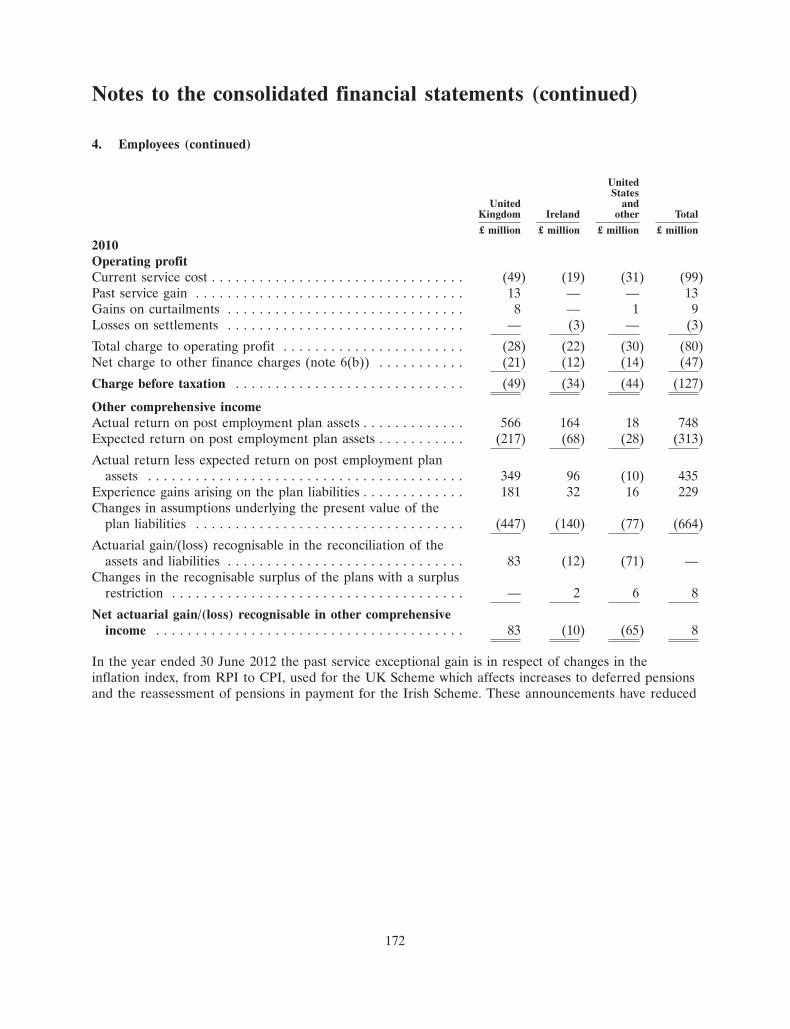
Notes to the consolidated financial statements (continued)
4. Employees (continued)
UnitedStates
United andKingdom Ireland other Total
£ million £ million £ million £ million
2010Operating profitCurrent service cost . . . . . . . . . . . . . . . . . . . . . . . . . . . . . . . . (49) (19) (31) (99)Past service gain . . . . . . . . . . . . . . . . . . . . . . . . . . . . . . . . . . 13 — — 13Gains on curtailments . . . . . . . . . . . . . . . . . . . . . . . . . . . . . . 8 — 1 9Losses on settlements . . . . . . . . . . . . . . . . . . . . . . . . . . . . . . — (3) — (3)
Total charge to operating profit . . . . . . . . . . . . . . . . . . . . . . . (28) (22) (30) (80)Net charge to other finance charges (note 6(b)) . . . . . . . . . . . (21) (12) (14) (47)
Charge before taxation . . . . . . . . . . . . . . . . . . . . . . . . . . . . . (49) (34) (44) (127)
Other comprehensive incomeActual return on post employment plan assets . . . . . . . . . . . . . 566 164 18 748Expected return on post employment plan assets . . . . . . . . . . . (217) (68) (28) (313)
Actual return less expected return on post employment planassets . . . . . . . . . . . . . . . . . . . . . . . . . . . . . . . . . . . . . . . . 349 96 (10) 435
Experience gains arising on the plan liabilities . . . . . . . . . . . . . 181 32 16 229Changes in assumptions underlying the present value of the
plan liabilities . . . . . . . . . . . . . . . . . . . . . . . . . . . . . . . . . . (447) (140) (77) (664)
Actuarial gain/(loss) recognisable in the reconciliation of theassets and liabilities . . . . . . . . . . . . . . . . . . . . . . . . . . . . . . 83 (12) (71) —
Changes in the recognisable surplus of the plans with a surplusrestriction . . . . . . . . . . . . . . . . . . . . . . . . . . . . . . . . . . . . . — 2 6 8
Net actuarial gain/(loss) recognisable in other comprehensiveincome . . . . . . . . . . . . . . . . . . . . . . . . . . . . . . . . . . . . . . . 83 (10) (65) 8
In the year ended 30 June 2012 the past service exceptional gain is in respect of changes in theinflation index, from RPI to CPI, used for the UK Scheme which affects increases to deferred pensionsand the reassessment of pensions in payment for the Irish Scheme. These announcements have reduced
172
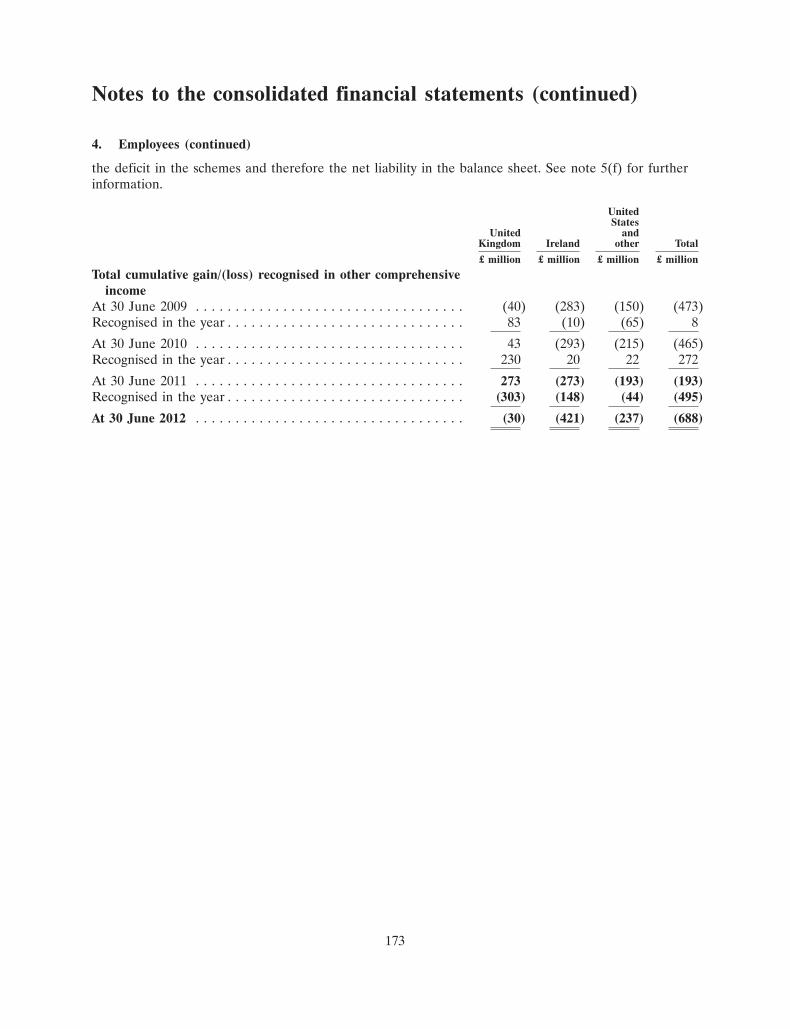
Notes to the consolidated financial statements (continued)
4. Employees (continued)
the deficit in the schemes and therefore the net liability in the balance sheet. See note 5(f) for furtherinformation.
UnitedStates
United andKingdom Ireland other Total
£ million £ million £ million £ million
Total cumulative gain/(loss) recognised in other comprehensiveincome
At 30 June 2009 . . . . . . . . . . . . . . . . . . . . . . . . . . . . . . . . . . (40) (283) (150) (473)Recognised in the year . . . . . . . . . . . . . . . . . . . . . . . . . . . . . . 83 (10) (65) 8
At 30 June 2010 . . . . . . . . . . . . . . . . . . . . . . . . . . . . . . . . . . 43 (293) (215) (465)Recognised in the year . . . . . . . . . . . . . . . . . . . . . . . . . . . . . . 230 20 22 272
At 30 June 2011 . . . . . . . . . . . . . . . . . . . . . . . . . . . . . . . . . . 273 (273) (193) (193)Recognised in the year . . . . . . . . . . . . . . . . . . . . . . . . . . . . . . (303) (148) (44) (495)
At 30 June 2012 . . . . . . . . . . . . . . . . . . . . . . . . . . . . . . . . . . (30) (421) (237) (688)
173

Notes to the consolidated financial statements (continued)
4. Employees (continued)
(c) The expected long term rates of return and fair values of the assets of the defined benefit postemployment plans were as follows:
United StatesUnited Kingdom Ireland and other Total
Expected Expected Expected Expectedlong term long term long term long term
rates of Fair rates of Fair rates of Fair rates of Fairreturn value return value return value return value
% £ million % £ million % £ million % £ million2012Fair value of plan assetsEquities . . . . . . . . . . . . . . . . . . . . . 7.3 1,591 7.3 472 7.2 269 7.3 2,332Bonds . . . . . . . . . . . . . . . . . . . . . . . 3.5 1,795 3.2 408 3.4 184 3.4 2,387Property . . . . . . . . . . . . . . . . . . . . . 7.3 512 7.3 64 7.0 9 7.3 585Other . . . . . . . . . . . . . . . . . . . . . . . 3.9 593 3.8 208 3.8 60 3.9 861
4,491 1,152 522 6,165Present value of funded plan liabilities . . (4,747) (1,552) (747) (7,046)Present value of unfunded plan liabilities (90) (7) (106) (203)
Deficit in post employment plans . . . . . (346) (407) (331) (1,084)Surplus restriction . . . . . . . . . . . . . . . — — (1) (1)
Post employment benefit net liabilities . . (346) (407) (332) (1,085)
2011Fair value of plan assetsEquities . . . . . . . . . . . . . . . . . . . . . 8.3 1,699 8.6 527 8.2 285 8.3 2,511Bonds . . . . . . . . . . . . . . . . . . . . . . . 4.8 1,619 4.9 628 4.6 171 4.8 2,418Property . . . . . . . . . . . . . . . . . . . . . 8.3 495 8.6 75 8.3 10 8.3 580Other . . . . . . . . . . . . . . . . . . . . . . . 5.2 489 5.3 (10) 5.1 47 5.2 526
4,302 1,220 513 6,035Present value of funded plan liabilities . . (4,402) (1,571) (705) (6,678)Present value of unfunded plan liabilities (81) — (100) (181)
Deficit in post employment plans . . . . . (181) (351) (292) (824)Surplus restriction . . . . . . . . . . . . . . . — — (2) (2)Impact of minimum funding requirement — — (12) (12)
Post employment benefit net liabilities . . (181) (351) (306) (838)
Included in the post employment plan deficit of £1,084 million (2011 – £824 million) are £191 million(2011 – £166 million) in respect of post employment medical benefit liabilities and £32 million (2011 –£32 million) in respect of other non-pension post employment liabilities.
Within the plan assets above there is no investment in the ordinary shares of Diageo plc. Includedin equities in the UK plans at 30 June 2012 are £248 million (2011 – £324 million) invested in hedgefunds and £289 million (2011 – £285 million) invested in private equity. Included in other assets at30 June 2012 are interest rate and inflation swaps and repurchase agreements with a fair value in theUK plans of £329 million gain (2011 – £173 million gain) and in the Irish plans of £73 million gain(2011 – £18 million loss).
The asset classes include some cash holdings that are temporary. This cash is likely to be investedimminently and so has been included in the asset class where it is anticipated to be invested in the longterm. UK plan assets include temporary cash of £26 million (2011 – £43 million) in ‘equities’,
174

Notes to the consolidated financial statements (continued)
4. Employees (continued)
£102 million (2011 – £74 million) in ‘bonds’ and £7 million (2011 – £5 million) in ‘property’. Irish planassets include temporary cash of £7 million (2011 – £11 million) in ‘equities’ and £8 million (2011 –£26 million) in ‘bonds’.
Post employment benefit assets and liabilities are recognised in the consolidated balance sheet,depending on whether an individual plan is in surplus or deficit, as follows:
2012 2011
£ million £ million
Non-current assets . . . . . . . . . . . . . . . . . . . . . . . . . . . . . . . . . . . . . . . . . . . . . . . 22 60Non-current liabilities . . . . . . . . . . . . . . . . . . . . . . . . . . . . . . . . . . . . . . . . . . . . . (1,107) (898)
(1,085) (838)
The expected long term rates of return for equities have been determined by reference to governmentbond rates (minimum risk rates) in the countries in which the plans are based. As at 30 June 2012, toreflect the additional risks associated with equities, expected long term rates of return on equitiesinclude a risk premium of 4.5% per year (2011 and 2010 – 4%) in excess of the expected return fromgovernment bonds. This risk premium is a long term assumption which is set after taking actuarialadvice and considering the assumptions used by other FTSE 100 companies. The expected long termrates of return for other assets are determined in a similar way, by including an appropriate riskpremium relative to government bonds in the relevant country.
The investment strategy for the group’s funded post employment plans is decided locally by thetrustee of the plan and/or Diageo, as appropriate, and takes account of the relevant statutoryrequirements. The objective for the investment strategy is to achieve a target rate of return in excess ofthe movement on the liabilities, while taking an acceptable amount of investment risk relative to theliabilities. This objective is implemented by using specific allocations to a variety of asset classes thatare expected over the long term to deliver the target rate of return. Most investment strategies havesignificant allocations to equities, with the intention that this will result in the ongoing cost to thegroup of the post employment plans being lower over the long term, within acceptable boundaries ofrisk. Each investment strategy is also designed to control investment risk by managing allocations toasset classes, geographical exposures and individual equity exposures.
At 30 June 2012, approximately 33% and 57% (2011 – 33% and 37%) of the UK Scheme’sliabilities were hedged against future movements in interest rates and inflation, respectively, throughthe use of swaps. At 30 June 2012, approximately 37% and 45% (2011 – 37% and 37%) of the IrishScheme’s liabilities were hedged against future movements in interest rates and inflation, respectively,through the use of swaps.
The discount rate is based on the yields of high quality fixed income investments. For theUK pension plans, which represent approximately 67% of total plan liabilities, the discount rate isdetermined by reference to the yield curves of AA rated corporate bonds for which the timing andamount of cash outflows are similar to those of the plans. A similar process is used to determine thediscount rate for the non-UK plans.
175
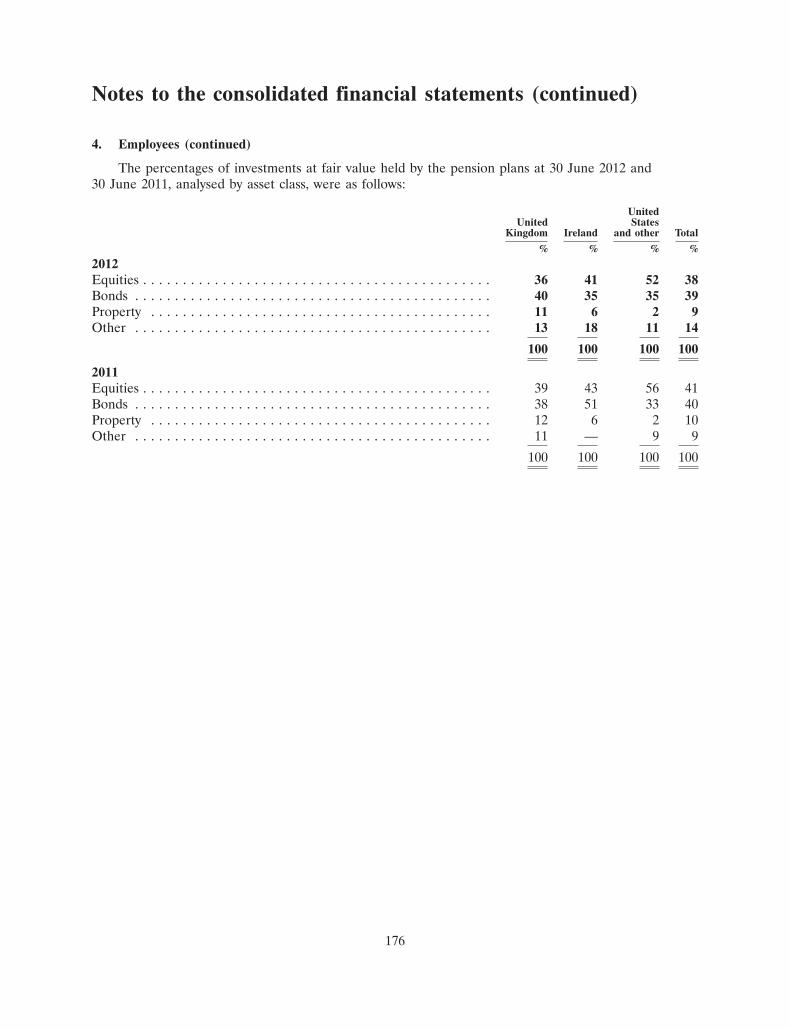
Notes to the consolidated financial statements (continued)
4. Employees (continued)
The percentages of investments at fair value held by the pension plans at 30 June 2012 and30 June 2011, analysed by asset class, were as follows:
UnitedUnited States
Kingdom Ireland and other Total
% % % %
2012Equities . . . . . . . . . . . . . . . . . . . . . . . . . . . . . . . . . . . . . . . . . . . . 36 41 52 38Bonds . . . . . . . . . . . . . . . . . . . . . . . . . . . . . . . . . . . . . . . . . . . . . 40 35 35 39Property . . . . . . . . . . . . . . . . . . . . . . . . . . . . . . . . . . . . . . . . . . . 11 6 2 9Other . . . . . . . . . . . . . . . . . . . . . . . . . . . . . . . . . . . . . . . . . . . . . 13 18 11 14
100 100 100 100
2011Equities . . . . . . . . . . . . . . . . . . . . . . . . . . . . . . . . . . . . . . . . . . . . 39 43 56 41Bonds . . . . . . . . . . . . . . . . . . . . . . . . . . . . . . . . . . . . . . . . . . . . . 38 51 33 40Property . . . . . . . . . . . . . . . . . . . . . . . . . . . . . . . . . . . . . . . . . . . 12 6 2 10Other . . . . . . . . . . . . . . . . . . . . . . . . . . . . . . . . . . . . . . . . . . . . . 11 — 9 9
100 100 100 100
176

Notes to the consolidated financial statements (continued)
4. Employees (continued)
(d) Movements in the present value of plan liabilities during the two years ended 30 June 2012:
UnitedUnited States
Kingdom Ireland and other Total
£ million £ million £ million £ million
Present value of plan liabilitiesAt 30 June 2010 . . . . . . . . . . . . . . . . . . . . . . . . . . . . . . . . . . 4,279 1,481 809 6,569Exchange differences . . . . . . . . . . . . . . . . . . . . . . . . . . . . . . . — 144 (27) 117Current service cost . . . . . . . . . . . . . . . . . . . . . . . . . . . . . . . . 59 19 32 110Past service gain . . . . . . . . . . . . . . . . . . . . . . . . . . . . . . . . . . (2) — (3) (5)Interest cost . . . . . . . . . . . . . . . . . . . . . . . . . . . . . . . . . . . . . 228 74 40 342Actuarial loss/(gain) . . . . . . . . . . . . . . . . . . . . . . . . . . . . . . . . 103 (53) 4 54Employee contributions . . . . . . . . . . . . . . . . . . . . . . . . . . . . . 7 3 1 11Benefits paid . . . . . . . . . . . . . . . . . . . . . . . . . . . . . . . . . . . . . (189) (83) (47) (319)Curtailments . . . . . . . . . . . . . . . . . . . . . . . . . . . . . . . . . . . . . (2) (4) (3) (9)Settlements . . . . . . . . . . . . . . . . . . . . . . . . . . . . . . . . . . . . . . — (10) (1) (11)
At 30 June 2011 . . . . . . . . . . . . . . . . . . . . . . . . . . . . . . . . . . 4,483 1,571 805 6,859Exchange differences . . . . . . . . . . . . . . . . . . . . . . . . . . . . . . . — (173) (1) (174)Acquisition of business . . . . . . . . . . . . . . . . . . . . . . . . . . . . . . — — 2 2Current service cost . . . . . . . . . . . . . . . . . . . . . . . . . . . . . . . . 61 15 34 110Past service exceptional gain . . . . . . . . . . . . . . . . . . . . . . . . . . (86) (29) — (115)Interest cost . . . . . . . . . . . . . . . . . . . . . . . . . . . . . . . . . . . . . 245 79 41 365Actuarial loss . . . . . . . . . . . . . . . . . . . . . . . . . . . . . . . . . . . . 345 181 32 558Employee contributions . . . . . . . . . . . . . . . . . . . . . . . . . . . . . 1 3 1 5Benefits paid . . . . . . . . . . . . . . . . . . . . . . . . . . . . . . . . . . . . . (212) (82) (58) (352)Curtailments . . . . . . . . . . . . . . . . . . . . . . . . . . . . . . . . . . . . . — — (3) (3)Settlements . . . . . . . . . . . . . . . . . . . . . . . . . . . . . . . . . . . . . . — (6) — (6)
At 30 June 2012 . . . . . . . . . . . . . . . . . . . . . . . . . . . . . . . . . . . 4,837 1,559 853 7,249
177

Notes to the consolidated financial statements (continued)
4. Employees (continued)
(e) Movements in the fair value of plan assets during the two years ended 30 June 2012:
UnitedUnited States
Kingdom Ireland and other Total
£ million £ million £ million £ million
Fair value of plan assetsAt 30 June 2010 . . . . . . . . . . . . . . . . . . . . . . . . . . . . . . . . . . 3,819 1,101 447 5,367Exchange differences . . . . . . . . . . . . . . . . . . . . . . . . . . . . . . . — 111 (13) 98Expected return on plan assets . . . . . . . . . . . . . . . . . . . . . . . . 242 70 27 339Actuarial gain/(loss) . . . . . . . . . . . . . . . . . . . . . . . . . . . . . . . . 333 (33) 36 336Contributions by the group . . . . . . . . . . . . . . . . . . . . . . . . . . . 90 61 63 214Employee contributions . . . . . . . . . . . . . . . . . . . . . . . . . . . . . 7 3 1 11Benefits paid . . . . . . . . . . . . . . . . . . . . . . . . . . . . . . . . . . . . . (189) (83) (47) (319)Settlements . . . . . . . . . . . . . . . . . . . . . . . . . . . . . . . . . . . . . . — (10) (1) (11)
At 30 June 2011 . . . . . . . . . . . . . . . . . . . . . . . . . . . . . . . . . . 4,302 1,220 513 6,035Exchange differences . . . . . . . . . . . . . . . . . . . . . . . . . . . . . . . — (132) — (132)Expected return on plan assets . . . . . . . . . . . . . . . . . . . . . . . . 271 68 33 372Actuarial gain/(loss) . . . . . . . . . . . . . . . . . . . . . . . . . . . . . . . . 42 33 (24) 51Contributions by the group . . . . . . . . . . . . . . . . . . . . . . . . . . . 87 46 57 190Employee contributions . . . . . . . . . . . . . . . . . . . . . . . . . . . . . 1 3 1 5Benefits paid . . . . . . . . . . . . . . . . . . . . . . . . . . . . . . . . . . . . . (212) (82) (58) (352)Settlements . . . . . . . . . . . . . . . . . . . . . . . . . . . . . . . . . . . . . . — (4) — (4)
At 30 June 2012 . . . . . . . . . . . . . . . . . . . . . . . . . . . . . . . . . . . 4,491 1,152 522 6,165
(f) History of funded status of plans at 30 June 2012:
2012 2011 2010 2009 2008
£ million £ million £ million £ million £ million
Fair value of plan assets . . . . . . . . . . . . . . . . . . . . . . 6,165 6,035 5,367 4,592 5,165Present value of plan liabilities . . . . . . . . . . . . . . . . . (7,249) (6,859) (6,569) (5,965) (5,559)
Deficit in post employment plans . . . . . . . . . . . . . . . (1,084) (824) (1,202) (1,373) (394)Surplus restriction . . . . . . . . . . . . . . . . . . . . . . . . . . (1) (2) (2) (9) (14)Impact of minimum funding requirement . . . . . . . . . . — (12) (1) (1) —
Post employment benefit liabilities . . . . . . . . . . . . . . (1,085) (838) (1,205) (1,383) (408)
In order to address the deficit on the UK Scheme the group established a Pension Funding Partnership.During the year ended 30 June 2011 whisky inventory was transferred into the partnership. The groupretains control over the partnership which at 30 June 2012 held inventory with a book value of£565 million (2011 – £535 million). The partnership is fully consolidated in the group financialstatements. The UK Scheme acquired a limited interest in the partnership, and as a partner, is entitledto a distribution from the profits of the partnership each year from the date the partnership wasestablished until the year ending 30 June 2024. This profit share was £25 million in the year ended30 June 2012 and is expected to be approximately the same amount for the next 13 years. In 2024 thegroup will be required, dependent upon the funding position of the UK Scheme at that time, to pay anamount expected to be no greater than the deficit at that time, up to a maximum of £430 million in
178

Notes to the consolidated financial statements (continued)
4. Employees (continued)
cash, to the UK Scheme to buy out the UK Scheme’s interest in the partnership. Under IAS 19 –Employee benefits the interest in the partnership does not represent a plan asset for group reportingpurposes and therefore the UK Scheme’s deficit position presented in these financial statements doesnot reflect the UK Scheme’s interest in the partnership. Accordingly, distributions from the partnershipto the UK Scheme are reflected in the consolidated group financial statements on a cash basis asdistributions are paid. The group has also agreed to make conditional contributions into escrow of upto £338 million if an equivalent reduction in the deficit is not achieved over the 10 year term of thefunding plan. The escrow account would be payable to the UK Scheme after the triennial fundingtrustee valuations. The triennial valuation as at 31 March 2012 is in progress and may result in thepayment of up to £127 million in three equal annual instalments, into escrow. In addition to the deficitfunding, Diageo continues to make a cash contribution in respect of current service costs based on theUK Scheme trustee’s valuation. This contribution is expected to be £45 million to the UK Scheme forthe year ending 30 June 2013.
The group has also agreed a deficit funding arrangement with the trustees of the Irish Schemeunder which it contributes to the Irish Scheme A21 million (£17 million) per annum until the yearending 30 June 2029. The agreement also provides for additional cash contributions into escrow of upto A188 million (£152 million) if an equivalent reduction in the deficit is not achieved over the 18 yearperiod. As part of this funding plan, Diageo has granted to the Irish Scheme a contingent assetcomprising mortgages over certain land and buildings and fixed and floating charges over certainreceivables of the group up to a value of A200 million (£161 million). In addition to the deficit fundingthe group expects to make cash contributions of A29 million (£23 million) to the Irish Scheme inthe year ending 30 June 2013.
The group also expects to make cash contributions of £90 million to all other post employmentschemes in the year ending 30 June 2013.
(g) History of experience gains and losses:
2012 2011 2010 2009 2008
£ million £ million £ million £ million £ million
Actual return less expected return on postemployment plan assets . . . . . . . . . . . . . . . . . . . . . 51 336 435 (946) (236)
Experience gains/(losses) arising on the plan liabilities 6 (74) 229 60 (54)Changes in assumptions underlying the present value
of the plan liabilities . . . . . . . . . . . . . . . . . . . . . . . (564) 20 (664) (127) 272
Actuarial (loss)/gain recognisable in the reconciliationof the assets and liabilities . . . . . . . . . . . . . . . . . . (507) 282 — (1,013) (18)
(h) Changes in the assumptions used for determining post employment costs and liabilities may have amaterial impact on the consolidated income statement and balance sheet. For the significantassumptions, the following sensitivity analyses give an estimate of the potential impacts on the
179

Notes to the consolidated financial statements (continued)
4. Employees (continued)
consolidated income statement for the year ended 30 June 2012 and on the consolidated balancesheet as at 30 June 2012:
Estimated impact on consolidated income statement
Other ProfitOperating finance before Profit for
profit charges taxation Taxation the year
£ million £ million £ million £ million £ million
2012Effect of 0.5% increase in discount rate:Approximate decrease in annual post employment cost . . 8 (8) — — —Effect of 1% increase in expected rates of return on plan
assets:Approximate decrease in annual post employment cost . . — 58 58 (14) 44Effect of one year increase in life expectancy:Approximate increase in annual post employment cost . . (2) (11) (13) 3 (10)Effect of 0.5% decrease in inflation:Approximate decrease in annual post employment cost . . 5 18 23 (5) 18Effect of 1% increase in medical inflation:Approximate increase in annual post employment cost . . (1) (1) (2) 1 (1)Effect of 1% decrease in medical inflation:Approximate decrease in annual post employment cost . . 1 1 2 (1) 1
Estimated impact on consolidatedbalance sheet
Net postemployment Net
benefit deferred Netliabilities tax assets assets
£ million £ million £ million
2012Effect of 0.5% increase in discount rate:Approximate decrease in post employment deficit . . . . . . . . . . . . . . . 516 (121) 395Effect of one year increase in life expectancy:Approximate increase in post employment deficit . . . . . . . . . . . . . . . . (238) 57 (181)Effect of 0.5% decrease in inflation:Approximate decrease in post employment deficit . . . . . . . . . . . . . . . 394 (89) 305Effect of 1% increase in medical inflation:Approximate increase in post employment deficit . . . . . . . . . . . . . . . . (23) 8 (15)Effect of 1% decrease in medical inflation:Approximate decrease in post employment deficit . . . . . . . . . . . . . . . 21 (8) 13
(i) Information on transactions between the group and its pension plans is given in note 32.
180

Notes to the consolidated financial statements (continued)
5. Exceptional items
IAS 1 (Revised) – Presentation of financial statements requires material items of income and expense tobe disclosed separately. Exceptional items are items which, in management’s judgement need to bedisclosed by virtue of their size or incidence in order for the user to obtain a proper understanding ofthe financial information.
In the three years ended 30 June 2012, the following exceptional items were recorded:
2012 2011 2010
£ million £ million £ million
Items included in operating profitRestructuringOperating model review(a) . . . . . . . . . . . . . . . . . . . . . . . . . . . . . . . . . . (69) (77) —Restructuring of Global Supply operations(b) . . . . . . . . . . . . . . . . . . . . . (16) (24) (93)Restructuring of Irish brewing operations(c) . . . . . . . . . . . . . . . . . . . . . (11) (10) (12)Global restructuring programme(d) . . . . . . . . . . . . . . . . . . . . . . . . . . . . — — (85)Restructuring of US wine operations(e) . . . . . . . . . . . . . . . . . . . . . . . . . — — 48OtherPension changes – past service credits(f) . . . . . . . . . . . . . . . . . . . . . . . . 115 — —Brand impairment(g) . . . . . . . . . . . . . . . . . . . . . . . . . . . . . . . . . . . . . . (59) (39) (35)Duty settlements(h) . . . . . . . . . . . . . . . . . . . . . . . . . . . . . . . . . . . . . . . — (127) —SEC settlement(i) . . . . . . . . . . . . . . . . . . . . . . . . . . . . . . . . . . . . . . . . . — (12) —
(40) (289) (177)
Sale of businessesStep acquisition of Quanxing and Shuijingfang(j) . . . . . . . . . . . . . . . . . . 124 — —Tanzania Breweries Limited(k) . . . . . . . . . . . . . . . . . . . . . . . . . . . . . . . 23 — —Wine operations(e) . . . . . . . . . . . . . . . . . . . . . . . . . . . . . . . . . . . . . . . . — (12) (26)Joint venture in India . . . . . . . . . . . . . . . . . . . . . . . . . . . . . . . . . . . . . . — (2) —Step acquisition of Nuvo(l) . . . . . . . . . . . . . . . . . . . . . . . . . . . . . . . . . . — — 11
147 (14) (15)
Exceptional items before taxation . . . . . . . . . . . . . . . . . . . . . . . . . . . . . 107 (303) (192)Items included in taxationTax on exceptional operating items . . . . . . . . . . . . . . . . . . . . . . . . . . . . 19 51 39Tax on sale of businesses . . . . . . . . . . . . . . . . . . . . . . . . . . . . . . . . . . . — 3 10Loss of future tax amortisation(m) . . . . . . . . . . . . . . . . . . . . . . . . . . . . (524) — —Settlements with tax authorities (n) . . . . . . . . . . . . . . . . . . . . . . . . . . . . — 66 —
(505) 120 49
Exceptional items in continuing operations . . . . . . . . . . . . . . . . . . . . . . (398) (183) (143)Discontinued operations net of taxation (note 9) . . . . . . . . . . . . . . . . . . (11) — (19)
Total exceptional items . . . . . . . . . . . . . . . . . . . . . . . . . . . . . . . . . . . . . (409) (183) (162)
(a) In the year ended 30 June 2011 the group reviewed its operating model across its businesses andcommenced a restructuring programme. The main objective of the programme was to improve theeffectiveness and productivity of its operations and to deploy resources closer to the market and inthose geographical regions where the potential for growth is greatest. This review resulted in changes tothe group’s regional structure and the way it organises its central functions. £69 million (2011 –
181

Notes to the consolidated financial statements (continued)
5. Exceptional items (continued)
£77 million) was incurred in the year ended 30 June 2012 principally in respect of staff redundancies,early termination of contracts and lease costs primarily in the United Kingdom, Ireland and the UnitedStates.
(b) In the year ended 30 June 2010 the group announced a number of initiatives to consolidate andstreamline the Global Supply spirits operations in the United Kingdom and North America in order tocreate greater operating efficiencies.
A restructuring of the group’s supply operations in Scotland was announced in the year ended30 June 2010. This included the consolidation of distilling, packaging and warehousing activities intofewer sites and resulted in the closure of a distillery, two cooperages and a warehouse. The packagingplant at Kilmarnock closed in 2012. New investment has been concentrated in the production sites inLeven in Fife and in Shieldhall near Glasgow. £8 million (2011 – £11 million; 2010 – £81 million) wasincurred in the year ended 30 June 2012 primarily in respect of redundancies, additional depreciationand site decommissioning costs.
In the year ended 30 June 2010, the group also announced the closure of the Dorval bottling plantin Quebec, Canada and the restructuring of the Daventry distribution centre and in May 2011 theclosure of the Menlo Park bottling plant in California and the specialty product building at the Relayplant in Maryland. The net costs of closing the facilities in the year ended 30 June 2012 was £8 million(2011 – £13 million; 2010 – £12 million).
(c) In the year ended 30 June 2008 Diageo announced the centralisation of the group’s brewingactivities in Ireland at one site. According to plans finalised in the year ended 30 June 2012, this willresult in the closure of the breweries and associated activities at Dundalk and Kilkenny in calendar2013. The exceptional charge for the three years ended 30 June 2012 was principally in respect ofaccelerated depreciation.
(d) In February 2009 the group announced a global restructuring programme which was designed toensure improved routes to market, stronger brand positions and enhanced financial strength. Theprogramme affected all operating segments including Corporate. The majority of the costs were inrespect of a reduction in the number of employees and were spread over the two years ended 30 June2010.
(e) In the year ended 30 June 2010, the group carried out a restructuring of its US wine operationswhich resulted in a restructuring charge of £41 million in respect of a reduction in the number ofemployees, early contract terminations and inventory impairment. The group also completed a sale andleaseback transaction of certain land and facilities located in the Napa Valley, California. The lease ofland was accounted for as an operating lease and resulted in a gain of £89 million which was accountedfor as an exceptional property profit.
In addition, as part of the restructuring of the group’s wine operations, it was announced inthe year ended 30 June 2010 that a number of non-strategic wine businesses in the United States andthe Barton & Guestier wine exporter business in France were to be sold. The loss on sale of thesebusinesses in the year ended 30 June 2011 was £10 million (2010 – £26 million).
In the year ended 30 June 2011 the group also disposed of the Gilbeys wine distribution andwholesale drinks business in Ireland. The loss on sale of the business was £2 million.
182

Notes to the consolidated financial statements (continued)
5. Exceptional items (continued)
(f) In July 2010 the UK government announced that the inflation index to be used to derive statutoryincreases could be changed from the Retail Prices Index (RPI) to the Consumer Prices Index (CPI). Asthe group had a pre existing constructive obligation under the UK Diageo Pension Scheme, and achange from RPI to CPI was notified to the members during the year, a past service credit of£86 million arose and has been accounted for as a change in benefits and recognised as an exceptionalcredit to operating costs in the income statement. Deferred members who have guaranteed RPIincreases will still have their deferred benefits linked to RPI. Pensions in payment are unaffected.
For the Guinness Ireland Group Pension Scheme a decision was made that there would be noincrease awarded to pensions in payment for the calendar year 2012 and a review will be carried out ofany future pension increases. This decision was notified to members during the year and resulted in apast service credit of £29 million which has been accounted for as an exceptional credit to operatingcosts in the income statement.
(g) In the year ended 30 June 2012 an impairment loss of £59 million was charged to other operatingexpenses in respect of the Cacique brand. The principal market for Cacique is Spain where theeconomy continues to suffer a significant downturn. The forecast and long term growth assumptions inthe Spanish market for Cacique were reduced due to a fall in demand which has resulted in animpairment of the brand value.
In the year ended 30 June 2011 and 2010 an impairment loss of £39 million and £35 million,respectively, was charged to other operating expenses in respect of the Ursus brand, resulting in a fullimpairment of the brand value.
(h) In the year ended 30 June 2011, Diageo Turkey settled its dispute with the Turkish customsauthorities regarding duty payable on beverage alcohol products sold in the domestic channel in Turkeybetween 2001 and 2009. The charge incurred with respect to this settlement (including legal fees andother associated costs) was £92 million which was paid during the year ended 30 June 2011. Inaddition, in June 2011 Diageo settled a dispute with the Thai customs authorities in respect of theprice of imported goods between 2002 and 2005. Diageo paid THB 1.8 billion (£35 million) includinglegal fees in the year ended 30 June 2011. Legal fees and other associated costs in prior years inrespect of these cases were written off to other external charges when incurred. Both charges representa full and final settlement of these disputes.
(i) In the year ended 30 June 2011 Diageo reached a settlement with the Securities and ExchangeCommission (SEC) in the United States which resulted in a charge of $19 million (£12 million) toexceptional items, including legal fees of $2 million. The settlement was agreed with the SEC in July2011 and was in respect of various regulatory and control matters, including the SEC enquiries inrespect of activities in Korea, India and Thailand.
(j) On 14 July 2011, Diageo acquired an additional 4% equity stake in Sichuan Chengdu QuanxingGroup Company Ltd. (Quanxing) from Chengdu Yingsheng Investment Holding Co., Ltd. Theconsideration for the additional 4% equity stake was CNY 140 million (£14 million). The acquisition ofthe 4% equity stake brought Diageo’s shareholding in Quanxing to 53%. Quanxing is a holdingcompany controlling a 39.7% equity stake in Sichuan Shuijingfang Co., Ltd. (Shuijingfang), a superpremium Chinese white spirits company listed on the Shanghai Stock Exchange which following theappointment of additional directors in June 2012 became a subsidiary of Diageo. Quanxing wasaccounted for as an associate up to 14 July 2011 but following the acquisition of the additional 4%equity stake it became a subsidiary with a 47% non-controlling interest. Shuijingfang was accounted for
183

Notes to the consolidated financial statements (continued)
5. Exceptional items (continued)
as an associate throughout the year ended 30 June 2012 but following the change of control became asubsidiary on 29 June 2012 with a 79% non-controlling interest. As a result of Quanxing andShuijingfang becoming subsidiaries of the group, a gain of £124 million has arisen on the differencebetween the book value of the equity owned prior to the transactions and their market value on thecompletion dates which has been disclosed as a sale of business. The gain includes £30 million ofcumulative exchange gains recycled from other comprehensive income less a provision of £16 millionfor onerous contracts arising on the acquisition.
(k) In January 2012 Diageo sold its 20% equity interest in Tanzania Breweries Limited (TBL) for aconsideration of £47 million. The investment in TBL was disclosed as an asset for sale and the gainbefore tax arising on the disposal was £23 million after transaction costs.
(l) In the year ended 30 June 2010 Diageo acquired an additional equity stake in the London Group,the owner of the Nuvo brand, an ultra-premium vodka-based sparkling liqueur, taking its equityownership from 42.5% to 71.25%. The London Group was formerly accounted for as an associate andfollowing the acquisition of further shares it became a subsidiary. The difference between the marketvalue of the equity owned prior to the acquisition and the book value of the associate was recognisedin the consolidated income statement, resulting in a gain of £11 million which was included in sale ofbusinesses.
(m) The group benefits from the availability of tax amortisation on many of its principal brands andother intangible assets. In the year ended 30 June 2012 negotiations with tax authorities wereconcluded, the outcome of which was a favourable change in taxation basis that replaces the benefit offuture amortisation resulting in a write off the related deferred tax assets of £524 million.
(n) In the year ended 30 June 2011 a number of legacy tax issues were settled in respect of historicrestructuring.
184

Notes to the consolidated financial statements (continued)
6. Interest and other finance income and charges
2012 2011 2010
£ million £ million £ million
(a) Net interestInterest receivable . . . . . . . . . . . . . . . . . . . . . . . . . . . . . . . . . . . . . . . . 107 183 188Fair value gain on interest rate instruments . . . . . . . . . . . . . . . . . . . . . . 155 95 281
Total interest receivable . . . . . . . . . . . . . . . . . . . . . . . . . . . . . . . . . . . . 262 278 469
Interest payable on bank loans and overdrafts . . . . . . . . . . . . . . . . . . . . (22) (21) (20)Interest payable on finance leases . . . . . . . . . . . . . . . . . . . . . . . . . . . . . (12) (5) (1)Interest payable on all other borrowings . . . . . . . . . . . . . . . . . . . . . . . . (459) (514) (548)Fair value loss on interest rate instruments . . . . . . . . . . . . . . . . . . . . . . (151) (107) (275)
Total interest payable . . . . . . . . . . . . . . . . . . . . . . . . . . . . . . . . . . . . . . (644) (647) (844)
Net interest . . . . . . . . . . . . . . . . . . . . . . . . . . . . . . . . . . . . . . . . . . . . . (382) (369) (375)
(b) Net other finance income and chargesNet finance income in respect of post employment plans . . . . . . . . . . . . 7 — —Other finance income . . . . . . . . . . . . . . . . . . . . . . . . . . . . . . . . . . . . . . 1 — 4
Total other finance income . . . . . . . . . . . . . . . . . . . . . . . . . . . . . . . . . . 8 — 4
Net finance charge in respect of post employment plans . . . . . . . . . . . . . — (3) (47)Unwinding of discounts . . . . . . . . . . . . . . . . . . . . . . . . . . . . . . . . . . . . (17) (16) (18)Hyperinflation adjustment . . . . . . . . . . . . . . . . . . . . . . . . . . . . . . . . . . . (3) (9) (16)Other finance charges . . . . . . . . . . . . . . . . . . . . . . . . . . . . . . . . . . . . . . (3) — —Net exchange movements on short term intercompany loans . . . . . . . . . . — — (10)
Total other finance charges . . . . . . . . . . . . . . . . . . . . . . . . . . . . . . . . . . (23) (28) (91)
Net other finance charges . . . . . . . . . . . . . . . . . . . . . . . . . . . . . . . . . . . (15) (28) (87)
Interest on post employment plan liabilities . . . . . . . . . . . . . . . . . . . . . . (365) (342) (360)Expected return on post employment plan assets . . . . . . . . . . . . . . . . . . 372 339 313
Net finance income/(charges) in respect of post employment plans . . . . . 7 (3) (47)
The amount of borrowing costs capitalised in the year ended 30 June 2012 was £5 million (2011 –£4 million; 2010 – £5 million).
From December 2009 Venezuela was classified as a hyperinflationary economy. Hyperinflationaryaccounting requires the restatement of the subsidiary undertaking’s income statement to currentpurchasing power. The impact of applying hyperinflationary accounting to the group’s operations inVenezuela resulted in a charge of £3 million (2011 – £9 million; 2010 – £16 million) to other financecharges. The index used to calculate the hyperinflationary adjustment was the Indice Nacionalde Precios al Consumidor which changed from 235.3 to 285.5 in the year ended 30 June 2012 (2011 –from 190.4 to 235.3; 2010 – from 145.0 to 190.4), an increase of 21% (2011 – 24%; 2010 – 31%).
7. Associates
The group’s share of profit after tax from associates was £213 million (2011 – £176 million; 2010 –£142 million).
185

Notes to the consolidated financial statements (continued)
7. Associates (continued)
The group’s 34% share of operating profit and of profit for the year of Moet Hennessy was£317 million and £205 million, respectively (2011 – £273 million and £179 million, respectively; 2010 –£229 million and £134 million, respectively).
In the year ended 30 June 2012, the group received dividends from its associates of £166 million(2011 – £138 million; 2010 – £111 million), of which £158 million was received from Moet Hennessy(2011 – £131 million; 2010 – £98 million). These dividends included receipts of £62 million (2011 –£51 million; 2010 – £31 million) from Moet Hennessy in respect of amounts payable to tax authorities.
Information on transactions between the group and its associates is given in note 32. Summarisedfinancial information for the group’s investments in associates is presented below:
(a) Moet Hennessy Moet Hennessy prepares its financial statements under IFRS in euros to31 December each year. Summary information for Moet Hennessy for the three years ended 30 June2012 after adjustment to align Moet Hennessy’s accounting policies and accounting periods with thoseof the group, translated at £1 = A1.18 (2011 – £1 = A1.16; 2010 – £1 = A1.13), is set out below:
2012 2011 2010
E million £ million E million £ million E million £ million
Sales . . . . . . . . . . . . . . . . . . . . . . . . . . . . . 3,797 3,218 3,353 2,891 2,935 2,597Profit for the year . . . . . . . . . . . . . . . . . . . 711 603 610 526 446 395
Profit for the year is after deducting amounts in respect of non-controlling interests.
(b) Other associates For all of the group’s investments in associates other than Moet Hennessy,summarised financial information, aggregating 100% of the sales and results of each associate, ispresented below:
2012 2011 2010
£ million £ million £ million
Sales . . . . . . . . . . . . . . . . . . . . . . . . . . . . . . . . . . . . . . . . . . . . . . . . . . 1,242 1,228 1,202Profit for the year . . . . . . . . . . . . . . . . . . . . . . . . . . . . . . . . . . . . . . . . . 49 32 79
186

Notes to the consolidated financial statements (continued)
8. Taxation
(a) Analysis of taxation charge in the year
2012 2011 2010
£ million £ million £ million
Current taxCurrent year . . . . . . . . . . . . . . . . . . . . . . . . . . . . . . . . . . . . . . . . . . . . . 312 450 354Adjustments in respect of prior years . . . . . . . . . . . . . . . . . . . . . . . . . . . 51 (5) (80)
363 445 274
Deferred taxOrigination and reversal of temporary differences . . . . . . . . . . . . . . . . . . 126 (13) 176Benefit of previously unrecognised tax losses . . . . . . . . . . . . . . . . . . . . . . — — (3)Changes in tax rates . . . . . . . . . . . . . . . . . . . . . . . . . . . . . . . . . . . . . . . 15 9 1Adjustments in respect of prior years (note 8(c)) . . . . . . . . . . . . . . . . . . . 534 (98) 29
675 (102) 203
Taxation on profit from continuing operations . . . . . . . . . . . . . . . . . . . . 1,038 343 477
Adjustments in respect of prior years for current tax comprise a UK tax charge of £13 million (2011 –£2 million charge; 2010 – £47 million credit) and an overseas tax charge of £38 million (2011 –£7 million credit; 2010 – £33 million credit).
2012 2011 2010
£ million £ million £ million
Current taxUnited Kingdom . . . . . . . . . . . . . . . . . . . . . . . . . . . . . . . . . . . . . . . . . . 31 94 (57)Overseas . . . . . . . . . . . . . . . . . . . . . . . . . . . . . . . . . . . . . . . . . . . . . . . . 332 351 331
363 445 274
Deferred taxUnited Kingdom . . . . . . . . . . . . . . . . . . . . . . . . . . . . . . . . . . . . . . . . . . 16 (141) 29Overseas . . . . . . . . . . . . . . . . . . . . . . . . . . . . . . . . . . . . . . . . . . . . . . . . 659 39 174
675 (102) 203
Taxation on profit from continuing operations . . . . . . . . . . . . . . . . . . . . 1,038 343 477
(b) Exceptional tax charges/(credits)
2012 2011 2010
£ million £ million £ million
Tax on exceptional operating items . . . . . . . . . . . . . . . . . . . . . . . . . . . . . (19) (51) (39)Tax on sale of businesses . . . . . . . . . . . . . . . . . . . . . . . . . . . . . . . . . . . . — (3) (10)Loss of future tax amortisation . . . . . . . . . . . . . . . . . . . . . . . . . . . . . . . . 524 — —Settlements agreed with tax authorities . . . . . . . . . . . . . . . . . . . . . . . . . . — (66) —
505 (120) (49)
187

Notes to the consolidated financial statements (continued)
8. Taxation (continued)
In the year ended 30 June 2012 a settlement was agreed with tax authorities resulting in a deferred taxasset write off of £524 million. See note 8(c) for further information. In the year ended 30 June 2011the tax settlement comprised a current tax credit of £66 million.
(c) Factors affecting tax charge for the year
2012 2011 2010
£ million £ million £ million
Profit from continuing operations before taxation . . . . . . . . . . . . . . . . . . 3,121 2,360 2,239
Notional charge at UK corporation tax rate of 25.5% (2011 – 27.5%;2010 – 28%) . . . . . . . . . . . . . . . . . . . . . . . . . . . . . . . . . . . . . . . . . . . 796 649 627
Elimination of notional tax on share of associates’ profits after tax . . . . . . (52) (48) (38)Differences in effective overseas tax rates . . . . . . . . . . . . . . . . . . . . . . . . (13) (16) (3)Items not chargeable . . . . . . . . . . . . . . . . . . . . . . . . . . . . . . . . . . . . . . . (393) (197) (172)Items not deductible . . . . . . . . . . . . . . . . . . . . . . . . . . . . . . . . . . . . . . . 100 164 116Benefit of previously unrecognised tax losses . . . . . . . . . . . . . . . . . . . . . . — — (3)Benefit of previously unrecognised other deferred tax assets . . . . . . . . . . — (115) —Changes in tax rates . . . . . . . . . . . . . . . . . . . . . . . . . . . . . . . . . . . . . . . 15 9 1Adjustments in respect of prior years . . . . . . . . . . . . . . . . . . . . . . . . . . . 585 (103) (51)
Tax charge for the year . . . . . . . . . . . . . . . . . . . . . . . . . . . . . . . . . . . . . 1,038 343 477
The group benefits from the availability of tax amortisation on many of its principal brands and otherintangible assets. During the year ended 30 June 2012 negotiations with tax authorities were concluded,the outcome of which was a favourable change in taxation basis of certain overseas profits that replacesthe benefit of future amortisation. This resulted in a write off of deferred tax assets of £524 million. Inthe year ended 30 June 2011 a combination of strong performance and positive forward outlook led tothe recognition of an increase in the deferred tax assets of £115 million in respect of futureamortisation.
(d) Factors that may affect future tax charges As a group involved in worldwide operations, Diageois subject to several factors which may affect future tax charges, principally the levels and mix ofprofitability in different jurisdictions, transfer pricing policies, tax rates imposed and settlements oragreements with tax authorities.
(e) Corporate tax payable The current corporate tax liability of £317 million (2011 – £381 million)represents the amount of taxes payable in respect of current and prior years that exceed paymentsmade, and includes any interest and penalties payable thereon included in the corporation tax charge.
(f) Material tax liabilities As the group operates throughout the world, it faces potential transferpricing issues in many jurisdictions relating to goods, services and financing. Acquisitions, disposals andrestructuring activities may also give rise to potential tax exposures. The group has a number of taxaudits ongoing worldwide but does not currently expect material additional tax exposures to arise,above the amounts provided, as and when audits are concluded.
188

Notes to the consolidated financial statements (continued)
9. Discontinued operations
Discontinued operations in the year ended 30 June 2012 comprise a charge of £11 million (£16 millionless deferred tax of £5 million) in respect of the discounted value of anticipated future payments toadditional thalidomide claimants (2011 – £nil; 2010 – £19 million).
10. Earnings per share
2012 2011 2010
£ million £ million £ million
Profit attributable to equity shareholdersContinuing operations . . . . . . . . . . . . . . . . . . . . . . . . . . . . . . . . . . . . . . 1,953 1,900 1,648Discontinued operations . . . . . . . . . . . . . . . . . . . . . . . . . . . . . . . . . . . . (11) — (19)
1,942 1,900 1,629
2012 2011 2010
million million million
Weighted average number of sharesShares in issue excluding own shares held . . . . . . . . . . . . . . . . . . . . . . . . 2,495 2,493 2,486Dilutive potential ordinary shares . . . . . . . . . . . . . . . . . . . . . . . . . . . . . . 14 8 5
2,509 2,501 2,491
Pence per shareContinuing operations– basic earnings . . . . . . . . . . . . . . . . . . . . . . . . . . . . . . . . . . . . . . . . . . . 78.2p 76.2p 66.3p– diluted earnings . . . . . . . . . . . . . . . . . . . . . . . . . . . . . . . . . . . . . . . . . 77.8p 76.0p 66.2pContinuing and discontinued operations– basic earnings . . . . . . . . . . . . . . . . . . . . . . . . . . . . . . . . . . . . . . . . . . . 77.8p 76.2p 65.5p– diluted earnings . . . . . . . . . . . . . . . . . . . . . . . . . . . . . . . . . . . . . . . . . 77.4p 76.0p 65.4p
189
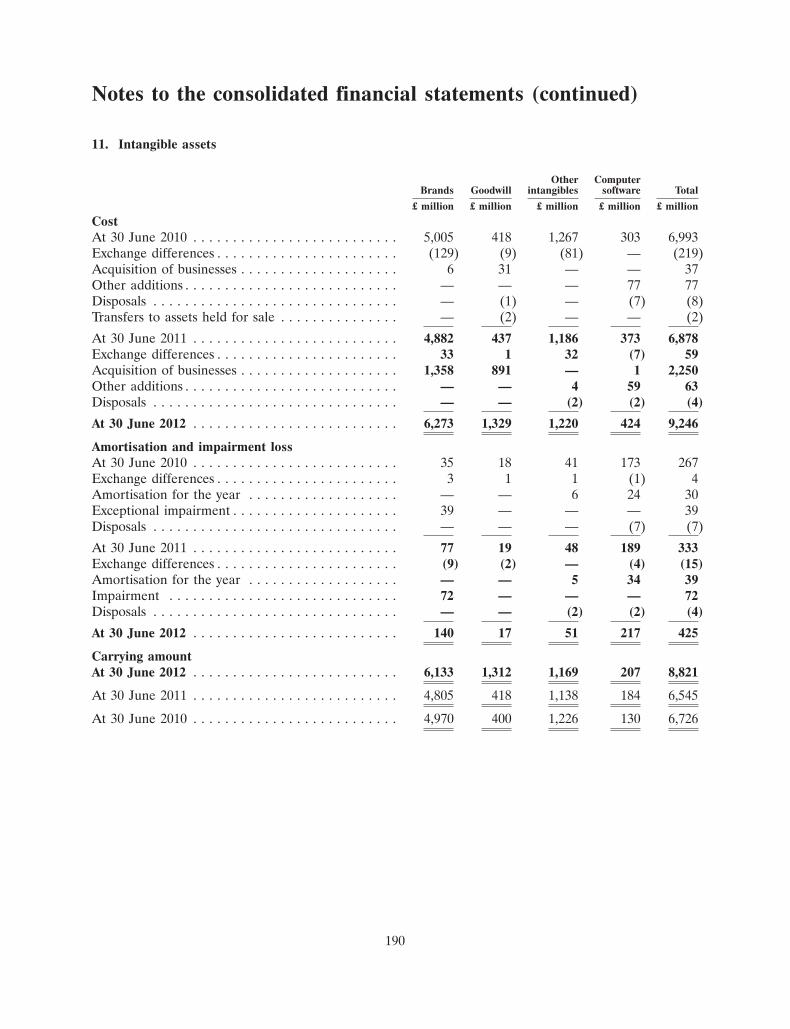
Notes to the consolidated financial statements (continued)
11. Intangible assets
Other ComputerBrands Goodwill intangibles software Total
£ million £ million £ million £ million £ million
CostAt 30 June 2010 . . . . . . . . . . . . . . . . . . . . . . . . . . 5,005 418 1,267 303 6,993Exchange differences . . . . . . . . . . . . . . . . . . . . . . . (129) (9) (81) — (219)Acquisition of businesses . . . . . . . . . . . . . . . . . . . . 6 31 — — 37Other additions . . . . . . . . . . . . . . . . . . . . . . . . . . . — — — 77 77Disposals . . . . . . . . . . . . . . . . . . . . . . . . . . . . . . . — (1) — (7) (8)Transfers to assets held for sale . . . . . . . . . . . . . . . — (2) — — (2)
At 30 June 2011 . . . . . . . . . . . . . . . . . . . . . . . . . . 4,882 437 1,186 373 6,878Exchange differences . . . . . . . . . . . . . . . . . . . . . . . 33 1 32 (7) 59Acquisition of businesses . . . . . . . . . . . . . . . . . . . . 1,358 891 — 1 2,250Other additions . . . . . . . . . . . . . . . . . . . . . . . . . . . — — 4 59 63Disposals . . . . . . . . . . . . . . . . . . . . . . . . . . . . . . . — — (2) (2) (4)
At 30 June 2012 . . . . . . . . . . . . . . . . . . . . . . . . . . 6,273 1,329 1,220 424 9,246
Amortisation and impairment lossAt 30 June 2010 . . . . . . . . . . . . . . . . . . . . . . . . . . 35 18 41 173 267Exchange differences . . . . . . . . . . . . . . . . . . . . . . . 3 1 1 (1) 4Amortisation for the year . . . . . . . . . . . . . . . . . . . — — 6 24 30Exceptional impairment . . . . . . . . . . . . . . . . . . . . . 39 — — — 39Disposals . . . . . . . . . . . . . . . . . . . . . . . . . . . . . . . — — — (7) (7)
At 30 June 2011 . . . . . . . . . . . . . . . . . . . . . . . . . . 77 19 48 189 333Exchange differences . . . . . . . . . . . . . . . . . . . . . . . (9) (2) — (4) (15)Amortisation for the year . . . . . . . . . . . . . . . . . . . — — 5 34 39Impairment . . . . . . . . . . . . . . . . . . . . . . . . . . . . . 72 — — — 72Disposals . . . . . . . . . . . . . . . . . . . . . . . . . . . . . . . — — (2) (2) (4)
At 30 June 2012 . . . . . . . . . . . . . . . . . . . . . . . . . . 140 17 51 217 425
Carrying amountAt 30 June 2012 . . . . . . . . . . . . . . . . . . . . . . . . . . 6,133 1,312 1,169 207 8,821
At 30 June 2011 . . . . . . . . . . . . . . . . . . . . . . . . . . 4,805 418 1,138 184 6,545
At 30 June 2010 . . . . . . . . . . . . . . . . . . . . . . . . . . 4,970 400 1,226 130 6,726
190

Notes to the consolidated financial statements (continued)
11. Intangible assets (continued)
(a) Brands are stated at fair value on acquisition. At 30 June 2012, the principal acquired brands, allof which are regarded as having indefinite useful economic lives, are as follows:
Principal markets 2012 2011
£ million £ million
Carrying amount of acquired brandsCrown Royal whisky . . . . . . . . . . . . . . . . . . . . . . . . . . . . . . . . . . United States 932 909Captain Morgan . . . . . . . . . . . . . . . . . . . . . . . . . . . . . . . . . . . . . Global 765 746Johnnie Walker whisky . . . . . . . . . . . . . . . . . . . . . . . . . . . . . . . . Global 625 625Yeni raki . . . . . . . . . . . . . . . . . . . . . . . . . . . . . . . . . . . . . . . . . . Turkey 598 —Shui Jing Fang Chinese white spirit . . . . . . . . . . . . . . . . . . . . . . . Greater China 538 —Smirnoff vodka . . . . . . . . . . . . . . . . . . . . . . . . . . . . . . . . . . . . . Global 525 512Windsor Premier whisky . . . . . . . . . . . . . . . . . . . . . . . . . . . . . . . Korea 484 506Bell’s whisky . . . . . . . . . . . . . . . . . . . . . . . . . . . . . . . . . . . . . . . South Africa 179 179Bushmills whiskey . . . . . . . . . . . . . . . . . . . . . . . . . . . . . . . . . . . United States 144 144Seagram’s 7 Crown whiskey . . . . . . . . . . . . . . . . . . . . . . . . . . . . United States 142 139Zacapa rum . . . . . . . . . . . . . . . . . . . . . . . . . . . . . . . . . . . . . . . . Global 122 —Seagram’s VO whisky . . . . . . . . . . . . . . . . . . . . . . . . . . . . . . . . . United States 121 118Gordon’s gin . . . . . . . . . . . . . . . . . . . . . . . . . . . . . . . . . . . . . . . Great Britain 119 119Old Parr whisky . . . . . . . . . . . . . . . . . . . . . . . . . . . . . . . . . . . . . Venezuela 113 111Cacique rum . . . . . . . . . . . . . . . . . . . . . . . . . . . . . . . . . . . . . . . Spain 112 190Bundaberg rum . . . . . . . . . . . . . . . . . . . . . . . . . . . . . . . . . . . . . Australia 88 90Tanqueray gin . . . . . . . . . . . . . . . . . . . . . . . . . . . . . . . . . . . . . . United States 76 74Romana Sambuca liqueur . . . . . . . . . . . . . . . . . . . . . . . . . . . . . . United States 54 53White Horse whisky . . . . . . . . . . . . . . . . . . . . . . . . . . . . . . . . . . Russia 53 53Meta beer . . . . . . . . . . . . . . . . . . . . . . . . . . . . . . . . . . . . . . . . . Ethiopia 52 —Other brands . . . . . . . . . . . . . . . . . . . . . . . . . . . . . . . . . . . . . . . 291 237
6,133 4,805
Capitalised brands are regarded as having indefinite useful economic lives and are therefore notamortised. These brands are protected by trademarks, which are renewable indefinitely, in all of themajor markets where they are sold. There are not believed to be any legal, regulatory or contractualprovisions that limit the useful lives of these brands. The nature of the premium drinks industry is thatobsolescence is not a common issue, with indefinite brand lives being commonplace, and Diageo has anumber of brands that were originally created more than 100 years ago. Accordingly, the directorsbelieve that it is appropriate that the brands are treated as having indefinite lives for accountingpurposes.
191

Notes to the consolidated financial statements (continued)
11. Intangible assets (continued)
(b) For the purposes of impairment testing, goodwill has been attributed to cash-generating units asfollows:
20112012 (restated)
£ million £ million
North America – United States . . . . . . . . . . . . . . . . . . . . . . . . . . . . . . . . . . . . . . 223 204Europe – Western Europe . . . . . . . . . . . . . . . . . . . . . . . . . . . . . . . . . . . . . . . . . . 163 117
– Turkey . . . . . . . . . . . . . . . . . . . . . . . . . . . . . . . . . . . . . . . . . . . . . . . . 607 — – Russia and Eastern Europe . . . . . . . . . . . . . . . . . . . . . . . . . . . . . . . . . 41 43
Africa – East Africa . . . . . . . . . . . . . . . . . . . . . . . . . . . . . . . . . . . . . . . . . . . . . . 34 32 – Africa Regional Markets . . . . . . . . . . . . . . . . . . . . . . . . . . . . . . . . . . . . 97 3
Asia Pacific – Greater China . . . . . . . . . . . . . . . . . . . . . . . . . . . . . . . . . . . . . . . . 105 —Other cash-generating units . . . . . . . . . . . . . . . . . . . . . . . . . . . . . . . . . . . . . . . . . 42 19
1,312 418
Comparatives have been restated following a revision of the group’s reporting segments. For anexplanation of the change in regional structure see note 2.
Goodwill has arisen on acquisitions of businesses and distribution rights and includes synergiesarising from cost savings and the opportunity to utilise the group’s distribution network to leveragemarketing of the acquired products and the extension of the group’s portfolio of brands in othermarkets around the world.
The fair values of the net assets (including brands) acquired in the Shuijingfang and Meta businesscombinations in Greater China and Africa Regional Markets, respectively, will be finalised in the yearending 30 June 2013 and as a result the goodwill and its allocation disclosed at 30 June 2012 isprovisional.
(c) Other intangibles comprise principally distribution rights. In the year ended 30 June 2008, Diageoacquired the global distribution rights in perpetuity for Ketel One vodka products, and the directorsbelieve that it is appropriate to treat these rights as having an indefinite life for accounting purposes.The carrying value at 30 June 2012 was £1,146 million (2011 – £1,118 million). All other distributionrights are amortised on a straight-line basis over the length of the distribution arrangements, generallybetween 10 and 20 years, unless there is an indication that the asset may be impaired, in which case, ifnecessary, the asset is written down or the amortisation period is reassessed and changed. Amortisationof other intangible assets is recognised in other operating expenses in the income statement.
(d) Computer software includes £51 million (2011 – £71 million) in respect of projects in the courseof development. Amortisation of computer software is recognised in other operating expenses in theincome statement.
Net book value of computer software includes £9 million (2011 – £nil) in respect of assets heldunder finance leases; depreciation for the year on these assets was £nil (2011 – £ nil).
Impairment testing To ensure that brands, goodwill and other intangibles with indefinite useful livesare not carried at above their recoverable amount, impairment reviews are performed comparing thenet carrying value with the recoverable amount using value in use calculations. For goodwill therecoverable amount is calculated in respect of the cash-generating unit including the attributed
192

Notes to the consolidated financial statements (continued)
11. Intangible assets (continued)
goodwill. These calculations are performed annually, or more frequently if events or circumstancesindicate that the carrying amount may not be recoverable. The value in use calculations are based ondiscounted forecast cash flows and terminal values calculated on the assumption that cash flowscontinue in perpetuity at the long term growth rate of each country or region.
The methodology to determine the discount factors and establish the long term growth ratesapplied in the calculation of the terminal recoverable amount has been revised following a review ofbest practice. Values calculated under the former and the revised methodology are not materiallydifferent.
Cash flows are forecast for each brand, other intangible and cash-generating unit for thefinancial year, which is approved by management and reflects expectations of sales growth, operatingcosts and margin, based on past experience and external sources of information.
The discount rates used are the weighted average cost of capital which reflect the returns ongovernment bonds issued by triple ‘A’ rated countries with a maturity of 10 years, and an equity riskpremium adjusted for specific industry and country risks. Further risk premiums are applied accordingto management’s assessment of the risks in respect of the individual cash flows. The group appliespost-tax discount rates to post-tax cash flows as the valuation calculated using this method closelyapproximates to applying pre-tax discount rates to pre-tax cash flows. The long term growth ratesapplied at the end of the forecast period are the long-term annual inflation rate of the countryobtained from external sources. For goodwill, these assumptions are based on the cash-generating unitor group of units to which the goodwill is attributed. For brands, they are based on a weighted averagetaking into account the country or countries where sales are made.
For some intangible assets, management expects to achieve growth, driven by Diageo’s sales,marketing and distribution expertise, which is significantly in excess of the long term growth rates forthe applicable countries or regions. In these circumstances, the recoverable amount is calculated basedon a five year detailed plan and extended by up to an additional five to ten years using the annualgrowth rate of the real gross domestic product (GDP) of the country or region aggregated with itsinflation rate, adjusted to take into account circumstances specific to the group. In the calculation ofthe terminal recoverable amount, the long-term annual inflation rate of the country is used as thegrowth rate.
193

Notes to the consolidated financial statements (continued)
11. Intangible assets (continued)
The pre-tax discount rates and long term growth rates used for impairment testing are as follows:
Pre-tax Long termdiscount growth
rate rate
% %
North America – United States . . . . . . . . . . . . . . . . . . . . . . . . . . . . . . . . . . . . . . 9 2Europe – Western Europe . . . . . . . . . . . . . . . . . . . . . . . . . . . . . . . . . . . . . . . . . . 12 2
– Great Britain . . . . . . . . . . . . . . . . . . . . . . . . . . . . . . . . . . . . . . . . . . . . 8 2 – Spain . . . . . . . . . . . . . . . . . . . . . . . . . . . . . . . . . . . . . . . . . . . . . . . . . 13 2 – Russia and Eastern Europe . . . . . . . . . . . . . . . . . . . . . . . . . . . . . . . . . 12 5 – Turkey . . . . . . . . . . . . . . . . . . . . . . . . . . . . . . . . . . . . . . . . . . . . . . . . . 17 5
Africa – East Africa . . . . . . . . . . . . . . . . . . . . . . . . . . . . . . . . . . . . . . . . . . . . . . 20 5 – Africa Regional Markets . . . . . . . . . . . . . . . . . . . . . . . . . . . . . . . . . . . . 21 5 – South Africa . . . . . . . . . . . . . . . . . . . . . . . . . . . . . . . . . . . . . . . . . . . . . 13 5
Asia Pacific – South-East Asia . . . . . . . . . . . . . . . . . . . . . . . . . . . . . . . . . . . . . . . 11 3 – Korea . . . . . . . . . . . . . . . . . . . . . . . . . . . . . . . . . . . . . . . . . . . . . . 10 3 – Australia . . . . . . . . . . . . . . . . . . . . . . . . . . . . . . . . . . . . . . . . . . . . 10 3 – Greater China . . . . . . . . . . . . . . . . . . . . . . . . . . . . . . . . . . . . . . . . 10 3
Any impairment writedowns identified are charged to other operating expenses in the incomestatement. Included in the total impairment charge of £72 million in the year ended 30 June 2012, anexceptional impairment charge of £59 million is in respect of the Cacique brand. The principal marketfor Cacique is Spain where the economy continued to suffer a significant downturn. The forecast andlong term growth assumptions in the Spanish market for Cacique were reduced due to a fall in demandwhich has resulted in an impairment of the brand value. The exceptional impairment charge of£39 million in the year ended 30 June 2011 (2010 – £35 million) was in respect of Ursus.
Sensitivity to change in key assumptions Impairment testing is dependent on management’s estimatesand judgements, in particular in relation to the forecasting of future cash flows, the discount ratesapplied to those cash flows and the expected long term growth rates.
The Cacique brand would be impaired in case of an increase in discount rate of 1ppt, a decreasein long term growth rate of 1ppt and a decrease in annual cash flows of 5% by £10 million, £6 millionand £6 million against its current carrying value, respectively. It remains possible that changes inassumptions could arise in excess of those indicated above.
For all intangibles with an indefinite life, other than the Cacique brand, management hasconcluded that no reasonable possible change in the key assumptions on which it has determined therecoverable amounts would cause their carrying values to exceed their recoverable amounts.
194

Notes to the consolidated financial statements (continued)
12. Property, plant and equipment
Fixtures ReturnableLand and Plant and and bottles and Underbuildings equipment fittings crates construction Total
£ million £ million £ million £ million £ million £ million
CostAt 30 June 2010 . . . . . . . . . . . . . . . . . . . 1,060 2,244 202 351 280 4,137Exchange differences . . . . . . . . . . . . . . . . 3 4 (3) — (8) (4)Acquisition of businesses . . . . . . . . . . . . . 10 26 1 5 22 64Other additions . . . . . . . . . . . . . . . . . . . . 19 82 17 47 244 409Disposals . . . . . . . . . . . . . . . . . . . . . . . . . (14) (28) (26) (11) (1) (80)Transfers . . . . . . . . . . . . . . . . . . . . . . . . . 15 205 (7) 10 (223) —
At 30 June 2011 . . . . . . . . . . . . . . . . . . . 1,093 2,533 184 402 314 4,526Exchange differences . . . . . . . . . . . . . . . . (21) (86) (4) (25) (4) (140)Acquisition of businesses . . . . . . . . . . . . . 100 67 3 — 16 186Other additions . . . . . . . . . . . . . . . . . . . . 21 100 10 30 454 615Disposals . . . . . . . . . . . . . . . . . . . . . . . . . (45) (134) (17) (20) (3) (219)Transfers . . . . . . . . . . . . . . . . . . . . . . . . . 75 305 (50) 21 (351) —
At 30 June 2012 . . . . . . . . . . . . . . . . . . . . 1,223 2,785 126 408 426 4,968
DepreciationAt 30 June 2010 . . . . . . . . . . . . . . . . . . . 314 1,078 127 214 — 1,733Exchange differences . . . . . . . . . . . . . . . . 2 17 (2) 4 — 21Depreciation charge for the year . . . . . . . . 37 166 22 31 — 256Exceptional accelerated depreciation . . . . . 4 23 — — — 27Disposals . . . . . . . . . . . . . . . . . . . . . . . . . (11) (27) (22) (3) — (63)Transfers . . . . . . . . . . . . . . . . . . . . . . . . . 13 (13) — — — —
At 30 June 2011 . . . . . . . . . . . . . . . . . . . 359 1,244 125 246 — 1,974Exchange differences . . . . . . . . . . . . . . . . (11) (58) (4) (17) — (90)Depreciation charge for the year . . . . . . . . 36 188 11 36 — 271Exceptional accelerated depreciation . . . . . 8 21 — — — 29Disposals . . . . . . . . . . . . . . . . . . . . . . . . . (43) (114) (17) (14) — (188)Transfers . . . . . . . . . . . . . . . . . . . . . . . . . (3) 33 (31) 1 — —
At 30 June 2012 . . . . . . . . . . . . . . . . . . . . 346 1,314 84 252 — 1,996
Carrying amountAt 30 June 2012 . . . . . . . . . . . . . . . . . . . . 877 1,471 42 156 426 2,972
At 30 June 2011 . . . . . . . . . . . . . . . . . . . 734 1,289 59 156 314 2,552
At 30 June 2010 . . . . . . . . . . . . . . . . . . . 746 1,166 75 137 280 2,404
(a) The net book value of land and buildings comprises freeholds of £780 million (2011 –£664 million), long leaseholds of £47 million (2011 – £25 million) and short leaseholds of £50 million(2011 – £45 million). Depreciation was not charged on £118 million (2011 – £101 million) of land.
195

Notes to the consolidated financial statements (continued)
12. Property, plant and equipment (continued)
(b) Included in the net book value of property, plant and equipment are the following amounts heldunder finance leases:
2012 2011
£ million £ million
Land and buildings . . . . . . . . . . . . . . . . . . . . . . . . . . . . . . . . . . . . . . . . . . . . . . . 33 34Plant and equipment . . . . . . . . . . . . . . . . . . . . . . . . . . . . . . . . . . . . . . . . . . . . . . 92 27Fixtures and fittings . . . . . . . . . . . . . . . . . . . . . . . . . . . . . . . . . . . . . . . . . . . . . . 3 4Assets under construction . . . . . . . . . . . . . . . . . . . . . . . . . . . . . . . . . . . . . . . . . . 95 16
223 81
Depreciation for the year on these assets was £9 million (2011 – £6 million).
(c) Transfers primarily represent assets brought into use during the year.
(d) As at 30 June 2012 the group has received government grants from the United States VirginIslands government of £116 million (2011 – £110 million) which have been netted against the capitalexpenditure incurred on the construction of a new rum distillery in the United States Virgin Islands.
13. Biological assets
£ million
Fair valueAt 30 June 2010 . . . . . . . . . . . . . . . . . . . . . . . . . . . . . . . . . . . . . . . . . . . . . . . . . . . . . . . . . 30Exchange differences . . . . . . . . . . . . . . . . . . . . . . . . . . . . . . . . . . . . . . . . . . . . . . . . . . . . . (2)Harvested grapes transferred to inventories . . . . . . . . . . . . . . . . . . . . . . . . . . . . . . . . . . . . . (27)Transfer from assets held for sale . . . . . . . . . . . . . . . . . . . . . . . . . . . . . . . . . . . . . . . . . . . . 5Changes in fair value . . . . . . . . . . . . . . . . . . . . . . . . . . . . . . . . . . . . . . . . . . . . . . . . . . . . . 27
At 30 June 2011 . . . . . . . . . . . . . . . . . . . . . . . . . . . . . . . . . . . . . . . . . . . . . . . . . . . . . . . . . 33Exchange differences . . . . . . . . . . . . . . . . . . . . . . . . . . . . . . . . . . . . . . . . . . . . . . . . . . . . . 1Harvested grapes transferred to inventories . . . . . . . . . . . . . . . . . . . . . . . . . . . . . . . . . . . . . (27)Changes in fair value . . . . . . . . . . . . . . . . . . . . . . . . . . . . . . . . . . . . . . . . . . . . . . . . . . . . . 27
At 30 June 2012 . . . . . . . . . . . . . . . . . . . . . . . . . . . . . . . . . . . . . . . . . . . . . . . . . . . . . . . . . 34
Biological assets comprise grape vines and grapes on the vine. At 30 June 2012, these assets compriseapproximately 2,004 hectares (2011 – 1,878 hectares) of vineyards, ranging from newly establishedvineyards to vineyards that are 93 years old.
196

Notes to the consolidated financial statements (continued)
14. Investments in associates
Moet OtherHennessy associates Total
£ million £ million £ million
Cost less provisionsAt 30 June 2010 . . . . . . . . . . . . . . . . . . . . . . . . . . . . . . . . . . . . . . . . . 1,814 246 2,060Exchange differences . . . . . . . . . . . . . . . . . . . . . . . . . . . . . . . . . . . . . . 150 7 157Additions . . . . . . . . . . . . . . . . . . . . . . . . . . . . . . . . . . . . . . . . . . . . . . — 58 58Share of retained profits/(losses) . . . . . . . . . . . . . . . . . . . . . . . . . . . . . 99 (10) 89Share of movements in other comprehensive income . . . . . . . . . . . . . . . 21 — 21
At 30 June 2011 . . . . . . . . . . . . . . . . . . . . . . . . . . . . . . . . . . . . . . . . . 2,084 301 2,385Exchange differences . . . . . . . . . . . . . . . . . . . . . . . . . . . . . . . . . . . . . . (199) (11) (210)Additions . . . . . . . . . . . . . . . . . . . . . . . . . . . . . . . . . . . . . . . . . . . . . . — 48 48Share of retained profits . . . . . . . . . . . . . . . . . . . . . . . . . . . . . . . . . . . 109 — 109Share of movements in other comprehensive income . . . . . . . . . . . . . . . (9) — (9)Step acquisition of Quanxing and Shuijingfang . . . . . . . . . . . . . . . . . . . — (125) (125)
At 30 June 2012 . . . . . . . . . . . . . . . . . . . . . . . . . . . . . . . . . . . . . . . . . 1,985 213 2,198
Investments in associates comprise the cost of shares, less goodwill written off on acquisitions prior to1 July 1998 of £1,238 million (2011 – £1,410 million), plus the group’s share of post acquisition reservesof £960 million (2011 – £975 million).
The movements in the year ended 30 June 2011 in respect of Moet Hennessy have beenreclassified to be consistent with the disclosure in the year ended 30 June 2012.
(a) Moet Hennessy Moet Hennessy prepares its financial statements under IFRS in euros to31 December each year. A summary of Moet Hennessy’s consolidated balance sheet as at 30 June 2012and 30 June 2011, including acquisition fair value adjustments principally in respect of Moet Hennessy’sbrands and translated at £1 = A1.24 (2011 – £1 = A1.11), is set out below:
2012 2011
E million £ million E million £ million
Non-current assets . . . . . . . . . . . . . . . . . . . . . . . . . . . . . . . . . 4,247 3,425 4,109 3,702Current assets . . . . . . . . . . . . . . . . . . . . . . . . . . . . . . . . . . . . 5,860 4,726 5,522 4,975
Total assets . . . . . . . . . . . . . . . . . . . . . . . . . . . . . . . . . . . . . . 10,107 8,151 9,631 8,677
Current liabilities . . . . . . . . . . . . . . . . . . . . . . . . . . . . . . . . . (1,586) (1,279) (1,490) (1,343)Non-current liabilities . . . . . . . . . . . . . . . . . . . . . . . . . . . . . . (1,281) (1,033) (1,338) (1,205)
Total liabilities . . . . . . . . . . . . . . . . . . . . . . . . . . . . . . . . . . . (2,867) (2,312) (2,828) (2,548)
Net assets . . . . . . . . . . . . . . . . . . . . . . . . . . . . . . . . . . . . . . . 7,240 5,839 6,803 6,129
197

Notes to the consolidated financial statements (continued)
14. Investments in associates (continued)
(b) Other associates For all of the group’s investments in associates other than Moet Hennessy,summarised financial information, aggregating 100% of the assets and liabilities of each associate,including acquisition fair value adjustments, is presented below:
2012 2011
£ million £ million
Non-current assets . . . . . . . . . . . . . . . . . . . . . . . . . . . . . . . . . . . . . . . . . . . . . . . 566 715Current assets . . . . . . . . . . . . . . . . . . . . . . . . . . . . . . . . . . . . . . . . . . . . . . . . . . . 411 546
Total assets . . . . . . . . . . . . . . . . . . . . . . . . . . . . . . . . . . . . . . . . . . . . . . . . . . . . . 977 1,261
Current liabilities . . . . . . . . . . . . . . . . . . . . . . . . . . . . . . . . . . . . . . . . . . . . . . . . (219) (259)Non-current liabilities . . . . . . . . . . . . . . . . . . . . . . . . . . . . . . . . . . . . . . . . . . . . . (282) (296)
Total liabilities . . . . . . . . . . . . . . . . . . . . . . . . . . . . . . . . . . . . . . . . . . . . . . . . . . (501) (555)
Net assets . . . . . . . . . . . . . . . . . . . . . . . . . . . . . . . . . . . . . . . . . . . . . . . . . . . . . . 476 706
15. Investments in joint ventures
The group consolidates its share of the results and net assets of joint ventures that are attributableto the group’s brands on a line-by-line basis or on a different proportional basis measured according tothe terms of the arrangements. The group’s principal joint ventures are as follows:
Country of Country of Percentage ofincorporation operation equity owned Principal activities
Don Julio BV . . . . . . . . . . . . Netherlands Mexico 50% Production, marketing anddistribution of premiumdrinks
Diageo Moet Hennessy(Thailand) Ltd. . . . . . . . . . Thailand Thailand 53.6% Marketing and distribution of
premium drinksGuinness Anchor Berhad . . . Malaysia Malaysia 50% Production, marketing and
distribution of premiumdrinks
Moet Hennessy Diageo(China) Co. Ltd. . . . . . . . . China China 50% Marketing and distribution of
premium drinksNorth British
Distillery Co. Ltd. . . . . . . . Scotland Scotland 50% Production of premium grainspirit and warehousing
The group’s joint ventures are involved in the production, marketing and distribution of premiumdrinks in Europe, South Africa, Central America and the Far East.
198
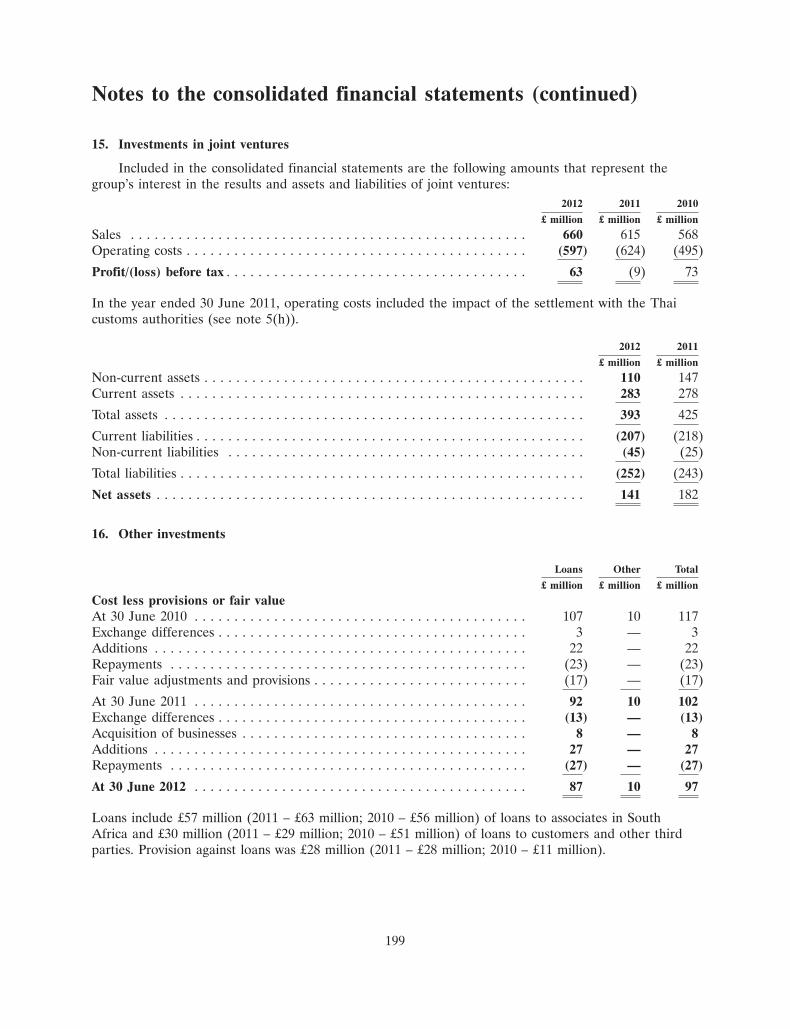
Notes to the consolidated financial statements (continued)
15. Investments in joint ventures
Included in the consolidated financial statements are the following amounts that represent thegroup’s interest in the results and assets and liabilities of joint ventures:
2012 2011 2010
£ million £ million £ million
Sales . . . . . . . . . . . . . . . . . . . . . . . . . . . . . . . . . . . . . . . . . . . . . . . . . . 660 615 568Operating costs . . . . . . . . . . . . . . . . . . . . . . . . . . . . . . . . . . . . . . . . . . . (597) (624) (495)
Profit/(loss) before tax . . . . . . . . . . . . . . . . . . . . . . . . . . . . . . . . . . . . . . 63 (9) 73
In the year ended 30 June 2011, operating costs included the impact of the settlement with the Thaicustoms authorities (see note 5(h)).
2012 2011
£ million £ million
Non-current assets . . . . . . . . . . . . . . . . . . . . . . . . . . . . . . . . . . . . . . . . . . . . . . . . 110 147Current assets . . . . . . . . . . . . . . . . . . . . . . . . . . . . . . . . . . . . . . . . . . . . . . . . . . . 283 278
Total assets . . . . . . . . . . . . . . . . . . . . . . . . . . . . . . . . . . . . . . . . . . . . . . . . . . . . . 393 425
Current liabilities . . . . . . . . . . . . . . . . . . . . . . . . . . . . . . . . . . . . . . . . . . . . . . . . . (207) (218)Non-current liabilities . . . . . . . . . . . . . . . . . . . . . . . . . . . . . . . . . . . . . . . . . . . . . (45) (25)
Total liabilities . . . . . . . . . . . . . . . . . . . . . . . . . . . . . . . . . . . . . . . . . . . . . . . . . . . (252) (243)
Net assets . . . . . . . . . . . . . . . . . . . . . . . . . . . . . . . . . . . . . . . . . . . . . . . . . . . . . . 141 182
16. Other investments
Loans Other Total
£ million £ million £ million
Cost less provisions or fair valueAt 30 June 2010 . . . . . . . . . . . . . . . . . . . . . . . . . . . . . . . . . . . . . . . . . . 107 10 117Exchange differences . . . . . . . . . . . . . . . . . . . . . . . . . . . . . . . . . . . . . . . 3 — 3Additions . . . . . . . . . . . . . . . . . . . . . . . . . . . . . . . . . . . . . . . . . . . . . . . 22 — 22Repayments . . . . . . . . . . . . . . . . . . . . . . . . . . . . . . . . . . . . . . . . . . . . . (23) — (23)Fair value adjustments and provisions . . . . . . . . . . . . . . . . . . . . . . . . . . . (17) — (17)
At 30 June 2011 . . . . . . . . . . . . . . . . . . . . . . . . . . . . . . . . . . . . . . . . . . 92 10 102Exchange differences . . . . . . . . . . . . . . . . . . . . . . . . . . . . . . . . . . . . . . . (13) — (13)Acquisition of businesses . . . . . . . . . . . . . . . . . . . . . . . . . . . . . . . . . . . . 8 — 8Additions . . . . . . . . . . . . . . . . . . . . . . . . . . . . . . . . . . . . . . . . . . . . . . . 27 — 27Repayments . . . . . . . . . . . . . . . . . . . . . . . . . . . . . . . . . . . . . . . . . . . . . (27) — (27)
At 30 June 2012 . . . . . . . . . . . . . . . . . . . . . . . . . . . . . . . . . . . . . . . . . . 87 10 97
Loans include £57 million (2011 – £63 million; 2010 – £56 million) of loans to associates in SouthAfrica and £30 million (2011 – £29 million; 2010 – £51 million) of loans to customers and other thirdparties. Provision against loans was £28 million (2011 – £28 million; 2010 – £11 million).
199

Notes to the consolidated financial statements (continued)
17. Inventories
2012 2011
£ million £ million
Raw materials and consumables . . . . . . . . . . . . . . . . . . . . . . . . . . . . . . . . . . . . . . 334 258Work in progress . . . . . . . . . . . . . . . . . . . . . . . . . . . . . . . . . . . . . . . . . . . . . . . . . 66 25Maturing inventories . . . . . . . . . . . . . . . . . . . . . . . . . . . . . . . . . . . . . . . . . . . . . . 2,953 2,681Finished goods and goods for resale . . . . . . . . . . . . . . . . . . . . . . . . . . . . . . . . . . . 602 509
3,955 3,473
Maturing inventories include whisky, rum, wines and Chinese white spirit. The following amounts ofinventories are expected to be utilised after more than one year:
2012 2011
£ million £ million
Raw materials and consumables . . . . . . . . . . . . . . . . . . . . . . . . . . . . . . . . . . . . . . 49 35Maturing inventories . . . . . . . . . . . . . . . . . . . . . . . . . . . . . . . . . . . . . . . . . . . . . . 2,479 2,246
2,528 2,281
Inventories are disclosed net of provisions for obsolescence, an analysis of which is as follows:
2012 2011
£ million £ million
Balance at beginning of the year . . . . . . . . . . . . . . . . . . . . . . . . . . . . . . . . . . . . . . 57 97Exchange differences . . . . . . . . . . . . . . . . . . . . . . . . . . . . . . . . . . . . . . . . . . . . . . (1) (2)Income statement charge . . . . . . . . . . . . . . . . . . . . . . . . . . . . . . . . . . . . . . . . . . . 4 10Utilised . . . . . . . . . . . . . . . . . . . . . . . . . . . . . . . . . . . . . . . . . . . . . . . . . . . . . . . . (8) (48)
52 57
18. Trade and other receivables
2012 2011
Current Non-current Current Non-currentassets assets assets assets
£ million £ million £ million £ million
Trade receivables . . . . . . . . . . . . . . . . . . . . . . . . . . . . . . . 1,749 — 1,501 —Interest receivable . . . . . . . . . . . . . . . . . . . . . . . . . . . . . . 19 — 45 —Other receivables . . . . . . . . . . . . . . . . . . . . . . . . . . . . . . 165 108 270 108Prepayments . . . . . . . . . . . . . . . . . . . . . . . . . . . . . . . . . . 142 11 130 10Accrued income . . . . . . . . . . . . . . . . . . . . . . . . . . . . . . . 28 — 31 —
2,103 119 1,977 118
As at 30 June 2012 non-current other receivables includes £84 million (2011 – £97 million) in respect ofthe assessment of excise duties made by the Korean customs authorities (see note 31(c)).
At 30 June 2012, approximately 12% and 22% of the group’s trade receivables of £1,749 millionare due from counterparties based in the United Kingdom and in the United States, respectively.
200
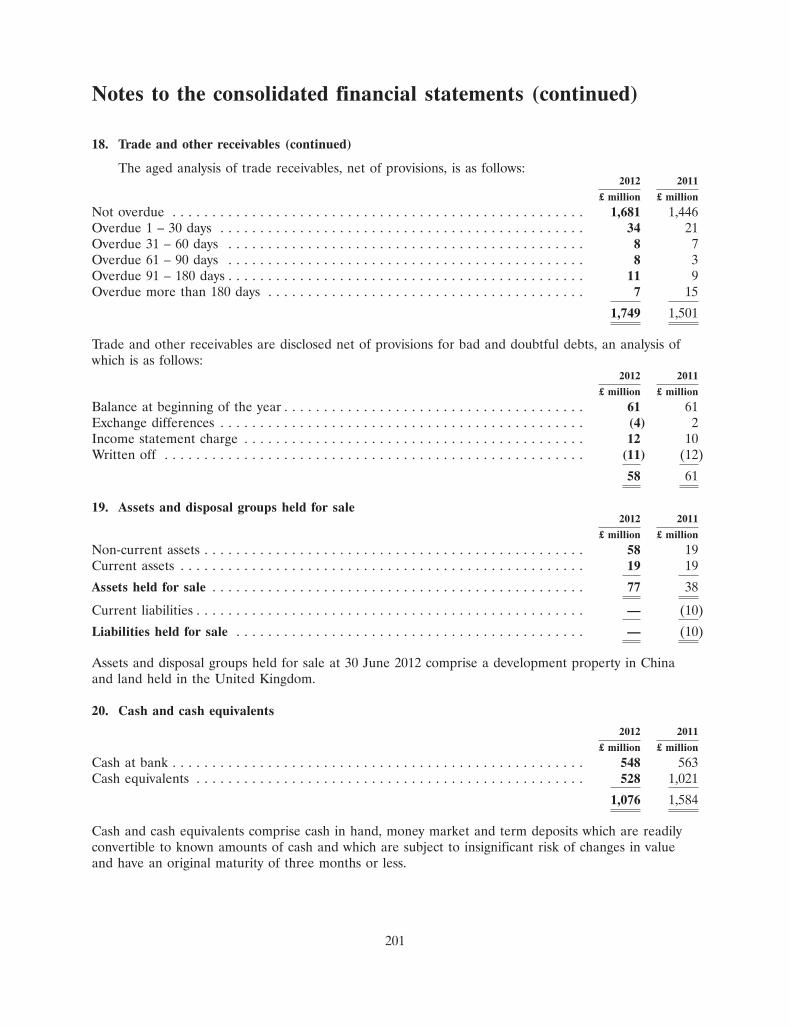
Notes to the consolidated financial statements (continued)
18. Trade and other receivables (continued)
The aged analysis of trade receivables, net of provisions, is as follows:2012 2011
£ million £ million
Not overdue . . . . . . . . . . . . . . . . . . . . . . . . . . . . . . . . . . . . . . . . . . . . . . . . . . . . 1,681 1,446Overdue 1 – 30 days . . . . . . . . . . . . . . . . . . . . . . . . . . . . . . . . . . . . . . . . . . . . . . 34 21Overdue 31 – 60 days . . . . . . . . . . . . . . . . . . . . . . . . . . . . . . . . . . . . . . . . . . . . . 8 7Overdue 61 – 90 days . . . . . . . . . . . . . . . . . . . . . . . . . . . . . . . . . . . . . . . . . . . . . 8 3Overdue 91 – 180 days . . . . . . . . . . . . . . . . . . . . . . . . . . . . . . . . . . . . . . . . . . . . . 11 9Overdue more than 180 days . . . . . . . . . . . . . . . . . . . . . . . . . . . . . . . . . . . . . . . . 7 15
1,749 1,501
Trade and other receivables are disclosed net of provisions for bad and doubtful debts, an analysis ofwhich is as follows:
2012 2011
£ million £ million
Balance at beginning of the year . . . . . . . . . . . . . . . . . . . . . . . . . . . . . . . . . . . . . . 61 61Exchange differences . . . . . . . . . . . . . . . . . . . . . . . . . . . . . . . . . . . . . . . . . . . . . . (4) 2Income statement charge . . . . . . . . . . . . . . . . . . . . . . . . . . . . . . . . . . . . . . . . . . . 12 10Written off . . . . . . . . . . . . . . . . . . . . . . . . . . . . . . . . . . . . . . . . . . . . . . . . . . . . . (11) (12)
58 61
19. Assets and disposal groups held for sale2012 2011
£ million £ million
Non-current assets . . . . . . . . . . . . . . . . . . . . . . . . . . . . . . . . . . . . . . . . . . . . . . . . 58 19Current assets . . . . . . . . . . . . . . . . . . . . . . . . . . . . . . . . . . . . . . . . . . . . . . . . . . . 19 19
Assets held for sale . . . . . . . . . . . . . . . . . . . . . . . . . . . . . . . . . . . . . . . . . . . . . . . 77 38
Current liabilities . . . . . . . . . . . . . . . . . . . . . . . . . . . . . . . . . . . . . . . . . . . . . . . . . — (10)
Liabilities held for sale . . . . . . . . . . . . . . . . . . . . . . . . . . . . . . . . . . . . . . . . . . . . — (10)
Assets and disposal groups held for sale at 30 June 2012 comprise a development property in Chinaand land held in the United Kingdom.
20. Cash and cash equivalents
2012 2011
£ million £ million
Cash at bank . . . . . . . . . . . . . . . . . . . . . . . . . . . . . . . . . . . . . . . . . . . . . . . . . . . . 548 563Cash equivalents . . . . . . . . . . . . . . . . . . . . . . . . . . . . . . . . . . . . . . . . . . . . . . . . . 528 1,021
1,076 1,584
Cash and cash equivalents comprise cash in hand, money market and term deposits which are readilyconvertible to known amounts of cash and which are subject to insignificant risk of changes in valueand have an original maturity of three months or less.
201

Notes to the consolidated financial statements (continued)
21. Borrowings and bank overdrafts
Year endRepayment interest
date Currency rates 2012 2011
% £ million £ million
Bank overdrafts . . . . . . . . . . . . . . . . . . . . . . On demand Various Various 38 12Commercial paper . . . . . . . . . . . . . . . . . . . . — US dollar 0.47-0.55 23 —Bank and other loans . . . . . . . . . . . . . . . . . . Various Various Various 165 103Credit support obligations . . . . . . . . . . . . . . 2012 Various Various 130 91Guaranteed debentures 2011 . . . . . . . . . . . . 2011 US dollar 9.0 — 186Guaranteed bonds 2012 . . . . . . . . . . . . . . . . 2012 US dollar 5.125 — 373Guaranteed bonds 2012 . . . . . . . . . . . . . . . . 2012 Euro 1.271 — 675Guaranteed bonds 2013 . . . . . . . . . . . . . . . . 2013 US dollar 5.2 478 —Guaranteed bonds 2013 . . . . . . . . . . . . . . . . 2013 US dollar 5.5 382 —Fair value adjustment to borrowings . . . . . . . — — — 14 7
Borrowings due within one year and bankoverdrafts . . . . . . . . . . . . . . . . . . . . . . . . 1,230 1,447
Guaranteed bonds 2013 . . . . . . . . . . . . . . . . 2013 US dollar 5.2 — 466Guaranteed bonds 2013 . . . . . . . . . . . . . . . . 2013 US dollar 5.5 — 373Guaranteed bonds 2013 . . . . . . . . . . . . . . . . 2013 Euro 5.5 926 1,035Guaranteed bonds 2014 . . . . . . . . . . . . . . . . 2014 US dollar 7.375 514 502Guaranteed bonds 2014 . . . . . . . . . . . . . . . . 2014 Euro 6.625 805 899Guaranteed bonds 2015 . . . . . . . . . . . . . . . . 2015 US dollar 5.3 477 465Guaranteed bonds 2015 . . . . . . . . . . . . . . . . 2015 US dollar 3.25 318 310Guaranteed bonds 2016 . . . . . . . . . . . . . . . . 2016 US dollar 5.5 381 372Guaranteed bonds 2017 . . . . . . . . . . . . . . . . 2017 US dollar 5.75 794 775Guaranteed bond 2017 . . . . . . . . . . . . . . . . . 2017 US dollar 1.5 633 —Guaranteed bonds 2020 . . . . . . . . . . . . . . . . 2020 US dollar 4.828 379 362Guaranteed bond 2022 . . . . . . . . . . . . . . . . . 2022 US dollar 2.875 631 —Guaranteed bonds 2035 . . . . . . . . . . . . . . . . 2035 US dollar 7.45 255 248Guaranteed bonds 2036 . . . . . . . . . . . . . . . . 2036 US dollar 5.875 377 369Guaranteed bond 2042 . . . . . . . . . . . . . . . . . 2042 US dollar 4.25 314 —Guaranteed debentures 2022 . . . . . . . . . . . . 2022 US dollar 8.0 189 185Medium term notes . . . . . . . . . . . . . . . . . . . 2018 US dollar 4.85 127 124Bank and other loans . . . . . . . . . . . . . . . . . . Various Various Various 44 49Fair value adjustment to borrowings . . . . . . . — — — 235 214
Borrowings due after one year . . . . . . . . . . . 7,399 6,748
Total borrowings before derivative financialinstruments . . . . . . . . . . . . . . . . . . . . . . . 8,629 8,195
Fair value of foreign currency forwards andswaps . . . . . . . . . . . . . . . . . . . . . . . . . . . — — — (210) (182)
Fair value of interest rate hedginginstruments . . . . . . . . . . . . . . . . . . . . . . . — — — (3) (58)
Total borrowings after derivative financialinstruments . . . . . . . . . . . . . . . . . . . . . . . 8,416 7,955
202

Notes to the consolidated financial statements (continued)
21. Borrowings and bank overdrafts (continued)
Bank overdrafts form an integral part of the group’s cash management and are included as acomponent of net cash and cash equivalents in the consolidated statement of cash flows. All bonds,medium term notes, debentures and commercial paper are fully and unconditionally guaranteed byDiageo plc.
Included in borrowings due within one year are credit support obligations. When derivativetransactions are undertaken with bank counterparties, the group may, where appropriate, enter intocertain agreements with such bank counterparties whereby the parties agree to post cash collateral forthe benefit of the other if the net valuations of the derivatives are above a pre-determined threshold.At 30 June 2012, the collateral held under these agreements amounted to $135 million (£86 million)and A54 million (£44 million) (2011 – $84 million (£52 million) and A44 million (£39 million)).
The interest rates shown in the table above are those contracted on the underlying borrowingsbefore taking into account any interest rate hedges (see note 23). The average monthly net borrowingsfor the year were £8,293 million (2011 – £7,227 million). Based on average monthly net borrowings andnet interest charge, taking into account interest rate hedges, the effective interest rate for the year was4.7% (2011 – 4.9%). For this calculation, net interest charge excludes fair value adjustments toderivative financial instruments and borrowings and average monthly net borrowings include the impactof interest rate swaps that are no longer in a hedge relationship but exclude the market valueadjustment for cross currency interest rate swaps. The loans above are stated net of unamortisedfinance costs of £92 million (2011 – £78 million; 2010 – £84 million).
The weighted average interest rate, before interest rate hedges, for short term borrowings at30 June 2012 was 6.1% (2011 – 4.3%; 2010 – 5.6%). The weighted average interest rate, before interestrate hedges, for bonds, medium term notes and bank loans included within borrowings due after oneyear at 30 June 2012 was 5.1% (2011 – 5.8%; 2010 – 5.5%).
Certain borrowings are reported in the table above at amortised cost with a fair value adjustmentshown separately.
(a) Analysis of net borrowings
2012 2011
£ million £ million
Borrowings due within one year and bank overdrafts . . . . . . . . . . . . . . . . . . . . . . . (1,230) (1,447)Borrowings due after one year . . . . . . . . . . . . . . . . . . . . . . . . . . . . . . . . . . . . . . . (7,399) (6,748)Fair value of foreign currency forwards and swaps(i) . . . . . . . . . . . . . . . . . . . . . . . 210 182Fair value of interest rate hedging instruments . . . . . . . . . . . . . . . . . . . . . . . . . . . . 3 58Finance lease liabilities . . . . . . . . . . . . . . . . . . . . . . . . . . . . . . . . . . . . . . . . . . . . (230) (79)
Gross borrowings . . . . . . . . . . . . . . . . . . . . . . . . . . . . . . . . . . . . . . . . . . . . . . . . (8,646) (8,034)Offset by:Cash and cash equivalents . . . . . . . . . . . . . . . . . . . . . . . . . . . . . . . . . . . . . . . . . . 1,076 1,584
Net borrowings . . . . . . . . . . . . . . . . . . . . . . . . . . . . . . . . . . . . . . . . . . . . . . . . . . (7,570) (6,450)
(i) Includes derivative financial instruments designated in net investment hedges or designated tohedge the foreign currency risk associated with certain foreign currency denominated borrowings.
203

Notes to the consolidated financial statements (continued)
21. Borrowings and bank overdrafts (continued)
Foreign currency forwards and swaps, interest rate hedging instruments and finance lease liabilitiesare included as appropriate in other financial assets and other financial liabilities.
(b) Reconciliation of movement in net borrowings
2012 2011
£ million £ million
Net borrowings at beginning of the year . . . . . . . . . . . . . . . . . . . . . . . . . . . . . . . . (6,450) (6,954)Net (decrease)/increase in cash and cash equivalents before exchange . . . . . . . . . . . (507) 242Net (increase)/decrease in loans . . . . . . . . . . . . . . . . . . . . . . . . . . . . . . . . . . . . . . (512) 414
Change in net borrowings from cash flows . . . . . . . . . . . . . . . . . . . . . . . . . . . . . . (1,019) 656Exchange differences on net borrowings . . . . . . . . . . . . . . . . . . . . . . . . . . . . . . . . 152 (17)Borrowings acquired through purchase of businesses . . . . . . . . . . . . . . . . . . . . . . . (5) (22)Other non-cash items . . . . . . . . . . . . . . . . . . . . . . . . . . . . . . . . . . . . . . . . . . . . . . (248) (113)
Net borrowings at end of the year . . . . . . . . . . . . . . . . . . . . . . . . . . . . . . . . . . . . . (7,570) (6,450)
204

Notes to the consolidated financial statements (continued)
22. Other financial assets and liabilities
Non-current Current Current Non-currentassets assets liabilities liabilities Total
£ million £ million £ million £ million £ million
2012Derivative assets/(liabilities)Designated in a cash flow hedge . . . . . . . . . . . . 235 28 (32) (8) 223Designated in a fair value hedge . . . . . . . . . . . . — 3 — — 3Designated in a net investment hedge . . . . . . . . — 1 (23) — (22)Not designated in a hedge relationship . . . . . . . 270 10 (18) (148) 114
505 42 (73) (156) 318
Non-derivative liabilitiesDeferred consideration payable . . . . . . . . . . . . . — — (17) (103) (120)Finance lease liabilities . . . . . . . . . . . . . . . . . . . — — (23) (207) (230)
— — (40) (310) (350)
Total other financial assets/(liabilities) . . . . . . . 505 42 (113) (466) (32)
2011Derivative assets/(liabilities)Designated in a cash flow hedge . . . . . . . . . . . . 177 44 (31) (11) 179Designated in a fair value hedge . . . . . . . . . . . . 66 2 — (10) 58Designated in a net investment hedge . . . . . . . . — 13 (17) — (4)Not designated in a hedge relationship . . . . . . . 62 30 (31) (33) 28
305 89 (79) (54) 261
Non-derivative liabilitiesDeferred consideration payable . . . . . . . . . . . . . — — (4) (21) (25)Finance lease liabilities . . . . . . . . . . . . . . . . . . . — — (7) (72) (79)
— — (11) (93) (104)
Total other financial assets/(liabilities) . . . . . . . 305 89 (90) (147) 157
Finance lease liabilities are payable as follows:
2012 2011
Present PresentFuture value of Future value of
minimum Future minimum minimum Future minimumlease finance lease lease finance lease
payments charges payments payments charges payments
£ million £ million £ million £ million £ million £ million
Less than one year . . . . . . . . . . . . . . . . . (39) 16 (23) (12) 5 (7)Between one and five years . . . . . . . . . . . (129) 45 (84) (38) 16 (22)More than five years . . . . . . . . . . . . . . . . (165) 42 (123) (76) 26 (50)
(333) 103 (230) (126) 47 (79)
205

Notes to the consolidated financial statements (continued)
23. Financial instruments and risk management
Derivative financial instruments are used to hedge exposure to fluctuations in foreign exchange rates,interest rates and commodity price movements that arise in the normal course of the group’s business.
The group’s funding, liquidity and exposure to foreign currency and interest rate risks are managedby the group’s treasury department. The treasury department uses a range of financial instruments tomanage these underlying risks.
Treasury operations are conducted within a framework of board-approved policies and guidelines,which are recommended and subsequently monitored by the finance committee. This committee isdescribed in the Corporate governance report. The policies and guidelines include benchmark exposureand/or hedge cover levels for key areas of treasury risk. The benchmarks, hedge cover levels and overallappropriateness of Diageo’s risk management policies are reviewed by the board following, forexample, significant business, strategic or accounting changes. The framework provides for limiteddefined levels of flexibility in execution to allow for the optimal application of the board-approvedstrategies. Transactions arising on the application of this flexibility may give rise to exposures differentfrom the defined benchmark levels that are separately monitored on a daily basis using value at riskanalysis. These transactions are carried at fair value and gains or losses are taken to the incomestatement as they arise. In the year ended 30 June 2012 gains and losses on these transactions were notmaterial.
The group purchases insurance for commercial or, where required, for legal or contractual reasons.In addition, the group retains insurable risk where external insurance is not considered an economicmeans of mitigating these risks.
The finance committee receives monthly reports on the activities of the treasury department,including any exposures different from the defined benchmarks.
(a) Currency risk The group presents its consolidated financial statements in sterling and conductsbusiness in many foreign currencies. As a result, it is subject to foreign currency risk due to exchangerate movements, which will affect the group’s transactions and the translation of the results andunderlying net assets of its foreign operations. To manage the foreign currency risk the group usescertain financial instruments. Where hedge accounting is applied, hedges are documented and testedfor hedge effectiveness on an ongoing basis. Diageo expects hedges entered into to continue to beeffective and therefore does not expect the impact of ineffectiveness on the consolidated incomestatement to be material.
Hedge of net investment in foreign operations The group hedges a substantial portion of its exposureto fluctuations in the sterling value of its foreign operations by designating net borrowings held inforeign currencies and using foreign currency spots, forwards, swaps and other financial derivatives. Theboard reviewed and approved a revised policy, applicable from 20 June 2012, to manage hedging offoreign exchange risk arising from net investment in foreign operations. The group’s revised policy is tomaintain total net investment Value at Risk below £1 billion with additional limits for individualcurrencies, where Value at Risk is defined as the maximum amount of loss not exceeded over aone year period with a 95% probability confidence level. The group’s previous policy was to seek tohedge currency exposure on its net investment in foreign operations by using gross debt in foreigncurrencies and foreign currency spots, forwards, swaps and other financial derivatives within thefollowing percentage bands: 80% to 100% for US dollars and euros and, at management’s discretion,0% to 100% for other currencies.
206

Notes to the consolidated financial statements (continued)
23. Financial instruments and risk management (continued)
Exchange differences arising on the retranslation of foreign currency borrowings (including foreigncurrency forwards, swaps and other financial derivatives), to the extent that they are in an effectivehedge relationship, are recognised in other comprehensive income to offset exchange differences on netinvestments in foreign operations. Exchange differences on foreign currency borrowings not in a hedgerelationship and any ineffectiveness are taken to the income statement.
Transaction exposure hedging The group’s policy is to hedge up to 24 months forecasted transactionalforeign currency risk in the three major currency pairs (US dollar/sterling, euro/sterling and euro/US dollar) targeting 75% coverage of the current financial year when the annual plan is approved, andup to 18 months for other currency pairs. The effective portion of the gain or loss on the hedge isrecognised in other comprehensive income and recycled into the income statement at the same time asthe underlying hedged transaction affects the income statement. Any ineffectiveness is taken to theincome statement.
Hedge of foreign currency debt The group uses cross currency interest rate swaps to hedge the foreigncurrency risk associated with certain foreign currency denominated borrowings. The effective portion ofthe gain or loss on the hedge is recognised in other comprehensive income and recycled into theincome statement at the same time as the underlying hedged transaction affects the income statement.Any ineffectiveness is taken to the income statement.
(b) Interest rate risk The group has an exposure to interest rate risk, arising principally on changesin US dollar, euro and sterling interest rates. To manage interest rate risk, the group manages itsproportion of fixed to floating rate borrowings within limits approved by the board, primarily throughissuing fixed and floating rate borrowing and commercial paper, and by utilising interest ratederivatives. These practices aim to minimise the group’s net finance charges with acceptable yearon year volatility. To facilitate operational efficiency and effective hedge accounting, the group’s policyis to maintain fixed rate borrowings within a band of 40% to 60% of forecast net borrowings. Due tothe exceptionally low interest rate environment experienced during 2012, the board has approved anexception to this policy, permitting fixed rate debt to reach up to 100% of forecast net debt. For thesecalculations, net borrowings exclude interest rate related fair value adjustments. The majority ofDiageo’s existing interest rate derivatives are legacy fair value hedges that have locked in positivemarket values. These instruments are no longer involved in hedge relationships and the fair valuechange is recognised in the income statement which is partially offset by the net interest earned onthese derivatives.
(c) Commodity price risk The group is exposed to commodity price risk. Commodity price risk ismanaged in line with principles approved by the board either through long term purchase contractswith suppliers or, where appropriate, derivative contracts. Where derivative contracts are used thegroup manages exposures principally through exchange-traded futures, forwards, swaps and options.
(d) Market risk sensitivity analysis The group is using a sensitivity analysis technique that measuresthe estimated impacts on the consolidated income statement and other comprehensive income of eitheran instantaneous increase or decrease of 0.5% (50 basis points) in market interest rates or a 10%strengthening or weakening in sterling against all other currencies, from the rates applicable at 30 June2012 and 30 June 2011, for each class of financial instruments with all other variables remainingconstant. The sensitivity analysis excludes the impact of market risks on the net post employmentbenefit liability and corporate tax payable. This analysis is for illustrative purposes only, as in practiceinterest and foreign exchange rates rarely change in isolation.
207

Notes to the consolidated financial statements (continued)
23. Financial instruments and risk management (continued)
The sensitivity analysis is based on the following:
• Financial instruments are valued at the balance sheet date using discounted cash flowtechniques.
• Changes in interest rates affect the interest income or expense of variable interest financialinstruments.
• Changes in interest rates only affect interest income or expense in relation to financialinstruments with fixed interest rates if these are recognised at fair value.
• Changes in interest rates affect the fair value of derivative financial instruments designated ashedging instruments.
• Changes in the fair values of derivative financial instruments and other financial assets andliabilities are estimated by discounting the future cash flows to net present values using ratesprevailing at the year end.
• All interest rate, net investment and foreign currency cash flow hedges are expected to be highlyeffective.
The sensitivity analysis estimates the impact of changes in interest and foreign exchangerates. Actual results in the future may differ from these results materially due to developments in theglobal financial markets which may cause fluctuations in interest and exchange rates to vary from thehypothetical amounts disclosed in the following table, which therefore should not be considered asprojections of likely future events, gains or losses.
Reasonably possible hypothetical changes in other risk variables would not significantly affect thefair value of financial instruments at 30 June 2012 and 30 June 2011.
Analysis of sensitivities
0.5% 0.5%decrease increase 10% 10%
in interest in interest weakening strengtheningrates rates of sterling of sterling
£ million £ million £ million £ million
2012Impact on income statement – gain/(loss) . . . . . . . . . . . . 5 (5) (26) 21Impact on the consolidated statement of comprehensive
income – gain/(loss)(i)(ii) . . . . . . . . . . . . . . . . . . . . . . 19 (18) (786) 6432011Impact on income statement – gain/(loss) . . . . . . . . . . . . 13 (13) (29) 24Impact on the consolidated statement of comprehensive
income – gain/(loss)(i)(ii) . . . . . . . . . . . . . . . . . . . . . . 22 (22) (731) 598
(i) The group’s foreign currency debt is used to hedge the net investments in foreign operations andas such the translation of foreign net investments mainly offsets the foreign currency gains orlosses on financial instruments recognised in other comprehensive income.
(ii) Impact on the consolidated statement of comprehensive income includes the impact on the incomestatement.
208

Notes to the consolidated financial statements (continued)
23. Financial instruments and risk management (continued)
The above analysis considers the impact of all financial instruments including financial derivatives,cash and cash equivalents, borrowings and other financial assets and liabilities.
(e) Credit risk Credit risk refers to the risk that a counterparty will default on its contractualobligations resulting in financial loss to the group. Credit risk arises from cash balances (including bankdeposits and cash and cash equivalents), derivative financial instruments and credit exposures tocustomers, including outstanding loans, trade and other receivables, financial guarantees and committedtransactions. Credit risk is managed separately for financial and business related credit exposures.
Financial credit risk
Diageo aims to minimise its financial credit risk through the application of risk management policiesapproved and monitored by the board. Counterparties are limited to major banks and financialinstitutions, primarily with a long term credit rating within the A band or better, and the policy restrictsthe exposure to any one counterparty by setting credit limits taking into account the credit quality ofthe counterparty. The group’s policy is designed to ensure that individual counterparty limits areadhered to and that there are no significant concentrations of credit risk. The board also defines thetypes of financial instruments which may be transacted. The credit risk arising through the use offinancial instruments for currency and interest rate risk management is estimated with reference to thefair value of contracts with a positive value, rather than the notional amount of the instrumentsthemselves.
When derivative transactions are undertaken with bank counterparties, the group may, whereappropriate, enter into certain agreements with such bank counterparties whereby the parties agree topost cash collateral for the benefit of the other if the net valuations of the derivatives are above apre-determined threshold.
Diageo annually reviews the credit limits applied and regularly monitors the counterparties’ creditquality reflecting market credit conditions.
Business related credit risk
Loan, trade and other receivables exposures are managed locally in the operating units where they ariseand credit limits are set as deemed appropriate for the customer. There is no concentration of creditrisk with respect to loans, trade and other receivables as the group has a large number of customerswhich are internationally dispersed.
The carrying amount of financial assets represents the group’s exposure to credit risk at thereporting date as disclosed in note 23(i), excluding the impact of any collateral held or other creditenhancements.
(f) Liquidity risk Liquidity risk is the risk that Diageo may encounter in meeting its obligationsassociated with financial liabilities that are settled by delivering cash or other financial assets. Thegroup’s policy with regard to the expected maturity profile of borrowings is to limit the amount of suchborrowings maturing within 12 months to 50% of gross borrowings less money market demand deposits,and the level of commercial paper to 30% of gross borrowings less money market demand deposits. Inaddition, it is group policy to maintain backstop facilities with relationship banks to support commercialpaper obligations.
209
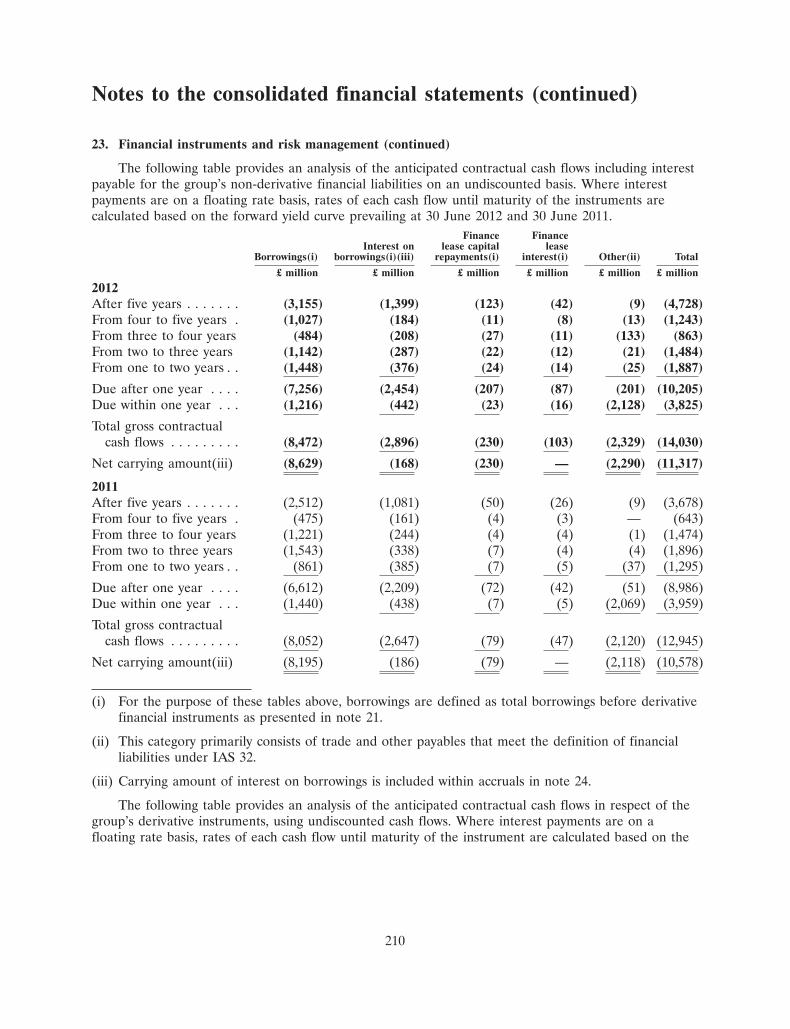
Notes to the consolidated financial statements (continued)
23. Financial instruments and risk management (continued)
The following table provides an analysis of the anticipated contractual cash flows including interestpayable for the group’s non-derivative financial liabilities on an undiscounted basis. Where interestpayments are on a floating rate basis, rates of each cash flow until maturity of the instruments arecalculated based on the forward yield curve prevailing at 30 June 2012 and 30 June 2011.
Finance FinanceInterest on lease capital lease
Borrowings(i) borrowings(i)(iii) repayments(i) interest(i) Other(ii) Total
£ million £ million £ million £ million £ million £ million
2012After five years . . . . . . . (3,155) (1,399) (123) (42) (9) (4,728)From four to five years . (1,027) (184) (11) (8) (13) (1,243)From three to four years (484) (208) (27) (11) (133) (863)From two to three years (1,142) (287) (22) (12) (21) (1,484)From one to two years . . (1,448) (376) (24) (14) (25) (1,887)
Due after one year . . . . (7,256) (2,454) (207) (87) (201) (10,205)Due within one year . . . (1,216) (442) (23) (16) (2,128) (3,825)
Total gross contractualcash flows . . . . . . . . . (8,472) (2,896) (230) (103) (2,329) (14,030)
Net carrying amount(iii) (8,629) (168) (230) — (2,290) (11,317)
2011After five years . . . . . . . (2,512) (1,081) (50) (26) (9) (3,678)From four to five years . (475) (161) (4) (3) — (643)From three to four years (1,221) (244) (4) (4) (1) (1,474)From two to three years (1,543) (338) (7) (4) (4) (1,896)From one to two years . . (861) (385) (7) (5) (37) (1,295)
Due after one year . . . . (6,612) (2,209) (72) (42) (51) (8,986)Due within one year . . . (1,440) (438) (7) (5) (2,069) (3,959)
Total gross contractualcash flows . . . . . . . . . (8,052) (2,647) (79) (47) (2,120) (12,945)
Net carrying amount(iii) (8,195) (186) (79) — (2,118) (10,578)
(i) For the purpose of these tables above, borrowings are defined as total borrowings before derivativefinancial instruments as presented in note 21.
(ii) This category primarily consists of trade and other payables that meet the definition of financialliabilities under IAS 32.
(iii) Carrying amount of interest on borrowings is included within accruals in note 24.
The following table provides an analysis of the anticipated contractual cash flows in respect of thegroup’s derivative instruments, using undiscounted cash flows. Where interest payments are on afloating rate basis, rates of each cash flow until maturity of the instrument are calculated based on the
210

Notes to the consolidated financial statements (continued)
23. Financial instruments and risk management (continued)
forward yield curve prevailing at 30 June 2012 and 30 June 2011. Cash flows are presented on a net orgross basis in accordance with the settlement arrangements of the instruments.
2012 2011
Derivative liabilities Inflow Outflow Inflow Outflow
£ million £ million £ million £ million
After five years . . . . . . . . . . . . . . . . . . . . . . . . . . . . . . . . . . . . 139 (136) 9 —From four to five years . . . . . . . . . . . . . . . . . . . . . . . . . . . . . . 4 (4) — (5)From three to four years . . . . . . . . . . . . . . . . . . . . . . . . . . . . . 5 (4) — (7)From two to three years . . . . . . . . . . . . . . . . . . . . . . . . . . . . . 6 (4) — (14)From one to two years . . . . . . . . . . . . . . . . . . . . . . . . . . . . . . 4 (14) — (17)
Due after one year . . . . . . . . . . . . . . . . . . . . . . . . . . . . . . . . . 158 (162) 9 (43)Due within one year . . . . . . . . . . . . . . . . . . . . . . . . . . . . . . . . 4 (71) — (84)
Total gross contractual cash flows . . . . . . . . . . . . . . . . . . . . . . . 162 (233) 9 (127)
2012 2011
Derivative assets Inflow Outflow Inflow Outflow
£ million £ million £ million £ million
After five years . . . . . . . . . . . . . . . . . . . . . . . . . . . . . . . . . . . . 700 (520) 1,204 (1,033)From four to five years . . . . . . . . . . . . . . . . . . . . . . . . . . . . . . 432 (348) 42 (37)From three to four years . . . . . . . . . . . . . . . . . . . . . . . . . . . . . 52 (30) 60 (34)From two to three years . . . . . . . . . . . . . . . . . . . . . . . . . . . . . 56 (31) 72 (34)From one to two years . . . . . . . . . . . . . . . . . . . . . . . . . . . . . . 61 (31) 115 (34)
Due after one year . . . . . . . . . . . . . . . . . . . . . . . . . . . . . . . . . 1,301 (960) 1,493 (1,172)Due within one year . . . . . . . . . . . . . . . . . . . . . . . . . . . . . . . . 98 (31) 213 (34)
Total gross contractual cash flows . . . . . . . . . . . . . . . . . . . . . . . 1,399 (991) 1,706 (1,206)
The group had available undrawn committed bank facilities as follows:
2012
£ million
Expiring within one year . . . . . . . . . . . . . . . . . . . . . . . . . . . . . . . . . . . . . . . . . . . . . . . . . . . 745Expiring between one and two years . . . . . . . . . . . . . . . . . . . . . . . . . . . . . . . . . . . . . . . . . . —Expiring after two years . . . . . . . . . . . . . . . . . . . . . . . . . . . . . . . . . . . . . . . . . . . . . . . . . . . 1,484
2,229
Commitment fees are paid on the undrawn portion of these facilities and accounted for on an accrualsbasis. Borrowings under these facilities will be at prevailing LIBOR rates (dependent on the period ofdrawdown) plus an agreed margin. These facilities can be used for general corporate purposes and,together with cash and cash equivalents, support the group’s commercial paper programmes.
There are no financial covenants on the group’s short and long term borrowings. Certain of theseborrowings contain cross default provisions and negative pledges.
211

Notes to the consolidated financial statements (continued)
23. Financial instruments and risk management (continued)
The committed bank facilities are subject to a single financial covenant, being minimum interestcover ratio of two times (defined as the ratio of operating profit before exceptional items, aggregatedwith share of associates’ profits after tax, to net interest). They are also subject to pari passu rankingand negative pledge covenants.
Any non-compliance with covenants underlying Diageo’s financing arrangements could, if notwaived, constitute an event of default with respect to any such arrangements, and any non-compliancewith covenants may, in particular circumstances, lead to an acceleration of maturity on certainborrowings and the inability to access committed facilities. Diageo was in full compliance with itsfinancial, pari passu ranking and negative pledge covenants throughout each of the years presented.
(g) Hedging instruments The group designates derivatives which qualify for hedge accounting aseither: (i) a hedge of the fair value of a recognised asset or liability (fair value hedge); (ii) a hedge of aforecast transaction or the cash flow risk from a change in foreign exchange or interest rates (cash flowhedge); or (iii) a hedge of a net investment in foreign operations. The accounting treatment for hedgesis disclosed in ‘Accounting policies of the group’.
The group tests effectiveness on a prospective and retrospective basis. Methods for testingeffectiveness include dollar offset, critical terms, regression analysis and hypothetical derivative method.
Gain on fair value hedging instruments for the year was £84 million (2011 – £8 million loss; 2010 –£163 million gain) and the loss on the hedged items attributable to the hedged risks was £86 million(2011 – £19 million gain; 2010 – £163 million loss).
In respect of cash flow hedging instruments, gains of £29 million (2011 – £25 million gain; 2010 –£27 million loss) have been recognised in other comprehensive income due to changes in fair value. Again of £4 million and a loss of £19 million have been transferred out of other comprehensive incometo other operating expenses and to other finance charges, respectively, in the year (2011 – £2 millionloss and a loss of £54 million; 2010 – £47 million loss and a gain of £73 million, respectively).
For cash flow hedges of forecast transactions at 30 June 2012, based on year end interest andforeign exchange rates, there is expected to be a charge to the income statement of £6 million in 2013and £4 million in 2014. With respect to hedges of the cash flow risk from a change in forward foreignexchange rates using cross currency interest rate swaps, the retranslation of the related bond principalto closing foreign exchange rates and recognition of interest on the related bonds will affect the incomestatement in each year until the related bonds mature in 2016 and 2036. Foreign exchange retranslationand the interest on the hedged bonds in the income statement are expected to offset those on the crosscurrency swaps in each of the years.
(h) Fair value measurements Fair value measurements of financial instruments are presentedthrough the use of a three-level fair value hierarchy that prioritises the valuation techniques used in fairvalue calculations. The levels can be broadly described as follows:
• Level 1 – use of unadjusted quoted prices in active markets for identical assets or liabilities;
• Level 2 – use of observable inputs other than quoted prices included within level 1, such asquoted prices for similar assets or liabilities in active markets; and
• Level 3 – use of inputs not based on observable market data but reflecting management’s ownassumptions about pricing the asset or liability.
212

Notes to the consolidated financial statements (continued)
23. Financial instruments and risk management (continued)
The group maintains policies and procedures to value instruments using the most relevant dataavailable. If multiple inputs that fall into different levels of the hierarchy are used in the valuation ofan instrument, the instrument is categorised on the basis of the most subjective input.
Derivatives and other financial liabilities at fair value
Foreign currency forwards and swaps, cross currency swaps and interest rate swaps are valued usingdiscounted cash flow techniques. These techniques incorporate inputs at levels 1 and 2, such as foreignexchange rates and interest rates. These market inputs are used in the discounted cash flow calculationincorporating the instrument’s term, notional amount and discount rate, and taking credit risk intoaccount. As significant inputs to the valuation are observable in active markets, these instruments arecategorised as level 2 in the hierarchy.
The Nolet Group’s option to sell the remaining 50% equity stake in Ketel One Worldwide BV toDiageo is classified as a derivative financial liability with changes in fair value included in operatingprofit. Industrias Licoreras de Guatemala’s option to sell the remaining 50% equity stake in RumCreations Products Inc, the owner of the Zacapa rum brand, to Diageo is classified as a financialliability with changes in fair value included in retained earnings (see note 30). As the valuation of theseoptions uses assumptions not observable in the market, they are categorised as level 3 in the hierarchy.
The group’s financial assets and liabilities, excluding finance lease liabilities, measured at fair valueare categorised as follows:
2012 2011
Level 1 Level 2 Level 3 Total Level 1 Level 2 Level 3 Total
£ million £ million £ million £ million £ million £ million £ million £ million
AssetsDerivative assets . . . . . . — 547 — 547 — 394 — 394
Total assets . . . . . . . . . . — 547 — 547 — 394 — 394
LiabilitiesDerivative liabilities . . . — (221) (8) (229) — (118) (15) (133)Other financial liabilities — — (120) (120) — — (25) (25)
Total liabilities . . . . . . . — (221) (128) (349) — (118) (40) (158)
213

Notes to the consolidated financial statements (continued)
23. Financial instruments and risk management (continued)
The movements in level 3 instruments, measured on a recurring basis, are as follows:
Other TotalDerivative financial level 3liabilities liabilities instruments
£ million £ million £ million
At 30 June 2010 . . . . . . . . . . . . . . . . . . . . . . . . . . . . . . . . . . . . . . . . (23) (28) (51)Net gains included in the consolidated statement of comprehensive
income(i) . . . . . . . . . . . . . . . . . . . . . . . . . . . . . . . . . . . . . . . . . . . 8 3 11
At 30 June 2011 . . . . . . . . . . . . . . . . . . . . . . . . . . . . . . . . . . . . . . . . (15) (25) (40)Financial liabilities arising on acquisitions . . . . . . . . . . . . . . . . . . . . . — (97) (97)Net gains included in the consolidated statement of comprehensive
income(i) . . . . . . . . . . . . . . . . . . . . . . . . . . . . . . . . . . . . . . . . . . . 7 6 13Net losses included in retained earnings . . . . . . . . . . . . . . . . . . . . . . — (6) (6)Settlement of liabilities . . . . . . . . . . . . . . . . . . . . . . . . . . . . . . . . . . . — 2 2
At 30 June 2012 . . . . . . . . . . . . . . . . . . . . . . . . . . . . . . . . . . . . . . . . (8) (120) (128)
(i) Including gains/(losses) included in the income statement.
214

Notes to the consolidated financial statements (continued)
23. Financial instruments and risk management (continued)
(i) Total financial assets and liabilities The table below sets out the group’s accounting classificationof each class of financial assets and liabilities, and their fair values.
2012 2011
Total Totalcarrying Fair carrying Fair
value value value value
£ million £ million £ million £ million
Financial assetsCash and cash equivalents . . . . . . . . . . . . . . . . . . . . . . . . . . . . 1,076 1,076 1,584 1,584
Available-for-sale investments . . . . . . . . . . . . . . . . . . . . . . . . . 4 4 4 4Trade receivables . . . . . . . . . . . . . . . . . . . . . . . . . . . . . . . . . . 1,749 1,749 1,501 1,501Interest receivable . . . . . . . . . . . . . . . . . . . . . . . . . . . . . . . . . . 19 19 45 45Accrued income . . . . . . . . . . . . . . . . . . . . . . . . . . . . . . . . . . . 28 28 32 32Other receivables(ii) . . . . . . . . . . . . . . . . . . . . . . . . . . . . . . . . 87 87 196 196Other investments . . . . . . . . . . . . . . . . . . . . . . . . . . . . . . . . . . 93 93 98 98
Loans and receivables . . . . . . . . . . . . . . . . . . . . . . . . . . . . . . . 1,976 1,976 1,872 1,872
Derivatives in a hedge relationship . . . . . . . . . . . . . . . . . . . . . . 267 267 302 302Other instruments at fair value . . . . . . . . . . . . . . . . . . . . . . . . 280 280 92 92
Financial assets at fair value through profit or loss . . . . . . . . . . 547 547 394 394
Total financial assets . . . . . . . . . . . . . . . . . . . . . . . . . . . . . . . . 3,603 3,603 3,854 3,854
Financial liabilitiesFinance leases . . . . . . . . . . . . . . . . . . . . . . . . . . . . . . . . . . . . 230 230 79 79
Borrowings not in a hedge relationship(i) . . . . . . . . . . . . . . . . . 8,308 9,131 4,812 5,164Borrowings in a hedge relationship(i) . . . . . . . . . . . . . . . . . . . . 321 327 3,383 3,631Trade payables . . . . . . . . . . . . . . . . . . . . . . . . . . . . . . . . . . . . 1,078 1,078 986 986Interest payable . . . . . . . . . . . . . . . . . . . . . . . . . . . . . . . . . . . 177 177 191 191Other payables(ii) . . . . . . . . . . . . . . . . . . . . . . . . . . . . . . . . . . 217 217 260 260Accruals . . . . . . . . . . . . . . . . . . . . . . . . . . . . . . . . . . . . . . . . . 875 875 847 847
Financial liabilities at amortised cost . . . . . . . . . . . . . . . . . . . . 10,976 11,805 10,479 11,079
Derivatives in a hedge relationship . . . . . . . . . . . . . . . . . . . . . . 63 63 69 69Other instruments at fair value . . . . . . . . . . . . . . . . . . . . . . . . 286 286 89 89
Financial liabilities at fair value through profit or loss . . . . . . . . 349 349 158 158
Total financial liabilities . . . . . . . . . . . . . . . . . . . . . . . . . . . . . . 11,555 12,384 10,716 11,316
(i) For the purpose of this table, borrowings are defined as total borrowings before derivative financialinstruments as presented in note 21.
(ii) Only receivables and payables that meet the definition of financial instruments under IAS 32 areincluded in this line.
All derivative financial instruments not in a hedge relationship are classified as trading derivativeswith fair value changes recorded in the income statement. The group does not use derivatives for
215

Notes to the consolidated financial statements (continued)
23. Financial instruments and risk management (continued)
speculative purposes. All transactions in derivative financial instruments are initially undertaken tomanage the risks arising from underlying business activities.
The fair values of borrowings are based on market data. The fair values of derivatives andfinancial instruments are estimated by discounting the future contractual cash flows using theappropriate yield curves prevailing at 30 June each year. At 30 June 2012 and 30 June 2011, thecarrying values of cash and cash equivalents, bank overdrafts, other financial assets and liabilities wereconsidered to approximate fair values.
(j) Analysis of cash and cash equivalents by currency
2012 2011
£ million % £ million %
US dollar . . . . . . . . . . . . . . . . . . . . . . . . . . . . . . . . . . . . . . . . 551 52 1,058 67Euro . . . . . . . . . . . . . . . . . . . . . . . . . . . . . . . . . . . . . . . . . . . 46 4 56 4Sterling . . . . . . . . . . . . . . . . . . . . . . . . . . . . . . . . . . . . . . . . . 23 2 123 8Korean won . . . . . . . . . . . . . . . . . . . . . . . . . . . . . . . . . . . . . . 111 10 67 4Chinese yuan . . . . . . . . . . . . . . . . . . . . . . . . . . . . . . . . . . . . . 88 8 21 1Other . . . . . . . . . . . . . . . . . . . . . . . . . . . . . . . . . . . . . . . . . . . 257 24 259 16
Cash and cash equivalents . . . . . . . . . . . . . . . . . . . . . . . . . . . 1,076 100 1,584 100
(k) Analysis of gross borrowings by currency
2012 2011
£ million % £ million %
US dollar . . . . . . . . . . . . . . . . . . . . . . . . . . . . . . . . . . . . . . . . (3,524) 41 (3,689) 46Euro . . . . . . . . . . . . . . . . . . . . . . . . . . . . . . . . . . . . . . . . . . . (1,951) 23 (1,990) 25Sterling . . . . . . . . . . . . . . . . . . . . . . . . . . . . . . . . . . . . . . . . . (2,893) 33 (1,776) 22Other . . . . . . . . . . . . . . . . . . . . . . . . . . . . . . . . . . . . . . . . . . . (278) 3 (579) 7
Gross borrowings . . . . . . . . . . . . . . . . . . . . . . . . . . . . . . . . . . (8,646) 100 (8,034) 100
The analysis of group’s gross borrowings above includes the impact of foreign currency forwards andswaps.
(l) Analysis of net borrowings by interest rate profile
2012 2011
£ million % £ million %
Fixed rate . . . . . . . . . . . . . . . . . . . . . . . . . . . . . . . . . . . . . . . (7,528) 99 (3,638) 57Floating rate . . . . . . . . . . . . . . . . . . . . . . . . . . . . . . . . . . . . . . 127 (2) (2,722) 42Interest free . . . . . . . . . . . . . . . . . . . . . . . . . . . . . . . . . . . . . . — — 5 —Impact of financial derivatives and fair value adjustments . . . . . (169) 3 (95) 1
Net borrowings . . . . . . . . . . . . . . . . . . . . . . . . . . . . . . . . . . . . (7,570) 100 (6,450) 100
The analysis above includes the impact of interest rate hedging instruments.
216

Notes to the consolidated financial statements (continued)
23. Financial instruments and risk management (continued)
(m) Capital management Diageo considers the following components of its balance sheet to becapital: borrowings, banks overdrafts and equity.
The group’s management is committed to enhancing shareholder value in the long term, both byinvesting in the businesses and brands so as to improve the return on investment and by managing thecapital structure. Diageo manages its capital structure to achieve capital efficiency, maximise flexibilityand give the appropriate level of access to debt markets at attractive cost levels. This is achieved bytargeting a range of ratios which are currently broadly consistent with an A band credit rating. Diageowould consider modifying these ratios in the medium term in order to effect strategic initiatives withinits stated goals, which could have an impact on its rating.
The group regularly assesses its debt and equity capital levels against its stated policy for capitalstructure.
Where appropriate, comparative figures were reclassified to ensure a consistent presentation withcurrent year information.
24. Trade and other payables
2012 2011
Current Non-current Current Non-currentliabilities liabilities liabilities liabilities
£ million £ million £ million £ million
Trade payables . . . . . . . . . . . . . . . . . . . . . . . . . . . . . . . . 1,078 — 986 —Interest payable . . . . . . . . . . . . . . . . . . . . . . . . . . . . . . . 177 — 191 —Tax and social security excluding income tax . . . . . . . . . . . 496 — 408 —Other payables . . . . . . . . . . . . . . . . . . . . . . . . . . . . . . . . 354 72 387 29Accruals . . . . . . . . . . . . . . . . . . . . . . . . . . . . . . . . . . . . . 875 — 847 —Deferred income . . . . . . . . . . . . . . . . . . . . . . . . . . . . . . 17 13 19 12
2,997 85 2,838 41
Interest payable at 30 June 2012 included interest on non-derivative financial instruments of£168 million (2011 – £186 million).
25. Provisions
Thalidomide Restructuring Other Total
£ million £ million £ million £ million
At 30 June 2011 . . . . . . . . . . . . . . . . . . . . . . . . . . . . . . 168 109 138 415Exchange differences . . . . . . . . . . . . . . . . . . . . . . . . . . . — (2) — (2)Acquisition of businesses . . . . . . . . . . . . . . . . . . . . . . . . — — 17 17Provisions charged during the year . . . . . . . . . . . . . . . . . 16 13 21 50Provisions used during the year . . . . . . . . . . . . . . . . . . . (16) (40) (34) (90)Unwinding of discounts . . . . . . . . . . . . . . . . . . . . . . . . . 10 — 1 11At 30 June 2012 . . . . . . . . . . . . . . . . . . . . . . . . . . . . . . 178 80 143 401
Included in current liabilities . . . . . . . . . . . . . . . . . . . . . 27 43 57 127Included in non-current liabilities . . . . . . . . . . . . . . . . . . 151 37 86 274
178 80 143 401
Provisions by their nature are subject to uncertainties with respect to the timing and outcomes of futureevents.
217
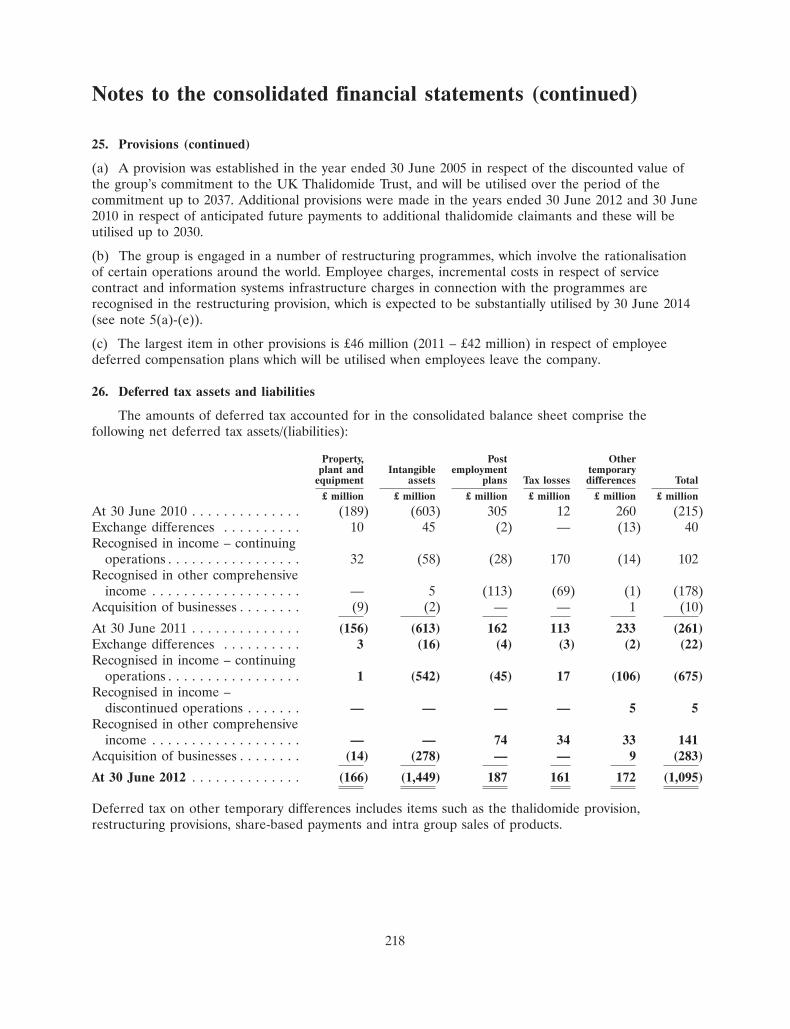
Notes to the consolidated financial statements (continued)
25. Provisions (continued)
(a) A provision was established in the year ended 30 June 2005 in respect of the discounted value ofthe group’s commitment to the UK Thalidomide Trust, and will be utilised over the period of thecommitment up to 2037. Additional provisions were made in the years ended 30 June 2012 and 30 June2010 in respect of anticipated future payments to additional thalidomide claimants and these will beutilised up to 2030.
(b) The group is engaged in a number of restructuring programmes, which involve the rationalisationof certain operations around the world. Employee charges, incremental costs in respect of servicecontract and information systems infrastructure charges in connection with the programmes arerecognised in the restructuring provision, which is expected to be substantially utilised by 30 June 2014(see note 5(a)-(e)).
(c) The largest item in other provisions is £46 million (2011 – £42 million) in respect of employeedeferred compensation plans which will be utilised when employees leave the company.
26. Deferred tax assets and liabilities
The amounts of deferred tax accounted for in the consolidated balance sheet comprise thefollowing net deferred tax assets/(liabilities):
Property, Post Otherplant and Intangible employment temporary
equipment assets plans Tax losses differences Total
£ million £ million £ million £ million £ million £ million
At 30 June 2010 . . . . . . . . . . . . . . (189) (603) 305 12 260 (215)Exchange differences . . . . . . . . . . 10 45 (2) — (13) 40Recognised in income – continuing
operations . . . . . . . . . . . . . . . . . 32 (58) (28) 170 (14) 102Recognised in other comprehensive
income . . . . . . . . . . . . . . . . . . . — 5 (113) (69) (1) (178)Acquisition of businesses . . . . . . . . (9) (2) — — 1 (10)
At 30 June 2011 . . . . . . . . . . . . . . (156) (613) 162 113 233 (261)Exchange differences . . . . . . . . . . 3 (16) (4) (3) (2) (22)Recognised in income – continuing
operations . . . . . . . . . . . . . . . . . 1 (542) (45) 17 (106) (675)Recognised in income –
discontinued operations . . . . . . . — — — — 5 5Recognised in other comprehensive
income . . . . . . . . . . . . . . . . . . . — — 74 34 33 141Acquisition of businesses . . . . . . . . (14) (278) — — 9 (283)
At 30 June 2012 . . . . . . . . . . . . . . (166) (1,449) 187 161 172 (1,095)
Deferred tax on other temporary differences includes items such as the thalidomide provision,restructuring provisions, share-based payments and intra group sales of products.
218

Notes to the consolidated financial statements (continued)
26. Deferred tax assets and liabilities (continued)
After offsetting deferred tax assets and liabilities where appropriate within territories, the netdeferred tax liability comprises:
2012 2011
£ million £ million
Deferred tax assets . . . . . . . . . . . . . . . . . . . . . . . . . . . . . . . . . . . . . . . . . . . . . . . 329 516Deferred tax liabilities . . . . . . . . . . . . . . . . . . . . . . . . . . . . . . . . . . . . . . . . . . . . (1,424) (777)
(1,095) (261)
The net deferred tax liability of £1,449 million (2011 – £613 million) in respect of intangible assetscomprises deferred tax assets of £39 million (2011 – £590 million) less deferred tax liabilities of£1,488 million (2011 – £1,203 million). The group benefits from the availability of tax amortisation onsome of its principal brands and other intangible assets. During the year ended 30 June 2012negotiations with tax authorities were concluded, the outcome of which was a favourable change intaxation basis of certain overseas profits that replaced the benefit of some future amortisation. Thisresulted in a write off of the related deferred tax assets of £524 million. This has been accounted for asan exceptional item. Deferred tax assets of £153 million (2011 – £107 million) have been recognised injurisdictions with prior year taxable losses. It is considered more likely than not that there will besufficient future taxable profits to support recognition of these deferred tax assets.
Unrecognised deferred tax assets Deferred tax assets have been recognised to the extent that it isconsidered more likely than not that there will be suitable taxable profits from which the futurereversal of the underlying timing differences can be deducted. Where this is not the case, deferred taxassets have not been recognised, as set out below:
2012 2011
Tax losses Other Tax losses Other
£ million £ million £ million £ million
Gross deferred tax assets . . . . . . . . . . . . . . . . . . . . . . . . . . . 319 39 317 623Amounts not recognised . . . . . . . . . . . . . . . . . . . . . . . . . . . . (158) — (204) (33)
161 39 113 590
Of the amounts recognised in respect of tax losses, £19 million has expiration dates through to 2022(2011 – £16 million through to 2021) and £142 million can be carried forward indefinitely (2011 –£97 million). Of the amounts unrecognised in respect of tax losses, £7 million has expiration datesthrough to 2022 (2011 – £7 million through to 2021) and £151 million (2011 – £197 million) can becarried forward indefinitely.
Unrecognised deferred tax liabilities No deferred tax liability is provided in respect of any futureremittance of earnings of foreign subsidiaries where the group is able to control the remittance ofearnings and it is probable that such earnings will not be remitted in the foreseeable future, or whereno liability would arise on the remittance. It is not practicable to estimate the amount of unrecogniseddeferred tax liabilities in respect of these unremitted earnings.
The aggregate amount of temporary difference associated with investments in subsidiaries,branches interests in joint ventures and associates for which deferred tax liabilities have not beenrecognised is £16.6 billion (2011 – £15.2 billion). This has been calculated based upon the temporarydifferences arising between the carrying value in the consolidated financial statements and the tax basisof each investment.
219

Notes to the consolidated financial statements (continued)
27. Other comprehensive income
Totalattributable
Retained to parentHedging Exchange earnings/ company Non-controlling
reserve reserve (deficit) shareholders interests Total
£ million £ million £ million £ million £ million £ million
2012Exchange differences on translation of
foreign operations excluding borrowings– group . . . . . . . . . . . . . . . . . . . . . . . . . . — (74) — (74) — (74)– associates and non-controlling interests* . — (240) — (240) 18 (222)Exchange differences on borrowings and
derivative net investment hedges . . . . . . — 210 — 210 — 210Effective portion of changes in fair value of
cash flow hedges– taken to other comprehensive income . . . 29 — — 29 — 29– transferred to income statement . . . . . . . (15) — — (15) — (15)Hyperinflation adjustment . . . . . . . . . . . . . — — 3 3 — 3Net actuarial loss on post employment
plans . . . . . . . . . . . . . . . . . . . . . . . . . . — — (495) (495) — (495)
Other comprehensive income/(loss) beforetaxation . . . . . . . . . . . . . . . . . . . . . . . . 14 (104) (492) (582) 18 (564)
Tax on exchange differences . . . . . . . . . . . — 7 — 7 — 7Tax on effective portion of changes in fair
value of cash flow hedges . . . . . . . . . . . . (4) — — (4) — (4)Tax on net actuarial loss on post
employment plans . . . . . . . . . . . . . . . . . — — 100 100 — 100
Tax on other comprehensive income/(loss) . (4) 7 100 103 — 103
Other comprehensive income/(loss) forthe year . . . . . . . . . . . . . . . . . . . . . . . . 10 (97) (392) (479) 18 (461)
2011Exchange differences on translation of
foreign operations excluding borrowings– group . . . . . . . . . . . . . . . . . . . . . . . . . . — (133) — (133) — (133)– associates and non-controlling interests . . — 157 — 157 (64) 93Exchange differences on borrowings and
derivative net investment hedges . . . . . . — (51) — (51) — (51)Effective portion of changes in fair value of
cash flow hedges– taken to other comprehensive income . . . 25 — — 25 — 25– transferred to income statement . . . . . . . 56 — — 56 — 56Hyperinflation adjustment . . . . . . . . . . . . . — — 6 6 — 6Net actuarial gain on post employment
plans . . . . . . . . . . . . . . . . . . . . . . . . . . — — 272 272 — 272
220
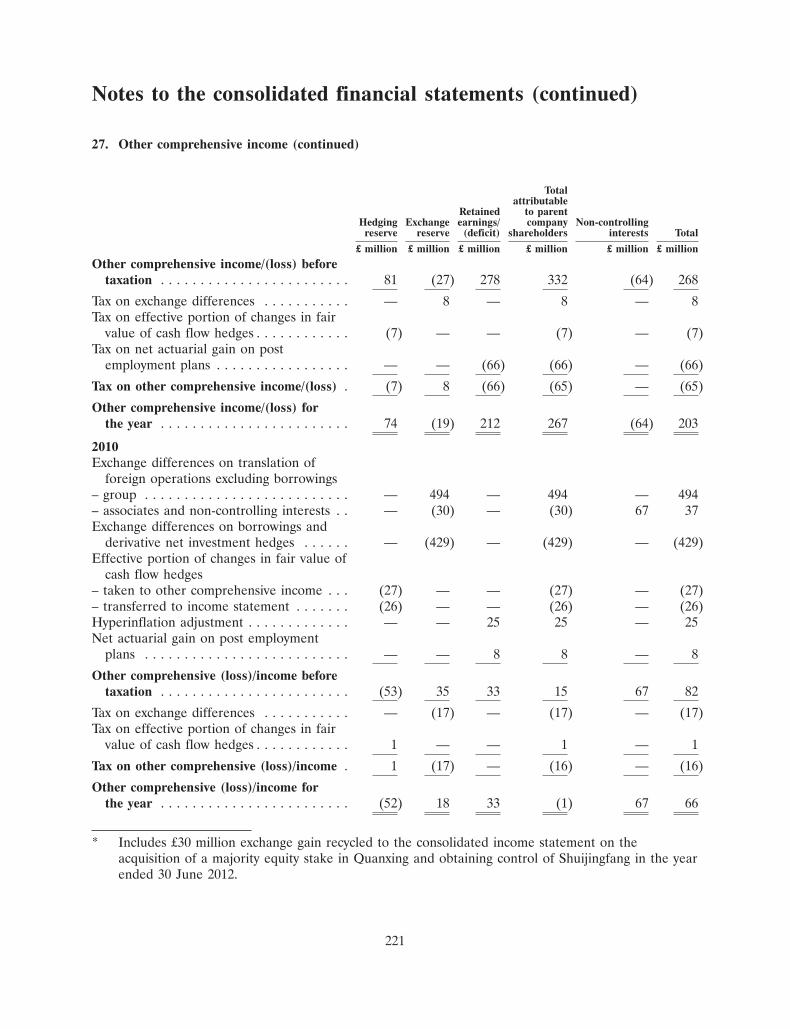
Notes to the consolidated financial statements (continued)
27. Other comprehensive income (continued)
Totalattributable
Retained to parentHedging Exchange earnings/ company Non-controlling
reserve reserve (deficit) shareholders interests Total
£ million £ million £ million £ million £ million £ million
Other comprehensive income/(loss) beforetaxation . . . . . . . . . . . . . . . . . . . . . . . . 81 (27) 278 332 (64) 268
Tax on exchange differences . . . . . . . . . . . — 8 — 8 — 8Tax on effective portion of changes in fair
value of cash flow hedges . . . . . . . . . . . . (7) — — (7) — (7)Tax on net actuarial gain on post
employment plans . . . . . . . . . . . . . . . . . — — (66) (66) — (66)
Tax on other comprehensive income/(loss) . (7) 8 (66) (65) — (65)
Other comprehensive income/(loss) forthe year . . . . . . . . . . . . . . . . . . . . . . . . 74 (19) 212 267 (64) 203
2010Exchange differences on translation of
foreign operations excluding borrowings– group . . . . . . . . . . . . . . . . . . . . . . . . . . — 494 — 494 — 494– associates and non-controlling interests . . — (30) — (30) 67 37Exchange differences on borrowings and
derivative net investment hedges . . . . . . — (429) — (429) — (429)Effective portion of changes in fair value of
cash flow hedges– taken to other comprehensive income . . . (27) — — (27) — (27)– transferred to income statement . . . . . . . (26) — — (26) — (26)Hyperinflation adjustment . . . . . . . . . . . . . — — 25 25 — 25Net actuarial gain on post employment
plans . . . . . . . . . . . . . . . . . . . . . . . . . . — — 8 8 — 8
Other comprehensive (loss)/income beforetaxation . . . . . . . . . . . . . . . . . . . . . . . . (53) 35 33 15 67 82
Tax on exchange differences . . . . . . . . . . . — (17) — (17) — (17)Tax on effective portion of changes in fair
value of cash flow hedges . . . . . . . . . . . . 1 — — 1 — 1
Tax on other comprehensive (loss)/income . 1 (17) — (16) — (16)
Other comprehensive (loss)/income forthe year . . . . . . . . . . . . . . . . . . . . . . . . (52) 18 33 (1) 67 66
* Includes £30 million exchange gain recycled to the consolidated income statement on theacquisition of a majority equity stake in Quanxing and obtaining control of Shuijingfang in the yearended 30 June 2012.
221

Notes to the consolidated financial statements (continued)
28. Share capital and reserves
(a) Allotted and fully paid share capital – ordinary shares of 28101⁄108 pence eachNumber Nominal
of shares value
million £ million
At 30 June 2012, 30 June 2011 and 30 June 2010 . . . . . . . . . . . . . . . . . . . . . . . . . 2,754 797
(b) Share premium During the year, 0.1 million ordinary shares with an aggregate nominal value ofless than £0.1 million were allotted under employee share option schemes for a total consideration of£1 million (2011 – 0.1 million shares, nominal value less than £0.1 million, consideration £0.4 million;2010 – 0.1 million shares, nominal value less than £0.1 million, consideration £0.4 million).
(c) Hedging and exchange reserve At 30 June 2012 the hedging reserve and exchange reservecomprised a credit of £74 million and a deficit of £7 million, respectively (2011 – £64 million credit and£90 million credit, respectively; 2010 – a deficit of £10 million and a credit of £109 million,respectively).
(d) Own shares Own shares comprise shares in the company held by employee share trusts, sharesrepurchased as part of the company’s share buyback programmes and held as treasury shares, sharesheld as treasury shares and call options held for hedging share scheme grants provided to employees.Movements in own shares are as follows:
222
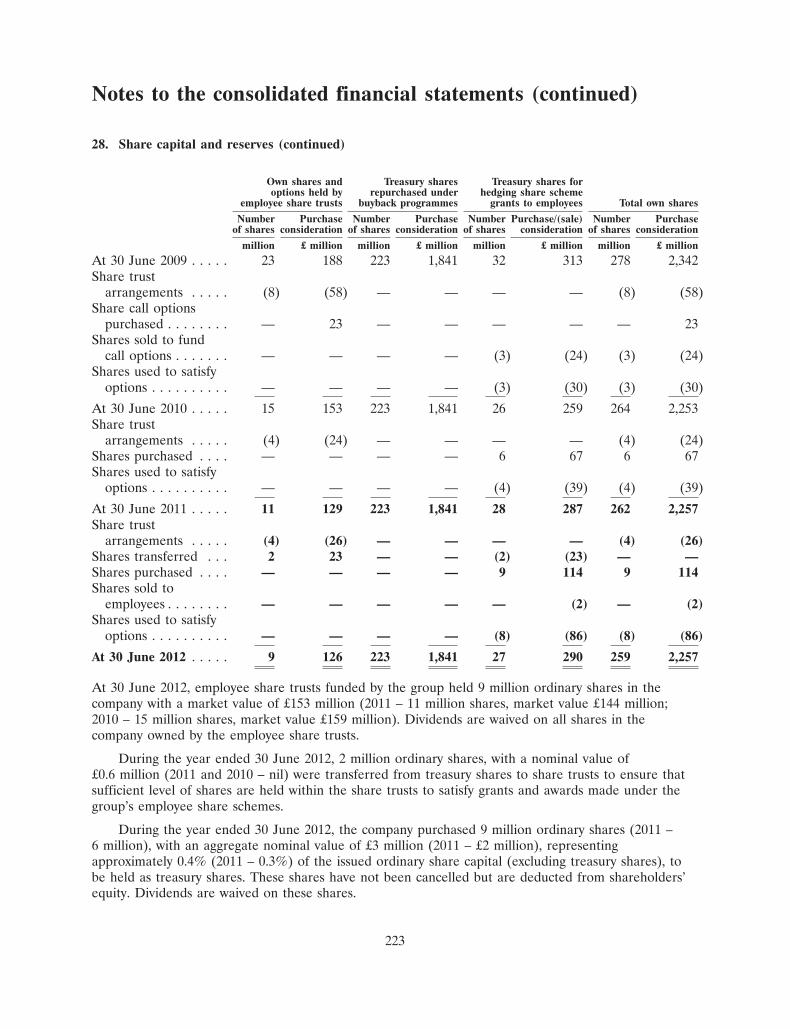
Notes to the consolidated financial statements (continued)
28. Share capital and reserves (continued)
Own shares and Treasury shares Treasury shares foroptions held by repurchased under hedging share scheme
employee share trusts buyback programmes grants to employees Total own shares
Number Purchase Number Purchase Number Purchase/(sale) Number Purchaseof shares consideration of shares consideration of shares consideration of shares consideration
million £ million million £ million million £ million million £ million
At 30 June 2009 . . . . . 23 188 223 1,841 32 313 278 2,342Share trust
arrangements . . . . . (8) (58) — — — — (8) (58)Share call options
purchased . . . . . . . . — 23 — — — — — 23Shares sold to fund
call options . . . . . . . — — — — (3) (24) (3) (24)Shares used to satisfy
options . . . . . . . . . . — — — — (3) (30) (3) (30)
At 30 June 2010 . . . . . 15 153 223 1,841 26 259 264 2,253Share trust
arrangements . . . . . (4) (24) — — — — (4) (24)Shares purchased . . . . — — — — 6 67 6 67Shares used to satisfy
options . . . . . . . . . . — — — — (4) (39) (4) (39)
At 30 June 2011 . . . . . 11 129 223 1,841 28 287 262 2,257Share trust
arrangements . . . . . (4) (26) — — — — (4) (26)Shares transferred . . . 2 23 — — (2) (23) — —Shares purchased . . . . — — — — 9 114 9 114Shares sold to
employees . . . . . . . . — — — — — (2) — (2)Shares used to satisfy
options . . . . . . . . . . — — — — (8) (86) (8) (86)
At 30 June 2012 . . . . . 9 126 223 1,841 27 290 259 2,257
At 30 June 2012, employee share trusts funded by the group held 9 million ordinary shares in thecompany with a market value of £153 million (2011 – 11 million shares, market value £144 million;2010 – 15 million shares, market value £159 million). Dividends are waived on all shares in thecompany owned by the employee share trusts.
During the year ended 30 June 2012, 2 million ordinary shares, with a nominal value of£0.6 million (2011 and 2010 – nil) were transferred from treasury shares to share trusts to ensure thatsufficient level of shares are held within the share trusts to satisfy grants and awards made under thegroup’s employee share schemes.
During the year ended 30 June 2012, the company purchased 9 million ordinary shares (2011 –6 million), with an aggregate nominal value of £3 million (2011 – £2 million), representingapproximately 0.4% (2011 – 0.3%) of the issued ordinary share capital (excluding treasury shares), tobe held as treasury shares. These shares have not been cancelled but are deducted from shareholders’equity. Dividends are waived on these shares.
223

Notes to the consolidated financial statements (continued)
28. Share capital and reserves (continued)
During the year ended 30 June 2012 the company sold 0.1 million ordinary shares held as treasuryshares with an aggregate nominal value of less than £0.1 million, to employees under the Internationalsharematch plan (2011 and 2010 – nil).
The company utilised 8 million ordinary shares held as treasury shares, with an aggregate nominalvalue of £2 million, to satisfy options exercised by employees during the year (2011 – 4 million shares,nominal value of £1 million; 2010 – 3 million shares, nominal value of £1 million).
During the year ended 30 June 2010 the company sold 3 million ordinary shares held as treasuryshares, with an aggregate nominal value of £1 million, to purchase call options over 8 million shares ata cost of £24 million to hedge share option grants. These options are held by the employee share trust.Call options denominated in US dollars with a value of £1 million were included in other financialassets.
(e) Dividends
2012 2011 2010
£ million £ million £ million
Amounts recognised as distributions to equity shareholders in the yearFinal dividend for the year ended 30 June 201124.9 pence per share (2010 – 23.5 pence; 2009 – 22.2 pence) . . . . . . . . 621 586 551Interim dividend for the year ended 30 June 201216.6 pence per share (2011 – 15.5 pence; 2010 – 14.6 pence) . . . . . . . . 415 387 363
1,036 973 914
Proposed final dividend for the year ended 30 June 201226.9 pence per share (2011 – 24.9 pence; 2010 – 23.5 pence) . . . . . . . . 671 621 586
The proposed final dividend was approved by the board of directors on 22 August 2012. As this wasafter the balance sheet date and the dividend is subject to approval by shareholders at the AnnualGeneral Meeting, this dividend has not been included as a liability in these consolidated financialstatements. There are no corporate tax consequences arising from this treatment.
224

Notes to the consolidated financial statements (continued)
29. Cash generated from operations
2011 20102012 (restated) (restated)
£ million £ million £ million £ million £ million £ million
Profit for the year . . . . . . . . . . . . . . . . . . . 2,072 2,017 1,743Discontinued operations . . . . . . . . . . . . . . . 11 — 19Taxation . . . . . . . . . . . . . . . . . . . . . . . . . . 1,038 343 477Share of associates’ profits after tax . . . . . . (213) (176) (142)Net interest and net other finance charges . . 397 397 462(Gain)/loss on sale of businesses . . . . . . . . . (147) 14 15
Operating profit . . . . . . . . . . . . . . . . . . . . 3,158 2,595 2,574Increase in inventories . . . . . . . . . . . . . . . . (338) (204) (104)(Increase)/decrease in trade and other
receivables . . . . . . . . . . . . . . . . . . . . . . . (218) 62 69Increase in trade and other payables and
provisions . . . . . . . . . . . . . . . . . . . . . . . . 27 32 364
Net movement in working capital . . . . . . . . (529) (110) 329Depreciation, amortisation and impairment . 411 352 372Dividend income . . . . . . . . . . . . . . . . . . . . 166 138 111Other items . . . . . . . . . . . . . . . . . . . . . . . . (201) (116) (211)
Cash generated from operations . . . . . . . . . 3,005 2,859 3,175
Comparatives have been restated following a change in the disclosure of dividends paid tonon-controlling interests and transaction costs incurred in respect of business acquisitions (see note 1).
Cash generated from operations is stated after £158 million (2011 – £259 million; 2010 –£145 million) of cash outflows in respect of exceptional operating items.
Other items include £200 million of cash contributions to post employment schemes in excess ofthe income statement impact (2011 – £119 million; 2010 – £114 million) and gains on sale of propertyof £19 million (2011 – £20 million; 2010 – £89 million) partly offset by the fair value charge in respectof share-based incentive plans of £36 million (2011 – £34 million; 2010 – £31 million).
225

Notes to the consolidated financial statements (continued)
30. Acquisition of businesses and purchase of shares of non-controlling interests
Net assets acquired and consideration
Quanxingand 2012
Mey Icki Zacapa Meta Shuijingfang Other Total 2011 2010
£ million £ million £ million £ million £ million £ million £ million £ million
Brands and computer software . 647 119 55 538 — 1,359 6 62Property, plant and equipment . 117 10 13 46 — 186 64 2Investments . . . . . . . . . . . . . . . — — — 8 28 36 40 —Inventories . . . . . . . . . . . . . . . . 44 19 6 66 — 135 3 —Assets and liabilities held for
sale . . . . . . . . . . . . . . . . . . . — — — 58 — 58 — —Other working capital . . . . . . . . 12 — (2) (59) — (49) (14) (1)Taxation . . . . . . . . . . . . . . . . . . (147) — (18) (135) — (300) (10) (2)Cash . . . . . . . . . . . . . . . . . . . . 38 2 — 57 — 97 — 4Borrowings . . . . . . . . . . . . . . . . — — (5) — — (5) (22) —Post employment benefit
liabilities . . . . . . . . . . . . . . . . (2) — — — — (2) — —
Fair value of assets andliabilities . . . . . . . . . . . . . . . 709 150 49 579 28 1,515 67 65
Goodwill arising on acquisition . 590 97 99 105 — 891 31 19Step acquisition . . . . . . . . . . . . — — — (219) — (219) — (21)Non-controlling interests . . . . . . (1) — — (451) — (452) (20) —
Consideration payable . . . . . . . 1,298 247 148 14 28 1,735 78 63
Satisfied by:Cash consideration paid . . . . . . 1,298 120 145 14 28 1,605 73 37Financial liabilities . . . . . . . . . . — 97 — — — 97 (1) —Deferred/contingent
consideration payable . . . . . . — 30 3 — — 33 6 26
1,298 247 148 14 28 1,735 78 63
Cash consideration paid forinvestments in subsidiaries . . . 1,298 120 145 14 — 1,577 33 37
Cash consideration paid forinvestments in associates . . . . — — — — 48 48 58 41
Cash acquired . . . . . . . . . . . . . (38) (2) — (57) — (97) — (4)Purchase consideration paid in
respect of prior yearacquisitions . . . . . . . . . . . . . . — — — — 7 7 6 —
Deposit (received)/paid . . . . . . . — — — (115) — (115) — 123
Net cash outflow/(inflow) onacquisition of businesses* . . . 1,260 118 145 (158) 55 1,420 97 197
226

Notes to the consolidated financial statements (continued)
30. Acquisition of businesses and purchase of shares of non-controlling interests (continued)
Purchase of shares of non-controlling interests
2012
£ million
Kenya Breweries . . . . . . . . . . . . . . . . . . . . . . . . . . . . . . . . . . . . . . . . . . . . . . . . . . . . . . . . 140Philippines . . . . . . . . . . . . . . . . . . . . . . . . . . . . . . . . . . . . . . . . . . . . . . . . . . . . . . . . . . . . . 15
155
* The group has revised the disclosure of the directly attributable acquisition costs in theconsolidated statement of cash flow. In the year ended 30 June 2012 these costs of £47 million(2011 – £20 million; 2010 – £9 million) have been included in cash flow from operating activitiesrather than cash flow from investing activities.
2012 acquisitions
Mey Icki On 23 August 2011, Diageo completed the acquisition of 100% of Mey Icki Sanayi veTicaret A.S. (Mey Icki) from TPG Capital and the Actera group for $2,129 million (£1,298 million).Mey Icki is the leading producer and distributor of raki in Turkey and also owns vodka and winebrands. Mey Icki has been consolidated from 23 August 2011. Directly attributable transaction andintegration costs of £11 million have been charged to other external charges in the year. Sinceacquisition Mey Icki has contributed £705 million to sales, £291 million to net sales and £95 million tooperating profit (net of £11 million transaction and integration costs).
Zacapa On 5 July 2011, Diageo completed the acquisition of a 50% equity controlling stake in RumCreations Products Inc (RCP), the owner of the Zacapa rum brand, from Industrias Licorerasde Guatemala (ILG), for a cash consideration of $240 million (£150 million) (including deferred andcontingent consideration of $48 million (£30 million)). ILG has a put option to sell the remaining 50%equity stake exercisable from 2016 calculated on a profit multiple. The net present value of thisfinancial liability was $155 million (£97 million) at acquisition. In addition, the transaction providedDiageo with perpetual global distribution rights for Zacapa rum, excluding those for Guatemala andthe domestic markets of El Salvador, Honduras, Nicaragua, Costa Rica, Belize and Panama. Diageoconsolidates the results of RCP. Directly attributable transaction costs of £1 million have been chargedto other external charges in the year. In the period since acquisition the additional contribution of theZacapa brand to operating profit was £8 million (net of £1 million transaction costs).
Quanxing and Shuijingfang On 14 July 2011, Diageo acquired an additional 4% equity stake inSichuan Chengdu Quanxing Group Company Ltd. (Quanxing) from Chengdu Yingsheng InvestmentHolding Co., Ltd. The consideration for the additional 4% equity stake was CNY 140 million(£14 million). The acquisition of the 4% equity stake brought Diageo’s shareholding in Quanxing to53%. Quanxing was accounted for as an associate up to 14 July 2011 but following the acquisition ofthe additional 4% equity stake it became a subsidiary with a 47% non-controlling interest. Quanxing isprimarily a holding company controlling a 39.7% equity stake in Sichuan Shuijingfang Co., Ltd.(Shuijingfang), a super premium Chinese white spirits company listed on the Shanghai Stock Exchange.During the year ended 30 June 2010 £123 million was deposited with China’s securities depositary andclearing agency in respect of the tender offer to all other shareholders of Shuijingfang. During the yearended 30 June 2012, Diageo received approval from the Chinese Securities Regulatory Commission tolaunch, and Diageo did launch and settle, the mandatory tender offer to all the other shareholders of
227

Notes to the consolidated financial statements (continued)
30. Acquisition of businesses and purchase of shares of non-controlling interests (continued)
Shuijingfang. A nominal amount of shares of Shuijingfang were tendered into the offer and the depositwas returned to Diageo.
On 29 June 2012 at the annual general meeting additional Diageo directors were appointed to theboard of Shuijingfang which gave Diageo control over the board and the operating and financialpolicies of the company. Up to 29 June 2012 Diageo accounted for Shuijingfang as an associate andfollowing the change in control on 29 June 2012 it became a subsidiary. As a result of Quanxing andShuijingfang becoming subsidiaries of the group, a gain of £124 million arose on the difference betweenthe book value of the equity owned prior to the transactions and the market values on the completiondates which has been disclosed as a sale of businesses in the consolidated income statement. Thenon-controlling interest in Shuijingfang has been calculated as 79% of the fair value of the net assets ofthe company and the non-controlling interest in Quanxing has been valued at 47% of the fair value ofits net assets. The fair values of the net assets disclosed are provisional and have been estimated byDiageo based on information obtained in accordance with all relevant Chinese laws and regulations.The fair values will be finalised in the year ending 30 June 2013.
The goodwill arising on the transaction represents the strategic premium in respect of entering theChinese white spirits market and the synergies arising from combining operations. Directly attributabletransaction and integration costs of £16 million have been charged to other external charges in theyear.
Meta On 9 January 2012, Diageo completed the acquisition of Meta Abo Brewery Share Company SC(Meta) from the government of Ethiopia for a cash consideration of $225 million (£148 million). Metaproduces and distributes the Meta beer brand. Directly attributable transaction and integration costs of£3 million have been charged to other external charges in the year. In the period since acquisition thecontribution (net of transaction and integration costs) to sales, net sales and operating profit was£16 million, £13 million and £nil, respectively. The fair values will be finalised in the year ending30 June 2013.
Halico During the year Diageo completed in tranches the acquisition of an additional 20.6% (2011 –24.9%) equity stake in Hanoi Joint Stock Company (Halico), the largest domestic branded spiritsproducer in Vietnam for a consideration of £28 million (2011 – £32 million). As a consequence Diageoowns 45.5% of the equity of Halico and equity accounts for this investment. Transaction costs on theacquisition were not material (2011 – £2 million).
The goodwill acquired in respect of the above acquisitions represents synergies arising from combiningoperations, intangible assets that do not qualify for separate recognition and the extension of thegroup’s portfolio in other markets around the world. None of the goodwill recognised is expected to bedeductible for income tax purposes. If the acquisitions had been completed on 1 July 2011 the group’ssales, net sales and operating profit for the year would have increased by £293 million, £207 million and£73 million, respectively.
Purchase of shares of non-controlling interests
Kenya Breweries On 25 November 2011, Diageo completed the acquisition of SABMiller Africa BV’s20% non-controlling equity stake in Kenya Breweries Limited (Kenya Breweries), through its subsidiaryundertaking, East African Breweries Limited, of which Diageo owns 50.03%, for a cash considerationof 19.5 billion Kenyan shillings (£134 million). Transaction costs of £6 million have been incurred andcharged to other retained earnings. As a result, Diageo owns 100% of Kenya Breweries. Kenya
228

Notes to the consolidated financial statements (continued)
30. Acquisition of businesses and purchase of shares of non-controlling interests (continued)
Breweries terminated a brewing and distribution agreement with SABMiller International BV on31 May 2011 and has ceased to distribute SABMiller’s brands in Kenya.
Philippines In December 2011, Diageo completed the acquisition of Carlos Palanca Group’s 49%non-controlling equity stake in Diageo Philippines Inc (DPI) for £15 million and became the soleshareholder. DPI produces, imports, exports and distributes Diageo’s brands throughout thePhilippines. Transaction costs were not material.
2011 acquisitions
Serengeti Breweries On 22 October 2010, Diageo completed the acquisition of a 51% equity stake inSerengeti Breweries Limited (SBL), a beer business based in Tanzania, through its subsidiaryundertaking, East African Breweries Limited of which Diageo owns 50.03%. The fair value of purchaseconsideration payable was £60 million, including borrowings acquired of £22 million. Transaction costsof £2 million (2010 – £5 million) in respect of the acquisition were charged to operating profit. Diageoconsolidates 100% of SBL with a 75% non-controlling interest and has a call option for the remaining49% of equity exercisable in 2013, calculated on a profit multiple of SBL. None of the goodwillrecognised is expected to be deductible for income tax purposes.
22 Marquis On 30 September 2010, Diageo acquired a 20% equity stake in LNJ Group, LLC, ownerof the 22 Marquis brand, a sparkling liqueur, for a consideration of £6 million. Depending on theperformance of the brand in the first three years following the acquisition Diageo has a contractualright to increase its ownership to 50% without additional consideration. Diageo also has an option topurchase the remaining 50% equity stake in 2014 at a pre-agreed profit multiple reflecting fair value.Diageo equity accounts for this investment.
2010 acquisitions
Nuvo On 29 June 2010 Diageo acquired an additional 28.75% equity stake in the London Group, theowner of the Nuvo brand, an ultra-premium vodka-based sparkling liqueur, for a consideration of£29 million. The London Group was formerly accounted for as an associate and following theacquisition of further shares became a subsidiary.
For all of the above acquisitions the non-controlling interests were recognised at the proportionateshare of net assets acquired.
Acquisitions after 30 June 2012
Ypioca On 9 August 2012, Diageo completed the acquisition of 100% of the equity of YpiocaBebidas S.A. (Ypioca) from Ypioca Agroindustrial Limitada for a cash consideration of BRL900 million (£284 million). Ypioca is a leading producer and distributor of a cachaca brand, Ypioca inBrazil. Ypioca will be consolidated and for the year ended 31 December 2011 had net sales of BRL177 million (£56 million). The fair value assessment has not been completed and an analysis of the netassets acquired is not disclosed as the acquisition was completed only two weeks prior to the financialstatements being signed. Directly attributable transaction costs of £7 million have been charged to otherexternal charges in the year.
229

Notes to the consolidated financial statements (continued)
31. Contingent liabilities and legal proceedings
(a) Guarantees As of 30 June 2012 the group has no material performance guarantees orindemnities to third parties.
(b) Colombian litigation An action was filed on 8 October 2004 in the United States District Courtfor the Eastern District of New York by the Republic of Colombia and a number of its localgovernment entities against Diageo and other spirits companies. The complaint alleges several causes ofaction. Included among the causes of action is a claim that the defendants allegedly violated theFederal RICO Act by facilitating money laundering in Colombia through their supposed involvement inthe contraband trade to the detriment of government owned spirits production and distributionbusinesses. Diageo is unable to quantify meaningfully the possible loss or range of loss to which thelawsuit may give rise. Diageo intends to defend itself vigorously against this lawsuit.
(c) Korean customs dispute Litigation is ongoing in Korea in connection with the application of themethodology used in transfer pricing on spirits imports since 2004. In December 2009, Diageo Koreareceived a final customs audit assessment notice from the Korean customs authorities, covering theperiod from 1 February 2004 to 30 June 2007, for Korean won 194 billion or £108 million (including£13 million of value added tax), which was paid in full and appealed to the Korean Tax Tribunal.
On 18 May 2011, the Tax Tribunal made a determination that the statute of limitations had run forpart of the assessment period, ordered a partial penalty refund and instructed the Korean customsauthorities to reinvestigate the remaining assessments. Accordingly, a refund of Korean won 43 billionor £24 million (including £2 million of value added tax) was made to Diageo Korea.
However, post the completion of the reinvestigation, the Korean customs authorities haveconcluded that they will continue to pursue the application of the same methodology and on18 October 2011 a further final imposition notice was issued for Korean won 217 billion or£120 million (including £13 million of value added tax) in respect of the period from 29 February 2008to 31 October 2010.
In response Diageo Korea filed a claim with the Seoul Administrative Court along with a petitionfor preliminary injunction to stay the final imposition notice. The Seoul Administrative Court grantedDiageo Korea’s request for preliminary injunction and stayed the final imposition until 30 September2012.
The underlying matter is currently in progress with the Seoul Administrative Court and DiageoKorea is unable to quantify meaningfully the possible loss or range of loss to which these claims maygive rise. Diageo Korea continues to defend its position vigorously.
(d) Ketel One vodka put option The Nolet Group has an option exercisable from 9 June 2011 to9 June 2013 to sell its 50% equity stake in Ketel One Worldwide BV to Diageo for a totalconsideration of $900 million (£573 million) plus 5.5% annual interest calculated from the date of theoriginal acquisition on 9 June 2008. If the Nolet Group exercises this option but Diageo chooses not tobuy the stake, Diageo will then have to pay $100 million (£64 million) to the Nolet Group and theNolet Group may then pursue a sale of its stake to a third party, subject to rights of first offer and lastrefusal on Diageo’s part.
(e) Thalidomide litigation In Australia, a class action claim alleging product liability and negligencefor injuries arising from the consumption of the drug thalidomide has been filed in the Supreme Courtof Victoria against Distillers Company (Biochemicals) Limited, its parent Diageo Scotland Limited(formerly Distillers Company Limited), as well as against Grunenthal GmbH, the developer of the
230

Notes to the consolidated financial statements (continued)
31. Contingent liabilities and legal proceedings (continued)
drug. The size of the class is not yet known. On 18 July 2012 Diageo settled the claim of the leadclaimant Lynette Rowe and agreed a process to consider the remaining claimants in the class. Toenable this process to occur, Lynette Rowe and her legal representatives have agreed not to take anystep towards a trial of any issue in the litigation before 31 August 2013. In the United Kingdom,proceedings have twice been commenced but lapsed for lack of service. Distillers Company(Biochemicals) Limited distributed the drug in Australia and the United Kingdom for a period in thelate 1950s and early 1960s. Diageo is unable to quantify meaningfully the possible loss or range of lossto which these lawsuits may give rise. The company has worked voluntarily for many years with variousthalidomide organisations and has provided significant financial support.
(f) Other The group has extensive international operations and is defendant in a number of legal,customs and tax proceedings incidental to these operations. There are a number of legal, customs andtax claims against the group, the outcome of which cannot at present be foreseen.
Save as disclosed above, neither Diageo, nor any member of the Diageo group, is or has beenengaged in, nor (so far as Diageo is aware) is there pending or threatened by or against it, any legal orarbitration proceedings which may have a significant effect on the financial position of the Diageogroup.
32. Related party transactions
Transactions between the group and its related parties are made on terms equivalent to those thatprevail in arm’s length transactions.
Subsidiaries Transactions between the company and its subsidiaries are eliminated on consolidationand therefore are not disclosed. Details of the principal group companies are given after these financialstatements.
Associates and joint ventures Sales and purchases to and from associates and joint ventures areprincipally in respect of premium drinks products but also include the provision of managementservices. All transactions are on terms equivalent to those in an arm’s length transaction.
231

Notes to the consolidated financial statements (continued)
32. Related party transactions (continued)
2012 2011 2010
£ million £ million £ million
Income statement itemsSales to associates . . . . . . . . . . . . . . . . . . . . . . . . . . . . . . . . . . . . . . . . . 37 46 74Purchases from associates* . . . . . . . . . . . . . . . . . . . . . . . . . . . . . . . . . . 22 26 27Sales to joint ventures . . . . . . . . . . . . . . . . . . . . . . . . . . . . . . . . . . . . . . 5 5 5Purchases from joint ventures . . . . . . . . . . . . . . . . . . . . . . . . . . . . . . . . 41 21 17
Balance sheet itemsGroup payables to associates . . . . . . . . . . . . . . . . . . . . . . . . . . . . . . . . . 1 8 9Group receivables from associates . . . . . . . . . . . . . . . . . . . . . . . . . . . . . 2 — 2Loans receivable from associates . . . . . . . . . . . . . . . . . . . . . . . . . . . . . . 57 63 57Group payables to joint ventures . . . . . . . . . . . . . . . . . . . . . . . . . . . . . . 1 3 2Group receivables from joint ventures . . . . . . . . . . . . . . . . . . . . . . . . . . 3 7 7
Cash flow items
Loans and equity contribution to associates . . . . . . . . . . . . . . . . . . . . . . 27 22 64
* Including purchase of maturing inventories from Moet Hennessy of £9 million (2011 – £9 million;2010 – £8 million).
Other disclosures in respect of associates are included in note 7 and note 14.
Key management personnel The key management of the group comprises the executive andnon-executive directors, the members of the executive committee and the company secretary. They arelisted under ‘Board of directors and executive committee’.
2012 2011 2010
£ million £ million £ million
Salaries and short term employee benefits . . . . . . . . . . . . . . . . . . . . . . . 18 20 21Non-executive directors’ fees . . . . . . . . . . . . . . . . . . . . . . . . . . . . . . . . . 1 1 1Share-based payments . . . . . . . . . . . . . . . . . . . . . . . . . . . . . . . . . . . . . . 9 10 10Post employment benefits . . . . . . . . . . . . . . . . . . . . . . . . . . . . . . . . . . . 1 4 4Termination benefits . . . . . . . . . . . . . . . . . . . . . . . . . . . . . . . . . . . . . . . — 1 —
29 36 36
Non-executive directors do not receive share-based payments or post employment benefits.
Details are given in the directors’ remuneration report of the individual directors’ remunerationand transactions between the group and key management personnel.
Pension plans The Diageo pension plans are recharged with the cost of administration servicesprovided by the company to the pension plans and with professional fees paid by the company onbehalf of the pension plans. The total amount recharged for the year was £10 million (2011 –£18 million; 2010 – £28 million).
232

Notes to the consolidated financial statements (continued)
33. Commitments
Capital expenditure Commitments for expenditure on intangibles and property, plant and equipmentnot provided for in these consolidated financial statements are estimated at £145 million (2011 –£148 million).
Operating lease commitments The minimum lease rentals to be paid under non-cancellable leases,principally in respect of properties, are as follows:
2012 2011
£ million £ million
Payments falling due:Within one year . . . . . . . . . . . . . . . . . . . . . . . . . . . . . . . . . . . . . . . . . . . . . . . . . . 94 104Between one and two years . . . . . . . . . . . . . . . . . . . . . . . . . . . . . . . . . . . . . . . . . 86 84Between two and three years . . . . . . . . . . . . . . . . . . . . . . . . . . . . . . . . . . . . . . . . 70 74Between three and four years . . . . . . . . . . . . . . . . . . . . . . . . . . . . . . . . . . . . . . . . 53 57Between four and five years . . . . . . . . . . . . . . . . . . . . . . . . . . . . . . . . . . . . . . . . . 47 49After five years . . . . . . . . . . . . . . . . . . . . . . . . . . . . . . . . . . . . . . . . . . . . . . . . . . 325 354
675 722
There are no significant leases for which contingent rent is payable, nor any that have purchaseoptions, escalation clauses or restrictions. A number of the operating leases have renewal clauses thatare all at fair market value. In respect of property not currently utilised, the group has entered intosub-leases for which the minimum amount receivable is £39 million (2011 – £44 million), of which£7 million (2011 – £9 million) falls due within one year of the balance sheet date. The amount receivedunder these leases is included in sales in the income statement.
34. Employee share compensation
The group uses a number of equity settled and cash settled share plans to grant options and shareawards to its directors and employees.
The annual fair value charge for the three years ended 30 June 2012 by principal plan is asfollows:
2012 2011 2010
£ million £ million £ million
Executive share option plansDiageo executive long term incentive plan . . . . . . . . . . . . . . . . . . . . . . . 3 2 1Diageo senior executive share option plan . . . . . . . . . . . . . . . . . . . . . . . 2 2 3Diageo executive share option plan . . . . . . . . . . . . . . . . . . . . . . . . . . . . 2 4 7Savings plans . . . . . . . . . . . . . . . . . . . . . . . . . . . . . . . . . . . . . . . . . . . . 4 4 5Executive share award plansDiageo executive long term incentive plan . . . . . . . . . . . . . . . . . . . . . . . 9 7 1Performance share plan . . . . . . . . . . . . . . . . . . . . . . . . . . . . . . . . . . . . . 11 11 10Discretionary incentive plan . . . . . . . . . . . . . . . . . . . . . . . . . . . . . . . . . . 4 4 4Cash settled . . . . . . . . . . . . . . . . . . . . . . . . . . . . . . . . . . . . . . . . . . . . . 1 — —
36 34 31
233

Notes to the consolidated financial statements (continued)
34. Employee share compensation (continued)
The fair value charge in the year ended 30 June 2011 includes operating exceptional items of £4 million(2010 – £1 million).
The principal plans are as follows:
Executive share option plans
(a) Diageo executive long term incentive plan (DELTIP) This scheme was introduced in the yearended 30 June 2010 to replace the Diageo executive share option plan. Awards made to executivesunder the plan are in the form of shares and share options at the market value at the time of grant.Executives are given the opportunity to elect to have their awards in the form of share options orshares or a combination of both. Share awards vest/are released on the third anniversary of the grantdate. Share options granted under this scheme may normally be exercised between three and ten yearsafter the grant date. There are no performance conditions to be satisfied, although the top 70 seniorexecutives are required to hold a minimum number of shares in Diageo plc. US executives are grantedawards over the company’s ADSs (one ADS is equivalent to four ordinary shares).
(b) Diageo senior executive share option plan 2008 (SESOP 2008) This scheme was introduced inOctober 2008 and grants options to senior executives at market value at the time of grant. Optionsgranted under this scheme may normally be exercised between three and ten years after the grant datebut only to the extent that a performance condition is satisfied. The current performance condition isbased on the increase in Diageo’s adjusted earnings per share (eps) over a three-year period. Growthtargets are set annually by the remuneration committee. For the 2011 grant, targets were set at 6% to10% and for the 2012 grant at 7% to 11% compound annual growth in adjusted eps. The proportion ofoptions that can be exercised depends on the extent to which the adjusted eps growth targets have beenmet. For the 2011 and 2012 grants, the exercise range is 25% for threshold performance up to 100%for achieving 10% and 11% or more compound annual growth in adjusted eps, respectively. Re-testingof the performance condition is not permitted. US executives are granted options over the company’sADSs.
(c) Diageo executive share option plan (DSOP) This scheme was introduced in December 1999 andgranted options to executives at the market value at the time of grant. The last grant made under thisscheme was in September 2009. Options granted under this scheme may normally be exercised betweenthree and ten years after the date granted.
(d) Diageo associated companies share incentive plan (DACSIP) This scheme was introduced inthe year ended 30 June 2012 and enables the company to grant shares and share options at the marketvalue at the time of grant to executives in a number of associated companies. The main terms of thescheme are the same as for DELTIP.
Savings plans
(a) UK savings-related share option scheme (SRSOS) The UK savings-related share option schemeis an HM Revenue & Customs approved scheme available to all UK employees. The scheme provides along term savings opportunity for employees who can use their savings to pay the exercise price of ashare option. Options may normally be exercised after three or five years, according to the length ofthe option period chosen by the employee, at a price that is not less than 80% of the market value ofthe shares at grant date.
234
Notes to the consolidated financial statements (continued)
34. Employee share compensation (continued)
(b) ROI savings-related share option scheme (ISRSOS) The ROI savings-related share optionscheme operates on a similar basis to the equivalent UK scheme (described above) for employeesbased in the Republic of Ireland.
(c) US employee stock purchase plan (USESPP) This plan provides a long term savings andinvestment opportunity for US employees who can use their savings to pay the exercise price of a shareoption. Options may normally be exercised after 12 months at a price equivalent to 85% of the marketvalue of the ADSs at the grant date.
(d) International sharematch plan (ISMP) This plan was introduced in September 2010 to replacethe International savings-related share option plan (described below). Employees outside the UnitedKingdom, Ireland and the United States are offered the opportunity to purchase Diageo shares orshare units and receive matching shares or share units subject to continued employment. Plan rulespermit flexibility for Diageo to set the matching amount annually based on corporate performance andto vary this by country. Target matching for the majority of the countries is buy three shares andreceive one free.
(e) International savings-related share option plan (International) The group also operated aninternational savings-related share option plan for employees outside the United Kingdom. The lastgrant made under this plan was in October 2009. The plan provided a long term savings opportunityfor employees who used their savings to pay the exercise price of a share option. Options may beexercised between one and five years after grant. The option exercise price was set at a discount to themarket value at grant date, ranging from nil to 20%, in accordance with local conditions and practices.
Executive share award plans
(a) Performance share plan (PSP 2008) This plan was introduced in October 2008 and replaced asimilar plan. Under the PSP, share awards can take a number of different forms. No payment is madefor awards. To date, participants have been granted conditional rights to receive shares. Awardsnormally vest after a three-year period – the ‘performance cycle’ – subject to achievement ofperformance tests.
235

Notes to the consolidated financial statements (continued)
34. Employee share compensation (continued)
For awards up to and including September 2010, the primary performance test is a comparison ofDiageo’s three year total shareholder return (TSR) – the percentage growth in Diageo’s share price(assuming all dividends and capital distributions are reinvested) – with the TSR of a peer group of 16companies including Diageo. TSR calculations are converted into a common currency (US dollars). Thevesting range is 25% if Diageo’s TSR produces a median ranking compared with the TSR of the peergroup companies, up to 100% if Diageo is ranked first or second in the peer group. The secondperformance test requires the remuneration committee to consider that there has been an underlyingimprovement in Diageo’s three-year financial performance, typically measured by an improvement inadjusted eps.
For awards made from September 2011, three equally weighted performance tests apply: 1) acomparison of Diageo’s three year TSR (as described above) with a peer group of 17 companiesincluding Diageo. TSR calculations are converted into a common currency (US dollars). The vestingrange is 25% if Diageo’s TSR produces a median ranking compared with the TSR of the peer groupcompanies, up to 100% if Diageo is ranked first, second or third in the peer group; 2) compoundannual growth in organic net sales over three years; 3) total organic operating margin improvementover three years. Targets for net sales and operating margin are set annually by the remunerationcommittee. The vesting range is 25% for achieving minimum performance targets, up to 100% forachieving the maximum target level.
Re-testing of the performance condition is not permitted. Dividends are accrued on awards andare given to participants to the extent that the awards actually vest at the end of the performance cycle.Dividends can be paid in the form of cash or shares.
(b) Discretionary incentive plan 2009 (DIP 2009) This scheme was introduced in October 2009 andreplaced a similar plan. Awards over shares or ADSs are granted under the plan, normally in the formof conditional rights to receive shares or ADSs. No payment is made for awards. Awards vest over athree to five year period with performance criteria varying by employee.
In certain markets DELTIP, DACSIP, ISMP and PSP work as cash alternative plans where due tolegislation and tax rules it is prohibitive to grant share options or shares settled directly in equity. Fromthe employee’s perspective it works in the same way as a normal share option or share except thatemployees do not have the right to own a share when they exercise their share options or their sharesvests.
236

Notes to the consolidated financial statements (continued)
34. Employee share compensation (continued)
For the three years ended 30 June 2012, the calculation of the fair value of each option and shareaward used the binomial (share option and savings plans) and Monte Carlo (share award plans) optionpricing models and the following weighted average assumptions:
Executive Executiveshare option Savings share award
plans plans plans
2012Risk free interest rate . . . . . . . . . . . . . . . . . . . . . . . . . . . . . 1.3% 0.9% 0.8%Expected life of the options . . . . . . . . . . . . . . . . . . . . . . . . . 60 months 35 months 36 monthsExpected volatility . . . . . . . . . . . . . . . . . . . . . . . . . . . . . . . . 15% 13% —Dividend yield . . . . . . . . . . . . . . . . . . . . . . . . . . . . . . . . . . . 3.3% 3.3% 3.3%Weighted average exercise price . . . . . . . . . . . . . . . . . . . . . . 1257p 987p —Weighted average share price . . . . . . . . . . . . . . . . . . . . . . . . 1226p 1319p 1253pWeighted average fair value of options/awards granted in
the year . . . . . . . . . . . . . . . . . . . . . . . . . . . . . . . . . . . . . . 86p 193p 869pNumber of options/awards granted in the year . . . . . . . . . . . 5.9 million 1.8 million 4.9 millionFair value of all options/awards granted in the year . . . . . . . . £5 million £3 million £43 million2011Risk free interest rate . . . . . . . . . . . . . . . . . . . . . . . . . . . . . 2.0% 1.1% 1.3%Expected life of the options . . . . . . . . . . . . . . . . . . . . . . . . . 60 months 34 months 36 monthsExpected volatility . . . . . . . . . . . . . . . . . . . . . . . . . . . . . . . . 23% 16% —Dividend yield . . . . . . . . . . . . . . . . . . . . . . . . . . . . . . . . . . . 3.3% 3.3% 3.3%Weighted average exercise price . . . . . . . . . . . . . . . . . . . . . . 1087p 908p —Weighted average share price . . . . . . . . . . . . . . . . . . . . . . . . 1098p 1162p 1214pWeighted average fair value of options/awards granted in
the year . . . . . . . . . . . . . . . . . . . . . . . . . . . . . . . . . . . . . . 171p 247p 652pNumber of options/awards granted in the year . . . . . . . . . . . 5.3 million 2.0 million 4.3 millionFair value of all options/awards granted in the year . . . . . . . . £9 million £5 million £28 million2010Risk free interest rate . . . . . . . . . . . . . . . . . . . . . . . . . . . . . 2.8% 1.8% 2.2%Expected life of the options . . . . . . . . . . . . . . . . . . . . . . . . . 60 months 36 months 36 monthsExpected volatility . . . . . . . . . . . . . . . . . . . . . . . . . . . . . . . . 18% 17% —Dividend yield . . . . . . . . . . . . . . . . . . . . . . . . . . . . . . . . . . . 3.6% 3.6% 3.6%Weighted average exercise price . . . . . . . . . . . . . . . . . . . . . . 964p 809p —Weighted average share price . . . . . . . . . . . . . . . . . . . . . . . . 986p 1030p 985pWeighted average fair value of options/awards granted in
the year . . . . . . . . . . . . . . . . . . . . . . . . . . . . . . . . . . . . . . 135p 224p 516pNumber of options/awards granted in the year . . . . . . . . . . . 8.2 million 2.8 million 4.1 millionFair value of all options/awards granted in the year . . . . . . . . £11 million £6 million £21 million
The risk free interest rate is based on the UK treasury coupon strips in effect at the time of the grant,for the expected life of the option. The expected life of the options represents the period of time thatoptions granted are expected to be outstanding. The group uses historical data to estimate optionexercise and employee termination within the valuation model. Expected volatility is based on impliedvolatilities from traded options on the group’s shares, historical volatility of the group’s shares andother factors.
237

Notes to the consolidated financial statements (continued)
34. Employee share compensation (continued)
Option holdings in the following tables are stated as ordinary share equivalents in pence. Optionsprices are translated at the following exchange rates: grants at actual exchange rates; exercises andcancellations at average exchange rates; and closing balances at year end exchange rates.
(a) Outstanding options Options over ordinary shares and over ADSs (US schemes only)outstanding at 30 June 2012 are as follows:
Weightedaverage Weighted
Range of remaining averageexercise Number at contractual exercise
prices 30 June life pricepence 2012 months pence
Executive share option plans . . . . . . . . . . . . . . . . . . . . 600-699 779,087 20 670700-799 929,816 22 733800-899 1,768,219 45 834900-999 6,528,667 71 946
1000-1099 10,920,816 85 10561100-1199 3,485,563 65 11581200-1299 5,435,533 111 12291300-1399 1,766,508 62 13461500-1599 406,754 116 1520
32,020,963 78 1065
Savings plans . . . . . . . . . . . . . . . . . . . . . . . . . . . . . . . . 600-699 218,889 16 690700-799 1,143,812 19 755800-899 1,401,622 15 840900-999 2,383,934 35 951
1000-1099 624,223 6 10271100-1199 21,739 13 1142
5,794,219 23 884
238

Notes to the consolidated financial statements (continued)
34. Employee share compensation (continued)
(b) Transactions on schemes Transactions on the share option and share award plans and theweighted average grant date fair value for options and shares for the three years ended 30 June 2012were as follows:
Executiveshare
Executive share option awardplans Savings plans plans
Weighted Weightedaverage averageexercise exercise
Number of price Number of price Number ofoptions pence options pence awards
Balance outstanding at 30 June 2009 . . . . . . 43,996,921 920 7,600,159 805 7,256,726Granted . . . . . . . . . . . . . . . . . . . . . . . . . . . 8,241,770 966 2,751,197 794 4,102,143Exercised/awarded . . . . . . . . . . . . . . . . . . . (9,116,692) 786 (2,108,686) 751 (196,894)Forfeited/expired . . . . . . . . . . . . . . . . . . . . . (1,788,598) 943 (1,083,327) 902 (1,925,184)
Balance outstanding at 30 June 2010 . . . . . . 41,333,401 1009 7,159,343 817 9,236,791Granted . . . . . . . . . . . . . . . . . . . . . . . . . . . 5,331,223 1087 2,029,288 940 4,259,304Exercised/awarded . . . . . . . . . . . . . . . . . . . (5,994,282) 901 (2,033,630) 806 (343,334)Forfeited/expired . . . . . . . . . . . . . . . . . . . . . (1,593,508) 965 (558,879) 847 (1,888,630)
Balance outstanding at 30 June 2011 . . . . . . 39,076,834 996 6,596,122 865 11,264,131Granted . . . . . . . . . . . . . . . . . . . . . . . . . . . 5,903,500 1257 1,794,909 987 4,881,856Exercised/awarded . . . . . . . . . . . . . . . . . . . (9,271,422) 974 (1,992,376) 854 (660,353)Forfeited/expired . . . . . . . . . . . . . . . . . . . . . (3,687,949) 1049 (604,436) 910 (3,488,448)
Balance outstanding at 30 June 2012 . . . . . . 32,020,963 1065 5,794,219 884 11,997,186
Number of options exercisable at:30 June 2012 . . . . . . . . . . . . . . . . . . . . . . . 15,112,388 1025 201,613 933
30 June 2011 . . . . . . . . . . . . . . . . . . . . . . . 17,194,922 967 136,758 1069
30 June 2010 . . . . . . . . . . . . . . . . . . . . . . . 16,415,347 687 78,738 916
(c) Employee share trusts, potential issues of ordinary shares and voting rights In order to hedgeits obligations under the share option and share award plans, the group either purchases own sharesdirectly and holds them as treasury shares, or it funds trusts to acquire shares in the company. Theshares held are accounted for as a deduction in arriving at shareholders’ equity. Call options are alsoused to manage some of the group’s obligations. Dividends receivable by the employee share trusts onthe shares are waived.
Shares used to satisfy the group’s obligations under the employee share plans can be newly issuedshares, treasury shares or shares purchased on the open market by the employee share trusts.
Where shares held by employee share trusts have been allocated to employee share planparticipants, they may exercise their voting rights. Where shares are held by employee share trusts andhave not been allocated to participants, the trustee abstains from voting.
239

Notes to the consolidated financial statements (continued)
35. Post balance sheet events
On 9 August 2012, Diageo completed the acquisition of 100% of the equity of Ypioca from YpiocaAgroindustrial Limitada for a cash consideration of BRL 900 million (£284 million). See note 30 forfurther details.
240

Principal group companies
This section on principal group companies forms part of the audited financial statements.
Country of Country of Percentage ofincorporation operation equity owned Business description
Subsidiaries
Diageo Ireland . . . . . . . . . . . . . . . . . Ireland Worldwide 100% Production,marketing anddistribution ofpremium drinks
Diageo Great Britain Limited . . . . . . England Worldwide 100% Marketing anddistribution ofpremium drinks
Diageo Scotland Limited . . . . . . . . . . Scotland Worldwide 100% Production,marketing anddistribution ofpremium drinks
Diageo Brands BV . . . . . . . . . . . . . . Netherlands Worldwide 100% Marketing anddistribution ofpremium drinks
Diageo North America, Inc . . . . . . . . United States Worldwide 100% Production,importing anddistribution ofpremium drinks
Diageo Capital plc(a) . . . . . . . . . . . . Scotland United Kingdom 100% Financing companyfor the group
Diageo Finance plc(a) . . . . . . . . . . . . England United Kingdom 100% Financing companyfor the group
Diageo Capital BV . . . . . . . . . . . . . . Netherlands Netherlands 100% Financing companyfor the group
Diageo Finance BV . . . . . . . . . . . . . Netherlands Netherlands 100% Financing companyfor the group
Diageo Investment Corporation . . . . . United States United States 100% Financing companyfor the US group
Associate
Moet Hennessy, SNC(b) . . . . . . . . . . France France 34% Production anddistribution ofpremium drinks
(a) Directly owned by Diageo plc.
(b) French partnership.
All percentages, unless otherwise stated, are in respect of holdings of ordinary share capital and areequivalent to the percentages of voting rights held by the group.
241

Report of independent registered public accounting firm –internal controls
The board of directors and shareholdersDiageo plc:
We have audited Diageo plc’s internal control over financial reporting as of 30 June 2012, basedon criteria established in Internal Control – Integrated Framework issued by the Committee ofSponsoring Organizations of the Treadway Commission (COSO). Diageo plc’s management isresponsible for maintaining effective internal control over financial reporting and for its assessment ofthe effectiveness of internal control over financial reporting included in the accompanyingmanagement’s report on internal control over financial reporting, appearing in the CorporateGovernance Report in Diageo plc’s Annual Report on Form 20-F. Our responsibility is to express anopinion on the Company’s internal control over financial reporting based on our audit.
We conducted our audit in accordance with the standards of the Public Company AccountingOversight Board (United States). Those standards require that we plan and perform the audit to obtainreasonable assurance about whether effective internal control over financial reporting was maintainedin all material respects. Our audit included obtaining an understanding of internal control overfinancial reporting, assessing the risk that a material weakness exists, and testing and evaluating thedesign and operating effectiveness of internal control based on the assessed risk. Our audit alsoincluded performing such other procedures as we considered necessary in the circumstances. We believethat our audit provides a reasonable basis for our opinion.
A company’s internal control over financial reporting is a process designed to provide reasonableassurance regarding the reliability of financial reporting and the preparation of financial statements forexternal purposes in accordance with generally accepted accounting principles. A company’s internalcontrol over financial reporting includes those policies and procedures that (1) pertain to themaintenance of records that, in reasonable detail, accurately and fairly reflect the transactions anddispositions of the assets of the company; (2) provide reasonable assurance that transactions arerecorded as necessary to permit preparation of financial statements in accordance with generallyaccepted accounting principles, and that receipts and expenditures of the company are being made onlyin accordance with authorizations of management and directors of the company; and (3) providereasonable assurance regarding prevention or timely detection of unauthorized acquisition, use, ordisposition of the company’s assets that could have a material effect on the financial statements.
Because of its inherent limitations, internal control over financial reporting may not prevent ordetect misstatements. Also, projections of any evaluation of effectiveness to future periods are subjectto the risk that controls may become inadequate because of changes in conditions, or that the degreeof compliance with the policies or procedures may deteriorate.
In our opinion, Diageo plc maintained, in all material respects, effective internal control overfinancial reporting as of 30 June 2012, based on criteria established in Internal Control – IntegratedFramework issued by the Committee of Sponsoring Organisations of the Treadway Commission.
We also have audited, in accordance with the standards of the Public Company AccountingOversight Board (United States), the consolidated financial statements of Diageo plc and subsidiarieson pages 144 to 240 which comprise the consolidated balance sheets as of 30 June 2012, and 2011, andthe related consolidated income statements, consolidated statements of comprehensive income,consolidated statements of changes in equity and consolidated statements of cash flows for each ofthe years in the three-year period ended 30 June 2012, including the disclosures identified as ‘part ofthe audited financial statements’ within the ‘Critical accounting policies’ section on pages 85 to 86, the
242

Report of independent registered public accounting firm –internal controls (continued)
‘Share and other interests’ on pages 119 and 120, the ‘Key management personnel related partytransactions’ on page 121 and the ‘Principal group companies’ on page 241 and our report dated22 August 2012 expressed an unqualified opinion on those consolidated financial statements.
KPMG Audit PlcLondon, England22 August 2012
243

Unaudited computation of ratio of earnings to fixed charges
Year ended 30 June
2012 2011 2010 2009 2008
£ million £ million £ million £ million £ million
EarningsIncome before taxes on income, non-controlling
interests and discontinued operations . . . . . . . . . 3,121 2,360 2,239 1,990 2,078Less: capitalised interest . . . . . . . . . . . . . . . . . . . . (5) (4) (5) (4) —Less: Share of associates’ income . . . . . . . . . . . . . (213) (176) (142) (164) (176)Add: Dividend income receivable from associates . 166 138 111 179 143Add: Fixed charges . . . . . . . . . . . . . . . . . . . . . . . 710 714 970 869 549
3,779 3,032 3,173 2,870 2,594
Fixed chargesInterest payable and other finance charges
(note (1)) . . . . . . . . . . . . . . . . . . . . . . . . . . . . . 667 675 935 836 523Add: Interest capitalised . . . . . . . . . . . . . . . . . . . . 5 4 5 4 —Add: One third of rental expense . . . . . . . . . . . . . 38 35 30 29 26
710 714 970 869 549
ratio ratio ratio ratio ratio
Ratio . . . . . . . . . . . . . . . . . . . . . . . . . . . . . . . . . 5.3 4.2 3.3 3.3 4.7
Note(1) Interest payable and other finance charges for the year ended 30 June 2012 includes a £151 million
charge (2011 – £107 million charge; 2010 – £275 million charge; 2009 – £164 million charge; 2008 –£75 million charge) in respect of fair value adjustments to the group’s derivative instruments.Impact of foreign exchange movements on net borrowings not in a hedge relationship andtherefore recognised in the income statement was £nil during the year ended 30 June 2012 (2011 –£nil; 2010 – £nil; 2009 – £11 million charge; 2008 – £6 million charge). In the year ended 30 June2010 an additional £10 million charge was recognised (2009 – £33 million charge; 2008 – £nil) inrespect of exchange rate translation differences on inter-company funding arrangements wherehedge accounting was not applicable.
244

Additional information for shareholders
Legal proceedings
Information on legal proceedings is set out in note 31 to the consolidated financial statements.
Related party transactions
Transactions with directors are disclosed in the directors’ remuneration report (see ‘Directors’remuneration report – Additional information’) and transactions with other related parties are disclosedin note 32 to the consolidated financial statements.
Share capital
Major shareholders At 24 August 2012, the following substantial interests (3% or more) in thecompany’s ordinary share capital (voting securities) had been notified to the company.
Number of Percentage of issued Date ofordinary ordinary share capital notification
Shareholder shares (excluding treasury shares) of interest
BlackRock Investment Management (UK)Limited (indirect holding) . . . . . . . . . . . 147,296,928 5.89% 3 December 2009
Capital Research and ManagementCompany (indirect holding) . . . . . . . . . . 124,653,096 4.99% 28 April 2009
Legal & General Group Plc (directholding) . . . . . . . . . . . . . . . . . . . . . . . . 99,894,002 3.99% 20 October 2009
The company has not been notified of any other substantial interests in its securities. The company’ssubstantial shareholders do not have different voting rights. Diageo, so far as is known by the company,is not directly or indirectly owned or controlled by another corporation or by any government. Diageoknows of no arrangements, the operation of which may at a subsequent date result in a change ofcontrol of the company.
As at the close of business on 24 August 2012, 482,715,607 ordinary shares, including those heldthrough ADSs, were held by approximately 2,551 holders (including ADR holders) with registeredaddresses in the United States, representing approximately 19.26% of the outstanding ordinary shares(excluding treasury shares). At such date, 120,511,079 ADSs were held by 1,894 registered ADRholders. Since certain of such ordinary shares and ADSs are held by nominees or former GrandMet orGuinness Group ADR holders who have not re-registered their ADSs, the number of holders may notbe representative of the number of beneficial owners in the United States or the ordinary shares heldby them.
Trading market for shares The Diageo plc ordinary shares are listed on the Exchange and on theDublin and Paris Stock Exchanges. Diageo ADSs, representing four Diageo ordinary shares each, arelisted on the NYSE.
The principal trading market for the ordinary shares is the Exchange. Shares are traded on theExchange’s electronic order book.
Orders placed on the order book are displayed on-screen through a central electronic system andtrades are automatically executed, in price and then time priority, when orders match withcorresponding buy or sell orders.
245

Additional information for shareholders (continued)
Share capital (continued)
Only member firms of the Exchange, or the Exchange itself if requested by the member firm, canenter or delete orders on behalf of clients or on their own account. All orders are anonymous.Although use of the order book is not mandatory, all trades, whether or not executed through theorder book and regardless of size, must be published immediately after execution unless they are largetrades eligible for deferred publication.
The Markets in Financial Instruments Directive (MiFID) allows for delayed reporting of largetrades with a sliding scale requirement based on qualifying minimum thresholds for the amount ofconsideration to be paid/the proportion of average daily turnover (ADT) of a stock represented by atrade. Provided that a trade/consideration equals or exceeds the qualifying minimum size, it will beeligible for deferred publication ranging from 60 minutes from time of trade to three trading days aftertime of trade.
Fluctuations in the exchange rate between the pound sterling and the US dollar will affect theUS dollar equivalent of the pound sterling price of the ordinary shares on the Exchange and, as aresult, will affect the market price of the ADSs on the NYSE. In addition, such fluctuations will affectthe US dollar amounts received by holders of ADSs on conversion of cash dividends paid in poundssterling on the underlying ordinary shares.
246
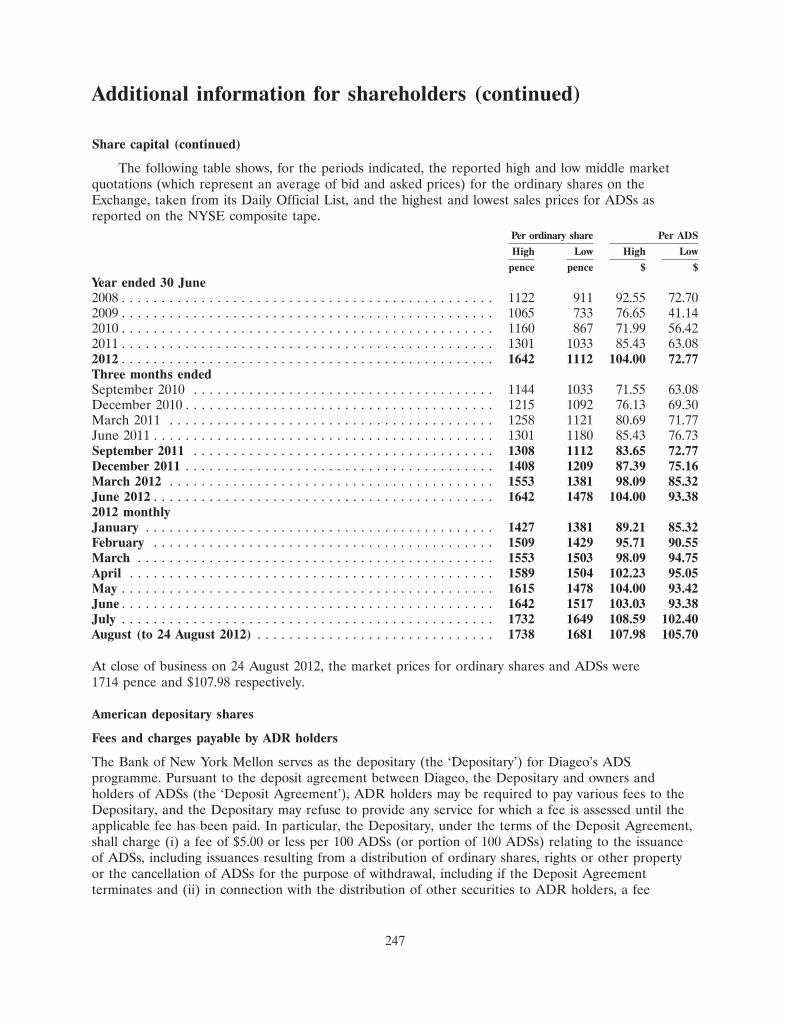
Additional information for shareholders (continued)
Share capital (continued)
The following table shows, for the periods indicated, the reported high and low middle marketquotations (which represent an average of bid and asked prices) for the ordinary shares on theExchange, taken from its Daily Official List, and the highest and lowest sales prices for ADSs asreported on the NYSE composite tape.
Per ordinary share Per ADS
High Low High Low
pence pence $ $
Year ended 30 June2008 . . . . . . . . . . . . . . . . . . . . . . . . . . . . . . . . . . . . . . . . . . . . . . . 1122 911 92.55 72.702009 . . . . . . . . . . . . . . . . . . . . . . . . . . . . . . . . . . . . . . . . . . . . . . . 1065 733 76.65 41.142010 . . . . . . . . . . . . . . . . . . . . . . . . . . . . . . . . . . . . . . . . . . . . . . . 1160 867 71.99 56.422011 . . . . . . . . . . . . . . . . . . . . . . . . . . . . . . . . . . . . . . . . . . . . . . . 1301 1033 85.43 63.082012 . . . . . . . . . . . . . . . . . . . . . . . . . . . . . . . . . . . . . . . . . . . . . . . 1642 1112 104.00 72.77Three months endedSeptember 2010 . . . . . . . . . . . . . . . . . . . . . . . . . . . . . . . . . . . . . . 1144 1033 71.55 63.08December 2010 . . . . . . . . . . . . . . . . . . . . . . . . . . . . . . . . . . . . . . . 1215 1092 76.13 69.30March 2011 . . . . . . . . . . . . . . . . . . . . . . . . . . . . . . . . . . . . . . . . . 1258 1121 80.69 71.77June 2011 . . . . . . . . . . . . . . . . . . . . . . . . . . . . . . . . . . . . . . . . . . . 1301 1180 85.43 76.73September 2011 . . . . . . . . . . . . . . . . . . . . . . . . . . . . . . . . . . . . . . 1308 1112 83.65 72.77December 2011 . . . . . . . . . . . . . . . . . . . . . . . . . . . . . . . . . . . . . . . 1408 1209 87.39 75.16March 2012 . . . . . . . . . . . . . . . . . . . . . . . . . . . . . . . . . . . . . . . . . 1553 1381 98.09 85.32June 2012 . . . . . . . . . . . . . . . . . . . . . . . . . . . . . . . . . . . . . . . . . . . 1642 1478 104.00 93.382012 monthlyJanuary . . . . . . . . . . . . . . . . . . . . . . . . . . . . . . . . . . . . . . . . . . . . 1427 1381 89.21 85.32February . . . . . . . . . . . . . . . . . . . . . . . . . . . . . . . . . . . . . . . . . . . 1509 1429 95.71 90.55March . . . . . . . . . . . . . . . . . . . . . . . . . . . . . . . . . . . . . . . . . . . . . 1553 1503 98.09 94.75April . . . . . . . . . . . . . . . . . . . . . . . . . . . . . . . . . . . . . . . . . . . . . . 1589 1504 102.23 95.05May . . . . . . . . . . . . . . . . . . . . . . . . . . . . . . . . . . . . . . . . . . . . . . . 1615 1478 104.00 93.42June . . . . . . . . . . . . . . . . . . . . . . . . . . . . . . . . . . . . . . . . . . . . . . . 1642 1517 103.03 93.38July . . . . . . . . . . . . . . . . . . . . . . . . . . . . . . . . . . . . . . . . . . . . . . . 1732 1649 108.59 102.40August (to 24 August 2012) . . . . . . . . . . . . . . . . . . . . . . . . . . . . . . 1738 1681 107.98 105.70
At close of business on 24 August 2012, the market prices for ordinary shares and ADSs were1714 pence and $107.98 respectively.
American depositary shares
Fees and charges payable by ADR holders
The Bank of New York Mellon serves as the depositary (the ‘Depositary’) for Diageo’s ADSprogramme. Pursuant to the deposit agreement between Diageo, the Depositary and owners andholders of ADSs (the ‘Deposit Agreement’), ADR holders may be required to pay various fees to theDepositary, and the Depositary may refuse to provide any service for which a fee is assessed until theapplicable fee has been paid. In particular, the Depositary, under the terms of the Deposit Agreement,shall charge (i) a fee of $5.00 or less per 100 ADSs (or portion of 100 ADSs) relating to the issuanceof ADSs, including issuances resulting from a distribution of ordinary shares, rights or other propertyor the cancellation of ADSs for the purpose of withdrawal, including if the Deposit Agreementterminates and (ii) in connection with the distribution of other securities to ADR holders, a fee
247

Additional information for shareholders (continued)
American depositary shares (continued)
equivalent to the fee that would be payable, if securities distributed by Diageo had been ordinaryshares and such ordinary shares had been deposited for issuance of ADSs.
In addition, ADR holders may be required under the Deposit Agreement to pay the Depositary(i) any tax, duty, governmental charge or fee or stock transfer or registration fee arising in connectionwith the foregoing transactions or otherwise, (ii) any expense resulting from the conversion of a foreigncurrency into US dollars and (iii) the expense of certain communications made, at the request of theADR holder, by cable, telex or facsimile. The Depositary may (i) withhold dividends or otherdistributions or sell any or all of the shares underlying the ADSs in order to satisfy any tax orgovernmental charge and (ii) deduct from any cash distribution any tax payable thereon or the cost ofany currency conversion.
Direct and indirect payments by the Depositary
The Depositary reimburses Diageo for certain expenses it incurs in connection with the ADRprogramme, subject to a ceiling set out in the agreement pursuant to which the Depositary providesservices to Diageo. The Depositary has also agreed to waive certain standard fees associated with theadministration of the programme.
During the financial year ended 30 June 2012, the company received from the Depositary$1,200,000 for continuing annual stock exchange listing fees, routine reporting and programmemaintenance, standard out-of-pocket maintenance costs for the ADSs (consisting of the expenses ofpostage and envelopes for mailing annual financial reports, printing and distributing dividendchecks,electronic filing of US Federal tax information, mailing required tax forms, stationery, postage,facsimile, and telephone calls), legal fees and certain investor relationship programmes and investorrelations promotional activities.
Articles of association
Diageo is incorporated under the name Diageo plc, and is registered in England and Wales underregistered number 23307.
The following description summarises certain provisions of Diageo’s articles of association (asadopted by special resolution at the Annual General Meeting on 14 October 2009) and applicableEnglish law concerning companies (the Companies Acts), in each case as at 24 August 2012. Thissummary is qualified in its entirety by reference to the Companies Acts and Diageo’s articles ofassociation.
Information on where investors can obtain copies of Diageo’s articles of association is providedunder ‘Additional information for shareholders – Documents on display’ below.
All of Diageo’s ordinary shares are fully paid. Accordingly, no further contribution of capital maybe required by Diageo from the holders of such shares.
Any amendment to the articles of association of the company may be made in accordance with theprovisions of the Companies Act by way of special resolution.
Directors Diageo’s articles of association provide for a board of directors, consisting (unless otherwisedetermined by an ordinary resolution of shareholders) of not fewer than three directors and not morethan 25 directors, in which all powers to manage the business and affairs of Diageo are vested.
248
Additional information for shareholders (continued)
Articles of association (continued)
Directors may be elected by the members in a general meeting or appointed by the board of directors.At each annual general meeting, the following are required to retire and are then reconsidered forre-election, assuming they wish to stand for re-election: any director who has been appointed by theboard of directors since the last annual general meeting; any director who has been in office during thetwo previous general meetings and did not retire at either of them; and any director who has been inoffice, other than in an executive position, for a continuous period of nine years or more at the date ofthe meeting. There is no age limit requirement in respect of directors. Directors may also be removedbefore the expiration of their term of office in accordance with the provisions of the Companies Acts.
Under Diageo’s articles of association, a director cannot vote in respect of any proposal in whichthe director has an interest.
However, this restriction on voting does not apply where the interest cannot reasonably beregarded as giving rise to a conflict of interest, nor to resolutions (a) giving the director any guarantee,security or indemnity in respect of obligations or liabilities incurred for the benefit of Diageo,(b) giving any guarantee, security or indemnity to a third party in respect of obligations of Diageo forwhich the director has assumed responsibility under an indemnity or guarantee or by the giving ofsecurity, (c) relating to an offer of securities of Diageo in which the director participates or mayparticipate as a holder of shares or other securities or in the underwriting, (d) relating to any contractin which the director is interested by virtue of the director’s interest in securities of Diageo or byreason of any other interest in or through Diageo, (e) concerning any other company in which thedirector is directly or indirectly interested, provided that the director does not have a relevant interestin that company, (f) relating to the arrangement of any employee benefit (including any retirementbenefit plan) in which the director will share equally with other employees, (g) relating to anyinsurance that Diageo purchases or maintains for its directors or any group of people, includingdirectors, (h) giving the director an indemnity where all the other directors are being offeredindemnities on substantially the same terms, and (i) for the funding by Diageo of the director’sexpenditure on defending proceedings or the doing by Diageo of anything to enable the director toavoid incurring such expenditure where all the other directors are being offered substantially the samearrangements. A director cannot vote in relation to any resolution of the board concerning his ownappointment, or the settlement or variation of the terms or the termination of his own appointment, asthe holder of any office or place of profit with Diageo or any company in which Diageo is interested.
Under Diageo’s articles of association, compensation awarded to directors may be decided by theboard or any authorised committee of the board. The remuneration committee is responsible formaking recommendations to the board concerning matters relating to remuneration policy. It iscomprised of all the non-executive directors except for the chairman.
The directors are empowered to exercise all the powers of Diageo to borrow money, subject to thelimitation that the aggregate amount of all net external borrowings of the group outstanding at anytime shall not exceed an amount equal to twice the aggregate of the group’s adjusted capital andreserves calculated in the manner prescribed in Diageo’s articles of association, unless sanctioned by anordinary resolution of Diageo’s shareholders.
Directors are not required to hold any shares of Diageo as a qualification to act as a director.
Dividend rights Holders of Diageo’s ordinary shares may, by ordinary resolution, declare dividendsbut may not declare dividends in excess of the amount recommended by the directors. The directorsmay also pay interim dividends or fixed rate dividends. No dividend may be paid other than out of
249
Additional information for shareholders (continued)
Articles of association (continued)
profits available for distribution. All of Diageo’s ordinary shares rank equally for dividends, but theboard may withhold payment of all or any part of any dividends or other monies payable in respect ofDiageo’s shares from a person with a 0.25% interest (as defined in Diageo’s articles of association) ifsuch a person has been served with a restriction notice (as defined in Diageo’s articles of association)after failure to provide Diageo with information concerning interests in those shares required to beprovided under the Companies Acts. Dividends may be paid in currencies other than pounds sterlingand such dividends will be calculated using an appropriate market exchange rate as determined by thedirectors in accordance with Diageo’s articles of association.
If a dividend has not been claimed, the directors may invest the dividend or use it in some otherway for the benefit of Diageo until the dividend is claimed. If the dividend remains unclaimed for12 years after the date such dividend was declared or became due for payment, it will be forfeited andwill revert to Diageo (unless the directors decide otherwise). Diageo may stop sending cheques,warrants or similar financial instruments in payment of dividends by post in respect of any shares ormay cease to employ any other means for payment of dividends if either (a) at least two consecutivepayments have remained uncashed or are returned undelivered or that means of payment has failed, or(b) one payment remains uncashed or is returned undelivered or that means of payment has failed andreasonable enquiries have failed to establish any new postal address or account of the holder. Diageomust resume sending dividend cheques, warrants or similar financial instruments or employing thatmeans of payment if the holder requests such resumption in writing.
Diageo’s articles of association permit payment or satisfaction of a dividend wholly or partly bydistribution of specific assets, including fully paid shares or debentures of any other company. Suchaction must be directed by the general meeting which declared the dividend and upon therecommendation of the directors.
Voting rights Voting on any resolution at any general meeting of shareholders is by a show of handsunless a poll is duly demanded. On a show of hands, (a) every shareholder who is present in person ata general meeting, and every proxy appointed by any one shareholder and present at a general meeting,has/have one vote regardless of the number of shares held by the shareholder (or, subject to (b),represented by the proxy), and (b) every proxy present at a general meeting who has been appointed bymore than one shareholder has one vote regardless of the number of shareholders who have appointedhim or the number of shares held by those shareholders, unless he has been instructed to vote for aresolution by one or more shareholders and to vote against the resolution by one or more shareholders,in which case he has one vote for and one vote against the resolution. On a poll, every shareholderwho is present in person or by proxy has one vote for every share held by that shareholder, but ashareholder or proxy entitled to more than one vote need not cast all his votes or cast them all in thesame way (the deadline for exercising voting rights by proxy is set out in the form of proxy).
A poll may be demanded by any of the following:
• the chairman of the meeting;
• at least three shareholders entitled to vote on the relevant resolution and present in person orby proxy at the meeting;
• any shareholder or shareholders present in person or by proxy and representing in the aggregatenot less than one-tenth of the total voting rights of all shareholders entitled to vote on therelevant resolution; or
250

Additional information for shareholders (continued)
Articles of association (continued)
• any shareholder or shareholders present in person or by proxy and holding shares conferring aright to vote on the relevant resolution on which there have been paid up sums in the aggregateequal to not less than one-tenth of the total sum paid up on all the shares conferring that right.
Diageo’s articles of association and the Companies Acts provide for matters to be transacted atgeneral meetings of Diageo by the proposing and passing of two kinds of resolutions:
• ordinary resolutions, which include resolutions for the election, re-election and removal ofdirectors, the declaration of final dividends, the appointment and re-appointment of the externalauditor, the increase of authorised share capital and the grant of authority to allot shares; and
• special resolutions, which include resolutions for the amendment of Diageo’s articles ofassociation, resolutions relating to the disapplication of pre-emption rights, and resolutionsmodifying the rights of any class of Diageo’s shares at a meeting of the holders of such class.
An ordinary resolution requires the affirmative vote of a simple majority of the votes cast by thoseentitled to vote at a meeting at which there is a quorum in order to be passed. Special resolutionsrequire the affirmative vote of not less than three-quarters of the votes cast by those entitled to vote ata meeting at which there is a quorum in order to be passed. The necessary quorum for a meeting ofDiageo is a minimum of two shareholders present in person or by proxy and entitled to vote.
A shareholder is not entitled to vote at any general meeting or class meeting in respect of anyshare held by him if he has been served with a restriction notice (as defined in Diageo’s articles ofassociation) after failure to provide Diageo with information concerning interests in those sharesrequired to be provided under the Companies Acts.
Liquidation rights In the event of the liquidation of Diageo, after payment of all liabilities anddeductions taking priority in accordance with English law, the balance of assets available fordistribution will be distributed among the holders of ordinary shares according to the amounts paid upon the shares held by them.
Pre-emptive rights and new issues of shares: While holders of ordinary shares have no pre-emptiverights under Diageo’s articles of association, the ability of the directors to cause Diageo to issue shares,securities convertible into shares or rights to shares, otherwise than pursuant to an employee sharescheme, is restricted. Under the Companies Acts, the directors of a company are, with certainexceptions, unable to allot any equity securities without express authorisation, which may be containedin a company’s articles of association or given by its shareholders in general meeting, but which ineither event cannot last for more than five years. Under the Companies Acts, Diageo may also not allotshares for cash (otherwise than pursuant to an employee share scheme) without first making an offer toexisting shareholders to allot such shares to them on the same or more favourable terms in proportionto their respective shareholdings, unless this requirement is waived by a special resolution of theshareholders.
Disclosure of interests in Diageo’s shares: There are no provisions in Diageo’s articles of associationwhereby persons acquiring, holding or disposing of a certain percentage of Diageo’s shares are requiredto make disclosure of their ownership percentage, although there are such requirements under theCompanies Acts. The basic disclosure requirement under Part 6 of the Financial Services andMarkets Act 2000 and Rule 5 of the Disclosure and Transparency Rules made by the Financial ServicesAuthority imposes a statutory obligation on a person to notify Diageo and the Financial Services
251

Additional information for shareholders (continued)
Articles of association (continued)
Authority of the percentage of the voting rights in Diageo he directly or indirectly holds or controls, orhas rights over, through his direct or indirect holding of certain financial instruments, if the percentageof those voting rights:
• reaches, exceeds or falls below 3% and/or any subsequent whole percentage figure as a result ofan acquisition or disposal of shares or financial instruments; or
• reaches, exceeds or falls below any such threshold as a result of any change in the breakdown ornumber of voting rights attached to shares in Diageo.
The Disclosure and Transparency Rules set out in detail the circumstances in which an obligationof disclosure will arise, as well as certain exemptions from those obligations for specified persons.
Under section 793 of the Companies Act 2006, Diageo may, by notice in writing, require a personthat Diageo knows or has reasonable cause to believe is or was during the three years preceding thedate of notice interested in Diageo’s shares to indicate whether or not that is the case and, if thatperson does or did hold an interest in Diageo’s shares, to provide certain information as set out inthat Act.
Rule 3 of the Disclosure and Transparency Rules further requires persons discharging managerialresponsibilities within Diageo (and their connected persons) to notify Diageo of transactions conductedon their own account in Diageo shares or derivatives or certain financial instruments relating to Diageoshares.
The City Code on Takeovers and Mergers also imposes strict disclosure requirements with regardto dealings in the securities of an offeror or offeree company on all parties to a takeover and also ontheir respective associates during the course of an offer period.
General meetings and notices At least 21 clear days’ written notice of an annual general meeting isrequired. Any general meeting which is not an annual general meeting is called a ‘general meeting’.Since the coming into force of the Companies (Shareholders’ Rights) Regulations 2009, the minimumnotice period for general meetings has increased from 14 to 21 clear days. This can, however, bereduced to 14 clear days, subject to shareholder approval, and offering shareholders the facility to voteelectronically. Diageo already offers shareholders the facility to vote by electronic means (via its onlineproxy service), and intends to put the necessary resolution to the forthcoming Annual General Meeting,as it did in 2011, to approve the holding of subsequent general meetings on not less than 14 clear days’notice. This approval will expire at the next Annual General Meeting.
An annual general meeting of shareholders must be held within six months of Diageo’s accountingreference date and at a time and place determined by the directors.
The chairman of any general meeting is entitled to refuse admission to (or eject from) that generalmeeting any person who fails to comply with any security arrangements or restrictions that the boardmay impose.
Variation of rights If, at any time, Diageo’s share capital is divided into different classes of shares, therights attached to any class of shares may be varied, subject to the provisions of the Companies Acts,either with the consent in writing of the holders of not less than three-quarters in nominal value of theissued shares of that class or upon the adoption of a special resolution passed at a separate meeting ofthe holders of the shares of that class.
252

Additional information for shareholders (continued)
Articles of association (continued)
At every such separate meeting, all of the provisions of Diageo’s articles of association relating toproceedings at a general meeting apply, except that (a) the quorum is to be the number of persons(which must be at least two) who hold or represent by proxy not less than one-third in nominal valueof the issued shares of the class or, if such quorum is not present on an adjourned meeting, one personwho holds shares of the class regardless of the number of shares he holds, (b) any holder of shares ofthe class who is present in person or by proxy may demand a poll, and (c) each shareholder present inperson or by proxy and entitled to vote will have one vote per share held in that particular class in theevent a poll is taken.
Class rights are deemed not to have been varied by the creation or issue of new shares rankingequally with or subsequent to that class of shares in all respects or by the reduction of the capital paidup on such shares or by the purchase or redemption by Diageo of its own shares, in each case inaccordance with the Companies Acts and Diageo’s articles of association.
Repurchase of shares Subject to authorisation by shareholder resolution, Diageo may purchase itsown shares in accordance with the Companies Acts. Any shares which have been bought back may beheld as treasury shares or, if not so held, must be cancelled immediately upon completion of thepurchase, thereby reducing the amount of Diageo’s issued share capital. Diageo currently hasshareholder authority to buy back up to 250 million ordinary shares during the period up to the nextAnnual General Meeting. The minimum price which must be paid for such shares is 28101/108 pence andthe maximum price is the higher of (a) an amount equal to 105% of the average of the middle marketquotations for an ordinary share as derived from the London Stock Exchange Daily Official List for thefive preceding business days and (b) the higher of the price of the last independent trade and thehighest current independent bid on the London Stock Exchange at the time the purchase is carried out.
Restrictions on transfers of shares The board may decline to register a transfer of a certificatedDiageo share unless the instrument of transfer (a) is duly stamped or certified or otherwise shown tothe satisfaction of the board to be exempt from stamp duty and is accompanied by the relevant sharecertificate and such other evidence of the right to transfer as the board may reasonably require, (b) isin respect of only one class of share and (c) if to joint transferees, is in favour of not more than foursuch transferees.
Registration of a transfer of an uncertificated share may be refused in the circumstances set out inthe uncertificated securities rules (as defined in the articles of association) and where, in the case of atransfer to joint holders, the number of joint holders to whom the uncertificated share is to betransferred exceeds four.
The board may decline to register a transfer of any of Diageo’s certificated shares by a person witha 0.25% interest (as defined in Diageo’s articles of association) if such a person has been served with arestriction notice (as defined in Diageo’s articles of association) after failure to provide Diageo withinformation concerning interests in those shares required to be provided under the Companies Acts,unless the transfer is shown to the board to be pursuant to an arm’s-length sale (as defined in thearticles of association).
Exchange controls
There are currently no UK foreign exchange control restrictions on the payment of dividends toUS persons on Diageo’s ordinary shares or on the conduct of Diageo’s operations.
253

Additional information for shareholders (continued)
Exchange controls (continued)
There are no restrictions under the company’s articles of association or under English law thatlimit the right of non-resident or foreign owners to hold or vote the company’s ordinary shares.
Please refer to the ‘Taxation’ section below for details relating to the taxation of dividendpayments.
Documents on display
The Form 20-F and any other documents filed by the company with the US Securities ExchangeCommission may be inspected at the Securities and Exchange Commission’s public reference roomlocated at 100 F Street, NE, Washington, DC 20549. Information on the operation of the publicreference room can be obtained by calling the Securities and Exchange Commission at 1 800 SEC 0330.
Taxation
This section provides a descriptive summary of certain US federal income tax and UK tax consequencesthat are likely to be material to the holders of the ordinary shares or ADSs, but only those who holdtheir ordinary shares or ADSs as capital assets for tax purposes.
It does not purport to be a complete technical analysis or a listing of all potential tax effectsrelevant to the ownership of the ordinary shares and ADSs. This section does not apply to any holderwho is subject to special rules, including:
• a dealer in securities or foreign currency;
• a trader in securities that elects to use a mark-to-market method of accounting for securitiesholdings;
• a tax-exempt organisation;
• a life insurance company;
• a person liable for alternative minimum tax;
• a person that actually or constructively owns 10% or more of the voting stock of Diageo;
• a person that holds ordinary shares or ADSs as part of a straddle or a hedging or conversiontransaction;
• a person that holds ordinary shares or ADSs as part of a wash sale for tax purposes;
• a US holder (as defined below) whose functional currency is not the US dollar; or
• a partnership or a partner in a partnership that holds ordinary shares or ADSs.
For UK tax purposes, this section applies only to persons who are the absolute beneficial ownersof their shares or ADSs and who hold their shares or ADSs as investments. It assumes that holders ofADSs will be treated as holders of the underlying ordinary shares.In addition to those personsmentioned above, this section does not apply to holders that are banks, regulated investmentcompanies, other financial institutions or to persons who have or are deemed to have acquired theirordinary shares or ADSs in the course of an employment or trade. This summary does not apply topersons who are treated as non-domiciled and resident or ordinarily resident in the United Kingdomfor the purposes of UK tax law. This section is based on the Internal Revenue Code of 1986, as
254
Additional information for shareholders (continued)
Taxation (continued)
amended, its legislative history, existing and proposed regulations, published rulings and court decisions,the laws of the United Kingdom and the practice of Her Majesty’s Revenue and Customs, all ascurrently in effect, as well as on the Convention Between the Government of the United States ofAmerica and the Government of the United Kingdom of Great Britain and Northern Ireland for theAvoidance of Double Taxation and the Prevention of Fiscal Evasion with Respect to Tax on Incomeand Capital Gains (the Treaty). These laws are subject to change, possibly on a retroactive basis.
In addition, this section is based in part upon the representations of the Depositary and theassumption that each obligation in the Deposit Agreement and any related agreement will beperformed in accordance with its terms. In general, and taking into account this assumption, forUS federal income tax purposes and for the purposes of the Treaty, holders of ADRs evidencing ADSswill be treated as the owner of the shares represented by those ADSs. Exchanges of shares for ADRs,and ADRs for shares, generally will not be subject to US federal income tax or to UK tax on profits orgains.
A US holder is a beneficial owner of ordinary shares or ADSs that is for US federal income taxpurposes:
• a citizen or resident for tax purposes of the United States and who is not and has at no pointbeen resident or ordinarily resident in the United Kingdom;
• a US domestic corporation;
• an estate whose income is subject to US federal income tax regardless of its source; or
• a trust if a US court can exercise primary supervision over the trust’s administration and one ormore US persons are authorised to control all substantial decisions of the trust.
This section is not intended to provide specific advice and no action should be taken or omitted inreliance upon it. This section addresses only certain aspects of US federal income tax and UK incometax, corporation tax, capital gains tax, inheritance tax and stamp taxes. Holders of the ordinary sharesor ADSs are urged to consult their own tax adviser regarding the US federal, state and local, andUK and other tax consequences of owning and disposing of the shares or ADSs in their respectivecircumstances. In particular, holders are encouraged to confirm with their adviser whether they are aUS holder eligible for the benefits of the Treaty.
Dividends UK taxation There is no UK withholding tax on dividends. A shareholder who is anindividual resident for UK tax purposes in the United Kingdom that receives a dividend from thecompany will generally be entitled to a tax credit equal to one-ninth of the dividend. The individual willbe taxable on the total of the dividend and the related credit, known as the gross dividend, which willbe regarded as the top slice of the individual’s income. In the case of a shareholder who is liable toincome tax at the basic rate, the tax credit will be treated as discharging the individual’s liability toincome tax in respect of the gross dividend. In the case of a shareholder who is liable to income tax atthe higher rate, the individual will be subject to tax on the gross dividend at the rate of 32.5%, to theextent that the gross dividend falls above the threshold for the higher rate of income tax when it istreated (as mentioned above) as the top slice of the individual’s income. This means that the tax creditwill satisfy only part of the individual’s liability to income tax on the gross dividend, so that theindividual will have to account for income tax equal to 22.5% of the gross dividend. In the case of ashareholder who is liable to income tax at the additional rate, the individual will be subject to tax onthe gross dividend at the rate of 42.5%, to the extent that the gross dividend falls above the threshold
255

Additional information for shareholders (continued)
Taxation (continued)
for the additional rate of income tax when it is treated (as mentioned above) as the top slice of theindividual’s income. This means that the tax credit will satisfy only part of the individual’s liability toincome tax on the gross dividend, so that the individual will have to account for income tax equal to32.5% of the gross dividend. Shareholders within the charge to UK corporation tax which are smallcompanies (for the purposes of the UK taxation of dividends) will not generally be subject to tax ondividends from Diageo. Other shareholders within the charge to UK corporation tax will not be subjectto tax on dividends from Diageo so long as the dividends fall within an exempt class and certainconditions are met. In general, dividends paid on shares that are ordinary share capital for UK taxpurposes and are not redeemable and dividends paid to a person holding less than 10% of the issuedshare capital of the payer (or any class of that share capital) are examples of dividends that fall withinan exempt class. A shareholder who is not liable for tax on dividends received on the shares will not beentitled to claim payment of the tax credit in respect of those dividends.
Eligible US holders will not normally be entitled to a tax credit under the Treaty, nor will they besubject to a withholding tax by the United Kingdom.
US taxation Under the US federal income tax laws, and subject to the passive foreign investmentcompany, or PFIC, rules discussed below, the gross amount of any dividend paid to a US holder byDiageo in respect of its ordinary shares or ADSs out of its current or accumulated earnings and profits(as determined for US federal income tax purposes) is subject to US federal income taxation.
Dividends paid to a non-corporate US holder in taxable years beginning before 1 January 2013that constitute qualified dividend income will be taxable to the holder at a maximum tax rate of 15%,provided that the ordinary shares or ADSs are held for more than 60 days during the 121-day periodbeginning 60 days before the ex-dividend date and the holder meets other holding period requirements.Dividends paid by Diageo with respect to its ordinary shares or ADSs generally will be qualifieddividend income to US holders that meet the holding period requirement. Under UK law, dividendsare not subject to UK withholding tax. Therefore, the US holder will include in income for US federalincome tax purposes the amount of the dividend received, and the receipt of a dividend will not entitlethe US holder to a foreign tax credit.
The dividend must be included in income when the US holder, in the case of shares, or theDepositary, in the case of ADSs, receives the dividend, actually or constructively. The dividend will notbe eligible for the dividends-received deduction generally allowed to US corporations in respect ofdividends received from other US corporations. Dividends will be income from sources outside theUnited States, and, depending on the US holder’s circumstances, will generally either be ‘passive’ or‘general’ income for purposes of computing the foreign tax credit, if allowable, to a US holder. Theamount of the dividend distribution that must be included in income of a US holder will be theUS dollar value of the pence payments made, determined at the spot pounds sterling/US dollar foreignexchange rate on the date the dividend distribution is included in income, regardless of whether thepayment is in fact converted into US dollars. Generally, any gain or loss resulting from currencyexchange fluctuations during the period from the date the dividend payment is included in income tothe date the payment is converted into US dollars will be treated as ordinary income or loss and willnot be eligible for the special tax rate applicable to qualified dividend income. The gain or lossgenerally will be income or loss from sources within the United States for foreign tax credit limitationpurposes. Distributions in excess of current and accumulated earnings and profits, as determined forUS federal income tax purposes, will be treated as a non-taxable return of capital to the extent of theholder’s basis in the ordinary shares or ADSs and thereafter as capital gain.
256
Additional information for shareholders (continued)
Taxation (continued)
Taxation of capital gains UK taxation A citizen or resident (for tax purposes) of the United Stateswho has at no time been either resident or ordinarily resident in the United Kingdom will not be liablefor UK tax on capital gains realised or accrued on the sale or other disposal of ordinary shares orADSs, unless the ordinary shares or ADSs are held in connection with a trade or business carried onby the holder in the United Kingdom through a UK branch, agency or a permanent establishment. Adisposal (or deemed disposal) of shares or ADSs by a holder who is resident or (in the case of anindividual) resident or ordinarily resident in the UK may, depending on the holder’s particularcircumstances, and subject to any available exemption or relief, give rise to a chargeable gain or anallowable loss for the purposes of UK taxation of chargeable gains.
US taxation Subject to the PFIC rules discussed below, a US holder who sells or otherwise disposes ofordinary shares or ADSs will recognise capital gain or loss for US federal income tax purposes equal tothe difference between the US dollar value of the amount that is realised and the tax basis, determinedin US dollars, in the ordinary shares or ADSs. Capital gain of a non-corporate US holder is generallytaxed at preferential rates where the property is held for more than one year. The gain or loss willgenerally be income or loss from sources within the United States for foreign tax credit limitationpurposes.
A US holder who is liable for both UK and US tax on a gain on the disposal of ordinary shares orADSs will generally be entitled, subject to certain limitations, to a credit against the holder’sUS federal income tax liability for the amount of any UK tax paid in respect of such gain.
PFIC rules Diageo believes that ordinary shares and ADSs should not be treated as stock of a PFICfor US federal income tax purposes, but this conclusion is a factual determination that is madeannually and thus may be subject to change. If treated as a PFIC, unless a US holder elects to be taxedannually on a mark-to-market basis with respect to the ordinary shares or ADSs, gain realised on thesale or other disposition of ordinary shares or ADSs would in general not be treated as capital gain.Instead, US holders would be treated as if the holder had realised such gain and certain ‘excessdistributions’ pro-rated over the holder’s holding period for the ordinary shares or ADSs and would betaxed at the highest tax rate in effect for each such year to which the gain or distribution was allocated,together with an interest charge in respect of the tax attributable to each such year. With certainexceptions, a holder’s ordinary shares or ADSs will be treated as stock in a PFIC if Diageo were aPFIC at any time during the holding period in a holder’s ordinary shares or ADSs. In addition,dividends received from Diageo will not be eligible for the special tax rates applicable to qualifieddividend income if Diageo is a PFIC either in the taxable year of the distribution or the precedingtaxable year, but instead will be taxable at rates applicable to ordinary income.
UK inheritance tax Subject to certain provisions relating to trusts or settlements, an ordinary share orADS held by an individual shareholder who is domiciled in the United States for the purposes of theConvention between the United States and the United Kingdom relating to estate and gift taxes (theConvention) and is not a UK national as defined in the Convention will not be subject toUK inheritance tax on the individual’s death (whether held on the date of death or gifted during theindividual’s lifetime) except where the ordinary share or ADS is part of the business property of aUK permanent establishment of the individual or pertains to a UK fixed base of an individual whoperforms independent personal services. In a case where an ordinary share or ADS is subject both toUK inheritance tax and to US federal gift or estate tax, the Convention generally provides forinheritance tax paid in the United Kingdom to be credited against federal gift or estate tax payable in
257

Additional information for shareholders (continued)
Taxation (continued)
the United States, or for federal gift or estate tax paid in the United States to be credited against anyinheritance tax payable in the United Kingdom, based on priority rules set forth in the Convention.
UK stamp duty and stamp duty reserve tax Stamp duty reserve tax (SDRT) arises upon the deposit ofan underlying ordinary share with the Depositary, generally at the higher rate of 1.5% of its issue priceor, as the case may be, of the consideration for transfer. The Depositary will pay the SDRT but willrecover an amount in respect of such tax from the initial holders of ADSs. No UK stamp duty will bepayable on the acquisition or transfer of ADSs in practice, provided that the instrument of transfer isnot executed in the United Kingdom and remains at all times outside the United Kingdom.Furthermore, an agreement to transfer ADSs in the form of ADRs will not give rise to a liability toSDRT.
Purchases of ordinary shares will be subject to UK stamp duty, or SDRT as the case may be, atthe rate of 0.5% of the price payable for the ordinary shares at the time of the transfer. However,where ordinary shares being acquired are transferred direct to the Depositary’s nominee, the onlycharge will generally be the higher SDRT charge of 1.5% of the price payable for the ordinary sharesso acquired.
Warning to shareholders – share fraud
Please beware share fraud of ‘‘boiler room’’ scams, where shareholders are called ‘out of the blue’by fraudsters (sometimes claiming to represent Diageo) attempting to obtain money or propertydishonestly. Further information is available in the investor section of the company’s website(www.diageo.com) but in short, if in doubt, take proper professional advice before making anyinvestment decision.
258

Signature
Pursuant to the requirements of Section 12 of the Securities Exchange Act of 1934, the Registrantcertifies that it meets all of the requirements for filing on Form 20-F and has duly caused this AnnualReport to be signed on its behalf by the undersigned, thereunto duly authorised.
DIAGEO plc(REGISTRANT)
/s/ DA MAHLAN
Name: DA MahlanTitle: Chief financial officer
5 September 2012
259
Exhibits
1.1 Articles of Association of Diageo plc (incorporated by reference to Exhibit 99.1 to the Report onForm 6-K (File No. 001-10691) filed with the Securities and Exchange Commission on 15 October2009).
2.1 Indenture, dated as of 3 August 1998, among Diageo Capital plc, Diageo plc and The Bank ofNew York Mellon (incorporated by reference to Exhibit 4.1 to the Registration Statement onForm F-1 (File No. 333-8874) filed with the Securities and Exchange Commission on 24 July 1998(pages 365 to 504 of paper filing)).*
2.2 Indenture, dated as of 1 June 1999, among Diageo Investment Corporation, Diageo plc and TheBank of New York Mellon (incorporated by reference to Exhibit 2.2 to the Annual Report onForm 20-F (File No. 001-10691) filed with the Securities and Exchange Commission on15 November 2001 (pages 241 to 317 of paper filing)).*
2.3 Indenture, dated as of 8 December 2003, among Diageo Finance B.V., Diageo plc and The Bankof New York Mellon (incorporated by reference to Exhibit 1 to the Report on Form 6-K (FileNo. 001-10691) filed with the Securities and Exchange Commission on 9 December 2003).*
4.1 Service Agreement, dated 1 November 2005, between Diageo plc and Paul S. Walsh (incorporatedby reference to Exhibit 4.6 to the Annual Report on Form 20-F (File No. 001-10691) filed with theSecurities and Exchange Commission on 25 September 2006).
4.2 Service Agreement, dated 1 July 2010, between Diageo plc and Deirdre A. Mahlan (incorporatedby reference to Exhibit 4.4 to the Annual Report on Form 20-F (File No. 001-10691) filed with theSecurities and Exchange Commission on 14 September 2010).
4.3 Service Agreement, dated 1 March 2012, between Diageo plc, Diageo North America, Inc andIvan Menezes.
4.4 Letter of Agreement, dated 19 July 2007, between Diageo plc and Dr Franz B. Humer(incorporated by reference to Exhibit 4.4 to the Annual Report on Form 20-F (File No. 001-10691)filed with the Securities and Exchange Commission on 15 September 2008).
4.5 Form of Service Agreement for Diageo plc’s executives in the United Kingdom, dated as of 1 July2006 (incorporated by reference to Exhibit 4.7 to the Annual Report on Form 20-F (FileNo. 001-10691) filed with the Securities and Exchange Commission on 17 September 2007).
4.6 Form of Service Agreement for Diageo plc’s executives in the United States, dated as of 1 July2006 (incorporated by reference to Exhibit 4.8 to the Annual Report on Form 20-F (FileNo. 001-10691) filed with the Securities and Exchange Commission on 17 September 2007).
4.7 Diageo 2010 Sharesave Plan, dated 14 October 2010 (incorporated by reference to Exhibit 4.2 tothe Registration Statement on Form S-8 (File No. 333-169934) filed with the Securities andExchange Commission on 14 October 2010).
4.8 Diageo 2001 Share Incentive Plan, dated 14 October 2010 (incorporated by reference toExhibit 4.3 to the Registration Statement on Form S-8 (File No. 333-169934) filed with theSecurities and Exchange Commission on 14 October 2010).
4.9 Rules of the Diageo plc 2009 International Share Match Plan, dated 14 October 2010(incorporated by reference to Exhibit 4.4 to the Registration Statement on Form S-8 (FileNo. 333-169934) filed with the Securities and Exchange Commission on 14 October 2010).
260

4.10 Diageo plc 2009 Executive Long Term Incentive Plan, dated 14 October 2009 (incorporated byreference to Exhibit 4.2 to the Registration Statement on Form S-8 (File No. 333-162490) filedwith the Securities and Exchange Commission on 15 September 2009).
4.11 Diageo plc 2009 Discretionary Incentive Plan, dated 14 October 2009 (incorporated by reference toExhibit 4.3 to the Registration Statement on Form S-8 (File No. 333-162490) filed with theSecurities and Exchange Commission on 15 September 2009).
4.12 Diageo plc 2008 Performance Share Plan, dated as of 15 October 2008 (incorporated by referenceto Exhibit 4.2 to the Registration Statement on Form S-8 (File No. 333-154338) filed with theSecurities and Exchange Commission on 16 October 2008).
4.13 Diageo plc 2008 Senior Executive Share Option Plan, dated as of 15 October 2008 (incorporatedby reference to Exhibit 4.3 to the Registration Statement on Form S-8 (File No. 333-154338) filedwith the Securities and Exchange Commission on 16 October 2008).
4.14 Diageo plc Senior Executive Share Option Plan, dated as of 26 August 2008 (incorporated byreference to Exhibit 4.7 to the Annual Report on Form 20-F (File No. 001-10691) filed with theSecurities and Exchange Commission on 15 September 2008).
4.15 Diageo plc Executive Share Option Plan, dated as of 26 August 2008 (incorporated by reference toExhibit 4.8 to the Annual Report on Form 20-F (File No. 001-10691) filed with the Securities andExchange Commission on 15 September 2008).
4.16 Diageo plc Associated Companies Share Option Plan, dated as of 26 August 2008 (incorporated byreference to Exhibit 4.9 to the Annual Report on Form 20-F (File No. 001-10691) filed with theSecurities and Exchange Commission on 15 September 2008).
4.17 Diageo plc Long Term Incentive Plan, dated as of 26 August 2008 (incorporated by reference toExhibit 4.10 to the Annual Report on Form 20-F (File No. 001-10691) filed with the Securities andExchange Commission on 15 September 2008).
4.18 Diageo plc 1998 United States Employee Stock Purchase Plan, dated as of 26 August 2008(incorporated by reference to Exhibit 4.12 to the Annual Report on Form 20-F (FileNo. 001-10691) filed with the Securities and Exchange Commission on 15 September 2008).
4.19 Diageo plc 2007 United States Employee Stock Purchase Plan, dated as of 26 August 2008(incorporated by reference to Exhibit 4.13 to the Annual Report on Form 20-F (FileNo. 001-10691) filed with the Securities and Exchange Commission on 15 September 2008).
4.20 Diageo plc UK Sharesave Scheme 2000, dated as of 26 August 2008 (incorporated by reference toExhibit 4.14 to the Annual Report on Form 20-F (File No. 001-10691) filed with the Securities andExchange Commission on 15 September 2008).
4.21 Addendum to Form of Service Agreement for Diageo plc’s executives in the United States(incorporated by reference to Exhibit 4.16 to the Annual Report on Form 20-F (FileNo. 001-10691) filed with the Securities and Exchange Commission on 15 September 2008).
4.22 Diageo plc Associated Companies Share Incentive Plan, dated as of 23 August 2011.
6.1 Description of earnings per share (included in note 10 to the consolidated financial statements onpage 189 of this Annual Report on Form 20-F.
7.1 Description of unaudited computation of ratio of earnings to fixed charges (included on page 244of this Annual Report on Form 20-F).
8.1 Principal group companies (included on page 241 of this Annual Report on Form 20-F).
12.1 Certification of Paul S. Walsh filed pursuant to 17 CFR 240.13a-14(a).
261

12.2 Certification of Deirdre A. Mahlan filed pursuant to 17 CFR 240.13a-14(a).
13.1 Certification of Paul S. Walsh furnished pursuant to 17 CFR 240.13a-14(b) and 18 U.S.C. 1350(a)and (b).
13.2 Certification of Deirdre A. Mahlan furnished pursuant to 17 CFR 240.13a-14(b) and 18 U.S.C.1350(a) and (b).
15.1 Consent of independent registered public accounting firm.
* Pursuant to an Agreement of Resignation, Appointment and Acceptance dated 16 October 2007 byand among Diageo plc, Diageo Capital plc, Diageo Finance BV, Diageo Investment Corporation,The Bank of New York and Citibank NA, The Bank of New York Mellon has become thesuccessor trustee to Citibank NA under Diageo’s indentures dated 3 August 1998, 8 December2003 and 1 June 1999.
262

Cross reference to Form 20-F
Item Required item in 20-F Page(s)
Part I1. Identity of directors, senior management and advisers Not applicable
2. Offer statistics and expected timetable Not applicable
3. Key informationA. Selected financial data 1-4B. Capitalization and indebtedness Not applicableC. Reason for the offer and use of proceeds Not applicableD. Risk factors 23-30
4. Information on the companyA. History and development of the company 5, 22-23, 227-229, 241B. Business overview 7-23, 158-164C. Organizational structure 241D. Property, plants and equipment 9-12, 195-196
4A. Unresolved staff comments Not applicable
5. Operating and financial review and prospectsA. Operating results 20-21, 37-78, 164, 207B. Liquidity and capital resources 79-84, 202-204, 209-212,
216, 230-231, 233C. Research and development, patents and licenses, etc. 20D. Trend information 78E. Off-balance sheet arrangements 84F. Tabular disclosure of contractual obligations 83G. Safe harbor 30-32
6. Directors, senior management and employeesA. Directors and senior management 87-90, 113-116B. Compensation 92-95, 101-122, 236-238C. Board practices 87-88, 95-97, 111-113,
127-130D. Employees 18-19, 167E. Share ownership 111, 116-121, 233-239
7. Major shareholders and related party transactionsA. Major shareholders 245B. Related party transactions 121, 231-232C. Interests of experts and counsel Not applicable
8. Financial informationA. Consolidated statements and other financial information 142-241B. Significant changes 240
9. The offer and listingA. Offer and listing details 245-247B. Plan of distribution Not applicableC. Markets 245D. Selling shareholders Not applicableE. Dilution Not applicableF. Expenses of the issue Not applicable
263

Item Required item in 20-F Page(s)
10. Additional informationA. Share capital Not applicableB. Memorandum and articles of association 248-253C. Material contracts 111-112, 234-239D. Exchange controls 253-254E. Taxation 254-258F. Dividends and paying agents Not applicableG. Statement by experts Not applicableH. Documents on display 254I. Subsidiary information Not applicable
11. Quantitative and qualitative disclosures about market risk 84-85, 206-217
12. Description of securities other than equity securitiesA. Debt securities Not applicableB. Warrants and rights Not applicableC. Other securities Not applicableD. American depositary shares 247-248
Part II
13. Defaults, dividend arrearages and delinquencies Not applicable
14. Material modifications to the rights of security holders and use Not applicableof proceeds
15. Controls and proceduresA. Disclosure controls and procedures 131B. Management’s report on internal control over financial 135reportingC. Attestation report of the registered public accounting firm 242-243D. Changes in internal control over financial reporting 135
16A. Audit committee financial expert 127
16B. Code of ethics 133
16C. Principal accountant fees and services 127-128, 166
16D. Exemptions from the listing standards for audit committees Not applicable
16E. Purchases of equity securities by the issuer and affiliated 222-224purchasers
16F. Change in registrant’s certifying accountant Not applicable
16G. Corporate governance 137-138
16H. Mine safety disclosure Not applicable
Part III
17. Financial statements Not applicable
18. Financial statements See Item 8
19. Exhibits 260-262
264

Page(s)
Additional informationShare capital 116-120, 189, 222-224,
233-239Unaudited computation of ratio of earnings to fixed charges 244Glossary of terms and US equivalents 266
It is possible to read and copy documents that have been filed by Diageo plc with the U.S. Securitiesand Exchange Commission (SEC) at the SEC’s public reference room, located at 450 5th Street, N.W.,Washington, D.C. 20549. Please call the SEC at 1-800-SEC-0330 for further information on the publicreference room and their copy charges. Filings with the SEC are also available to the public fromcommercial document retrieval services and on the web site maintained by the SEC at www.sec.gov.
265

Glossary of terms and US equivalents
In this document the following words and expressions shall, unless the context otherwise requires, havethe following meanings:Term used in UK annual report US equivalent or definitionAcquisition accounting Purchase accountingAssociates Entities accounted for under the equity methodAmerican Depositary Receipt (ADR) Receipt evidencing ownership of an ADSAmerican Depositary Share (ADS) Registered negotiable security, listed on the New York Stock Exchange, representing four
Diageo plc ordinary shares of 28101⁄108 pence eachCalled up share capital Common stockCapital allowances Tax depreciationCapital redemption reserve Other additional capitalCompany Diageo plcCPI Consumer price indexCreditors Accounts payable and accrued liabilitiesDebtors Accounts receivableEmployee share schemes Employee stock benefit plansEmployment or staff costs Payroll costsEquivalent units An equivalent unit represents one nine-litre case of spirits, which is approximately 272
servings. A serving comprises 33ml of spirits, 165ml of wine, or 330ml of ready to drink orbeer. To convert volume of products other than spirits to equivalent units: beer in hectolitresdivide by 0.9, wine in nine-litre cases divide by five, ready to drink in nine-litre cases divideby 10, and certain pre-mixed products classified as ready to drink in nine-litre cases divide byfive.
Euro, A, ¢ Euro currencyExceptional items Items that, in management’s judgement, need to be disclosed separately by virtue of their
size or incidenceExcise duty Tax charged by a sovereign territory on the production, manufacture, sale or distribution of
selected goods (including imported goods) within that territory. It is generally based on thequantity or alcohol content of goods, rather than their value, and is typically applied toalcohol products and fuels.
Finance lease Capital leaseFinancial year Fiscal yearFree cash flow Net cash flow from operating activities, net purchase and disposal of property, plant and
equipment and movements in loans and other investmentsFreehold Ownership with absolute rights in perpetuityGAAP Generally accepted accounting principlesGroup and Diageo Diageo plc and its consolidated subsidiariesIFRS International Financial Reporting Standards as endorsed and adopted for use in the
European Union and International Financial Reporting Standards as issued by theInternational Accounting Standards Board
Impact Databank An international data resource for the beverage alcohol industry that is independent fromindustry participants
LIBOR London Interbank Offered RateMerger accounting Pooling of interestsNet sales Sales after deducting excise dutiesNoon buying rate Buying rate at noon in New York City for cable transfers in pounds sterling as certified for
customs purposes by the Federal Reserve Bank of New YorkOperating profit Net operating incomeOrganic movement At level foreign exchange rates and after adjusting for exceptional items, acquisitions and
disposals for continuing operationsOwn shares Treasury stockPound sterling, sterling, £, pence, p UK currencyPrice/mix Price/mix is the number of percentage points by which the organic movement in net sales
exceeds the organic movement in volume. The difference arises because of changes in thecomposition of sales between higher and lower priced variants or as price changes areimplemented
Profit EarningsProfit for the year Net incomeProvisions Accruals for losses/contingenciesReserves Accumulated earnings, other comprehensive income and additional paid in capitalRPI Retail price indexRTD Ready to drink products. Ready to drink also include ready to serve products, such as pre
mix cans in some markets, and progressive adult beverages in the United States and certainmarkets supplied by the United States.
SEC US Securities and Exchange CommissionShare premium Additional paid in capital or paid in surplusShareholders’ funds Shareholders’ equityShares Common stockShares and ordinary shares Diageo plc’s ordinary sharesShares in issue Shares issued and outstandingTrade and other payables Accounts payable and accrued liabilitiesTrade and other receivables Accounts receivableUS dollar, US$, $, ¢ US currency
266

