diagnosing and resolving spinlock contention on...
TRANSCRIPT
Diagnosing and Resolving Spinlock Contention on SQL Server
Microsoft Corporation
Published: June, 2011
Summary This paper provides in-depth information about the methodology the Microsoft SQL Server Customer Advisory Team (SQLCAT) team uses to identify and resolve issues related to spinlock contention observed when running SQL Server 2008 and SQL Server 2008 R2 applications on high-concurrency systems.

Copyright
This document is provided “as-is”. Information and views expressed in this document, including
URL and other Internet Web site references, may change without notice. You bear the risk of
using it.
Some examples depicted herein are provided for illustration only and are fictitious. No real
association or connection is intended or should be inferred.
This document does not provide you with any legal rights to any intellectual property in any
Microsoft product. You may copy and use this document for your internal, reference purposes.
© 2011 Microsoft Corporation. All rights reserved.
Contents
Diagnosing and Resolving Spinlock Contention on SQL Server ..................................................... 4
What's in this paper? .................................................................................................................... 4
Acknowledgments ........................................................................................................................ 4
Diagnosing and Resolving SpinLock Contention Issues ................................................................. 5
In This Section .............................................................................................................................. 5
Symptoms and Causes of SQL Server Spinlock Contention .......................................................... 6
Symptoms and Causes of SQL Server Spinlock Contention ....................................................... 6
Symptoms of SQL Server Spinlock Contention ........................................................................... 6
Typical Scenarios for SQL Server Spinlock Contention............................................................... 9
Diagnosing SQL Server Spinlock Contention ................................................................................ 12
Diagnosing SQL Server Spinlock Contention ............................................................................ 12
Walkthrough: Diagnosing a Spinlock Contention Issue ............................................................. 13
Options and Workarounds for Handling SQL Server Spinlock Contention ................................... 19
Appendix A: Automating the Process of Capturing Memory Dumps to Analyze Spinlock
Contention .................................................................................................................................. 20
SQL Query for Capturing Memory Dumps ................................................................................. 21
Appendix B: Capturing Spinlocks Statistics Over a Specific Time Period..................................... 26
4
Diagnosing and Resolving Spinlock Contention on SQL Server
Welcome to the Diagnosing and Resolving Spinlock Contention on SQL Server paper. While
working with mission critical customer systems the Microsoft SQL Server Customer Advisory
Team (SQLCAT) have developed a methodology which we use to identify and resolve particular
resource contention issues observed when running SQL Server 2008 and SQL Server 2008 R2
on high concurrency systems.
We created this guide to provide in-depth information about identifying and resolving resource
contention issues related to spinlock contention observed when running SQL Server 2008
applications on high concurrency systems with certain workloads.
The recommendations and best practices documented here are based on real-world experience
during the development and deployment of real world OLTP systems.
To download a copy of this guide in chm, pdf, or docx form, go to
http://go.microsoft.com/fwlink/?LinkId=223366.
This paper applies to SQL Server 2005 and later.
What's in this paper? This guide describes how to identify and resolve spinlock contention issues observed when
running SQL Server 2008 applications on high concurrency systems with certain workloads.
Specifically, this guide includes the following main section:
Diagnosing and Resolving SpinLock Contention Issues – The Diagnosing and Resolving
SpinLock Contention Issues section analyzes analyze the lessons learned by the SQLCAT
team from diagnosing and resolving spinlock contention issues.
Acknowledgments We in the SQL Server User Education team gratefully acknowledge the outstanding contributions
of the following individuals for providing both technical feedback as well as a good deal of content
for this paper:
Authors
Ewan Fairweather, Microsoft SQLCAT
Mike Ruthruff, Microsoft SQLCAT
Contributors
Fabricio Voznika, Microsoft Development
Jack Richins, Microsoft Development
Note
5
Thomas Kejser, Microsoft Program Management
Reviewers
Prem Mehra, Microsoft Program Management
Steve Howard, Microsoft Program Management
Paul S. Randal, SQLskills.com
Kun Chen, Microsoft Development
Gus Apostol, Microsoft Program Management
Sanjay Mishra, Microsoft Program Management
Alexei Khalyako, Microsoft Program Management
Diagnosing and Resolving SpinLock Contention Issues
Historically, commodity Windows Server computers have utilized only one or two
microprocessor/CPU chips, and CPUs have been designed with only a single processor or “core”.
Increases in computer processing capacity have been achieved through the use of faster CPUs,
made possible largely through advancements in transistor density. Following “Moore‟s Law”,
transistor density or the number of transistors which can be placed on an integrated circuit have
consistently doubled every 2 years since the development of the first general purpose single chip
CPU in 1971. In recent years, the traditional approach of increasing computer processing
capacity with faster CPUs has been augmented by building computers with multiple CPUs. As of
this writing, the Intel Nehalem CPU architecture accommodates up to 8 cores per CPU, which
when used in an 8 socket system can then be doubled to 128 logical processors through the use
of hyper-threading technology. As the number of logical processors on x86 compatible computers
increases so too does the possibility that concurrency related issues may occur when logical
processors compete for resources. This guide describes how to identify and resolve particular
resource contention issues observed when running SQL Server 2008 and SQL Server 2008 R2
applications on high concurrency systems with some workloads.
In this section we will analyze the lessons learned by the SQLCAT team from diagnosing and
resolving spinlock contention issues, which are one class of concurrency issues observed in real
customer workloads on high scale systems.
In This Section Symptoms and Causes of SQL Server Spinlock Contention
Diagnosing SQL Server Spinlock Contention
Options and Workarounds for Handling SQL Server Spinlock Contention
Appendix A: Automating the Process of Capturing Memory Dumps to Analyze Spinlock
Contention
Appendix B: Capturing Spinlocks Statistics Over a Specific Time Period
6
Symptoms and Causes of SQL Server Spinlock Contention
This section describes how to diagnose issues with “spinlock contention”, which can be
detrimental to the performance of an OLTP application running on SQL Server 2008 R2.
Spinlock diagnosis and troubleshooting should be considered an advanced topic which requires
knowledge of debugging tools and Windows internals. For the remainder of this topic it will be
assumed that the reader has some level of knowledge or familiarity with these. Many of the
spinlock types are undocumented and interpreting these requires knowledge of SQL Engine
internals.
This paper is not meant to serve as documentation of all spinlock types. The intention of this
paper is to provide the reader with the tools to investigate this type of contention and an
understanding of how to determine if the amount of contention being observed is problematic. We
will discuss some common scenarios and how best to approach and handle them.
Symptoms and Causes of SQL Server Spinlock Contention Spinlocks are lightweight synchronization primitives which are used to protect access to data
structures. Spinlocks are not unique to SQL Server. They are generally used when it is expected
that access to a given data structure will need to be held for a very short period of time. When a
thread attempting to acquire a spinlock is unable to obtain access it executes in a loop
periodically checking to determine if the resource is available instead of immediately yielding.
After some period of time a thread waiting on a spinlock will yield before it is able to acquire the
resource in order to allow other threads running on the same CPU to execute. This is known as a
backoff and will be discussed in more depth later in this paper.
SQL Server utilizes spinlocks to protect access to some of its internal data structures. These are
used within the engine to serialize access to certain data structures in a similar fashion to latches.
The main difference between a latch and a spinlock is the fact that spinlocks will spin (execute a
loop) for a period of time checking for availability of a data structure while a thread attempting to
acquire access to a structure protected by a latch will immediately yield if the resource is not
available. Yielding requires context switching of a thread off the CPU so that another thread can
execute. This is a relatively expensive operation and for resources that are held for a very short
duration it is more efficient overall to allow a thread to execute in a loop periodically checking for
availability of the resource.
Symptoms of SQL Server Spinlock Contention On any busy high concurrency system it is normal to see active contention on frequently
accessed structures that are protected by spinlocks. This is only considered problematic when
the contention is such that it introduces significant CPU overhead. Spinlock statistics are exposed
7
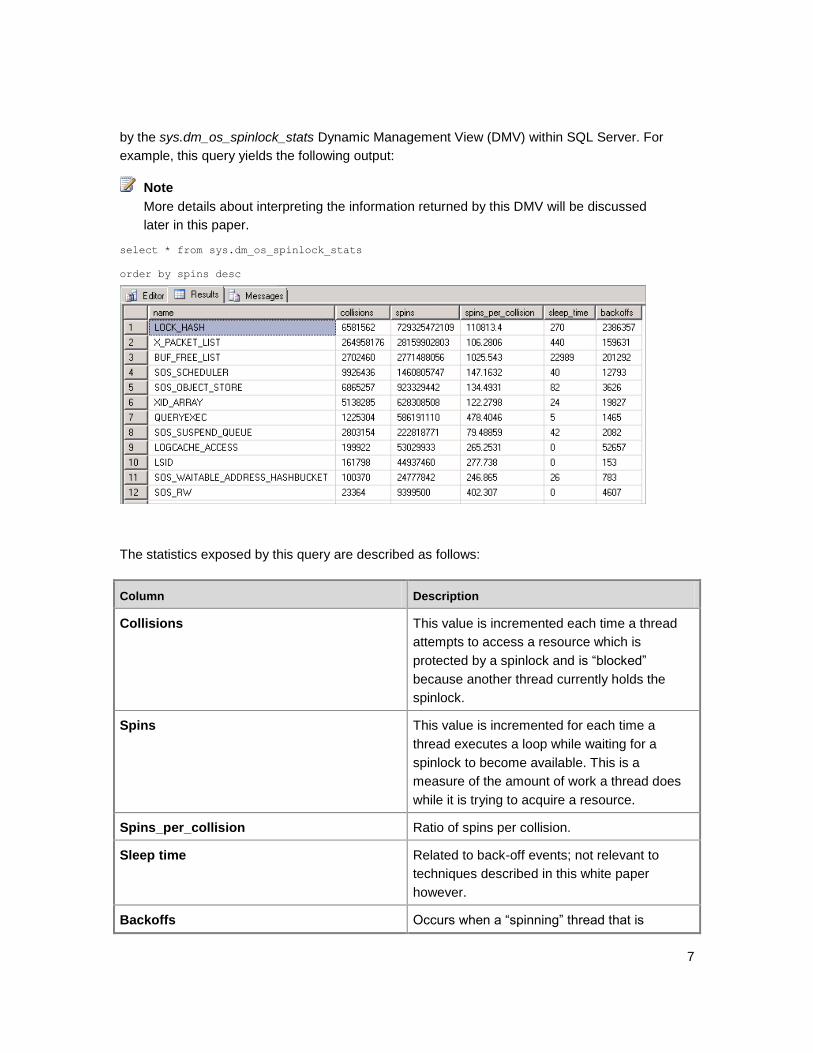
by the sys.dm_os_spinlock_stats Dynamic Management View (DMV) within SQL Server. For
example, this query yields the following output:
More details about interpreting the information returned by this DMV will be discussed
later in this paper.
select * from sys.dm_os_spinlock_stats
order by spins desc
The statistics exposed by this query are described as follows:
Column Description
Collisions This value is incremented each time a thread
attempts to access a resource which is
protected by a spinlock and is “blocked”
because another thread currently holds the
spinlock.
Spins This value is incremented for each time a
thread executes a loop while waiting for a
spinlock to become available. This is a
measure of the amount of work a thread does
while it is trying to acquire a resource.
Spins_per_collision Ratio of spins per collision.
Sleep time Related to back-off events; not relevant to
techniques described in this white paper
however.
Backoffs Occurs when a “spinning” thread that is
Note
8
Column Description
attempting to access a held resource has
determined that it needs to allow other threads
on the same CPU to execute.
For purposes of this discussion, statistics of particular interest are the number of collisions, spins
and backoff events that occur within a specific period when the system is under heavy load.
When a thread attempts to access a resource protected by a spinlock a collision occurs. When a
collision occurs the collision count is incremented and the thread will begin to spin in a loop and
periodically check if the resource is available. Each time the thread spins (loops) the spin count
is incremented.
Spins per collision is a measure of the amount of spins occurring while a spinlock is being held by
a thread and will tell you how many spins are occurring while threads are holding the spinlock.
For example, small spins per collision and high collision count means there is a small amount of
spins occurring under the spinlock and there are many threads contending for it. A large amount
of spins means the time spent spinning in the spinlock code relatively long lived (i.e. the code is
going over a large number of entries in a hash bucket). As contention increases (thus increasing
collision count), the number of spins also increases.
Backoffs may be thought of in a similar fashion to spins. By design, to avoid excessive CPU
waste, spinlocks will not continue spinning indefinitely until they can access a held resource. To
ensure a spinlock does not excessively use CPU resource, spinlocks will backoff, or stop spinning
and “sleep”, regardless of if they ever obtain ownership the held resource. This is done to allow
other threads to be scheduled on the CPU in the hope that this.may allow more productive work
to happen. Default behavior for the engine is to spin for a constant time interval first before
performing a backoff. Attempting to obtain a spinlock requires that a state of cache concurrency is
maintained, which is a CPU intensive operation relative to the CPU cost of spinning. Therefore,
attempts to obtain a spinlock are performed sparingly and not performed each time a thread
spins. In SQL Server 2008 R2 certain spinlock types (for example: LOCK_HASH) were improved
by utilizing an exponentially increasing interval between attempts to acquire the spinlock (up to a
certain limit) which often reduces the impact on CPU performance.
The diagram below provides a conceptual view of the spinlock algorithm:
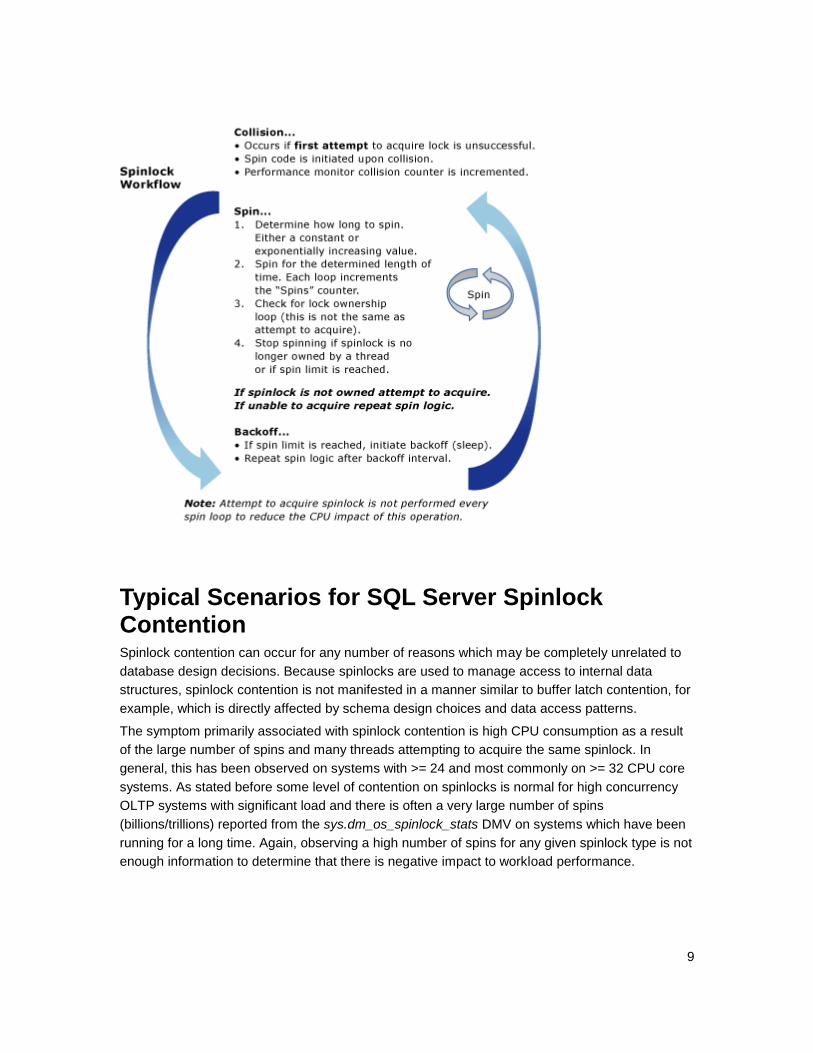
9
Typical Scenarios for SQL Server Spinlock Contention Spinlock contention can occur for any number of reasons which may be completely unrelated to
database design decisions. Because spinlocks are used to manage access to internal data
structures, spinlock contention is not manifested in a manner similar to buffer latch contention, for
example, which is directly affected by schema design choices and data access patterns.
The symptom primarily associated with spinlock contention is high CPU consumption as a result
of the large number of spins and many threads attempting to acquire the same spinlock. In
general, this has been observed on systems with >= 24 and most commonly on >= 32 CPU core
systems. As stated before some level of contention on spinlocks is normal for high concurrency
OLTP systems with significant load and there is often a very large number of spins
(billions/trillions) reported from the sys.dm_os_spinlock_stats DMV on systems which have been
running for a long time. Again, observing a high number of spins for any given spinlock type is not
enough information to determine that there is negative impact to workload performance.
10
Symptoms which may indicate spinlock contention:
1. A high number of spins and backoffs are observed for a particular spinlock type.
AND
2. The system is experiencing heavy CPU utilization or spikes in CPU consumption. In heavy
CPU scenarios one may also observe high signal waits on SOS_SCHEDULER_YEILD
(reported by the DMV sys.dm_os_wait_stats).
AND
3. The system is experiencing very high concurrency.
AND
4. The CPU usage and spins are increased disproportionate to throughput.
Even if each of the preceding conditions is true it is still possible that the root cause of
high CPU consumption lies elsewhere. In fact, in the vast majority of the cases increased
CPU will be due to reasons other than spinlock contention. Some of the more common
causes for increased CPU consumption include:
1. Queries which become more expensive over time due to growth of the underlying data
resulting in the need to perform additional logical reads of memory resident data.
2. Changes in query plans resulting in suboptimal execution.
With that said, if each of the conditions listed above is true then it would be advisable to
perform further investigation into possible spinlock contention issues.
One common phenomenon easily diagnosed is a significant divergence in throughput and CPU
usage. Many OLTP workloads have a relationship between (throughput / number of users on the
system) and CPU consumption. High spins observed in conjunction with a significant divergence
of CPU consumption and throughput can be an indication of spinlock contention introducing CPU
overhead. An important thing to note here is that it is also very common to see this type of
divergence on systems when certain queries become more expensive over time. For example,
queries which are issued against datasets which perform more logical reads over time may result
in similar symptoms.
It is critical to rule out other more common causes of high CPU when troubleshooting these types
of problems.
Example:
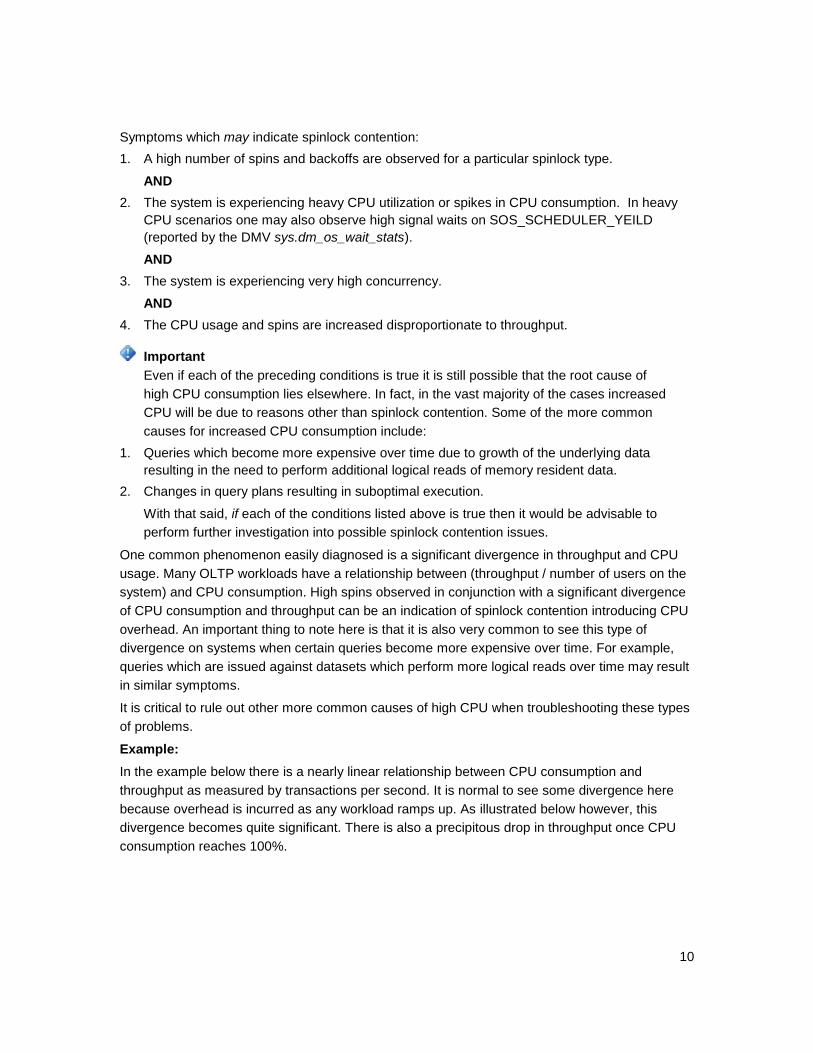
In the example below there is a nearly linear relationship between CPU consumption and
throughput as measured by transactions per second. It is normal to see some divergence here
because overhead is incurred as any workload ramps up. As illustrated below however, this
divergence becomes quite significant. There is also a precipitous drop in throughput once CPU
consumption reaches 100%.
Important
11
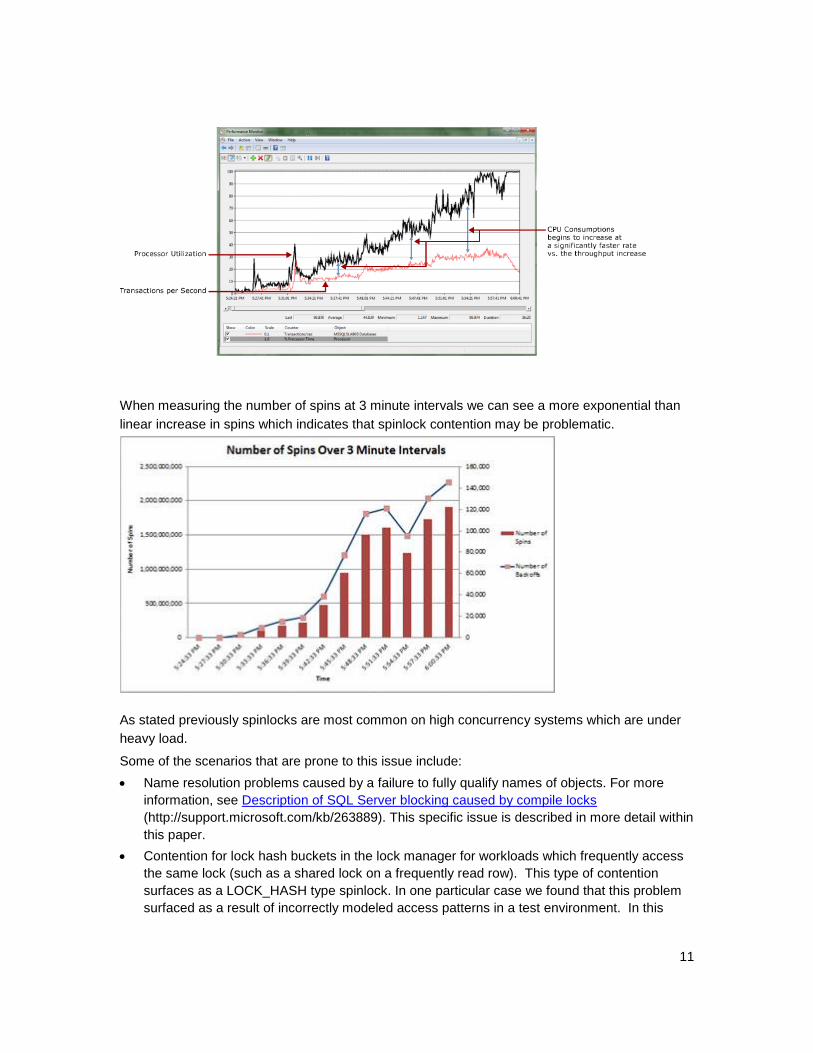
When measuring the number of spins at 3 minute intervals we can see a more exponential than
linear increase in spins which indicates that spinlock contention may be problematic.
As stated previously spinlocks are most common on high concurrency systems which are under
heavy load.
Some of the scenarios that are prone to this issue include:
Name resolution problems caused by a failure to fully qualify names of objects. For more
information, see Description of SQL Server blocking caused by compile locks
(http://support.microsoft.com/kb/263889). This specific issue is described in more detail within
this paper.
Contention for lock hash buckets in the lock manager for workloads which frequently access
the same lock (such as a shared lock on a frequently read row). This type of contention
surfaces as a LOCK_HASH type spinlock. In one particular case we found that this problem
surfaced as a result of incorrectly modeled access patterns in a test environment. In this
12
environment, more than the expected numbers of threads were constantly accessing the
exact same row due to incorrectly configured test parameters.
High rate of DTC transactions when there is high degree of latency between the MSDTC
transaction coordinators. This specific problem is documented in detail in the SQLCAT blog
entry Resolving DTC Related Waits and Tuning Scalability of DTC
(http://go.microsoft.com/fwlink/?LinkID=214413).
Diagnosing SQL Server Spinlock Contention
This section provides information for diagnosing SQL Server spinlock contention.
Diagnosing SQL Server Spinlock Contention The primary tools used to diagnose spinlock contention are:
1. Performance Monitor - Look for high CPU conditions or divergence between throughput and
CPU consumption.
2. The sys.dm_os_spinlock stats DMV - Look for a high number of spins and backoff events
over periods of time.
3. SQL Server Extended Events - Used to track call stacks for spinlocks which are
experiencing a high number of spins.
4. Memory Dumps - In some cases, memory dumps of the SQL Server process and the
Windows Debugging tools. In general, this level of analysis is done when the Microsoft SQL
Server support teams are engaged.
The general technical process for diagnosing SQL Server Spinlock contention is:
1. Step 1 – Determine that there is contention which may be spinlock related (see section
above).
2. Step 2 – Capture statistics from sys.dm_ os_spinlock_stats to find the spinlock type
experiencing the most contention.
3. Step 3 – Obtain debug symbols for sqlservr.exe (sqlservr.pdb) and place the symbols in the
same directory as the SQL Server service .exe file (sqlservr.exe) for the instance of SQL
Server.
In order to see the call stacks for the back off events, you must have symbols for the
particular version of SQL Server that you are running. Symbols for SQL Server are available
on the Microsoft Symbol Server. For more information about how to download symbols from
the Microsoft Symbol Server, see Microsoft Knowledge Base article 311503, Use the
Microsoft Symbol Server to obtain debug symbol files
(http://support.microsoft.com/kb/311503).
4. Step 4 – Use SQL Server Extended Events to trace the back off events for the spinlock types
of interest.
Extended Events provide the ability to track the "backoff" event and capture the call stack for
those operation(s) most prevalently trying to obtain the spinlock. By analyzing the call stack it
13
is possible to determine what type of operation is contributing to contention for any particular
spinlock.
Walkthrough: Diagnosing a Spinlock Contention Issue The following is a walkthrough of how to use the tools and techniques above to diagnose a
spinlock contention problem in a real world scenario. This is from a customer engagement
running a benchmark test to simulate approximately 6,500 concurrent users on an 8 socket, 64
physical core server with 1 TB of memory.
Symptoms
Periodic spikes in CPU were observed which pushed the CPU utilization to nearly 100%. A
divergence between throughput and CPU consumption was observed leading up to the problem.
By the time that the large CPU spike occurred, a pattern of a very large number of spins occurring
during times of heavy CPU usage at particular intervals was established.
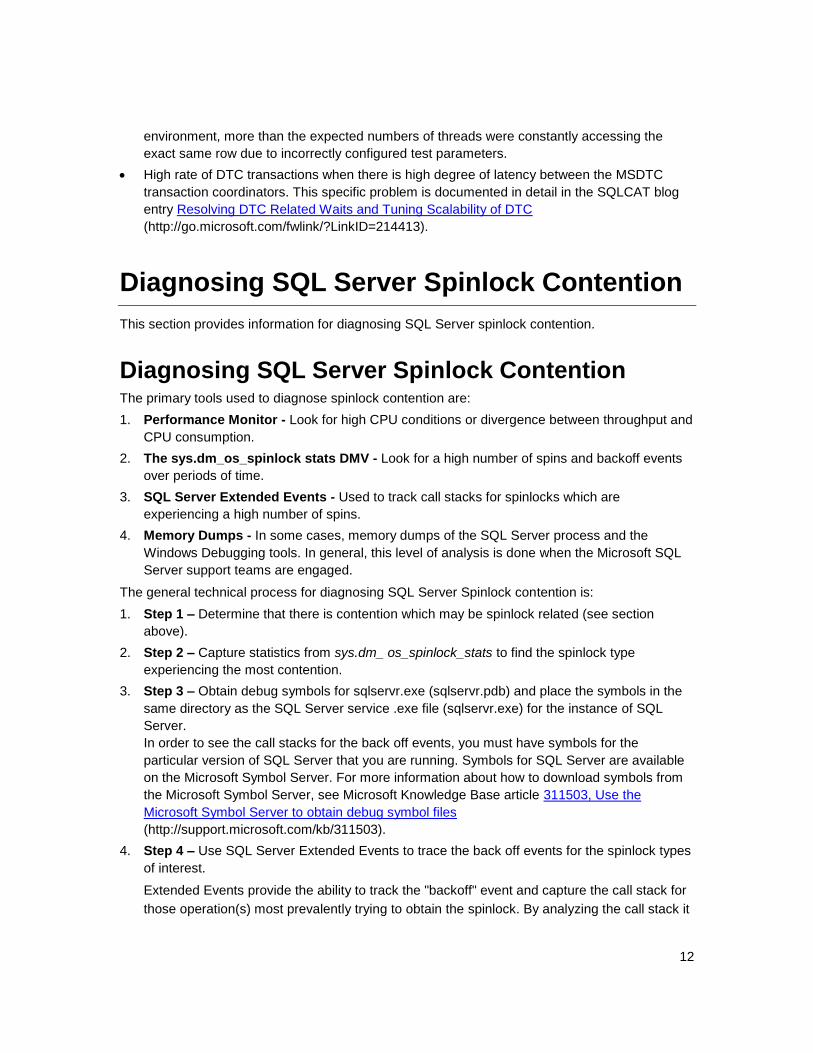
This was an extreme case in which the contention was such that it created a spinlock convoy
condition. A convoy occurs when threads can no longer make progress servicing the workload
but instead spend all processing resources attempting to gain access to the lock. The
performance monitor log illustrates this divergence between transaction log throughput and CPU
consumption, and ultimately the very large spike in CPU utilization.
14
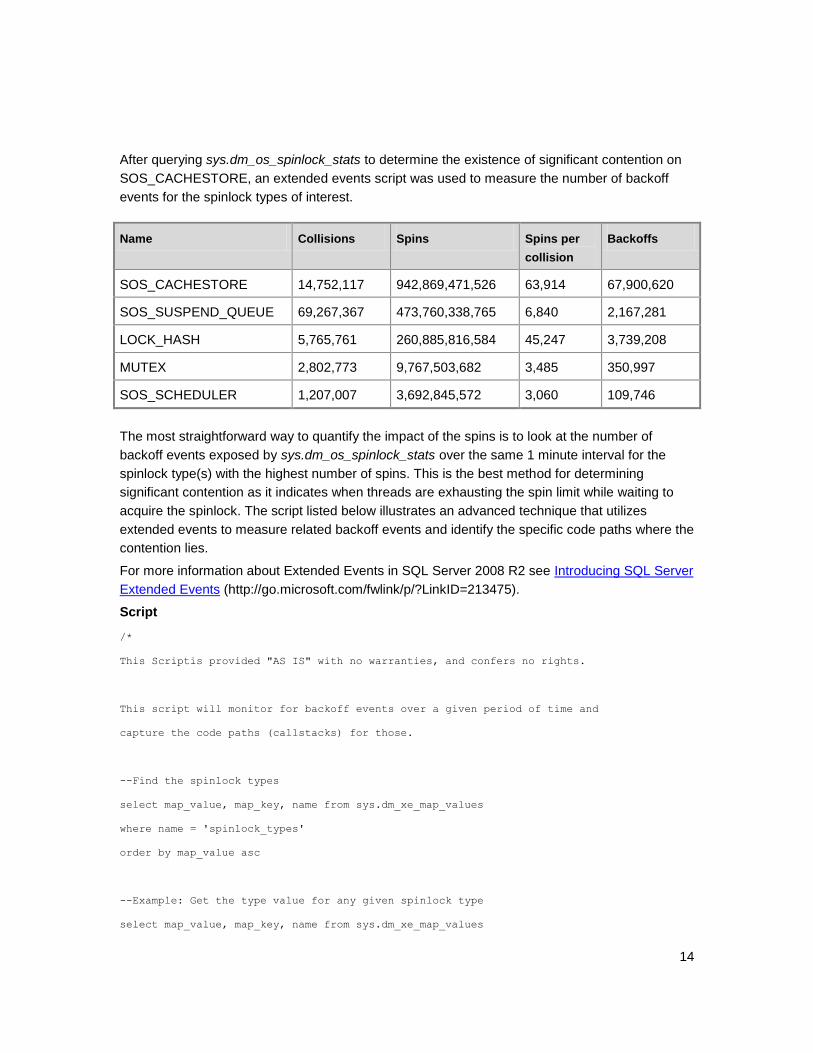
After querying sys.dm_os_spinlock_stats to determine the existence of significant contention on
SOS_CACHESTORE, an extended events script was used to measure the number of backoff
events for the spinlock types of interest.
Name Collisions Spins Spins per
collision
Backoffs
SOS_CACHESTORE 14,752,117 942,869,471,526 63,914 67,900,620
SOS_SUSPEND_QUEUE 69,267,367 473,760,338,765 6,840 2,167,281
LOCK_HASH 5,765,761 260,885,816,584 45,247 3,739,208
MUTEX 2,802,773 9,767,503,682 3,485 350,997
SOS_SCHEDULER 1,207,007 3,692,845,572 3,060 109,746
The most straightforward way to quantify the impact of the spins is to look at the number of
backoff events exposed by sys.dm_os_spinlock_stats over the same 1 minute interval for the
spinlock type(s) with the highest number of spins. This is the best method for determining
significant contention as it indicates when threads are exhausting the spin limit while waiting to
acquire the spinlock. The script listed below illustrates an advanced technique that utilizes
extended events to measure related backoff events and identify the specific code paths where the
contention lies.
For more information about Extended Events in SQL Server 2008 R2 see Introducing SQL Server
Extended Events (http://go.microsoft.com/fwlink/p/?LinkID=213475).
Script
/*
This Scriptis provided "AS IS" with no warranties, and confers no rights.
This script will monitor for backoff events over a given period of time and
capture the code paths (callstacks) for those.
--Find the spinlock types
select map_value, map_key, name from sys.dm_xe_map_values
where name = 'spinlock_types'
order by map_value asc
--Example: Get the type value for any given spinlock type
select map_value, map_key, name from sys.dm_xe_map_values
15
where map_value IN ('SOS_CACHESTORE', 'LOCK_HASH', 'MUTEX')
Examples:
61LOCK_HASH
144 SOS_CACHESTORE
08MUTEX
*/
--create the even session that will capture the callstacks to a bucketizer
--more information is available in this reference: http://msdn.microsoft.com/en-
us/library/bb630354.aspx
create event session spin_lock_backoff on server
add event sqlos.spinlock_backoff (action (package0.callstack)
where
type = 61--LOCK_HASH
or type = 144--SOS_CACHESTORE
or type = 8--MUTEX
)
add target package0.asynchronous_bucketizer (
set filtering_event_name='sqlos.spinlock_backoff',
source_type=1, source='package0.callstack')
with (MAX_MEMORY=50MB, MEMORY_PARTITION_MODE = PER_NODE)
--Ensure the session was created
select * from sys.dm_xe_sessions
where name = 'spin_lock_backoff'
--Run this section to measure the contention
alter event session spin_lock_backoff on server state=start
--wait to measure the number of backoffs over a 1 minute period
waitfor delay '00:01:00'
16
--To view the data
--1. Ensure the sqlservr.pdb is in the same directory as the sqlservr.exe
--2. Enable this trace flag to turn on symbol resolution
DBCC traceon (3656, -1)
--Get the callstacks from the bucketize target
select event_session_address, target_name, execution_count, cast (target_data as XML)
from sys.dm_xe_session_targets xst
inner join sys.dm_xe_sessions xs on (xst.event_session_address = xs.address)
where xs.name = 'spin_lock_backoff'
--clean up the session
alter event session spin_lock_backoff on server state=stop
drop event session spin_lock_backoff on server
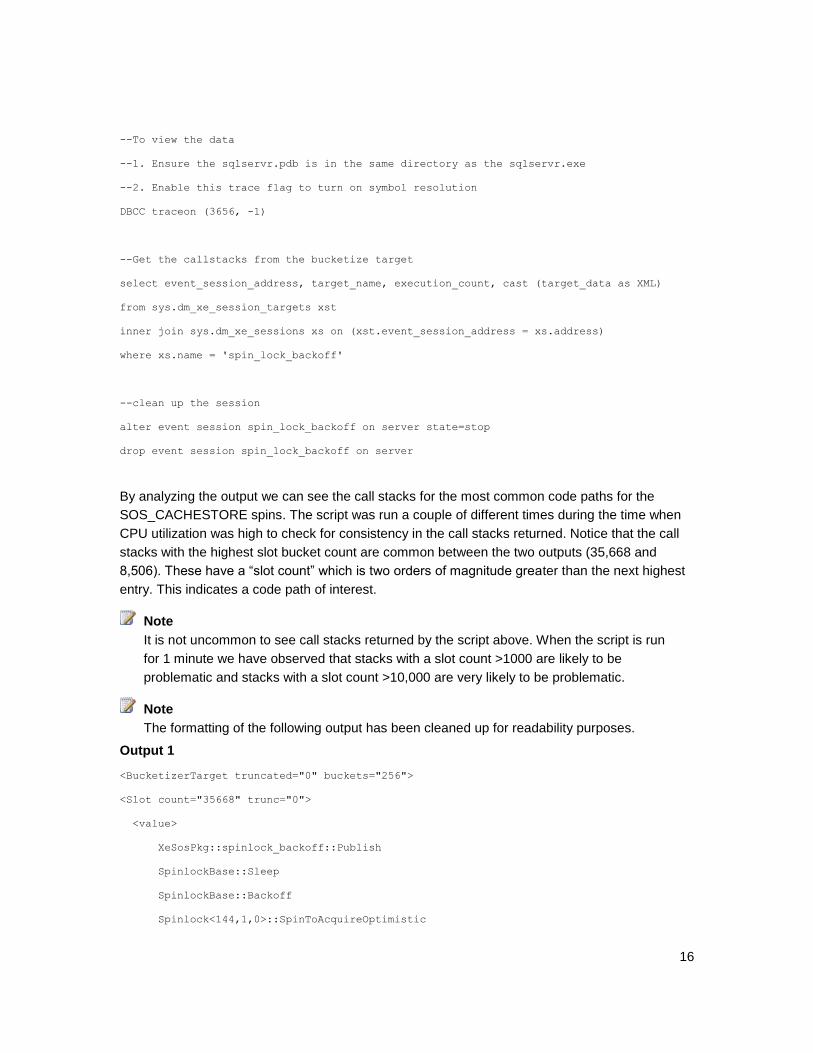
By analyzing the output we can see the call stacks for the most common code paths for the
SOS_CACHESTORE spins. The script was run a couple of different times during the time when
CPU utilization was high to check for consistency in the call stacks returned. Notice that the call
stacks with the highest slot bucket count are common between the two outputs (35,668 and
8,506). These have a “slot count” which is two orders of magnitude greater than the next highest
entry. This indicates a code path of interest.
It is not uncommon to see call stacks returned by the script above. When the script is run
for 1 minute we have observed that stacks with a slot count >1000 are likely to be
problematic and stacks with a slot count >10,000 are very likely to be problematic.
The formatting of the following output has been cleaned up for readability purposes.
Output 1
<BucketizerTarget truncated="0" buckets="256">
<Slot count="35668" trunc="0">
<value>
XeSosPkg::spinlock_backoff::Publish
SpinlockBase::Sleep
SpinlockBase::Backoff
Spinlock<144,1,0>::SpinToAcquireOptimistic
Note
Note
17
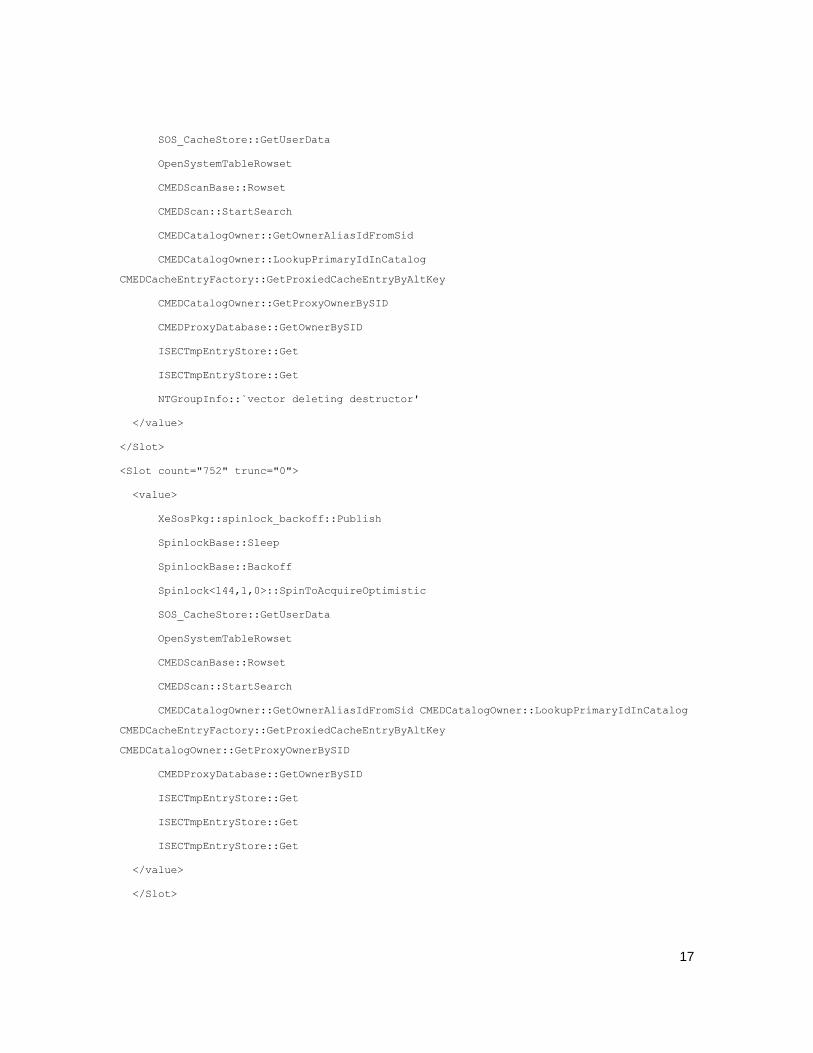
SOS_CacheStore::GetUserData
OpenSystemTableRowset
CMEDScanBase::Rowset
CMEDScan::StartSearch
CMEDCatalogOwner::GetOwnerAliasIdFromSid
CMEDCatalogOwner::LookupPrimaryIdInCatalog
CMEDCacheEntryFactory::GetProxiedCacheEntryByAltKey
CMEDCatalogOwner::GetProxyOwnerBySID
CMEDProxyDatabase::GetOwnerBySID
ISECTmpEntryStore::Get
ISECTmpEntryStore::Get
NTGroupInfo::`vector deleting destructor'
</value>
</Slot>
<Slot count="752" trunc="0">
<value>
XeSosPkg::spinlock_backoff::Publish
SpinlockBase::Sleep
SpinlockBase::Backoff
Spinlock<144,1,0>::SpinToAcquireOptimistic
SOS_CacheStore::GetUserData
OpenSystemTableRowset
CMEDScanBase::Rowset
CMEDScan::StartSearch
CMEDCatalogOwner::GetOwnerAliasIdFromSid CMEDCatalogOwner::LookupPrimaryIdInCatalog
CMEDCacheEntryFactory::GetProxiedCacheEntryByAltKey
CMEDCatalogOwner::GetProxyOwnerBySID
CMEDProxyDatabase::GetOwnerBySID
ISECTmpEntryStore::Get
ISECTmpEntryStore::Get
ISECTmpEntryStore::Get
</value>
</Slot>
18
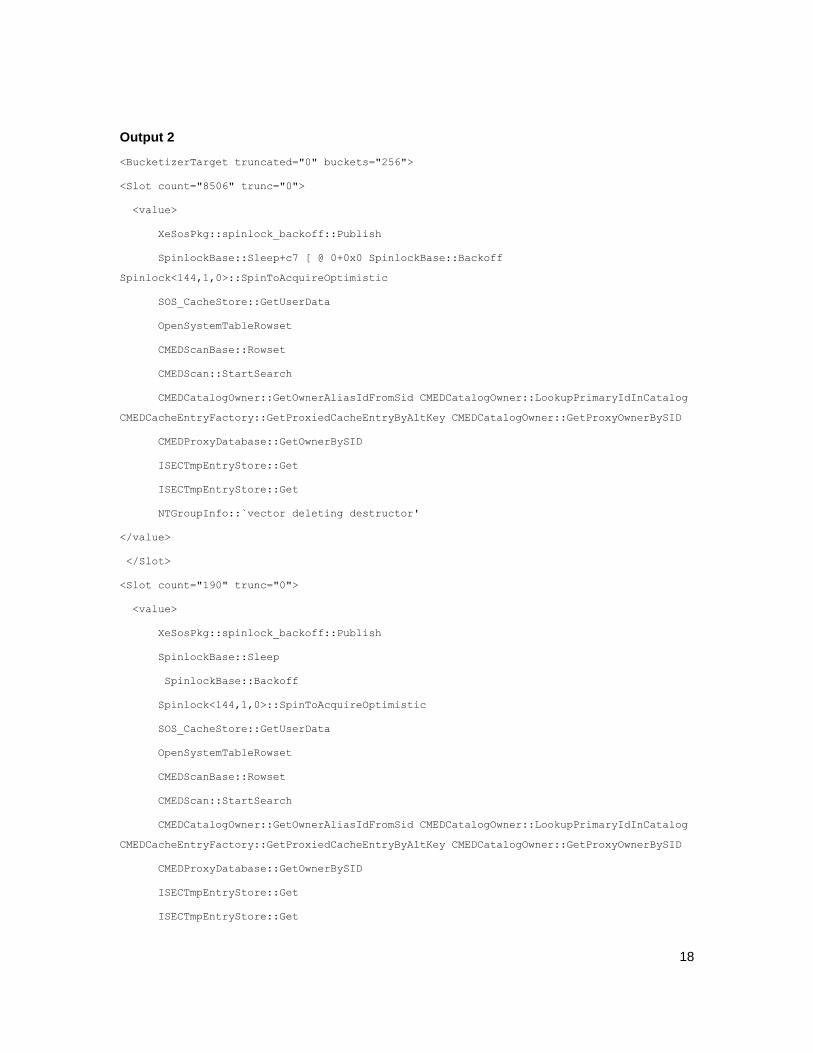
Output 2
<BucketizerTarget truncated="0" buckets="256">
<Slot count="8506" trunc="0">
<value>
XeSosPkg::spinlock_backoff::Publish
SpinlockBase::Sleep+c7 [ @ 0+0x0 SpinlockBase::Backoff
Spinlock<144,1,0>::SpinToAcquireOptimistic
SOS_CacheStore::GetUserData
OpenSystemTableRowset
CMEDScanBase::Rowset
CMEDScan::StartSearch
CMEDCatalogOwner::GetOwnerAliasIdFromSid CMEDCatalogOwner::LookupPrimaryIdInCatalog
CMEDCacheEntryFactory::GetProxiedCacheEntryByAltKey CMEDCatalogOwner::GetProxyOwnerBySID
CMEDProxyDatabase::GetOwnerBySID
ISECTmpEntryStore::Get
ISECTmpEntryStore::Get
NTGroupInfo::`vector deleting destructor'
</value>
</Slot>
<Slot count="190" trunc="0">
<value>
XeSosPkg::spinlock_backoff::Publish
SpinlockBase::Sleep
SpinlockBase::Backoff
Spinlock<144,1,0>::SpinToAcquireOptimistic
SOS_CacheStore::GetUserData
OpenSystemTableRowset
CMEDScanBase::Rowset
CMEDScan::StartSearch
CMEDCatalogOwner::GetOwnerAliasIdFromSid CMEDCatalogOwner::LookupPrimaryIdInCatalog
CMEDCacheEntryFactory::GetProxiedCacheEntryByAltKey CMEDCatalogOwner::GetProxyOwnerBySID
CMEDProxyDatabase::GetOwnerBySID
ISECTmpEntryStore::Get
ISECTmpEntryStore::Get
19
ISECTmpEntryStore::Get
</value>
</Slot>
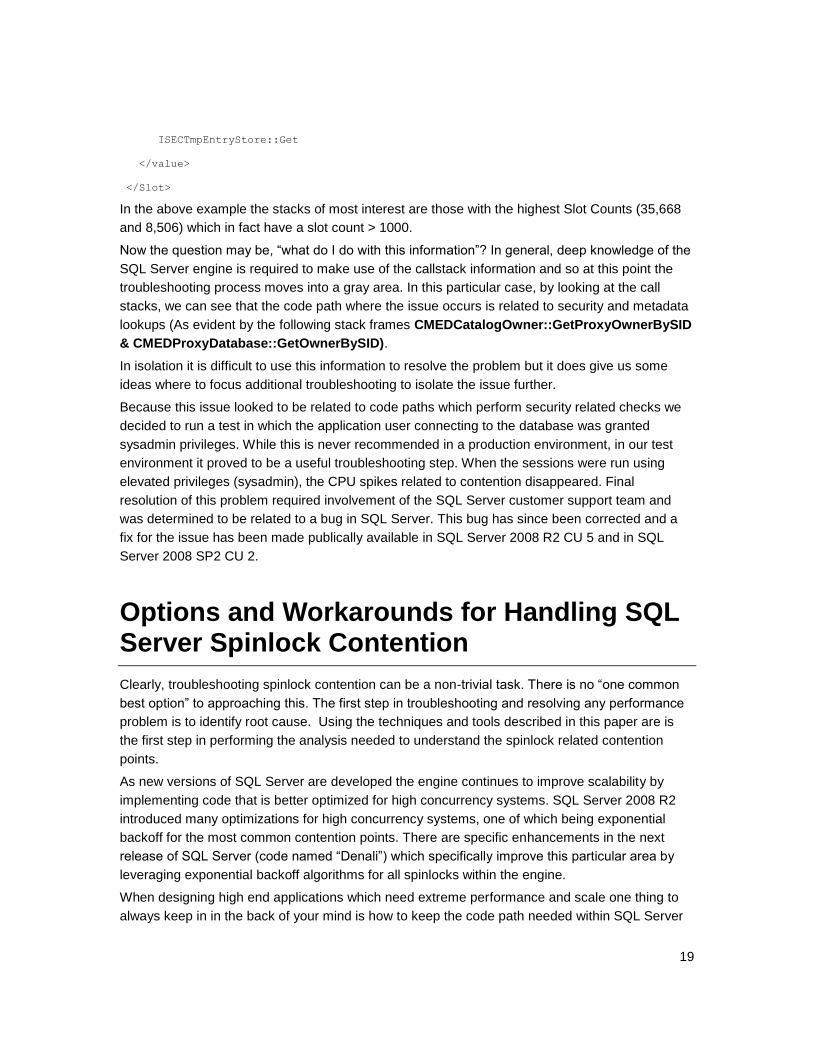
In the above example the stacks of most interest are those with the highest Slot Counts (35,668
and 8,506) which in fact have a slot count > 1000.
Now the question may be, “what do I do with this information”? In general, deep knowledge of the
SQL Server engine is required to make use of the callstack information and so at this point the
troubleshooting process moves into a gray area. In this particular case, by looking at the call
stacks, we can see that the code path where the issue occurs is related to security and metadata
lookups (As evident by the following stack frames CMEDCatalogOwner::GetProxyOwnerBySID
& CMEDProxyDatabase::GetOwnerBySID).
In isolation it is difficult to use this information to resolve the problem but it does give us some
ideas where to focus additional troubleshooting to isolate the issue further.
Because this issue looked to be related to code paths which perform security related checks we
decided to run a test in which the application user connecting to the database was granted
sysadmin privileges. While this is never recommended in a production environment, in our test
environment it proved to be a useful troubleshooting step. When the sessions were run using
elevated privileges (sysadmin), the CPU spikes related to contention disappeared. Final
resolution of this problem required involvement of the SQL Server customer support team and
was determined to be related to a bug in SQL Server. This bug has since been corrected and a
fix for the issue has been made publically available in SQL Server 2008 R2 CU 5 and in SQL
Server 2008 SP2 CU 2.
Options and Workarounds for Handling SQL Server Spinlock Contention
Clearly, troubleshooting spinlock contention can be a non-trivial task. There is no “one common
best option” to approaching this. The first step in troubleshooting and resolving any performance
problem is to identify root cause. Using the techniques and tools described in this paper are is
the first step in performing the analysis needed to understand the spinlock related contention
points.
As new versions of SQL Server are developed the engine continues to improve scalability by
implementing code that is better optimized for high concurrency systems. SQL Server 2008 R2
introduced many optimizations for high concurrency systems, one of which being exponential
backoff for the most common contention points. There are specific enhancements in the next
release of SQL Server (code named “Denali”) which specifically improve this particular area by
leveraging exponential backoff algorithms for all spinlocks within the engine.
When designing high end applications which need extreme performance and scale one thing to
always keep in in the back of your mind is how to keep the code path needed within SQL Server
20
as short as possible. Just as one would do this in application development, the same technique
can be leveraged by following SQL Server best practices. A shorter code path means less work is
performed by the database engine and will naturally avoid contention points. Many best practices
have a side effect of reducing the amount of work required of the engine, and hence, result
optimizing workload performance.
Taking a couple best practices from earlier in this paper as examples:
1. Fully Qualified Names: Fully qualifying names of all objects will result in removing the need
for SQL Server to execute code paths that are required to resolve names. We have
observed contention points also on the SOS_CACHESTORE spinlock type encountered
when not utilizing fully qualified names in calls to stored procedures. Failure to fully qualify
these the names results in the need for SQL Server to lookup the default schema for the user
which results in a longer code path required to execute the SQL.
2. Parameterized Queries: Another example is utilizing parameterized queries and stored
procedure calls to reduce the work needed to generate execution plans. This again results in
a shorter code path for execution.
3. LOCK_HASH Contention: Contention on certain lock structure or hash bucket collisions is
unavoidable in some cases. Even though the SQL Server engine partitions the majority of
lock structures, there are still times when acquiring a lock results in access the same hash
bucket. For example, an application the accesses the same row by many threads
concurrently (i.e. reference data). This type of problems can be approached by techniques
which either scale out this reference data within the database schema or leverage NOLOCK
hints when possible.
The first line of defensive in tuning SQL Server workloads is always the standard tuning practices
(e.g. indexing, query optimization, I/O optimization, etc…). However, in addition to the standard
tuning one would perform, following practices that reduce the amount of code needed to perform
operations is an important approach. Even when best practices are followed, there is still a
chance that spinlock contention may occur on very busy high concurrency systems. Use of the
tools and techniques in this paper can help to isolate or rule out these types of problems and
determine when it is necessary to engage the right Microsoft resources to help.
Hopefully these techniques will provide both a useful methodology for this type of troubleshooting
and insight into some of the more advanced performance profiling techniques available with SQL
Server.
Appendix A: Automating the Process of Capturing Memory Dumps to Analyze Spinlock Contention
The following extended events script has proven to be useful to automate the collection of
memory dumps when spinlock contention becomes significant. In some cases memory dumps
will be required to perform a complete diagnosis of the problem or will be requested by Microsoft
support teams to perform in depth analysis. In SQL Server 2008 there is a limit of 16 frames in
21
callstacks captured by the bucketizer, which may not be deep enough to determine exactly where
in the engine the callstack is being entered from. This is improved in the next version of SQL
Server codename „Denali‟ by increasing the number of frames in callstacks captured by the
bucketizer to 32.
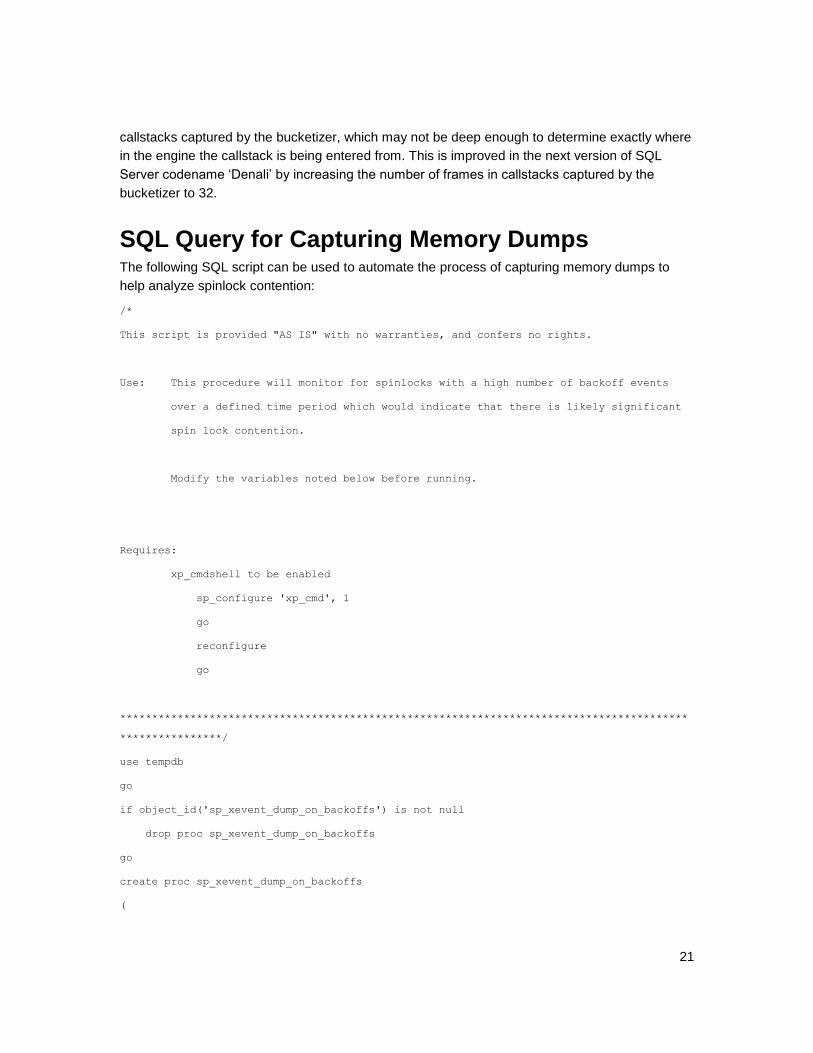
SQL Query for Capturing Memory Dumps The following SQL script can be used to automate the process of capturing memory dumps to
help analyze spinlock contention:
/*
This script is provided "AS IS" with no warranties, and confers no rights.
Use: This procedure will monitor for spinlocks with a high number of backoff events
over a defined time period which would indicate that there is likely significant
spin lock contention.
Modify the variables noted below before running.
Requires:
xp_cmdshell to be enabled
sp_configure 'xp_cmd', 1
go
reconfigure
go
*****************************************************************************************
****************/
use tempdb
go
if object_id('sp_xevent_dump_on_backoffs') is not null
drop proc sp_xevent_dump_on_backoffs
go
create proc sp_xevent_dump_on_backoffs
(
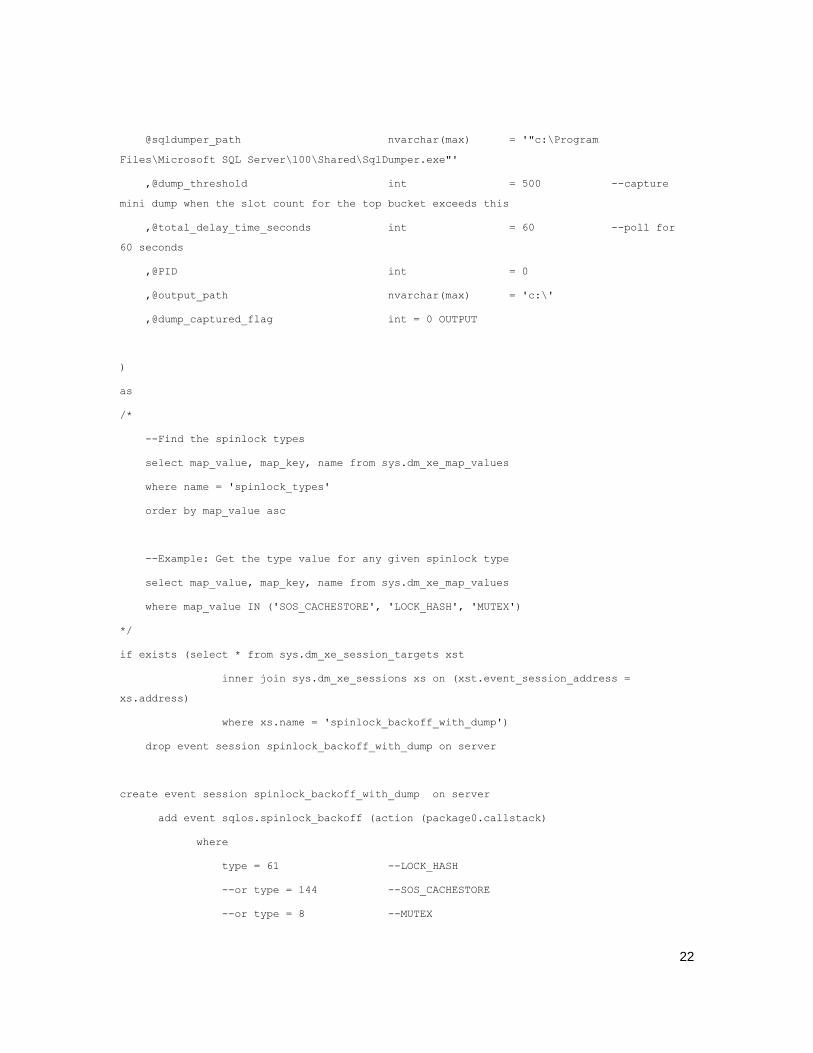
22
@sqldumper_path nvarchar(max) = '"c:\Program
Files\Microsoft SQL Server\100\Shared\SqlDumper.exe"'
,@dump_threshold int = 500 --capture
mini dump when the slot count for the top bucket exceeds this
,@total_delay_time_seconds int = 60 --poll for
60 seconds
,@PID int = 0
,@output_path nvarchar(max) = 'c:\'
,@dump_captured_flag int = 0 OUTPUT
)
as
/*
--Find the spinlock types
select map_value, map_key, name from sys.dm_xe_map_values
where name = 'spinlock_types'
order by map_value asc
--Example: Get the type value for any given spinlock type
select map_value, map_key, name from sys.dm_xe_map_values
where map_value IN ('SOS_CACHESTORE', 'LOCK_HASH', 'MUTEX')
*/
if exists (select * from sys.dm_xe_session_targets xst
inner join sys.dm_xe_sessions xs on (xst.event_session_address =
xs.address)
where xs.name = 'spinlock_backoff_with_dump')
drop event session spinlock_backoff_with_dump on server
create event session spinlock_backoff_with_dump on server
add event sqlos.spinlock_backoff (action (package0.callstack)
where
type = 61 --LOCK_HASH
--or type = 144 --SOS_CACHESTORE
--or type = 8 --MUTEX
23
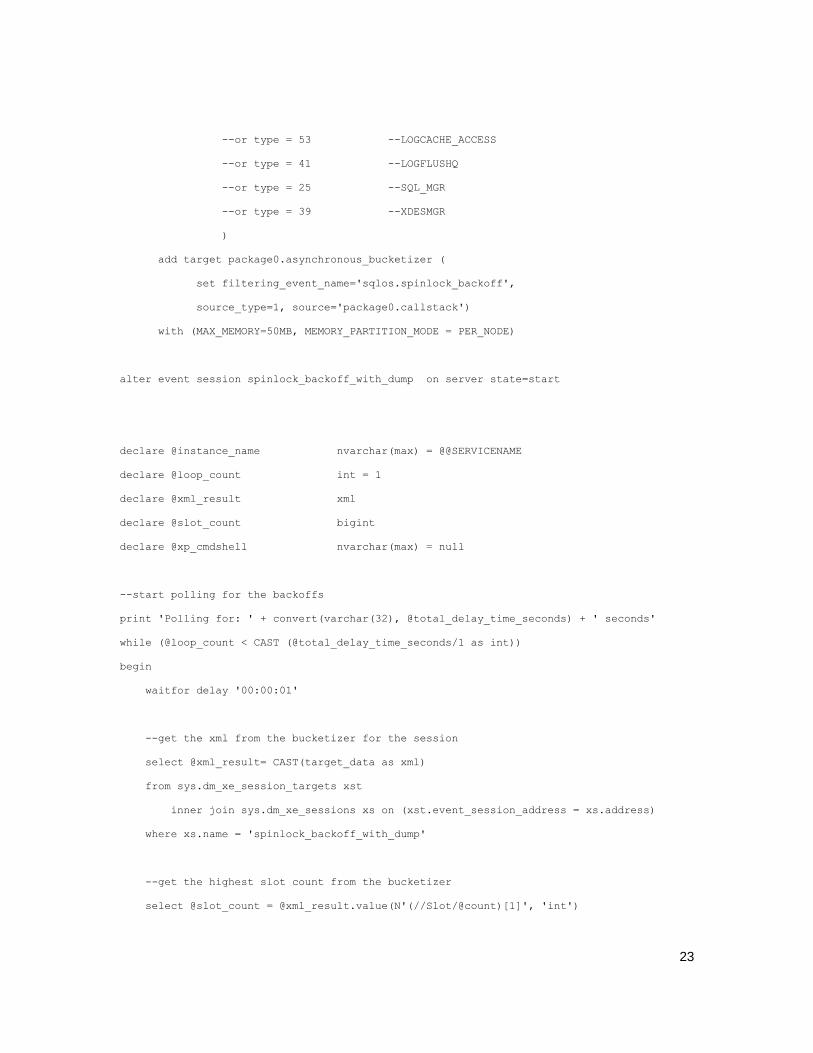
--or type = 53 --LOGCACHE_ACCESS
--or type = 41 --LOGFLUSHQ
--or type = 25 --SQL_MGR
--or type = 39 --XDESMGR
)
add target package0.asynchronous_bucketizer (
set filtering_event_name='sqlos.spinlock_backoff',
source_type=1, source='package0.callstack')
with (MAX_MEMORY=50MB, MEMORY_PARTITION_MODE = PER_NODE)
alter event session spinlock_backoff_with_dump on server state=start
declare @instance_name nvarchar(max) = @@SERVICENAME
declare @loop_count int = 1
declare @xml_result xml
declare @slot_count bigint
declare @xp_cmdshell nvarchar(max) = null
--start polling for the backoffs
print 'Polling for: ' + convert(varchar(32), @total_delay_time_seconds) + ' seconds'
while (@loop_count < CAST (@total_delay_time_seconds/1 as int))
begin
waitfor delay '00:00:01'
--get the xml from the bucketizer for the session
select @xml_result= CAST(target_data as xml)
from sys.dm_xe_session_targets xst
inner join sys.dm_xe_sessions xs on (xst.event_session_address = xs.address)
where xs.name = 'spinlock_backoff_with_dump'
--get the highest slot count from the bucketizer
select @slot_count = @xml_result.value(N'(//Slot/@count)[1]', 'int')
24
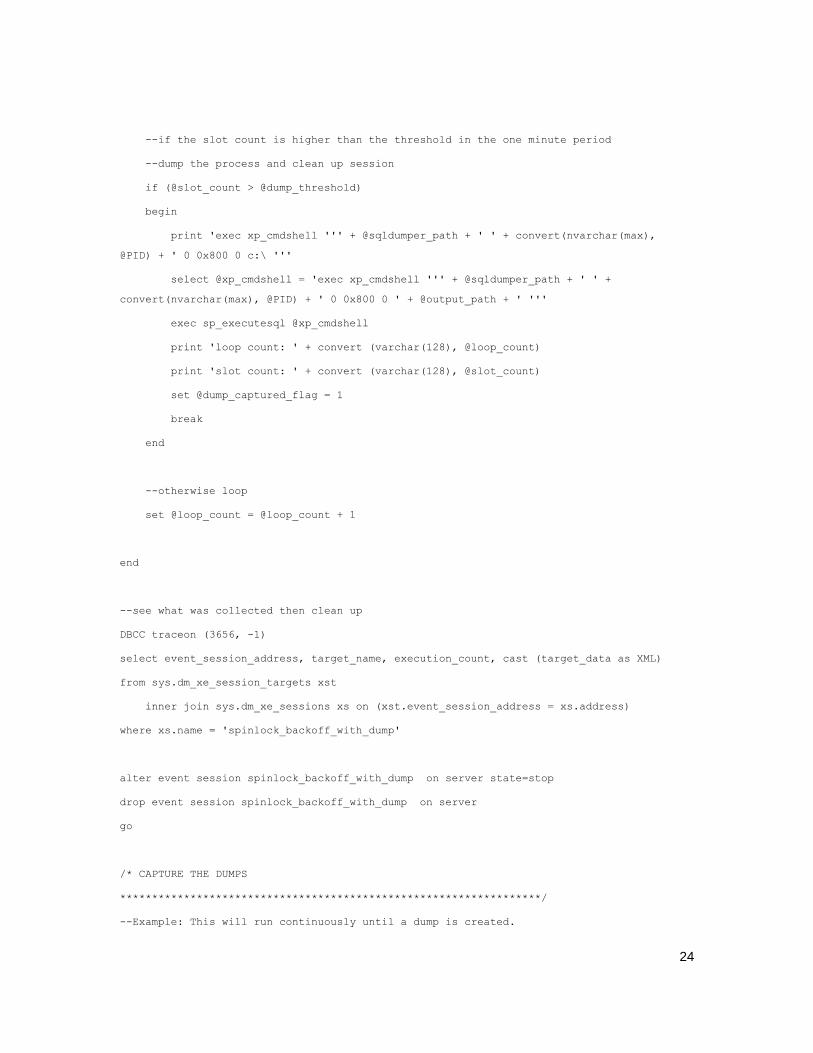
--if the slot count is higher than the threshold in the one minute period
--dump the process and clean up session
if (@slot_count > @dump_threshold)
begin
print 'exec xp_cmdshell ''' + @sqldumper_path + ' ' + convert(nvarchar(max),
@PID) + ' 0 0x800 0 c:\ '''
select @xp_cmdshell = 'exec xp_cmdshell ''' + @sqldumper_path + ' ' +
convert(nvarchar(max), @PID) + ' 0 0x800 0 ' + @output_path + ' '''
exec sp_executesql @xp_cmdshell
print 'loop count: ' + convert (varchar(128), @loop_count)
print 'slot count: ' + convert (varchar(128), @slot_count)
set @dump_captured_flag = 1
break
end
--otherwise loop
set @loop_count = @loop_count + 1
end
--see what was collected then clean up
DBCC traceon (3656, -1)
select event_session_address, target_name, execution_count, cast (target_data as XML)
from sys.dm_xe_session_targets xst
inner join sys.dm_xe_sessions xs on (xst.event_session_address = xs.address)
where xs.name = 'spinlock_backoff_with_dump'
alter event session spinlock_backoff_with_dump on server state=stop
drop event session spinlock_backoff_with_dump on server
go
/* CAPTURE THE DUMPS
******************************************************************/
--Example: This will run continuously until a dump is created.
25
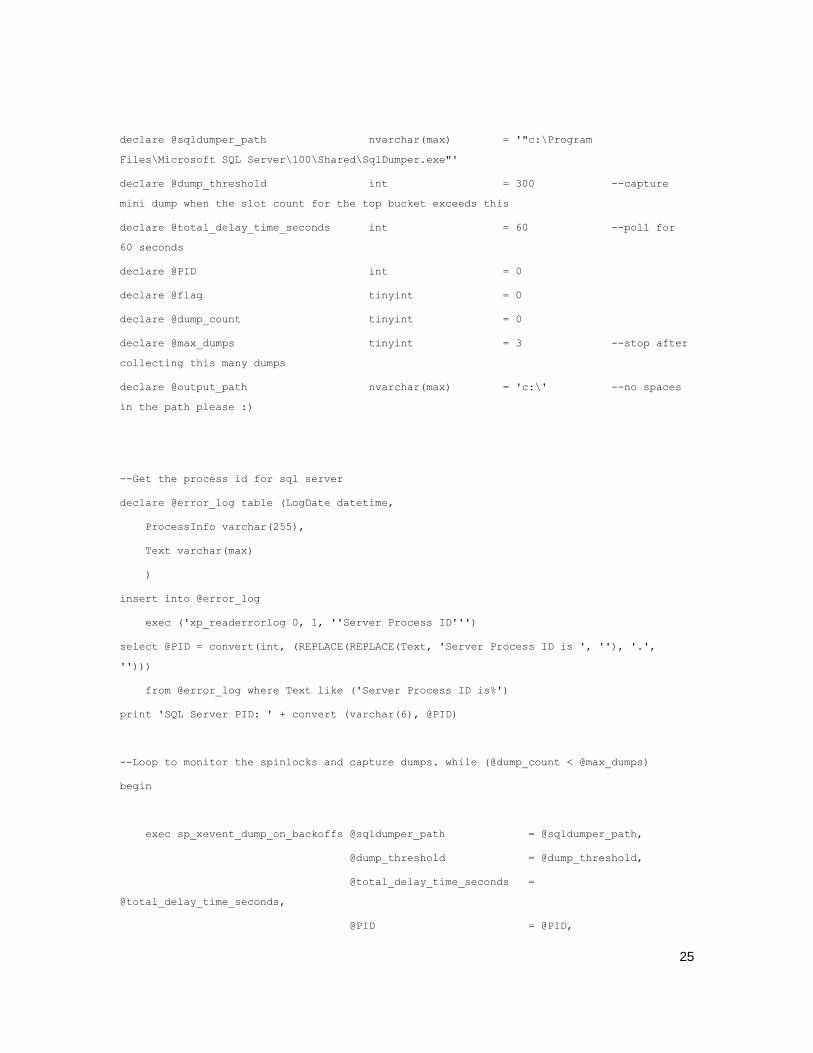
declare @sqldumper_path nvarchar(max) = '"c:\Program
Files\Microsoft SQL Server\100\Shared\SqlDumper.exe"'
declare @dump_threshold int = 300 --capture
mini dump when the slot count for the top bucket exceeds this
declare @total_delay_time_seconds int = 60 --poll for
60 seconds
declare @PID int = 0
declare @flag tinyint = 0
declare @dump_count tinyint = 0
declare @max_dumps tinyint = 3 --stop after
collecting this many dumps
declare @output_path nvarchar(max) = 'c:\' --no spaces
in the path please :)
--Get the process id for sql server
declare @error_log table (LogDate datetime,
ProcessInfo varchar(255),
Text varchar(max)
)
insert into @error_log
exec ('xp_readerrorlog 0, 1, ''Server Process ID''')
select @PID = convert(int, (REPLACE(REPLACE(Text, 'Server Process ID is ', ''), '.',
'')))
from @error_log where Text like ('Server Process ID is%')
print 'SQL Server PID: ' + convert (varchar(6), @PID)
--Loop to monitor the spinlocks and capture dumps. while (@dump_count < @max_dumps)
begin
exec sp_xevent_dump_on_backoffs @sqldumper_path = @sqldumper_path,
@dump_threshold = @dump_threshold,
@total_delay_time_seconds =
@total_delay_time_seconds,
@PID = @PID,
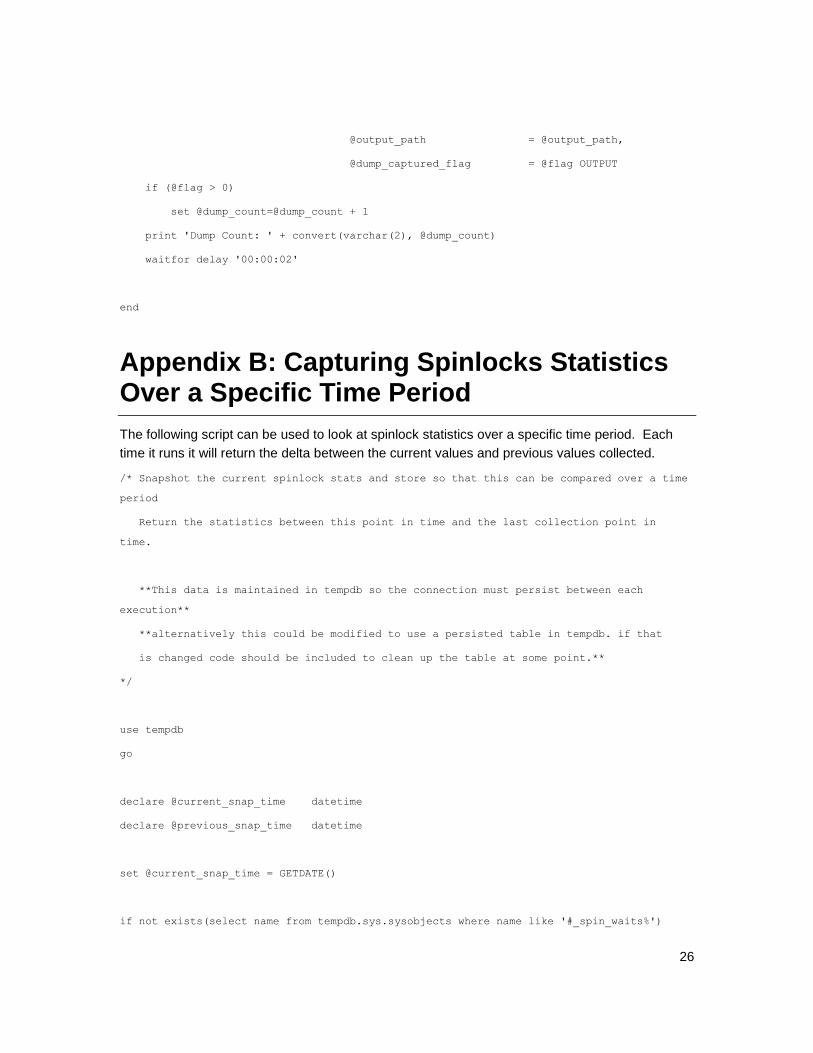
26
@output_path = @output_path,
@dump_captured_flag = @flag OUTPUT
if (@flag > 0)
set @dump_count=@dump_count + 1
print 'Dump Count: ' + convert(varchar(2), @dump_count)
waitfor delay '00:00:02'
end
Appendix B: Capturing Spinlocks Statistics Over a Specific Time Period
The following script can be used to look at spinlock statistics over a specific time period. Each
time it runs it will return the delta between the current values and previous values collected.
/* Snapshot the current spinlock stats and store so that this can be compared over a time
period
Return the statistics between this point in time and the last collection point in
time.
**This data is maintained in tempdb so the connection must persist between each
execution**
**alternatively this could be modified to use a persisted table in tempdb. if that
is changed code should be included to clean up the table at some point.**
*/
use tempdb
go
declare @current_snap_time datetime
declare @previous_snap_time datetime
set @current_snap_time = GETDATE()
if not exists(select name from tempdb.sys.sysobjects where name like '#_spin_waits%')
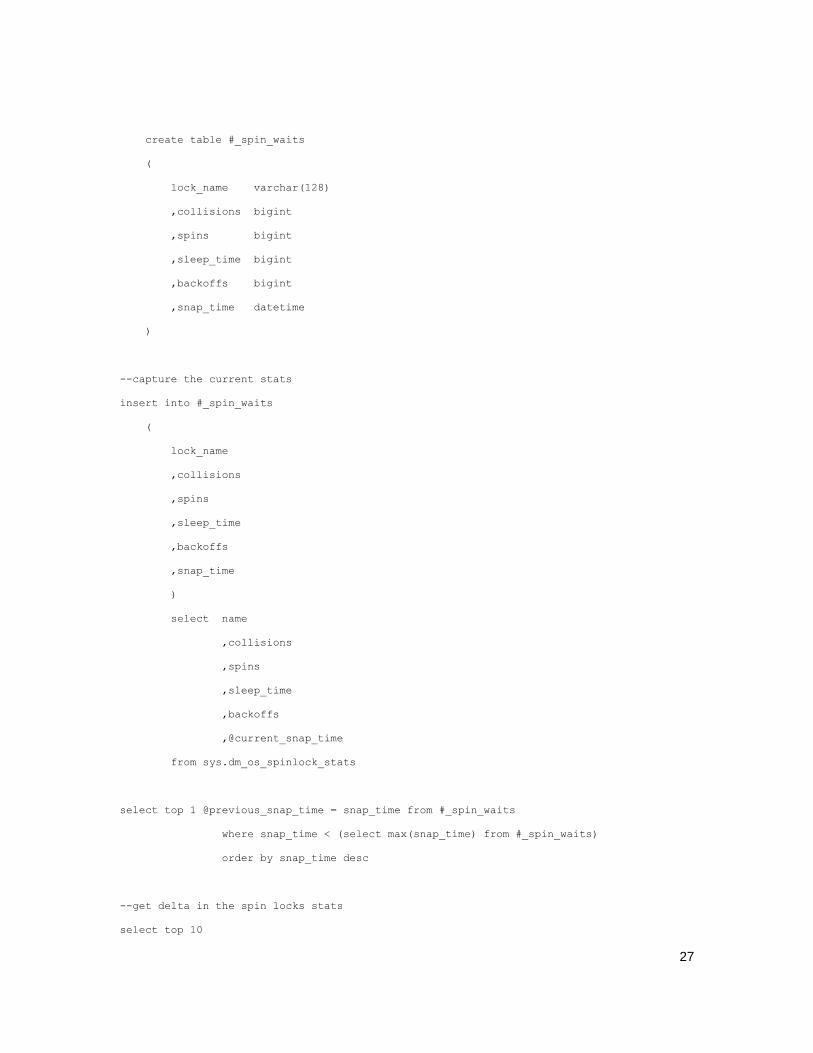
27
create table #_spin_waits
(
lock_name varchar(128)
,collisions bigint
,spins bigint
,sleep_time bigint
,backoffs bigint
,snap_time datetime
)
--capture the current stats
insert into #_spin_waits
(
lock_name
,collisions
,spins
,sleep_time
,backoffs
,snap_time
)
select name
,collisions
,spins
,sleep_time
,backoffs
,@current_snap_time
from sys.dm_os_spinlock_stats
select top 1 @previous_snap_time = snap_time from #_spin_waits
where snap_time < (select max(snap_time) from #_spin_waits)
order by snap_time desc
--get delta in the spin locks stats
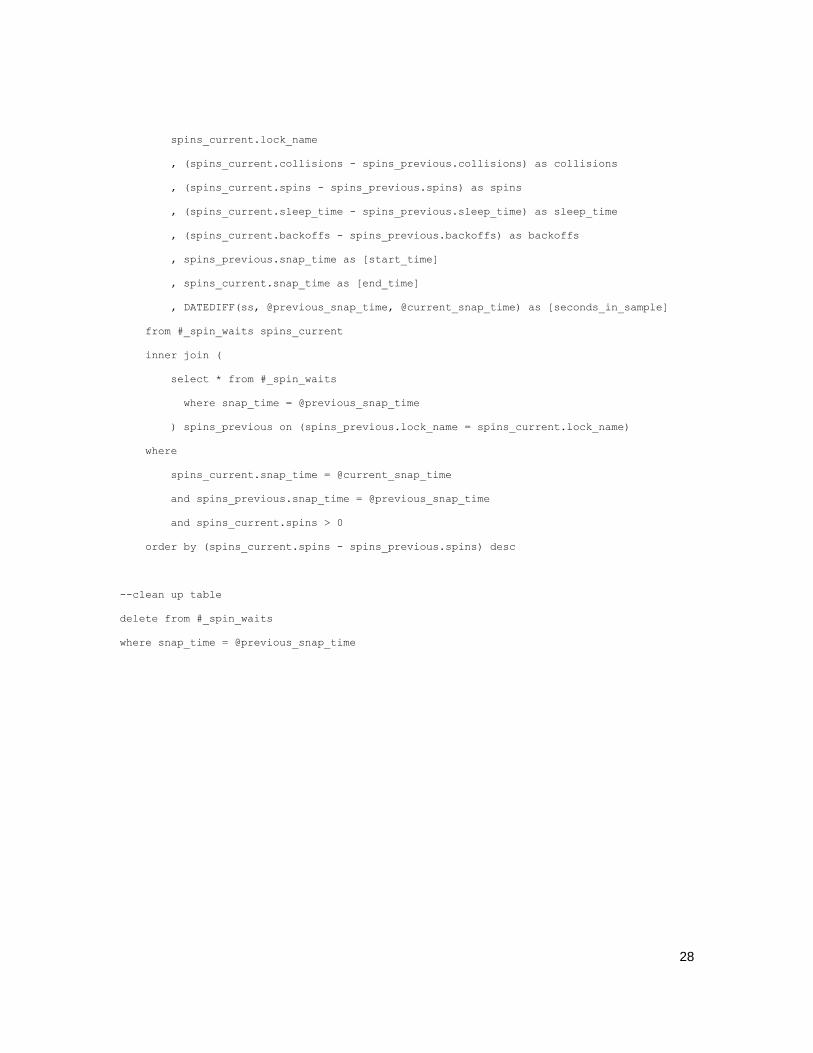
select top 10
28
spins_current.lock_name
, (spins_current.collisions - spins_previous.collisions) as collisions
, (spins_current.spins - spins_previous.spins) as spins
, (spins_current.sleep_time - spins_previous.sleep_time) as sleep_time
, (spins_current.backoffs - spins_previous.backoffs) as backoffs
, spins_previous.snap_time as [start_time]
, spins_current.snap_time as [end_time]
, DATEDIFF(ss, @previous_snap_time, @current_snap_time) as [seconds_in_sample]
from #_spin_waits spins_current
inner join (
select * from #_spin_waits
where snap_time = @previous_snap_time
) spins_previous on (spins_previous.lock_name = spins_current.lock_name)
where
spins_current.snap_time = @current_snap_time
and spins_previous.snap_time = @previous_snap_time
and spins_current.spins > 0
order by (spins_current.spins - spins_previous.spins) desc
--clean up table
delete from #_spin_waits
where snap_time = @previous_snap_time