diagnosis and prognosis of automotive systems: motivations...
TRANSCRIPT

Diagnosis and Prognosis of AutomotiveSystems: motivations, history and some
results
Giorgio Rizzoni ∗,∗∗, Simona Onori ∗∗, Matteo Rubagotti ∗∗∗
∗ The Ohio State University, Department of Mechanical EngineeringDepartment, and Center for Automotive Research,
email: [email protected]∗∗ The Ohio State University, Center for Automotive Research,
email: [email protected]∗∗∗ University of Pavia, Department of Computer Engineering and
Systems Science Italy,email: [email protected]
Abstract: This paper presents an overview of diagnostic needs and methodologies in theautomotive field. The field of automotive engineering has seen an explosion in the presence ofelectronic components and systems on-board vehicles since the 1970s. This growth was initiallymotivated by the introduction of emissions regulations that led to the widespread application ofelectronic engine controls. A secondary but important consequence of these developments wasthe adoption of on-board diagnostics regulations aimed at insuring that emission control systemswould operate as intended for a prescribed period of time (or vehicle mileage). In addition, thepresence of micro-controllers on-board the vehicle has led to a proliferation of other functionsrelated to safety and customer convenience, and implemented through electronic systems andrelated software, thus creating the need for more sophisticated on-board diagnostics. Today, asignificant percentage of the software code in an automobile is devoted to diagnostic functions.This paper presents an overview of diagnostic needs and requirements in the automotiveindustry, illustrates some of the challenges that are associated with satisfying these requirements,and proposes some future directions, in particular with respect to prognostics.
Keywords: Automotive applications, Fault-tolerant control, Linear and robust methods,Nonlinear methods
1. INTRODUCTION
Why diagnosis in the automotive field? The field of auto-motive engineering has seen an explosion in the presenceof electronic components and systems on-board vehiclessince the 1970s. This growth was initially motivated bythe introduction of emissions regulations that led to thewidespread application of electronic engine controls. Asecondary but important consequence of these develop-ments was the adoption of on-board diagnostics regula-tions aimed at insiring that emission control systems re-mained functional for a prescribed period of time (or vehi-cle mileage). In addition, the presence of microcontrollerson-board the vehicle led to a proliferation of functionsimplemented through electronic systems and related soft-ware, related to safety and customer convenience, creatingthe need for more sophisticated on-board diagnostics. To-day, a significant percentage of the software code in anautomobile is devoted to diagnostic functions. Of course,the use of diagnostic methods in automobiles is as oldas the automobile itself. Repair technicians have adopteda variety of diagnostic techniques based on the humansenses, from sight to sound to smell, for over a century.
? This work was supported in part by someone.
However, over the past quarter century this field hasevolved from being in the domain of expert technicians,aided by test and measurement equipment, to the develop-ment of software that is embedded in the microcontrollersthat manage functions ranging from engine performanceand emissions, to braking, traction control, stability, andmyriad customer convenience functions. The aim of thispaper is to present an overview of the state of the art in on-board diagnostics in today’s automobiles, and to suggestsome future directions.
1.1 Emission regulation
The original motivation for the introduction of real-timeon-board diagnostics in automotive vehicles originatesfrom the California Air Resources Board (CARB) require-ments introduced in the early 1990’s to guarantee theintegrity of the engine exhaust emissions control systems.The idea behind the original on-board diagnostics regula-tions [obd05], [EPA] was to guarantee that the exhaustemissions control system would be functional for a pe-riod of time associated with warranty or with regulatedrequirements. OBD regulations mandate that any fault inthe emission control system affecting software algorithms,sensors, actuators or other hardware that could lead to

an increase of tailpipe emissions such that the vehiclewould no longer meet the emissions regulations, shouldbe detected in real-time and codified according to a setof on-board diagnostic codes that are described in theOBD legislation. These regulations first came into effect in1988 and were further expanded in 1994 through OBD-IIregulations, and affect every single component or subsys-tem that could increase engine exhaust emissions above apre-specified threshold. With the growth in complexity inexhaust emissions regulations, and the attendant increasein complexity in the hardware and software required tomeet such regulations, the task of meting OBD regulationshas become quite challenging. In particular, the OBDchallenge for Diesel engines and associated exhaust after-treatment systems is notable, requiring the detection offaults that lead to very small changes in regulated exhaustgas emissions, of the order of tens of ppm. In a latersection, this paper reviews three distinct approaches tosolving OBD problems related to exhaust emissions con-trols.
1.2 Safety
A second motivation for the introduction of on-boarddiagnostic algorithms has been the introduction of safetysystems on-board vehicles. In recent years, increasingattention to safety has led to the introduction of anti-lock braking systems, traction control systems, electronicstability control systems, and passive and active restraints.Many safety functions are also the subject of increasinglystringent regulations. The introduction of active systemsthat can affect the safety of a vehicle, such as braking,traction and stability control, and the introduction of by-wire systems to implement these functions, has generateddifferent needs in diagnostics. In this context, diagnosisis a precursor to fault-tolerant control: if a safety-criticalcomponent is malfunctioning because of a fault or failurein a sensor, actuator or other component, or a malfunctionin one of the software algorithms, then it is necessary toidentify such safety-critical failures very quickly so as tobe able to take corrective actions and ensure the safetyand reliability of the vehicle.
1.3 Customer satisfaction
The third area that has seen a growth in diagnostcs isrelated to customer satisfaction. Even in subsystems wherediagnostic requirements are not legislated, nor are theymandated by the presence safety-critical functions, theremay be some significant advantages in having diagnosticalgorithms on-board the vehicle for the purpose of guaran-teeing customer satisfaction and overall quality. The useof diagnostic algorithms to reduce false positives that maylead to significant warranty costs for manufacturers hasbeen a subject of interest to automotive manufacturers,and also to subsystem suppliers, who may incorporatediagnostics directly into sensors or actuators. Accuratediagnosis can reduce the incidence of faulty componentsor the incidence of components being replaced when theyare in fact still good (i.e., false positives). This is an issueof particular concern in a vehicle that has significant elec-tronics content because it is often too easy, in the face of aperceived malfunction, to replace expensive components,
such as for example an electronic control unit, ratherthan pinpoint the specific cause. Studies conducted in theindustry have shown that the percentage of false positives,for example as they pertain to replacement of the enginecontrol unit, is as high as 80% of the cases ([MPY+06]).
2. PROBLEMS AND CHALLENGES
In the face of the different requirements outlined in thepreceding section, there is growing interest on the part ofthe automotive industry in the ability to systematicallydesign diagnostic algorithms. Further, automakers havealso shown a desire to extend warranty periods to provideconsumers with a worry-free experience. As a consequence,in addition to on-board diagnosis of different functions,the prognosis of various functions and subsystems in thevehicle has also become important. Manufacturers wouldlike to be able to predict when maintenance or replacementmay be needed for specific components, for example the12V battery, or components in subsystems related to theemissions control system. So, prognosis is beginning totake on a role in automotive electronic systems that wasnot on the horizon even just five or ten years ago.
The implementation of diagnostic and prognostic algo-rithms of this type in automotive systems presents a num-ber of challenges due to the scale of the implementation.Such algorithms must be adaptable to millions of vehiclesand must be robust enough to be valid over a broad rangeof different realizations of the same vehicle platform, withchoice of different engines, transmissions, and accessories.Further, vehicles that might be architecturally identical,will unavoidably require different software calibrations indifferent markets. Thus, the design and implementation ofOBD algorithms is not a ‘one size fits all’ kind of designapproach.
The second issue is related to the fact that automo-tive systems tend to be complex and highly nonlinear.For example, engine and exhaust emissions processes arecharacterized by complex thermochemical behavior (com-bustion processes, exhaust emissions formation), that isstrongly affected by chemical reaction kinetics, fluid mo-tion and heat transfer. Further, the presence of sensorsand actuators, such as fuel injectors, or systems that couldbe pneumatically or hydraulically actuated increases theoverall complexity of an engine emission control system.Therefore, it is difficult to imagine that simple, linear algo-rithms could be very effective unless a substantial amountof thinking and a deep understanding of the physics of theprocesses goes into their design.
Another important aspect is the speed of execution, inthe face of limited computational capabilities (both CPUspeed and memory). On-board computers used in au-tomotive applications have relatively low power relativeto the number of functions that they perform, becausecost is a significant constraint in the automotive industry.So, one of the main challenges is to develop effectivediagnosis algorithms that can be implemented in fixed-point arithmetic microcontrollers with limited amount ofmemory and limited CPU speed. Some algorithms mayrequire truly real-time implementation. For instance, insafety-critical diagnosis algorithms (e.g.: vehicle stabilitycontrol, or brake-by wire or steer-by wire applications), one
is obviously concerned with the implementation of thesealgorithms in real-time so that any fault that is detectedcan be compensated for in a fault-tolerant control schemeor by entering a limp-home mode as safely and as quicklyas possible. On the other hand, other types of algorithms,such as those that may be used to diagnose malfunctions inthe emission control systems, may not have such stringentreal-time requirements, in the sense that on-board diag-nostics regulations typically require that the diagnosis becarried out within what is called a ‘one trip’.
Finally, diagnosis must be as transparent as possible tothe user, while the designer must be very cognizant ofthe relative weight of false alarms vs. missed detections:such weighting will vary depending on the application,with missed detections being especially costly (to the user)in safety-critical applications, while false alarms can bevery costly (to the manufacturer and consumer alike)when non-safety-critical applications that have warrantyimplications are considered.
In short, the subject of system diagnosis in the most com-plex consumer device in existence today - the automobile- is one that presents numerous technical challenges thatrange form the theory of estimation and detection, toreal-time software implementation issues. We hope thatthe reader will come to appreciate the true complexity ofthe problem after reading the overview presented in thefollowing sections.
3. APPROACHES TO FAULT DIAGNOSIS
Generally speaking, one can characterize approaches tofault diagnosis as
• data-based: based on data and employing systemidentification techniques to identify models;
• physics model-based, that is, based on a model thathas some predictive quality based on physical firstprinciples.
In reality, no approach is completely physics-model-basedor completely data-based, because every approach thatuses data typically has some kind of an underlying model,and every physics-model-based approach requires a certainamount of empirical calibration, so that in truth everyapproach we use is really a combination of data-basedand physics-model-based techniques. It is our opinionthat, whenever possible, models based on the physics ofthe process should be used. What constitutes a modelis subject to interpretation, of course. A model is, ingeneral, intended to be a collection of differential and/oralgebraic equations, but can take many forms. The keyidea is that one should taking into account a physicalunderstanding of the system at the very onset. It isalso important to understand that when one talks aboutmodel-based approaches in diagnostics, these may requiremodels that have greater fidelity than the models that arerequired to develop the control algorithms. This is oneof the fundamental challenges in diagnostics: in order tobe able to detect minor differences between the normaloperation of a system and its faulty operation, one needsto have reasonably sophisticated models, or a very solidunderstanding of the physical principles that underlie theprocesses.
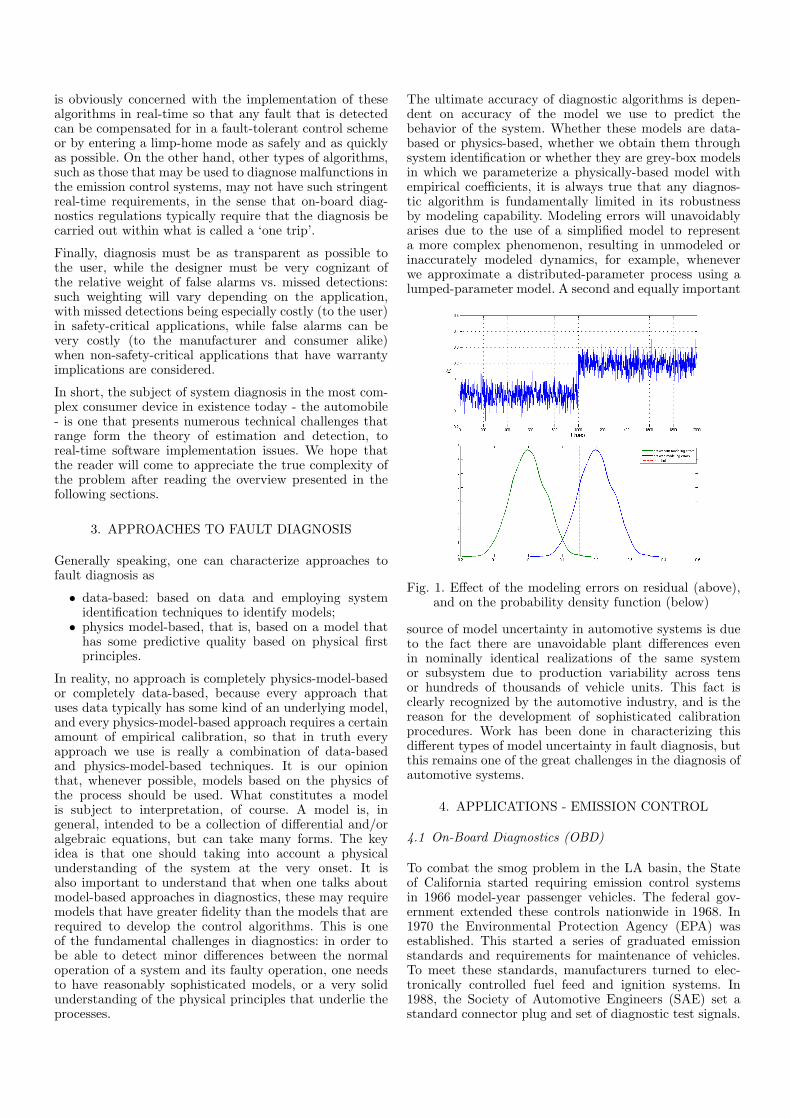
The ultimate accuracy of diagnostic algorithms is depen-dent on accuracy of the model we use to predict thebehavior of the system. Whether these models are data-based or physics-based, whether we obtain them throughsystem identification or whether they are grey-box modelsin which we parameterize a physically-based model withempirical coefficients, it is always true that any diagnos-tic algorithm is fundamentally limited in its robustnessby modeling capability. Modeling errors will unavoidablyarises due to the use of a simplified model to representa more complex phenomenon, resulting in unmodeled orinaccurately modeled dynamics, for example, wheneverwe approximate a distributed-parameter process using alumped-parameter model. A second and equally important
Fig. 1. Effect of the modeling errors on residual (above),and on the probability density function (below)
source of model uncertainty in automotive systems is dueto the fact there are unavoidable plant differences evenin nominally identical realizations of the same systemor subsystem due to production variability across tensor hundreds of thousands of vehicle units. This fact isclearly recognized by the automotive industry, and is thereason for the development of sophisticated calibrationprocedures. Work has been done in characterizing thisdifferent types of model uncertainty in fault diagnosis, butthis remains one of the great challenges in the diagnosis ofautomotive systems.
4. APPLICATIONS - EMISSION CONTROL
4.1 On-Board Diagnostics (OBD)
To combat the smog problem in the LA basin, the Stateof California started requiring emission control systemsin 1966 model-year passenger vehicles. The federal gov-ernment extended these controls nationwide in 1968. In1970 the Environmental Protection Agency (EPA) wasestablished. This started a series of graduated emissionstandards and requirements for maintenance of vehicles.To meet these standards, manufacturers turned to elec-tronically controlled fuel feed and ignition systems. In1988, the Society of Automotive Engineers (SAE) set astandard connector plug and set of diagnostic test signals.

The EPA adapted the standards from the SAE on-boarddiagnostic programs [EPA]. OBD-II is developed by SAEand adopted by the EPA and CARB (California Air Re-sources Board).
EPA: OBD-I and OBD-II The first-generation OBD-Irequirements (1988) were relatively simple as compared totoday’s requirements:
- Emission-related inputs to the ECU were required tobe monitored for opens and shorts;
- The components requiring performance monitoringincluded the ECU, fuel metering system, ignition andEGR system (if present).
Since 1994, OBD-II regulations have been imposed in theU.S.A. on gasoline, Diesel and alternative fuel vehicles. Adistinction is made between passenger cars and light-dutytrucks on one side, and heavy-duty vehicles on the other.
The European Union (EU) has developed a set of regula-tions for onboard diagnostics for emissions controls that issimilar to those defined for the U.S.A. It is expected thatcommon standards will be used to define the EU OBDrequirements such that engines developed for the U.S. andEurope will comply for OBD in both domains. The Eu-ropean On-Board Diagnostics (EOBD) requirements aresimilar to the EPA OBD requirements, with the exceptionthat higher malfunction thresholds are tolerated. In prac-tice, most manufacturers have simply utilized US OBD-IIsoftware/strategy to meet the EOBD requirements.
Any component that directly or indirectly affects emis-sions, for example, coolant or intake manifold temperaturesensors must be monitored. If a malfunction is detectedthat would cause emissions to exceed the regulated stan-dard by more than 50%, a Malfunction Indicator Light(MIL) must be lit on the dash-panel to warn the operatorthat repair is required.
In addition, the OBD-II regulations require monitoring ofcomprehensive components, such as any electronic power-train component/system which either provides input to, orreceives commands from the on-board computer for: mal-functions which can affect emissions during any reasonablein-use driving condition, or electronic powertrain compo-nents/systems used as part of the diagnostic strategy forany other monitored system or component. This stringentrequirement is intended to ensure that anything that canaffect emissions, even to very small degree, is monitored.
In the next three sections we illustrate three diagnosticapplications motivated by OBD requirements, chosen toplace emphasis on three distinct diagnostic methodologies:
• Model-based fault diagnosis of a NOx aftertreatmentsystem. In ([PCO+09], [PSYJ06]) an open-loop ap-proach based on parity equations is used;
• fault-tolerant powertrain control achieved by inte-grating control and diagnostics, in which [KRU98],[KRU01a] use nonlinear (sliding-mode) observers;
• and, finally a signal-processing-based engine misfiredetection [KRSW95] algorithm.
4.2 NOx after treatment system
A fundamental application of FDI in the automotivefield consists in monitoring the after-treatment systemsin Diesel engines. In [PCS] and [PCO+09] a scheme basedon a parity equation approach is proposed and analyzed.One of the most important factors for permitting the useof Diesel engines according to the OBD regulations is thecontrol of the engine emissions, in particular particulatematter (PM) and nitrogen oxides (NOx). A methodologyfor NOx emission reduction called Lean NOx Trap (LNT)[BCSB98] (see Fig. 2), is taken into account here. Thisstrategy has the advantage of not requiring reductantsupply aboard, is effective within a broad range of tem-peratures (250 − 450◦C), and has a high NOx conversionefficiency (more than 90%).
Fig. 2. Schematic of typical LNT aftertreatment system
The main challenge for NOx after treatment systemsimplementation on the vehicle is that a robust controlsystem must be implemented, in order to ensure thatthe after treatment device operates with high conversionefficiency, regardless of variability in the operating con-ditions, and with restrictions on the available sensors.Moreover, dedicated algorithms are required to monitorthe aftertreatment system for faults, in compliance withthe recent OBD-II regulations. In [PCS] and [PCO+09],the described strategy permits to detect faults regardingsensor malfunctioning, LNT sulfur poisoning and thermaldeactivation in the LNT scheme. The model is obtainedwith a grey-box approach, where the equations regardingthe conservation of mass and energy are used, togetherwith simplified stoichiometric reactions for mass balances.It is assumed that the mixture is at thermal and chemicalequilibrium (quasi-steady conditions), and that NOx areonly present as NO. A high level scheme of the model canbe seen in Fig. 3.
Fig. 3. Schematic of the model used for the NOx aftertreatment diagnostics
The fault diagnosis method used to detect the LNT af-tertreatment system faults with steady-state input condi-tions, is based on parity equations with constant thresh-olds. Fig. 4 represents the whole diagnostics scheme: the

blocks in the upper part, from left to right, representthe Diesel engine with air-to-fuel ratio (AFR) control, theDiesel Oxidation Catalyst (DOC) and the LNT. The blockin the left-lower part represents the model of the enginethat is run in the diagnostics scheme, in order to generatethe output in case of non-faulty conditions: the differencebetween the outputs of this system and those generatedby the ‘truth model’ implemented in the upper part of thescheme are the residuals used for fault detection and iso-lation. Please note that the implementation of the parityequations is achieved in this case through a computationalmodel, not an analytical one, and that the computationalmodel, however simplified, is still quite complex.
Fig. 4. Schematic of the FDI system in the NOx aftertreatment application
The method described above yields promising results; forinstance, Fig. 5 shows the results obtained in detecting afault in the temperature sensor in [PCO+09], These resultswere obtained in simulation, using a validated model ofthe process. It should be remarked that today, the abilityto run models of such complexity in real time in an on-borad processor is probably still beyond the capabilitiesof production microcontroller hardware. Nonetheless, thisapproach shows what can be accomplished if a relativelyhigh-fidelity model that can be computed in real time isavailable.
Fig. 5. Residuals for temperature sensor fault diagnosis inthe NOx diagnostics scheme
4.3 Fault tolerant powertrain control
The second application that pertains to the exhaust emis-sions regulations area is the one described in ([KRU01a])and [KRU98], where the integration of control and diag-nostics with the objective of achieving fault tolerant con-trol is considered. The references cited describe a strategy
that incorporates detection and isolation, and guaranteesdesired system stability and performance in the presenceof certain component malfunctions.
Fig. 6. Air-fuel related subsystem of an IC engine.
The system under consideration considers the breathingand fueling dynamics of a port fuel-injected 4.6L sparkignition (SI) engine, shown in Figure 6. This type ofmodel is generally referred to as a ”mean value” model.The elements of the system include flow through thethrottle, filling and emptying of the intake manifold, fuelinjection and fuel film dynamics in the manifold runners,exhaust gas recirculation (EGR), system delays includingthe induction-to-power stroke delay inherent in the four-stroke engine cycle and transport delay in the exhaustmanifold, and sensor dynamics.
The objective of the work is two-fold: first, it is required toidentify a fault in the proportional oxygen sensor (UEGO),and, second, the air-fuel-ratio (AFR) controller must becapable of reacting to a fault maintaining good controlperformance, that is, keeping the AFR as close as possibleto the reference value. To solve both these problems, thecontrol strategy is designed as follows: a feed-forwardterm that uses cylinder air charge estimation and fuelfilm estimation provides the base value for the fuel to beinjected; feedback comes in the form of a proportional term(using the UEGO sensor) and of and Integral Sliding Modeterm. The latter consists of an additive discontinuouscontrol term that compensates for possible actuator faults.A sliding mode observer is used to track the value of theoutput, in order to avoid that a fault on the sensor couldlead to decreased performance of the control strategy. Fig.7 shows a schematic of the fault tolerant control strategy:the observer structure takes into account the possibledifferent faults.
The strategy was implemented first in simulation, thenon an engine; Fig. 8 shows how the proposed controlmethodology reacts to an input fault (in simulation). Aftera short time, the fault is identified, while the IntegralSliding Mode strategy permits to react very quickly to itkeeping the AFR around the reference value.

Fig. 7. Schematic of control and diagnostics for engine airand fuel management system.
Fig. 8. Air-fuel ratio response with fuel injector fault inthe fault tolerant control scheme
4.4 Engine misfire detection
In this section we summarize a family of approaches thatuse signal processing and statistical signal classificationto detect and isolate individual occurrences of enginemisfire. Misfire is defined as as a lack of combustion inthe cylinder due to absence of spark, poor fuel meter-ing, poor compression, or any other cause. This does notinclude lack of combustion events in non-active cylin-ders due to default fuel shut-off or cylinder deactivationstrategies [obd05]. According to the OBD-II regulations,even a single instance of misfire in the engine has to berecorded, while repeated instances have to be reported formaintenance. Automotive engines, as with any rotatingmachinery, present signature torsional vibrations, and anychanges in this signature can be used to detect faults inthe engine. Angular velocity measurement have been usedto detect changes in torsional vibration characteristics ofengines [Riz89],[GW90],[CR94],[PGG+95],[KRSW95].
The diagnosis of abnormalities in the torsional vibrationof the engine crankshaft is more readily apparent when thevariables of interest are viewed with respect to the angleof rotation of the shaft. These variables are periodic whenmeasured in the domain of angle of rotation, and it doesnot matter if angle of rotation is a non-linear function oftime [CR94]. Among the various methods used to analyzethe angular velocity data, there are: spectral analysisusing discrete fourier transform, principal componentsanalysis, discrete wavelet transform and change detection[KRSW95].
When torsional vibrations are measured in the angulardomain, they are quasi-periodic with period equal to oneengine cycle (two revolutions for a four stroke engine).Discrete Fourier Transform (DFT) based approach areespecially appropriate because of the periodic nature ofthe signal. If we define the window to be 4π radians,then the engine firing frequency will be N times perperiod, where N is the number of cylinders in the engine.Assuming that each cylinder produces identical torque, thespectral content of the signal will be at the firing frequencyof the engine, and at higher harmonics. Any spectralcontent at lower frequencies will indicate a significant non-uniformity in engine torque production, and is an excellentindicator of misfiring conditions. Fig. 9 shows the caseof the amplitude spectrum of the angular velocity signalfor the normal and misfire case for a 12-cylinder engine[PGG+95].
The fact that a misfire is readily visible in the order ofrotation spectrum, as shown in Fig. 9, does not makethe isolation task automatic. Isolation of the misfiringcylinder can actually be a complex process that can requiresophisticated pattern recognition methods. In the espe-cially challenging case, that of a 12-cylinder engine, [Riz89]shows that using a combination of Principal ComponentsAnalysis (PCA) and statistical clustering it is possible tocorrectly detect and isolate single misfires even in a V-12 high-performance engine in which combustion eventshave significant overlap with one another, rendering theisolation of the misfiring cylinder quite difficult.
Fig. 9. Amplitude spectrum of the angular velocity signalfor the normal and misfire case for a 12-cylinderengine
The PCA method is a well-known multi-variate statisti-cal technique that permits analysis of complex data byproviding the ability to compress large data sets into alower dimensional representation. The data compressioncharacteristics of PCA also make it suitable for the ex-

traction of salient features from the data, and facilitatethe solution of pattern recognition ad signature analysisproblems. In this example, PCA is used in conjunctionwith clustering techniques to isolate the location of themisfiring cylinder. The real and imaginary parts of thefirst twelve frequency components of the engine angularvelocity signal (excluding the DC component), form theinitial data vector for PCA. As explained earlier, thesefrequency components are computed on a cycle-by-cyclebasis. Let a sample data matrix be
X = xij = xj (1)where i = 1, . . . , I is the engine cycle index and j =1, ..., 24, is the index of the real and imaginary parts ofthe twelve frequency components. Note that I >> 24, andthat xi is the row vector corresponding to the ith enginecycle. The matrix X is typically generated by acquiringdata at various engine speeds and loads, under nominallyconstant speed and load conditions. The xi vectors canthen be represented in 24-dimensional space.
Once a normalized data matrix exists, it becomes possibleto define a new orthonormal basis, u1, u2, ..., uJ . The u1
axis is determined in such a way that the square distancesbetween vectors zi and the u1 axis are minimized. Thisis analogous to maximizing the square projections of thevectors zi on u1. Summing up these square projections,the variance of the random vectors zi is obtained. Theu2 axis is found following the same procedure with thesupplementary constraint of its orthogonality with u1. Theu3 axis is defined in the same way adding the orthogonalityto u1 and u2 and so on.
The projection of the i-th cycle vectors onto the new basisis calculated by means of the transformation matrix U :F = fij = fi = ZU where F is a (I × 24) matrix,called the factor matrix. The fj = fij columns (thePrincipal Components) contain the projections of all theI points onto the uj axis. The next step is to order theJ columns fi, according to the decreasing value of thevariance on the uj axis. Taking into account only the mostsignificant Principal Components, the computing time isreduced, without a substantial loss of information. Thedetection and isolation of a misfire is then based on thecalculation of the distance between the coordinates ofthe z∗ vector and the coordinates of the pre-computedcenters of gravity of each of the clusters corresponding toeach of the twelve possible misfire conditions. Figure 10depicts such clustering in three-dimensional space simplyfor visualization purposes showing clusters of misfiring andnormal data.
5. APPLICATION - SAFETY
5.1 Introduction
The first results in electronically controlled vehicle chassissystems can be found in [WI95], where a diagnostic systemfor the lateral vehicle motion is designed using a discreteparity space approach. In [KR95a] and [KR95b] a solutionto the problem of diagnosing faults in a vehicle steeringsystem is proposed using nonlinear observers constructedby sliding mode design techniques. In [ISS00], after adescription of a drive-by-wire system and of the possiblesensor, actuator and component faults, an application
Fig. 10. Example of clustering in three-dimensional space
of a simple fault detection and isolation scheme for aelectromechanical brake pedal in a brake-by-wire system ispresented. Three residuals are obtained by using a parityequation method and by comparing the signal from onesensor with the reconstructed value from another sensorobtained by an analytical pedal model. In [Ise00], thefault detection and isolation approach is applied to vehiclesuspensions and to a simplified bicycle model for thesteering system. Some experimental results are presentedfor the vehicle suspension related to the tire stiffnessestimation. For the bicycle model a fault detection schemebased on the parity space approach and neural networksis used to classify the different faults by training it withspecial patterns. For an overview on fault-tolerant drive-by wire system one can refer to [ISS02], while recentresults in FDI for lateral and vertical vehicle dynamicsare presented in [FBSI07]. Fault diagnosis for engine andpowertrain systems, and vehicle dynamics and control, hasbeen studied for instance in [KRU01b], [DAR99], [PSR03].
During recent years, the applications of FDI strategies forimproving safety in the vehicle have received increasingattention.
In the following, a hierarchical approach proposed in[Pis02] in drive-by-wire system is presented which permitsthe use of simple models for fault diagnosis.
5.2 Hierarchical FID in a drive-by-wire system
The general structure for the Hierarchical FDI is based ona hierarchical decomposition of a system, as representedin Fig. 12. The basic idea is to view the system as an in-terconnection of lower dimensional subsystems determinedaccording to a certain partitioning methodology. For thedecomposed system it is possible to create a FDI schemecomprised of many ‘Residual Generation Units’, and eachof them outputs a residual that is sent to a ‘ResidualEvaluation Unit’ that performs the residual evaluation forthe selected subsystem. An example of hierarchical decom-position scheme for a vehicle chassis system is depicted inFig. 11.
The methodology combines enhanced version of model-based fault diagnosis with qualitative techniques and mod-els. The principle is based on the fact that system failuresoccur in two stages: failure sources where the fault orig-inated, and failure propagation of these faults to otherunits. So, a process for failure analysis must try to locate

Fig. 11. Generalized structure decomposition for hierarchical FDI (upper part), vehicle X-by-wire system (lower part)
Fig. 12. Generalized structure decomposition for hierarchi-cal FDI (upper part), vehicle X-by-wire system (lowerpart)
the failure sources, and isolate the faults cause of failure,according to the scheme in Fig. 13. The framework is struc-turally divided into two components. The model-basedpassive component represents the knowledge about thefault behavior of the system under analysis, and consistsof two different models. The failure analysis instead isan active constituent comprising processes that use themodel-based knowledge for diagnosis. One model for thepassive component is the Hierarchical Model-Based FDIpreviously described, while the second model is constitutedby a Hierarchical Fault Propagation Digraph.
The fault propagation digraph contains a hierarchical rep-resentation of available knowledge about the character-istics of fault propagation within the system. Each levelin the hierarchy contains one or more structures thattogether represent a view of the system under a partic-ular granularity. The granularity of view increases withlevels. Thus as one traverses down the levels of the model,the resolution of view increases. The Fault Location and
Hierarchical
Model!Based FDI
Fault location
and
isolation
Hierarchical Fault
Propagation
Digraph
Failure model!based
passive componentsFailure Analysis
SUPERVISOR
processes
Fig. 13. A framework for hierarchical FDI
Isolation Process (FLIP) operates on individual structuresof the hierarchical fault propagation model.
FLIP starts at the top level of the model constituted by asingle structure containing a single element that representsthe system under analysis. Once the FLIP returns thefailure sources in all structures at one level, the processmigrates to the next level. The FLIP interacts also withthe hierarchical model-based FDI model by activating theavailable residual generator units to reduce the possiblefault locations and, at the end, to perform the finalisolation. When a FLIP exits from the lowest level, thefailure source set will contain the set of faults that are thesource of failure.
A scheme representing the application of such methodol-ogy to a chassis system is depicted in Fig. 14.
For the same application, i.e. the drive-by-wire system,adaptive thresholds are used for fault detection in sensorswhen a steer-by-wire strategy is used, as described in[PSYJ06], where it is also shown how modeling errors canbe drastically reduced by this technique.

Fig. 14. An example of hierarchical propagation model for a chassis system
6. APPLICATION - CONSUMER SATISFACTION
6.1 Introduction
The demand for electric power systems in automobileshas increased substantially in the last decade due to theaddition of many electrical systems and electronic devicesneeded to comply with regulations and meet customerneeds. As a consequence of this dramatic growth in powerrequirements, and in order to maintain optimal vehicleperformance, attention must be given to deriving moreeffective fault diagnosis algorithms for electrical systems.Vehicle diagnosis has become an important component in avehicle operation both for safety and consumer satisfactionreasons. As vehicles have become equipped with more andmore complex electronic systems and sub-systems, it hasalso become more challenging to identify the defective partof the system, whether it is the ECU, sensor, actuator,wiring harness, etc. ([TH02]). This is mainly due to thefollowing reasons. First of all, because different models ofvehicles generations have versatile architecture and fea-tures, they can exhibit distinct fault behavior and it canbe sometimes difficult to uniquely associate a malfunctionfeature to a specific component. Moreover, the automotiveindustry has experienced an increased of both ”no defectfound” problems, not reproducible, and ”intermittent de-fects”, that exhibits a minimal degree of repeatability butare hard to locate. That leads to an intrinsic difficulty ofaccurately identifying faults on vehicles. This challengingproblem has led both the academic and the industry worldto put a lot of efforts in it [KN05], [AM02], [BI03].
The next section focuses on the description of developmentof fault diagnosis systems for the automotive ElectricPower Generation and Storage (EPGS) system. It will beextremely helpful to give an early warning to the userwhen the EPGS system leaves its safe operating areadue to whatever reasons. Meanwhile, such a capabilitywill also improve resource management via condition-based maintenance, and minimize the operational costs forautomotive dealers. For such a system two different faultdiagnosis approaches have been proposed:
- model-based approach ([?], [LCS+08b]), which ex-ploits a analytical model of the system for designinga parity-equation based fault diagnosis scheme, and
- a hierarchical approach, presented in [LCS+08a], thatallows to go from more general information of thesystem malfunctions to a detailed knowledge of thefault, hence achieving fault isolation.
6.2 Electric Power Generation and Storage system (EPGS)
The EPGS system, shown in Fig. 15, is composed of abelt, an alternator with rectifier, a voltage regulator, abattery and several electrical loads. When the engine is
Fig. 15. EPGS system
running, the alternator, driven by the engine through abelt, supplies power to the loads and charges a 12-Vlead-acid battery. The battery provides the high powerneeded by the engine starter motor, and supplies powerwhen the engine is not running or when the demand forelectrical power exceeds the output power of the alternator[Bos03]. The diagnostic problem focuses on the detectionand isolation of a specific set of alternator faults, includingbelt slipping, rectifier fault and voltage regulator fault.
The faults aimed to be diagnosed are:
- Open diode fault: a diode of the passive rectifier isopen.
- Regulator electronic circuit fault: the electronic cir-cuit of the regulator can break.
- Belt slip fault: the belt can break or can have asignificant slip.

The first three faults are different failure modes of thealternator, whereas the last two are faults related to thebelt. The two approaches presented have been both testedin simulation and implemented on the EPGS experimentaltest bench, (Fig. 16) developed at the Center for Automo-tive Research, OSU.
Fig. 16. EPGS test bench
6.3 Model-based fault diagnosis for the EPGS system
Model-based fault detection and isolation (FDI) is basedon the ability to construct residual generators based onmodels of the system (for example, through the designof state observers or parity equations). Unfortunately,due to the highly nonlinear behavior of the componentsof the system, the complexity of the EPGS system issignificant. For the alternator system, the combinationof the nonlinear dynamics of the three-phase generatorwith the switched, state-dependent behavior of the diodebridge rectifier, make the design of a model-based faultdiagnosis system very challenging. Linearization is, forexample, virtually impossible in the presence of the hardnonlinearities present in the rectifier. Meanwhile, a directnon-linear parity equation or observer design for such acomplex non-linear switch system will also be extremelydifficult.
In order to obtain a robust diagnostic algorithm, and inlight of its implementation in the vehicle, the approach in[LCS+08b] utilizes an equivalent alternator model basedon its input-output relationship ([SRP07]). This allows forthe identification of an equivalent DC generator model ofthe alternator by the replacement of the AC synchronousgenerator and diode bridge rectifier with an equivalent DCgenerator, as shown in the scheme of Fig.17. The designedfault diagnosis algorithm uses a parity equation approachbased on the equivalent model and compare the behaviorof the alternator with the behavior of the equivalent modelto produce the residuals that contain the information ofthe faults, according to the scheme in Fig. 18.
The components of the EPGS system have a high nonlin-ear behavior which can be hard to model. For the alter-nator system, the combination of the nonlinear dynamicsof the three-phase generator with the switched, state-dependent behavior of the diode bridge rectifier, make thedesign of a model-based fault diagnosis system very chal-lenging. Linearization is, for example, virtually impossiblein the presence of the hard nonlinearities present in the
Fig. 17. Input-output perspective of an alternator
rectifier. Meanwhile, a direct non-linear parity equationor observer design for such a complex non-linear switchsystem will also be extremely difficult. It is important
Fig. 18. Model-based fault diagnosis scheme
to notice that the equivalent model is used as an openloop estimator for the full model without fault. Anotherimportant part of FDI design is the residual processing andthreshold calibration. In fact, because of model inaccuracy,disturbance or measurement noise, conditions for perfectlyrobust residual generation cannot be met in practice. Thethreshold calibration has been conducted by a statisticalapproach, with the aim of reducing the probability of falsedetection and miss detection. In Fig. 19, for example, it isshown the behavior of the residual r2 = Vf − Vfeq, in thecase of no fault, belt fault and diode fault condition.
Fig. 19. Experimental results
6.4 Hierarchical fault diagnosis for the EPGS system
The main drawback of the model-based FDI solutionpresented in the previous section is that it requires themeasurements of both the battery current and alternator

current, whereas only the alternator current is availableon-board. A different approach of fault diagnosis is thenpursued in [LCS+08a]. In this work, the frequency contentof the measured signals is deeply analyzed and exploitedto design the hierarchical FDI algorithm. Specifically, froman accurate analysis of the signals, one can extract crucialinformation about the symptoms of the faults occurringat the system. For instance, it is known that, if an opendiode fault occurs, the ripple amplitude increases.
Hierarchical diagnostic strategy, as implemented in [LCS+08a],refers to a top-down methodology that uses a-priori knowl-edge of the system signal behavior in order to detectpossible system malfunctions. This allows to go frommore general information of the system malfunctions toa detailed knowledge of the fault, hence achieving faultisolation. The main idea is that, starting from a high levelanalysis of the signals, the occurrence of a possible fault isdetected and isolated by analyzing the frequency contentof the signals. An important advantage of such a hierar-chical approach is that the computation load is greatlyreduced when compared to a model-based FDI algorithm.Figure 20 depicts the diagnostic logic which runs whenthe alternator is in operation. The diagnosis logic has ahierarchical structure, composed of three levels The firstlevel analyzes both the battery current signal Ibatt, bychecking amplitude and frequency of its ripple, and theVdc signal by monitoring its mean value. If an anomalyis detected, with respect to the nominal condition, thealgorithm activates the lower levels to isolate the fault.This algorithm has been also experimentally validated on
Fig. 20. Top-down hierarchical scheme
the EPGS test bench (Fig. 16) and it turns out to besuitable for on-board implementation.
7. FUTURE CHALLENGES
7.1 Hybrid Vehicles
Fig. 21. Fault-tree diagram of the electric powertrain
7.2 Prognosis
During the last ten years, many researchers from differentengineering communities (reliability, fault detection anddiagnosis, mechanical fatigue analysis, identification andcontrol of linear and nonlinear dynamical systems) startedfocusing on understanding how a complex electromechani-cal system can age, and to predict how much time remainsbefore the life of the system comes to the end, that is, toestimate the Remaining Useful Life (RUL). This emergingengineering discipline is usually referred to as Prognosticsand Health Management (PHM). Health monitoring andprognostics of complex systems is a basic requirement forcondition-based maintenance in many application domainswhere safety, reliability, and availability of the systemsare considered mission critical. Unlike health monitoringtechnology, prognostics technology is still in its infancyalthough some research work on developing the technologyhas been done over the recent years. Most of the relevantwork in the field of prognostics comes from the structuralengineering community, where failure due to structuralfatigue can lead to catastrophic consequences (e.g., inaeronautical and marine applications).
Like in diagnostics, prognosis methods can be dividedin data-driven and model-based ([?]). With respect todiagnosis, in a data-driven approach for prognosis a moreintensive data collection process is needed in order tocharacterize the damage accumulation and progression.
The main challenge is to analyze a multidimensional andnoisy data stream from many of sources (use conditions,environmental conditions, and so on) in a population ofsimilar components. It is important to say that the man-agement of uncertainty is fundamental in RUL estimation.When the component is new and the accumulated damageis negligible, the uncertainty margins on the exact timeof failure are very large. These margin of course becomenarrower as the component ages. Data-driven applicationsspan a large number of techniques, from probabilistic ones[?] to neural networks [?]. Model-based approaches areuseful to obtain more precise results, but of course their

design requires a deep knowledge of the system. First, it isnecessary to identify and experimentally validate damagevariables not always an easy and generalizable task, as itusually involves very lengthy experiments under controlledconditions, which do not necessarily reflect actual agingin real life. Second, once a damage variable is identified,there remains the challenge of reliably extracting featuresor estimating parameters from experimental data thatclosely correlate with the damage variable. Third, damageevolution is invariably a nonlinear phenomenon, makingthe modeling of it more difficult, and is also dependenton initial conditions (e.g. structural or material defectdistribution). The applied methodologies comprehend, forinstance, observer-based methods [LBP+03], [OKG+08],and mechanics-of-failure related strategies [CC04].
As for the automotive field, at the moment a lot of effortsare being put in the estimation of the RUL of batteries.A fundamental role is played by batteries, especially inelectric and hybrid-electric vehicle applications, where es-timating their life can eventually be crucial. Estimation ofthe state-of-charge (SOC) is indeed an important variableto tarck for battery prognosis. In fact, the SOC value canbe useful to monitor the variation in the capacity of thebattery, and consequently the battery calendar life.
A very good example of model-based SOC estimation canbe found in [Ple04a], [Ple04b], and [Ple04c], where anExtended Kalman Filter is exploited.
A new prognostic methodology developed in ([SOGR09],[CSGR06], [SCGR05]) is presented in this section.
The model-based prognosis method in ([SOGR09]), in-troduces an analytical aging model to describe the sys-tem degradation for predicting the remaining life. Theanalytical aging model is based on experimental resultscollected on three different kinds of batteries: lead-acid(PbA), nickel-metal hydride (NiMH) and lithium-ion (Li-Ion) and on a suitable curve fitting. If the life of thebattery is defined in terms of residual capacity, S, then theprogression of the aging process can be expressed throughthe evolution of the normalized damage measure ξ, definedas,
ξ =S0 − S
S0 − Sf(2)
where S0 is the capacity of a new battery, and Sf thecapacity of a battery at the end of its life, which is apredefined value. In fact, the end of life is usually definedas the moment in which the capacity becomes 80% of itsoriginal value. By definition, the damage measure ξ takesvalues between 0 (new battery) and 1 (end-of-life battery).Based on the Palmgren-Miner comulative mechanical fa-tigue model, a prognosis algorithm is formulated to predictthe evolution of the damage, as shown, for example, inFig. 22.
8. CONCLUSIONS
ACKNOWLEDGEMENTS
The authors would like to thank Dr. Marcello Canova, Dr.Yong-Wha Kim, Prof. P. Pisu, Delphi, GM, NSF.
0 500 1000 1500 2000 25000
0.2
0.4
0.6
0.8
Total Amp!hour throughput, n [Ah]
!
60 degC
45degC
Fig. 22. Damage progression for Li-Ion batteries
REFERENCES
[AM02] S. Amberkar and B. Murray. Diagnostic strate-gies for advanced automotive systems. 2002.
[BCSB98] M.S. Brogan, AD Clark, MJ Spencer, and R.J.Brisley. Recent progress in nox trap technology.In Proc. International Congress & Exposition,Detroit, MI, February 1998.
[BI03] M. Borner and R. Isermann. Supervision, faultdetection, and sensor fault tolerance of passen-ger cars. pages 327–334, 2003.
[Bos03] Bosch. Automotive electric and electronic sys-tems. 2003.
[CC04] D. Chelidze and J.P. Cusumano. A dynamicalsystems approach to failure prognosis. Journalof Vibration and Acoustics, 126:2, 2004.
[CR94] F.T. Connolly and G. Rizzoni. Real time es-timation of engine torque for the detection ofengine misfires. Journal of Dynamic Systems,Measurement, and Control, 116:675, 1994.
[CSGR06] Z. Chehab, L. Serrao, Y. Guezennec, andG. Rizzoni. Aging characterization of nickel– metal hydride batteries using electrochemi-cal impedance spectroscopy. Proceedings of the2006 ASME International Mechanical Engi-neering Congress and Exposition, 2006.
[DAR99] L. Dinca, T. Aldemir, and G. Rizzoni.A model-based probabilistic approach forfault detection andidentification with appli-cation to the diagnosis of automotive en-gines. IEEE Transactions on Automatic Con-trol, 44(11):2200–2205, 1999.
[EPA] Code of federal regulations (cfr [epa]), title40, part 86, section 86.094-17 - control of airpollution from new motor vehicles and newmotor vehicle engines; regulations requiringon-board diagnostic systems on 1994 and latermodel year light duty vehicles and light dutytrucks (obd).
[FBSI07] D. Fischer, M. Borner, J. Schmitt, and R. Iser-mann. Fault detection for lateral and verticalvehicle dynamics. Control Engineering Prac-tice, 15(3):315–324, 2007.
[GW90] Rizzoni G. and Ribbens W.B. Onboard diag-nosis of engine misfire. In SAE Transactions,Section 6, volume 99, 1990.

[Ise00] R. Isermann. Mechatronic systems: conceptsand applications. Trans. of the Institute ofMeasurement and Control, 22(1):29–45, 2000.
[ISS00] R. Isermann, R. Schwartz, and S. Stolzl. Fault-tolerant drive-by-wire systems - concepts andrealizations. In Proc. 4th IFAC Symposiumon Fault Detection Supervision and Safety forTechnical Processes, Budapest, Hungary, June2000.
[ISS02] R. Isermann, R. Schwarz, and S. Stolzl. Fault-tolerant drive-by-wire systems. IEEE ControlSystems Magazine, 22(5):64–81, 2002.
[KN05] Line K. and Clements N. A systematic ap-proach for developing prognostic algorithms onlarge complex systems. 2005.
[KR95a] V. Krishnaswami and G. Rizzoni. Model basedhealth monitoring of vehicle steering systemusingsliding mode observers. In Proc. Ameri-can Control Conference, 1995.
[KR95b] V. Krishnaswami and G. Rizzoni. Slidingmode observer design with emphasis on vehi-cle dynamics applications. In Proc. ASME In-ternational Mechanical Engineering Congressand Exposition, San Francisco, CA, November1995.
[KRSW95] YW Kim, G. Rizzoni, B. Samimy, andYY Wang. Analysis and processing of shaftangular velocity signals inrotating machin-ery for diagnostic applications. In Acoustics,Speech, and Signal Processing, 1995. ICASSP-95., 1995 International Conference on, vol-ume 5, 1995.
[KRU98] YW Kim, G. Rizzoni, and V Utkin. Automo-tive engine diagnosis and control via nonlinearestimation. Control Systems Magazine, IEEE,18:84–89, 1998.
[KRU01a] YW Kim, G. Rizzoni, and V Utkin. Developinga fault tolerant power-train control system byintegrating design of control and diagnostics.International Journal of Robust and NonlinearControl, 11:1095 – 1114, 2001.
[KRU01b] Y.W. Kim, G. Rizzoni, and V.I. Utkin. Devel-oping a fault tolerant power-train control sys-tem by integrating design of control and di-agnostics. International Journal of Robust andNonlinear Control, 11(11):1095–1114, 2001.
[LBP+03] J. Luo, A. Bixby, K. Pattipati, L. Qiao,M. Kawamoto, and S. Chigusa. An interact-ing multiple model approach to model-basedprognostics. In IEEE International Conferenceon Systems, Man and Cybernetics, 2003, vol-ume 1, 2003.
[LCS+08a] Bologna L., Guerini C., Onori S., Rizzoni G.,Salman M. A., and Zhang X. Hierarchicaldiagnosis and prognosis strategy for electri-cal power generation and storage system. vol-ume 27, Ann Arbor, Michigan, USA, October20-22 2008.
[LCS+08b] Weiwu L., Suozzo C., Onori S., Rizzoni G.,Salman M. A., and Zhang X. Experimentalcalibration and validation of fault diagnosisand prognosis algorithms for automotive elec-tric power generation and storage system. vol-
ume 27, Ann Arbor, Michigan, USA, October20-22 2008.
[MPY+06] Salman M., Popp P., Zhang Y., Zhang X., andChin Y. K. Vehicle diagnosis and prognosis:Concepts, trends, and applications to batteries.2006.
[obd05] Malfunction and Diagnostic System Require-ments for 2004 and Subsequent Model-Year Passenger Cars, Light-Duty Trucks, andMedium-Duty Vehicles and Engines, Novem-ber 2005. Title 13, California Code Regula-tions, Section 1968.2.
[OKG+08] M. Orchard, G. Kacprzynski, K. Goebel,B. Saha, and G. Vachtsevanos. Advances inuncertainty representation and managementfor particle filtering applied to prognostics. InProc. International Conference on Prognosticsand Health Management, Denver, CO, October2008.
[PCO+09] A. Pezzini, M. Canova, S. Onori, G. Rizzoni,and A. Soliman. A Methodology for Fault Di-agnosis of Diesel NOx Aftertreatment Systems.In Proc. Safeprocess, 2009.
[PCS] P. Pisu, M. Canova, and A. Soliman. Model-Based Fault Diagnosis of a NOx Aftertreat-ment System.
[PGG+95] Azzoni P., Cantoni G., Minelli G., Moro D.,Rizzoni G., Ceccarani M., and Mazzetti S.Measurement of engine misfire in the lam-borghini 533 v-12 engine using crankshaftspeed fluctuations. In Journal of Engines, edi-tor, SAE Technical Paper 950837, volume 99,1995.
[Pis02] P. Pisu. Hierarchical Model-based Fault Diag-nosis with Application to Vehicle Systems. PhDThesis, Ohio State University, 2002.
[Ple04a] G.L. Plett. Extended Kalman filtering for bat-tery management systems of LiPB-based HEVbattery packs Part 1. Background. Journal ofPower Sources, 134(2):252–261, 2004.
[Ple04b] G.L. Plett. Extended Kalman filtering for bat-tery management systems of LiPB-based HEVbattery packs Part 2. Modeling and identifi-cation. Journal of Power Sources, 134(2):262–276, 2004.
[Ple04c] G.L. Plett. Extended Kalman filtering for bat-tery management systems of LiPB-based HEVbattery packs-Part 3. State and parameter esti-mation. Journal of Power Sources, 134(2):277–292, 2004.
[PSR03] P. Pisu, A. Soliman, and G. Rizzoni. Vehiclechassis monitoring system. Control Engineer-ing Practice, 11(3):345–354, 2003.
[PSYJ06] P. Pisu, A. Serrani, S. You, and L. Jalics.Adaptive threshold based diagnostics for steer-by-wire systems. Journal of Dynamic Systems,Measurement, and Control, 128:428, 2006.
[Riz89] G. Rizzoni. Diagnosis of individual cylindermisfires by signature analysis of crankshaftspeed fluctuations. SAE Transactions, Section3, 1989.
[SCGR05] L. Serrao, Z. Chehab, Y. Guezennec, andG. Rizzoni. An aging model of Ni-MH batter-ies for hybrid electric vehicles. Proceedings of

the 2005 IEEE Vehicle Power and PropulsionConference (VPP05), pages 78–85, 2005.
[SOGR09] L. Serrao, S. Onori, Y. Guezennec, and G. Riz-zoni. A novel model-based algorithm for bat-tery prognosis. accepted to the 2009 Safe-process, 2009.
[SRP07] A. Scacchioli, G. Rizzoni, and P. Pisu. Hierar-chical model based fault diagnosis for an elec-trical power generation storage automotive sys-tem. New York, USA, July 11-13 2007.
[TH02] Ogawa T. and Morozumi H. Diagnostics trendsfor automotive electronic systems. 2002.
[WI95] M. Wurtenberger and R. Isermann. Supervi-sion of lateral vehicle motion using a discreteparity space approach. In Proc. 1st Workshopon Advances in Automotive Control, Ascona,Switzerland, March 1995.