diagnostic effects of an early mastery activity in college
TRANSCRIPT
University of Nebraska - LincolnDigitalCommons@University of Nebraska - Lincoln
Faculty Publications, Department of Mathematics Mathematics, Department of
2018
Diagnostic Effects of an Early Mastery Activity inCollege Algebra and PrecalculusNathan WakefieldUniversity of Nebraska-Lincoln, [email protected]
Joe ChampionBoise State University, [email protected]
Jessalyn BolkemaUniversity of Nebraska-Lincoln, [email protected]
Douglas DaileyChristendom College, [email protected]
Follow this and additional works at: https://digitalcommons.unl.edu/mathfacpubPart of the Applied Mathematics Commons, Higher Education Commons, Mathematics
Commons, and the Science and Mathematics Education Commons
This Article is brought to you for free and open access by the Mathematics, Department of at DigitalCommons@University of Nebraska - Lincoln. Ithas been accepted for inclusion in Faculty Publications, Department of Mathematics by an authorized administrator of DigitalCommons@Universityof Nebraska - Lincoln.
Wakefield, Nathan; Champion, Joe; Bolkema, Jessalyn; and Dailey, Douglas, "Diagnostic Effects of an Early Mastery Activity inCollege Algebra and Precalculus" (2018). Faculty Publications, Department of Mathematics. 221.https://digitalcommons.unl.edu/mathfacpub/221
Diagnostic Effects of an Early Mastery Activity in College Algebra and Precalculus
Nathan Wakefield,1 Joe Champion,2 Jessalyn Bolkema,1 & Douglas Dailey3
1 Department of Mathematics, University of Nebraska-Lincoln, 203 Avery Hall, Lincoln, NE 68588-0130, USA
2 Department of Mathematics, Boise State University, 1910 University Drive, Boise, ID 83725-1555, USA
3 Department of Mathematics and Natural Sciences, Christendom College, 134 Christendom Drive, Front Royal, VA 22630, USA
Corresponding author — Nathan Wakefield [email protected]
Abstract The purpose of this study was to investigate implementation of an early intervention mastery activity during the first two weeks of college algebra and precalculus courses at a large U.S. public university. Statistical modeling of (N = 935) students’ performance in the courses, including a logistic regression model of pass/fail course achievement with students’ high school rank, ACT Mathematics scores, and performance on the intervention as explanatory variables, suggested significant independent differences in course performance across performance levels on the early mastery activity. An evaluation of diagnostic validity for the model yielded a 19% false negative rate (predicted to fail the course, but passed) and a 7% false positive rate (students predicted to pass the course, but failed), suggesting the early mastery activity, when combined with admissions indicators of mathematics readiness, may be useful in better identifying students at risk of failing their first university mathematics course. This
1
digitalcommons.unl.edu
Published in International Journal of Research in Undergraduate Mathematics Education 4 (2018), pp 376–392.
doi 10.1007/s40753-018-0075-8 Copyright © 2018 Springer International Publishing AG, part of Springer Nature. Used by
permission. Published 11 May 2018.
Wa k e f i e l d e t a l . i n I n t. J . R e s . U n d e r g r a d . M at h . E d . 4 ( 2 0 1 8 ) 2
strategy, which also yields information for focused intervention efforts, is currently being explored through a campus-wide advising tool at the research site.
Keywords: College algebra, Precalculus, Undergraduate mathematics, Academic re-tention, Self-efficacy, Performance modeling
Introduction
Nearly all U.S. universities, four-year colleges, and community colleges require completion of at least one mathematics course as a general ed-ucation requirement for postsecondary degrees. In many institutions, college algebra serves a primary role for students seeking to meet their mathematics requirement. The course topics historically have been structured around the prerequisite algebra skills and knowledge needed for differential calculus, which is typically augmented by a separate trig-onometry course for those students seeking to take calculus courses. Sometimes, these algebra and trigonometry topics are combined (some-times also with limit topics) into a precalculus course. Though ubiqui-tous and familiar in postsecondary settings, college algebra and pre-calculus1 courses can vary greatly across institutions, due in part to different student distributions in terms of both mathematical prepara-tion and programs of study, as well as different approaches to calculus instruction (Herriott and Dunbar 2009).
Many institutions historically have struggled with low student achievement in college algebra. In the United States, students often need a C or better on an ABCDF grading scale in order to advance to a subse-quent course. It is uncommon for overall college algebra DFW rates (the combined percentage of enrolled students who earn a letter grade of D or F, or withdraw from the course) to exceed 40% (Herriott and Dun-bar 2009), meaning that hundreds of thousands of postsecondary stu-dents fail to receive college credit for the course annually. In fact, some have observed that, as developed economies have become increasingly driven by innovation in science, technology, engineering, and mathemat-ics, college algebra has acted as a ‘gatekeeper’ prerequisite for a variety of economic and socioeconomic opportunities (Moses and Cobb 2002; Kamii 1990). Consequently, the large potential improvements in student
1 For clarity, we refer to the general course types in lowercase (e.g., college algebra), with cap-italization for specific courses at the research site.
Wa k e f i e l d e t a l . i n I n t. J . R e s . U n d e r g r a d . M at h . E d . 4 ( 2 0 1 8 ) 3
retention that may come from lower DFW rates in college algebra and other first-year college mathematics courses have led many institu-tions to attempt pre-freshman intervention (Goonatilake and Chappa 2010), curricular reform (Herriott and Dunbar 2009), improved stu-dent placement (Medhanie et al. 2012), and increased instructional sup-port. For a growing number of institutions, including at the research site, low achievement in college algebra and precalculus has contrib-uted to the establishment of dedicated faculty positions with the pri-mary responsibility of improving developmental and first-year math-ematics programs.
Placement, the process by which a university determines which course (or level of course) is appropriate for a student, is an area of growing research. Medhanie et al. (2012) have argued that effective mathematics placement processes are key to students’ success in courses such as college algebra. However, postsecondary mathematics placement has its own challenges, particularly the highly variable nature of local secondary mathematics instruction and the limited time and resources available to institutions when placing what is often a very high percent-age of all newly admitted students. A variety of placement methods are currently used by postsecondary U.S. institutions, including (a) recom-mended and required courses based on students’ program of study, (b) tables and formulas based on students’ scores on standardized college-readiness exams such as the United States-based ACT or SAT, (c) course-specific exams (often developed in-house at each institution), and (d) commercially available placement exams (Medhanie et al. 2012). Med-hanie and colleagues argue for the use of ACT scores as a postsecond-ary mathematics placement test, a claim supported by the ACT’s content focus on algebra knowledge and skills. However, others note successful placement based on high school grades, standardized tests, and com-mercially available testing software, in some combination. The litera-ture does not show a clear best-practice (Sawyer 2010; Allen and Scon-ing 2005; Fitchett et al. 2011; Norman et al. 2011; Radunzel and Noble 2012; Reddy and Harper 2013; Madison et al. 2015). This is not to say that placement is not working; some institutions have found their place-ment process to be very effective (Ahlgren and Harper 2011; Rueda and Sokolowski 2004). Regardless, many institutions, including the research site, have struggled for years to develop an effective placement program with limited resources, little evidence for the quality of assessment data,
Wa k e f i e l d e t a l . i n I n t. J . R e s . U n d e r g r a d . M at h . E d . 4 ( 2 0 1 8 ) 4
and little or no rigorous methodology being employed for evaluation of the predictive validity of placement processes when it comes to students’ achievement in their first mathematics courses. Beyond the need for ad-equate placement procedures, there is wide concern with overall suc-cess in first-year mathematics courses. Such concern is most evidenced in the Mathematical Association of America (MAA) book A Fresh Start for Collegiate Mathematics: Rethinking the Courses Below Calculus (Hast-ings 2006), where the authors argue that there may need to be a refo-cusing in courses below calculus on both the content of these courses and on new approaches to teaching. Increased learning of mathemat-ics is the goal of the text, and while it is not a foolproof way of measur-ing learning, DFW rates do serve as indicators of the success of a course. Indeed, within the MAA’s Fresh Start, various chapters cite historically high DFW rates with a typical range between 40 and 50%. In his analy-sis of college algebra, Gordon lists five reasons why the “primary empha-sis on the development of algebraic skills” is not working. While some of these reasons coalesce around the value of conceptual learning and the long-term usefulness of these courses to students, the first item to be addressed is simply that “at most schools, these courses have unac-ceptably high DFW rates” (Gordon 2006, p. 276).
Purpose & Research Question
Concerned with student achievement in first-year mathematics at the re-search site, and looking for a better connection between our placement processes and course instruction, we set out to conduct a research study on College Algebra and Precalculus. We hypothesized that the indicators of students’ prior mathematics knowledge, skills, and performance that are used to place students into these courses were likely to be associ-ated with their performance in the classes. That is, we presumed that students with higher overall grade point averages in high school, with higher ACT math scores, or with higher placement exam scores were sta-tistically more likely to pass their first mathematics course than those with lower marks on these measures. However, we further hypothe-sized that these statistical trends are mediated by a host of other fac-tors, especially students’ self-efficacy and willingness to put forth effort in the class and to seek out help when needed. Moreover, Bressoud and
Wa k e f i e l d e t a l . i n I n t. J . R e s . U n d e r g r a d . M at h . E d . 4 ( 2 0 1 8 ) 5
Rasmussen (2015) identify proactive student support as a key factor in successful calculus programs. Through an intervention during the first few weeks of the course, we hoped to accurately identify students who may be at increased risk of failing their first mathematics course, as well as facilitate improved outcomes for these students. We formulated the following guiding research question to first measure the legitimacy this intervention as a diagnostic tool:
Can an early-semester mastery activity be used to effec-tively identify students who are at increased risk of failing college algebra and precalculus at a large public research university in the Midwest?
Background
Social Cognitive Lens for Development of the Early-Semester Mas-tery Activity
Our development and implementation of an Early-Semester Mastery Activity is rooted in and motivated by social cognitive learning the-ory (Bandura 1986). Here mastery activity is used to denote an activ-ity which is graded as pass or fail and on which students are allowed multiple attempts to achieve satisfactory performance. Postsecondary students interact with their mathematics courses through complicated personal and social dynamics, bringing more than just domain-specific skills to bear as they pursue personal goals and make decisions that affect each other’s learning and achievement. Triadic reciprocity (Ban-dura 1986), or the specific ways in which personal, behavioral, and en-vironmental factors interact to affect learners’ performances, provides a useful framework for considering students’ learning of mathematics. In particular, students (personal) are asked to demonstrate mastery (behavioral) on a task that is repeatable, with the ability to get help and motivation in-between attempts (environmental). In the context of the entry-level mathematics courses addressed in this study, this so-cial cognitive perspective on learning places special emphasis on adult students’ agency (Bandura 1986) in achieving success in what amounts for many to a several-month-long pursuit of a high-stakes goal: to pass
Wa k e f i e l d e t a l . i n I n t. J . R e s . U n d e r g r a d . M at h . E d . 4 ( 2 0 1 8 ) 6
a single required mathematics course with a grade of C or better. A critical element in many students’ course efforts is their mathemat-ics self-efficacy, which includes beliefs about their ability to success-fully complete specific mathematical tasks in defined contexts (Ban-dura 1986).
Researchers have documented four primary sources of self-efficacy in mathematics, including (in order of typical importance) (1) mastery experiences (i.e., performance on mathematical tasks), (2) vicarious ex-periences (i.e., observing others’ attempts to do mathematics), (3) social persuasion (e.g., others’ appraisals of one’s mathematics ability), and (4) physiological responses (e.g., changes in heart rate or anxiety when pre-sented with mathematical tasks) (Usher and Pajares 2009). In statisti-cal models of mathematics performance, self-efficacy has been identified as one of the key factors explaining differences in achievement in mid-dle school, even after controlling for prior achievement and background differences (Chen and Zimmerman 2007). In other words, regardless of students’ prior mathematical knowledge and skill, their performance in mathematics is likely to be influenced by a cyclic relationship between their perceptions of their mathematical abilities and their performance on specific mathematics in a course.
The social cognitive perspective on students’ performance in college algebra and precalculus suggests a potential benefit for implementing one or more early mastery experiences — specific contexts in which stu-dents can attempt to complete a short-term goal that is authentically aligned to the types of mastery required in the course. A student’s per-formance on an early mastery experience acts as a potential source of self-efficacy, which can in turn serve as motivation for future persistence and effort in the course. In fact, the mutually reinforcing mechanism of self-efficacy and performance undergirds a primary indicator of suc-cess among postsecondary faculty: “successful students … have faith in their potential as math students. They are undeterred by challenges or failure. They set goals, ask questions, and build relationships with their classmates” (Silva and White 2013, p.7).
Setting
The participants in the research study were students who were officially enrolled in College Algebra or Precalculus (N = 935) at the university
Wa k e f i e l d e t a l . i n I n t. J . R e s . U n d e r g r a d . M at h . E d . 4 ( 2 0 1 8 ) 7
research site during Fall 2014.2 As part of approved protocols for a broader study on active learning at the research site, de-identified data for all students enrolled in the classes were available for this analysis. The university is moderately selective (about 65% acceptance rate), with a first-year retention rate of 84%. Among all students in the U.S. who complete the ACT exam in high school, the students at the university are above the national average in their mathematics preparation (mean mathematics ACT = 25.3, 80th percentile). Nearly all students enrolled in College Algebra or Precalculus were placed in the course through their performance on the university’s mathematics placement exam, though some were allowed to enroll because they had previously attempted and failed the course or had passed a developmental mathematics course at the research site.
The placement exam is an in-house exam developed twenty years ago by mathematics faculty and is now administered online. All incom-ing students at the research site are required to take the exam. Incoming students may take the exam once in an unproctored environment, but each subsequent attempt must be given in a proctored setting. There is no limit to the number of times incoming students may take the place-ment exam.
After the exam, students are assigned four scores corresponding to their mastery of elementary algebra, advanced algebra, precalculus, and trigonometry based on their exam performance. Students with am-ple preparation in trigonometry but insufficient algebra background are very rare. Thus, the College Algebra and Precalculus courses in this study have the same cutoff score for admittance. Students who make this cutoff are steered to College Algebra or Precalculus based on their future study plans. For example, if a student plans to take cal-culus in this situation, he or she is encouraged to enroll in Precalcu-lus instead of two one-semester courses of College Algebra and Trig-onometry separately.
The course text in all three of the courses was Functions Modeling Change, 4th Ed, (Connally et al. 2010). Topics in both College Algebra and Precalculus included properties of functions; linear, quadratic,
2 For a student to have “officially enrolled” in a course at the university, he or she must be listed on the course roster after the university census date approximately two weeks into the se-mester (allowing students a change to drop or change classes without a record on their transcript).
Wa k e f i e l d e t a l . i n I n t. J . R e s . U n d e r g r a d . M at h . E d . 4 ( 2 0 1 8 ) 8
exponential, logarithmic, polynomial, and rational functions; transforma-tions, inverses, and composition of functions. In addition, Precalculus in-cluded substantial study of trigonometric ratios, functions and identities.
There were 16 sections of College Algebra and 10 sections of Pre-calculus, each with enrollments of 35 to 40 students. The Precalculus course met five days per week, including three 50 minute class periods and two 75 minute class periods. The College Algebra course met dur-ing three 75 minute class periods each week. Graduate teaching assis-tants served as instructors for twenty of the course sections, with lec-turers and one professor teaching the other six sections. The courses were highly coordinated, with two graduate students assisting one fac-ulty member to develop all of the course materials and administer the courses. The graduate students facilitated weekly instructor meetings to discuss course content, teaching methodology, and instructional con-sistency. All instructors used common lesson plans, in-class worksheets, quizzes, homework, and exams. Students completed homework activity through an online WeBWorK system, with randomized task generation and automated grading. Instructors graded their own section’s weekly team quizzes, but exams were graded as a group to prevent discrep-ancies in grading between sections. Students’ overall grades were cal-culated as a weighted average of three unit exams (40%), a final exam (20%), homework (15%), team quizzes (12%), participation (8%), and the Course Readiness Activity (CRA) (5%).
Description of the Course Readiness Activity
Starting in Fall 2013, the research team began studying an early mas-tery activity for college algebra and precalculus students. The activity, the Course Readiness Activity (CRA), was developed and refined across several semesters by mathematics faculty and graduate students at the research site. The tasks had been developed by faculty without consult-ing mathematics education literature but were chosen based on the in-structors’ perceptions of the main areas in which students struggled to recall and apply grades K-12 mathematics knowledge. The CRA includes 12 tasks asking students to simplify numerical expressions with expo-nents, add fractions, solve linear equations, solve a system of linear equa-tions in two variables, solve an inequality, compose functions, find the equation of a line between points, and match linear equations to their graphs (see Table 1 for a content alignment). Though some of the topics
Wa k e f i e l d e t a l . i n I n t. J . R e s . U n d e r g r a d . M at h . E d . 4 ( 2 0 1 8 ) 9
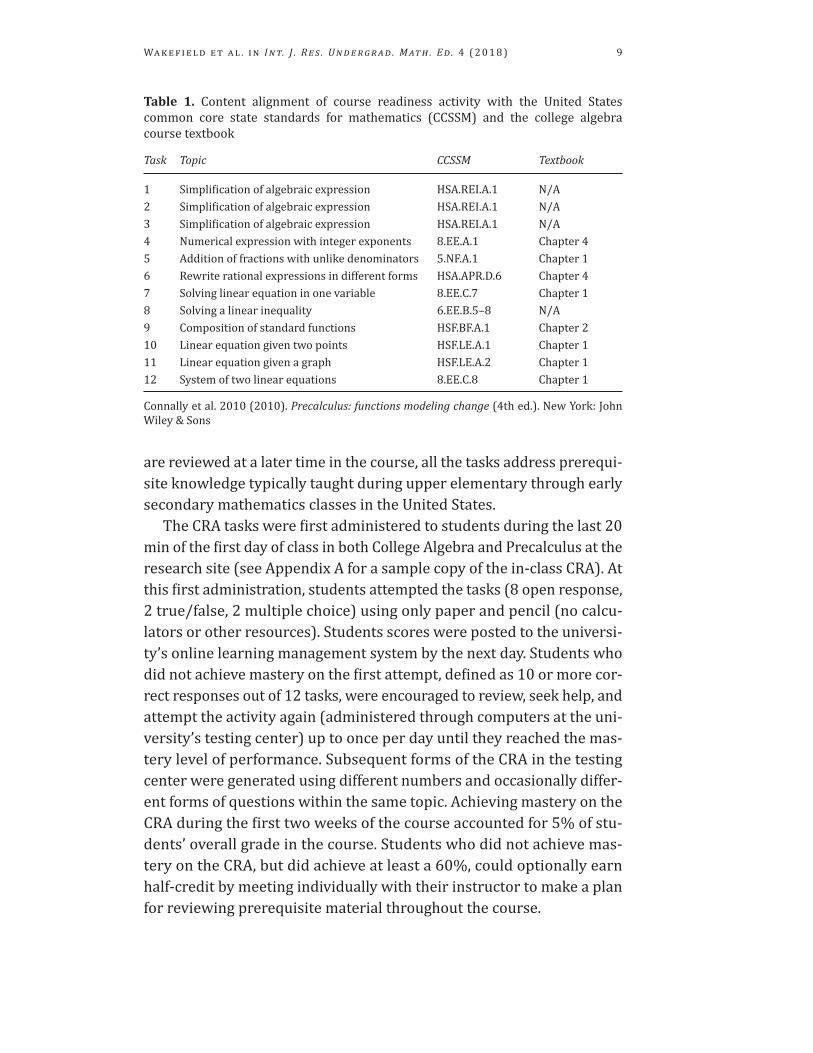
are reviewed at a later time in the course, all the tasks address prerequi-site knowledge typically taught during upper elementary through early secondary mathematics classes in the United States.
The CRA tasks were first administered to students during the last 20 min of the first day of class in both College Algebra and Precalculus at the research site (see Appendix A for a sample copy of the in-class CRA). At this first administration, students attempted the tasks (8 open response, 2 true/false, 2 multiple choice) using only paper and pencil (no calcu-lators or other resources). Students scores were posted to the universi-ty’s online learning management system by the next day. Students who did not achieve mastery on the first attempt, defined as 10 or more cor-rect responses out of 12 tasks, were encouraged to review, seek help, and attempt the activity again (administered through computers at the uni-versity’s testing center) up to once per day until they reached the mas-tery level of performance. Subsequent forms of the CRA in the testing center were generated using different numbers and occasionally differ-ent forms of questions within the same topic. Achieving mastery on the CRA during the first two weeks of the course accounted for 5% of stu-dents’ overall grade in the course. Students who did not achieve mas-tery on the CRA, but did achieve at least a 60%, could optionally earn half-credit by meeting individually with their instructor to make a plan for reviewing prerequisite material throughout the course.
Table 1. Content alignment of course readiness activity with the United States common core state standards for mathematics (CCSSM) and the college algebra course textbook
Task Topic CCSSM Textbook
1 Simplification of algebraic expression HSA.REI.A.1 N/A2 Simplification of algebraic expression HSA.REI.A.1 N/A3 Simplification of algebraic expression HSA.REI.A.1 N/A4 Numerical expression with integer exponents 8.EE.A.1 Chapter 45 Addition of fractions with unlike denominators 5.NF.A.1 Chapter 16 Rewrite rational expressions in different forms HSA.APR.D.6 Chapter 47 Solving linear equation in one variable 8.EE.C.7 Chapter 18 Solving a linear inequality 6.EE.B.5–8 N/A9 Composition of standard functions HSF.BF.A.1 Chapter 210 Linear equation given two points HSF.LE.A.1 Chapter 111 Linear equation given a graph HSF.LE.A.2 Chapter 112 System of two linear equations 8.EE.C.8 Chapter 1
Connally et al. 2010 (2010). Precalculus: functions modeling change (4th ed.). New York: John Wiley & Sons
Wa k e f i e l d e t a l . i n I n t. J . R e s . U n d e r g r a d . M at h . E d . 4 ( 2 0 1 8 ) 10
Data Analysis
The data sample includes numerical grading records and institutional registration records, anonymized to protect students’ and instructors’ identities and combined into a common dataset. Indicators of course performance considered in the analysis includes every enrolled stu-dent’s number of CRA attempts, date of last attempt at the CRA, highest score on the CRA, achievement on the CRA (mastery or non- mastery), combined homework score, combined quiz score, combined class par-ticipation score, percentages on the first, second, third, and final ex-ams. To remove the dependency on CRA scores in the overall grading, we recalculated students’ weighted overall course grades and level of achievement in the course (pass/fail) with the CRA scores omitted from the calculations.
Several background factors were extracted from institutional re-cords, including students’ self-reported sex, age, and ethnicity, as well as academic level (e.g., freshman, sophomore), enrollment statuses (e.g., full- or part-time, transfer, first-time student), primary undergradu-ate major at the time of enrolling in the course, ACT scores (or inter-polated ACT score from SAT submissions), high school grade point av-erage, high school percentile (high school rank normalized by the size of graduating class), and performance on the university’s mathemat-ics placement exam.
We used multivariate analysis of variance (MANOVA) and logistic re-gression to address the research question using the data on students’ background, CRA performance, and course outcomes. The value of MANOVA techniques for this application derives from the statistically robust ability to test hypothesized differences in course performance by both continuous and categorical factors, while controlling for poten-tial differences across the courses in which students complete the CRA. Then, after determining which factors were identified as having effects on course performance, we used logistic regression to build a statistical model of students’ likelihood of successfully completing the course. The regression model was then used to develop a direct estimate of the di-agnostic accuracy of the CRA results, with the respective coefficients in the model providing an estimate of both the direction and relative mag-nitude of CRA performance, ACT performance, and high school percen-tile as early-semester indicators of students’ probability of success in the respective courses.
Wa k e f i e l d e t a l . i n I n t. J . R e s . U n d e r g r a d . M at h . E d . 4 ( 2 0 1 8 ) 11
Results
Demographics
Among the N = 935 students in the sample, the self-reported sex distri-bution was 48% female, 52% male. Students’ programs of study were similar to those among entering freshmen at the university, includ-ing many pursuing a degree in the colleges of arts and sciences (28%), business (21%), education and humanities (12%), agricultural sciences (8%), engineering (6%), or other (7%), plus a sizable number of stu-dents who had yet to declare a program (18%). Students self-reported their ethnicity as White (80.7%), Hispanic/Latino (7.6%), Black (2.9%), Two or More Races (3.8%), Asian (2.2%), or another descriptor (2.8%). The vast majority were first-time freshmen (80.4%), with other fresh-men and sophomores comprising most others (13%). The mean age of students was 19.0 years (SD = 1.8), with 85% of students under 20 years of age. The mean high school rank of participants was the 61st percen-tile (SD = 21.4).
Mathematical Preparation
Students were placed in College Algebra (n = 553) and Precalculus (n = 382) based on their intended field of study, with Precalculus students be-ing students whose field of study falls within a STEM discipline and Col-lege Algebra students being students whose field of study was primarily not a STEM discipline. Consequently, we expected their prior mathemati-cal preparation to differ significantly between the courses. This was con-firmed (t(726) = 7.3, p < .001, d = .51). The mean ACT Math score for stu-dents in College Algebra was 21.8 (60th percentile nationally), compared to a mean of 23.6 (70th percentile nationally) in Precalculus.
CRA Performance and Course Achievement
There was complete information on course outcomes for n = 910 of the 935 students in the sample. These students’ achievement on the CRA was ordered into four categories of decreasing performance: “Early Pass” (achieve mastery in the first 3 days of the course), “Pass” (achieve mas-tery in the first two weeks), “Fail with Remediation” (met with instructor
Wa k e f i e l d e t a l . i n I n t. J . R e s . U n d e r g r a d . M at h . E d . 4 ( 2 0 1 8 ) 12
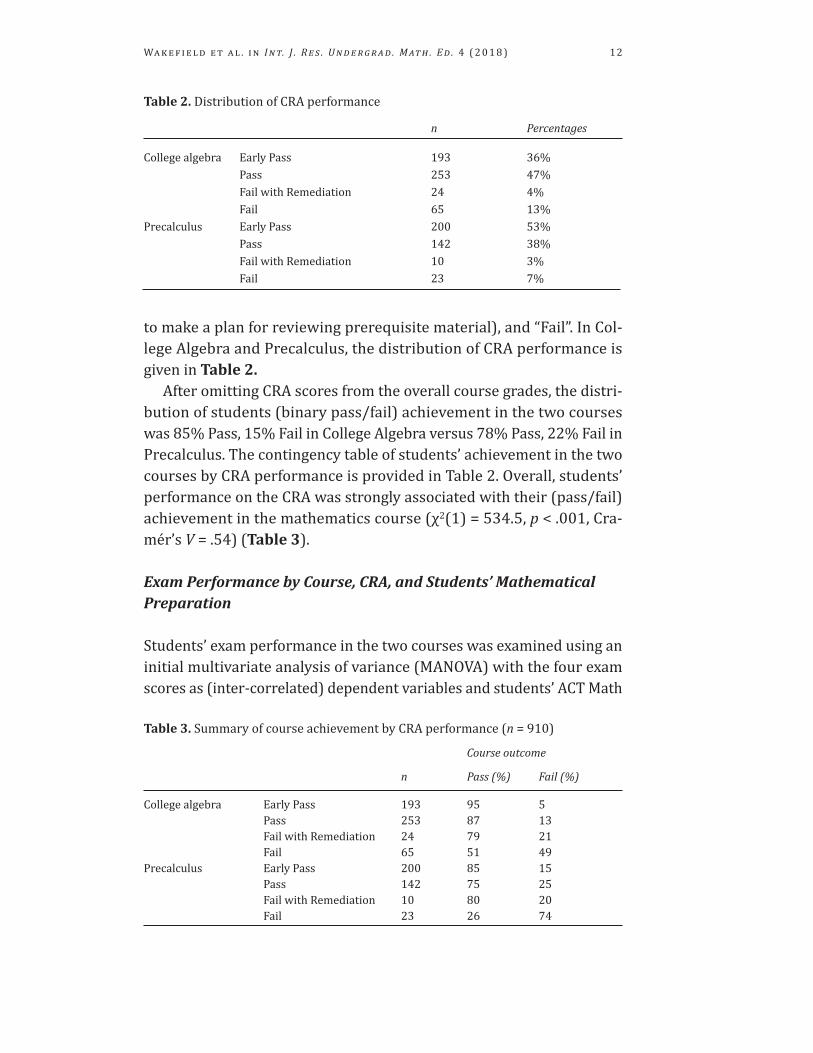
to make a plan for reviewing prerequisite material), and “Fail”. In Col-lege Algebra and Precalculus, the distribution of CRA performance is given in Table 2.
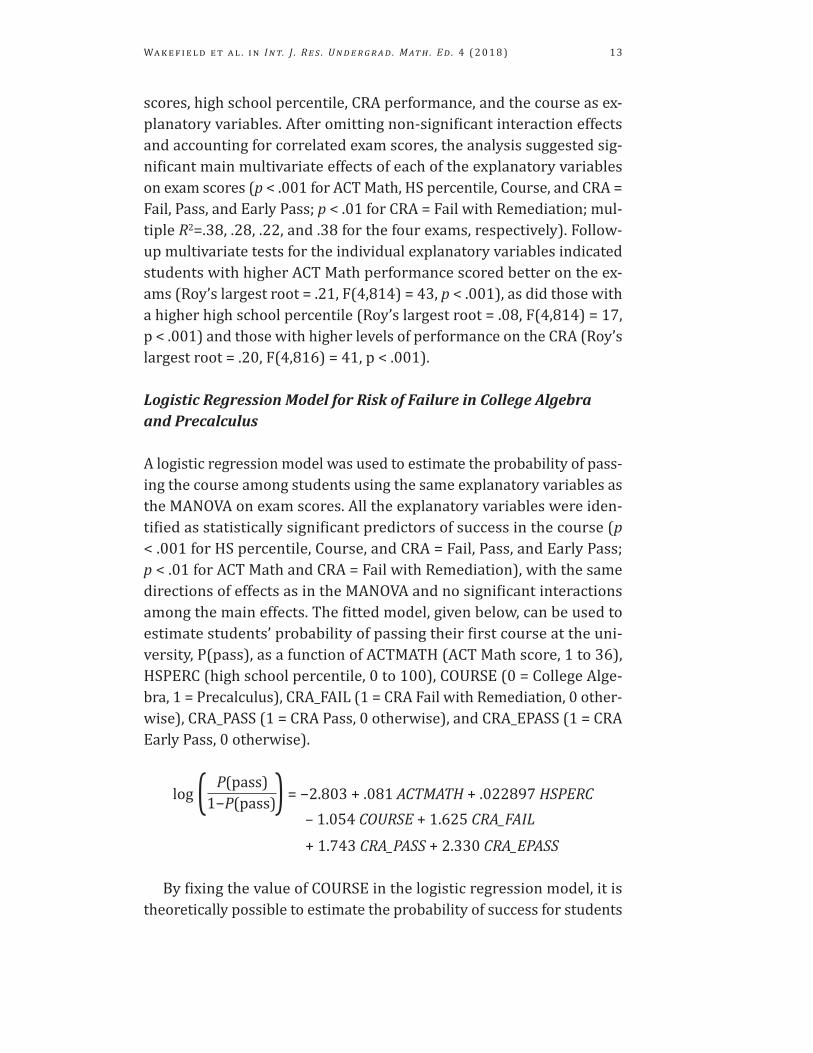
After omitting CRA scores from the overall course grades, the distri-bution of students (binary pass/fail) achievement in the two courses was 85% Pass, 15% Fail in College Algebra versus 78% Pass, 22% Fail in Precalculus. The contingency table of students’ achievement in the two courses by CRA performance is provided in Table 2. Overall, students’ performance on the CRA was strongly associated with their (pass/fail) achievement in the mathematics course (χ2(1) = 534.5, p < .001, Cra-mér’s V = .54) (Table 3).
Exam Performance by Course, CRA, and Students’ Mathematical Preparation
Students’ exam performance in the two courses was examined using an initial multivariate analysis of variance (MANOVA) with the four exam scores as (inter-correlated) dependent variables and students’ ACT Math
Table 2. Distribution of CRA performance
n Percentages
College algebra Early Pass 193 36% Pass 253 47% Fail with Remediation 24 4% Fail 65 13%Precalculus Early Pass 200 53% Pass 142 38% Fail with Remediation 10 3% Fail 23 7%
Table 3. Summary of course achievement by CRA performance (n = 910)
Course outcome
n Pass (%) Fail (%)
College algebra Early Pass 193 95 5 Pass 253 87 13 Fail with Remediation 24 79 21 Fail 65 51 49Precalculus Early Pass 200 85 15 Pass 142 75 25 Fail with Remediation 10 80 20 Fail 23 26 74
Wa k e f i e l d e t a l . i n I n t. J . R e s . U n d e r g r a d . M at h . E d . 4 ( 2 0 1 8 ) 13
scores, high school percentile, CRA performance, and the course as ex-planatory variables. After omitting non-significant interaction effects and accounting for correlated exam scores, the analysis suggested sig-nificant main multivariate effects of each of the explanatory variables on exam scores (p < .001 for ACT Math, HS percentile, Course, and CRA = Fail, Pass, and Early Pass; p < .01 for CRA = Fail with Remediation; mul-tiple R2=.38, .28, .22, and .38 for the four exams, respectively). Follow-up multivariate tests for the individual explanatory variables indicated students with higher ACT Math performance scored better on the ex-ams (Roy’s largest root = .21, F(4,814) = 43, p < .001), as did those with a higher high school percentile (Roy’s largest root = .08, F(4,814) = 17, p < .001) and those with higher levels of performance on the CRA (Roy’s largest root = .20, F(4,816) = 41, p < .001).
Logistic Regression Model for Risk of Failure in College Algebra and Precalculus
A logistic regression model was used to estimate the probability of pass-ing the course among students using the same explanatory variables as the MANOVA on exam scores. All the explanatory variables were iden-tified as statistically significant predictors of success in the course (p < .001 for HS percentile, Course, and CRA = Fail, Pass, and Early Pass; p < .01 for ACT Math and CRA = Fail with Remediation), with the same directions of effects as in the MANOVA and no significant interactions among the main effects. The fitted model, given below, can be used to estimate students’ probability of passing their first course at the uni-versity, P(pass), as a function of ACTMATH (ACT Math score, 1 to 36), HSPERC (high school percentile, 0 to 100), COURSE (0 = College Alge-bra, 1 = Precalculus), CRA_FAIL (1 = CRA Fail with Remediation, 0 other-wise), CRA_PASS (1 = CRA Pass, 0 otherwise), and CRA_EPASS (1 = CRA Early Pass, 0 otherwise).
log ( P(pass) )
= −2.803 + .081 ACTMATH + .022897 HSPERC 1−P(pass) – 1.054 COURSE + 1.625 CRA _FAIL
+ 1.743 CRA_PASS + 2.330 CRA_EPASS
By fixing the value of COURSE in the logistic regression model, it is theoretically possible to estimate the probability of success for students
Wa k e f i e l d e t a l . i n I n t. J . R e s . U n d e r g r a d . M at h . E d . 4 ( 2 0 1 8 ) 14
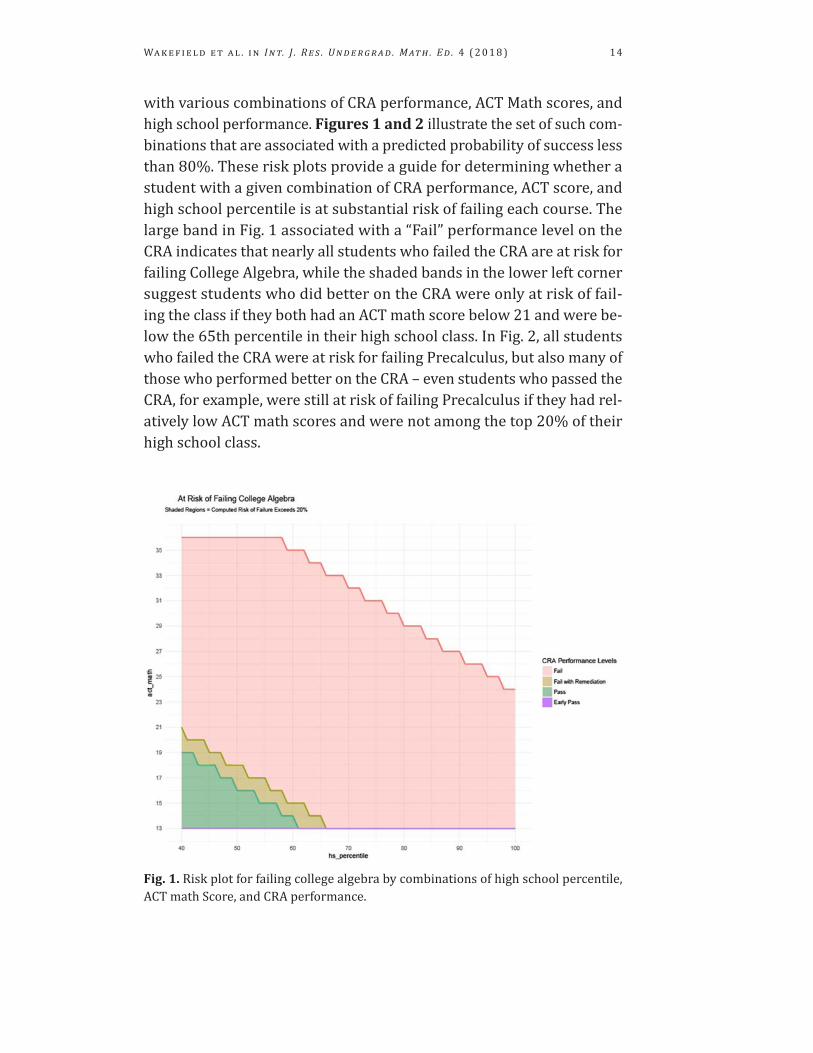
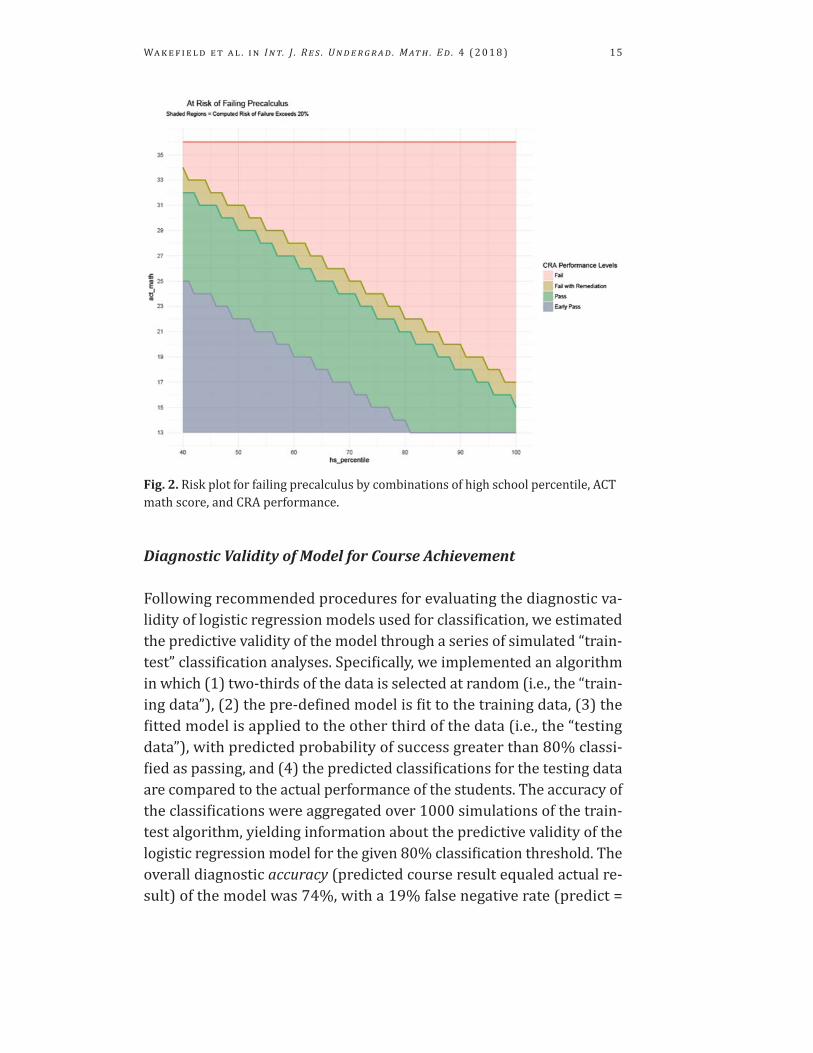
with various combinations of CRA performance, ACT Math scores, and high school performance. Figures 1 and 2 illustrate the set of such com-binations that are associated with a predicted probability of success less than 80%. These risk plots provide a guide for determining whether a student with a given combination of CRA performance, ACT score, and high school percentile is at substantial risk of failing each course. The large band in Fig. 1 associated with a “Fail” performance level on the CRA indicates that nearly all students who failed the CRA are at risk for failing College Algebra, while the shaded bands in the lower left corner suggest students who did better on the CRA were only at risk of fail-ing the class if they both had an ACT math score below 21 and were be-low the 65th percentile in their high school class. In Fig. 2, all students who failed the CRA were at risk for failing Precalculus, but also many of those who performed better on the CRA – even students who passed the CRA, for example, were still at risk of failing Precalculus if they had rel-atively low ACT math scores and were not among the top 20% of their high school class.
Fig. 1. Risk plot for failing college algebra by combinations of high school percentile, ACT math Score, and CRA performance.
Wa k e f i e l d e t a l . i n I n t. J . R e s . U n d e r g r a d . M at h . E d . 4 ( 2 0 1 8 ) 15
Diagnostic Validity of Model for Course Achievement
Following recommended procedures for evaluating the diagnostic va-lidity of logistic regression models used for classification, we estimated the predictive validity of the model through a series of simulated “train-test” classification analyses. Specifically, we implemented an algorithm in which (1) two-thirds of the data is selected at random (i.e., the “train-ing data”), (2) the pre-defined model is fit to the training data, (3) the fitted model is applied to the other third of the data (i.e., the “testing data”), with predicted probability of success greater than 80% classi-fied as passing, and (4) the predicted classifications for the testing data are compared to the actual performance of the students. The accuracy of the classifications were aggregated over 1000 simulations of the train-test algorithm, yielding information about the predictive validity of the logistic regression model for the given 80% classification threshold. The overall diagnostic accuracy (predicted course result equaled actual re-sult) of the model was 74%, with a 19% false negative rate (predict =
Fig. 2. Risk plot for failing precalculus by combinations of high school percentile, ACT math score, and CRA performance.
Wa k e f i e l d e t a l . i n I n t. J . R e s . U n d e r g r a d . M at h . E d . 4 ( 2 0 1 8 ) 16
fail course, actual = pass course) and a 7% false positive rate (predict = pass course, actual = fail course).
As an additional test of the reliability of the model, we gathered simi-lar data on students’ CRA performance and course outcomes during the same semester of the subsequent academic year. Though the new data set did not include information on students’ prior mathematics knowl-edge and achievement, we did explore the relationship between CRA performance and course success. Using the same variables for the CRA as used in the original logistic regression model yielded, we found no significant differences in the estimated effects of CRA level on course outcomes by year, and similar coefficients associated with the four CRA levels across the two data sets (all were within one standard error, with the exception of the effect associated with “fail with remediation,” which was larger in the new data set).
Discussion
The goal of this study was to investigate the extent to which an early mastery activity could be used to support achievement in college alge-bra and precalculus. This was addressed through a Course Readiness Activity (CRA), in which students had multiple opportunities during the first two weeks of their course to complete at least 10 of 12 tasks. We hy-pothesized that this relatively brief activity, with an emphasis on a short-term achievable goal, could help to support students’ performance in the course, as well as help to identify students at increased risk of failing the course. A rigorous analysis of the students’ performance and achieve-ment data demonstrated a strong relationship between the students’ CRA performance and their subsequent achievement in the course, even after adjusting for differences between the two courses and students’ prior mathematics preparation.
Our study provides some limited evidence about why CRA perfor-mance appears to be linked to students’ subsequent performance in the class (above and beyond the other indicators of mathematical prepara-tion). The activity may act as an early test of students’ motivation and persistence and provides an opportunity for both instructors and stu-dents to identify potential mathematically challenging topics. Table 1 strongly indicates a significant portion of the material in the curricu-lum is likely covered in a students’ secondary preparation. Thanheiser
Wa k e f i e l d e t a l . i n I n t. J . R e s . U n d e r g r a d . M at h . E d . 4 ( 2 0 1 8 ) 17
et al. (2014) have looked at how perceptions of “annoying prerequisite” courses may affect preservice teacher’s motivation to engage with ma-terial. Thanheiser et al. (2013) found it important to show preservice teachers that their current understanding of mathematics was limited and that they had more to learn. We believe that a similar effect may be realized for a more broad group of students the CRA. That is, the activity may send a message to students that, even though content may be famil-iar from prior coursework, they should not assume they have mastery of the content or that the course will be easy. The earlier we can help college students rethink preconceived notions of introductory college mathematics course content, the better prepared they will be to engage with the material in a purposeful way.
Many of our results could also be interpreted as supporting a “mis-placement” hypothesis. That is, perhaps the CRA can serve as an ef-fective way to identify those students who are simply unprepared for the course. After all, many students who failed the CRA later failed the course (74% in Precalculus, 49% in College Algebra). Intuitively, we sup-port this interpretation and are encouraged by the possibilities for us-ing the CRA (or similar early mastery activities) as an “early warning system” to identify students at high-risk of failure in entry-level college mathematics courses. In fact, the mathematics department at the re-search site has begun implementing the results of this activity as a tool for early identification of at-risk students. Students who are unable to pass the CRA are offered the opportunity to receive some partial credit for meeting with the mathematics undergraduate advisor to discuss how to be successful in mathematics followed by four meetings with an un-dergraduate learning assistant in which the students can ask further questions about the material and work on reviewing material in prepa-ration for the first and second exams.
We also think the CRA may serve an important role as a structured opportunity for purposeful review of prerequisite content. Regard-less of the possible predictive qualities, the activity serves the purpose for which it is named: course readiness. Virtually all of the students in our entry-level mathematics courses come into the course not having thought much about mathematics in at least three months. The activity appears to force students to engage with mathematics on the first day of the course and to continue working with the tasks until they succeed. Instead of waiting for the first exam, the activity appears to prompt stu-dents to begin studying mathematics on day one. We think the early
Wa k e f i e l d e t a l . i n I n t. J . R e s . U n d e r g r a d . M at h . E d . 4 ( 2 0 1 8 ) 18
nature of the activity can help students to “knock the rust off early,” realize an early metacognitive advantage, and set attainable, proximal study goals.
Conclusion
Using a brief early-semester mastery activity on prerequisite mathe-matics content, we were able to identify a significant portion of the stu-dents in College Algebra and Precalculus who are at risk of failing the course. Though interpretation may be limited by the development of the instrument (the CRA was designed and implemented by a group of mathematicians based on their perceptions without consulting educa-tional literature), the predictive strength of the CRA speaks to the need for the mathematics community and mathematics education community to work together to evaluate and tools used in undergraduate mathe-matics classrooms.
We theorize that the CRA may be supported by a mechanism in which entry-level undergraduate mathematics students use information from the assessment to rethink their preconceived notions of their mastery of prerequisite content, engage in purposeful review, and build specific self-efficacy to persist in the course. We invite future research to inves-tigate this proposed mechanism, particularly through qualitatively study of students’ beliefs and behaviors during and after completion of early-course mastery activities like the CRA.
Another avenue of further research could come from studying the ef-fect of the activity at other locations and other courses, up to perhaps calculus. Finally, a significant area of further research lies in our need to better serve students who are at high risk of failure. Early mastery activ-ities may do a great job of identifying at-risk students; however, merely identifying at-risk students is not enough. Future research should focus on identifying, developing, and implementing activities that are likely to help at-risk students be more successful in entry-level undergradu-ate mathematics courses.
Conflict of Interest — On behalf of all authors, the corresponding author states that there is no conflict of interest.
Wa k e f i e l d e t a l . i n I n t. J . R e s . U n d e r g r a d . M at h . E d . 4 ( 2 0 1 8 ) 19
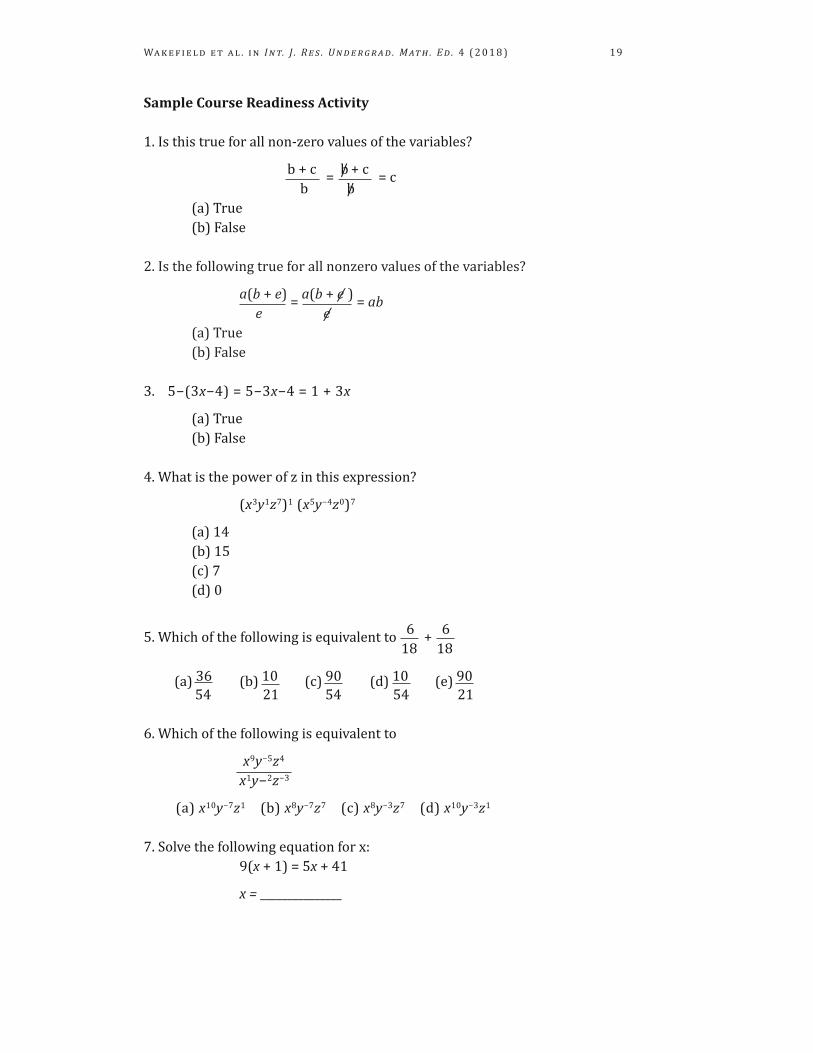
Sample Course Readiness Activity
1. Is this true for all non-zero values of the variables?
b + c = b/ + c = c b b/
(a) True (b) False
2. Is the following true for all nonzero values of the variables?
a(b + e) = a(b + e/ ) = ab e e/
(a) True (b) False
3. 5−(3x−4) = 5−3x−4 = 1 + 3x
(a) True (b) False
4. What is the power of z in this expression?
(x3y1z7)1 (x5y−4z0)7
(a) 14 (b) 15 (c) 7 (d) 0
5. Which of the following is equivalent to 6 + 6 18 18
(a) 36 (b) 10 (c) 90 (d) 10 (e) 90 54 21 54 54 21
6. Which of the following is equivalent to
x9y−5z4 x1y−2z−3
(a) x10y−7z1 (b) x8y−7z7 (c) x8y−3z7 (d) x10y−3z1
7. Solve the following equation for x: 9(x + 1) = 5x + 41
x = _______________
Wa k e f i e l d e t a l . i n I n t. J . R e s . U n d e r g r a d . M at h . E d . 4 ( 2 0 1 8 ) 20
8. Solve the inequality for x
9(x + 3) < 11x − 6
x ______________
9. If y = 9x + 2, and x = 4t + 3, then write y in terms of t. y = ______________
10. Find an equation for the line passing through (−1, 7) and (1, 9). Write your line in slope-intercept form.
y = _________________
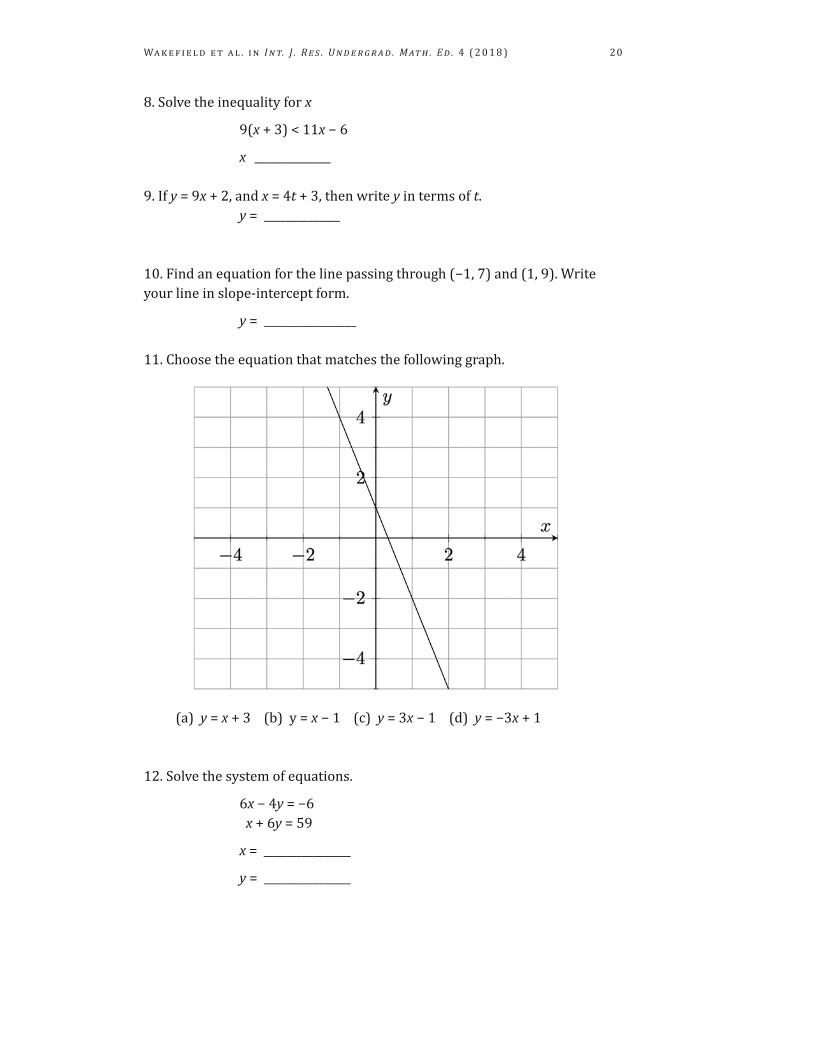
11. Choose the equation that matches the following graph.
(a) y = x + 3 (b) y = x − 1 (c) y = 3x − 1 (d) y = −3x + 1
12. Solve the system of equations.
6x − 4y = −6 x + 6y = 59
x = ________________
y = ________________
Wa k e f i e l d e t a l . i n I n t. J . R e s . U n d e r g r a d . M at h . E d . 4 ( 2 0 1 8 ) 21
References
Ahlgren, A., & Harper, M. (2011). Assessment and placement through Calculus I at the University of Illinois. Notices of the American Mathematical Society, 58(10).
Allen, J., & Sconing, J. (2005). Using ACT assessment scores to set benchmarks for college readiness. ACT Research Report Series, 2005–3. American College Testing (ACT), Inc. Retrieved from https://files.eric.ed.gov/fulltext/ED489766.pdf
Bandura, A. (1986). Social foundations of thought and action: A social cognitive theory. Englewood Cliffs, NJ: Prentice Hall.
Bressoud, D., & Rasmussen, C. (2015). Seven characteristics of successful calculus programs. Notices of the American Mathematical Society, 62(2), 144-146.
Chen, P., & Zimmerman, B. (2007). A cross-national comparison study on the accuracy of self-efficacy beliefs of middle-school mathematics students. The Journal of Experimental Education, 75(3), 221–244.
Connally, E., Hughes-Hallett, D., & Gleason, A. M. (2010). Precalculus: Functions modeling change (4th ed.). New York: John Wiley & Sons.
Fitchett, S., King, K., & Champion, J. (2011). Outcomes of mathematics placement: An analysis of advising and enrollment data. Primus, 21(7), 577–791.
Goonatilake, R., & Chappa, E. (2010). Early intervention in college mathematics courses: A component of the STEM RRG program funded by the US Department of education. The Montana Mathematics Enthusiast, 7(1), 63–74.
Gordon, S. P. (2006). Where do we go from Here? Creating a National Initiative to refocus the courses below Calculus. In N. B. Hastings (Ed.), A fresh start for collegiate mathematics: Rethinking the courses below calculus (Vol. 69) (pp. 274–282). Washington D.C.: Mathematical Association of America.
Hastings, N. B. (2006). A fresh start for collegiate mathematics: Rethinking the courses below calculus (Vol. 69). Washington D.C.: Mathematical Association of America.
Herriott, S. R., & Dunbar, S. R. (2009). Who takes college algebra? Primus, 19(1), 74–87.
Kamii, M. (1990). Opening the algebra gate: Removing obstacles to success in college preparatory mathematics courses. Journal of Negro Education, 59(3), 392–406.
Madison, B., Linde, C., Decker, B., Rigsby, E., Dingman, S., & Stegman, C. (2015). A study of placement in first college mathematics course. Primus, 25(2), 131–157.
Medhanie, A. G., Dupuis, D. N., LeBeau, B., Harwell, M. R., & Post, T. R. (2012). The role of the ACCUPLACER mathematics placement test on a student’s first college mathematics course. Educational and Psychological Measurement, 72(2), 332–351.
Moses, R., & Cobb, C. E. (2002). Radical equations: Civil rights from Mississippi to the algebra project. Boston, MA: Beacon Press.
Norman, K., Medhanie, A., Harwell, M., Anderson, E., & Post, T. (2011). High school mathematics curricula, university mathematics placement recommendations, and student university mathematics performance. Primus, 21(5), 435–455.
Wa k e f i e l d e t a l . i n I n t. J . R e s . U n d e r g r a d . M at h . E d . 4 ( 2 0 1 8 ) 22
Radunzel, J., & Noble, J. (2012). Predicting long-term college success through degree completion using ACT composite score, ACT benchmarks, and high school grade point average. ACT research report series, 2012 (5). ACT, Inc. Retrieved from https://files.eric.ed.gov/fulltext/ED542027.pdf
Reddy, A., & Harper, M. (2013). Mathematics placement at the University of Illinois. Primus, 23(8), 683–702.
Rueda, N. G., & Sokolowski, C. (2004). Mathematics placement test: Helping students succeed. The Mathematics Educator, 14(2).
Sawyer, R. (2010). Usefulness of high school average and ACT scores in making college admission decisions. ACT Research Report Series 2010-2. ACT, Inc. Retrieved from https://files.eric.ed.gov/fulltext/ED527216.pdf
Silva, E., & White, T. (2013). Pathways to improvement: Using psychological strategies to help college students master developmental math. Stanford: Carnegie Foundation for the Advancement of Teaching. Retrieved from http://cdn.carnegiefoundation.org/wpcontent/uploads/2014/09/pathways_to_improvement.pdf
Thanheiser, E., Philipp, R. A., Fasteen, J., Strand, K., &Mills, B. (2013). Preservice-teacher interviews: A tool for motivating mathematics learning. Mathematics Teacher Educator, 1(2), 137–147. https://doi.org/10.5951/mathteaceduc.1.2.0137
Thanheiser, E., Philipp, R., & Fasteen, J. (2014). Motivating prospective elementary teachers to learn mathematics via authentic tasks. In P. Liljedahl, C. Nicol, S. Oesterle, & D. Allan (Eds.). Proceedings of the 38th Conference of the International Group for the Psychology of Mathematics Education and the 36th Conference of the North American Chapter of the Psychology of Mathematics Education Vol. 5 (pp. 233-240) Vancouver, Canada: PME.
Usher, E. L., & Pajares, F. (2009). Sources of self-efficacy in mathematics: A validation study. Contemporary Educational Psychology, 34(1), 89–101.