diagnostic-photographic determination of drag… · 1 diagnostic-photographic determination of...
TRANSCRIPT

1
Diagnostic-Photographic Determination of Drag/Lift/Torque Coefficients of High Speed
Rigid Body in Water Column
Peter C. Chu and Chenwu Fan Naval Ocean Analysis and Prediction Laboratory Naval Postgraduate School, Monterey, California
Paul R. Gefken
Polter Laboratory, SRI International, Menlo Park, California

Report Documentation Page Form ApprovedOMB No. 0704-0188
Public reporting burden for the collection of information is estimated to average 1 hour per response, including the time for reviewing instructions, searching existing data sources, gathering andmaintaining the data needed, and completing and reviewing the collection of information. Send comments regarding this burden estimate or any other aspect of this collection of information,including suggestions for reducing this burden, to Washington Headquarters Services, Directorate for Information Operations and Reports, 1215 Jefferson Davis Highway, Suite 1204, ArlingtonVA 22202-4302. Respondents should be aware that notwithstanding any other provision of law, no person shall be subject to a penalty for failing to comply with a collection of information if itdoes not display a currently valid OMB control number.
1. REPORT DATE 2008 2. REPORT TYPE
3. DATES COVERED 00-00-2008 to 00-00-2008
4. TITLE AND SUBTITLE Diagnostic-Photographic Determination of Drag/Lift/Torque Coefficientsof High Speed Rigid Body in Water Column
5a. CONTRACT NUMBER
5b. GRANT NUMBER
5c. PROGRAM ELEMENT NUMBER
6. AUTHOR(S) 5d. PROJECT NUMBER
5e. TASK NUMBER
5f. WORK UNIT NUMBER
7. PERFORMING ORGANIZATION NAME(S) AND ADDRESS(ES) Naval Ocean Analysis and Prediction Laboratory,Naval PostgraduateSchool,Monterey ,CA
8. PERFORMING ORGANIZATIONREPORT NUMBER
9. SPONSORING/MONITORING AGENCY NAME(S) AND ADDRESS(ES) 10. SPONSOR/MONITOR’S ACRONYM(S)
11. SPONSOR/MONITOR’S REPORT NUMBER(S)
12. DISTRIBUTION/AVAILABILITY STATEMENT Approved for public release; distribution unlimited
13. SUPPLEMENTARY NOTES
14. ABSTRACT
15. SUBJECT TERMS
16. SECURITY CLASSIFICATION OF: 17. LIMITATION OF ABSTRACT Same as
Report (SAR)
18. NUMBEROF PAGES
50
19a. NAME OFRESPONSIBLE PERSON
a. REPORT unclassified
b. ABSTRACT unclassified
c. THIS PAGE unclassified
Standard Form 298 (Rev. 8-98) Prescribed by ANSI Std Z39-18

2
Abstract
Prediction of rigid body falling through water column with a high speed (such as
Mk-84 bomb) needs formulas for drag/lift and torque coefficients, which depend on
various physical processes such as supercavitation and bubbles. A diagnostic-
photographic method is developed in this study to determine the drag/lift and torque
coefficients for a fast moving rigid-body in water column. The diagnostic part is to derive
the relationships (called diagnostic relationships) between (drag, lift, torque) coefficients
and (position, orientation) of the rigid body from the three momentum equations and
three moment of momentum equations. The photographic part is to collect data of
trajectory and orientation of a fast moving rigid body using multiple high-speed video
cameras (10,000 Hz). Substitution of the digital photographic data into the diagnostic
relationships leads to semi-empirical formulas of drag/lift and torque coefficients, which
are functions of the Reynolds number, attack angle, and rotation rate. This method was
verified by 1/12th Mk-84 bomb strike experiment with various tail configurations (tail
section with four fins, two fins, and no fin and no tail section) conducted at the SRI test
site. The cost of this method is much lower than the traditional method using the wind
tunnel. Various trajectory patterns are found for different tail configurations.
Keywords: Body-flow interaction, drag coefficient, lift coefficient, torque coefficient,
fast rigid body in water column, dynamic-photographic method

3
1. Introduction
Prediction of a fast moving rigid body in water column has wide scientific
significance and technical application. The dynamics of a rigid body allows one to set up
six nonlinear equations for the most general motion: three momentum equations and three
moment-of-momentum equations. The scientific studies of the hydrodynamic
characteristics of a rigid body in water column involve nonlinear dynamics, body and
multi-phase fluid interaction, supercavitation, and instability theory.
The technical application of the hydrodynamics of a rigid body with high speed
into fluid includes aeronautics, navigation, and civil engineering. Recently, the scientific
problem about the movement of a rigid body in water column drew attention to the naval
research. This is due to the threat of mine and maritime improvised explosive device
(IED). Prediction of a fast falling rigid body in the water column contributes to the bomb
breaching for mine/maritime IED clearance in surf and very shallow water zones depth
shallower than 12.2 m (i.e., 40 ft), according to U.S. Navy’s standards.
To predict rigid body maneuvering in water column, accurate calculation of
hydrodynamic forces and torques is important but difficult. Difficulty is caused by
unknown drag, lift, and torque coefficients. Thus, determination of these coefficients is
crucial for the prediction[1][2][3]. Different from traditional methods used in aerodynamics
such as using the wind tunnel, we present a new efficient and low cost method to
determine the drag, lift, torque coefficients. This method consists of dynamical and
photographical parts. The dynamical part is to establish diagnostic relationships between
hydrodynamic coefficients (e.g., drag, lift, torque coefficients) and kinematics of the rigid
body (e.g., position, orientation). The photographical part is to conduct experiments with

4
shooting the rigid body into the hydrographical tank with high speed and recording its
underwater position and orientation with high-speed video (HSV) cameras at 10,000
films per second (fps). Semi-empirical formulas can be established for the drag, lift,
torque coefficients by substituting the digital data of rigid body’s location and orientation
from the HSV cameras into the diagnostic relationships.
The rest of the paper is outlined as follows. Sections 2 and describes
hydrodynamic forces/torques and basic dynamics. Section 4 presents the diagnostic
relationships for the drag/lift and torque coefficients, which were derived from the
momentum and moment of momentum equations. Section 5 depicts the photographic
method. Sections 6 and 7 show the semi-empirical formulas for the drag/lift and torque
coefficients and the verification. Section 8 describes the tail section damage effects.
Section 9 presents the conclusions.
2. Hydrodynamic Forces and Torques
2.1. Drag/Lift Forces
Let the earth-fixed coordinate system is use with (i, j) the unit vectors in the
horizontal plane and k the unit vector in the vertical direction. Consider an axially
symmetric rigid body such as a bomb falling through water column. The two end-points
of the body (i.e., head and tail points) are represented by rh(t) and rt(t). The difference
between the two vectors in nondimensional form
h t
h t
−=
−r rer r
, (1)
is the unit vector representing the body’s main axis direction (Fig. 1). The centers of mass
(om) and volume (ov) are located on the main axis with σ the distance between ov and
om, which has a positive (negative) value when the direction from ov to om is the same

5
(opposite) as the unit vector e (Fig. 2). The location (or called translation) of the body is
represented by the position of om,
r(t) = xi +yj + zk. (2)
The translation velocity is given by
, ou
d Udt
= =r u u e , (3)
where (U, ue ) are the speed and unite vector of the rigid-body velocity. Let β be the
angle of the body’s main axis with the horizontal plane, γ be the angle of the body’s
velocity u with the horizontal plane, and α be the attack angle between the direction of
the main body axis (e) and the direction of the body velocity (eu) [4] (Fig. 2),
( ) ( ) ( )1 1 1cos , sin , sinu uα β γ− − −= = =e e e k e ki i i . (4)
Usually, the unit vector eu is represented by (Fig. 3)
cos cos cos sin sinu γ ψ γ ψ γ= + +e i j k . (5)
where ψ is the azimuth angle. Differentiation of (5) with respect to t gives
cosuu u
d d ddt dt dt
γ ψγ ψ γ= +e e e , (6)
where
sin cos , sin cos sin sin cosu uψ γψ ψ γ ψ γ ψ γ= − + = − − +e i j e i j k , (7)
are unit vectors. It is clear that
, , u u u u u uψ γ γ ψ⊥ ⊥ ⊥e e e e e e . (8)
Let Vw be the water velocity. Water-to-body relative velocity V (called the
relative velocity) is represented by
w uU≡ − ≈ − = −V V u u e . (9)

6
Here, the water velocity is assumed much smaller than the rigid-body velocity. A third
basic unit vector ( hme ) can be defined perpendicular to both e and eu,
h um
u
×=
×e eee e
. (10)
The drag force (Fd) is in the opposite direction of the rigid-body velocity. The lift force
(Fl) is in the plane constructed by the two vectors (e, eu) (i.e., perpendicular to hme ) and
perpendicular to eu, and therefore the lift force is in the direction of hm u×e e . Both drag
and lift forces, exerting on the center of volume, are represented by
d d uf= −F e , , hl l l l m uf= = ×F e e e e , (11)
where fd and fl are the magnitudes of the forces. The magnitudes (fd, fl) are represented
by the drag law[5],
2 21 1, ,2 2d d w l l wf C A U f C A Uρ ρ= = (12)
where ρ is water density; Aw is the under water projection area; (Cd, Cl) are the drag
and lift coefficients, which are determined by the experiments.
Bomb is a fast moving rigid-body usually with four fins. Two fins in the same
plane are called the pair of fins. For simplicity, these fins are treated approximately as
the NACA0015 airfoils (Fig. 4) with known drag and lift coefficients. For example, they
are listed at http://www.aerospaceweb.org/question/airfoils/q0150b.shtml. Using these
coefficients, the combined drag and lift forces on a pair of fins ( fcF ) can be calculated. If
the bomb has n pairs of fins, the total drag and lift forces on the fins are represented by
n fcF .
2.2. Translation Torque

7
As the drag/lift forces are defined on the center of volume, the hydrodynamic
torque (relative to center of mass) Mh is caused by (a) drag and lift forces exerted on ov
to om, (b) moment of drag/lift forces exerted on ov (Mtr) and (c) anti-rotation of the rigid-
body (Mrot),
( ) fh d l f c tr rotnσ σ= − × + − × + +M e F F e F M M . (13)
The torque Mtr is perpendicular to both eu (the direction of V) and e (the body
orientation), and therefore it is in the same direction of the unit vector hme ,
htr tr mM=M e , (14)
where Mtr is the magnitude of the anti-translation torque, and be calculated by the drag
law[4],
212tr m w wM C A L Uρ= , (15)
where Cm is the anti-translation torque coefficient.
2.3. Anti-Rotation Torque
The anti-rotation torque acts as the rigid-body rotates. Let *Ω be the rigid-body’s
angular velocity vector, which is decomposed into two parts with one along the unit
vector e (bank angle) and the other Ω (azimuthal and elevation angles) perpendicular to
e (Fig. 5),
* s= Ω +Ω e Ω . (16)
Let ωe be the unit vector in the direction ofΩ ,
ω= ΩΩ e , Ω = Ω . (17)
The unit vector ωe is perpendicular to e,

8
0ω =e ei . (18)
Time rate of change of the unit vector e (main axis direction) is given by
*ddt
= × = ×e Ω e Ω e . (19)
Vector product between (19) and the unit vector e gives
ddt ω× = = Ωee Ω e . (20)
Differentiation of (16) with respect to time t and use of (20) lead to[6]
( )*
ss
d d ddt dt dt
Ω= +Ω × +
Ω Ωe Ω e . (21)
The anti-rotation torque (Mrot) is against the rotation of the rigid body *Ω . It can
be decomposed into two parts,
rot s c= +M M M , (22)
where the torque sM (resistant to self spinning, sΩ e ) parallels the main axis of the
body (i.e., the unit vector e),
s sM= −M e , (23)
and the torque Mc is perpendicular to the unit vector e,
c cM ω= −M e , ω ⊥e e , (24)
where Ms and Mc are the corresponding scalar parts. The drag law shows that[7]
312s s w w s sM C A Lρ= Ω Ω , (25)
21 ( / )2c w r w w rM CF L V A L Vρ= Ω . (26)

9
where Cs is the torque coefficient for self-spinning; C is the drag coefficient due to
cross-body flow. The function F(μ ) is obtained from surface integration of torque due to
cross-body hydrodynamic force (perpendicular to the body). For a cylindrical body, the
coefficient C and function F(μ ) are given by[8] [9]
1.9276 8 / Re, if Re 121.261+16/Re, if 12< Re 1800.855+89/Re, if 180 < Re 2000
0.84+0.00003Re, if 2000 < Re 120001.2 - 4/ if 12000 < Re 150000, 10
0.835 - 0.35/ , if 12000 < Re 150000, 2 100.
C δ δδ δ
+ ≤≤≤≤
= ≤ ≥≤ ≤ <
7-0.08/ , if 12000 < Re 150000, 2 1.875 0.0000045Re, if 150000 < Re 3500001/(641550/Re + 1.5), if Re > 350000.
δ δ
⎧⎪⎪⎪⎪⎪⎪⎨⎪⎪
≤ <⎪⎪ − ≤⎪⎪⎩
(27)
2 2 4
2
1 , for 1/ 26
( )1 4 1 1 , for 1/ 24 3 2 16
Fμ
μμ
μ μ μ μμ
⎧ ≥⎪⎪≡ ⎨⎡ ⎤⎛ ⎞ ⎛ ⎞⎪ − + + − <⎜ ⎟ ⎜ ⎟⎢ ⎥⎪ ⎝ ⎠ ⎝ ⎠⎣ ⎦⎩
(28)
Here, δ is the aspect ratio of the rigid body; Re = /UD ν , is the Reynolds number with
D the effective diameter of rigid body; Vr is the projection of the water-to-body relative
velocity on the vector r ω= ×e e e ,
( )r r uV U ω= = − ×V e e e ei i , (29)
where Eq.(9) is used. For a supercavitation area, a correction factor may be multiplied to
the coefficient C.
3. Dynamics
3.1. Momentum Equation

10
Differentiation of (3) with respect to time t gives the acceleration of the rigid
body,
uu
d dU dUdt dt dt
= +u ee . (30)
The momentum equation in the earth-fixed coordinate system is given by (Fig. 3),
uu
dU dm Udt dt
⎛ ⎞+ =⎜ ⎟⎝ ⎠
ee F . (31)
where F is the resultant force consisting of,
fg b d l cn= + + + +F F F F F F . (32)
Here,
, ,g bmg gρ= − = ΠF k F k (33)
are the gravity and buoyancy force and Π is the volume of the rigid body. For bomb
without fin (n = 0), the resultant force is represented by
g b d l= + + +F F F F F . (34)
Inner products between Eq.(31) and the unit vectors ( , ,u u uψ γe e e ) for n = 0 lead to
( ) u ddUm m g fdt
ρ= Π − −k ei , (35)
[ ]( ) l l udmU m g fdt
γγ ρ= Π − +k e ei , (36)
[ ]cos ( ) l l udmU m g fdt
ψψγ ρ= Π − +k e ei . (37)
Here, we use (8) and the condition l v⊥e e (i.e., the lift force perpendicular to the drag
force). The vector [ ]( ) l lm g fρΠ − +k e in (36) and (37) can be represented by
[ ]( ) ( ) cosl l d u u udU d dm g f m f mU mUdt dt dt
γ ψγ ψρ γΠ − + = + + +k e e e e , (38)
11
which shows that this vector has the component of (mdU/dt + fd) in the direction of eu,
/mUd dtγ in the direction of uγe , and cos /mU d dtγ ψ in the direction of u
ψe . Inner
product of (38) by the unit vector el leads to
[ ]( ) cosl l l u u ld dm g f mU mUdt dt
γ ψγ ψρ γ⎡ ⎤− + Π + = +⎢ ⎥⎣ ⎦k e e e e ei i , (39)
where the condition ( u l⊥e e ) is used [see (11)].
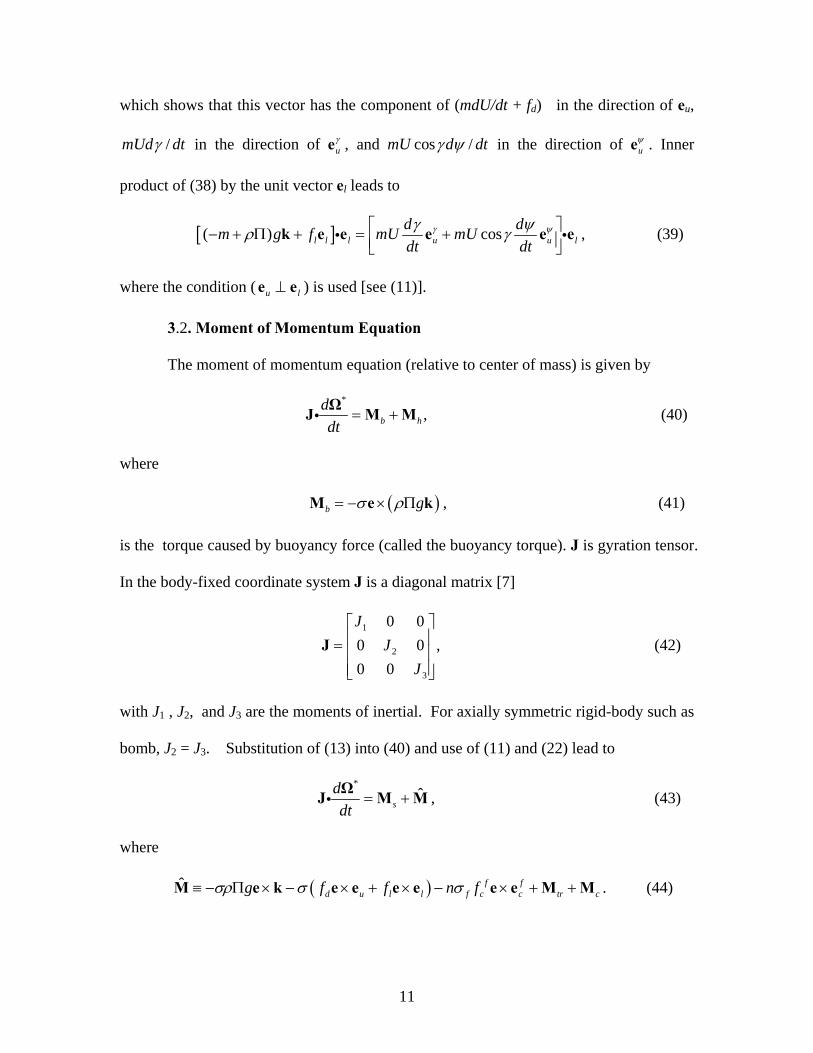
3.2. Moment of Momentum Equation
The moment of momentum equation (relative to center of mass) is given by
*
,b hddt
= +ΩJ M Mi (40)
where
( )b gσ ρ= − × ΠM e k , (41)
is the torque caused by buoyancy force (called the buoyancy torque). J is gyration tensor.
In the body-fixed coordinate system J is a diagonal matrix [7]
1
2
3
0 00 0 ,0 0
JJ
J
⎡ ⎤⎢ ⎥= ⎢ ⎥⎢ ⎥⎣ ⎦
J (42)
with J1 , J2, and J3 are the moments of inertial. For axially symmetric rigid-body such as
bomb, J2 = J3. Substitution of (13) into (40) and use of (11) and (22) lead to
*
ˆs
ddt
= +ΩJ M Mi , (43)
where
( )ˆ f fd u l l f c c tr cg f f n fσρ σ σ≡ − Π × − × + × − × + +M e k e e e e e e M M . (44)

12
Since sM is the anti-self-spinning torque which parallels the unit vector e, and M is the
torque perpendicular to the unit vector e, the moment of momentum equation (43) can be
decomposed into two components with one parallel to e[10],
1s
sdJ MdtΩ
= − , (45)
and the other perpendicular to e,
( )2
ˆs
ddt J
= −Ω ×Ω M Ω e , (46)
where (24) is used. For a rigid-body with very slow or no self spinning (such as bomb),
0sΩ , Eq.(46) becomes
2ˆdJ
dt=
Ω M . (47)
4. Diagnostic Relationships
The momentum equations (35) and (39) can be rewritten by
( )
2
2 /ud
w
m g mdU dtC
A Uρ
ρΠ − −⎡ ⎤⎣ ⎦=
k ei, (48)
( ) ( )
2
2 / cos /u u l ll
w
mU d dt d dt m gC
A U
γ ψγ γ ψ ρ
ρ
⎡ ⎤+ − Π −⎣ ⎦=e e e k ei i
. (49)
Inner products of (47) by the unit vectors hme (direction of Mtr) for without fin (n = 0) and
ωe (direction of Mae) lead to
( )
( ) ( )
22
22
( / )12
,
h hm m
hrm w r m
w w
h hd u m l l m
w
dJ g VdtC CF L VUA L U
C CL
ω
σρ
ρ
σ
+ Π ×= + Ω
⎡ ⎤+ × + ×⎣ ⎦
Ω e e k ee e
e e e e e e
i ii
i i
(50)

13
Eqs.(48)-(50) are the diagnostic relationships for determining the coefficients (Cd, Cl,
Cm). In the righthand sides of (48)-(50), the unit vectors (e, ev, ωe ) are essential, and the
other unit vectors (el, hme , ,u u
ψ γe e ) are derived.
Accurate prediction of a high-speed rigid body’s location and orientation in the
water column needs realistic values of the drag/lift and torque coefficients (Cd, Cl, Cm).
Among these coefficients, (Cd, Cl, Cm) depend on the attack angle (α ).
Effects of special phenomena such as surface impact, bubbles, and supercavition
on the movement of rigid body are represented in the change of these coefficients. Thus,
if the time evolutions of unit vectors (e, eu, ωe ) and variables ( , , , , ,x y z U ψ χ ) are
measured, time evolutions of the drag/lift and torque coefficients (Cd, Cl, Cm) can be
obtained using the diagnostic relationships (48)-(50). The rotation rate Ω is calculated
from the time series of ( ,ψ χ ).
With large-amount of derived (Cd, Cl, Cm) data, instantaneous relationships (semi-
empirical formulas) can be established statistically between (Cd, Cl, Cm) and basic
parameters such as the attack angle α , Reynolds number (Re), and the rotation rate Ω .
A traditional method for this purpose is to conduct experiments in the wind tunnel. Use
of wind tunnel may be feasible for determining the drag/lift and torque coefficients of a
rigid body in the air, but not realistic in the water especially the rigid body with high
speed such as bomb.
5. Photographic Method
5.1. General Description
As alternative to the wind tunnel method, the photographic method is used to
measure time evolutions of rigid-body’s head and tail points rh(t) and rt(t) using HSV

14
cameras [11]. From the [rh(t), rt(t)] data, the time series of the unit vectors (e, eu, ωe ),
variables ( , , , , ,x y z U ψ χ ), and attack angle (α ) can be calculated using (3), (4), (5),
and (23). With the diagnostic relationships (48)-(50), time evolutions of the drag/lift
and torque coefficients (Cd, Cl, Cm) can be obtained.
5.2. Model Design and Construction
Details of the full-scale Mk84 with a guidance tail section were obtained from
Boeing Corporation with the mass inertia properties for the complete Mk84 warhead and
tail section as well as for the modifications to the tail section including removal of two
fins, four fins, and the complete tail section. We developed a closed form analytical
model to determine the outer casing material and thickness and type of internal
components and their location for the 1/12-scale model to match the scaled total mass,
center of gravity and radius of gyration values for the Mk84 bomb with the different tail
configurations. Here, the overall outer shape of the scaled Mk84 bomb represented an
exact dimensional replica of the full-scale system. Fig. 6 shows the overall design details
of each model configuration. The outer casing was made from 7075-T6 aluminum. For
the models with a tail section, the casing was fabricated in two pieces that were screwed
together near the center point. To obtain the correct mass properties, a copper plug was
inserted inside the model and then the remaining internal cavity was filled with a low
density Epoxy. For all of the models with a tail section, only small differences in the
copper plug size was required to match the mass properties. For these models the Epoxy
had a density of 0.546 kg m-3. For the model with no tail section, two copper plugs were
required and the Epoxy density had to be increased to 1.168 kg m-3 by adding Tungsten

15
powder. Four types of model Mk-84 bombs were constructed: Type-I (tail with 4 fins),
Type-II (tail with two fins), Type-III (tail with no fins), and Type-IV (no tail).
5.3. Experiment Procedure
Two experiments were conducted to demonstrate the feasibility of this method
with 1/12th scale model of the general purpose bomb (Mk-84) as the fast moving rigid
body. The first experiment was conducted at the Monterey Bay Aquarium Research
Institute (MBARI) Unmanned Underwater Vehicle Test Tank (9.14 m × 13.72 m × 9.14
m) filled with standard sea water[12][13]. The second experiment was conducted at a 6 m
deep by 9 m diameter pool, located at the SRI’s Corral Hollow Experiment Site[14]. A
pneumatic launcher (gas gun) was used to shoot the 1/12th model Mk-84 bomb into the
water tank in the first (second) experiment with velocities up to 100 m s-1 (454 m s-1) (Fig.
7). Since the implementation is very similar between the two experiments and the second
experiment has much larger speed, the second experiment is presented here to illustrate
the photographic method.
Models of Mk-84 bombs with and without tail section are taken as examples to
illustrate the methodology for determination of the drag/lift and torque coefficients (Cd,
Cl, Cm), and in turn the prediction of location and orientation of a fast-moving rigid-body
through the water column. The primary objective is to determine the Mk84 trajectory
through the very shallow water zone to provide an estimate of the maximum bomb-to-
target standoff and required fuse delay time for optimum target lethality. Because it is
possible that a portion, or all, of the guidance tail section may become separated from the
warhead during water entry, it is necessary to determine the Mk84 trajectory for a variety

16
of different tail configurations ranging from a warhead with a completely intact tail
section and four fins to a warhead with the tail section completely.
Using the Hopkinson scaling laws, 1/12-scale Mk84 bomb models were designed
and constructed in SRI that matched the overall casing shape and mass inertial properties
of the full-scale Mk84 prototype. To model the different possible damaged tail
configurations, we fabricated models that consisted of the warhead section with a
complete tail section and four fins, a complete tail section and two fins, a complete tail
section and no fins, and with the tail section removed.
The gas gun (0.10 m diameter and 1.52 m long) barrel was evacuated before
launching the scale model to prevent an air blast from disturbing the water surface prior
to the model impacting the water surface. At the end of the gas gun there was a massive
steel ring to strip the sabot from the scale model. At high velocities there is some
deviation from the theoretical calibration curve, which may be attributed to gas blow by
around the sabot or friction. For the maximum gun operating pressure of 2,500 psi, we
were able to achieve a nominal water-entry velocity of about 305 m s-1.
Two orthogonal periscope housings were positioned in the pool to allow
simultaneous above-water and below-water visualization of the model trajectory. The
housings supported Phantom-7 HSV cameras, which were run at 10,000 fps. Five high-
intensity, short duration (30 ms) flash bulbs were used to front-light the scale model as it
entered the water and traveled under water. The HSV cameras and flash bulbs were
triggered at the time the sabot was released within the gun.
5.4. Data Collection

17
For the complete Mk84 bomb system, including the warhead with tail section and
4 fins (Type-I), tail section and 2 fins (Type-II), tail section and no fin (Type-III), and no
tail section (Type-IV) were launched at different nominal water-entry velocity regimes
from 119.48 m s-1 to 308.83 m s-1. Table 1 summarizes the overall experimental matrix
and water-entry conditions. Typically, the water-impact angle of entry was between 88o
and 90o. In Launches 10, 11, and 12 the sabot failed to fully support the scale model
within the gun during the launch phase, resulting in the scale model impacting the sabot
stripper plate before impacting the water. Sequences of images from the two orthogonal
HSV cameras were generated for each launch (Fig. 8).
Therefore, 16 time series of the unit vectors (e, eu, ),ωe variables
( , , , , , ,x y z U ψ χ Ω ), and attack angle (α ) were obtained for the four types of the
model Mk-84 bombs. All the experimental data have been converted to full-scale values.
We divided the 16 time series into two groups: (a) Launches 13, 14, 15 (called the
working data) for determining semi-empirical formulas for the drag/lift and torque
coefficients (Cd, Cl, Cm), and (b) rest of the data for evaluating the semi-empirical
formulas (called evaluation data).
6. Semi-Empirical Formulas
Statistical analysis was conducted on the working dataset (Type-IV: Launch-13, -
14, and -15) at each time step (remember the data rate is 10,000 Hz) between (Cd, Cl, Cm)
and (Re, α , Ω ). Following semi-empirical formulas have been established,
( )2 0.2
2 2 Re0.02 0.35 0.008 sinRe*dC e
πα θ− − ⎛ ⎞= + + Ω⎜ ⎟⎝ ⎠
, (51) (53)

18
( )
( ) ( )
0.2
1
20.85
2 2
Re0.35sin if Re* 2
Re0.1sin 0.015 sin if Re* 2
lC
πθ α
πθ θ α
⎧ ⎛ ⎞ ≤⎪ ⎜ ⎟⎪ ⎝ ⎠= ⎨
⎛ ⎞⎪ − Ω >⎜ ⎟⎪ ⎝ ⎠⎩
(52) (54)
( )
( )
0.2Re*0.07sin 2 if Re 2
Re0.02sin 2 if Re* 2
mC
πα α
πα α
⎧ ⎛ ⎞ ≤⎪ ⎜ ⎟⎝ ⎠⎪= ⎨
⎛ ⎞⎪ >⎜ ⎟⎪ ⎝ ⎠⎩
(53) (55)
Here, Re* = 1.8× 10⁷, is the critical Reynolds number, and
( )( ) ( )1
2.2 2.22.2 2 sign 2θ π π π α π α≡ − − − − , (54) (56)
1.8
12αθ ππ
⎛ ⎞= ⎜ ⎟⎝ ⎠
, 0.7
222 1αθ ππ
⎛ ⎞= −⎜ ⎟⎝ ⎠
. (55) (57)
The semi-empirical formulas (51)-(53) show that the drag/lift coefficients (Cd, Cl) depend
more on (Re, α ) and less on the rotation rate Ω . For the same attack angle (α ), Cd
increases with Re. For the same Re, Cd increases with α monotonically from 0o to 90o
and reduces monotonically with α from 90o to 180o with a maximum value for α = 90o
(Fig. 9). The dependence of lift coefficient Cl on (Re, α ) is a little complicated than Cd,
especially for the attack angle larger than 90o (Fig. 10). The torque coefficient Cm
depends only on (Re, α ) (Fig. 11).
The momentum equations (35)-(37) and the moment of momentum equation (47)
were integrated using the same parameters (such as the density ratio, length, radius, the
center of volume, and the center of mass) and the drop initial conditions (speed and
orientation) as in Type-III (tail without fin) and Type-IV (no tail) (see Table 1) after
using (51)-(53) for (Cd, Cl, Cm). The validity of the semi-empirical formulas (51)-(53)

19
are verified through comparison between calculated and observed bomb trajectories,
orientations, and velocities.
7. Results and Verification
7.1. Type-I
This type is for the complete Mk84 bomb system, including the warhead with tail
section and four fins. Seven launches (Launch-1 to Launch-7) were conducted at different
nominal water-entry velocity regimes (119 ms-1 to 302 ms-1). Fig. 8 shows a sequence of
images from the two orthogonal HSV cameras for a nominal velocity of 295 ms-1
(Launch-3). The cavitated column generated by the Mk84 bomb motion consists of a
tapered cone that has a maximum full scale diameter at the end of the tail section of about
0.9 m. This is about a factor of two larger than the maximum bomb diameter of 0.45 m.
This cavity shape was about the same for all of the initial water-entry velocities between
119 ms-1 and 302 ms-1.
Fig. 12 shows the comparison of bomb’s translation and orientation for Type-I
(Launch-1 to Launch-7) between the calculated and observed data. Both calculated and
observed trajectories show similar patterns. For the low velocity regime of about 125 ms-1
(Launach-1 and Launch-7), at a full scale depth of 12 m, the horizontal position ranged
between 0.1 m (Launch-7, Fig. 12g) and 0.67 m (Launch-1, Fig. 12a). The bomb
trajectories are quite stable without oscillation and tumbling no matter the water entry
velocity is high or low.
7.2. Type-II
This type is for the modified Mk84 bomb system including the warhead with a tail
section and two fins. Three launches (Launch-10, -11, -19) were conducted at an average

20
water-entry velocity of about 294 ms-1. Fig. 13 shows a sequence of images (Launch-11)
from the two orthogonal HSV cameras with a water entry-velocity of 290 ms-1. The
cavitated column generated by the bomb motion consists of a tapered cone that has a
maximum full-scale diameter at the end of the tail section of about 0.9 m. This is about a
factor of two larger than the maximum bomb diameter of 0.45 m. Thus, the initial cavity
shape was about the same as for the model with a tail section and four fins as described
above.
Fig. 14 shows the comparison of bomb’s translation and orientation for Type-II
(Launch-10, -11, -19) between the calculated and observed data. Both calculated and
observed trajectories show similar patterns. At full-scale depth of 12.2 m (i.e., 40 ft), the
horizontal position ranged between 0.53 m (Launch-11) and 2.1 m (Launch-10). These
values are about a factor of two larger than the values measured for Mk84 bomb
configuration with a tail section and four fins. Also, there seems to be no correlation
between trajectory path and initial impact angle. The removal of two fins causes the
bomb to eventually make180o turn and travel toward the surface. The 12.2 m depth is
reached at about 45 ms after water entry.
7.3. Type-III
This type is for the modified Mk84 bomb system including the warhead with a tail
section and no fin. Three launches (Launch-16, -17, -18) were conducted at an average
water-entry velocity of about 298 ms-1. Fig. 15 shows a sequence of images (Launch-17)
from the two orthogonal HSV cameras with a water entry-velocity of 297 ms-1. The
cavitated column generated by the bomb motion consists of a tapered cone that has a
maximum full-scale diameter at the end of the tail section of about 0.9 m. This is about a

21
factor of two larger than the maximum bomb diameter of 0.45 m. Thus, the initial cavity
shape was about the same as for the model with a tail section and four fins and for the
model with two fins as described above.
Fig. 16 shows the comparison of bomb’s translation and orientation for Type-III
(Launch-16, -17, -18) between the calculated and observed data. Both calculated and
observed trajectories show similar patterns. At full-scale depth of 12.2 m (i.e., 40 ft), the
horizontal position ranges between 2.1 m (Launch-18) and 3.5 m (Launch-17). These
values are about a factor of 9.5 and 3.5, respectively, larger than the values measured for
a Mk84 warhead with a tail section and four fins. Also, there seems to be no correlation
between trajectory path and angle of impact. As shown in Figs. 15 and 16, the removal of
four fins causes the bomb eventually to make 180o turn and travel toward the surface in a
manner similar to the trajectory for a bomb with a tail section and two fins. The 12.2 m
depth is reached at about 47 ms after water entry. In general, the model with a tail section
and no fins shows a decrease in overall trajectory stability compared with a model with a
tail section and two fins. This is evident primarily through larger horizontal positions.
7.4. Type-IV
This type is for the modified Mk84 bomb system including the warhead and no
tail section. Three launches (Launch-13, -14, -15) were conducted at an average water-
entry velocity of about 299 ms-1. Fig. 17 shows a sequence of images (Launch-13) from
the two orthogonal HSV cameras with a water entry-velocity of 297 ms-1. The cavitated
column generated by the bomb motion consists of a tapered cone that has a maximum
full-scale diameter at the end of the tail section of about 0.9 m. This is about a factor of
two larger than the maximum bomb diameter of 0.45 m. Thus, the initial cavity shape

22
was about the same as for the model with a tail section (four, two, and no fins) as
described above.
Fig. 18 shows the comparison of bomb’s translation and orientation for Type-IV
(Launch-13, -14, -15) between the calculated and observed data. Both calculated and
observed trajectories show similar patterns. At full-scale depth of 12.2 m (i.e., 40 ft), the
bomb has rotated 180º such that the bomb is moving tail first. When the nose reaches a
depth of 12.2 m, the nose horizontal position is between 5.5 m to 7.2 m. Launch-13 had a
deviation of 4.3º from the vertical water entry angle, which was the largest deviation in
all of the launches. However, comparison of the trajectories in Launch-13 and Launch-14,
in which a 90o water-entry angle was obtained, indicates that there is no correlation
between impact angle and trajectory path. Thus, the trajectory motion is dominated by
instability of the bomb within the cavitated region. Different from the Mk-84 bomb with
a tail section and no fin (or two fins), the Type-IV bombs are never moving up toward the
surface (Fig. 18).
Figs. 19-21 show the comparison between predicted and observed time evolutions
of the horizontal deviation (x) and depth position (z) of om, bomb speed (U), and angles
( , ,α β γ ). The predicted values of these variables are consistent to the corresponding
observed values. This confirms the validity of the semi-empirical formulas (53)-(55) for
drag/lift and torque coefficients (Cd, Cl, Cm). The three launches show the same
interesting results. The bomb nose reaches the 12.2 m depth at about 110 ms after water
entry. At this depth the bomb nose velocity decreased by about 82%. The horizontal
deviation (x) of om increases rapidly at first and then slowly with time, and about 6 m
from the entry point as the bomb reached the depth of 12.2 m.

23
8. Tail Section Damage Effects
The experiments conducted with different tail configurations were performed to
determine the effects on bomb trajectory for different possible postulated damage levels
to the tail section. Because the tail section is comprised mostly of internal stiffeners with
an external skin, it may be weaker than the warhead section and, therefore, may be
damaged during initial water entry or during tail slap within the cavitated region. Fig. 22
shows the maximum measured trajectories for each tail configuration for a nominal
water-entry velocity of about 297 ms-1, i.e., Launch-2 (Type-I), Launch-19 (Type-II),
Launch-17 (Type-III), and Launch-13 (Type-IV).
Table 2 summarizes data comparison of the overall trajectory behavior for the
different tail configurations. For each trajectory parameter we show the value associated
with a particular tail configuration and the percentage difference compared with a
complete bomb having a tail section and four fins. The horizontal nose position
significantly increases with increased levels of damage to the tail section. For a model
with a tail section and two fins, no fins, and no tail section, the horizontal position values
increase by 120%, 259%, and 575%, respectively. With regard to travel time at 12.2 m
depth, only the no-tail configuration shows a significant increase of 179%.
9. Conclusions
(1) A new dynamic-photographic method has been developed to determine the
drag/lift and torque coefficients (Cd, Cl, Cm) of a fast-moving rigid body in the water
column. This method contains two parts: (1) establishment of the diagnostic relationship
between (Cd, Cl, Cm) and the rigid-body’s trajectory and orientation, and (2) data
collection of trajectory and orientation of a fast moving rigid body using multiple high-

24
speed video cameras (10,000 Hz). Using the digital photographic data, semi-empirical
formulas of (Cd, Cl, Cm) versus Reynolds number, attack angle, and rotation rate can be
established. The cost of this method is much lower than the traditional method using the
wind tunnel to determine (Cd, Cl, Cm).
(2) To demonstrate the feasibility and powerfulness of this method, an experiment
was conducted with 1/12th scale model of the general purpose bomb (Mk-84) as the fast
moving rigid body at a 6 m deep by 9 m diameter pool, located at the SRI’s Corral
Hollow Experiment Site. A gas gun was used to shoot the 1/12th model Mk-84 bomb into
the water tank with velocities up to 304 ms-1. Four types of Mk-84 model bombs were
used with total 16 launches for the experiment: warhead with tail section and four fins
(Type-1), with tail section and two fins (Type-1I), with tail section and no fin (Type-1II),
and with no tail section (Type-IV). Among them, data from 3 launches in Type-IV were
used to get the semi-empirical formulas for (Cd, Cl, Cm). The rest of data were used for
verification.
(3) The momentum equations and moment of momentum equations were
integrated with the same parameters (such as the density ratio, length, radius, the center
of volume, and the center of mass) and the drop initial conditions (speed and orientation)
as in the observations after using the semi-empirical formulas for (Cd, Cl, Cm). Consistent
between calculated and observed bomb trajectories, orientations, and velocities show the
powerfulness of this method.
(4) Both calculated (solving dynamic equations with the semi-empirical formulas)
and experimental data show similar results. The cavitated column generated by the Mk84
bomb motion consists of a tapered cone that has a maximum full scale diameter at the end

25
of the tail section of about 0.9 m. This is about a factor of two larger than the maximum
bomb diameter of 0.45 m. This cavity shape was about the same for all of the initial
water-entry velocities and four types of model bombs.
(5) The horizontal nose position significantly increases with increased levels of
damage to the tail section. For a model with a tail section and two fins, no fins, and no
tail section, the horizontal position values increase by 120%, 259%, and 575%,
respectively. With regard to travel time at 12.2 m (i.e., 40-ft) depth, only the no-tail
configuration shows a significant increase of 179%.
(6) For bomb with a tail section and four fins, its trajectories are quite stable
without oscillation and tumbling no matter the water entry velocity is high or low.
Removal of two fins causes the bomb to eventually make180o turn and travel toward the
surface. Although having a similar trajectory pattern (i.e., making180o turn and traveling
toward the surface), the removal of four fins shows a decrease in overall trajectory
stability compared with a model with a tail section and two fins. This is evident primarily
through larger horizontal positions. For Mk-84 bomb without a tail section, the bomb has
rotated 180º at full-scale depth of 12.2 m such that the bomb is moving tail first. Different
from the Mk-84 bomb with a tail section and no fin (or two fins), the Mk-84 bombs
without a tail section are never moving up toward the surface.
Acknowledgments
The Office of Naval Research Breaching Technology Program (Grant Number:
N0001405WR20209) and Naval Oceanographic Office supported this study.

26
References
[1] Chu, P.C., and C.W. Fan, 2006: Prediction of falling cylinder through air-water-
sediment columns. Journal of Applied Mechanics, 73, 300-314.
[2] Chu, P.C., and C.W. Fan, 2005: Pseudo-cylinder parameterization for mine impact
burial prediction. Journal of Fluids Engineering, 127, 1515-152.
[3] Chu, P.C., 2008: Mine impact burial prediction from one to three dimensions. Applied
Mechanics Reviews, ASME Journal, in press.
[4] Munson, B.R., and D.J. Cronin, 1998: Airfoils and wings. In “The Handbook of Fluid
Dynamics”, edited by R. W. Johnson, CRC Press, 4-1 to 4-3.
[5] Von Mises, R, 1959, Theory of Flight, 1st Ed., Dover Publications Inc., New York, 564-585 pp.
[6] Chu, P.C., and C.W. Fan, 2007: Mine impact burial model (IMPACT35) verification
and improvement using sediment bearing factor method. IEEE Journal of Oceanic
Engineering, 32 (1), 34-48.
[7] Chu, P.C., C.W. Fan, A. D. Evans, and A. Gilles, 2004: Triple coordinate transforms
for prediction of falling cylinder through the water column. Journal of Applied
Mechanics, 71, 292-298.
[8] Rouse, H, 1938, Fluid Mechanics for Hydraulic Engineers, 1st Ed., Mcgraw-Hill
Book Company Inc., New York, 422 pp.
[9] Crowe, C.T., J.A. Roberson, and D.F. Elger, 2001, Engineering Fluid Mechanics. 7th
Edition, John Wiley & Sons Inc, New York, 714 pp.
[10] White, F. M., 1974, Viscous Fluid Flow, 1st Ed., McGraw-Hill Inc., New York, 712
pp.

27
[11] Chu, P.C., A. Gilles, and C.W. Fan, 2005: Experiment of falling cylinder through the
water column. Experimental and Thermal Fluid Sciences, 29, 555-568.
[12] Chu, P.C., G. Ray, P. Fleischer, and P. Gefken, 2006: Development of three
dimensional bomb maneuvering model, DVD-ROM (10 pages). Seventh Monterey
International Symposium on Technology and Mine Problems, NPS, Monterey, California,
May 1-4.
[13] Ray, G., 2006: Bomb strike experiments for mine countermeasure. Master thesis in
Meteorology and Oceanography, Naval Postgraduate School, Monterey, California, 197
pp.
[14] Gefken, P.R., 2006: Evaluation of precision-guided bomb trajectory through water
using scale-model experiments. SRI Final Technical Report – PYU-16600, 80 pp.

28
Table 1. Summary of Mk-84 underwater trajectory experimental matrix.
Launch Number
Model Type Water-Entry Velocity (m/s)
Water-Entry Impact Angle (o)
1 I (tail with 4 fins) 132 89.2 2 I (tail with 4 fins) 297 90.0 3 I (tail with 4 fins) 295 88.8 4 I (tail with 4 fins) 302 88.5 5 I (tail with 4 fins) 227 88.0 6 I (tail with 4 fins) 219 89.0 7 I (tail with 4 fins) 119 88.2 8 II (tail with 2 fins) impacted
sabot stripper plate
9 II (tail with 2 fins) impacted sabot
stripper plate
10 II (tail with 2 fins) 295 90.0 11 II (tail with 2 fins) 290 90.0 12 II (tail with 2 fins) impacted
sabot stripper plate
13 IV (no tail) 297 85.7 14 IV (no tail) 301 90.0 15 IV (no tail) 301 88.7 16 III (tail with no fin) 304 90.0 17 III (tail with no fin) 297 87.0 18 III (tail with no fin) 291 88.1 19 II (tail with 2 fins) 297 90.0

29
Table 2. Horizontal position shift and travel time at depth of 12.2 m (i.e., 40 ft) for Mk-84 warhead with different tail configurations.
Model Type Horizontal Position Shift (Unit: m)
Travel Time (Unit: ms)
Tail with 4 Fins
0.96
46.2
Tail with 2 Fins
2.12
46.2
Tail with Non Fins
3.46
49.8
No Tail
6.50
129.5

30
o y
z
x
r h
r t
L
e
Fig. 1. Position vectors rh, rt, and the unit vector e.

31
e
β
om
ov
uγ
α
Fd
Fl
M
σ
Fig. 2. Attack angle (α ), angles ( ,β γ ), center of volume (ov), center of mass (om), and drag and lift forces (exerted on ov). Note that σ is distance between ov and om with positive (negative) value when the direction from ov to om is the same (opposite) as the unit vector e.

32
Fig. 3. Illustration of unit vectors ( , , , xy
u u u uψ γe e e e ) with xy
ve the projection of eu on the x-y plane.

33
om
e
Vw
of
Ffd
Ffl
σ f
Fig. 4. Axial and cross-axial velocity ( , f f
a cu u ), associated hydrodynamic forces on a pair of fins ( , f f
a cF F ) and the distance between of and om (i.e., fσ ) with positive (negative) value when the direction from of to om is the same (opposite) as the unit vector e.

34
Fig. 5. Illustration of , , tr cΩ M M .

35
(a)
(b)
Fig. 6. Photography of 1/12th scale model Mk-84 bomb: (a) warhead with tail section and four fins, and (b) sabot.

36
Fig. 7. Overview experimental arrangement.

37
(a) (b) (c)
Fig. 8. Two HSV images for Launch-3 (Type-I) at water entry velocity of 295 ms-1: initial water entry, (b) t = 22.8 ms, and (c) t = 44.4 ms.

38
030
6090
120150
180
0.51
1.52
x 107
0
0.1
0.2
0.3
0.4
0.5
α(o)
(a) Ω= −5/s
Re
Cd
030
6090
120150
180
0.51
1.52
x 107
0
0.1
0.2
0.3
0.4
0.5
α(o)
(b) Ω= 0/s
Re
Cd
030
6090
120150
180
0.51
1.52
x 107
0
0.1
0.2
0.3
0.4
0.5
α(o)
(c) Ω= 5/s
Re
Cd
Fig. 9. Dependence of Cd on the Reynolds number (Re) and attack angle (α ) for three different values of Ω : (a) -5 s-1, (b) 0, and (c) 5 s-1.

39
030
6090
120150
180
0.51
1.52
x 107
−0.2
0
0.2
0.4
α(o)
(a) Ω= −5/s
Re
Cl
030
6090
120150
180
0.51
1.52
x 107
−0.2
0
0.2
0.4
α(o)
(b) Ω= 0/s
Re
Cl
030
6090
120150
180
0.51
1.52
x 107
−0.2
0
0.2
0.4
α(o)
(c) Ω= 5/s
Re
Cl
Fig. 10. Dependence of Cl on the Reynolds number (Re) and attack angle (α ) for three different values of Ω : (a) -5 s-1, (b) 0, and (c) 5 s-1.

40
030
6090
120150
180
0.5
1
1.5
2
x 107
−0.05
0
0.05
0.1
0.15
α(o)Re
Cm
Fig. 11. Dependence of Cm on the Reynolds number (Re) and attack angle (α ).

41
−2 0 2 4
−20
−15
−10
−5
0
Y(m
)
X(m)
(a)
−2 0 2 4
X(m)
(b)
−2 0 2 4
X(m)
(c)
ExpMod
−2 0 2 4
X(m)
(d)
−2 0 2 4
X(m)
(e)
−2 0 2 4
X(m)
(f)
−2 0 2 4
X(m)
(g)
Fig. 12. Comparison between predicted and observed trajectories for Mk84 warhead with tail section and four fins (Type-1) with initial water entry speed: (a) 132 ms -1, (b) 297 ms-1, (c) 295 ms-1, (d) 302 ms-1, (e) 227 ms-1, (f) 219 ms-1, and (g) 119 ms-1.

42
(a) (b) (c) (d) (e) (f)
Fig. 13. Two HSV images for Launch-11 (Type-II) at water entry velocity of 290 ms-1: (a) initial water entry, (b) t = 21.6 ms, (c) t = 48.0 ms, (d) t = 75.6 ms, (e) t = 116.4 ms, and (f) t = 344.4 ms.

43
0 5 10 15 20 25
−20
−15
−10
−5
0
Z(m
)
Y(m)
(a) Initial U = 295m/s
0 5 10 15 20 25
Y(m)
(b) Initial U = 290m/s
0 5 10 15 20 25
Y(m)
(c) Initial U = 297m/s
ExperimentModeling
Fig. 14. Comparison between predicted and observed trajectories for Mk84 warhead with tail section and two fins (Type-1I) with initial water entry speed: (a) 295 ms -1, (b) 290 ms-1, and (c) 297 ms-1. (a) (b) (c) (d)
(e) (f)
Fig. 15. Two HSV images for Launch-17 (Type-III) at water entry velocity of 298 ms-1: (a) initial water entry, (b) t = 22.8 ms, (c) t = 55.2 ms, (d) t = 99.0 ms, (e) t = 211.2 ms, and (f) t = 376.2 ms. Note that for time longer than 99.0 ms, only one HSV camera got the pictures.

44
0 5 10 15 20 25
−20
−15
−10
−5
0
Z(m
)
Y(m)
(a) Initial U = 304m/s
ExperimentModeling
0 5 10 15 20 25
Y(m)
(b) Initial U = 299m/s
0 5 10 15 20 25
Y(m)
(c) Initial U = 291m/s
Fig. 16. Comparison between predicted and observed trajectories for Mk84 warhead with tail section and no fin (Type-1II) with initial water entry speed: (a) 304 ms-1, (b) 298 ms-1, and (c) 291 ms-1.

45
(a) (b) (c) (d) (e)
Fig. 17. Two HSV images for Launch-13 (Type-IV) at water entry velocity of 296 ms-1: (a) initial water entry, (b) t = 30.0 ms, (c) t = 51.6 ms, (d) t = 155.4 ms, and (e) t = 418.2 ms.

46
Fig. 18. Comparison between predicted and observed trajectories for Mk84 warhead with no tail section (Type-1V) with initial water entry speed: (a) 296 ms -1, (b) 301 ms-1, and (c) 301 ms-1.

47
−2
0
2
4
6
8
Y (
m)
(a)
Experiment3−D Model
−25
−20
−15
−10
−5
0
5
Z (
m)
(b)
0 0.1 0.2 0.3 0.40
50
100
150
200
250
300
U (
m/s
)
Time (s)
(c)
−50
0
50
100
150
200
α (o )
(d)
−100
−50
0
50
100
β (o )
(e)
0 0.1 0.2 0.3 0.4−100
−90
−80
−70
−60
−50
−40
γ (o )
Time (s)
(f)
Fig. 19. Time-evolutions between predicted (solid) and observed (dotted) for Launch-13: (a) horizontal position (x) of om, (b) depth position (z) of om, (c) bomb speed (U), (d) angle γ , (e) angle β , and (f) attack angle α .

48
0
2
4
6
8
Y (
m)
(a)
Experiment3−D Model
−25
−20
−15
−10
−5
0
5
Z (
m)
(b)
0 0.1 0.2 0.3 0.40
50
100
150
200
250
300
350
U (
m/s
)
Time (s)
(c)
−50
0
50
100
150
200
α (o )
(d)
−100
−50
0
50
100
β (o )
(e)
0 0.1 0.2 0.3 0.4−90
−80
−70
−60
−50
−40
−30
γ (o )
Time (s)
(f)
Fig. 20. Time-evolutions between predicted (solid) and observed (dotted) for Launch-14: (a) horizontal position (x) of om, (b) depth position (z) of om, (c) bomb speed (U), (d) angle γ , (e) angle β , and (f) attack angle α .

49
−2
0
2
4
6Y
(m
)
(a)
Experiment3−D Model
−20
−15
−10
−5
0
5
Z (
m)
(b)
0 0.1 0.20
50
100
150
200
250
300
350
U (
m/s
)
Time (s)
(c)
0
50
100
150
200
α (o )
(d)
−100
−50
0
50
100
β (o )
(e)
0 0.1 0.2−100
−90
−80
−70
−60
−50
−40
−30
γ (o )
Time (s)
(f)
Fig. 21. Time-evolutions between predicted (solid) and observed (dotted) for Launch-15: (a) horizontal position (x) of om, (b) depth position (z) of om, (c) bomb speed (U), (d) angle γ , (e) angle β , and (f) attack angle α .

50
−22
−20
−18
−16
−14
−12
−10
−8
−6
−4
−2
0F
ull−
Sca
le W
ater
Dep
th (
m)
Experiment
Tail With 4 FinsTail With 2 FinsTail Without FinNo Tail
0 5 10 15 20 25
−22
−20
−18
−16
−14
−12
−10
−8
−6
−4
−2
0
Full−Scale Horizontal Position (m)
Ful
l−S
cale
Wat
er D
epth
(m
)
Modeling
Tail With 4 FinsTail With 2 FinsTail Without FinNo Tail
Fig. 22. Trajectories for Mk-84 warhead with different tail configurations.