diagnostic research designs: an introductory overview
TRANSCRIPT

15/03/2012
1
Diagnostic research designs: an introductory overview
Madhukar Pai, MD, PhDAssociate Professor of Epidemiology, McGill UniversityMontreal, Canada
Email: [email protected]
Classical EBM approach to diagnosis: compute sens/spec, LRs, and work out the post-test probabilities…
Diseaseruled IN
Disease ruled OUT
Disease not
ruled in or out
Above this point,treat
Below this point,no further testing

15/03/2012
2
Bayes' theory
•Bayes' Theorem is a simple mathematical formula used for calculating conditional probabilities
•every test is done with a certain probability of disease -degree of suspicion [pre-test or prior probability]
• the probability of disease after the test result is the post-test or posterior probability
pre-test probability
post-test probability
Test
Post-test odds = Pre-test odds x Likelihood ratio
What you thought before + New information = What you think now
pre-test probability
LOW
post-test probability
HIGH
Test
•An accurate test will help reduce uncertainty
•The pre-test probability is revised using test result to get the post-test probability
•Tests that produce the biggest changes from pretest to post-test probabilities are most useful in clinical practice [very large or very small likelihood ratios]
•LR also called “Bayes Factor”
pre-test probability
HIGH
post-test probability
LOWTest
Bayesian approach to diagnosis

15/03/2012
3
The diagnostic process is Bayesian, probabilistic, multivariable and sequential
Moons KGM. In: Grobbee & Hoes. Clinical Epidemiology. 2009
Some differences
Test research vs. diagnostic research
Diagnosis vs. screening
Diagnosis vs. prediction

15/03/2012
4
Moons et al. Epidemiology 1999
Moons et al. Clin Chem 2004
Moons et al. JECH 2002
Diagnosis Vs Screening
A diagnostic test is done on sick peoplepatient presents with symptomspre-test probability of disease is high (i.e. disease prevalence is high)
A screening test is usually done on asymptomatic, apparently healthy people
healthy people are encouraged to get screenedpre-test probability of disease is low (i.e. disease prevalence is low)

15/03/2012
5
Diagnosis vs. prediction
Diagnosis: Disease has already occurred and we are trying to detect its
presencePrognosis: Disease has not occurred and we want to know who is most
likely to develop the diseaseBoth are amenable to multivariable approaches and prediction modelsThey are often mixed up Sometimes a diagnostic test itself can be used to predict
future outcomes (e.g. PSA, Apgar) E.g. With IGRAs we were hoping that they will be accurate for detecting LTBI as
well as predicting who will develop TB disease

15/03/2012
6
Types of diagnostic study designs(Phased approach)

15/03/2012
7
Phases in intervention/drug trials
Phase I: Researchers test a new drug or treatment in a small group of people for the first time to evaluate its safety, determine a safe dosage range, and identify side effects.
Phase II: The drug or treatment is given to a larger group of people to see if it is effective and to further evaluate its safety.
Phase III: The drug or treatment is given to large groups of people to confirm its effectiveness, monitor side effects, compare it to commonly used treatments, and collect information that will allow the drug or treatment to be used safely.
Phase IV: Studies are done after the drug or treatment has been marketed to gather information on the drug's effect in various populations and any side effects associated with long-term use.
BMJ 2002;324:539–41

15/03/2012
8
Phase I to IV diagnostic studiesPhase I questions Do test results in patients with the target disorder differ from those
in normal people?
BMJ 2002;324:539–41
Phase I to IV diagnostic studies
Phase II questions Are patients with certain test results more likely to have the
target disorder than patients with other test results?
BMJ 2002;324:539–41

15/03/2012
9
Phase I to IV diagnostic studiesPhase III questions Does the test result distinguish patients with and without the
target disorder among patients in whom it is clinically reasonable to suspect that the disease is present?
BMJ 2002;324:539–41
Phase I to IV diagnostic studies
Phase IV questions Do patients who undergo this diagnostic test fare better (in
their ultimate health outcomes) than similar patients who are not tested?
BMJ 2002;324:539–41
15/03/2012
10
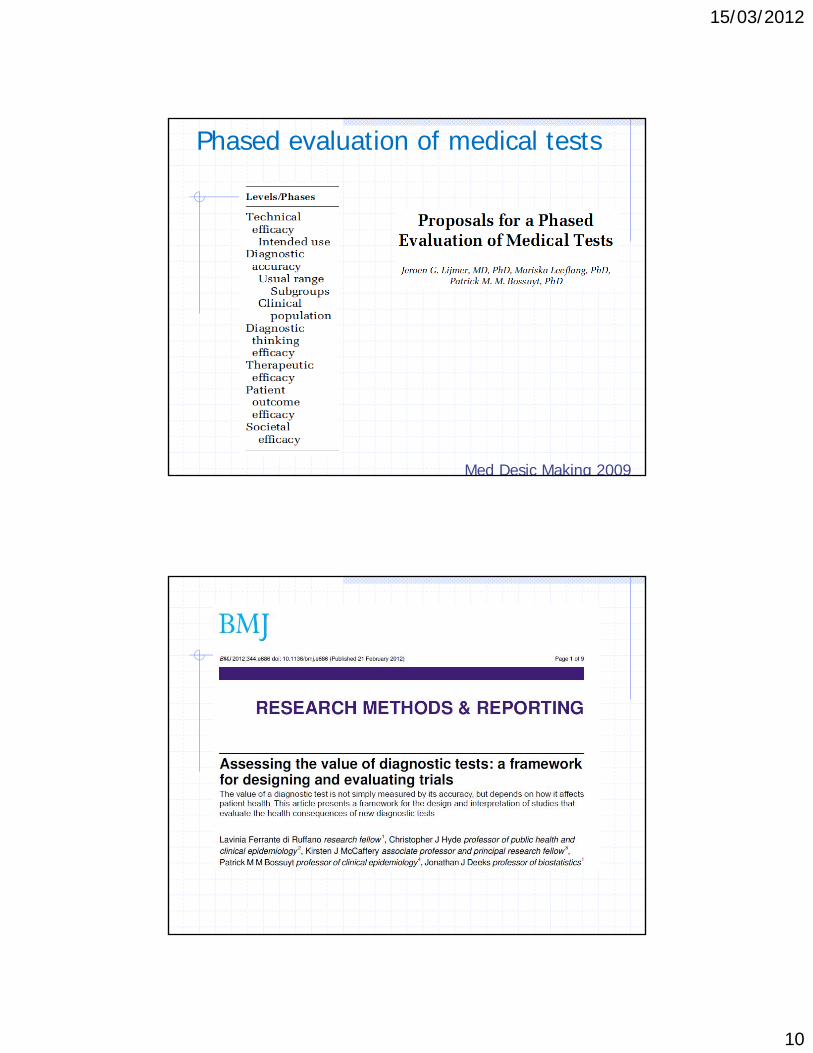
Phased evaluation of medical tests
Med Desic Making 2009

15/03/2012
11
Design is often decided by: what is the real or intended purpose of the test?
Bossuyt, BMJ, 2006
TB examplesTriage: Urine LAM POC test in HIV+ to decide who needs further investigation for TB disease
Replacement: Xpert MTB/RIF to replace sputum smear microscopy for investigating HIV+ TB suspects
Add-on: IGRA added to TST for LTBI screening of HIV-infected persons with low CD4 counts
Most published TB Dx studies do not clearly indicate the intendedpurpose!

15/03/2012
12
Denkinger C et al. Clin Micro Infect 2011

15/03/2012
13
Replacement
No change in consequences for TP, FP, FN, TN
Accuracy may be enough (preferably paired data) – unless new test is more sensitive
Other info needed: costs, safety, burden, indeterminate results…
Add on
Potential change in consequences, also extra numbers(either extra positives or extra negatives)
Extra testing: extra time, burden
Other info needed: costs, safety, burden, indeterminate results…Effect of change in consequences (patient impact)

15/03/2012
14
Triage
May result in a completely different pathway and different population selected for treatment
Accuracy will not be enough
Other info needed: clinical impact, costs, safety, burden, indeterminate results…
Advantage of early diagnosis?
A decision tree will be very helpful to clarify the intended purpose
Dowdy D et al.

15/03/2012
15

15/03/2012
16
Key issue to appreciate:
Accuracy may or may not result in clinical impact (on patient outcomes)

15/03/2012
17
33
Pediatrics 2003;112;363-367
Rapid tests for influenza: Clinical impact
“Impact” outcomes include:
•Change in clinical decisions•Reduction in antibiotic use•Increased antiviral use•Decreased length of time to discharge•Reduction in lab investigations, etc
Most diagnostic studies are focused on technical and accuracy issues
Tatsioni, Annals

15/03/2012
18
Most existing tools and instruments are focused on test accuracy
Example: DEEP guidelines by TDR QUADAS tool STARD for better reporting Cochrane Handbook for Diagnostic Reviews
Mapping the landscape and quality of TB diagnostic research
Madhukar Pai, MD, PhDLaurence Brunet, MScJessica Minion, MDKaren Steingart, MD, MPHAndrew Ramsay, MScChristian Lienhardt, MD, PhD
36
Contact: [email protected]

15/03/2012
19
37PLoS One 2009
Main findingsAbout 15% of all TB papers were mainly focused on TB diagnosis.Of these, about 85% were evaluation studies of tests and markers.Of these evaluation studies, about 85% are early phase studies of test accuracy; there are very little data on impact on patient outcomes.Most test accuracy studies are of moderate to low quality and are poorly reported. Essential methodological and design elements are often either not reported or poorly reported.These results have important implications for policy making
38

15/03/2012
20
39BMJ 2008
Example: Rapid diagnostics tests (RIDTs) for influenza
159 accuracy studies
20+ impact studies (including several diagnostic RCTs)
40
GRADE expectations are met in other fields that are well ahead of TB...

15/03/2012
21
In TB, since we have mostly accuracy data: example from WHO EGM on tests for drug-resistant TB
Regardless of study quality, precision, consistency ... accuracy studies will never lead to High Quality Evidence
Test,# Studies (participants)
Design Limitations Directness Inconsistency Imprecise or sparse data
Publication Bias
Evidence Quality
MODS,9 (1474)
CS & CC Low No evidence Low Low Possible Moderate
NRA,19 (2304)
CS & CC Low No evidence Low Low Possible Moderate
CRI,31 (2498)
CS & CC Low No evidence Low Low Possible Moderate
TLA,3 (439)
CS & CC Low No evidence Low High-1
Possible Low
Phage,12 (2935)
CS & CC Moderate/High-1
No evidence Moderate/High-1
Low Probable Very low
LPA,12 (4937)
CS & CC Low No evidence Low Low Possible Moderate
-1
-1
-1
-1
-1
-1
41
There are 60+ systematic reviews on TB tests, but almost all focus on sensitivity and specificity (accuracy)
42
15/03/2012
22
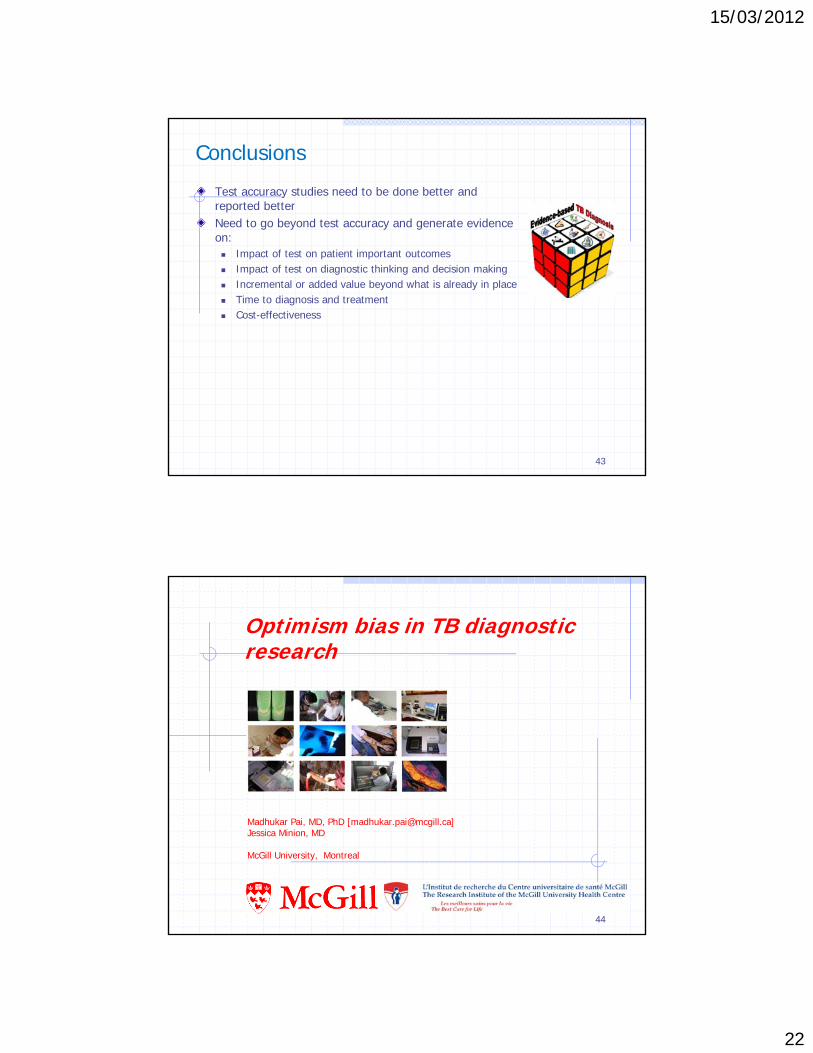
Test accuracy studies need to be done better and reported betterNeed to go beyond test accuracy and generate evidence on: Impact of test on patient important outcomes Impact of test on diagnostic thinking and decision making Incremental or added value beyond what is already in place Time to diagnosis and treatment Cost-effectiveness
43
Conclusions
Optimism bias in TB diagnostic research
Madhukar Pai, MD, PhD [[email protected]]Jessica Minion, MD
McGill University, Montreal
44

15/03/2012
23
45
46

15/03/2012
24
While almost all trials with “positive” results on antidepressants had been published, trials with “negative” results submitted to the US Food and Drug Administration, with few exceptions, remained either unpublished or were published with the results presented so that they would appear “positive”
Publication bias and selective publication
47
Non-replicated studies and publication bias –especially in genetic and biomarker studies
48

15/03/2012
25
49PLoS Med 2005
TB diagnostic studies can be optimistic because of
Case-control studiesInappropriate comparison groupsInsufficient validation in high TB/HIV burden settingsInappropriate data analytic methods and exclusionsIndustry-led studies that are not independently validatedOptimistic package inserts based on mostly in-house studiesControlled studies by test developers that are not replicable in the real worldBiomarkers that fail to get converted into good products

15/03/2012
26
Many TB dx studies are case-control
A large % of TB serology studies werecase-control studies
Confirmed TB casesVs.Healthy controls (oftenfrom low-incidence countries)
51
Steingart KR et al.
Spectrum bias (a form of selection bias)
Population used for evaluating the test: Extreme contrast
Case-control design
Normal contrast (Indicated population) Consecutively recruited patients in whom the disease is suspected
Extreme contrast (spectrum bias) can result in overestimation of test accuracy
52

15/03/2012
27
Rutjes et al. CMAJ 200653
Case-controldesign results inoptimistic accuracy
We find this in TB as well:Example: PCR tests for TB meningitis
Pai et al. Lancet Infect Dis 2003
Case-control studies had atwo-fold higher diagnostic odds ratios thancross-sectional studies
54

15/03/2012
28
It is not uncommon to see TB test evaluations where:
Cases come from a high-incidence country and controls from a low-incidence country
Tests work well in a low-incidence country and fall apart in a high-incidence country
Tests that work well in immunocompetent persons fail in populations with high HIV prevalence
55
Lack of discrimination in TB endemic settings: example
Hoff et al. Clinical Infectious Diseases 2007; 45:575–82
Mycobacterium tuberculosis–specific ESAT-6 and CFP-10 antibody responses
Ethiopia
Tanzanian cases
Danish controls
56

15/03/2012
29
High incidence countries
Low incidence countries
57
Variation in performance in high vs low endemic countries: example
MycoDot was hailed to be a breakthrough because it was a simple dipstick test
Commercialized and marketed by Mossman Associates (with support of PATH)
Package insert: sensitivity of 70% and specificity of 95%
58
HIV can prove to be the acid test for any test! Example of MycoDot

15/03/2012
30
But when the test was evaluated in countries with high HIV prevalence, the performance was disastrous
Sens in HIV+ = 26%
Sens in HIV+ = 25%
59Despite these results, the test is still available on the market!
Analysis of diagnostic studiesIt is not uncommon to see researchers: Excluding patients or controls with no definitive diagnoses Excluding indeterminate or inconclusive results Perform post-hoc “discrepant” analysis to move numbers within 2
x 2 tables
Such analyses often result in spuriously inflated accuracy estimates
60

15/03/2012
31
Example: exclusion of indeterminates can inflate accuracy estimates
If indeterminates are included: Sens = 66%
If indeterminates are excluded: Sens = 85%
61
62

15/03/2012
32
Industry involvement in drug trials and its impact on study outcomes and conclusions
BMJ 2002CMAJ 2004
BMJ 2003JAMA 2003
63
Industry involvement in diagnostic studies?
About 40% of TB, HIV, Malaria diagnostic studies had industry involvement orknown conflict of interest
Fontela P et al. PLoS One 2009 64
15/03/2012
33
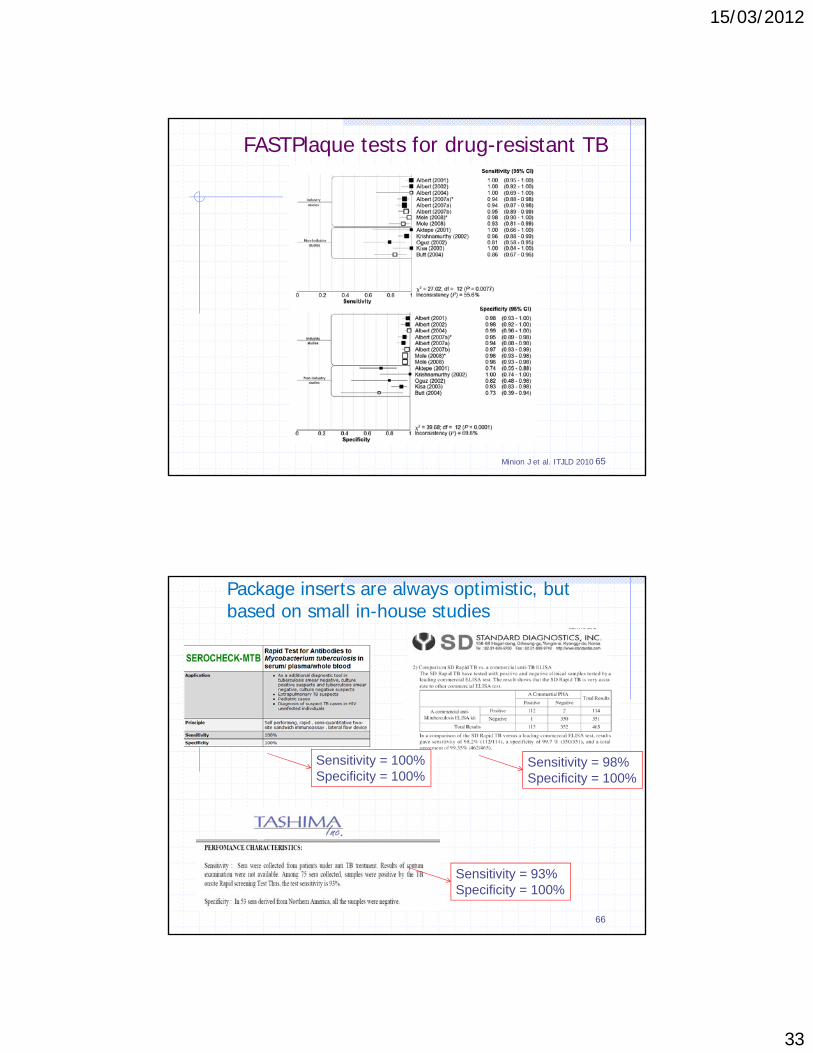
FASTPlaque tests for drug-resistant TB
Minion J et al. ITJLD 2010 65
66
Package inserts are always optimistic, but based on small in-house studies
Sensitivity = 98%Specificity = 100%
Sensitivity = 93%Specificity = 100%
Sensitivity = 100%Specificity = 100%

15/03/2012
34
More examples...
Test Package insert sens
Package insert spec
Meta-analysis sens
Meta-analysis spec
QFT-Gold 89% 79%
FASTPlaque-Response
96 – 100% 99 – 100% 95% 95%
Anda-TB IgG 85 - 90% 85 - 100 % 60 - 75% ~90%
MycoDot 70% 95% 26% - 76% 84% - 97%
Clearview TB ELISA
81% (HIV+) 93 – 98% 56% (HIV+) 95%
GenoTypeMDTBDrplus
99% 99% 98% 99%
Gen-Probe MTD
97% (S+)72 (S-)
100% (S+)99% (S-)
97% (S+)76% (S-)
96% (S+)95% (S-)
67
MODS: developed in Peru – performs excellent
Implemented in India – performs poorly
Sensitivity 80%
Issues with contamination
Issues with reliability
Sensitivity better than LJ (98 vs. 84%)
Fast turnaround time (1 week vs. 6 weeks+)
68

15/03/2012
35
FASTPlaque phage assay – performed well when done by industry
Implemented in Kenya –performs poorly
Despite upgrading the lab:
Low accuracy (31% sens; 95% spec)
Issues with contamination (nearly have were not interpretable) 69
100% sens100% spec
Initial positive results that do not work out: MPB64 skin patch test (Sequella Inc.)
Pai M et al. Exp Rev Mol Diagn 2006;6(3):423-432; Image courtesy Sequella Inc.
Early data in 1998:
Sensitivity: 98%Specificity: 100%
In 2012, still not commercially available
70