diagnostics.wadcfg web/app.config wad-control-container isdefault=true deploy cspkg
TRANSCRIPT


Boris SchollSr. Lead Program Manager – Cloud Platform Tools
Diagnosing issues with Cloud applications hosted in Azure using Visual Studio
3-581
Windows Azure Cloud Service Windows Azure Virtual machinesWindows Azure Web SitesDemos, Demos, Demos
Agenda

Azure Diagnostics Remote Debugging IntelliTrace / Profiler Troubleshooting Demo
Cloud Services
What are we going to cover?

Implement application logging and tracing Good entry level tracing and logging Uses System.Diagnostics and Azure diagnostics
trace listener Windows Event logs on guest OS IIS logs
IIS logs Failed request logs
Performance Counters Crash dumps Custom logs Azure Infrastructure logs
Azure DiagnosticsWhat should I use it for?

WAD Architecture – Configuration
Diagnostics.wadcfg
Diagnostics Agent
Diagnostics.wadcfg
Diagnostics Agent
wad-control-container
Web/app.config
Web/app.config
IN_0
Wad-control-container
IsDefault=True
Visual Studio
Deploy CSPKG

WAD Architecture – Config Precedence
wad-control-container Blob
Highest precedence Default polling interval is once per minute.
Imperative code
• RoleInstanceDiagnosticManager.SetCurrentConfiguration()
• DiagnosticMonitor.Start()
Diagnostics.wadcfg file
Web Role Bin Directory under rootWorker Role Root Directory
Default configuration

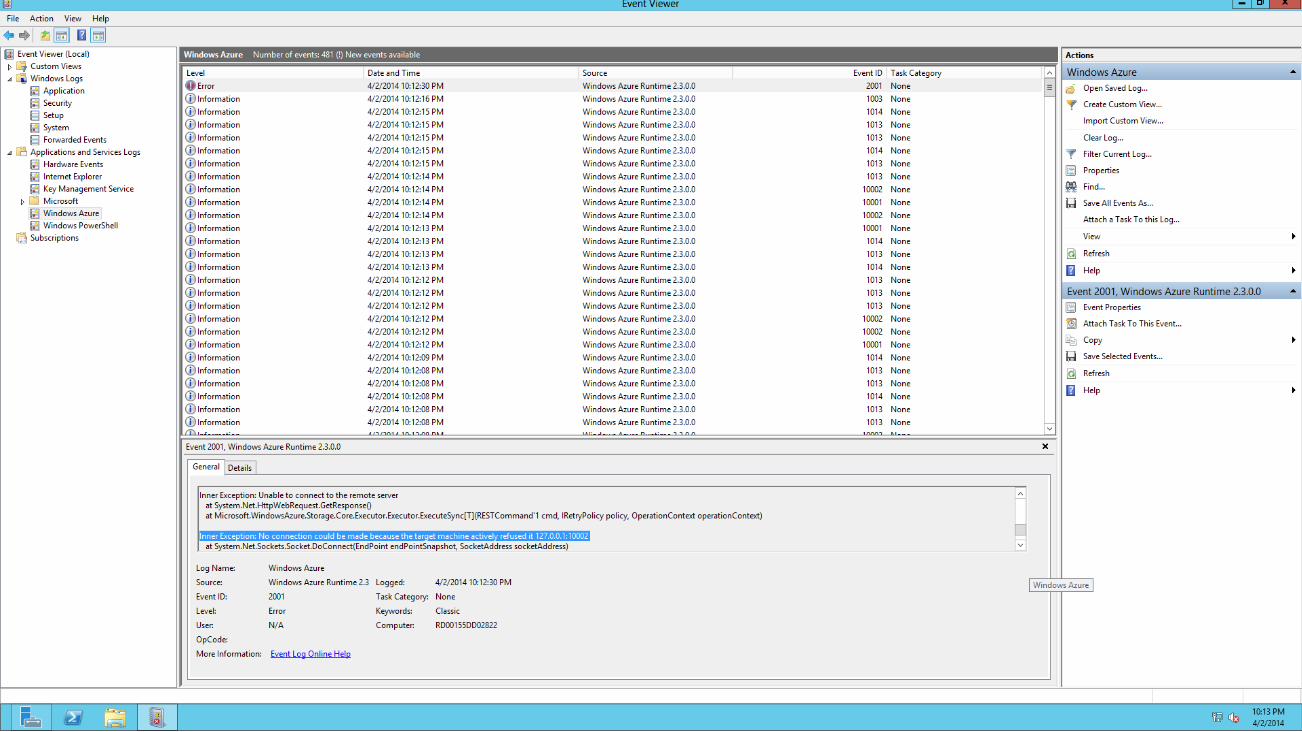
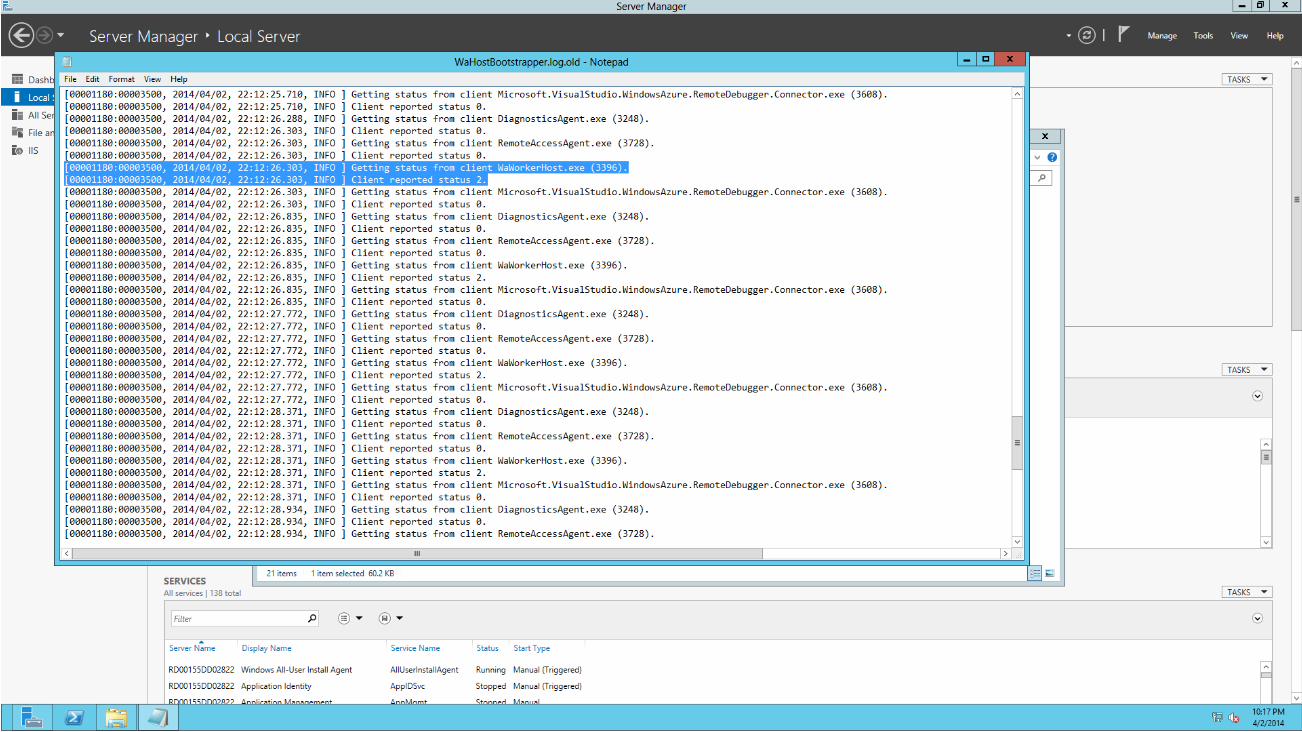
Troubleshooting a Cloud Service using Visual Studio
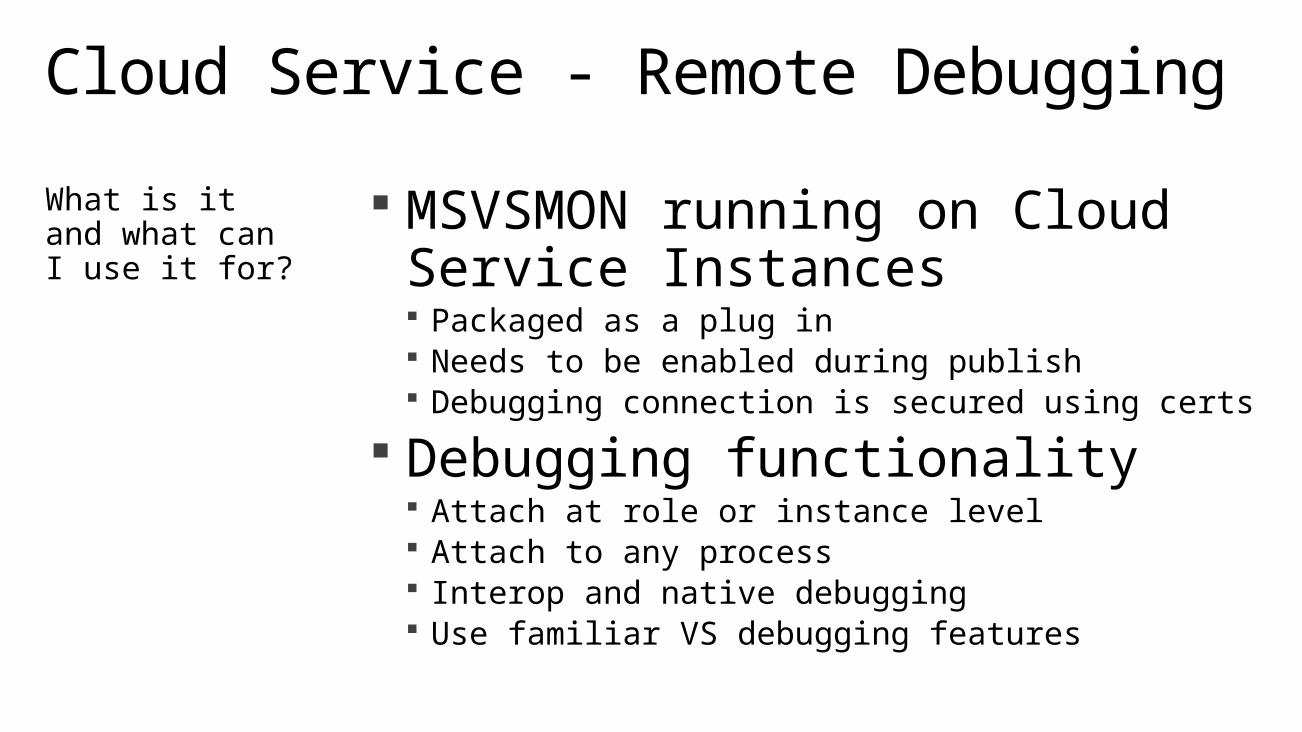
MSVSMON running on Cloud Service Instances Packaged as a plug in Needs to be enabled during publish Debugging connection is secured using certs
Debugging functionality Attach at role or instance level Attach to any process Interop and native debugging Use familiar VS debugging features
Cloud Service - Remote Debugging
What is it and what can I use it for?
Debugging a Cloud Service

Enablement Both options are enabled during publish Agents are mutually exclusive
IntelliTrace (VS Ultimate) Rewind/replay program execution in the debugger Captures WaIIShost.exe and w3wp.exe events Great for chasing down logical errors Great for detecting missing assemblies*
Profiler (VS Pro) Analyze performance issues and bottlenecks Detect inefficient algorithms
Cloud Service - IntelliTrace/Profiler
What can I use it for?

Logging and Tracing Remote Debugging Application Insights Profiling Troubleshooting Demo
Virtual machines
What are we going to cover?

ETW based semantic logging
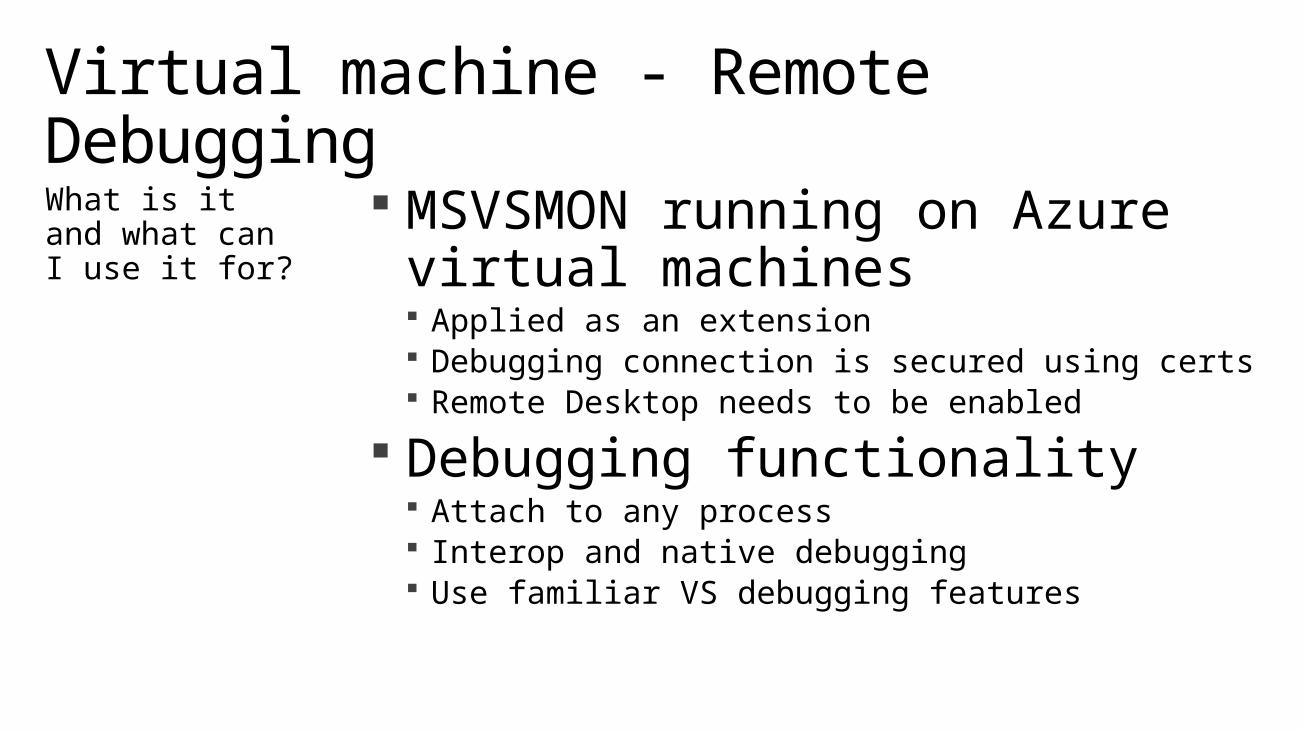
MSVSMON running on Azure virtual machines Applied as an extension Debugging connection is secured using certs Remote Desktop needs to be enabled
Debugging functionality Attach to any process Interop and native debugging Use familiar VS debugging features
Virtual machine - Remote Debugging
What is it and what can I use it for?

Remote Debugging a virtual machine

Check availability of an application Health Dashboards
Is the application and available and performing for users? Check application performance
Notifications and deep insight Shows performance problems, memory usage and
exceptions Check if the application is succeeding
Usage dashboard Shows usage patterns and top features
Applications Insights
What can I use it for?
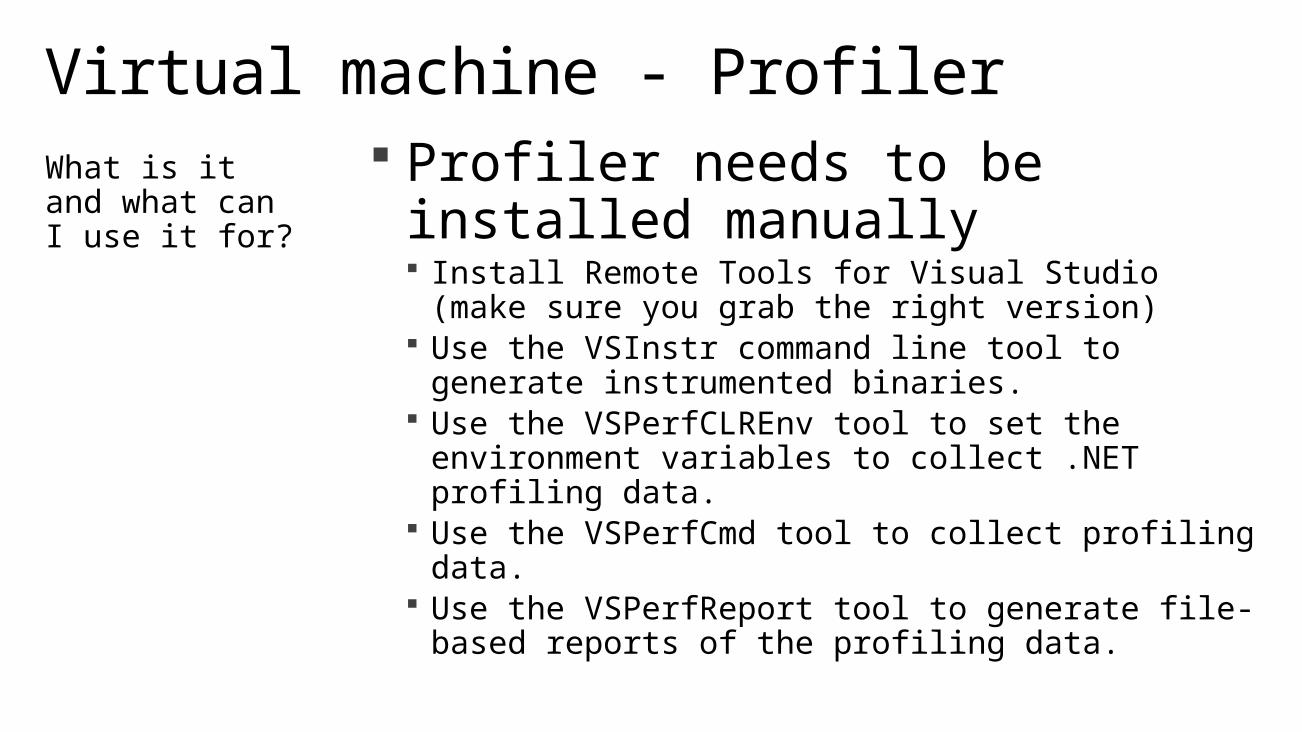
Profiler needs to be installed manually Install Remote Tools for Visual Studio (make sure
you grab the right version) Use the VSInstr command line tool to generate
instrumented binaries. Use the VSPerfCLREnv tool to set the environment
variables to collect .NET profiling data. Use the VSPerfCmd tool to collect profiling data. Use the VSPerfReport tool to generate file-based
reports of the profiling data.
Virtual machine - ProfilerWhat is it and what can I use it for?

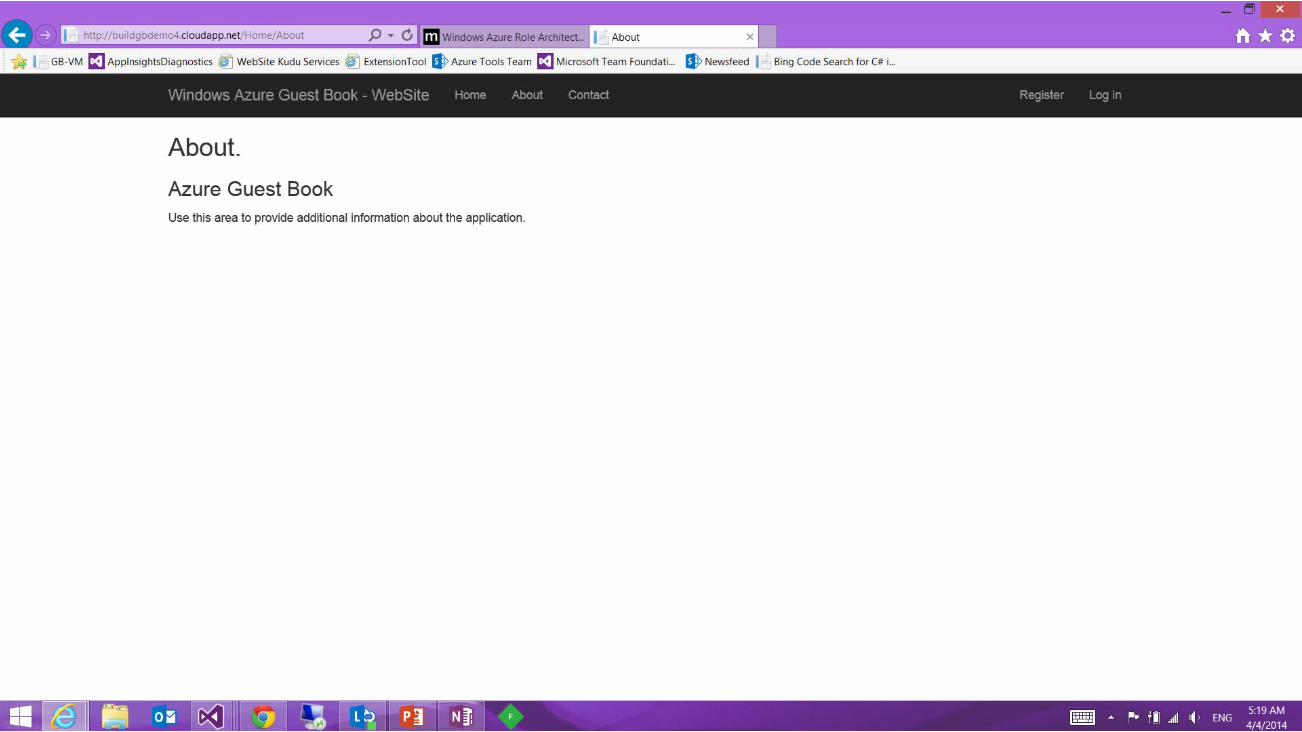
Web Site Diagnostics Remote Debugging Troubleshooting Demo
Web Sites
What are we going to cover?
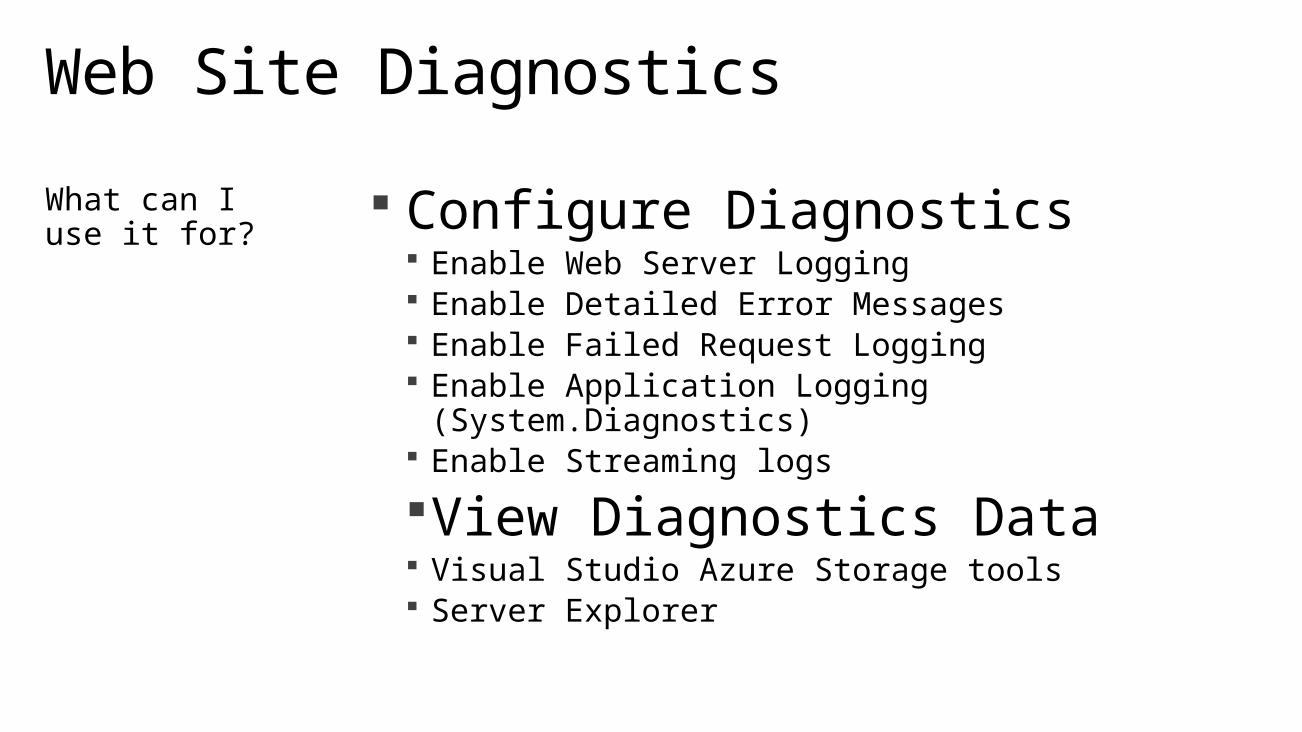
Configure Diagnostics Enable Web Server Logging Enable Detailed Error Messages Enable Failed Request Logging Enable Application Logging (System.Diagnostics) Enable Streaming logs
View Diagnostics Data Visual Studio Azure Storage tools Server Explorer
Web Site Diagnostics
What can I use it for?
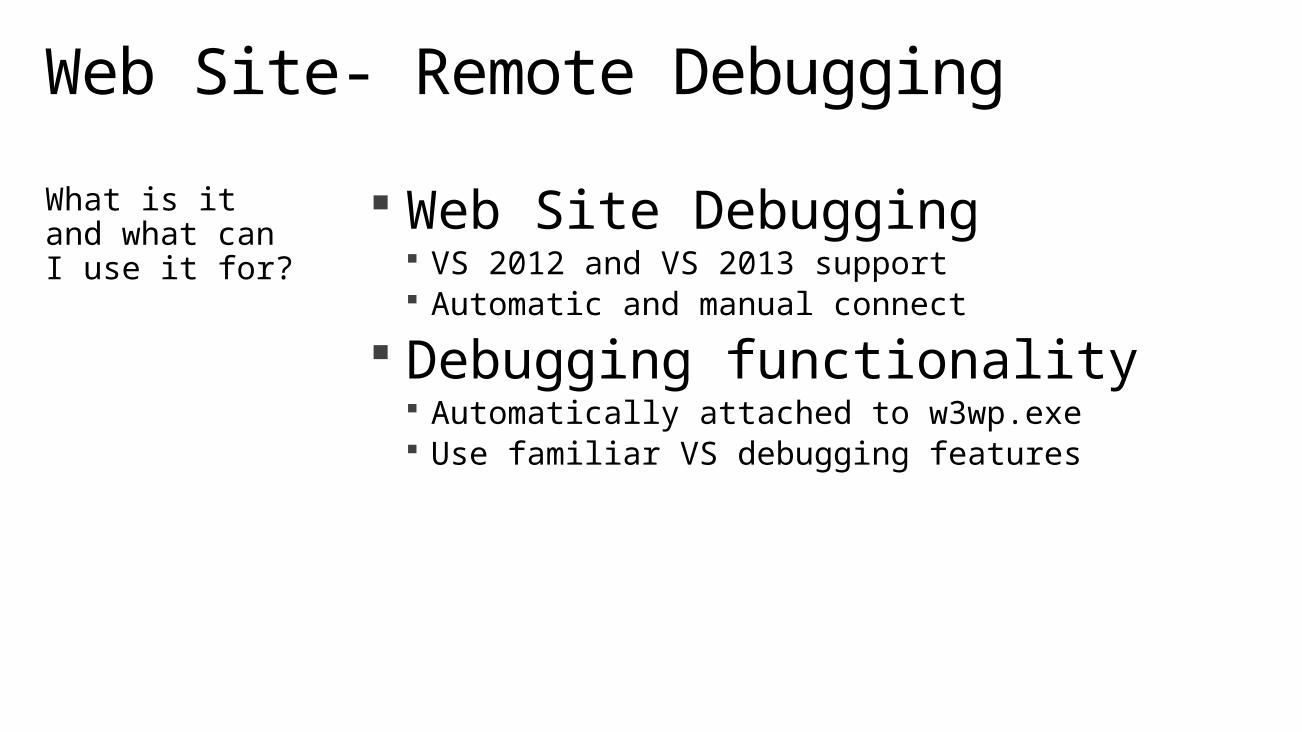
Web Site Debugging VS 2012 and VS 2013 support Automatic and manual connect
Debugging functionality Automatically attached to w3wp.exe Use familiar VS debugging features
Web Site- Remote Debugging
What is it and what can I use it for?

Visual Studio provides a great set of diagnostics tools
Diagnostics is a key investment area
Application Insights is a powerful service
Investments are made across compute containers
Summary
Takeaways

for Ultimate with MSDN subscribers
Go to http://msdn.Microsoft.com/specialoffers
SPECIAL OFFERSPartner Program
Your Feedback is Important
Fill out an evaluation of this session and help shape future events.
Scan the QR code to evaluate this session on your mobile device.
You’ll also be entered into a daily prize drawing!

© 2014 Microsoft Corporation. All rights reserved. Microsoft, Windows, Windows Vista and other product names are or may be registered trademarks and/or trademarks in the U.S. and/or other countries.The information herein is for informational purposes only and represents the current view of Microsoft Corporation as of the date of this presentation. Because Microsoft must respond to changing market conditions, it should not be interpreted to be a commitment on the part of Microsoft, and Microsoft cannot guarantee the accuracy of any information provided after the date of this presentation. MICROSOFT MAKES NO WARRANTIES, EXPRESS, IMPLIED OR STATUTORY, AS TO THE INFORMATION IN THIS PRESENTATION.