diagrams for understanding chemical processesfigure 1.3: skeleton process flow diagram (pfd) for the...
TRANSCRIPT

Diagrams for Understanding Chemical processes
CHAPTER 1
The most effective way of communicating information about a process is through the use of flow diagrams.
This chapter include:Different type of chemical process diagrams.How these diagrams represent different scales of process views.One consistent method for drawing process flow diagrams.The information to be included in a process flow diagram.The purpose of operator training simulators and recent advances in 3-D representation of different chemical process .
Types of flow diagrams:
1. Block flow diagrams (BFD).
2. Process flow diagrams ( PFD).
3. Piping and instrumentation diagrams (P&ID).
1.1: BLOCK FLOW DIAGRAM (BFD)This diagram consisted of a series of blocks representing different equipment or unit operations that were connected by input and output streams.
Important information such as operating temperatures, pressures, conversions, and yield was included on the diagram along with flowrates and some chemical compositions.
The diagram do not include any details of equipment within any of the blocks.
1.1: BLOCK FLOW DIAGRAM (BFD)
The block flow diagram can take one of two forms:I. Block flow process diagram: drawn for a single process .II. Block flow plant diagram: drawn for a complete
chemical complex involving many different chemical process.
Both types of block flow diagrams are useful for explaining the overall operation of chemical plants.
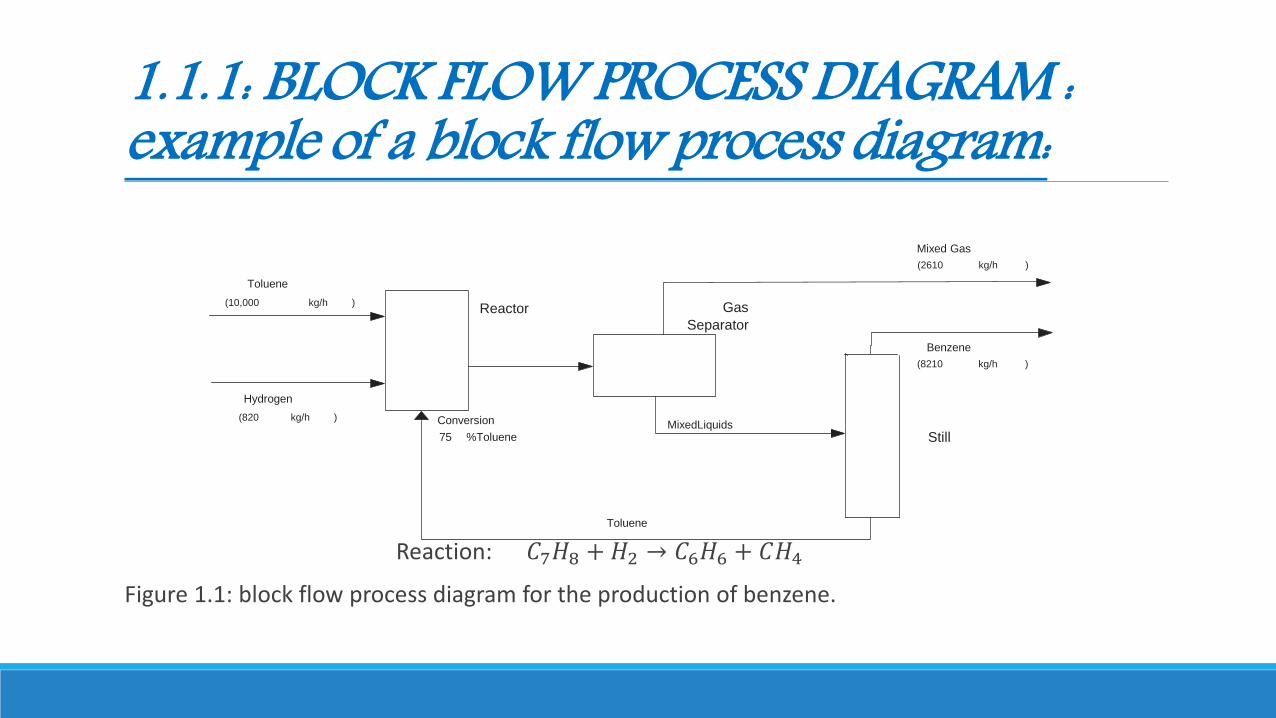
1.1.1: BLOCK FLOW PROCESS DIAGRAM :example of a block flow process diagram:
Reaction: 𝐶7𝐻8 + 𝐻2 → 𝐶6𝐻6 + 𝐶𝐻4
Figure 1.1: block flow process diagram for the production of benzene.
Reactor Gas
Separator
Still
Toluene
Hydrogen
Benzene
(8210 kg/h )
Toluene
Mixed Gas
(2610 kg/h )
MixedLiquidsConversion
75 %Toluene
(10,000 kg/h )
kg/h )(820
1.1.1: BLOCK FLOW PROCESS DIAGRAM :
This block flow diagram gives a clear overview of the production of benzene, unobstructed by the many details related to the process.Each block in the diagram represents a process function and may, in reality, consist of several pieces of equipment.Although much information is missing from Figure 1.1, it is clear that such a diagram is very useful for “ getting a feel “ for the process.
1.1.1: BLOCK FLOW PROCESS DIAGRAM :
Block flow process diagrams often form the starting point for developing a PDF .It shows the main features without getting bogged down in the details.
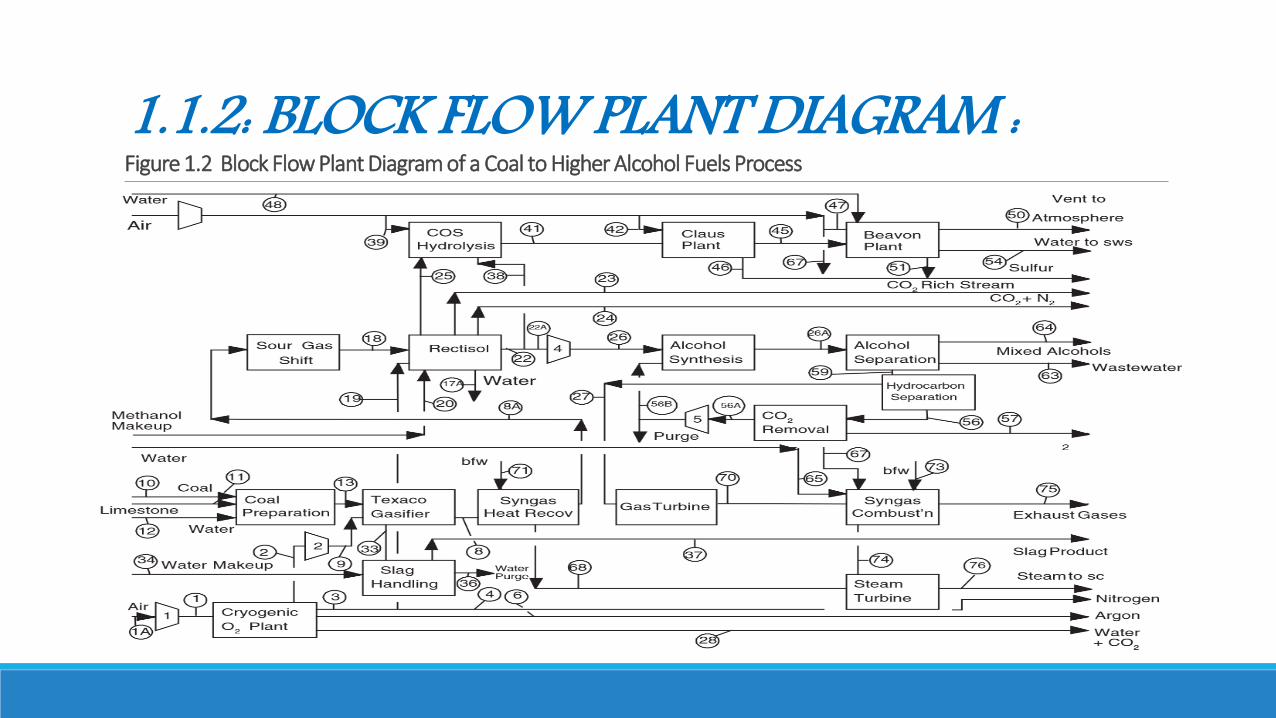
1.1.2: BLOCK FLOW PLANT DIAGRAM :Figure 1.2 Block Flow Plant Diagram of a Coal to Higher Alcohol Fuels Process
1.1.2: BLOCK FLOW PLANT DIAGRAM :
This block flow plant diagram is for a coal to higher alcohol fuels plant. Clearly, this is a complicated process in which there are a number of alcohol fuel products produced from a feedstock of coal. Each block in this diagram represents a complete chemical process (compressors and turbines are also shown as trapezoids), and a block flow process diagram could be drawn for each block in Figure 1.2.
1.1.2: BLOCK FLOW PLANT DIAGRAM :
The advantage of a diagram such as Figure 1.2 is that it allows a complete picture of what this plant does and how all the different processes interact to be obtained. On the other hand, in order to keep the diagram relatively uncluttered, only limited information is available about each process unit. The conventions for drawing block flow plant diagrams are similar to Table 1.1.
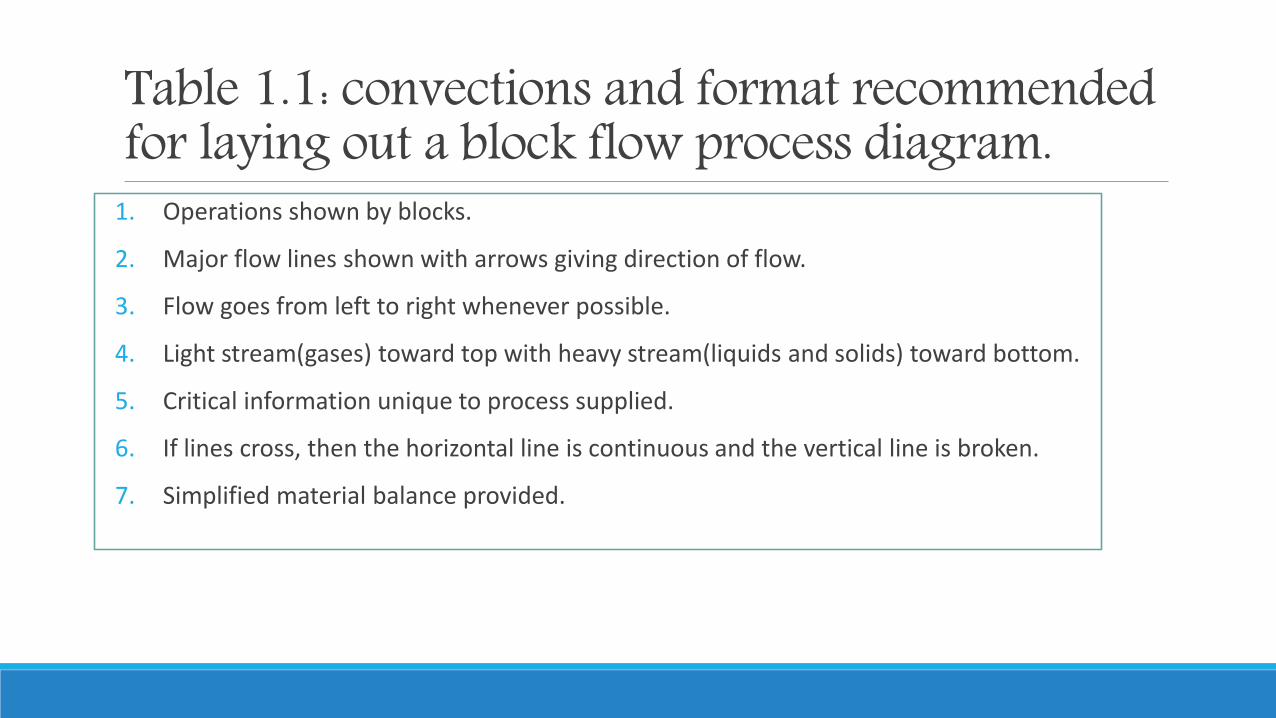
Table 1.1: convections and format recommended for laying out a block flow process diagram.
1. Operations shown by blocks.
2. Major flow lines shown with arrows giving direction of flow.
3. Flow goes from left to right whenever possible.
4. Light stream(gases) toward top with heavy stream(liquids and solids) toward bottom.
5. Critical information unique to process supplied.
6. If lines cross, then the horizontal line is continuous and the vertical line is broken.
7. Simplified material balance provided.
1.2 :PROCESS FLOW DIAGRAM (PFD)
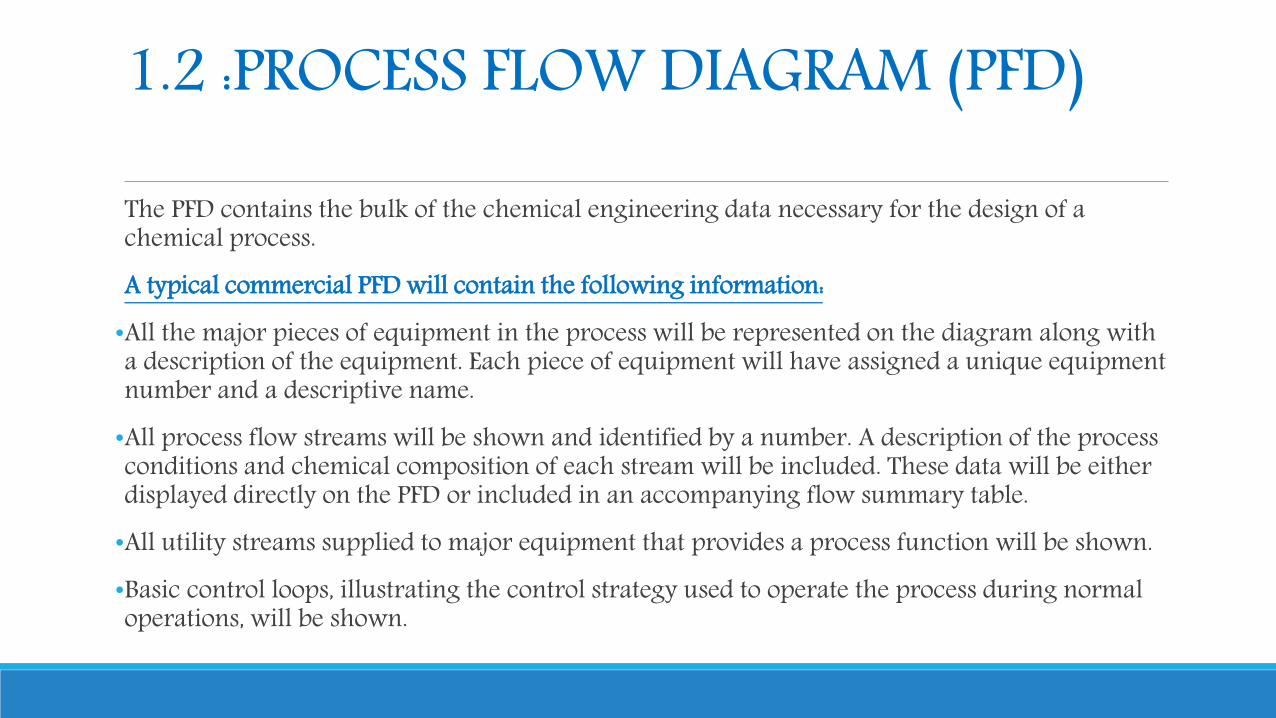
The PFD contains the bulk of the chemical engineering data necessary for the design of a chemical process.A typical commercial PFD will contain the following information:•All the major pieces of equipment in the process will be represented on the diagram along with a description of the equipment. Each piece of equipment will have assigned a unique equipment number and a descriptive name.•All process flow streams will be shown and identified by a number. A description of the process conditions and chemical composition of each stream will be included. These data will be either displayed directly on the PFD or included in an accompanying flow summary table.•All utility streams supplied to major equipment that provides a process function will be shown.•Basic control loops, illustrating the control strategy used to operate the process during normal operations, will be shown.
1.2 :PROCESS FLOW DIAGRAM (PFD)
The basic information provided by a PFD can be categorized into one of the following:1. Process topology2. Stream information3. Equipment information
1.2.1: Process TopologyProcess topology : the location of and interaction between equipment and process streams.
Equipment is represented symbolically by “icons” that identify specific unit operations.
1.2.1: Process TopologyFigure 1.3 shows that each major piece of process equipment is identified by a number on the diagram.
A list of the equipment numbers along with a brief descriptive name for the equipment is printed along the top of the diagram.
1.2.1: Process Topology
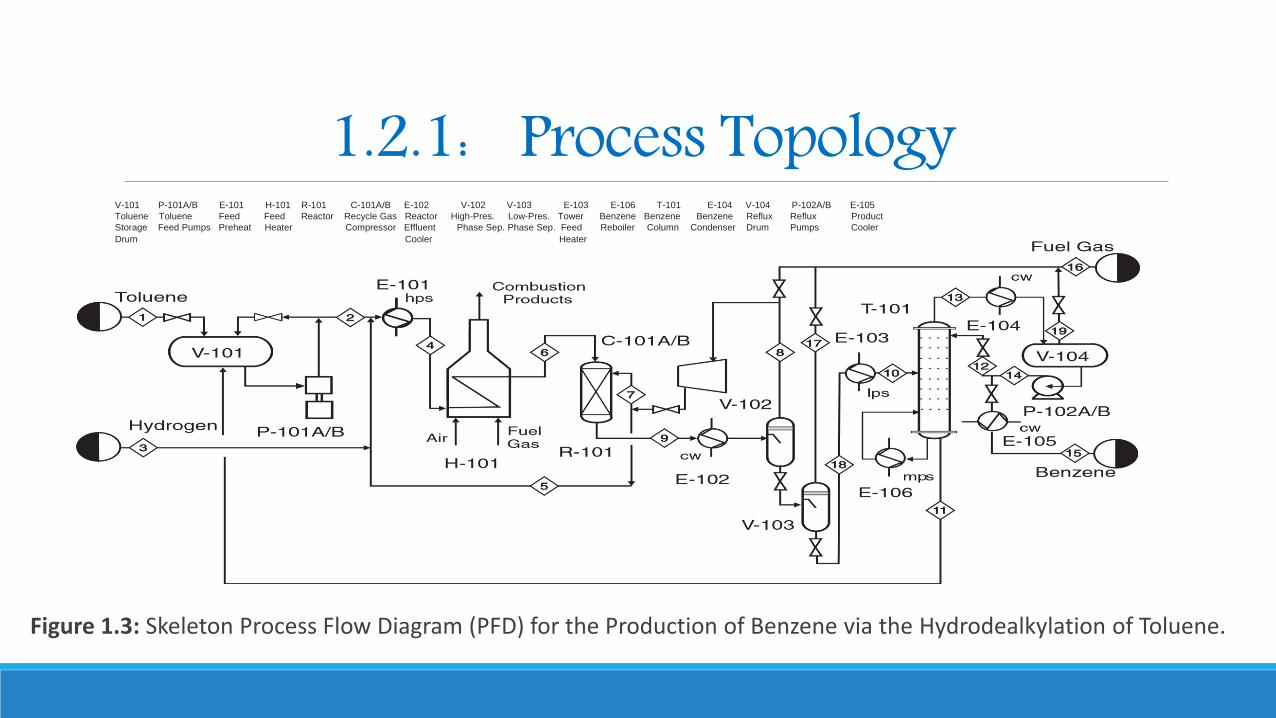
Figure 1.3: Skeleton Process Flow Diagram (PFD) for the Production of Benzene via the Hydrodealkylation of Toluene.
V-101 P-101A/B E-101 H-101 R-101 C-101A/B E-102 V-102 V-103 E-103 E-106 T-101 E-104 V-104 P-102A/B E-105
Toluene Toluene Feed Feed Reactor Recycle Gas Reactor High-Pres. Low-Pres. Tower Benzene Benzene Benzene Reflux Reflux Product
Storage Feed Pumps Preheat Heater Compressor Effluent Phase Sep. Phase Sep. Feed Reboiler Column Condenser Drum Pumps Cooler
Drum Cooler Heater
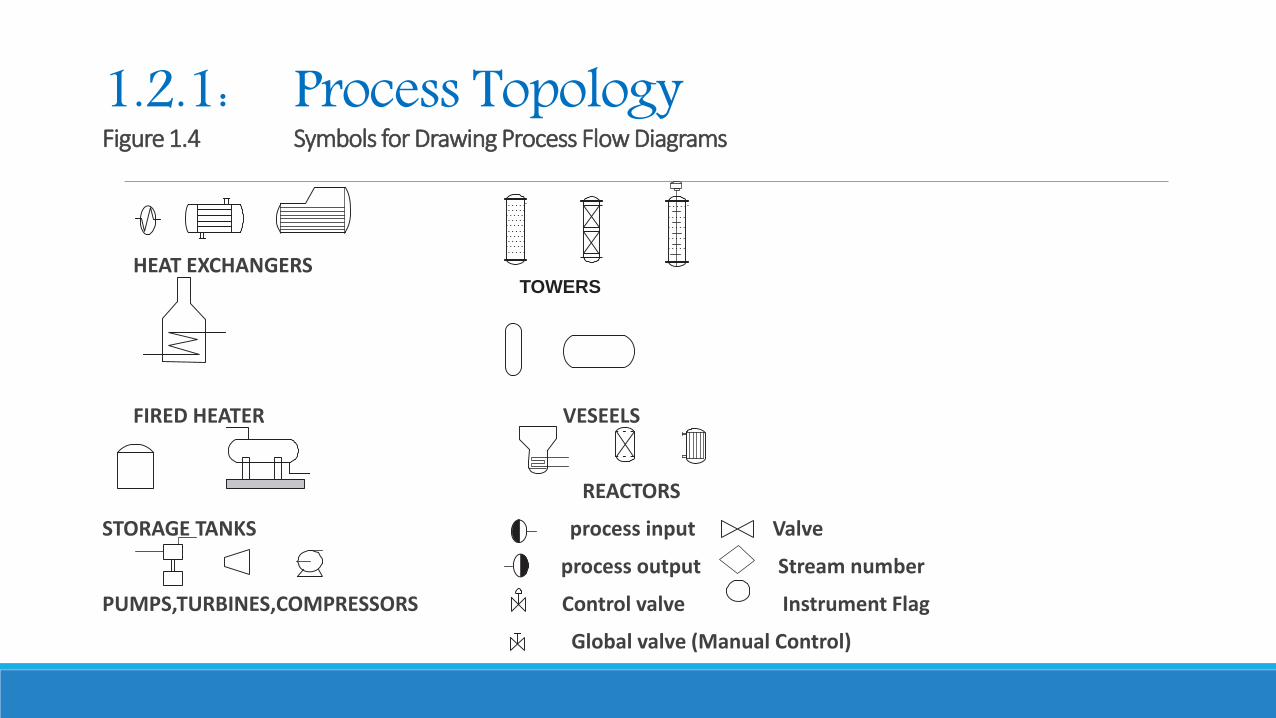
1.2.1: Process TopologyFigure 1.4 Symbols for Drawing Process Flow Diagrams
HEAT EXCHANGERS
FIRED HEATER VESEELS
REACTORS
STORAGE TANKS process input Valve
process output Stream number
PUMPS,TURBINES,COMPRESSORS Control valve Instrument Flag
Global valve (Manual Control)
TOWERS
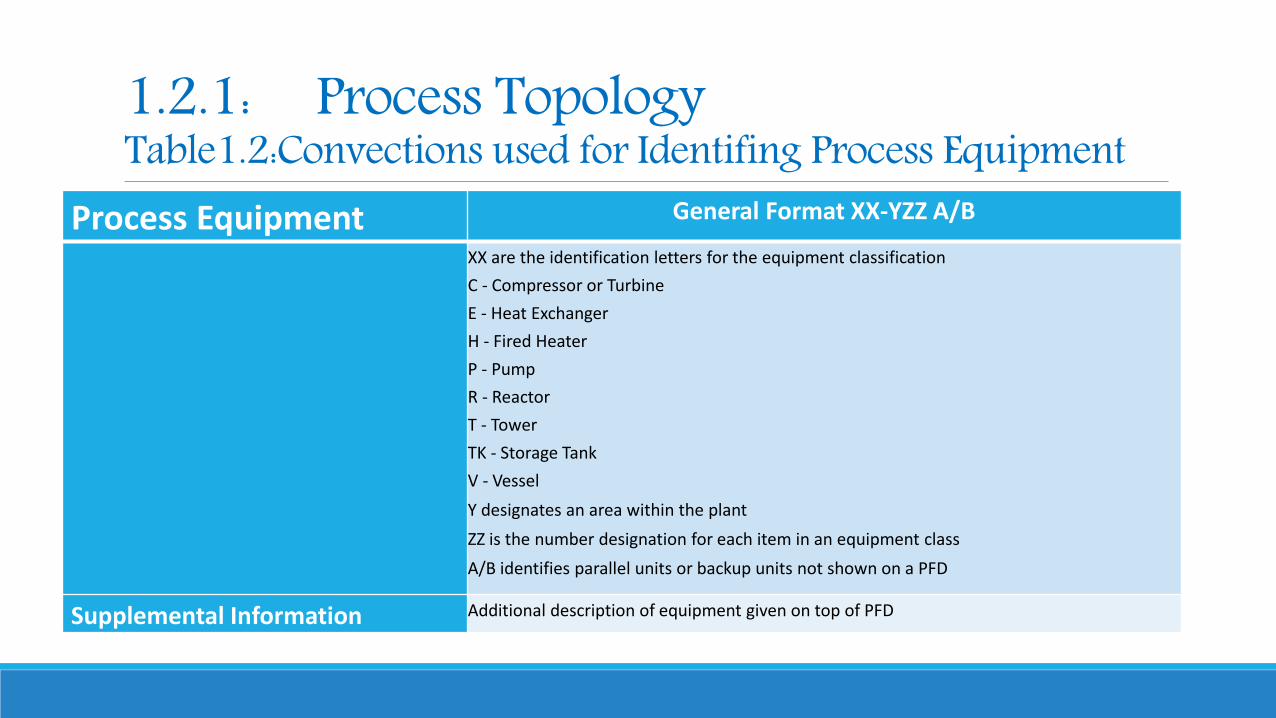
1.2.1: Process TopologyTable1.2:Convections used for Identifing Process Equipment
Process Equipment General Format XX-YZZ A/B
XX are the identification letters for the equipment classification
C - Compressor or Turbine
E - Heat Exchanger
H - Fired Heater
P - Pump
R - Reactor
T - Tower
TK - Storage Tank
V - Vessel
Y designates an area within the plant
ZZ is the number designation for each item in an equipment class
A/B identifies parallel units or backup units not shown on a PFD
Supplemental Information Additional description of equipment given on top of PFD
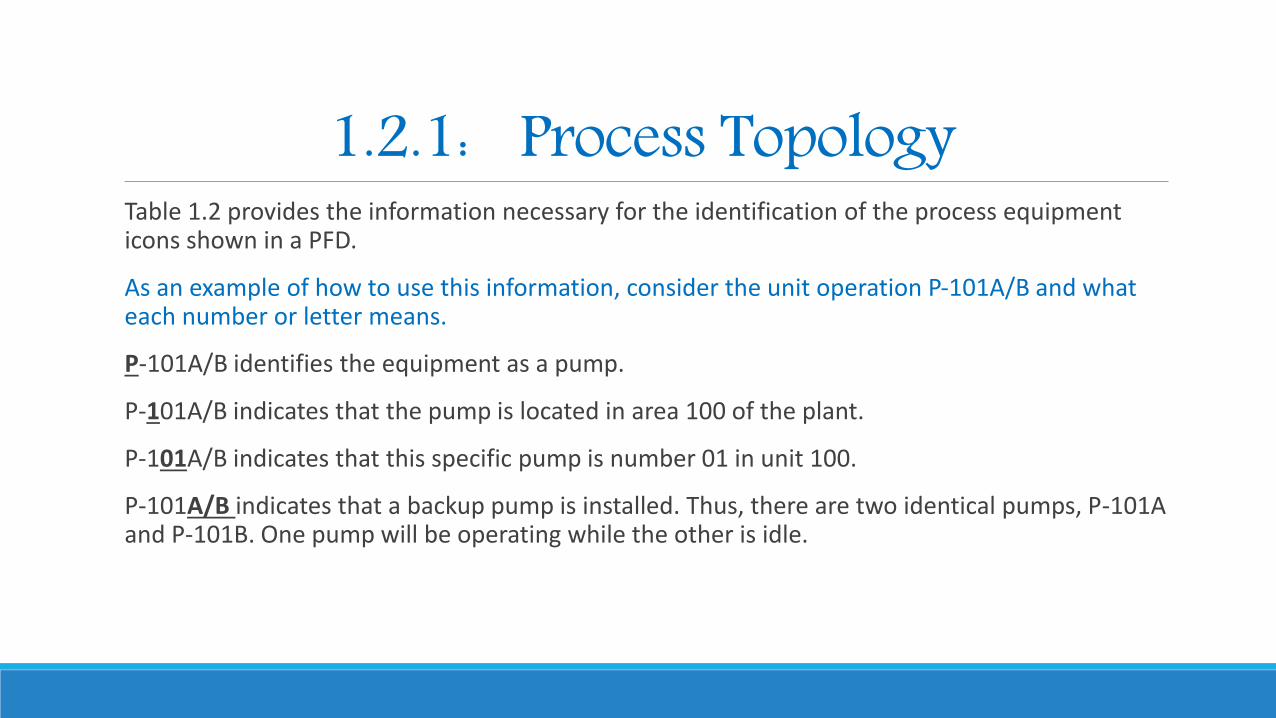
1.2.1: Process TopologyTable 1.2 provides the information necessary for the identification of the process equipment icons shown in a PFD.
As an example of how to use this information, consider the unit operation P-101A/B and what each number or letter means.
P-101A/B identifies the equipment as a pump.
P-101A/B indicates that the pump is located in area 100 of the plant.
P-101A/B indicates that this specific pump is number 01 in unit 100.
P-101A/B indicates that a backup pump is installed. Thus, there are two identical pumps, P-101A and P-101B. One pump will be operating while the other is idle.
1.2.1: Process TopologyWhen a piece of equipment wears out and is replaced by a new unit that provides essentially the same process function as the old unit, then it is not uncommon for the new piece of equipment to inherit the old equipment’s name and number (often an additional letter suffix will be used, e.g., H-101 might become H-101A).
On the other hand, if a significant process modification takes place, then it is usual to use new equipment numbers and names.
1.2.2 : Stream Information.Each of the process streams is identified by a number in a diamond box located on the stream. The direction of the stream is identified by one or more arrowheads. The process stream numbers are used to identify streams on PFD.
1.2.2 : Stream Information.Utilities are needed services that are available at the plant.
Chemical plants are provided with a range of central utilities that include electricity, compressed air, cooling water, refrigerated water, steam, condensate return, inert gas for blanketing, chemical sewer, wastewater treatment, and flares.
A list of the common services is given in table 1.3, which also provides a guide for the identification of process streams.
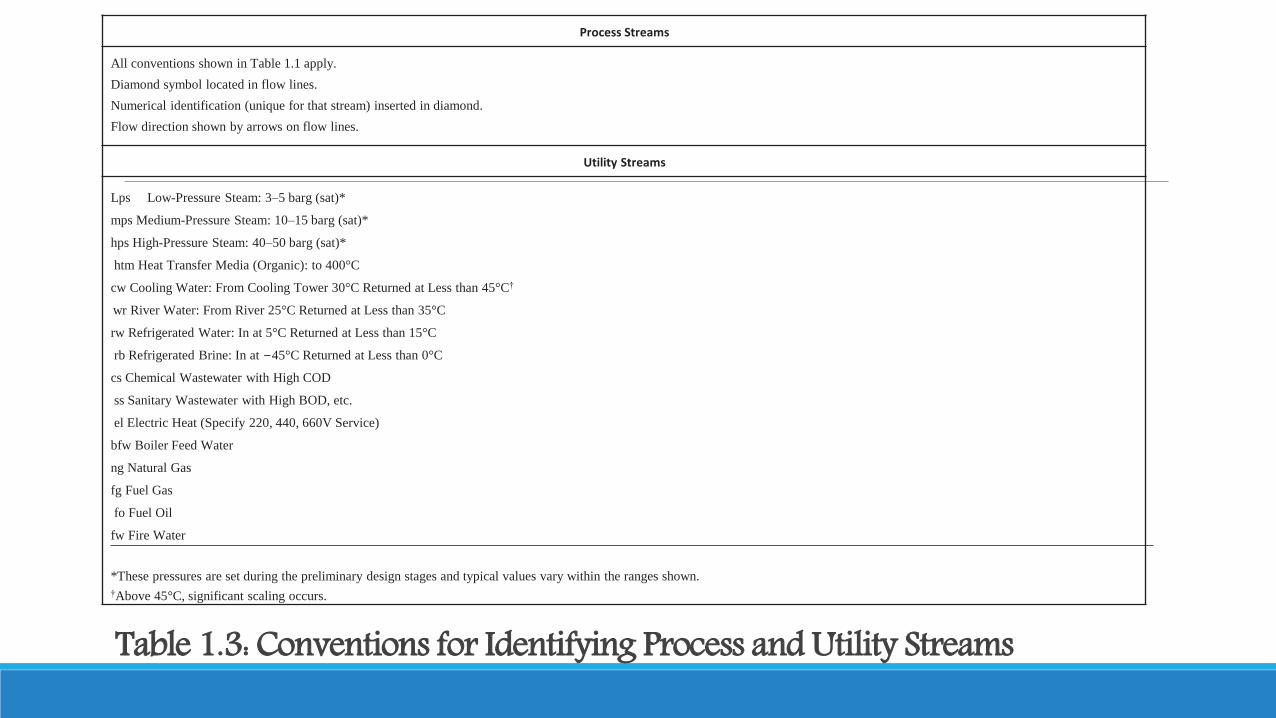
Table 1.3: Conventions for Identifying Process and Utility Streams
Process Streams
All conventions shown in Table 1.1 apply.
Diamond symbol located in flow lines.
Numerical identification (unique for that stream) inserted in diamond.
Flow direction shown by arrows on flow lines.
Utility Streams
Lps Low-Pressure Steam: 3–5 barg (sat)*
mps Medium-Pressure Steam: 10–15 barg (sat)*
hps High-Pressure Steam: 40–50 barg (sat)*
htm Heat Transfer Media (Organic): to 400°C
cw Cooling Water: From Cooling Tower 30°C Returned at Less than 45°C†
wr River Water: From River 25°C Returned at Less than 35°C
rw Refrigerated Water: In at 5°C Returned at Less than 15°C
rb Refrigerated Brine: In at −45°C Returned at Less than 0°C
cs Chemical Wastewater with High COD
ss Sanitary Wastewater with High BOD, etc.
el Electric Heat (Specify 220, 440, 660V Service)
bfw Boiler Feed Water
ng Natural Gas
fg Fuel Gas
fo Fuel Oil
fw Fire Water
*These pressures are set during the preliminary design stages and typical values vary within the ranges shown.
†Above 45°C, significant scaling occurs.
1.2.2 : Stream Information.Most of the utilities shown are related to equipment that adds or removes heat within the process in order to control temperatures. This is common for most chemical processes.For small diagrams containing only a few operations, the
characteristics of the streams such as temperatures, pressures, compositions, and flowrates can be shown directly on PFD.For complex diagrams only the stream number is provided on the
diagram.
1.2.2 : Stream Information.The stream information that is normally given in a flow summary table is given in Table 1.4. It is divided into two groups—required information and optional information— that may be important to specific processes. The flow summary table, for Figure 1.3, is given in Table 1.5 and contains all the required information listed in Table 1.4.
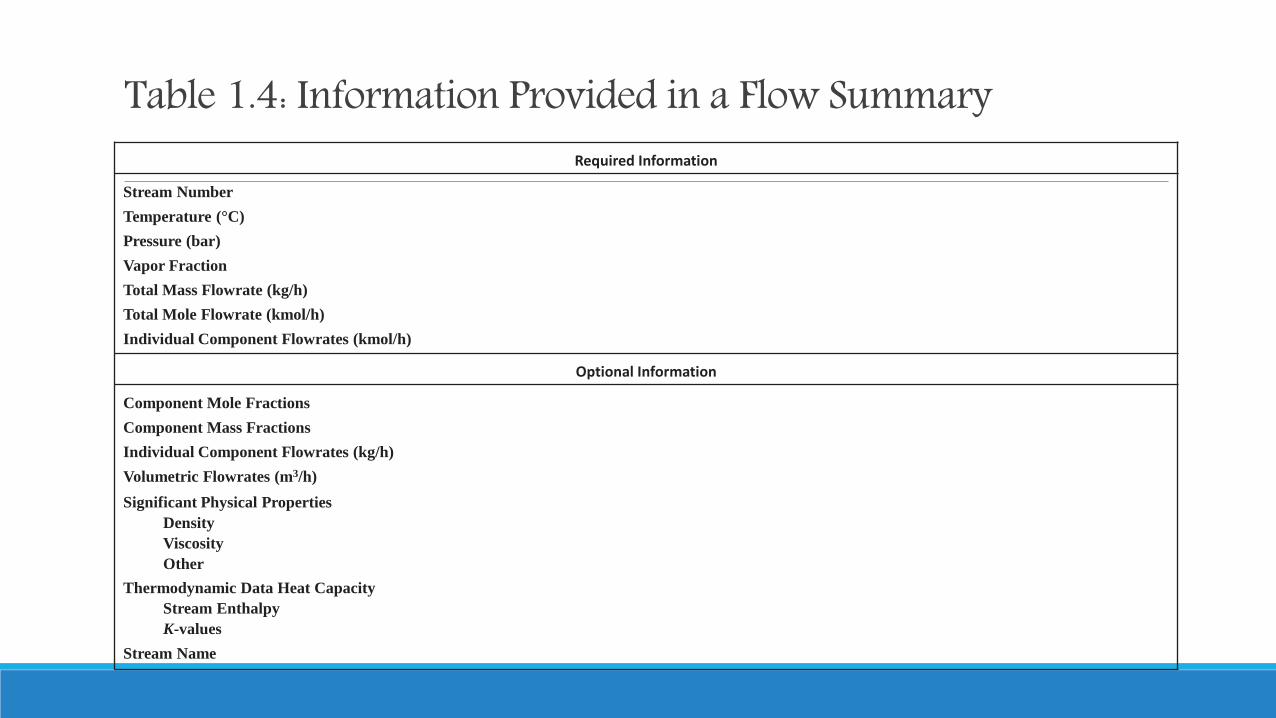
Table 1.4: Information Provided in a Flow SummaryRequired Information
Stream Number
Temperature (°C)
Pressure (bar)
Vapor Fraction
Total Mass Flowrate (kg/h)
Total Mole Flowrate (kmol/h)
Individual Component Flowrates (kmol/h)
Optional Information
Component Mole Fractions
Component Mass Fractions
Individual Component Flowrates (kg/h)
Volumetric Flowrates (m3/h)
Significant Physical Properties
Density
Viscosity
Other
Thermodynamic Data Heat Capacity
Stream Enthalpy
K-values
Stream Name
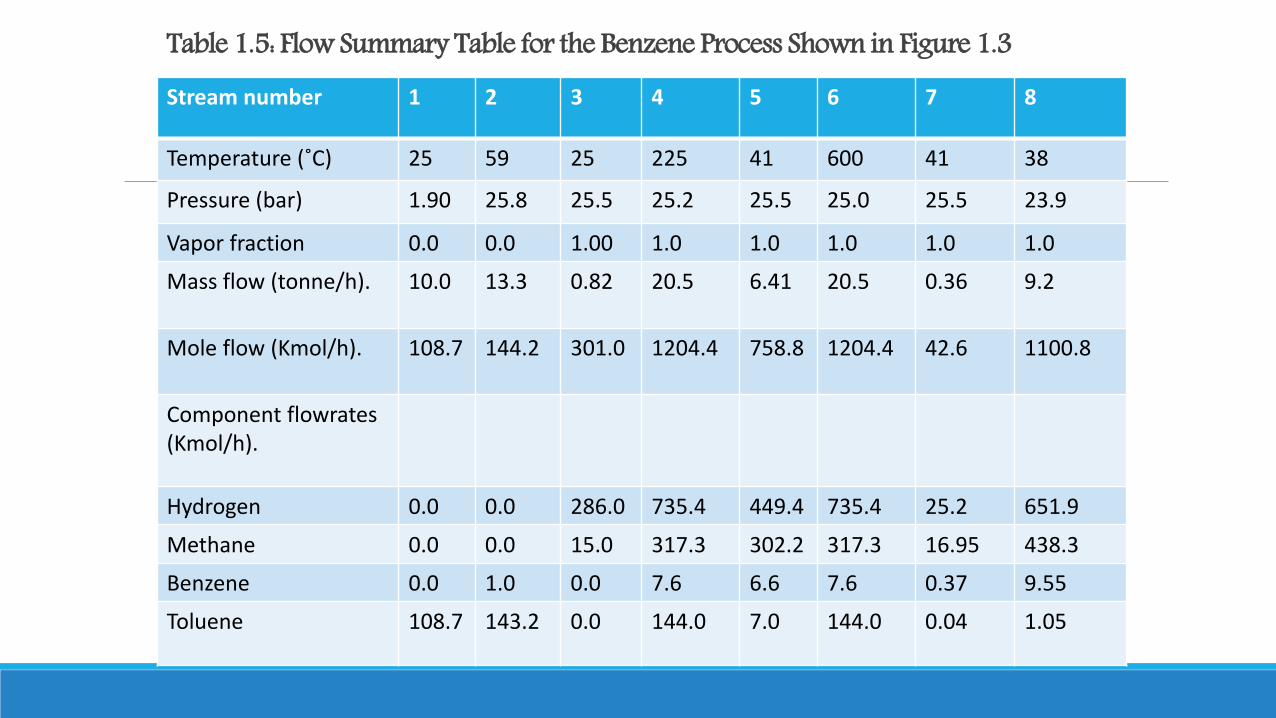
Table 1.5: Flow Summary Table for the Benzene Process Shown in Figure 1.387654321Stream number
384160041225255925Temperature (˚C)
23.925.525.025.525.225.525.81.90Pressure (bar)
1.01.01.01.01.01.000.00.0Vapor fraction
9.20.3620.56.4120.50.8213.310.0Mass flow (tonne/h).
1100.842.61204.4758.81204.4301.0144.2108.7Mole flow (Kmol/h).
Component flowrates(Kmol/h).
651.925.2735.4449.4735.4286.00.00.0Hydrogen
438.316.95317.3302.2317.315.00.00.0Methane
9.550.377.66.67.60.01.00.0Benzene
1.050.04144.07.0144.00.0143.2108.7Toluene

Table 1.5: Flow Summary Table for the Benzene Process Shown in Figure 1.3
191817161514131211109
1123838383811211211214790654
2.52.92.82.52.33.32.53.32.82.624.0
1.00.01.01.00.00.01.00.00.00.01.0
0.0111.50.072.618.2122.722.714.03.2711.620.9
0.90142.24.06304.2105.6290.7291.6185.235.7142.21247.0
0.020.020.67178.00.00.00.020.00.00.02652.6
0.880.883.10123.050.00.00.880.00.00.88442.3
0.0106.30.262.85105.2289.46289.46184.31.1106.3116.0
0.035.00.030.310.41.221.220.8834.635.036.0
1.2.3: Equipment Information :Provides the information necessary to estimate the costs of equipment and furnish the basis for the detailed design of equipment.
Table 1.6 provides the information needed for the equipment summary for most of the equipment encountered in fluid processes.
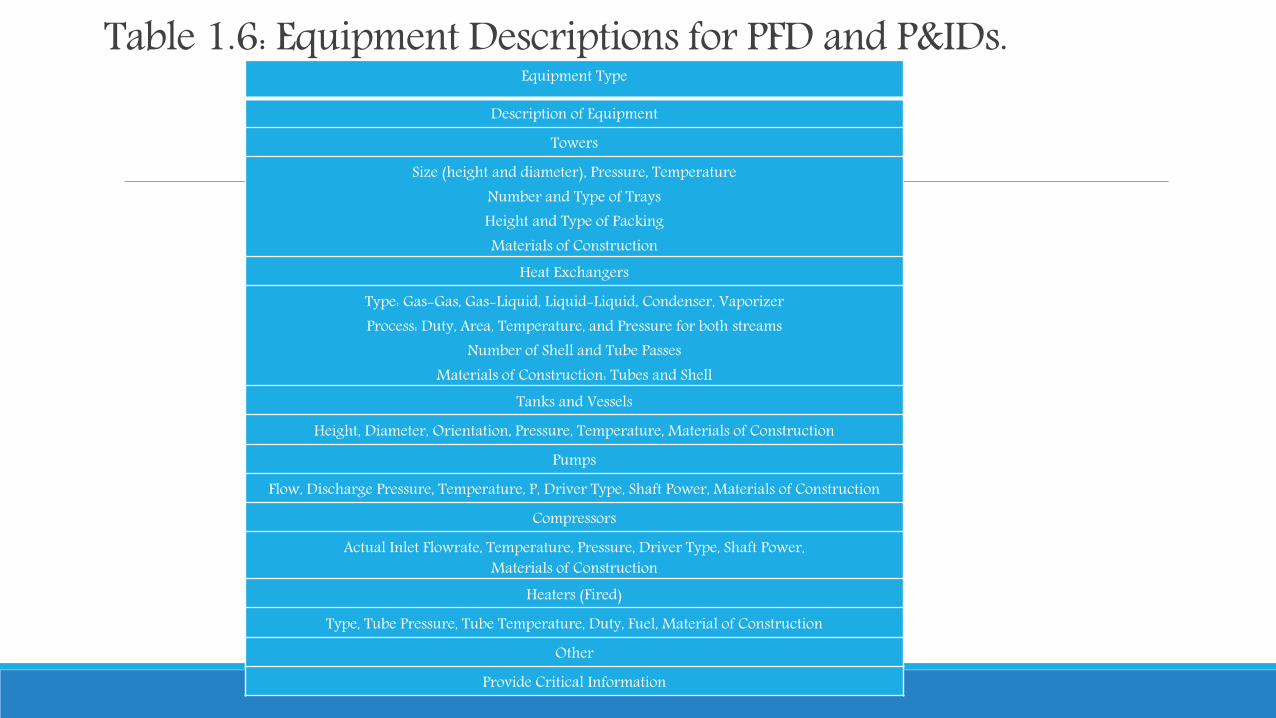
Table 1.6: Equipment Descriptions for PFD and P&IDs.Equipment Type
Description of EquipmentTowers
Size (height and diameter), Pressure, TemperatureNumber and Type of TraysHeight and Type of PackingMaterials of Construction
Heat ExchangersType: Gas-Gas, Gas-Liquid, Liquid-Liquid, Condenser, VaporizerProcess: Duty, Area, Temperature, and Pressure for both streams
Number of Shell and Tube PassesMaterials of Construction: Tubes and Shell
Tanks and VesselsHeight, Diameter, Orientation, Pressure, Temperature, Materials of Construction
PumpsFlow, Discharge Pressure, Temperature, P, Driver Type, Shaft Power, Materials of Construction
CompressorsActual Inlet Flowrate, Temperature, Pressure, Driver Type, Shaft Power,
Materials of ConstructionHeaters (Fired)
Type, Tube Pressure, Tube Temperature, Duty, Fuel, Material of ConstructionOther
Provide Critical Information
1.2.3: Equipment Information :The information presented in Table 1.6 is used in preparing the equipment summary portion of the PFD for the benzene process.
The equipment summary for the benzene process is presented in Table 1.7
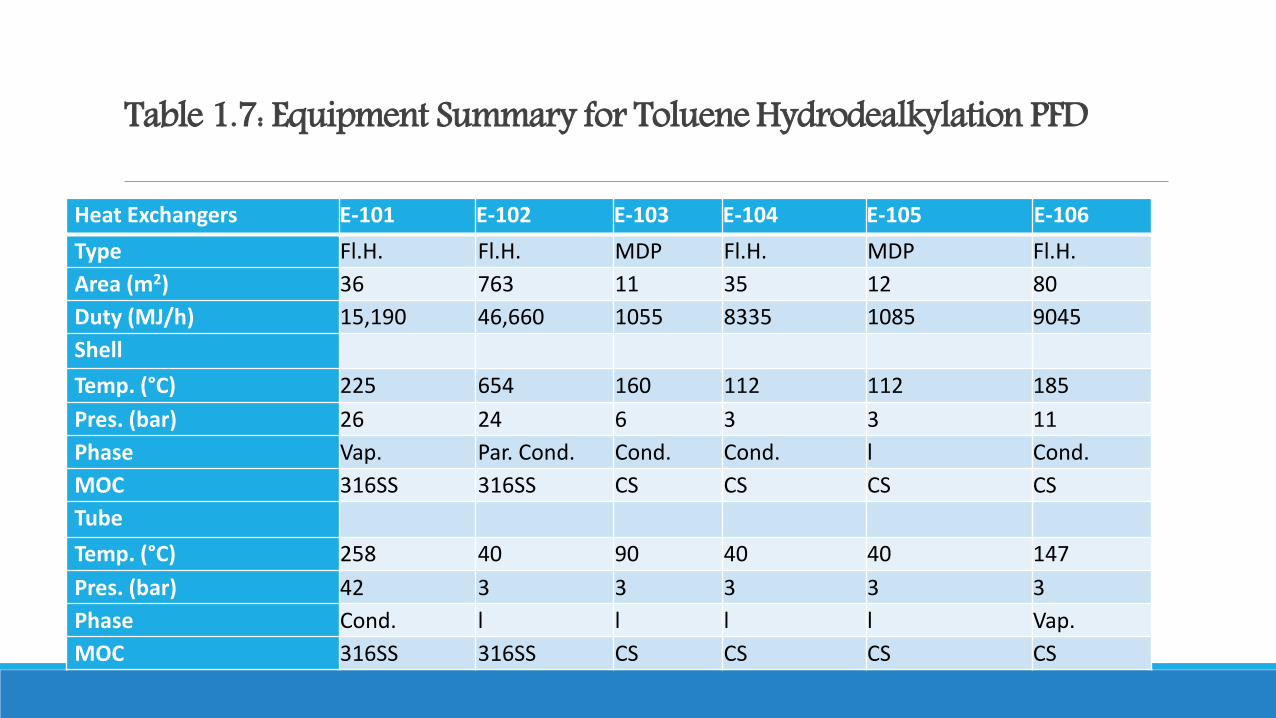
Table 1.7: Equipment Summary for Toluene Hydrodealkylation PFD
Heat Exchangers E-101 E-102 E-103 E-104 E-105 E-106
Type Fl.H. Fl.H. MDP Fl.H. MDP Fl.H.
Area (m2) 36 763 11 35 12 80
Duty (MJ/h) 15,190 46,660 1055 8335 1085 9045
Shell
Temp. (°C) 225 654 160 112 112 185
Pres. (bar) 26 24 6 3 3 11
Phase Vap. Par. Cond. Cond. Cond. l Cond.
MOC 316SS 316SS CS CS CS CS
Tube
Temp. (°C) 258 40 90 40 40 147
Pres. (bar) 42 3 3 3 3 3
Phase Cond. l l l l Vap.
MOC 316SS 316SS CS CS CS CS
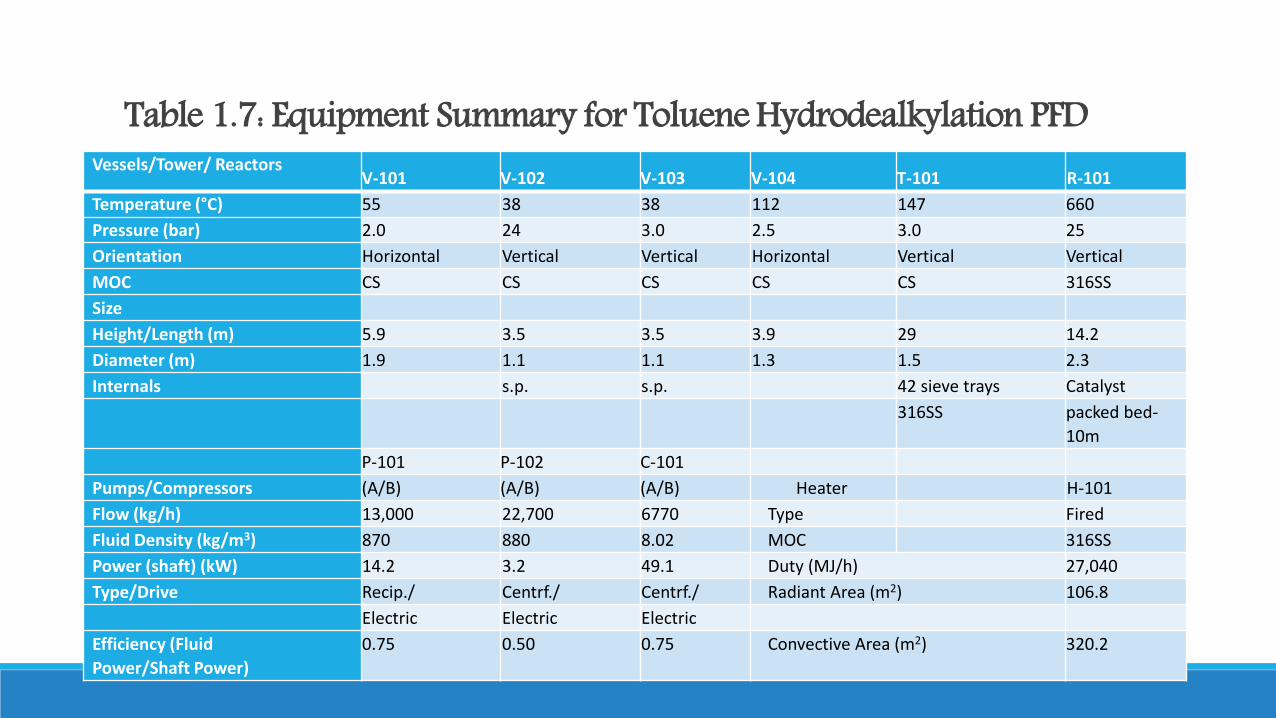
Table 1.7: Equipment Summary for Toluene Hydrodealkylation PFDVessels/Tower/ Reactors
V-101 V-102 V-103 V-104 T-101 R-101
Temperature (°C) 55 38 38 112 147 660
Pressure (bar) 2.0 24 3.0 2.5 3.0 25
Orientation Horizontal Vertical Vertical Horizontal Vertical Vertical
MOC CS CS CS CS CS 316SS
Size
Height/Length (m) 5.9 3.5 3.5 3.9 29 14.2
Diameter (m) 1.9 1.1 1.1 1.3 1.5 2.3
Internals s.p. s.p. 42 sieve trays Catalyst
316SS packed bed-
10m
P-101 P-102 C-101
Pumps/Compressors (A/B) (A/B) (A/B) Heater H-101
Flow (kg/h) 13,000 22,700 6770 Type Fired
Fluid Density (kg/m3) 870 880 8.02 MOC 316SS
Power (shaft) (kW) 14.2 3.2 49.1 Duty (MJ/h) 27,040
Type/Drive Recip./ Centrf./ Centrf./ Radiant Area (m2) 106.8
Electric Electric Electric
Efficiency (Fluid
Power/Shaft Power)
0.75 0.50 0.75 Convective Area (m2) 320.2
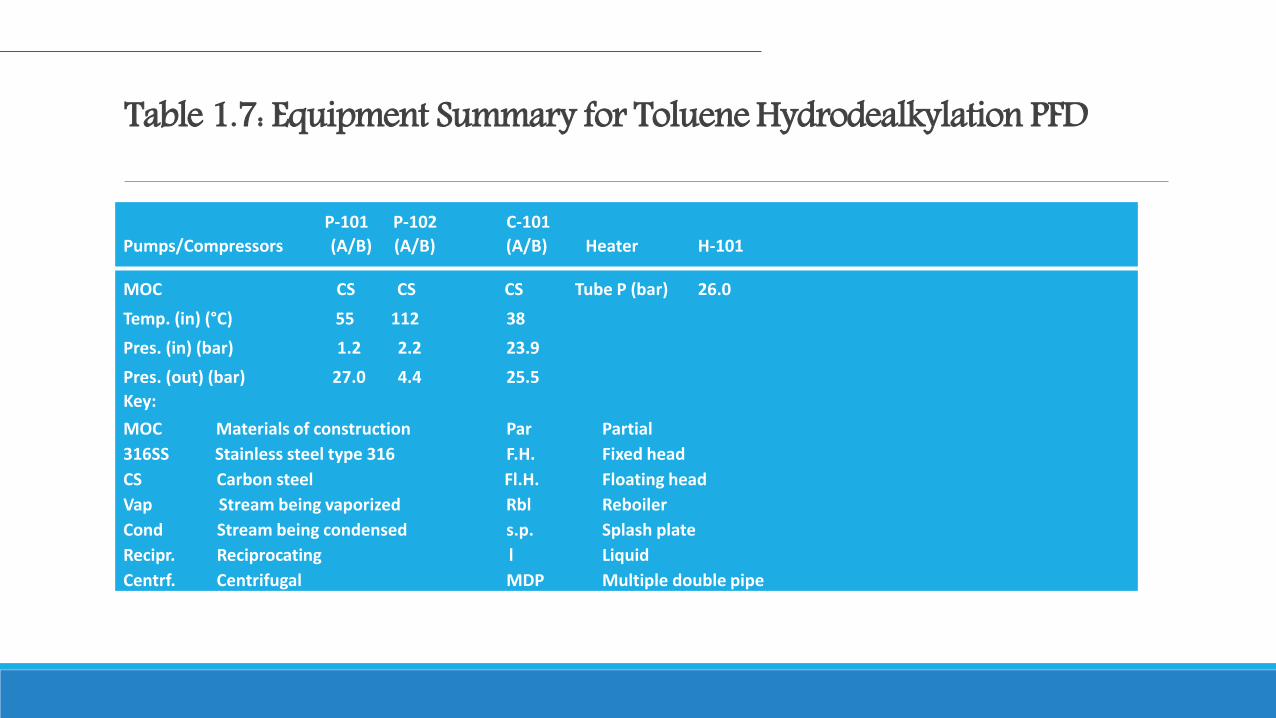
Table 1.7: Equipment Summary for Toluene Hydrodealkylation PFD
P-101 P-102 C-101
Pumps/Compressors (A/B) (A/B) (A/B) Heater H-101
MOC CS CS CS Tube P (bar) 26.0
Temp. (in) (°C) 55 112 38
Pres. (in) (bar) 1.2 2.2 23.9
Pres. (out) (bar) 27.0 4.4 25.5
Key:
MOC Materials of construction Par Partial
316SS Stainless steel type 316 F.H. Fixed head
CS Carbon steel Fl.H. Floating head
Vap Stream being vaporized Rbl Reboiler
Cond Stream being condensed s.p. Splash plate
Recipr. Reciprocating l Liquid
Centrf. Centrifugal MDP Multiple double pipe
1.2.4:Combining Topology, Stream Data, and Control Strategy to Give a PFD
The amount of process information displayed on the PFD has been kept to a minimum. A more representative example of a PFD for the benzene process is shown in Figure 1.5. This diagram includes all of the elements found in Figure 1.3, some of the information found in Table 1.5, plus additional information on the major control loops used in the process.Stream information is added to the diagram by attaching “information flags.” The shape of the flags indicates the specific information provided on the flag. Figure 1.6 illustrates all the flags used in this text. These information flags play a dual role. They provide information needed in the plant design leading to plant construction and in the analysis of operating problems during the life of the plant.
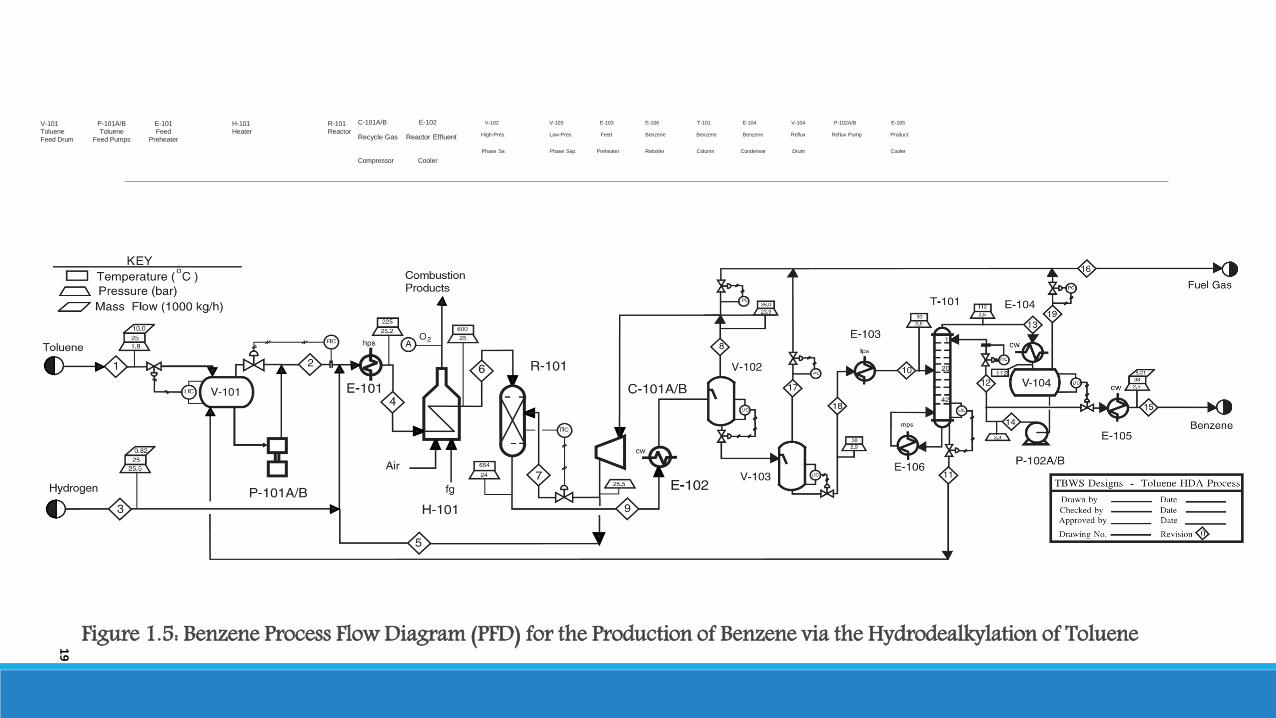
Figure 1.5: Benzene Process Flow Diagram (PFD) for the Production of Benzene via the Hydrodealkylation of Toluene
V-101 P-101A/B E-101 H-101 R-101
Toluene Toluene Feed Heater Reactor
Feed Drum Feed Pumps Preheater
C-101A/B E-102 V-102 V-103 E-103 E-106 T-101 E-104 V-104 P-102A/B E-105
Recycle Gas Reactor Effluent High-Pres. Low-Pres. Feed Benzene Benzene Benzene Reflux Reflux Pump Product
Phase Se. Phase Sep. Preheater Reboiler Column Condenser Drum Cooler
Compressor Cooler
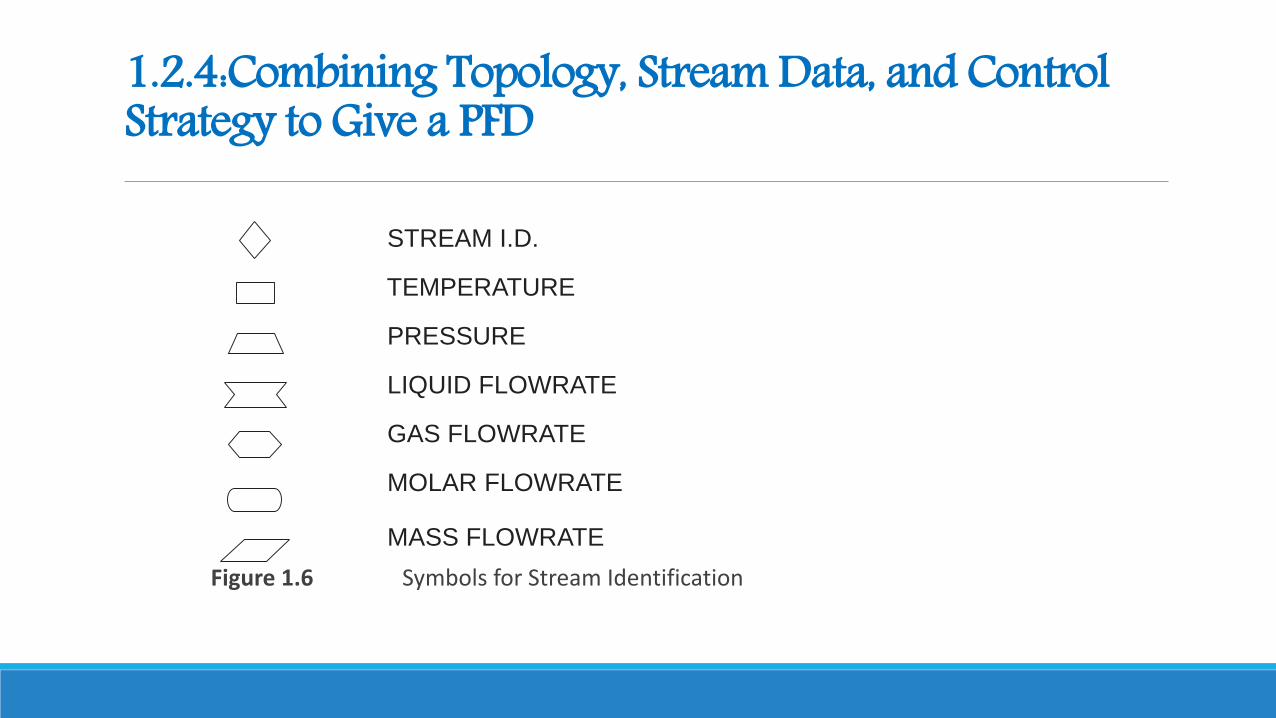
1.2.4:Combining Topology, Stream Data, and Control Strategy to Give a PFD
STREAM I.D.
TEMPERATURE
PRESSURE
LIQUID FLOWRATE
GAS FLOWRATE
MOLAR FLOWRATE
MASS FLOWRATE
Figure 1.6 Symbols for Stream Identification
1.3: PIPING AND INSTRUMENTATION DIAGRAM (P&ID).The piping and instrumentation diagram (P&ID), also known as mechanical flow diagram (MFD), provides information needed by engineers to begin planning for the construction of the plant.The P&ID includes every mechanical aspect of the plant except the
information given in Table 1.8. The general conventions used in drawing P&IDs are given in Table 1.9.
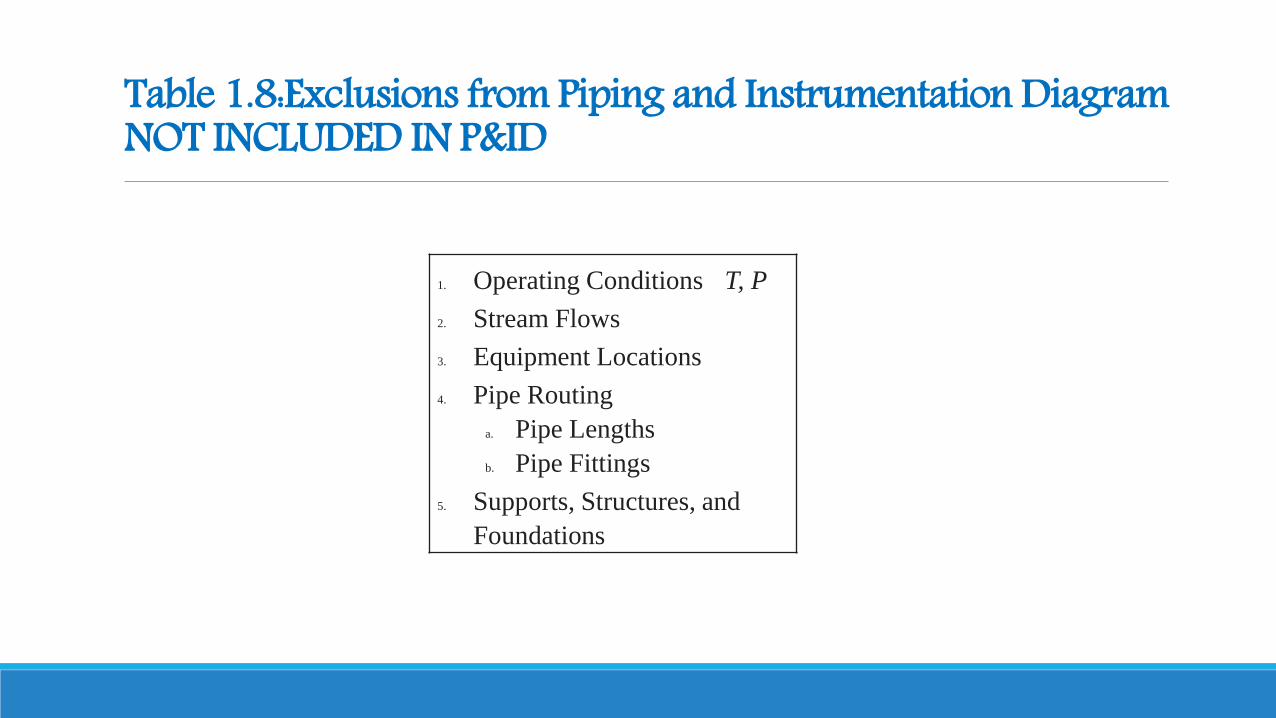
Table 1.8:Exclusions from Piping and Instrumentation DiagramNOT INCLUDED IN P&ID
1. Operating Conditions T, P
2. Stream Flows
3. Equipment Locations
4. Pipe Routing
a. Pipe Lengths
b. Pipe Fittings
5. Supports, Structures, and
Foundations
1.3: PIPING AND INSTRUMENTATION DIAGRAM (P&ID).Each PFD will require many P&IDs to provide the necessary data.Utility connections are identified by a numbered box in the P&ID. The number within the box identifies the specific utility.The circular flags on the diagram indicate where the information is obtained in the process and identify the measurements taken and how the information is dealt with. The P&ID is also used to train operators. Once the plant is built and is operational, there are limits to what operators can do. The P&ID is particularly important for the development of start-up procedures when the plant is not under the influence of the installed process control systems.
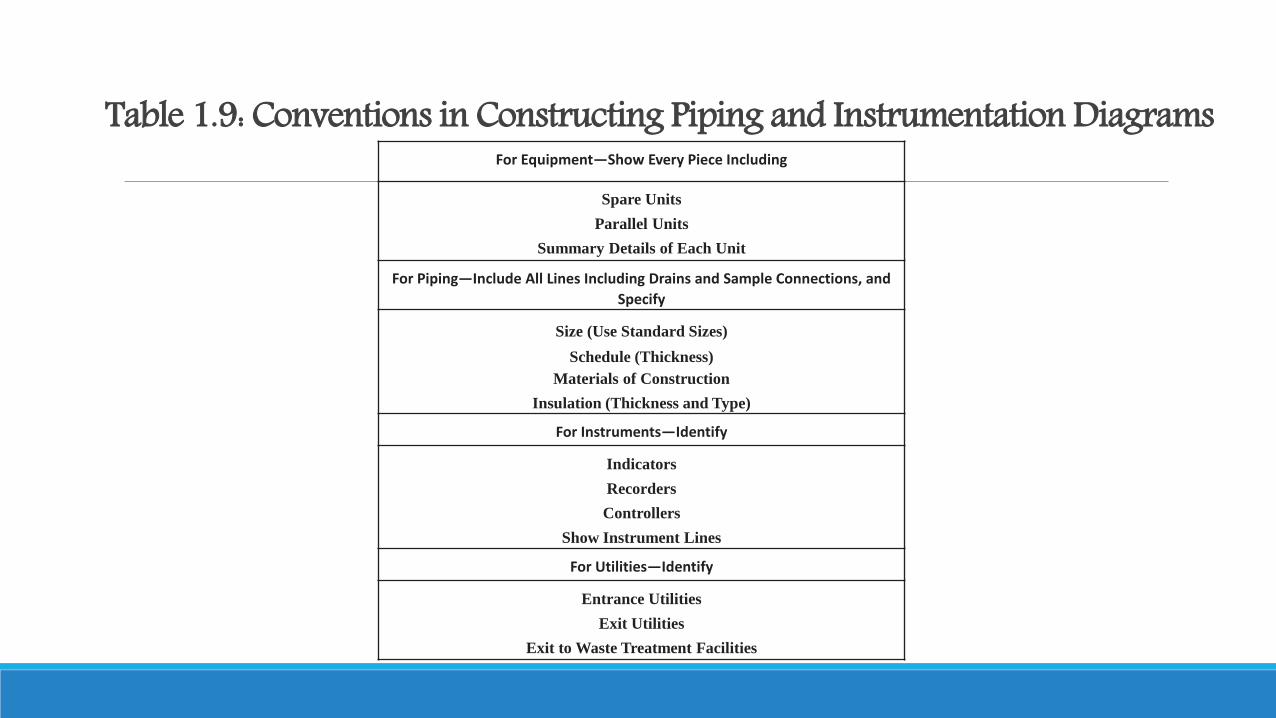
Table 1.9: Conventions in Constructing Piping and Instrumentation DiagramsFor Equipment—Show Every Piece Including
Spare Units
Parallel Units
Summary Details of Each Unit
For Piping—Include All Lines Including Drains and Sample Connections, and
Specify
Size (Use Standard Sizes)
Schedule (Thickness)
Materials of Construction
Insulation (Thickness and Type)
For Instruments—Identify
Indicators
Recorders
Controllers
Show Instrument Lines
For Utilities—Identify
Entrance Utilities
Exit Utilities
Exit to Waste Treatment Facilities
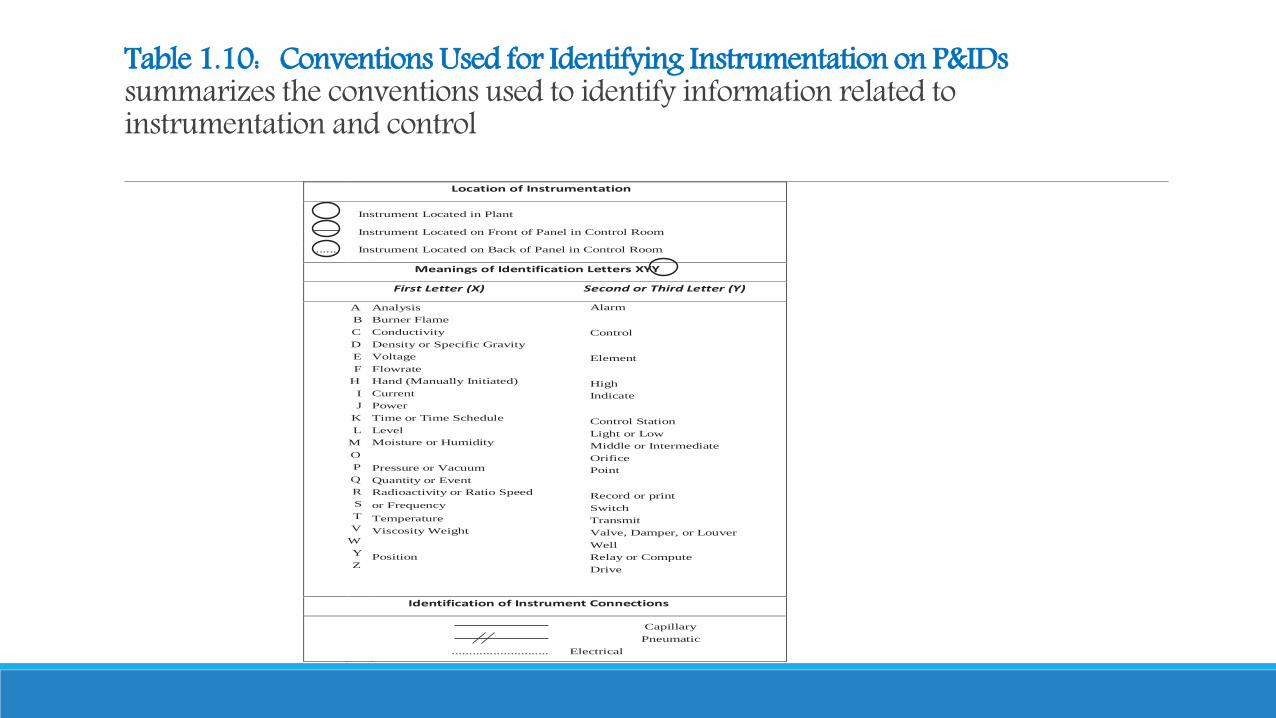
Table 1.10: Conventions Used for Identifying Instrumentation on P&IDs summarizes the conventions used to identify information related to instrumentation and control
Location of Instrumentation
Instrument Located in Plant
Instrument Located on Front of Panel in Control Room
...... Instrument Located on Back of Panel in Control Room
Meanings of Identification Letters XYY
First Letter (X) Second or Third Letter (Y)
A B C D E F
H I J
K L
M O P Q R S T V
W Y Z
Analysis Burner Flame Conductivity Density or Specific Gravity Voltage Flowrate Hand (Manually Initiated) Current Power Time or Time Schedule Level Moisture or Humidity
Pressure or Vacuum Quantity or Event Radioactivity or Ratio Speed
or Frequency
Temperature Viscosity Weight
Position
Alarm
Control
Element
High Indicate
Control Station Light or Low Middle or Intermediate Orifice Point
Record or print Switch Transmit Valve, Damper, or Louver Well Relay or Compute Drive
Identification of Instrument Connections
Capillary Pneumatic
............................ Electrical
1.3: PIPING AND INSTRUMENTATION DIAGRAM (P&ID).
Figure 1.7 is a representative P&ID for the distillation section of the benzene process shown in Figure 1.5. The P&ID presented in Figure 1.7 provides information on the piping, and this is included as part of the diagram.
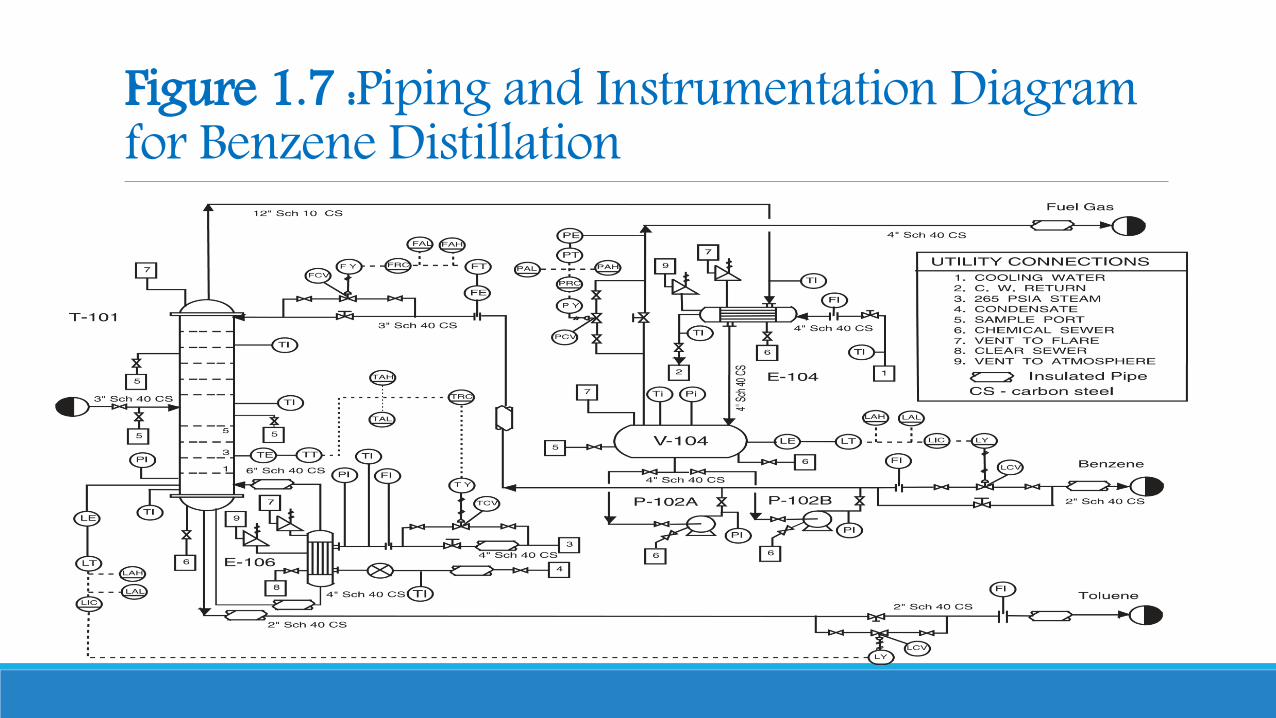
Figure 1.7 :Piping and Instrumentation Diagram for Benzene Distillation