diagrams of epidemiological knowledge in medical geography
TRANSCRIPT

Diagrams of epidemiological knowledgein medical geography and public health surveillance
Dissertation zur Erlangung des Grades des Doktors der Philosophiean der Fakultät Geisteswissenschaften der Universität Hamburg im Promotionsfach Medienwissenschaften
vorgelegt von Steffen Martin Krämer
Hamburg, 2020

Tag der mündlichen Prüfung: 02.05.2019Erstgutachterin: Prof. Dr. Kathrin FahlenbrachZweitgutachterin: Prof. Dr. Susanne Krasmann

Contents
Acknowledgments 5
Introduction 7
1. Topological media and diagrammatic coordination 191.1 Topological media 201.2 Diagrams and the diagrammatic 241.3 Visualization and inscription 311.4 Media of stabilization 371.5 Diagrams as media of coordination 481.6 Conclusion: How to approach epidemiological knowledge? 55
2. Reconfiguring the causal web in scientific epidemiology, 1960-1995 612.1 Epidemiological science and the genealogical narrative of multicausality 622.2 Diagrammatic dis/continuity: causal chain, web and fractal 722.3 Discussion: Diagrammatic discourse and figurative series 82
3. Centering the geomedical map before, during and after World War II 893.1 Mapping for correlation and prognosis 933.2 The political epidemiography of German Geomedizin 973.3 Wider diagrammatic context: The virologists’ chain of infections 1003.4 Postwar ecological turn and diagrammatic discourse 1043.5 Narrating the epistemic specificity of geomedical technology 1073.6 Discussion: Inter-diagrammatic relations and epistemic centering 110
4. Overlaying in computerized medical geography, 1965-1975 1154.1 Computerized Mapping of Disease 1174.2 Context 1: Digital disease complexes and the integration of table and
map in the work of Jacques May 1274.3 Context 2: SYMAP, 1967-1976 129

4.4 Discussion: Proto-diagrammatic schema 132
5. Architectural schemes of containment during the WHO Malaria Eradication Program, 1956-1969 1375.1 A very brief history of epidemic surveillance in the 20th century 1405.2 Case Study: The WHO Malaria Eradication Program, 1955-1969 1425.3 Geographical knowledge infrastructure in a pre-GIS environment 1455.4 The house as containment scheme between surveillance and control 1525.5 Discussion: Figurative coordination in place of diagrammatic infrastructure 155
6. Charting the temporal shape of outbreak detection algorithms in epidemic surveillance 1636.1 Outbreak detection algorithms and surveillance systems 1656.2 Re-designing the Graphical User Interface of a surveillance software 1716.3 The temporal shape(s) of outbreak detection 1746.4 Discussion: Diagrammatic coordination of event objects 177
7. Popularizing Medical Geography in the 2000s 1817.1 Popularization research and popular epidemiology 1827.2 Popularizing disease mapping – Trading zones between geography,
data visualization, and software development 1867.3 Pathways, reduction, and object of popularization 1917.4 Discussion: Exemplifying diagrammatic infrastructure 193
8. Conclusion 1978.1 Reviewing the case studies 1998.2 Concluding remarks on diagrammatic processes, topological objects
and the exemplary role of epidemiology 204
Bibliography 211
Curriculum Vitae 230

5
Acknowledgments
This dissertation would not have been possible without the generous and critical debates and conversations with many colleagues over the last few years. I want to especially thank Katrin Fahlenbrach and Susanne Krasmann for their supervision; they always responded to the meandering itinerary of my dissertation project in an insightful and constructive fashion. I would also like to thank all other members of the Research Training Group “Loose Connections –Collectivity in Digital and Urban Space” at the University of Hamburg for their different contributions to my project through workshops, roundtables and informal discussions: Isis Berger, Ulrich Bielefeld, Alexa Färber, Sina Farzin, Laura Kemmer, Gabriele Klein, Janine Klemmt, Annika Kühn, Katharina Liebsch, Michael Liegl, Sandra Noeth, Christian Helge Peters, Urs Stäheli and Vanessa Weber. The multidisciplinary environment of the group shaped in a fundamental way the theoretical and disciplinary ‘lines of flight’ of my dissertation. I also gratefully acknowledge the funding I received from the University of Hamburg as stipendiary of this Research Training Group. Moreover, I would like to thank my colleagues at the Brandenburg University of Technology Cottbus-Senftenberg for their feedback during the earlier phase of my doctoral research: Christer Petersen, Anke Steinborn and Peter Klimczak. Last but not least, I would like to extend my sincere thanks to all participants of the PhD colloquia of Susanne Krasmann and Christine Hentschel at the University of Hamburg.
Besides the conceptual support I received in the different university contexts during the project, I also benefitted greatly from the help of a number of people during my field research. Here, I want to especially thank the staff of the archives of the World Health Organization in Geneva for their assistance, as well as my interlocutors at the Robert Koch Institute in Berlin for sharing their thoughts on current developments in epidemic surveillance with me.
Finally, I am deeply grateful for the various kinds of support that I have received from my partner Gözde, my parents Sabine and Peter, and my brother Hannes over the last years. Without their encouragement and love I could not have completed this study.


7
Introduction
We come across the term epidemic, both as noun and adjective, almost daily and in various contexts. It is deployed to describe the spread of ideas, of diseases, of words, of affects and many more. In most uses of the term we find a topological operation at work. The object described as an epidemic is figured as something extending in space and time. When it comes to making this topological attribution not only verbally but also pictographically evident, it seems that cartography has taken over the role of lead medium. The epidemic spread of ideas is presented in network maps of Twitter conversations; the epidemic spread of Ebola in topographic maps of a country or region. Moreover, we have grown accustomed to the use of narrative motifs and rhetorical figures that mobilize epidemiological thinking, be it the talk of spread, contagion and virality in broad areas of popular culture, or the immunological motif of vaccination in the humanities.1 The starting points of my investigation were these seemingly self-evident figurations of epidemicity as topological, topographic, and most of all cartographic, and an interest in the vital connection between topological and epidemiological thinking.
But how ubiquitous are these topo- and cartographic figurations of epidemicity really? Do my observations also hold true for the epidemiological sciences and practices of public health, for example? Which techniques do scientists and public health officers use to bring the phenomenon of epidemicity into being? And how is our potentially different phenomenalizing of epidemicity eventually shared or how does it mingle? These are some of the questions that this book seeks to tackle. Especially the last question leads to another, however: What is the entity that travels between different knowledge collectives and professional communities and that has the power to turn a particular rendering of epidemicity into a ubiquitous one? A quick answer might be that the traveling agents are images and words: the visual artifact of the map and the term 'epidemic.’ My reservations regarding this answer, and here I follow the composite stream of "practice theories” (Schatzki, Knorr Cetina, and von Savigny 2001; Reckwitz 2003) in social and cultural theory, is that we need to look at the level of topological performance and practice in order to understand how the different modes of engagement with epidemicity stabilize
1 A discussion of the immunological motif can be found, among others, in Esposito 2011 and Lorey 2011.
8
and how they take hold, generate fascination and attachment outside traditional areas of application.
At the same time, I am not interested in topological performance as a basic kind of process with a universalizing tendency but in topological performance that is characteristic of specific fields of epistemic practice. Establishing how words and images facilitate the circulation of these topological actions across such fields is the second task of this book. The first one is to describe how these actions are anchored in a social formation and situated context. However, the identification of these social formations and contexts is far from straightforward. Pointing to professional knowledge practices that I am not familiar with includes many presumptions that would need careful deconstruction. Likewise, it turned out to be difficult to describe the topological performing of epidemicity in which I myself assume to participate. In other words, who and where is the 'me’ that I mentioned above and from whom I believe an expert’s rendering of epidemicity might differ? I could point to my position as a researcher with a background in media practice and media theory. But more importantly, I am also interested in and have practically engaged with mapping exercises, even if not in a professional context. And as a student of media studies and architecture I have also been particularly affected by the so-called 'spatial turn’ in cultural studies.2 The epistemic formation in relation to epidemicity to which I believe I belong has an engaged but amateur experience with mapping on the one hand and a professionally induced reflection of media culture on the other hand, and it may include as diverse members as media scientists, critics, programmers, designers, journalists, and artists. This formation might be too broad and heterogenous to be called an 'epistemic community’ or 'knowledge collective,’ but the way in which this group technically engages with epidemicity is also too specific to name it a 'cultural technique’.3 Within this larger formation I want to give two examples that ignited my own interest and provided entry points for the present book.
In 2005, the media theorist Eugene Thacker published an article in the online magazine Fibreculture that testified to his interest in epidemiological knowledge production. The theoretical aim of his article was to use this field of expertise to sketch out a more general theory about networks. In this article, Thacker stated that "networks can be 'layered’ on top of each other to produce an intensification, or a 'network affect’” (Thacker 2005, footnote 12). Thacker had already commented on network phenomena for some time and together with his colleague Alexander Galloway later published the now famous monograph "The exploit: A theory of
2 See, for example, Dünne and Günzel 2006, or Crang and Thrift 2000.3 For a discussion of the term 'epistemic community’ and 'knowledge collective’ see
Gittelman 2007, Amin and Roberts 2008, and Lindkvist 2005, and for the term 'cultural technique’ see Gheoghegan 2013.

9
networks” (Galloway and Thacker 2007). In the earlier article from which the above quote is taken, Thacker pointed towards this theorization of networks more generally by establishing a relation between epidemic disease and the public health techniques employed to counter them; between counter-terrorism paradigms that turned towards networked forms of organization, and the network structure of the phenomena they wished to control. Further, these relations were only possible in the context of contemporary information and transportation networks. The 'intensification of networks’ resulted from this structural similarity between biological, informational, organizational and strategic approaches to networks. Further amplified by Thacker’s interest in networked social movements,4 this presumed intensification of networks would turn into an ontological claim in his collaboration with Galloway, stating that networks are "elemental” (Galloway and Thacker 2007, 155-57).
It was this image of layered networks that stood at the beginning of my research as a captivating and indeed affective point of interest. As I came to see, many other authors have discussed the intense mingling of network modeling and disease modeling, with Peta Mitchell speaking of a "network turn in epidemiology and the corresponding 'viral’ turn in network theory” (Mitchell 2012, 8). In addition, some epidemiologists themselves had claimed that networks exist from the most micro to the most macro, urging their discipline to go beyond too narrow understandings of what could count as 'edge’ or 'node’ (Luke and Harris 2007; Luke 2012). However, the seductive power of Thacker’s image crystallized for me, I realized, in the term layered. I was used to perceiving networks as flat and abstract representations on white blank spaces rather than the stratified, multilayered planes I knew from my software and map applications. Moreover, Thacker referenced the 19th century medical geographer John Snow, and how he mapped diseases. He wrote: "Snow’s famous epidemiological maps of South London reveal a concept that is central to network thinking: the layering, in one space, of different types of networks” (Thacker 2005, 5 of 17). As it turns out, Thacker’s proposal of layered networks had a decisively technical touch. Medical Geography or disease mapping provided the 'epistemological toy’ for conceptualizing network intensification and, by extension, networks as trans-scalar and elemental.
Altogether, I found Thacker’s article not only informative due to its more obvious content – namely, the description of epidemiology and network ontologies – but also due to its choice of historical reference (medical cartography) and the adaptation of this reference to his own analytical vocabulary. Especially because Thacker writes as a professional author and theorist, I take his account to be exemplary of how an engaged interest in epidemiological knowledge 'from the outside’ is accompanied
4 See, for example, Thacker 2004.

10
by or even relayed through a particular set of topological gestures, above all cartographic ones. This is not to say that layering is a technical gesture particular to epidemiological knowledge. Lev Manovich (1999, 88) famously described it as a defining montage style of our software culture in general. But there might be certain topological gestures that are associated with epidemiological knowledge production rather than others and integrating layering with network graphing seemed to count among them.
The second example that ignited my interest in how epidemiological knowledge is construed, and within a field of practice that I already felt more familiar with, revolved around the way that mapping software has been discussed and promoted by contemporary software developers, programmers, and data visualization enthusiasts. Many examples could be given from this field (see chapter 7), but this one seems particularly fitting for the present introduction. Since its beginning in the 1970s, the company ESRI Inc. has been one of the world’s most famous mapping and GIS software providers with applications in various contexts and disciplines, including a so-called "Health and Human Services” branch. In 2012, the manager of this branch, Bill Davenhall, promoted the use of mapping software for health-related concerns in a publication entitled "Geomedicine” (Davenhall 2012). Davenhall also reiterated this term in a series of public presentations. Originally, however, the label geomedicine emerged in the 1930s in Germany, in connection with the expansionist and racist political ideology of the time. The fact that ESRI and Davenhall decided to use this term for promotional purposes is interesting in two respects: Firstly, because they did not clarify its origins, which suggests that they took the term to be sufficiently clear to stand on its own; either because they did not know its history, or because the technology it references was considered to be of a universal value that can exist independently of its historical instrumentalization. Secondly, the terminological choice is interesting because of the epistemological scope and relevance it was supposed to encode. Davenhall considered the presumably universal value of geomedical technology to be urgent in the face of the large datasets that are available nowadays, which link data by location in a geographical information system, and which could help doctors to look beyond the symptoms of a single patient and find other factors or similar cases in their environment (Davenhall 2012, 11 and 28). In making this point, Davenhall joins a growing community of speakers who emphasize the value of spatial intelligence, that is, the use of maps and locational data to inform decisions and make correlational judgments. Interestingly, the way he narrated this epistemic value of geomedicine closely resembled what epidemiologists and medical geographers since the beginning of the 19th century had claimed to be the value of their trade. However, epidemiologists and medical geographers have also further differentiated their respective sets of tools and epistemic practices since those early days. Davenhall’s presentation of geomedicine

11
therefore highlighted the continuity of a particular version of epidemiological knowledge, one that is fully anchored in a geographical technology. At the same time, he claimed that this technology has moved beyond the expert’s setting into the wider public; that "medical epidemiologists, the front line of disease detectives, have used GIS extensively" (6) and that thanks to public mapping applications we might all become, at some point, "citizen epidemiologists" (19).
Even though the context, presumed audience and style of writing of both authors, Thacker and Davenhall, are extremely different – a media theoretical context and hermetic writing style on the one hand, and a rather marketing-oriented style and context on the other hand – both their publications share the tendency to prototypically exemplify epidemiological knowledge production through geographic techniques. It is not just that they reference certain technical terms that are common in epidemiological discourse; they also make claims about the "epistemic machinery” (Knorr Cetina 1999, 3) of epidemiological knowledge, implying that cartographic technology and its underlying epistemological models could potentially belong to a core setting of epidemiological knowledge production. It was this centering of geographical technology within a wider frame of epidemiological practice that my inquiry first sought to interrogate. In order to make sense of these dynamics I needed to craft my analytical perspective accordingly; to understand in which ways such technical appropriations are contingent compared to what counts as epistemological knowledge elsewhere. Being approximately and comparatively more familiar with the setting of these two authors, my assumption was that I should turn to other fields of practice and estrange myself from my default presumptions about epidemiological knowledge and its epistemic machinery. Thus I turned to studying the history of epidemiology and medical geography.
Importantly, my object of interest was not the analysis of a specific term. Many great studies have been published in recent decades on how epidemiological terms, especially contagion, have circulated across regions of knowledge (e.g., Schaub 2004; Parikka 2007; Mitchell 2012). Instead, I was interested in topological performances that have been turned into techniques and technologies of epidemiological knowledge and how these differ or are shared across different fields of epistemic practice, knowledge collectives and other social formations. This perspective generated two mutually implicating questions that I have already hinted at above: Which groups and which techniques am I speaking about? The two questions are mutually implicating as soon as we consider the identity of a group to be stabilized, among other things, through its techniques and practices. Multiple scholars have emphasized this stabilizing role of techniques for epistemic communities and I will return to many of them in the first chapter. Although I was unable to answer one question without the other, as an analytic tradeoff I considered it nevertheless helpful to assume the identity of one of the two objects of interest –group boundaries

12
or techniques– at the outset without foreclosing that this presumed identity would become blurred over the course of the study. I therefore decided to assume the identification of certain professional communities as well as disciplines to begin with, even though more specific 'epistemic cultures’ (Knorr Cetina) may emerge within and beyond these first delimitations as my research progresses. I therefore decided to select my settings of interest very conventionally, that is, by professional categorization: I decided to focus on practices of professional epidemiologists, public health officers and medical geographers, and then secondly inquire about their respective expert publics such as programmers, statisticians, data journalists and visualization experts, in whose shadow I could eventually revisit my own default understanding from which I started.
This left the second question still open, however: Which techniques would I focus on? Rather than focusing on all kinds of tools and technical equipment used by these expert communities, I kept topological content as my center of interest. In other words, my attention was still on spatial figurations of epidemics but not only cartographic ones. For example, the idea that epidemics are emergent events that come about by passing a critical threshold is also an explicitly spatial rendering of epidemics. My aim was to broaden the overlap of topology and epidemiology and make the choice for a particular, let’s say, cartographic inscription of epidemics ever more contingent and necessary to deconstruct. This does not mean that I omitted an interest in cartography. To the contrary, I also inquired into how its multiple uses vary across the professional communities mentioned above and how it has become such a popular technology for representing epidemics and epidemiological knowledge. I therefore selected not only medical geography but also epidemiology and public health surveillance as particular windows into the wider realm of epidemiological knowledge practices and its spectrum of topological techniques, with the idea that these different windows would allow me to trace the particularity of certain settings and fields and even draw distinctions and similarities between them. However, such distinctions and similarities might exist on different levels. On a macro-level one could assume to find different styles of reasoning (Hacking 1992; 2002, chapters 11 and 12), with a statistical style of reasoning in public health surveillance and epidemiology, and one that favors visualization and spatial analytics in medical geography. Some aspects of this macro-level distinction will indeed play a role throughout the following discussion, but I feared that by starting from the assumption of a style of reasoning I might already start too high up and explain as much as I cover. Moreover, the distinction between a statistical and a geographical style might boil down too quickly to an opposition between image and number. Although I believe that the chosen professional contexts of epidemiological knowledge lean toward the deployment of particular techniques that shape their reasoning about epidemics, I wanted to understand what contributes to stabilizing

13
these techniques. Styles of reasoning are already individuated entities of a more general kind.
To move down in abstraction level, I therefore decided to look at the use of particular graphical mediators that concretize some of the techniques and practices of these professional contexts; and then, secondly, to contextualize them in the knowledge infrastructures (Edwards 2010) in which they are embedded. By focusing on graphical mediators in order to identify and analyze the specificity of particular fields of knowledge and action, I am following a path that sits between Actor-Network-Theory (henceforth: ANT) and media theory. I will detail in Chapter 1 what these disciplinary alliances and the chosen terminology entail, but for the moment it needs to be emphasized that by focusing on graphical mediators, the above-mentioned relation between topology and epidemiology was reduced to a specific point of interaction: the interaction between topological acts and media of inscription. With ANT I presumed that topological acts and media of inscription co-stabilize into practices and mediators which are indicative of and often specific to a field of knowledge and action. An example of a mediator-practice double would be the attribution of epistemic agency to certain topological acts and instruments involved in the process of mapping, e.g. to the practice of cartographic overlaying and to the artifact of the layered map, and this attribution would serve the stabilization of the epistemic practices of a particular group of knowledge workers. One further implication of this terminology was that topological acts cannot be limited to human operators, and subsequently also the individuation of practices and mediators must include topological acts performed by machines.
Moreover, rather than including in my analysis all kinds of topological acts and media of inscription, and how they are collapsed into mediator objects, I chose to focus on diagrammatic media and diagrammatic processes more specifically. Again, I will detail these terms in further detail in Chapter 1 and limit myself to a brief preview at this moment. The concept of the diagram in media studies and related research traditions has seen an extreme semantic extension and widened area of application. I will use the term diagrammatic media to denote the artifact of a graph, chart, map, or a related kind of graphical inscription, which we commonly refer to in ordinary language when we speak of diagrams. By contrast, the notion of a diagrammatic process (or sometimes: the diagrammatic) will be used as the more specialized term but with a wider meaning. I will understand it as the situated process of modeling and remodeling, configuring and reconfiguring the content of topological acts in a particular field. This process is functionally facilitated by connecting similar spatial structures, for example, structurally similar figures or media of figuration. The diagram can be seen as a material support for the diagrammatic. However, a diagrammatic process must not be reduced to the work of one type of diagrammatic medium or to graphical inscription alone; it can stretch

14
across different figures of speech, inscription materials, and bodily schemata. In addition, I study these diagrammatic processes only insofar as they are part of an epistemic practice complex, which means that they assist in generating objects of knowledge. More specifically, diagrammatic processes generate these objects in a particular way: objects are realized in a potentially ongoing cycle of (re)modeling and graphical (re)configuration, couched between the making of an abstract model and a concrete inscription. I will argue that this ‘unfolding objectual character’ (Knorr Cetina 2001) of diagrammatic processes serves to coordinate a field of knowledge. Thus, whereas the term mediator heuristically allows me to emphasize the immanent stabilization perspective of a field of knowledge and action, the concept of the diagrammatic serves to highlight the topological coordination at work and how it might stretch across different kinds of media.
Organization of the book
Over the course of the book, these key concepts of topological acts, graphical mediator and of diagrammatic coordination will be tested through a series of fields and case studies from the history of epidemiology, medical geography and public health surveillance. As I said above regarding the identification of groups, techniques and 'analytical windows,’ drawing the boundaries of a field and selecting a case study was far from trivial. How would I know which field and case study to select without already assuming its relevance to a historical hypothesis about the development of epidemiological knowledge, or to a systematic hypothesis about the role of diagrams as graphical mediators? I believe this is not a dilemma to be solved, but a core part of the research that needs to be made transparent. I view research as an abductive process, by which an initial corpus of research materials, whose selection has been based on preliminary models and interests, leads to the identification of types and regularities that in turn will alter the next round of models, interests, and collected materials, and so on. Authors in the tradition of Foucault’s discourse analysis have made clear that the building of a corpus is the research and that it involves continuous deconstruction of the initial corpus-building assumptions.5 Moreover, the abductive attitude is represented in making the researcher’s intuitive first surprise explicit,6 as I hope to have done above, and to keep track of how the research process alters it along the way. At the end of the book, I will therefore return to my initial curiosity. But the main body of the following chapters will consist of different fields of epidemiological expert practice,
5 For a discussion of the ongoing deconstruction of the corpus in Foucault-inspired discourse analysis see, for example, Renggli 2014.
6 For the notion of surprise in abductive reasoning see Reichertz 2013.

15
which I came to distinguish after iteratively exploring the wider spectrum of epidemiological knowledge.
The term 'field’, however, is itself loaded and can be given a different meaning and scope depending on whether one approaches it in the tradition of ethnography or in the tradition of social theory (Neumann 2012). Still, in both theoretical trajectories exists an understanding of the field as a relational entity that emerges from the research and through the encounter between the researcher and what is being researched,7 corresponding with the abductive attitude that I indicated above. A field can therefore be very different things and it does not map onto a specific geographical scale. It is altogether a different unit than the ethnographic units of the setting or the site, which tend to indicate a specific locale that the researcher can go to in order to observe and participate in the practices of the informants. The field, by contrast, is an entity that transcends the locale because it emerges in the process of research, in relation to the iterative generalizations of the researcher or from the comparison of different sites, settings and practices.8 One also finds a primarily practice-oriented conception of the term field in sociology; for example, when the sociologist Andreas Reckwitz (2003) addresses 'practice complexes’ as a 'social field’ once these practice complexes are formally institutionalized and factually coordinated.9 My own use of the term ‘the field’ is aligned with these potentially transscalar understandings of a field as a nexus of practices and which might concretize or mutually stabilize with specific mediators and knowledge objects.
Finally, there seems to be a methodological tension between fields of practice that I recognize over the course of a corpus-building process, and the idea of a case study that always implies an already bounded class of entities of which it is a case. In other words, the open-endedness of the abductive field identification is somewhat countered by the rectifying and instituting force of the case.10 However, I used the two concepts of field and case as complementary forms of analysis, which resonate with different presumptions and foci in the research process. On the one hand, fields point to practice complexes that I have iteratively identified as important in
7 Cf. Neumann 2012. In Ethnography, one also finds a distinction between different ways of constituting a field: a field constitution by the social world one is researching, an analytical constitution of the field by the ethnographer, and a processual constitution of the field in the research process itself (Thomas 2019, 36-37).
8 For a comparative approach in ethnography in general and towards the comparison of sites and settings in the aftermath of multi-sited ethnography in particular, see Scheffer and Niewöhner 2010, and here especially Sørensen 2010.
9 Reckwitz (2003) also mentions two other forms of practice complexes: a general one that expresses a certain lifestyle, and loosely coupled practice complexes.
10 Lauren Berlant writes: "As genre, the case hovers about the singular, the general, and the normative. It organizes publics, however fleeting. It expresses a relation of expertise to a desire for shared knowledge.” (Berlant 2007, 664)

16
epidemiological expert knowledge, and each case study offered a more detailed look into these professional settings. On the other hand, a case study was only considered worthwile if it provided the overall analysis with a topological knowledge object that seemed exemplary for epidemiological practice in these settings: for example, objects such as spread, correlation, containment, or disease-environment complexes. Yet, the exemplary status of these objects was an assumption on my part and underwent changes. I only came to recognize some of them as exemplary over the course of the research, while I presumed others to be relevant from the outset. The process of selecting case studies therefore mirrored and fed the process of field identification and vice versa. Epidemiological fields of practice and topological objects remained knotted together in this way. Furthermore, as much as I consider it a necessary part of the abductive gesture to return to my initial starting point at the end of the book, I also believe it is crucial to revisit my assumptions about the exemplary objects in epidemiological knowledge at the end.
Different fields and case studies appeared as possible candidates for being selected, studied in greater detail and presented in this book. Some selection criteria seemed therefore necessary. Firstly, and on the most general level, fields and cases had to stand out as factually and temporally confined activities or operational chains, which revolve around a topological act with the aim of making epidemic events visible. Secondly, it was necessary that they involve diagrammatic media such as graphs and maps, making it possible to study whether they stabilize or coordinate these operational chains. Thirdly, the case studies had to trace different topological objects that seemed iteratively exemplary for epidemiological knowledge, such as multifactorial causal complexes, correlation, spread, containment, and emergence. Still, these three selection criteria were made deliberately wide so that the list of fields and case studies includes discipline-building discourses, temporary research projects and the development of technical systems. Eventually, I selected six fields and case studies.
For presentational purposes, I grouped these fields and case studies according to the professional disciplines to which they seemingly belong and I ordered them partially chronologically and partially in a way that introduces the reader to basic epidemiological concepts and to a presumably intuitive conception of diagrammatic processes before widening the perspective further and further. Thus, the first case study looks at the scientific discipline of epidemiology, the second and third at medical geography, and the fourth and fifth at epidemic surveillance in public health. The sixth case study is again closely related to medical geography but because it revolves around the interaction between different professions and around the popularization of epidemiological knowledge practices, it is presented separately at the end. This last case study also appears at the end of the book in order to keep my promise of revisiting my initial presumptions about epidemiological knowledge

17
and its exemplary objects outside the professional fields presented beforehand. As far as the theoretical exploration of diagrammatic processes is concerned, each case study will end with a discussion part that sums up how we might understand the diagrammatic in the face of this case study and what conceptual and methodical challenges it poses. Moreover, the larger conceptual discussions at the end of each case study make it necessary to introduce further theoretical tools as we go along. However, there are some theoretical presumptions that already frame the whole inquiry from the outset and before going into the detail of each case and respective diagrammatic discussion, I will first outline some of the most central theoretical concepts in the following chapter.

19
1. Topological media and diagrammatic coordination
The theoretical and heuristic route I follow in this book navigates a path between media studies, sociology of knowledge, and Science & Technology Studies (STS). But as I write this, I also feel a certain hesitation in using these labels. I have spent the most part of my early professional and academic life in transdisciplinary working environments, and it was not until working on the research for this book that I was increasingly confronted by calls for disciplinary positioning. As much as I would prefer to circumvent these calls, I also acknowledge my obligation to make the research transparent and allow readers to find familiar anchor points along the way. It is in this spirit that I will present some of the key theoretical concepts in the following and locate my inquiry in relation to other well-known research agendas. I leave it to the reader to consider them as theoretical positionings or rather as informative meeting grounds.
At the beginning of this chapter, I will limit myself to providing an overview of the most important concepts that will reoccur throughout the whole book. I will introduce a wider conceptual framework of topological media, from which I will then select diagrams and diagrammatic processes as my focus of interest. Moreover, and on a more sociological note, I will make a heuristic distinction between media of stabilization and coordination. The concepts that I will discuss under the heading of media of stabilization are diverse – mediators, knowledge infrastructures, styles of reasoning, epistemic culture – but in my reading they all help to describe how a field of (epistemic) action is stabilized from within. Under the category of media of coordination, by contrast, I will approach the question of the stabilization of a field of action from a different perspective, that is, by discussing the concepts of boundary objects and conscription devices whose mediating capacity provides a certain amount of plasticity by which separate fields of actions are brought together to communicate with each other. I will eventually propose addressing the diagram and diagrammatic processes as media of coordination, which coordinate the configuration and reconfiguration of topological models. It needs to be noted, however, that even though this chapter provides an introduction to important heuristic concepts that appear throughout the rest of the book, it only aims at a minimal overview. Each of the case study chapters that follow hereafter will provide further theoretical discussion and, if necessary, introduce additional assisting concepts.

20
1.1 Topological media
I said at the very beginning that I assume our engagement with epidemicity entails a topological operation, by which we imagine the spread, composition, and emergence of epidemic phenomena as spatialized. Moreover, I said that we have grown accustomed to specific types of such operations, for example through cartography, rhetoric, narrative motifs and figures; and that we are therefore equipped with what amounts to a topological know-how or knowledge in relation to epidemicity. In the following, I will outline what is meant by topological acts, topological knowledge, and media of topological description and experience over the course of my inquiry. On the one hand, this provides a glimpse into the wider conceptual context and generality of topological media, which motivated me to focus on diagrammatic media as a more specific object of study. On the other hand, it introduces the idea that media of topological reasoning can be so multifold and proliferating that we need to turn to the question of how some of them obtain an outstanding status, for example, as an actor with epistemic agency, or as an object for economic valuation.
Topology is a branch of mathematics and therefore a formally rigid system of scientific description. Beyond mathematics, one of its more general philosophical implications is to conceptualize space in terms of relative positioning rather than essentializing it, and to avoid construing spatial categories only in relation to human bodies and minds. Among others, Gottfried Wilhelm Leibniz’s unfinished work of a mathematically concise "analysis situs” is often taken as an inspiration for the development of topology (Günzel 2007, 21-22). Another central aspect of mathematical topology is its preoccupation with surfaces and its contribution to geometry. Both objects of topological engagement – relative positioning and surfaces – combine in the popular example of a coffee cup transforming into a doughnut. Despite its transformation, the surface of the doughnut-coffee-cup can be continuously defined in terms of the relative positioning of its points. In other words, there is a continuous property of the doughnut-cup-object that makes it identifiable and which we would not be able to describe if we only focused on essential space coordinates and tried to identify an object by the extensions therein.
The interests and concepts of mathematical topology have resonated equally strongly in the social sciences and humanities since the 1930s and even more forcefully since the 1960s: on the one hand, in psychology (Lewin 1934) and quantitative sociology (Moreno 1934, Lundberg and Lawsing 1937); on the other hand, in the structuralist and post-structuralist schools of linguistics (Jakobson 1965), psychoanalysis (for example in Lacan, see Ragland and Milovanovic 2004), anthropology (Lévi-Strauss 1969), philosophy (Serres 1982, Deleuze and Guattari [1980] 1987), sociology (Deleuze on Foucault [1986] 1992) and in media studies (Lury, Parisi and Terranova 2012). Geography is not explicitly listed here as it
21
obviously relates to spatial theory and topology in the most profound sense and has engaged and inspired topological theorizations in other disciplines in myriad ways.11
This wide-ranging application of topology complicates the question of which topological toolbox and interpretation to follow, and any decisive choice would make it necessary to outline the presuppositions that this decision entails and what it does not – a task that would be beyond the possible scope of my inquiry. Thus, for pragmatic reasons and to serve as an introduction to the analytical angle of this book, I merely want to point to the different types of mediations that theorists regularly deploy to register a phenomenon as topological. Two ideal-typical cases stand out: the use of diagrams to mark a structural similarity, for example a network image to mark the social as topological; and the use of the human body or means of animation to register a homeomorphic transformation. Because such topological mediations are embedded in specific activity contexts, in which they might occur regularly, they can assist in stabilizing a practice complex. From this perspective it makes sense to speak of a topological practice, for example, if a theorist’s description or reasoning about something bears the signature of this or that kind of topological mediation repeatedly.
However, not all topological activities operate or 'materialize’ on the level of a topological practice. Below description and reflective reasoning might be further topological acts that buttress the former, at least in the context of human action and experience. For example, the phenomena of homeomorphic transformation and structural similarity are based on the identification of continuity and similarity and thereby evoke basic processes of perception, such as psychological association rules. This, in turn, brings up the question of whether we can already meaningfully speak of 'topo-logies’ on such a basic level. Typical kinds of basic association would be association by contiguity and association by similarity. An experience of structural similarity, for example, mobilizes both association rules: the contiguity relation in the identification of a single structure, and the similarity relation in the identification of the relation between two structures. These basic kinds of association rules could thus be addressed as genetic vehicles of topological experience. The idea would be that through the repeated performance of such basic rules of association, by which we learn to recognize a connection beyond a singular perceptive act, we already have sufficient ingredients to speak of a minimal topo-logy – where 'logy’ stands in for the application of a rule, for a sense that can be learned, but not only for a reflective mode of engagement.12
11 For example, through the work of Doreen Massey, Sarah Whatmore, or Nigel Thrift, to name just a few.
12 William James’ description of conjunctive experience in his version of a radical empiricism points in this direction (James 1912, 44ff). However, the problem I see with topological

22
Whereas the association rules function as media for the becoming of topological experience, the before-mentioned example of the diagram in descriptions of structural similarity may serve as a medium of topological reasoning. Yet, we might consider both of them as falling into the category of media of topological knowledge, given that I restricted the examples to the context of human practice and that all of them may serve as warrants for believing in this or that description, reflection, or experience as adequate. Association rules are a special kind of topological media because, compared to images, their enduring materiality is not intuitively graspable. Yet, for the moment, we need to resist the temptation to 'implement’ these media in seemingly unproblematic hardware categories, such as neural systems, behaviors or even "system-environment hybrids” (Hansen 2009). Postponing this decision retains the promise, I believe, of later approaching the question of material implementation as one of stabilization and coordination across registers of semiotics and practice.
This tentative taxonomy of media of topological knowledge is of course an idealization. In reality, various such media interact, combine, oppose, inhibit, and capacitate each other; and always to the degree that specific situations and contexts allow. At the same time, we do not just find mingling and proliferation in empirical analysis, but also dominance and centering of some topological media over others. Further below, I will adopt the terms ‘mediator’ and ‘intermediary’ from Actor-Network-Theory as a way to account for both the proliferation and centering of topological media. For example, once we start using a mouse as an interface for moving the cursor on a screen, both the movement structure of the mouse and that of the cursor are reflected as structurally similar. One could come to conclude that it is the observer scheme of the diagram that is given priority in this reflection. Over the course of some time, this similarity perception may transition into the experience of a continuum between mouse and cursor movement, and the object distinctions that accompanied the similarity reflection may become softer; they may become parts of one continuous movement object, or even fade entirely. One way to read this example is to emphasize that structural similarity and homeomorphic continuity are observer schemes at a specific time and in the context of particular acts. One of them might obtain priority and agency in acts of topological description while reverting to the background in acts of topological experience. To be a medium of topological knowledge or action is a momentary status that equally involves the making of objectifications and subjectifications: for example, to be an object that can be reified for economic valuation, or to be an actor that is granted epistemic agency.
theories that strongly rely on James is that topology too quickly becomes synonymous with a fundamental relationism as if topology could be reduced to a matter of just any connection.

23
Another example of the centering of certain topological media can be found in the article by Thacker (2005) from the introduction. There, I cited his claim that an 'intensification of networks’ is present in today’s culture of security. Read against the constitutive mingling of topological media, in fact, Thacker’s description points to the dominance of a specific topological image, that of the network. But he also referenced a number of other topological mediations by bringing in medical cartography and a sense of homeomorphic transformation through affective intensity. Thus, Thacker’s article speaks about network intensification, but in itself it is a witness to an intensification of topological mediations more generally. In this context of a topological intensification, not only the network image appears to be centered as a primary agent but also the practice of disease mapping, on which Thacker’s description relies heavily. However, in order to interpret this intensified milieu and the centering of certain topological media, we cannot merely concentrate on Thacker’s text and explain the intensification and centering by relying on discursive or narrative conventions in the field of media studies. Neither can we only turn to what the text describes, that is, to expert settings of security and epidemiology. Instead, the topological intensification and centering of some topological media appear at the intersection of both, which thereby marks a specific historical situatedness.
In extracting a minimal definition of topology across contexts and observer levels, but while employing an overall phenomenological lens, Stephan Günzel (2007, 21) stated that a topological inquiry occurs whenever one looks at what remains the same despite observers believing that there is a change. This 'basic’ topological question might also be turned into a slightly different one: how in topological inquiry something is attributed with stability in a general milieu of change. The paradigm case would be homology and the answer that 'relationships’ are the objects that stay the same despite change. However, topological acts such as the act of topological description might involve different modes of stabilization beyond only the focus on relationships as the content of description or phenomenon of observation. Even more, relationships might be one possible object of topological inquiry, but they are also too general a category to meaningfully mark any sociological differences. Instead of relationships in general, at various point in this book I will discuss the more particular phenomenon of correlation, which takes up significant space in fields of epidemiological knowledge. Moreover, besides objectifying that which topological inquiry is about, topological acts might get enmeshed into a practice complex due to further dynamics of stabilization. A topological inquiry might endure not only because it grants something the status of a phenomenon to be studied, but also by objectifying what counts as a medium or an actor. In other words, the terms actor, phenomenon, and medium refer to different possible modes in which something persists in a topological practice
24
complex, for example in topological description. Rather than coming up with a baseline definition of topology or topological inquiry, the task of empirical work, in my opinion, is to outline how different 'cultures of topological inquiry’ stabilize. And the more particular endeavor of this book is to study these topological cultures that stabilize in/as fields of epidemiological knowledge.
Altogether, two heuristic items especially will be used throughout the following chapters in order to trace these different topological cultures within epidemiological knowledge production: firstly, objectifications of the phenomenon of topological inquiry, for example, the objects of correlation, spread, containment and emergence; secondly, the media that makes topological inquiry possible and in which some of them obtain the status of epistemic agents. Taken together, these objects and media/epistemic agents concretize and delimit particular topological cultures within the spectrum of epidemiological knowledge. Given the above-mentioned proliferation, intricateness and intensification of media of topological inquiry in the context of epidemiological knowledge, some further analytical concentration appears to be necessary, however. Rather than reconstructing all the kinds of topological media and topological schemes discussed above, I will primarily focus on the medium of the diagram. From a functional perspective and according to the specifics of diagrams outlined above, it would therefore seem that I am mainly interested in the role of structural similarity in the construction of epidemiological knowledge. However, this alone is too broad a property and we will see next that further qualifications can be made that concern the epistemic function and status of diagrams.
1.2 Diagrams and the diagrammatic
Diagrams are part of so many everyday activities from school education and professional work to newspaper reading that hardly anyone has not engaged with them in a repeated manner. A common understanding of diagrams limits them to line drawings with a reduced repertoire of simple geometric and symbolic forms: prototypically with dotted and straight lines, arrows and textboxes. Diagrams are often used to represent simplified models of an object or an operation. They set the thinking and imagination of these objects in motion, to experiment with the models, to apply them to a case in question, or to use them as guidelines for designing an object or operation.
Within the academic discipline of media theory, the study of diagrams has accumulated a significant body of scholarship in recent years, but it also has multiple intellectual predecessors.13 I only want to point to two more recent pathways in
13 For an overview of different key texts and genealogies in diagrammatic research, see Schneider, Ernst, and Wöpking 2016.

25
whose course diagrammatic research can be situated. The first is the convergence of the pictorial and spatial turn in cultural studies, or of Raumtheorie and Bildwissenschaft in the German-speaking context. To move away from a conception of language that limits it to the difference between writing and speaking, authors emphasized the 'notational iconicity’ of writing that is constructed by the spatiality of the inscription surface, by the positional value that signs can take within it and by the space between signs (Krämer 2003). Consequently, pictures were also problematized, among other things, in terms of their spatial structuring, for example, to delimit medial differences between 'dense’ analogue pictures and 'structural images’ and digital images (see Heßler and Mersch 2009). Against this background, the image type of the diagram proves a particular case in point. Moreover, this turn towards the spatial formatting of visual media must also be contextualized in a wider context of media theoretical development during the 1990s that attempted to move away from hermeneutics to studying the materiality of communication and, more specifically, the graphical materiality of inscription (Gumbrecht and Pfeiffer 1988; Lenoir 1998; see Packer and Crofts Wiley 2012). To inscribe upon a flat surface means to simultaneously make use of the trace or 'graphem’ as well as of the blank space that separates the marks. Given the generality of this technique of graphical inscription for the development of cultural expression, it has also been addressed as a basic "cultural technique" (Krämer and McChesney 2003; Krämer 2006; Siegert 2015).
A second recent pathway of diagrammatic theorizing in media studies builds upon the diagram discussion of Gilles Deleuze, Félix Guattari, and Henri Bergson, but also combines their work with that of other thinkers from the American pragmatist context. In fact, the work of the American pragmatist Charles Sanders Peirce has been an influential source for both traditions of diagrammatic theory. For Peirce, diagrams form a major subtype of iconic semiosis (Peirce [1903] 1998, 274). Peirce’s conception of diagrams includes both a sense for their specific thought-experimental capacity (see Peirce [1906] 1998) but also for a semiotic functionalism that could be applied to more mediations and artifacts than what we might usually associate with diagrams. Along these latter lines, some theories of diagrams view them more as autonomous entities or functional concretizations beyond human cognition (Lury, Parisi, and Terranova 2012; Munster 2013; Thrift 2014). The semiotic model that has framed the understanding of diagrams since Peirce lent these theories the conceptual ability to replace the human interpreter by other sign processes and therefore bury or unearth the diagram in various machinic processes. Being understood as operative images with the instructive power to set analytic processes into motion, even in fully automatized contexts, diagrams seem to operate ubiquitously at a level of information technology and there they exemplify a powerful yet peculiar category of cultural expressions: engineered rules of model-

26
making that are not necessarily perceptible (Lury, Parisi, and Terranova 2012). In the following, I will introduce two perspectives of diagrammatic theory in
media studies: a more extensive conception of diagrams on the one hand, and a more human reasoning-oriented conception on the other. What both theoretical perspectives share, among other things, is an important distinction between diagrams and what they call 'the diagrammatic,’ whereby the latter appears to be the more extensive notion and in one of the two perspectives even leaves the visual artifact behind altogether.
1.2.1 Diagrams in the context of human reasoning and intuition
Media philosopher Sybille Krämer defines diagrams as a visual combination of drawing and writing in one schematized image and which can be visually singled out from the running text in which it might be embedded (Krämer 2016, 60); whereas she understands the diagrammatic as a wider category that also includes other visual forms such as tables, notations, graphical models or maps. However, she describes the diagram as "prototypical” for this class of visual form and writes that the diagram’s characteristics might also apply in gradual difference to the other visual forms subsumed under the diagrammatic. Accordingly, she proposes twelve attributes of diagrams,14 but which are general enough to potentially be also applicable to some of the other forms of the diagrammatic. I do not wish to reiterate all of these attributes but will only point to those that will reappear in the chapters that follow.
The first among these attributes is that diagrams are characteristic combinations of image and text. This combination may occur within the image space of the diagram, through a combination of text boxes and graphs or legends and maps, for example, but it may also refer to the fact that diagrams are always embedded in discursive practices in order to be explained (Krämer 2016, 60-61). As already indicated above, the first understanding grows out from a body of work that has critiqued theories of writing as too phonocentric (Krämer and Bredekamp 2003). Instead, writing was addressed as an 'intermedial hybrid’ of image and text, whose mediality is better captured through Nelson Goodman’s concept of notational systems, which are characterized by disjointed marks and finite differentiation (Goodman [1976] 1997). Writing shares with notation the disjointedness of its marks, and the necessary gaps or spacing between them. It can thus be opposed to pictures, which do not have this constitutive spacing, and without being rid
14 These are: image-text-combination, extrinsic materiality, planarity, graphism, relationality, directness, simultaneity/synopsis, schematism, referentiality, sociality, operativity, mediality (Krämer 2016, 59-86, my translation).

27
of iconicity altogether and reduced to spoken text. Instead, writing is said to be characterized by "notational iconicity" (Krämer 2003). This hybridity and notational iconicity was later also applied to diagrams. Importantly, authors believed that this undecidable status between 'scripturality and pictorality’ (Mersch 2008), between saying and showing, and between 'arbitrariness and similarity’ (Krämer 2005), equipped diagrams and other media forms of notational iconicity with a particular performative capacity. They make it possible to reduce interpretative or semantic workload – their reference to something in the world – and already perform mental and manual acts by combining the signs in the space of the image/text. The notations do not need to signal to somewhere else, but they already show their differentiation and potential logical connections in the inscription space and are thereby sufficiently operative for acts of calculating, arguing, mathematical proof and other acts of reasoning. Thus, first the hybrid of writing, then the hybrid of diagrams was characterized by how they offer an 'operational space’ (Krämer 2005).
Mersch (2008) expressed this by stating that cases of notational iconicity require "a transformation from figurality into operationality.” However, this should not be taken as an opposition. The operationality that is determined by the image/text-hybridity of diagrams does not exclude figurality. In contrast, figurality is the result of a process of figuration that must be sought between text and image and manual and intellectual acts. Accordingly, another attribute of diagrams that Krämer (2016, 84-85) mentions is described as "transfiguration.” Diagrams allow a "metamorphosis of the graphical figuration into an extra-graphical constellation” (Krämer 2016, 84-85, my translation). They do not only visualize but, more importantly, allow the viewer to flip from practical and hand-eye-coordinated interaction with an object into cognition and theoretical inference. Connected to this is the fact that diagrams are both descriptive and prescriptive or instructive. Their pragmatic scope does not cease with showing a figure, or with facilitating the semantic question to what this showing refers to, but they also instruct the viewer in how to take directions and make connections or separations. The diagram achieves its purpose once we enact these figures and thereby prove the logical connections are applicable, with the geometric proof in mathematics as a prime example. Moreover, and connecting to Peirce’s definition of diagrams by structural similarity, Krämer indicates that there exists a structural analogy between the instructing diagram and the instruction-performing action (82). The two aspects of transfiguration and simultaneous de- and prescription open a theoretical path that will become important further on in the thesis, that is, when integrating these aspects into a more sociological theory of diagrams by asking how the connections between media in transfiguration and between description and prescription are coordinated.
With these latter attributes of transfiguration and simultaneous de- and

28
prescription, Krämer’s theory captures the above-mentioned function of diagrams of facilitating the cognitive modeling and remodeling of objects. Diagrams describe a general model but also prescribe how this model can be apprehended: by following the orientations and directions of the schematic drawing, transfiguring this movement structure into thinking and other kinds of action, potentially obtaining the belief that this movement is to be trusted, or trying to reconfigure the model and eventually also the diagram. Or as Bauer and Ernst (2010) describe it, diagrams are characteristically involved in cycles of configuration and reconfiguration, for thought experiments to be exercised and for abductive reasoning. This central epistemological placing of diagrams in processes of reasoning is often derived from Kant and his connected concepts of schema and schematization (Bauer and Ernst 2010, 41). Kant introduced the schema as something that mediates between 'intellectual’ and 'sensual’ capacities, between a conceptual category and the phenomenon that appears in perception or imagination (Kant in Schneider et al. 2016, 43-45). The location of the schema is the faculty of imagination and yet schemata are not images, Kant emphasized; they are rather a rule or method of imaginative synthesis. The example he gives is: I can see five dots in front of me on a piece of paper or I can think of the number five. In order for both cases to be related to the concept of five, the rules that I am exercising when thinking the number or seeing the dots must have something in common, be it a rule of aggregation or whatsoever. This rule is the schema and the method or technique of the mind used to deploy these schemata is called schematism. By extension, and to bring this discussion to the empirical interests of this book, the same would need to apply even in cases where the concepts do not seem to have an equivalent phenomenon in perception. What is being referenced by the concept of territory or of epidemics cannot be apprehended as a whole by the human agent through her senses of perception but there can indeed be a schematic mediation between something perceptible and something that partakes in the concept of territory or epidemic, for example, the phenomenon and concept of spread. And this synthesis can be supported by, for example, a map. The connection to diagrammatic research and to the aims of my overall inquiry becomes obvious here but also problematic because it risks becoming a circular description: I can describe a schema through its diagrammatic properties, or I can describe a diagram through its schematizing properties.
Altogether, even though the hitherto presented pathway of diagrammatic research targets the role of diagrams in human mental processes, it starts the epistemological inquiry from a primarily 'aesthetic’ perspective. The second theoretical pathway that I will discuss next follows a similar first interest, but eventually aims at pushing diagrammatic theory beyond the context of human perception and thinking.

29
1.2.2 Diagrams in the wider sense
Compared to Krämer’s discussion of diagrams, which still follows an interest in the empirical visuality and image quality of diagrams, another strand of diagram theory takes the diagram outside the context of human reasoning and inference into a realm of imperceptibility, where spatial forms and processes of generalization are addressed as entities in a posthuman aesthetics before human cognition comes into the picture. Anna Munster’s discussion of the diagrammatic in her work about network aesthetics is one such example (Munster 2013). On the one hand, she describes diagrams as "a kind of icon that resembles not the object itself but the relations necessary for generating an object” (Munster 2013, 24). This picks up on Peirce’s category of diagrammatic iconicity but decouples it from a phenomenal intentionality. Instead, it creates conditions for seeing an object by providing relations in the image that are similar to relations in the viewer’s world, or by providing movement across the image surface that is similar to an embodied memory of movement in the world. From this initial and conditioning similarity there will emerge a phenomenal recognition of an object as a second step. Yet, the question is then if the diagram also has an actual form that can be experienced as such, or if it is entirely situated in the realm of potentiality. According to Munster, the diagram does not have a "form” or "coordinates” yet but only the "function to generate relationality” and thereby "marks and enables the passage from virtual to actual” (29).
To be able to both expressively mark and functionally enable the passage between the virtual realm that comes before any concrete forms and relations on the one hand and the actualized forms and relations on the other hand, the diagram(matic) must have its stakes in both realms. To conceptualize this double stand between form and formative, Munster associates the diagram with rhythms: "The diagram […] rhythmically prepares the space through which the configured image, the choreographed movement, will have then drawn or danced itself out” (29). The reference to rhythm is particularly relevant here. It suggests that the diagram(matic) operates before spatial forms have individuated, on the level of a formatively or genetically more primordial level. Like a rhythm, it brings actualized forms and virtual formatives into a productive cycle. To use a classic example from the philosophy of time consciousness: in the perception of music, a previously heard tone is synthesized with newly perceived tones into the spatialized time of the rhythm as it develops, which means that every tone not only realizes a pre-existing virtual rhythm but also affects the continued individuation of the rhythm. For Munster, the formative rhythm of the diagram(matic) and the actualized form or figure appear in a similar reciprocal looping.
The actualized form of the 'tone’, however, would not be the diagram, but rather a figure in Munster’s terminology, which becomes clearer if we turn to Munster’s

30
description of computer networks. She uses the term "mechanograms” to describe diagrams that allow computer networks to compose: "The grid and network, then, are figures through which the arraying diagram, or more precisely the mechanogram, moves, transitions, and transforms itself” (31). Here, Munster identifies the form of the array and the operational form of arraying with the diagram or the rhythm of computer networks, while the grid and network are said to be figures that help the propagation of the diagram. The individuated figures of grid and network are the notes through which the rhythm plays itself out, but they are not the form/formative of the rhythm. In other words, Munster makes an implicit distinction between the movement form as a whole and the form of a figure that takes on a role within the space that the movement form provides.
Whereas the above-mentioned strand of diagram studies remained interested in the specific mediality of diagrams as a graphical artifact vis-à-vis human intuition and reasoning, Munster seems to aim at an epistemology, or 'onto-epistemology’, that goes beyond human experience altogether. Both the scope of application and the philosophical reference points are therefore different in both presented theories of diagrams. Their shared interest, however, remains the schematization or formative force that is provided by the diagrammatic, and how it plays out in a liminal space between thinking and perception, and between movement and spatial form. The notion of figuration is particularly important in this respect as it holds the promise of moving below the spatial form of the image and bringing a sense of processuality.
Altogether, I share Sybille Krämer’s assumption of a larger spectrum of diagrammatic artifacts which might be connected to each other in the context of a particular field of action and knowledge. Such diagrammatic artifacts are, for example, maps, tables and graphs. Their particular connection is not only figuratively relevant, but it can establish a shared operational space, for example, when a table instructs the drawing of a map. Munster’s wider conception of diagrams, by contrast, is helpful for my inquiry in thinking about the diagrammatic as an operative and generative potentiality that might underly how a specific figurative process becomes a recognizable object of experience and a topic of empirical research. From this perspective, there is no need to restrict diagrammatic research to those figures whose inscriptive materiality is intuitively perceptible. Instead, the perceived figure of a schematic image and the rhetorical figure in speech, for example, might together actualize this virtual diagrammatic process and feed back into it. As far as a minimal baseline for the identification of diagrams is concerned, I understand them as objects that facilitate spatial similarity. Moreover, once we approach the diagrammatic as a process that is involved in epistemic practices, which is the aim of my inquiry, the notion of diagrammatic additionally carries the characteristic of facilitating cycles of configuring and reconfiguring objects of knowledge.

31
1.3 Visualization and inscription
Diagrams play out in topological practice; most significantly, in topological thinking. They are external representations that assist topological thinking not only through their semantic content but through their mediality as surface inscriptions, in which notational marks and blank spaces play a fundamental role. As material resources for thinking, diagrams are also a strong conceptual platform for stressing aspects of embodied cognition – through the multimodality of graphical surface navigation that mobilizes vision, touch and kinesthetic sense – and aspects of extended cognition due to their externalized artifactuality. It therefore does not come as a surprise that diagrams have been widened in scope and philosophical application as much as the concept of 'mind’ has seen extension. However, for the present investigation the question of how one can particularize an analysis of diagrammatic and topological practice arises. As already mentioned above, graphical inscription, in whose tradition diagrams stand, has been described as a "cultural technique" (Krämer and McChesney 2003; Krämer 2006; Siegert 2015). Yet, the meaning of cultural techniques already implies a generality that reaches further than the particularization necessary for the present book. Another way would be to approach diagrams in specific areas of expertise within defined historical and geographical limits, for example, in ancient Greek mathematics (e.g., Netz 1999). Along these lines, historians, philosophers, and sociologists of science especially have tackled the use of diagrams in particular scientific fields. Representative of this development was, for example, the publication of a special issue in Biology and Philosophy on diagrams in scientific practice, edited by Peter Taylor and Ann Blum in 1991 (Taylor and Blum 1991), as well as the seminal volume "Representation in scientific practice" by Michael Lynch and Steve Woolgar (Lynch and Woolgar 1990) that included a whole series of important case studies and reflections about the use of diagrams in the history of science. This work on diagrams in science studies during the 1980s and 1990s did not directly lead to the emergence of a specialized terminology of the diagrammatic in the sense in which it was introduced above, but rather focused on interrogating the materiality and sociological function of chains of inscription and the concept of visualization. Yet, in doing so, this research introduced pathbreaking lines of problematization about the use of diagrams in science through specific ase studies, and which would also resonate in the diagrammatic research in media studies years later. In the following, I want to discuss some of these earlier works on science visualization because they help to emphasize an additional aspect in the quest to particularize diagrammatic processes, i.e. that diagrams do not come alone but are embedded in a bundle of diagrammatic mediations that together determine the scope and validity of an apparatus of visualization.
A popular concept in the history of science that speaks to the importance of diagrammatic processes in scientific practice is that of a 'graphical method.'
32
The graphical method is usually associated with scientific methods of the second half of the 19th to the beginning of the 20th century: from self-recording instruments in physiology, through Marey’s self-proclaimed graphical method and chronophotography, to the graphical tracing of Brownian motion in physics (Daston and Galison 1992; Chadarevian 1993; Bigg 2011). Moreover, the graphical method has been described as belonging to a particular type of scientific rationality, which is characterized by an affirmation of "mechanical objectivity" as an epistemic virtue, by a devaluation of the subjectivity of the scientist, and by a technical rationality that makes graphical representations the 'words of nature itself ’ (Daston and Galison 1992, 116). However, while Lorraine Daston and Peter Galison (1992) initially grouped the graphical method of Marey underneath a regime of mechanical objectivity (see also Snyder 1998), fifteen years later, in their epochal study of changing regimes of objectivity, the graphical method was not explicitly dealt with anymore (Daston and Galison 2007). One might speculate that this change occurred because the graphical method spans too many different scientific contexts, some of which may fall between the two regimes of objectivity that they by then called 'mechanical objectivity' and 'structural objectivity'.
Between the two publications of Daston and Galison was published a critique by Joel Snyder (1998) that is particularly interesting here. Snyder questioned whether Marey’s graphical method really fits the framework of mechanical objectivity, because Daston and Galison had characterized this framework in terms of a struggle between granting agency to a perceiving subject or to a machine. Snyder contended that this does not map easily onto the case of Marey, because Marey had visualized something – graphically or pictorially – that would remain imperceivable to the human senses otherwise. The question of whether a human or a machine was in charge missed the point: "Questions about the accuracy of these data can be resolved only by appealing to other, perhaps even more refined mechanical instruments" (Snyder 1998, 380). Even more: "The visualizations, or graphic data, are a function of the imperceptible movement of the experimental subject and of the precisely regulated, revolving motion of the inscriber" (381). In other words, the graphical data stemmed from a synchronization of different movements and their structural match, from a diagrammatic match in the more extended sense of diagrams outlined above. Importantly, Snyder uses the term visualization to allude to this particular setup and I believe that something profound can be taken from his terminological choice: that by visualization we do not problematize so much a question of accuracy, but the working-together of different media beyond the human interpreter, and which – as an orchestrated apparatus of synchronized tracings – might make something visible that otherwise remains imperceivable. This sense of an extended apparatus of material tracings also connects to Hans-Jörg Rheinberger’s concept of an "experimental system" that specifies different fields

33
of scientific practice (Rheinberger 1998). Importantly for the present discussion, Rheinberger constructs an experimental system out of graphematic elements that he terms "trace-articulations," which obtain the status of "epistemic things" or of "sufficiently stable embodiments of concepts and theories" that can be addressed and further manipulated (295). These articulations might have been generated and will be further interpreted through the assistance of technical devices. Within this technical arrangement of trace articulations, models and representations are not necessarily 'compared to nature’ anymore, but they are "matched" with other models and representations. At the end, "a written table or a printed curve then is only the last step in a series of transformations of a previous graphemic disposition of pieces of matter, which is given by the experimental arrangement" (296).
A more contemporary example of reframing the earlier science studies of representation in terms of 'visualization’ was proposed by Cornelius Borck (2016) for the particular context of the neurosciences. Drawing specifically on Galison (1997), Borck makes a distinction between imaging and writing modes of scientific research. An imaging mode entails "mimetic resemblance," while a writing mode uses the "depiction of measured, recorded or otherwise encoded relations" (Borck 2016, 113). Both of them are addressed by Borck as different modes of visualization in the neurosciences. While the imaging mode is connected to a locationist approach that studies neurological processes in this or that brain region, the writing mode is instead found in functionalist theories, and its "paradigmatic example[s]" are "visualizations in the form of charts with traces generated by the graphical method." The different visualization modes, according to Borck, cannot be reduced to two different types of images, but they point to two distinct kinds of semiosis, with one prioritizing iconic and the other indexical processes. Since the neurosciences rely on visual evidence in any case, they cannot be branched into an anti-visual versus an outspokenly visual subdomain as Galison’s distinction between image and logic might imply. Instead, they are characterized by these different modes of visualization, their differentiation and interplay, the instruments to which they are connected, and the objects and theories they bring into being.
Besides this line of visualization research that historicizes the graphical method in particular scientific contexts, a second strand of visualization research that is of interest for my inquiry is epitomized in the already mentioned volume "Representation in scientific practice" by Lynch and Woolgar (1990). Especially the contributions by Bruno Latour and Michael Lynch speak directly to aspects of diagrammatic theory as it was introduced above. First of all, one finds in this volume a tacit sense of the spectrum of different yet related kinds of diagrammatic media, but under the category of inscriptions, for example, when Latour (1990, 23) writes that "diagrams, lists, formulae, archives, engineering drawings, files, equations, dictionaries, collections, and so on, depending on the way they are put into focus,

34
may explain almost everything or almost nothing" about the making of scientific facts. Second, and this counts especially for Latour, a focus is put on the various kinds of links and linkings that inscriptions in general, and diagrams in particular, provide. In outlining his concept of "immutable mobiles," Latour emphasizes their ability to "link," "re-combine," and "superimpose" different entities such as disciplines, problems, places and times.15 In order to establish a powerful apparatus of visualization, one does not only need the linked graphical surfaces of multiple inscriptions, but also the mobilization of different entities around the constancy of a formal transformation: for example, around the formal translatability between map and territory. "In sum," Latour suggests, "you have to invent objects which have the properties of being mobile but also immutable, presentable, readable and combinable with one another" (26).
Even though a powerful scientific inscription system, for example that of a laboratory or of cartography, may entail a tremendous amount of links between inscriptions, Latour also outlines the special status of the 'final inscription' that stands at the very end of this process and which makes forgotten all those inscriptions prior to it. Already in "Laboratory Life," Latour and Woolgar (1979, 63) wrote: "One important feature of the use of inscription devices in the laboratory is that once the end product, an inscription, is available, all the intermediary steps which made its production possible are forgotten. The diagram or sheet of figures becomes the focus of discussion." In "Representation in Scientific Practice," this trope of the final inscription is again reiterated by Latour by stating: "It is not the inscription by itself that should carry the burden of explaining the power of science; it is the inscription as the fine edge and the final stage of a whole process of mobilization, that modifies the scale of the rhetoric." This dominant interest in the question of scale is peculiar and differentiates Latour’s perspective on diagrams from that of Lynch, for example. Lynch is equally interested in links and linkings, but he is more interested in the "conversation" between different media – in his case: the specific combination of photographs and diagrams in scientific practice (see
15 For example, Latour writes that "The links between different places in time and space are completely modified by this fantastic acceleration of immutable mobiles which circulate everywhere in all directions" (Latour 1990, 32). In another place, he stresses the re-combinational property of immutable mobiles by stating: "One aspect of these recombinations is that it is possible to superimpose several images of totally different origins and scales. To link geology and economics seems an impossible task, but to superimpose a geological map with the printout of the commodity market at the New York Stock Exchange requires good documentation and takes a few inches. Most of what we call ‘structure,’ ‘pattern,’ ‘theory,’ and "abstraction” are consequences of these superimpositions." (45) Finally, in relation to the work of Herbert Simon, he summarizes: "Similar tactics that use diagrams in order to establish rapid links between many unrelated problems are documented by cognitive psychologists" (49, emphasis added in all quotes).

35
also Lynch 1991). Lynch’s interest in how diagrams link up with other inscriptions appears to be a more 'local' perspective compared to Latour’s. The latter aims at describing the making of links that "spread" (Latour 1990, 32-34) and which are maintained beyond a particular instance of connecting different media. However, in doing so, Latour also limits his description to an already abstracted account of general laws of formal consistency, institutionalization, and the centering of power, in which the media specificity of the links revert to the background.
In recalling the history of "Representation in Scientific Practice," Lynch and Woolgar (2014) trace its origins back to an equally famous workshop entitled "Visualization and Cognition" held in Paris in 1983. Retrospectively, Lynch and Woolgar state that for the workshop they "preferred the term 'visualization’ over that of 'perception' or 'observation,' because of the way it connoted practices of making visible" (Lynch and Woolgar 2014, vii). The fact that they eventually decided to use the term 'representation' in the title of the subsequent publication had to do with the fact that they also wanted to include verbal interaction in laboratory settings and how they combine with image practices. In 2014, Catelijne Coopmans and Janet Vertesi, together with Lynch and Woolgar, published "Representation in Scientific Practice Revisited" (Coopmans et al. 2014) with entirely new contributions. Again they decided to stay with representation, but noted in passing the problematization of the term in the previous two decades and that it has been replaced by some authors with 'visualization.' In a footnote they added that "visualization, however, has been associated with its own set of problems, ranging from an uncritical privileging of sight to the 'mimetic . . . obsession for an image as a copy' that draws our attention to particular, singular images, graphs, models, and so on, rather than tracing the dynamic way reference is constituted through multiple conversions of form" (Coopmans et al. 2014, 10). Their solution to the terminological quarrel was to approach both of them as "unsettled concepts," acknowledging that they are "loaded" and to avoid using them as "neutral summary description[s] of the scientific, technical, or medical work" (4).
Before the visual turn in science studies and before or at least in parallel with the research that led to the publication of "Representation in Scientific Practice," authors of feminist cultural and media studies had started to investigate the use of images in science and especially of images of the female body in medicine. In recalling the history of this field of research, Lisa Cartwright (2015) emphasized the work of Rosalind Pollack Petchesky (1987) on "fetal images" and the historical work of Ludmilla Jordanova (1989) on "sexual vision" as pathbreaking. Among the different branches that would later coalesce under the label "visual culture studies" (Mirzoeff 1998), the early feminist works on scientific imaging already had a more particular lens for interrogating the ways that wider cultural dynamics impact the practice of scientists as well as showing the implicit norms of image use

36
by scientists and doctors themselves. The term visualization was not particularly conceptualized in this context but when it was used, it seemed to refer primarily to newer imaging technologies that amount to 'imaging systems’ and involve a number of translations and manipulations. Donna Haraway (1998) summed up a list of these "instruments of visualization" which included "sonography systems, magnetic response imaging, artificial intelligence-linked graphic manipulation systems, scanning electron microscopes, computer-aided tomography scanners, color enhancement techniques, satellite surveillance systems, home and office VDTs" (Haraway 1998, 191). Haraway also stated that these systems give way to an "infinitely mobile vision" that is supposedly "direct, devouring, generative, and unrestricted." The aim of her critical project was not to advocate abandoning vision but to "reclaim" it in order "to find our way through all the visualizing tricks and powers of modern sciences and technologies" (192). However, if one turns to the discussion of particular forms of graphical representations, authors from the earlier tradition of feminist critiques of visual culture also took different lines of argumentation. For example, Anne Balsamo (1998) argued against scientific images that fragment the material body by mapping it onto an abstract functional diagram; while Jordanova (1989, 140-42) discussed the example of a hand-drawn diagram of a pregnant woman much more affirmatively. What seemed to unite many authors methodologically in their criticism was the focus on the context of reception and the situatedness of image use.
Altogether, and despite the unsettled nature of the term visualization, the above-mentioned snippets point to a shared horizon of problematization, against which visualization takes shape as a thick process and 'epistemic machinery' (Knorr Cetina) that cannot be reduced to an image maker, an image, and a viewer. Instead, visualization involves the development of skills and epistemic trust, the translation and matching of forms, media, and instruments, and the mobilization, experimenting and enacting of objects and phenomena as thus-and-so. For the present inquiry, the translation and matching of forms is particularly investigated through the interplay of different diagrammatic media. The objects or phenomena of interest are epidemiological objects such as spread, correlation, containment, and emergence. The development of skills is searched for in processes of standardization, in expressions of competence and capacities; and the building of epistemic trust is found in the narration of genealogies and histories of this or that diagrammatic process and medium, or by presenting their exemplary application. Altogether, these different aspects partake in the making and stabilization of a mode of visualization. In the following, I will turn to a number of other heuristic tools from Science and Technology Studies that further help to delimit how such processes of stabilization come about.

37
1.4 Media of stabilization
At the beginning of this chapter, topological action was outlined as an everyday action and I explained how it entails basic kinds of experience, how it integrates pre-predicative belief, basic psychological association rules, and what in the phenomenological tradition was called passive synthesis. Now this perspective needs to be further specified, inquiring about how specific kinds of topological action become indicative of and specific for a particular group of actors and for a particular group of epistemic actions. Since the overall aim of this book is to study mediations of topological knowledge, specifically the structuration of diagrams and the diagrammatic, and how they are situated, ordered and expressed in the context of epidemiological knowledge claims, I cannot merely reconstruct general accounts of acting topologically. Instead, I must choose a sociological model that pays specific attention to the role of diagrammatic or topological practices and objects in particular groups, and how their linking of practice and object is a situated characteristic of this group. There are multiple models that one could turn to and therefore I do not only choose one model for the present purpose but a set of closely related ones from the area of Science Studies and Science and Technology Studies (STS). The models I wish to present are the theory of mediators when fixating what is involved in technological agency, the theory of knowledge infrastructures in the stabilization of scientific disciplines, the theory of self-authenticating techniques in the emergence of taken-for-granted styles of reasoning, and the theory of objectual practices in characterizing the epistemic culture of groups of researchers.
Most of these models’ development, and why I choose to speak of them as media of stabilization, can only be properly understood against the counterparts of instability, controversy and friction. What is a field of (epistemic) practice stabilized against or from if not the fragility, contingency and controversy of knowledge claims? For example, the approach known as the Social Construction of Technology (SCOT) departed from the premise that technological development entails different interest groups and interpretations or problem/solution-frames and that only by different ways of 'closure’ at the end of this process of controversy and negotiation will we find a stabilized technical artifact (Bijker and Pinch 1987). In the approach known as Laboratory Studies we find the assumption that the interpretative flexibility of scientific practice is not only reduced by the commitment of the scientist to a particular idea or theoretical model but that it is importantly stabilized by the tedious inscription work during data collection and distribution. In the initial research that led to Actor-Network-Theory (ANT) the "frontlines" between programs and anti-programs were emphasized in order to flesh out the in/stability of disciplinary mechanisms (Latour 1991) or that of controversies involving multiple stakeholders and affected communities (Callon 1986). The study of mediation in all these contexts has therefore been closely tied to the question of how, despite

38
differing interest groups, action programs or controversies around an innovation, discovery, or issue, stabilization can occur. However, rather than searching for this stabilization in a consensual agreement or convergence of interests as traditionally construed, the authors discussed below turn to the materiality of practice as the main medium of stabilization.
Moreover, in ANT stabilization was not only problematized vis-à-vis controversies and interpretive flexibility, but it was also related to the question of how agency is objectified despite a potentially widely distributed network of actors and actants, and a potentially proliferating list of transformative relations between entities in the network. Already in the title of ANT the actor-network points to the figure/ground game and contingency of objectifying that which acts: One can look at a network of agents as that which comprises an agency, or address the network as a whole as an actor itself. Equally, to recall another common take on agency, one can look at a subject that uses certain means to act upon an object, or one can address the means as something that by its transformative linking makes entities into subjects and objects. The relation can act as that which makes the relata, but then the relata are themselves relations between further relata that they make and so on and so forth. In other words, transformative relations "proliferate" (Latour 1994) and the empirical question becomes which relation has been selected or elevated as the one granted with agency in this or that context. Especially technical objects have received a lot of attention from this perspective, where the agency of a technique is not merely located on the side of a human subject that simply uses passive tools and means, or on the side of an instrument either. Instead, a technology is considered to be a stabilized form of agency, where the proliferation of potentially transformative relations has been stalled and fixed in an objectual order in a specific way. Accordingly, Latour famously coined the phrase that "technology is society made durable" (Latour 1991).
Finally, it needs to be mentioned that the idea of stabilized objects or objectifications (of means, research objects, matters of concern) within a wider field of epistemic practice has been criticized in later developments of ANT (Mol 1999, 2002; Dugdale 1999). Departing from the presumably stable objects in a field of knowledge, authors such as Annemarie Mol have emphasized that these objects are enacted and performed in different ways. For example, the object of a disease or certain indicators such as specific blood levels are not the same in all contexts, but they are enacted differently in the laboratory, by statistics, or in a clinic. On the one hand, one might be led to distinguish these settings as different epistemic practice contexts or different epistemic cultures with their own ways of rendering or relating to objects. On the other hand, these different object enactments are also not miles apart, but they may be sequenced or otherwise entangled in a certain diagnostic context. Thus, rather than emphasizing stability, the multiplicity of object versions

39
is highlighted, making way for a "multiple ontology." The question of how much stability one permits an entity to have vis-à-vis the drawing of boundaries around specific epistemic practice contexts will eventually also affect my understanding of the diagrammatic. On the one hand, the diagrammatic will be approached as something that stabilizes acts of proving, inferring, reasoning, etc. On the other hand, this stability will be crafted as something that lies within a dynamic cycle of affirmation and revision, of configuring and reconfiguring, through which the diagrammatic remains in transformation, or otherwise ceases to be.
Altogether, different analytical entry points and levels of objectification can be distinguished in what follows: Firstly, an entry point that presumes the existence of a detectable human group of knowledge workers, where one follows their objectification of research objects, objects of knowledge, or 'epistemic objects,‘ that are connected to specific epistemic practices and situated within particular epistemic cultures. In fact, the relationship between epistemic practice and epistemic object might become one of the key elements that characterizes an epistemic culture as such and such. Or, secondly, an objectification of that which holds a variety of knowledge workers together beyond the tight coupling of epistemic practice and epistemic object, and without using a collective denominator such as 'culture,' but rather objectifying the social structure as a collective 'style' or 'knowledge infrastructure.' And thirdly, technical objectifications, where one presumes the transient existence of a stabilized technology whose scope one unfolds by following the different entities that have been enrolled and potentially blackboxed in this technological objectification. After outlining these approaches in more detail, I will come back to the different analytical scales of each of them and how I relate them.
1.4.1 Mediator and intermediary
The term 'mediator’ is borrowed from Actor-Network-Theory (ANT). Even though the concept is used by different authors affiliated with ANT and its origins are usually traced back to a study by Antoine Hennion (Schüttpelz 2013), I will concentrate on Bruno Latour’s understanding and application of the term in my present inquiry. For Latour, as well as Hennion before him, mediators are distinguished from intermediaries (Latour 1993, 76-82; Latour 2005, 37-42). An intermediary is that which transmits accurately without any transformation involved, while a mediator 'interrupts, transforms and helps something else to emerge’ (Latour, Cuntz, and Engell 2013). At first sight, this seems to be a media theoretical commonplace and links to other established critiques of media that have equally emphasized the transforming role in opposition to what is too quickly perceived as immediacy or directness. However, I believe that the distinction between mediator and intermediary plays out its strength in a diachronic perspective, for example in

40
the analysis of technological development. As with most terms of ANT, it is more a heuristic than a general theory (Schüttpelz 2008), and, I believe, a heuristic that is particularly steered towards an analysis of the changing status of mediating entities over time. An example from Latour (1994) would be a speed bump that is installed to discipline drivers to slow down and which starts as if it were a simple means but eventually becomes a mediator that is brought to court. There is a risk of removing the concept of mediator from these context-specific developments and reducing it to a non-transient property of being 'transformative’ as opposed to non-transformative transmitters (notwithstanding that this is an oxymoron). Instead, for the diachronic perspective it seems to be more helpful to concentrate on the distinction and passage between intermediary and mediator or vice versa, and how agency gets redistributed in this process. Moreover, for an object to obtain the status of an agent, and more specifically that of a mediator, in the framework of ANT it must be able to own the property of being transformative for a series of related and sometimes competing actions and action potentials, and it must exercise its agency across material-semiotic distinctions. The speed bump could become a mediator because it is an object that works with the action of driving slow in order not to harm the car, with the action of disciplining without spending too many resources, but also with the transformation of the street’s material and with its figuring in symbolic traditions (‘a laying policeman,’ as Latour’s informants call the speed bump). It is only through the network of practices, semiotic processes, material objects, and their relations, that the mediator obtains its power – in this case for disciplinary action.
To move away from this example and closer towards my own area of interest, I will concentrate in this book on diagrammatic mediators, which makes the scope of the term narrower than in Latour’s usage. In the case of diagrammatic mediators, a task and practice become objectified as a mediator by virtue of taking a transformative role in inscription systems, in the quest for scientific visualization, in processes of configuration and reconfiguration, and both on the material level of the surface and in trans-figurations beyond the surface. A knot of potentially transformative relations obtains or fails to obtain the status of a diagrammatic mediator depending on how it enrolls the wider network of graphical and 'extra-graphical’ practices with their own material and figurative specificities. For example, in a cartographical visualization system, a numeric geo-coded table might obtain the status of a diagrammatic mediator because it instructs the generation of a map and becomes the prioritized interface of programmers and 'interoperable' service developers. Or the map might obtain this status instead because, for example, it is connected to the presumably creative and generative perception of patterns by human agents. As these examples show, my use of diagrammatic mediators is not only restricted to a more confined area of application, but it also differs from

41
the use of the term mediator in the work of Latour and his interpreters due to the number of connections that I consider empirically. Rather than mapping all kinds of connections by which a mediator obtains its central and sometimes obfuscating role in a network of potential actors, I focus only on those connections that extend the operational and figurative space of diagrammatic artifacts or of diagrammatic processes in the wider sense discussed above.
The extensiveness of the concept of mediator eventually becomes an empirical matter. In an article about the art of Rembrandt, Latour writes, one must "multiply the mediators – going from the quality of the varnish, the type of market force, the name of all the successive buyers and sellers, the critical accounts evaluating the painting throughout history, the narrative of the theme and its successive transformations, […] and so on in a bewildering gamut of heterogeneous elements that, together, composed the quality of a Rembrandt” (Latour 1998, 422). For Latour, then, mediators can be a wide range of things and one of their primary heuristic functions is to emphasize that agency cannot be reduced to one element – for example, a genius painter. At the same time, the status of mediators on the level of Latour’s ontological project seems to shift between that of a primitive and that of a complex. They are taken to be serious as historical objects in their own rights that have obtained a powerful position and blackbox other elements and relations, while the analyst’s task is to look at them closely and unfold the whole range of other mediators that they obfuscate. However, the analyst will also face the difficulty of deciding where to draw the line and which mediators to select. In this context, Erhard Schüttpelz (2013) has spoken of an irreducible circulation of personal, material and technical mediators, and that the attempted reduction to one of these poles always brings about one of the others and so on and so forth. Conversely, the empirical task becomes one of analyzing how this flux has been fixed in the accounts of one’s interlocutors, texts or other sources. Human members of the field in question are aware that there are transformative mediations involved and they can provide their own list, against which the theorist can weigh her own. Two methodic and methodological calls follow from this. First, the call to reconstruct how the assigning and obtaining of a mediator or intermediary status has changed in the expressions in the field. Second, to self-reflect as researcher on how the research was initially started by the identification of an intermediary or mediator status. In many cases, the gesture of analyzing mediators as opposed to intermediaries always already starts from the identification of a reduction and from the identification of 'misinterpreted’ immediacy. For example, Latour’s intervention into the myth of a heroic agency of Rembrandt already starts from the knowledge that these reductions have taken place, that people regularly refer to Rembrandt as the genius human who alone had the agency of creating works of art. The reduction is therefore not one that was inductively discovered in the study of Rembrandt’s
42
working context, but the identification of the reduction stems from the analysis of another field. Methodologically, one can be sensitized to reduction from the analysis of other fields, but then must turn towards the question of how these reductions take shape within the field under observation. This also means granting reductions their proper ontological status. On the one hand, objects "gain reality" (Latour 1991, 108) through the extended assemblage and practices they entail. On the other hand, it is part of the dynamics of a field of knowledge that objects also exist in more empty ways and as reductions.
1.4.2 Knowledge infrastructures, styles of reasoning, epistemic cultures
While mediator objects 'stabilize’ the otherwise unstable proliferation of transformative relations in a distributed agency network, and even though there are expectations involved on the analyst’s side regarding the existence of such mediator objects, the concept does not depend in a strong sense on the presumption of a particular social grouping in which this mediator obtains its role. A different perspective on epistemic agency, or the agency of knowledge production, would be to affirm this understanding of the distribution of agency across various entities and material-semiotic registers, but rather than following how it is collapsed into centralized mediators, one attempts to mark the boundary of this network and approach it as a specific constellation or infrastructure of knowledge that has reverted to an always operative but implicit background. Along such lines, Paul Edwards (2010) proposed the concept of knowledge infrastructures in a study on climate science. For Edwards, "knowledge infrastructures comprise robust networks of people, artifacts, and institutions that generate, share, and maintain specific knowledge about the human and natural worlds” (Edwards 2010, 17). His research revolved around how, in the face of climate change, climate observing systems were reworked to transition them from their initial slow but detailed processing of long-term data to a quicker and more operative technology typical of meteorology (12-16). In addition, to establish global climate observing systems, various national and historical records had to be made interoperable. Edwards deploys the terms "data friction” and "computational friction” to accentuate the laborious processes that were involved in transitioning climate science infrastructure into its contemporary form.16 On the one hand, Edward’s interest in friction connects to the long-standing
16 Edwards writes that "expenditures of energy and limited resources in the calculation of numbers can be termed computational friction,” whereas "'data friction’ refers to the costs in time, energy, and attention required simply to collect, check, store, move, receive, and access data” (83-84). Data friction becomes apparent wherever the movement of data – "from one place on Earth to another, from one machine (or computer) to another, or from one medium (e.g. punch cards) to another (e.g. magnetic tape)” — is hindered. Moreover,

43
tradition in STS to account for the controversies and struggles that had to be stabilized for a social group, technical object or field of practice to hold together. On the other hand, his two types of friction provide him with an empirical anchor for further specifying the practices that make up knowledge infrastructures, such as the "programming, operating, debugging, and repairing [of] computers" (103) or the "collecting, checking, storing, moving, receiving, and accessing [of] data" (84). Friction is therefore a heuristic tool used to root the assumption of the 'epistemic infrastructuring’ of a social group – in Edward’s case: a scientific discipline – in particular empirical instances.
A related concept, but with a different social scope, is Ian Hacking’s discussion of styles of reasoning (Hacking 1992; 2002, Chapters 11 and 12), by which he extends earlier concepts in the history and philosophy of science such as Ludwik Fleck’s "thought styles” and 'styles of scientific reasoning’ by Alistair Crombie. For Hacking, styles of reasoning are not logical methods such as deduction and induction, but instead they are ways of reasoning about truth-or-falsehood (2002, 168). For example, Hacking identifies a laboratory style of reasoning beginning with Boyle or an “algorismic” (185) style of reasoning beginning with Arabic Algebra. Statistics is also a style of reasoning and Paracelsus’ similitude method is an extinct style of reasoning. Hacking presents a number of defining characteristics of styles of reasoning, for example, that they create a list of new objects and that they come with ontological debates (what is the nature of this and that object). For the present discussion, the most important aspect of styles of reasoning, however, is that they emerge due to what Hacking calls "self-stabilizing techniques.” Again, as in the models presented above, an epistemic community or community of practice under observation includes differing opinions at first and it is the self-stabilizing techniques that eventually consolidate the group and give rise to the specific style of doing things 'just right’. These self-stabilizing techniques include, according to Hacking, different processes that create a web of stability, a "mutual adjustment of ideas [...], material [...], and marks (including data and data analysis)” (193).
Hacking’s concept of 'self-stabilizing techniques’ takes a middle position between an interest in habituated technical knowhow on the one hand and an interest in the materiality of equipment and inscription on the other. A property of the style is that one doesn’t look at its technicality in great detail but simply accepts it as the right way to do things and often ignores its sociohistorical specificity: "Each style has become what we think of as a rather timeless canon of objectivity, a standard or model of what it is to be reasonable about this or that type of subject matter. We do not check
computational friction and data friction usually go together because "computation is one kind of operation on data” (84). Beyond the 'calculation of numbers’ as the first definition of computational friction, Edwards later adds further practices to this type of friction, such as the "programming, operating, debugging, and repairing [of] computers” (103).

44
to see whether mathematical proof or laboratory investigation or statistical studies are the right way to reason: they have become (after fierce struggles) what it is to reason rightly, to be reasonable in this or that domain” (188). Ludwik Fleck once wrote that concepts allow a "habituation of thinking” ("Denkgewöhnung,” Fleck 1935, 52) and in a similar way, Hacking’s style of reasoning seems to be based on a habituation of doing through self-stabilizing techniques. Hacking’s theory of styles has been criticized on different grounds; for example, for not making convincingly clear how he prevents some kind of a relativism (Kusch 2011). However, the same critics also point out that Hacking has indeed hinted at a theoretically possible solution for preventing such relativism, but that some of his examples seemed to contradict this solution. The theoretical solution to prevent relativism could be that styles are not exclusive and incompatible, but instead can be combined, whereas in the case of relativism one would assume the incompatibility of perspectives. At this point I believe one can eventually link Hacking’s account back to some of the previously mentioned authors from STS. The possible combination of styles corresponds in my opinion with the idea of Annemarie Mol, that the multiplicity of objects and enactments does not mean that they exclude each other but that they are often entangled. Both object enactments and styles of reasoning must be thought of not as solids all the way down but as just temporarily stable enough.
Finally, a third position that relates to the two previous ones is Karin Knorr Cetina’s conception of scientific practice as being comprised of different "epistemic cultures" that have cultivated their own "epistemic machinery" (Knorr Cetina 1999, 2005; Knorr Cetina and Reichmann 2015). Knorr Cetina defines epistemic cultures as "cultures that create and warrant knowledge" and as "amalgams of arrangements and mechanisms – bonded through affinity, necessity, and historical coincidence – which, in a given field, make up how we know what we know” (Knorr Cetina 1999, 1). Her conceptual intervention continues a long-held debate in the history and social studies of science about the possible unity or disunity, comprehensibility or incomprehensibility of different scientific disciplines. Following an understanding in which science is differentiated according to "distinctive traditions of teamwork and publication, specific epistemic strategies, different meanings of the empirical, and distinctive notions of reality," it appears obvious to Knorr Cetina that "science and expertise are obvious candidates for cultural divisions." However, the notion of an epistemic culture aims at a different level of analysis and tries to circumvent the boundary of this or that scientific discipline and profession. The notion of an epistemic culture "is not pitched at the level of whole disciplines but at the level of research fields" and it is possible "that the differences between some disciplines are not as substantial as the differences between subfields of a single discipline" (Knorr Cetina and Reichmann 2015, 876).
When studying an epistemic culture or epistemic enculturation, two settings

45
are particular exemplary for Knorr Cetina: the laboratory and the experiment. One could approach these two settings as different types of organization; however, Knorr Cetina points out that the heuristic of organization would not do them justice. The concept of organization reduces too many of the relationships that are at play in a particular setting to people, structures and technical competence. Such a framework thereby ignores the ongoing work to create and manipulate objects and problems that are crucial for holding the epistemic cultures of the laboratory or the experiment together. Especially this "object-centeredness" (874) of epistemic cultures is therefore a crucial characteristic for Knorr Cetina, and it is important to acknowledge that the object is not fixed but maintained, cared for and refined. In other places, Knorr Cetina has elaborated further this "objectual" character of epistemic practices (Knorr Cetina 2001). Most importantly, she distinguishes epistemic practices from mere routines in the way that epistemic practices are "internally differentiated," which includes different possibilities for how subjects and objects become related in this practice and reflected upon, and thereby keep the epistemic object open for experimentation.
Moreover, epistemic cultures are not limited to the sciences. They can be found in "expert settings outside of the scientific laboratory," for example, in the context of Wikipedia (877). In fact, it is a crucial point of Knorr Cetina's proposal that epistemic cultures exist in multiple forms across society – as the 'cultures of different knowledge settings – something that the entrenching and macroscopic concept of the knowledge society makes difficult to see.17 At the same time, this does not exclude that macro-scale norms influence how an epistemic culture turns out to be. Rather, the knowledge society provides a "general knowledge-environment,” develops policies, promotes or inhibits certain epistemic developments, and "provides a sort of scaffolding for epistemic cultures" (Knorr Cetina 2005, 66). This larger-scale scaffolding is equally contingent and sometimes Cetina refers to it as "knowledge cultures” and at other places as "macroepistemic cultures” (Knorr Cetina 2005, 73; Knorr Cetina and Reichmann 2015, 878). Either way, it comprises "the knowledge attitudes, institutional arrangements, and knowledge policies of different societies" (Knorr Cetina and Reichmann 2015, 878). She regards the concept of the risk society as exemplary for models that exist on this larger level of a
17 "The dominant definition of a knowledge society is economic; it states that knowledge has become a productive force that increasingly replaces capital, labor, and natural resources as central value- and wealth-creating factors (e.g., Bell, 1973; Drucker, 1993: 45). Analysts may also emphasize the presence and role of information infrastructures [...] But a knowledge society is not simply a society of more knowledge and technology and of the economic and social consequences of these factors. It is also a society permeated with knowledge settings, the whole sets of arrangements, processes, and principles that serve knowledge and unfold with its articulation. Epistemic cultures are the cultures of knowledge settings" (Knorr Cetina 2005, 65).
46
knowledge culture or macroepistemic culture. That knowledge of risk is valued, and policies are constructed accordingly, is not particular to a more confined epistemic culture, but can be the case across different ones (879).
By comparison with the previous concepts, one can recognize some similarities between Knorr Cetina’s concept of epistemic culture, what elements it contains and how it stabilizes, and the concepts of knowledge infrastructures and styles of reasoning. One of the similarities is the already mentioned 'object-centeredness’ of epistemic cultures that resonates with Hacking’s understanding of ontological friction that precedes the stabilization of styles of reasoning. Another similarity is the way that epistemic cultures stabilize immanently through some kind of infra-structure, by which they bring together the everyday performance of different people and non-human entities into "taken for granted” lifeworlds (Knorr Cetina and Reichmann 2015, 874). According to Knorr Cetina, epistemic cultures "tend to have rich and potentially complex internal environments, with warped geometries that result from their turning or curving in upon themselves and a tendency to impose and expand their own structures and concerns." These infrastructures envelop the way in which epistemic subjects and epistemic objects co-constitute in practice or what Knorr Cetina calls "material regularities” (874).
The general definition of epistemic cultures as creating and 'warranting' knowledge opens the way, therefore, for a double perspective: On the one hand, this warranting is engrained into the lifeworld’s taken-for-grantedness and does not have to be reflexively entertained by those participating in the epistemic culture. It is the task of the social scientists to trace the regularities that make for this warrant. On the other hand, the epistemic warrants can indeed be pointed to by informants in the field and in a reflected manner, in which case they might not only speak as participants of their epistemic culture but draw from models that exist across epistemic cultures and as part of the larger knowledge culture. For example, as we will see in the case studies below, informants might assign epistemic warrants based on their belief in the inferential power of visualization technology or in the valuation of collaborative, distributed work.
Altogether, all three authors – Edwards, Hacking, Knorr Cetina – approach their area of interest with the assumption of a bounded group of knowledge workers or a socially distinguished form of epistemic agency: a scientific discipline in the case of Edwards, a collective style of reasoning in the case of Hacking, and an epistemic culture in the case of Knorr Cetina. Moreover, all three authors deploy their own particular terminology to indicate how an entangled complex of material-semiotic processes and objects stabilize these groups or forms of epistemic agency internally. These are 'knowledge infrastructures' in the case of Edwards, 'self-authenticating techniques' in the case of Hacking, and an 'epistemic machinery’ and internally differentiated 'epistemic practices' in the case of Knorr Cetina.

47
The concepts of mediators, of knowledge infrastructures, of styles of reasoning, and of epistemic culture help me to emphasize different aspects and analytical scales in the case studies that follow in the next chapters. A mediator-oriented analysis can highlight how the status of graphical media or media of inscription changes from being a mere transmitting tool without further problematization and attribution of agency to one whose transformative role is taken into account. The concept of knowledge infrastructure, and its related terms of computational and data friction, helps me to emphasize the specificity and thickness of that which stabilizes a field of knowledge work from the inside, by not only arranging a diverse list of entities, but also by having undergone a process of effortful negotiation and habituation. This specificity and thickness of knowledge infrastructures will help contrast them from more reductive references to generic knowledge 'technologies.’ In a similar way, styles of reasoning are specific and not easily reducible elsewhere, but they bring in their heuristic strength through the intuitive notion of 'style.’ The concept is handy in both sensitizing myself to and estranging myself from accounts that express distinctions and alliances in the realm of epidemiological knowledge based on stylistic similarities, which are sometimes taken to mean merely the formal resemblance of images of data visualizations, for example between the examples from the history of epidemiology and contemporary information design. The more extensive understanding of style that Hacking proposes helps to thicken and question such comparisons. Finally, an epistemic culture is very flexible in scale and may cover the same social and temporal extensiveness as a knowledge infrastructure or a style of reasoning in that it stabilizes how groups develop their own ways of producing and warranting knowledge claims over time. At the same time, an epistemic culture may also be deployed to describe smaller scales in that it is specific to a limited scientific research project. However, especially for the case studies that are presented towards the end of the book, I find the term the most useful in connection with what Knorr Cetina has called macro-epistemic cultures. An epistemic culture may deploy models of a macro-epistemic culture to make sense of its own knowledge claims, while specificities of an epistemic culture may be reduced and taken out of context to be acknowledged at the level of macro-epistemic culture. In addition to the concept of epistemic culture and macro-epistemic culture, Knorr Cetina also provides another important concept for the case studies that follow: that is, her emphasis that epistemic practices continue to enact different ways of connecting epistemic subjects and objects over time and keep the object open for refinement. This internal differentiation and openness with regard to its object connects her theory of objectual epistemic practices to the cycle of configuration and reconfiguration that characterizes a diagrammatic process. Conversely, it makes it necessary not only to inquire about the epistemic object that a diagrammatic process configures and reconfigures, but also how in

48
this process the epistemic subject positions are configured and reconfigured.
1.5 Diagrams as media of coordination
To my knowledge and at the present state of writing, diagrammatic approaches in media studies have not yet been explicitly integrated with the before-mentioned concepts of mediators, knowledge infrastructure, styles or reasoning and epistemic culture in science studies and STS. There have been mutual hints on a number of occasions, but they have remained implicit or only mentioned but not further detailed. In the context of media studies, it is often through a reference to the work of Latour that bridges between the conceptual traditions are tentatively hinted at. For example, Sybille Krämer mentions Latour’s work on immutable mobiles when discussing the materiality of diagrams (Krämer 2016, 63). In her reading, Latour emphasizes the 'exteriority of the diagrammatic’ in showing that books, maps, tables, forms, laboratory reports etc. are small enough to be easily movable across distant geographies, and that via their surface of inscription they provide for stable forms to resist quick dissolution. In other words, from the perspective of a philosopher of mediation such as Krämer, models from STS are brought in to stress an externalist reading of diagrams. Dieter Mersch (2008), on the other hand, referenced Latour’s concept of a chain of inscription when elaborating his concept of image logic. It allowed him to emphasize that an image leaves its optical referent behind in the multi-step process of (digital) visualization, making it even more necessary to distinguish between making seen or becoming visible on the one hand, and the medial specificity of the image on the other hand.
One can also find an indirect link between ANT and diagrammatic research in Munster’s (2013) work on diagrams and the diagrammatic. She develops her take on diagrammatics via the American pragmatists James and Peirce and the poststructuralist models of diagrams by Deleuze and Guattari. Latour especially is called on whenever the relationality of human and non-human entities is problematized rather than for the direct purpose of diagrammatic theorizing. Yet one can reconstruct a connection between diagrammatics and ANT at the point where Munster discusses the distinction between sociality and society in the work of Gabriel Tarde (Munster 2013, 119-21). Through Latour’s reception of Tarde Munster understands sociality as an underlying flow of forces, which for example works through mimetic contagion, but which has not yet been stabilized into an organized or structured society. Nevertheless, there exists a collectivity or sociality at this level and therefore some form of stability without being a structure and for which Munster prefers to use the term 'congealing’. She interprets Latour such that for him this underlying sociality can be captured by the concept of actor-network. It seems to be this two-level understanding of the social which Munster wishes

49
to adopt for her theory of diagrams and the diagrammatic. The diagrammatic is conceptualized to work on a level of generative relationality without yet being an image of structure and therefore without being a diagram in the narrower sense of an empirical form. Altogether, ANT and diagrammatic meet in the work of Munster in the assumption of a generative relationality that establishes cohesion without being reducible to the stability of a structure.
On the side of STS, diagrams and diagrammatic media in the wider sense such as maps and tables have been repeating empirical objects of interest, but their theorization does not usually link up with diagrammatic research in media studies. Nevertheless, one finds theorizations of diagrams that offer some implicit similarities to the way diagrams are theorized in media studies, for example, in one of the founding texts of infrastructure research by Susan Leigh Star and James R. Griesemer about boundary objects (Star and Griesemer 1989). What these texts from STS bring to the fore more strongly than texts in the tradition of media studies, is the coordinating function of diagrams among a group of actors. Because I have already discussed some of the diagrammatic theories in media studies above, in the following I will primarily focus on this question of diagrams as coordinating devices in the tradition of STS. Besides Star and Griesemer’s interest in diagrams as boundary objects and those who build upon them, I will also briefly touch upon the ideas of Edwin Hutchins on diagrammatic coordination in the context of navigation at sea. The focal point of my discussion in the present subsection is to emphasize the objectual character of coordination. Compared to the analysis of stabilization, which can approach diagrammatic processes as part of a field’s structure, scaffolding or milieu, my understanding of epistemic coordination follows the tradition of analyzing boundary objects and highlights the objectification of diagrammatic processes.
1.5.1 Diagrams as coordinating boundary objects and conscriptions
Star and Griesemer (1989) mention maps by which the observed knowledge infrastructure – in their case the collection of a museum – and its diverse interest groups are held together without resolving all their tensions. The power of boundary objects, and in this case of a map, lies in offering a certain margin between fixation and flexibility, between disciplining and appropriation of knowledge practices. In the example of Star and Griesemer, the mapped contour of the State of California that describes the scope of the museum collection worked as an epistemic agreement between the different interest groups, while deciding what to inscribe within these territorial boundaries still remained each group’s choice. Star and Griesemer abstracted this semi-stabilizing function of the boundary object of the map further by stating that it can mediate between the general and the specific,

50
between apprehended particulars and conceptual universals. It is precisely this function of maps that has also received a considerable amount of theoretical interest in diagrammatic research in media studies and has been proposed as a function of diagrams more generally; that is, the power to schematize. Since in diagrammatic research, the epistemological concepts of schema and schematization are often derived from Kant and because Latour has chosen to position his perspective as explicitly anti-Kantian, however, the concept of schematization seems to be inadequate for establishing a bridge between both traditions of theorization.
Instead of using schematization as the bridging concept between diagrammatic research in media studies and in STS, the notion of coordination may be more fruitful. Coordination complements the stabilization function discussed in the previous section, but it is not entirely congruent with it. It seems to me that co-ordination, with the Latin root of 'ordinatio’ meaning order or structure, refers to a type of action that is more directly connected to the topological and diagrammatic meaning that I have discussed above. Co-ordination semantically entails the association of two structuring actions or entities, which has also been defined as one of the meanings of the diagram. However, tracing the notion of coordination in the work of the STS scholars mentioned above is not as straightforward. Although the term is often used it also comes with theoretical baggage and has resulted in some reservations. One of the reasons might be that coordination still has a cognitive or mentalist ring. Another might be that it carries some hierarchical weight, where despite the prefix 'co’ one imagines a single actor – be it an apparatus, a set of rules, a manager, or whatever overarching or top-level agency – coordinating 'lower-level’ actions; an assumption that runs against the grain of the flat ontologies of ANT, for example. Nevertheless, we can find some hints of coordination if not in the work of Latour and Star and Griesemer then in the studies of third authors who have interpreted and adopted the STS accounts mentioned above.
For example, Kathryn Henderson (1998) studied how prototypes and drawings mediate the design and production process in engineering communities. Because they are the object of different readings and interpretation by various groups in the organization, she claims that these artifacts can be a source of conflict, but they can also "facilitate coordination" once they circulate among higher-ranking members of the organization (Henderson 1998, 5). She goes on to connect this understanding to Star and Griesemer's notion of boundary objects, stating that "Leigh Star first raised the issue in science and technology studies by introducing the term boundary object for material objects that facilitate the coordination of scientific work because they can be interpreted in a tightly focused way by specialists while being simultaneously readable by generalists" (5). However, Star and Griesemer do not actually speak of coordination in their original text; nonetheless they model the boundary object as something emergent in the co-working of different parties. Surely, this is something

51
that aligns their work, but not using the term 'coordination’ might have been purposeful in order to avoid any of the misleading meanings mentioned above. After all, the concept of boundary object was precisely a response to having realized the intermediary zone or tradeoff between too little and too much disciplining, or, as Star and Griesemer phrased it: "the allies enrolled by the scientist must be disciplined, but cannot be overly-disciplined” (Star and Griesemer 1989, 407). At the same time, the fact that Henderson read coordination into the original text by Star and Griesemer also cannot be too far off the mark since Henderson's text was published in a book series of which Susan Leigh Star was one of the series editors.
Eventually, a conceptual interest in the term "coordination" does appear in Geoffrey C. Bowker and Susan Leigh Star’s analysis of the International Classification of Disease (ICD) roughly ten years after the study on boundary objects (Bowker and Star 2000). There, the two authors write that the ICD functions "as an object that facilitates the coordination of work among multiple agencies – an agent for distributed work and cognition" (Bowker and Star 2000, 135). The reference to distributed cognition is an important link to another research tradition about coordination, and to which I will return further below. But first I want to point out how Bowker and Star themselves sketch their understanding of coordination and whether or not boundary objects coordinate. In their ICD analysis, they name "list making as foundational for coordinating activity distributed in time and space" and consider these lists as part of a "genre system" of communication, which does not only provide a surface for inscription but helps "complex organizational structure and infrastructure [to] evolve" (138). Importantly, they emphasize that such an understanding of genre 'system' is fertile because it simultaneously turns to the "abstract top-level notion of the genre" and to "the more concrete local variants [...] such as the list of diseases, the mortality rolls, and the metadata coordinating lists." By extension, one can read this passage as an indicator that the authors see coordination itself as a process that is realized in this stitching of abstract and concrete inscription devices, which has also been a fundamental property of boundary objects. And indeed, Bowker and Star also describe "the ICD as boundary object. Through open recognition of the tension between the local and the international-universal, the ICD has been continually tested and its limits set. Boundary objects do not claim to represent universal, transcendent truth; they are pragmatic constructions that do the job required" (152). Although they still do not mention coordination explicitly as a property of boundary objects – for example, in the theory section of the same name (296-298) –, it seems that boundary objects and coordination are two heuristic perspectives on the same empirical object. In their status as boundary objects, artifacts mediate a conflict across social groups by integrating or absorbing dissensus; in their status as coordinating genres they align

52
distant actors within a certain margin of variance.18
1.5.2 Diagrams as media that coordinate relations of structural similarity
The above-mentioned reference by Bowker and Star to the notion of ‘distributed cognition’ can now be picked up again. Especially the cognitive anthropologist Edwin Hutchins and his work "Cognition in the Wild" comes to mind in this context, as Hutchins himself cited work in the tradition of STS and ANT as an inspiration (Hutchins 1996). Perhaps Bowker and Star had Hutchins’ analysis in mind when choosing to frame coordination as a process for distributed work and cognition. As already mentioned, the term 'coordination’ seems to be frequently used in the cognitive sciences and might risk mobilizing a distinction between top- and lower-level processes or a schema of downstream cognition. What is particular about Hutchins’ theory, however, is that his goal is to distribute cognition across collective organizations, human individuals and artifacts; in other words, to move beyond internalist models of cognition. His theory thereby also holds the potential to approach coordination in a more horizontal or ontologically 'flat’ fashion.
Hutchins’ case study is the process of navigation onboard a Navy ship and how it involves multiple actors and representations to work effectively. In order to describe an organized yet complicated task such as navigation at sea and how the different people involved work together, how they communicate, use instruments, draw from previous experience etc. – all of this becomes conceptualized by Hutchins’ distributed cognition approach in terms of how representational states are allowed to propagate across the organization from one medium to another. "I will refer to a configuration of the elements of a medium that can be interpreted as a representation of something as a representational state of the medium. Representational states are propagated from one medium to another by bringing
18 My focus on the concept of boundary objects should not be taken to mean that research on boundary objects is the only area where an interest in coordination in the wider field of STS surfaces. For example, Peter Galison (1997, 803-844), from the perspective of a historian and philosopher of science, has also written about coordination across scientific subcultures. And similar to some of the authors already mentioned, he prefers coordination over the notion of a ‘conceptual schema’ that he rejects as too static, fixed, and unhistorical. Moreover, Galison also points to a case of diagrammatic coordination more specifically: In discussing the work of physicist Julian Schwinger during the 1940s, Galison shows how Schwinger had come to accept “equivalence circuits” from the engineers he collaborated with, even though they did not fully capture the theoretical complexity that Schwinger was initially interested in (825). They were ‘good enough’ approximations and, more importantly, they were the means by which the different “subcultures” involved in the research – theoretical physicist and engineers – coordinated their actions and belief in what Galison calls the “trading zone” between different cultures.

53
the states of the media into coordination with one another" (117). At other times, he did not write of representational states but of "structured representational media" (141) that are brought into coordination. The human agent is a medium in this model as well – or actually humans are composed of multiple media including their skills and bodily techniques – as much as the artifacts in their environment might be composed of multiple media, for example, navigation instruments that combine charts, viewfinder, ruler, and tables. For a successful propagation between these media to take place, they have to be brought into coordination with each other. Moreover, this coordination also has an evolutionary perspective: Tasks are increasingly made easier by bringing in new media into the network of coordination, for example, by using techniques that have been learned and eventually internalized by humans and/or by changing the tools outside the human body that make the task easier. This adaptive temporal perspective also implies that each propagation gradually transforms the configuration of the coordinated network, by making it possible for further media to develop or to be brought into the circuit.
In a review of Hutchins’ work, Latour positively highlighted this aspect of a transformation-implicating propagation of media across the whole organization, and it appears to be directly adaptable to his own theoretical layout of 'mediators all the way’ (Latour 1996: 57, 59). At the same time, Latour criticized that Hutchins’ distribution of mediator does not go far enough but stops in the interaction between navigator minds and artifacts in their direct surroundings, when there are so many more mediators to consider in the wider context of society, especially "with the Global Positioning System, which transforms the whole Earth in the inside of a laboratory” (60). As far as coordination is concerned, Latour also criticized that Hutchins does not detail the different modes of coordination enough but uses "spongy metaphors” such as "glue” or "malleable and adaptable tissue” to describe them (61). Although it is true that Hutchins did not categorize further the various empirical types of coordination, it would however be wrong to accuse him of only approaching the material reality of coordination through these 'spongy’ metaphors without having the sense for more action-oriented materialism that Latour follows. On the general level of his theory of coordination, Hutchins indeed specified what he thinks the 'action-material’ of coordination is. For Hutchins, coordination worked by "pattern matching,” where the pattern of elements in one medium matches the patterns in another. But, and here Latour’s critique seems to the point, he did not seek for other 'existential’ modes of coordination.
Against the background of Hutchins’s work, claiming a coordinating role for diagrams seems to be inherent to the claim that they mediate structural similarity. They co-ordinate precisely between these structures; for example, between two sets of actions. On the other hand, little analytical depth is gained by speaking of diagrammatic coordination as soon as one finds an instance in the field that brings

54
two structures into resemblance. Instead, two additional qualifications seem necessary to speak of a diagrammatic coordination that integrates ideas from STS and from diagram research in media studies: First, the diagrammatic was defined above as a process that facilitates modeling and remodeling and therefore a cycle of transformation. Diagrammatic coordination must equally imply this aspect and not simply be reduced to pattern matching. By interrogating diagrammatic coordination, we therefore inquire about the integration of different sets of action into cycles of reasoning and by ways of similarity. This implies some kind of creative refinement process and we are most likely to encounter diagrammatic coordination in organizational contexts where processes of theoretical modeling, construction or innovation are taking place, but also in argumentations and debates that iteratively refine their models. In the case of Henderson’s study of design sketches, this transformative aspect is clearly present in the way that the sketch iteratively serves to model and remodel the technical object that is being designed. Moreover, diagrammatic coordination thus construed ends when the revision cycle is over, but this does not mean that the stability of the epistemic community or organization also ceases to be. The extent or limit of a stable epistemic community is different from the extent of the diagrammatic coordination. The endurance of the former does not per se depend on the latter.
The second conceptual addition to the phenomenon of diagrammatic coordination stems from the insight of the research on genre systems and boundary objects that they must contain a certain margin of flexibility for coordination between different social worlds. In the case from Star and Griesemer (1989), where the map of California worked as a boundary object in the development of the museum collection, the epistemic actions of the museum’s different stakeholders became somewhat aligned through their use of this map. Even though the map is a prototypical diagrammatic artifact and a prime example of a diagrammatic-iconic relationship with its territorial referent object, the emphasis is put elsewhere: on the similarity between the inscription practices and subsequent epistemic practices of selecting what validly belongs to the museum collection and what not. However, because the model of California does not really change in this process, this example would seem to fall short of a diagrammatic reconfiguration. Yet, the example showed how the collection of the museum was configured and reconfigured and for this process the map of California proved valuable. The diagram facilitated coordination by providing the same iconic/diagrammatic image for different social groups, and this image allowed both groups to figure and reconfigure their shared object of interest in a similar way. The question of semantic and pragmatic plasticity and of degrees of similarity may refer to the correspondence accuracy that different groups assign to a diagrammatic image, or to their more or less established similarity in enacting this image and modeling process despite varying interests and conceptual

55
contexts in both social groups.There also is a potential risk in focusing on diagrammatic coordination too
loosely construed: for example, when all relations of structural similarity become candidates for coordination. The more we count in as relevant relations of structural similarity, the more we risk ending up with an infinite regress. There might be such relationships all the way down and all the way up in any kind of organization. It is at this point that the heuristic of the mediator or intermediary turns out to be handy once again, since it was introduced precisely to study the otherwise infinite regress of media of transformation and how some are objectified as mere intermediaries and others are concentrated in a single powerful agent. A diagrammatic artifact might be seen as a key agent, for example, a data table that collects data and instructs machines to initiate this or that process of calculation and visualization. And the diagrammatic object might also serve to coordinate between different participants of the activity complex in question. Tracing an object that coordinates and following an object that has obtained the role of a mediator might therefore be two perspectives that mutually support each other.
Altogether, it is one of the primary aims of this book to detail the coordinating and stabilizing function of diagrammatic processes further and in the context of the case studies or particular fields of knowledge that follow. At the same time, I would like to keep another line of investigation in mind, that is, the possibility of relating the work on diagrams not only to a particular field of action but to the transaction that happens between different such fields. The question is whether we can limit diagrammatic processes and their coordinating or stabilizing function to particular fields of epistemic practice, even take them as indicative for identifying an epistemic community or collective, or whether diagrammatic processes have a greater scope of application beyond the characteristics of a single group and practice complex. On a related note, one needs to be attentive to how these diagrammatic processes change over time, or how their scope and area of application changes over time, for example by travelling between communities. With the theoretical models outlined so far, we can already point to three different scales on which the development or change of diagrammatic processes might be observed: They may succeed or fail in coordinating across social worlds by providing both an abstract idea and a concrete inscription practice (Star and Griesemer). They may take part in the immanent stabilization of community-specific knowledge infrastructures (Edwards) and styles of reasoning (Hacking). They may become essentialized intermediaries or mediators over the course of a technological innovation, blackboxing the complex network that was involved in their making (Latour).
56
1.6 Conclusion: How to approach epidemiological knowledge?
Epidemiological knowledge is here understood as a spectrum and placeholder category that signals a list of items such as practices, artifacts, human and non-human actors, representational devices and systems of inscription, all of which combine in specific ways in making warranted judgments about the origin, location, composition or control of epidemic diseases and how they are studied. In using such a category I am starting from the established distinction between knowledge and science in the history of knowledge (Foucault [1969] 2002c, 196-215; Sarasin 2011; Kassung 2007, 7-24; Vogl 1999, 7-16),19 rather than reducing epidemiological knowledge to science in the first place. However, it remains a heuristic placeholder because I cannot grasp epidemiological knowledge as a whole. Instead, I am turning to more concrete fields within this spectrum in which the above items stabilize in a recognizable fashion. The boundaries of existing scientific disciplines may assist in the identification of such fields but they cannot be the only marker. As Foucault has proposed, science itself might be characterized by different knowledge thresholds: the first being a threshold of discursive emergence, followed by thresholds of epistemologization (where the discourse becomes propositional or about truth claims), of scientificity and of formalization (Foucault [1969] 2002c, 206). Other historical discourse analyses have made a distinction between “logically stabilized” and non-stabilized discourses in order to distinguish science, technical expert discourses and law from literature and politics, for example (Landwehr 2009, 130). As much as discourse analytical theories are informative for my own inquiry, I do not wish to reduce my material from the outset to written, verbal and pictorial statements and degrees of formalization. Instead, I wish to discern the scope of different yet overlapping fields of epidemiological knowledge based on the topological operations and diagrammatic mediality and materiality at work. This of course does not mean that the contents of written, verbal or pictorial statements do not matter. They remain the primary empirical material of my study. But the perspective is a different one than in discourse analytical approaches. Rather than delimiting a field of knowledge through the identification of a regular distribution of statements and frontlines of problematization, I approach the specificity of these fields in the way they establish diagrammatic connections that stabilize an
19 For a concise discussion of central aspects of a 'history of knowledge’ after Foucault and the distinction between science and knowledge systems more generally, see Sarasin (2011). According to Sarasin, rational knowledge, belief systems and art are distinguishable "provinces of knowledge", and science is taken to be a primary model for rational knowledge, even though it also integrates aspects from the other provinces. For another take on the history of knowledge, which combines cultural history and a more rhizomatic reading of the historical archive of knowledge, see Kassung (2007, 7-24).

57
epistemic practice complex, and the latter also includes a particular distribution of epistemic agency.
At this point it seems necessary to provide additional detail about my understanding of agency and to clarify what might be meant by the more specific term of epistemic agency. In the recent decades, the meaning of the concept of agency has been the source of controversy in social theory to such a great extent that it would be impossible for me to acknowledge all the various versions of the concept (cf. Fuller 1994; Emirbayer and Mische 1998). In a traditional sense of agency, the term refers to the capacity to act in a way that is structurally transformative (including the transformation of existing structures of action such as routines and habits). Moreover, in a traditional human-centric sense, agency is also sometimes taken to be the mark of a choice or intention to act in this rather than that way and to own the responsibility of exercising the one or the other. Among others, three important lines of critique have led away from this traditional conceptualization of agency: Firstly, the constructivist insight that many more entities than just human actors, choices and intentions are involved in the individuation of agency. Secondly, the insight that agency is either a “divisible good” with “positional effects” (Fuller 1994, 742-3) or it becomes infinitely decomposable into further causes and effects until the point where agency ceases to have any effect. Against this background, agency is a positioning of an agent within a certain temporal, factual and spatial framing. Thirdly, the proposal that the opposition between agency and structure must be overcome in favor of, for example, a dynamic co-development of agency and structure over time. If this is mapped onto the figure of a human agent, agency might be phenomenologically construed as the retention and protention of the capacity to transform specific structures and which is continuously re-evaluated (Emirbayer and Mische 1998). The contemporary notion of ‘distributed agency’ embodies these different dimensions of departure from the traditional human-centric model of agency to varying degrees, and it tends to entertain a dual analytical interest in both the distribution and the positioning (centering, framing) of agency.20
In a similar way, one can also take either a narrower human-centric or a more diffused and distributed perspective on the concept of epistemic agency. In theories of distributed epistemic agency, the criteria of responsibility is usually kept, but that what participates in this responsibility is widened beyond the individual human
20 By speaking of distributed agency one might direct attention to the genetic components of an agency’s individuation, or one might refer to the contingent position of an agent for which the responsibility for this or that action is being claimed (for example, the reductive position of a mediator). The positioning of the agent as the single center of agency can then be approached as a reduction from this distributed network that made it possible in the first place. This is, for example, my reading of the concept of mediator in the tradition of ANT and as I discussed it above.

58
into non-human-inclusive assemblages, corporations and collectives (cf. Reider 2016). Epistemic agency is simply defined as “anything that is responsible for the assessments, acquisition, dissemination, and retention of knowledge” (Reider 2016, X) or as “the initiation, sustenance, and [...] background monitoring of belief-forming processes” (Palermos and Pritchard 2016, 121). Palermos and Pritchard (2016) have combined the concepts of epistemic agency and distributed agency by rooting them in the manifestation of “epistemic sensibility,” which is only to say that an agent can sense whether there is something wrong with a belief-forming process, but if there is not, than the agent might still be responsible for employing this belief-forming process but without being aware. Their definition is based a version of ‘process reliabilism’ (Goldman and Beddor 2016), which is focusing on the reliability of epistemic processes and not so much on the result of these processes such as the truthfulness of facts. Everything that supports this reliability is somehow included in the conditions of epistemic agency, which therefore entails all kinds of instruments and technical media as well as community processes.
The mediation of these background processes that affect the reliability of epistemic processes has above been captured by the term knowledge infrastructures. However, knowledge infrastructures and the matter of reliability seem to side entirely with the aspect of structure and seem to downplay the active aspect of agency along the way. The concept of mediator, by contrast, was introduced to capture the point at which an agent has been positioned and assigned the capacity to transform. Yet, the positioning or centering of the mediator might be shared by the different members of a field and for whom this mediator assignment has therefore become part of their knowledge infrastructure. Thus, as with the coupled relationship of structure and agency in general, knowledge infrastructures and mediator must be approached as two indivisible halves of the same coin when analyzing epistemic action complexes.
For empirical analysis, the above-mentioned conceptualization of epistemic agency leads to three potential methodical paths for my investigation: Firstly, I can approach epistemic agency as an attribution made by my informants and primary sources and turn to explicit statements that assign epistemic agency to objects or people – where this does not mean that these objects are attributed with epistemic sensibility but with their partaking in the individuation of epistemic agency in a way that makes a difference. In other words, technical devices might be assigned with epistemic agency in this sense because they make a difference without claiming sensibility for them. But even in this scenario, the epistemological analysis must also, secondly, turn to the conditions of possibility that are necessary for such an attribution to hold. For example, a map can be assigned the status of an important graphical mediator for epidemiological knowledge. But this assignment might have happened in order to shift an epistemic status that has previously only been assigned

59
to a statistical table (see chapter 3). Or a cartographic system may be addressed as a mediator that owns the epistemic agency of synthesizing data for observation because it incorporates both table and map (see chapter 4). In both cases, turning to the explicit conditions for the attribution of epistemic agency tells me about what alternatives have been integrated into this assignment and which have been omitted. This second perspective can be extended into a third one where I move even further away from explicit agency attributions, and turn to anything that supports the reliability of epistemic processes even if they are not explicitly mentioned as such. It is this last perspective in which my own media theoretical intervention is the greatest, as I am not following the medial conditions to which I have been pointed to by my informants or primary sources, but to the medial regularities that I have selected due to my initial theoretical interest (here: a diagrammatic interest) or due to iteratively comparing the case studies and thereby refining what medial conditions might have played a role even though they remained implicit.
All three paths are supposed to help me analyze how diagrammatic processes are involved in the distribution of epistemic agency within each of the epidemiological practice complexes of the following case studies, and whether diagrammatic media themselves obtain a transformative status within this distribution. In the terminology introduced in the previous sections: how diagrammatic processes are collapsed into an entity that goes by the term ‘mediator’, while simultaneously shadowing other kinds of processes. The positioning and framing of epistemic mediators guide attention away from other important knowledge processes and appear as if they had a particular agentive status that distinguishes them from other mediating entities. Conversely, the centering of certain mediators as primary epistemic agents also entails some kind of centering of epistemological models by which this kind of mediation is considered epistemically worthwhile and reliable. In fact, epistemic mediators may exemplify the application of an epistemological model and thereby anchor the model in the field. Their reciprocal power-transfer makes epistemological model and epistemic mediator two important components of establishing a mode of reasoning that is specific to this field of knowledge. Note that this specificity does not derive from the abstract content of an epistemological model, which may well exist in other contexts, but from the model’s specific relationship with a mediator. It is the mediator, so to speak, that lends this relationship its specificity. It bears a specific signature derived from the mediations and entities that are collapsed into its own claim of agency.
Besides the term mediator, there were other concepts that I have presented above as candidates for analyzing the stabilization of a field of practice, of scientific practice or epistemic practice more generally. These were the concepts of knowledge infrastructure, styles of reasoning, and epistemic culture. All of them have varying scopes of application, and I will use them over the course of the book as delimiting

60
heuristic concepts, against which the scope of each case study and field of practice can be discussed. However, some of these concepts also risk overshooting. Few of the case study might testify to a style of reasoning, but they may be smaller in scope or less bounded in character, and yet, each case study points to a regularity for whose identification the concept of a style of reasoning may prove useful. Whenever I encounter a presentation about how epidemiological knowledge is generated and why this way is considered adequate, reliable or even truthful, I will consider this as an expression of a 'mode of reasoning.’ A mode of reasoning appears to me as a still less specified, more generic terminology.21 In order to be addressed as a 'style of reasoning’, however, something else must be at work from the list that Hacking has provided; most importantly, the invention of new objects accompanied by ontological debates and a set of self-authentifying techniques. Not all case studies will allow for such a reading, but the style concept helps to delimit their scope. All of the three concepts of style of reasoning, knowledge infrastructure and epistemic culture indicate that a constellation of epistemic reliability has been achieved, which scaffolds the knowledge practice under observation. As mentioned above, they serve as a terminological counterweight to the concept of mediator because they do not emphasize the concentration of epistemic agency in one object but its reliance on an infrastructural milieu.
At the same time, the relationship between the objectification of epistemic agency and its distribution or scaffolding in an infrastructural milieu must be thought of as dynamic to some extent, because the objectification can become part of the background infrastructure that coordinates the activity of different participants in the field. From the discussion of boundary objects in the previous section, I deduce that the process of epistemic coordination is object-oriented and that mediator objects may serve as such coordinating entities. One of the challenges of the following case studies will be to distinguish between different kinds of epistemic objectification and their infrastructural integration. Diagrammatic processes participate in epistemic practices in the way that they help to configure and reconfigure knowledge objects, by mediating between abstract model and particular inscription. This kind of epistemic objectification is not the same as the objectification of an epistemic agent for whom it is claimed to transform a process of knowledge production. Diagrammatic processes might be analyzed for both kinds of epistemic objectification: they might themselves be collapsed into a single mediator object for whom it is claimed to be transformative, and they might assist in the generating, configuring and reconfiguring of knowledge objects.
21 This less specified notion is somewhat reminiscent of Algirdas J. Greimas’ concept of "modes of veridiction" (Greimas [1980] 1989).

61
2. Reconfiguring the causal web in scientific epidemiology, 1960-1995
In the present chapter, I aim to introduce the role of diagrams in epidemiological knowledge in a fairly literal manner. I will turn to the probably most intuitive type of diagram, that is, to graph drawings, not considering the larger class of diagrammatic artifacts such as maps and tables, and I will show how these graph drawings have been part of a discipline-building discourse of epidemiological science in the US. More specifically, the diagrams that are discussed in this chapter have been used to support or contest arguments about epidemic causality. They thereby also integrate into a genealogical narrative that describes epidemiological knowledge as moving through different stages of causal modelling. A related narrative, one that will be scrutinized as we go along, is that this movement proceeds from less to more complex interpenetration of causal factors, of scales of analysis and of scientific disciplines. The rhetorical role of schematic graph drawings may be to support such claims for complexification, which in itself seems paradoxical given the reductive quality of diagrams. Part of the chapter’s more theoretical discussion will therefore revolve around the relation between text and diagram and how they complement each other in negating and affirming certain causal models over others.
I decided to put this chapter at the beginning for two reasons: Firstly, because I hope it helps to introduce important facets of epidemiological science and reasoning for readers who are unfamiliar with the discipline and its history. But this does not mean that I conceive of epidemiological knowledge as being defined only by professional epidemiologists and that I only count their definitions as the necessary baseline from which any inquiry into epidemiological knowledge has to start. Nevertheless, it seems to me a comprehensible way to begin and from which to secondly extend the corpus, especially because some of the epidemiologists’ terms and concepts will resurface in other case studies in later chapters. The second reason for presenting this case study at the beginning, is that it still operates with an intuitive understanding of diagrams and connects them to a conventional analytical notion of discourse. It prepares the ground, so to speak, for the wider understanding of diagrams and the diagrammatic that will be discussed in the chapters hereafter as well as for their embeddedness in knowledge practices that regularly refer back to epidemiological history.

62
In the first part of this chapter, I will introduce attempts to periodize epidemiological history and discussions about epidemic causality, especially in the 1920s in Great Britain and Germany. Of course, this will remain a very selective introduction and I do not claim that it is complete in any way. The aim of this part is to familiarize readers with a historical narrative about and conceptual antagonisms relating to epidemic causality, providing a background not only for the analysis of the second part of this chapter but also for some of the other case studies that follow. In the second part of the chapter, I will turn to the context of post-war epidemiology in the USA and to a debate about epidemiological theory that was fought not only in words but also in diagrams.
2.1 Epidemiological science and the genealogical narrative of multicausality
A recently published handbook defines epidemiology as "the study of distribution and determinants of health-related states or events in specified populations, and the application of this study to the control of health problems,” and as a decisively "multidisciplinary science giving input to the applied field of public health” (Ahrens, Krickeberg and Pigeot 2005, 4-6). The description of epidemiology as multidisciplinary is not a mere tribute to a trending interdisciplinarity nowadays but has to do with the complicated history of what would only very late become conventionally addressed as the science of epidemiology in the German and US-American context. The label 'epidemiology’ was for a long time not the only disciplinary term used: it competed with labels such as historical-geographical pathology, hygiene, preventive medicine, and social medicine. This is also echoed in the naming of journals and other scientific publications. In the USA, the American Journal of Hygiene, first published in 1920, only renamed itself as the American Journal of Epidemiology in 1965 ("Change in Name” 1965). Another factor making it difficult to get a grip on 'scientific’ epidemiology and its historical trajectory in the USA and Germany, is that it mediates between science and administrative matters, between state technology and laboratory, and between an interest in the practical matters of control and census techniques and in the scientific study of the determinants of epidemic diseases. Accordingly, we find at least two repeating genealogical narratives for what would become epidemiology in the USA and Germany. On the one hand, a medicine-oriented genealogy that begins with the Greek medics Hippocrates and Galen, traces their interpretation and adaptation through Arabic medicine into the Middle Ages in Europe, continues with a revival of Hippocratic ideas and early theories about contagion and quarantine in the 16th to 17th centuries in Italy and England, with early ideas about inoculation and vaccination in the 18th century, to eventually arrive at the heroic tales of the 19th

63
century with Louis Pasteur and Robert Koch, among others (Saracci 2015, 10-13; Yarnell and O’Reilly 2013, 1-3; Büttner and Muller 2015, 19-20). On the other hand, we find a genealogical narrative about epidemiology along the lines of a history of health statistics and "medical police” (see Rosen 1953; Bayatrizi 2008, 2009), often commencing with English statisticians of the 17th century such as Graunt and Petty and continuing into the 19th century professionalization of statistical offices (Saracci 2015, 12; Yarnell and O’Reilly 2013, 2; Webb et al. 2017, 11-13; Büttner and Muller 2015, 21-22). Sometimes the statistical strand of the genealogical narrative is given more emphasis, sometimes the medical strand, but usually they both come together in one way or another. Especially Michel Foucault has become known for analyzing both strands in tandem in his Birth of the Clinic (Foucault [1963] 2003), but also for his analysis of the genealogical narrative of medical police in a number of articles (Foucault [1974] 2002a, [1979] 2002b) and its integration into his wider project of Discipline and Punish (Foucault [1975] 1995). However, within the disciplinary discourse of epidemiology itself, these two lines of descent are often acknowledged as intertwined threads, but which nevertheless remain pre-epidemiological in the sense that a discipline under this name only formed later – either in the 19th century or in the time around the Second World War, depending on which account one follows. Saracci (2015), for example, describes the time from the 1830s to the 1940s as "classical epidemiology” and the time after 1940 as "new epidemiology” (10). Büttner and Müller (2016), by contrast, state that MacMahon, Pugh and Ibsen’s publication of Epidemiologic Methods in 1960 was "the very first comprehensive and widely influential textbook of epidemiology” (Büttner and Muller 2016, 25). If handbooks are a good indicator of the institutionalization of a discipline, as already Fleck argued, then this statement must be extended to the claim that epidemiology as its protagonists know and identify it today became a recognizable discipline only in the mid-20th century. Whether or not one follows this judgment, the positions just presented indeed show that for contemporary epidemiological authors the term and discipline of epidemiology was either not coherently institutionalized until the mid-20th century, or that it made a decisive turn at this moment into a 'new’ kind of epidemiology.
In making sense of the different threads that converged in the emergence of epidemiology as science one also finds multiple attempts at periodizing the history of epidemiological knowledge according to different anchors. Some base their periodization on the diseases investigated such as infectious, chronic, or re-emerging infectious disease (Terris 1983; King 2004). Others focus on the methods and techniques employed such as historical-geographic techniques, experimental and laboratory setups, and probability statistics, for example (e.g., Trostle 1986; Susser 1985). This line of reasoning and periodizing also corresponds with a common internal categorization of epidemiology into descriptive, analytic, and

64
experimental epidemiology. Even other authors base their historiographies on the hegemonic causal argumentations that became typical of certain periods such as the search for 'necessary’ causes since the age of bacteriology in opposition to merely occurring factors, or the opposing of monocausal versus multifactorial causation (Gradmann and Schlich 1999). According to Schlich (1999, 11-13), it seemed as if at the end of the 19th century hygienists were targeting and trying to control various factors simultaneously, whereas bacteriologists emphasized the control of specific and necessary causes. Finally, changes in the profession of medicine, in its specialization into further subfields as well as the institutionalization of related disciplines through university and research institutes serve as another typical marker. Erwin H. Ackerknecht’s Short History of Medicine is an example of the latter sort, which traces the development of the medical profession through different ages, regions and cultures, and arrives at the 19th century in Western Europe where the emergence of public health and preventive medicine in the guise of hygiene are discussed as giving rise to a new type of medical practitioner, one who does not treat patients anymore but who is occupied solely with larger aggregates of people (Ackerknecht 1989, 187).
Of course, many publications that offer a historical account of epidemiology present a mix of these ways of periodizing. Nevertheless, I will in the following mainly concentrate on the periodization of causal models because it is in the context of this discursive tradition and genealogical narrative that I will discuss the use of diagrams further below. However, some preparatory words of caution are necessary regarding the difference between a periodization of causal modelling and claims at complexity. It is common to establish a difference between mono-causal and multi-causal models in relation to epidemics, as we will see below, where mono-causal reasoning reduces the source to a pathogen, a genetic disposition or an environmental condition and multi-causal reasoning concentrates on the intermingling of these factors. Claims at complexity go beyond multi-causal models in that they explicate how these causal factors work across analytical scales, have feedback effects, and may lead to the emergence of a new entity. However, making a distinction between monocausal, multicausal and complex reasoning in a historical analysis leads to the danger of slipping into a narrative of progress where the list of causal factors diversifies or extends over time with a more fine-tuned machinery of science, diversified interest groups and more sensitive equipment, and with complexity reasoning growing out of the same momentum. To avoid this implication, I will therefore instead speak of complexification in order to indicate that these are contingent attributions that authors make especially when they come to reflect on the discipline’s self-understanding and historical development.
The case study presented below will deal with the 'new epidemiology’ in the US of the 1950s and later and how authors deploy diagrams for their arguments
65
of causal complexification. However, to make sense of this development we first need to turn to the decades prior to this new age of epidemiology, especially to the 1920s, when a discourse about causal complexification in epidemic modelling emerges across epidemiological subdisciplines.
2.1.1 Beyond mono- vs. multicausality
Epidemiological history up until the First World War is sometimes narrated according to a simple antagonistic picture. This picture entails an opposition between environmental theories on the one hand and contagion theories on the other hand. Environmental theories are usually associated with the name of Hippocrates and the idea that factors such as climate, wind, soil, water etc. cause epidemics. Contagion theories, by contrast, highlight that disease agents cause epidemics. Taking this ideal type of controversy as a historical marker, in many historical accounts of the discipline it seems as if the history of epidemiology tended to swing between these poles at least between the 15th and 19th centuries. At the end of the 19th century, so the story goes, the contagionists were on top of the debate, and here particularly through the success of bacteriology and laboratory methods. Bacteriology became the dominating paradigm between 1870 and the First World War, especially in France with Louis Pasteur and in Germany with Robert Koch (see Sarasin et al. 2007). However, this dominance was eventually revised after the First World War, with second-generation bacteriologists turning away from the idiom to 'trace even the last bacillus’ (Mendelsohn 2007, 244). The "new epidemiology” (Hamer 1928) that emerged in the interwar period was characterized by an integration of formerly different subdisciplines of the field: the integration of statistical epidemiology, of laboratory bacteriology, of clinical research and of new ecological theories that stressed the causal force of natural or social environments. From this vantage point, the difference between the older and newer age of epidemiology might appear to be one between monocausal reductionism on the one hand – assuming only the disease agent or the environment as causative factor – and multicausal holism on the other hand, stressing that these factors may interact as parts in a nonreducible whole.22
However, historian of science J. Andrew Mendelsohn (2007) has criticized this binary opposition by pointing to the fact that both bacteriologists and other epidemiologists adjusted and mingled their ideas, objects and explanations in the face of the new epidemics of the early 20th century. These new epidemics were neither reducible to a generalized contagious agent anymore nor could they be explained by environmental and biological constitution alone. For example, it was
22 For a critique of holism at the time, see Lawrence and Weisz 1998 and Harrington 1995.

66
found that the introduction of single cases of typhus fever would not necessarily lead to an epidemic despite the obvious presence of an agent. Instead, there needed to be a permanent circulation for an epidemic to sustain (Mendelsohn 2007, 266). On the one hand, this gave renewed credit to an empirical macro-view that was common to statistics and to mathematical formalizations that could integrate population data into abstract models of epidemic emergence. For example, infected and susceptible individuals could be distinguished within populations, and thresholds could be computed above which epidemics could sustain themselves in a given population (Kermack and McKendrick 1927). On the other hand, the study of the infectious micro-agent was not to be dismissed but had to be integrated into an 'ecological’ model about the interaction between pathogen, host and environment. Such a mix of laboratory-style analysis, ecological thinking and mathematical formalization had been prominent in the study of malaria since the turn of the century and received additional support from the emerging field of population ecology during the 1920s (Kingsland 1985). However, the institutional power lay with the bacteriologists, statisticians, and hygienists who were employed at national research centers and offices for disease control. Accordingly, Mendelsohn presents the permeation during the interwar period of bacteriology of neo-Hippocratic theories about environmental causation, and of mathematical-ecological modeling by focusing on central institutional actors. For Germany and the USA, he foregrounds bacteriologists turning to experimental epidemiology, more specifically, Fred Neufeld at the Robert-Koch-Institute in Berlin and Simon Flexner at the Rockefeller Institute in New York. For Great Britain, by contrast, he reconstructs the permeation of different disciplinary positions in epidemiological knowledge from two sides: from the perspective of statistical epidemiologists and institutions on the one hand, and from the side of experimental-bacteriological ones on the other hand. The singularity of Great Britain is argued on the grounds that, beyond Germany and the USA, the process of institutionalizing epidemiological-statistical knowledge had already picked up steam since the mid-19th century. The development in all geographical locations converge in the same point, however, and that is the permeation of previously opposing positions in the epidemiological sciences.
Although Mendelsohn’s theory of permeation argues against a dichotomizing of reductionists vs. holists during the 1920s, this does not rule out the presence of a new discursive tendency that characterized this permeation at the time, such as the search for 'complex’ explanations and ways to legitimize them. For example, in his handbook Epidemiology: Old and New (1928), the British epidemiologist William Hamer referred on multiple occasions to the organic philosophy of Alfred North Whitehead. He mobilized a historical comment by Whitehead about the history of ideas and applied it to the history of epidemiology (Hamer 1928, 104-

67
130). Hamer wrote that after a "dull,” "decadent,” and "declining” era of thought at the end of 19th century, there "followed the modern era, with its revival of the Doctrine of Relativity” (1928, 105).23 Later he added that "while it was increasingly realised that the epidemiology of the Victorian era had laid too great stress upon the 'symptom complex' and the 'gross macroscopical lesion,' [...] it was also clear, on the other hand, that bacteriology had not been sufficiently careful in distinguishing causal from associated organisms” (1928, 127-28). The mentioned distinction between causation and association was common to statistics but not, as he claimed, to bacteriology. In other words, Hamer appealed in this quote to the possibility of taking up the best of both worlds, a macroscopical and microscopical approach which needed to be integrated into a new systemic project of epidemiology. Altogether, Hamer’s appeal for complexification can be seen in the fact that he tended to integrate macro and micro approaches as well as causation and association as two distinct but equally important markers of causality, together with the attempt to create a new systemic account of the discipline.
For another typical marker of problematizing complexity in the British context, absent in Mendelsohn’s study, one can turn to the discussion, formalization, and reification of 'emergence’. Mathematical epidemiologists of the same time began to formalize the notion of epidemic emergence and epidemic thresholds (Kermack and McKendrick 1927). The biochemist William O. Kermack and the epidemiologist Anderson G. McKendrick set out to formulate a general mathematical representation for studying the "interplay of the various factors of infectivity, recovery, and mortality” in relation to the question of how an epidemic "terminates” and despite the possibility of people being "susceptible” to whatever epidemic agent is circulating. This mathematical theory would become known as a precursor to later SIR-models in epidemiology but the authors also situated their work in the tradition of other mathematically inclined epidemiological researchers before them, such as Ronald Ross, and they thereby related themselves to the search for an 'ecology of disease’ that would integrate multiple factors and their interplay. Both the works of Hamer and that of Kermack and McKendrick can be seen as indicative of an intensified ecological interest in epidemiological theory building during those years and a turn towards multifactorial reasoning, one that corresponded with the more general success of (population) ecology at that time (Kingsland 1985). However, the extensiveness of this multifactorial complexity should not be confused with how ecologists and system theorists of the second half of the 20th century might have
23 The book, which Hamer uses as a guiding reference here, is Whitehead’s Science in The Modern World from 1925 and the latter’s periodization of different ‘climates of opinion.’ Hamer also points out that Whitehead adopted the notion of a ‘climate of opinion’ from a contemporary of Sydenham, thereby reinforcing the link between the philosopher’s historiography and epidemiological history.

68
understood it. Hamer and Kermack and McKendrick did not attempt to account for the feedback effects between disease etiology and control efforts, for example, but they did respond to a perceived explanatory lack in epidemiological knowledge at the time by not only calling for an extended list of factors but also emphasizing and formalizing the inter-factorial connections.
For the USA, Mendelsohn turns to Simon Flexner, who directed the newly established Rockefeller Institute for Medical Research in New York and who, in 1922, published an article on experimental epidemiology (Flexner 1922). This article details how the laboratory study of animal epidemics at his institute connects to and yet differs from older bacteriological research. According to him – as well as to many historians (Schlich 1999, 14) – older bacteriological authors already believed that epidemic causality cannot be reduced to the "occurrence of microorganisms”, but that epidemics are conditioned by a "greater complexity”, including "qualities of the microbe but also of the host and, as well, their many reactions, one upon the other” (11). However, Flexner also emphasized that one should not accordingly revert to a search for interdependencies across all different diseases or by turning to "indefinite concepts of epidemic constitutions.” Instead, the attempt of bacteriology to find definite causes should be kept but "extended and deepened” to include the host and its conditions of receptivity and immunity. Controlled laboratory studies of animal epidemics, in his opinion, were the "means [by which] it may be possible to secure those precise data of both microorganism and host on which eventually a real science of epidemiology may come to be built” (12).
Finally, if we turn to the context of Germany, Mendelsohn specifically focuses on the writings of Fred Neufeld and other employees at the Robert-Koch-Institute in Berlin to show the shifting of disciplinary boundaries. Here too we find a discourse of complexification taking hold. Neufeld was a bacteriologist who had taken over the direction of the institute, where he and his team conducted experimental epidemiological studies. In a number of publications he discussed the experimental findings of his British and US-American colleagues and emphasized that he was not following the reductions of older bacteriology but that he was also wary of a 'fallback’ into theories that would attempt to reduce causation to factors such as soil, wind and water (Neufeld 1924; 1927). He proposed a complex of four factors that interact in the event of epidemics: natural receptiveness, required immunity, virulence and mass of the pathogen (Neufeld 1924, 1349). Moreover, Neufeld was critical of generalizing explanations from one epidemic infection type to another and instead pleaded for the uniqueness of each. He emphasized this in one article by reference to a quote by Goethe – a typical reference figure for the holistic discourse of the Weimar years and also the specific form of holism of the National Socialists thereafter (Harrington 1995) – according to which everything in nature is more simple than one could think and more entangled than one could grasp (Neufeld

69
1935, 741). Understanding this intellectual background is particularly interesting for the case study that will follow in the next chapter. There, we will see how these attempts at complexifying causal explanation during the 1920s disappear again and are replaced by the centering of a 'geomedical’ theory and method during the 1930s. However, this centering too was a synthetic move of integrating bacteriological and geographical ideas rather than taking an old geographical discipline and putting it at the center once again. The following chapter will detail this context further. For the present moment it is primarily important to keep in mind that the search for multifactorial, interdisciplinary or complex explanations had already characterized important parts of epidemiological discourse during the 1920s in Britain, Germany and the USA, and in the case study presented below this tradition is continued into the 1990s where it revolves around the use of images and metaphors as important vehicles of such a discourse of complexification.
2.1.2 Causal web and critical epidemiology
Disease-oriented periodizations of epidemiology often consider the era in Western medicine before 1945 as being occupied with infectious disease and the one after until the mid-1980s with chronic disease (Terris 1983; Susser 1985). Especially conceptual developments related to cancer affected the discourse about causal modelling since the 1960s in what later would be termed the new ‘new epidemiology’ (Saracci 2015). The models that were developed in response to chronic diseases, and more specifically to cancer, brought indeterministic theories of ‘risk factors’ and probable causal pathways into the focus of attention rather than deterministic theories of final cause and single agent (Parascandola 2011). As the determining factors of cancer were not known, their necessary identification was replaced by the study of likely correlations between the disease and probable risk factors. For the US, especially the work on tobacco consumption and lung cancer became a paradigm case during the 1960s, which initiated much of the debate and further conceptual refinement of indeterministic theories of multiple causation. In the UK, Austin Bradford Hill, professor of medical statistics at University of London, reformulated these ideas into a catalogue of qualities that must be met by an association between different factors, in order to interpret this association as ‚likely‘ amounting to a causal relation (Bradford Hill 1965).
Around the same time, the epidemiologist Brian MacMahon, Professor at the Harvard School of Public Health, published a handbook on Epidemiological Methods, together with Thomas F. Pugh and Johannes Ipsen (MacMahon, Pugh and Ipsen 1960). Some contemporary historiographies of epidemiology refer to this publication as the very first comprehensive handbook of the discipline (Büttner and Muller 2016, 25), even though one needs to keep in mind that such statements

70
are made against the background of a presumed ‘new epidemiological’ age after the Second World War. In their handbook, MacMahon Pugh and Ipsen opposed the earlier reductive conceptions of causal chains and instead proposed a model that they famously labelled the web of causation. I will come back to this example further below and to the diagrammatic strategy they deployed while conceptualizing this model. In addition to the conceptual development of the causal web, and to the development of quality criteria for the judgments of causal associations in the context of cancer research, also new methodical tools came into use during 1960s that would correspond with these conceptual turns, for example, the use of multivariate analysis (Susser 1985, 156-57; Krieger 1994, 887).
Almost parallel to the publication of Epidemiological Methods and Bradford Hill’s list of criteria, the social epidemiologist Mervyn Susser held a series of lectures that would later compile into the book Causal Thinking in the Health Sciences, published in 1973 (Susser 1973). Susser had just taken the chair of epidemiology at Columbia University in 1966 after previous work in the UK and South Africa. Together with Ezra Stein, Susser had innovated studies about community health work and about class-related epidemiological determinants (see Smith and Susser 2002). In Causal Thinking, Susser made a distinction between immediate and distant causes, emphasizing the necessity of keeping supposedly distant variables such as class in sight for prevention. The book also included a discussion of the criteria necessary to make causal judgments in epidemiology, joining the work of Bradford Hill and the Surgeon General’s report on lung cancer during the 1960s (see Kaufman and Poole 2000). Moreover, Causal Thinking also already hinted at an “ecological view of epidemiology” that considers “different levels of determination” (Smith and Susser 2002, 35) and which Susser and others developed further during the 1990s.
In 1996, Mervyn and Ezra Susser proposed an ecological paradigm that they called the “Chinese Box,” targeting the “blackbox” paradigm of the chronic disease era (Susser and Susser 1996). According to the authors, the blackbox paradigm had been based on computing the risk ratio of exposure to outcome at an individual level and on modifying individual lifestyles. The Chinese Box paradigm, by contrast, was supposed to measure determinants and outcomes at different levels of organization, regard community as an important “localized structure,” and to integrate new “information and biomedical technology to find leverage at efficacious levels, from contextual to molecular” (1996, 676-77). The Sussers called their model an “eco-epidemiological” one.
Also during the 1990s and two years earlier than the Sussers, the social epidemiologist and later professor for social epidemiology at the Harvard T.H. Chan School of Public Health, Nancy Krieger, proposed a so-called “ecosocial framework” for epidemiology (Krieger 1994). In a similar trans-scalar fashion to the Sussers, Krieger focused on the level-specific presumptions underlying many

71
epidemiological theories, particularly the neglect of social determinants and the priority of individual causes of disease. The two scales that traditionally come to mind when thinking about disease are the individual level and the population level. To focus on either one of them with disregard for the other has attracted criticism for decades, referring to such shortcuts as “individualistic fallacy” or “ecological fallacy,” respectively (Subramanian et al. 2009). But Krieger was also wary that there was a misunderstanding and misrepresentation of the notion of ‘ecology.’ For Krieger, the term ecological was to be understood in its proper sense of complex interacting scales rather than being reduced to population level. Reflecting retrospectively on her programmatic call for an ecosocial framework in the 1990s, she wrote twenty years later: “As I wrote at the time, the ‚eco’ in ‚ecosocial’ was meant literally to refer to ecology, the real ecology of ecosystems, in contrast to the kind of ‚ecological analysis’ warned against in epidemiological research” (Krieger 2015, 803).
Both Susser’s and Krieger’s reasoning about causal models in epidemiology does not only testify to yet another ecological turn in epidemiology in the US between the 1960s and 1990s, but they also represent a strand of social epidemiology that is sometimes referred to as “critical epidemiology” (Brown 1997; Breilh 2008). The sociologist Phil Brown used the term to refer to scientists from the discipline of epidemiology who “argue against a value-free model,” and who “focus on the social context of environmental hazards and diseases” (Brown 1997, 147). Moreover, Brown implied that critical epidemiologists more openly endorse the participation of non-experts from affected communities. With their early emphasis on community health care, Stein and Susser represent this tendency as much as Krieger does with her reflexive turn on ecological theories in epidemiology.
To summarize this very short introduction to discourses about causal modelling in epidemiology: the first complexification of causal models I discussed for the 1920s was connected to an integration of formerly distinct methods, including laboratory, experimental, mathematical and statistical techniques, and it began to integrate different scales of analysis. The complexification of causal models in the immediate decades after the Second World War and in relation to chronic diseases revolved around indeterministic theories of disease causation, and it was connected to new methodological advancements in statistics. Finally, with the critical epidemiologies of Susser and Krieger in the 1990s, the complexification of causal models in epidemiology again took another turn. Epidemiological causality is now meant to traverse different scales both for etiological research and for finding adequate control methods. My primary reason for selecting these examples over others is that they help to structure a discursive struggle that was not only fought in words, but also in images.

72
2.2 Diagrammatic dis/continuity: causal chain, web and fractal
Diagrams are a default device for aiding causal modeling in various scientific disciplines (see, e.g., Griesemer 1991 or Taylor and Blum 1991). In epidemiology more specifically, typical visual diagrams in the epidemiology of zoonoses, for example, would be flow charts that show the general causal pathways between humans, parasites and animals in "zoonotic cycles” (Lynteris 2017). In the following, I want to show the diagrammatic side of the discourse about disease causation introduced above. In this context, the role of diagrams became reflected upon especially with the beginning of critical epidemiology in the 1990s, when epidemiologists began to scrutinize older conceptual models for scalar bias. One of these older conceptual diagrams they began to oppose and therefore an important reference point in the diagrammatical discourse of scientific epidemiology was the notion of the causal web proposed by MacMahon, Pugh and Ipsen (1960). But even these authors from the 1960s had their own diagrammatic antagonist, which was the figure of the causal chain, and against which MacMahon et al. proposed the web as an alternative. Thus, the following discussion appears to be structured by a three-step movement from the figure of the causal chain to that of the causal web and finally to the trans-scalar diagrams used by critical epidemiologists. However, at least the first part of this movement is at best tentative. MacMahon et al. do not give any reference to where they took the model of 'causal chain’ from and we can assume that this has to do with its already self-evident and intuitive use at the time. In other words, the causal chain was already a common rhetorical device when the authors published their handbook and did not need additional visual illustration.
2.2.1 Diagramming the causal web
MacMahon, Pugh and Ipsen (1960, 18-19) proposed the "web of causation” both as a metaphor and a concrete visual form to programmatically point towards a new understanding of causality in epidemiology.
On the one hand, their model of causality continued a statistical way of reasoning and they attempted to adapt it for the practical orientation of epidemiology. They referred to concepts typical in statistics such as frequency and association and defined "a causal association […] as an association between two categories of events in which change in the frequency or quality of one is observed to follow alteration in the other” (1960, 12, emphasis added). They continued by differentiating different types of association – independence, non-causally associated, indirectly causal, directly causal – and by proposing a two-step causal analysis: with the first step being always a statistical association or significant correlation, and the second step being a further investigation of this association, preferably by experiment. However,

73
as experiments are often not possible, the authors proposed guiding one’s causal judgment based on "time sequence,” "strength of association” and "consistence of existing knowledge” (1960, 15). In other words, they added another layer of reasoning on top of the statistical style to continue but also adapt statistics to the practical rationality of epidemiology.
On the other hand, their causal model was also meant as a critique of the "oversimplification” of a "chain of causation” approach (1960, 18). Effects were said to never be dependent on single causes. In their view it was impossible to know "that this is the ultimate direct association and no other,” and they emphasized that the "practical significance of causal associations in the development of preventive programs does not necessarily depend on the degree of directness” (1960, 17). It was against this background that they proposed their own model of the causal web as an alternative.
The concept of the web of causation was illustrated by the authors through a visual figure and a practical example exercise. The exercise was to determine the components of an association between the treatment for syphilis and the development of jaundice or icterus. The image they provided to illustrate the web of components was not, however, what one might envision from today’s standpoint. The authors presented a tree diagram that rather reminds of hierarchical structures than a web in the sense of weavings of nodes and edges that we are more accustomed to today (Figure 1). The diagram shows how different boxed component classes are connected to possible outcomes that themselves become conditions for further components. By convention, one comes to read the diagram from top to bottom, from "occurrence of syphilis” to "icterus” as the two "categories of events,” which the reader is supposed to associate. In navigating the diagram, one recognizes where links between the part components are uncertain and await analysis, and where parallel trajectories are proposed. At the same time, there are no arrows that would indicate direction. The whole connective tissue of components is presented like a categorical matrix – in their view: like a web – between the two main "events” without suggesting a direction or singular path. One is led to see the multiplicity of components laying between these two ends.
The overall function of the image is at once to make a conceptual point about the reductiveness of causal chains and necessary causes and to present a tool for deriving meaningful targets of intervention. As far as the first function is concerned, MacMahon, Pugh and Ipsen write that the "distinction between causes and contributory factors is arbitrary and often quite meaningless. Most commonly, the chosen factor is the necessary cause only by definition, in the sense that automobiles are the necessary cause of automobile accidents” (1960, 20). As far as the second function is concerned, the authors distinguish factors by distance:

74
We may note that many variables other than those directly in the chain enter the genealogy at each step of the chain. Consequently, the longer the chain the weaker the association. A preventive attack on the disease depends on finding an element in the chain which can be eliminated and which is sufficiently close. (MacMahon, Pugh and Ipsen 1960, 18)
As one can see from this description, the web is modeled not only against the chain metaphor but also on top of it. The web consists of multiple and potentially extendable chains. It helps the epidemiologist to map the extension of these chains, get a sense of their relative distance and thereby inform the decision where to preventively intervene. The seemingly too rigid and ordered appearance of the diagram stems from the fact that the single directional chain has been multiplied into a matrix of non-directional chains, for which the authors chose the trope of the web.
Figure 1. MacMahon, Pugh and Ipsen illustrated their concept of a “web of causation” by the figure above with the caption “Some components of the association between the treatment
for syphilis and jaundice.” Reprinted from MacMahon, Pugh, and Ipsen (1960, 19, fig. 2).

75
2.2.2 Reciprocal relations and levels of organization
Mervyn Susser’s Causal Thinking was published in 1973. Compared to MacMahon et al.’s handbook, he made a much more extensive use of visual figures to illustrate different approaches towards causal modeling in epidemiology. Starting along the lines of conventional historiography, he introduced Hippocratic texts as the initial forerunners that would make a first pathbreaking differentiation in epidemiology between environment and host as two different components in disease causation, while at the same time modeling wrongly how initial conditions and intermediary causes lead to different symptoms causally. In order to illustrate how this wrong chaining of events and components can be corrected, Susser uses minimal graphs, mainly arrows, that he successively expands and transforms. Where the Hippocratic model was represented through a linear chain, the contemporary epidemiological author, according to Susser, would bifurcate the causal line into branches of different causes and effects (Figure 2a).
Especially arrows were important signs in the visual language of Susser. He used them to illustrate the classic understanding of causation as an asymmetric relationship of determination between two variables – visually represented by an arrow between letters – and he also used arrows to move this model further and transform it into one that accommodates reciprocal relationships between the variables. He applied this transformation to the by now classic epidemiological triangle – a triangular model that represents a causal relationship between host, environment and pathogen – in order to stress the point that this model is best extended by reciprocal arrows that indicate co-determination between the components. Even better, he contented, would be to consider the environment as that what surrounds those components and their relationships at all times (Figure 2b). Susser framed this latter model as an ecological one whereas the triangle alone, even in its reciprocal form, was considered as an epidemiological model. The text left little doubt that its author’s ambition was to move the epidemiological model further in the direction of the ecological one. In a clear diagrammatic arc of argumentation, Susser had started with the simple chain diagram of Hippocrates, to then move further into contemporary epidemiological modeling and present the ecological diagram as its aspired neighbor. He concluded this section on causal diagrams by stating that “the simple sequential causal model […] has developed into a model in which the triad of agent, host, and environment are engaged in processes of reciprocal interaction […] A complex ecological model (Exhibit 6,3) is a still better representation of reality: agent and host are engaged in continuing interaction with an enveloping environment” (Susser 1973, 30).
Different from the diagrams he used in his narration of the advances in causal modeling, Susser used Venn diagrams when explaining how variables can be distinguished that might partake in disease causation. For example, he illustrated

76
Figure 2a. Mervyn Susser‘s diagrammatic comparison of a Hippocratic model of causation with a contemporary model (Susser 1973, 16). Reproduced with
permission of Oxford Publishing Limited through PLSclear.
Figure 2b. Susser‘s diagrammatic comparison of triangular, reciprocal and ecological models of causation with the example of schistosomiasis (Susser 1973, 28).
Reproduced with permission of Oxford Publishing Limited through PLSclear.

77
that a dependent and an independent variable might only have a certain area of overlap, and that both an explanatory variable or an intervening variable might additionally affect and specify which part of the association between the two initial variables comes into focus. Later reviews of Susser’s Causal Thinking would claim that Susser introduced a distinction between distant causes and immediate causes, emphasizing that distant causes must not be neglected or devalued in their causal impact. However, no such terminological distinction is explicitly made in Susser’s 1973 text. Nevertheless, he indeed advances an ecological system model in which exist different levels of organization and whose causal effects upon each other can be tremendous. In fact, in the first place he describes those different levels of organization to introduce his concept of a ‘frame of reference’ that any epidemiologist looking for causal models must keep in mind: a frame of reference describes on which level of organization the observer is seeking for causes and in epidemiology usually corresponds either with the units of aggregate population numbers or with the medical examination of an individual course of an illness or with the laboratory investigation of a pathogen. Any causal claims must keep in mind which frame of reference they deploy in their causal investigation and that this is always only a partial cutout of the larger ecological complex of disease causation. For advancing this theory of an ecological system’s multiple levels of organization that can have effects upon each other, Susser does not use graphs and diagrams, however, but he mobilizes a metaphor. He writes: “The evolution of causal models in epidemiology has led us to the concept of systems […] Systems also relate to one another; they contain each other like the boxes of a Chinese conjuring trick” (48-49). Almost twenty years after Causal Thinking, this image of the Chinese box gains greater prominence in a two-part article series by Mervyn and Ezra Susser on the “Future for Epidemiology”, whose second part is entitled “From Black Box to Chinese Boxes and Eco-Epidemiology” (Susser and Susser 1996). Here, the image of the Chinese Box becomes the main metaphoric guideline for the argumentation in the text, which otherwise does not use any visual diagrams at all.
2.2.3 Fractals
In her proposal for an "ecosocial” framework, Nancy Krieger (1994) criticized the diagram of the causal web as still too reductive and called for new metaphors and models. She acknowledged that by the time of its initial publication the trope of the web had successfully served as a provocation against the then-common metaphor of the causal chain. It had "tapped into an intuitive sense of interconnection” that had become a common trope by way of cybernetics and ecology (Krieger 1994, 890). Her criticism, however, focused on MacMahon, Pugh and Ipsen’s attempt to use the diagram as a model for intervention while not giving an account of the theories that

78
produced the components of the web in the first place. In her reading, the diagram was hiding the etiological models it was based on: The web as a practical tool for intervention was designed in a way such that it focused on risk factors "closest to the outcome under investigation, and these in turn typically translate to the direct biological causes of disease in individuals and/or to 'lifestyles’” (891). For Krieger, the web did not account well enough for causes such as economy, for example, and even more importantly, it did not take the interplay of population-level risk factors and individual ones into account. She concluded that "the 'web’ did not challenge this basic biomedical and individualistic orientation to disease causation” (892).
Most importantly, Krieger’s critique of the causal web and her own conceptual intervention for an "ecosocial epidemiology” was also explicitly a call for new diagrams and metaphors. She ended her critique accordingly by presenting a number of different metaphoric candidates: for example, adding the "spider” to the web, or picking up the metaphor of a "societal scaffolding” or of a "growing bush of evolution” (896). The diagram that she finally chose as sufficiently representing the causal complexity she wished to install was the image of a fractal: "This intertwining ensemble must be understood to exist at every level, sub-cellular to societal, repeating indefinitely, like a fractal object” (896). Krieger then also presented an actual computer-generated image of a fractal structure (Figure 3), "illustrating self-similarity on multiple scales.” In her further commentary on the image, she clearly articulated that this image proposition had to be understood as part of a theoretical or conceptual search, with the function of generating a method rather than representing answers. It was supposed to help conceptualize the finding of so-called "epidemiological profiles across and within societies” (897). The particular branches of the fractal image were supposed to represent different levels of societal and ecological organization and an epidemic was expected to multiply into various profiles that are determined by the interdependence of different factors at different scales. By using the image of a fractal as conceptual metaphor and diagram, Krieger connected her work to complexity discourses in biomedicine beyond epidemiology. She had adapted the diagram from a publication about the aging-related "loss of complexity" in neural structures in the brain (Lipsitz and Goldberger 1992). The original authors of this paper had represented changes in the "fractal-like architecture" of neural branches by using photographs. Krieger adapted this neurological image as a model for complexity reasoning beyond its application to brain processes. In addition, the fractal had already made a career in different areas of science and popular science by this time (see Rötzer 1994), although Krieger does not reference any of these developments specifically.

79
Figure 3. Nancy Krieger‘s proposal for an adequate image of epidemic causation with the original caption “computer-generated fractal structure, illustrating self-similarity on
multiple scales” (Krieger 1994, 897, fig. 6). Reprinted with permission from Elsevier.

80
2.2.4 Diagrammatic strategies
The authors discussed above used a series of diagrammatic strategies in order to model epidemic causality. I want to point to four diagrammatic strategies in particular: branching, reconfiguring directedness, leveling, problematizing distance. All three publication –MacMahon, Susser and Krieger– use a strategy of branching, where they transform the mono-linear order of a single chain into different branches at various points of the original chain. This strategy is a positive or additive strategy in the sense of adding further visual elements to an existing figure and thereby generating a new figure while simultaneously referring back to the original one. The second strategy of reconfiguring directedness works different in the three examples. MacMahon et al. transform the directedness of the chain figure by leaving away all arrow-like indicators of direction in their diagram of the web. They therefore negate direction by subtraction, by not showing what the image of the chain would usually indicate, i.e. a clear direction. In a similar way, also Krieger leaves out directional arrows in the branches of her fractal image, and she only keeps a single arrow that indicates the directed causal relation between different levels of organization. In other words, she reintroduces the arrow that has been omitted by MacMahon et al. but which in Krieger’s case has been given a different meaning: this time the arrow is supposed to be an indicator of transscalar causal relationships. Susser, by contrast, reformulates the directedness of causal graphs by adding arrows that show reciprocal or cyclical effects, and he thereby reconfigures the initial causal model and criticizes the linearity of the causal chain image.
The third diagrammatic strategy of levelling is explicitly only found in Krieger’s work. While MacMahon et al. and Susser do not point beyond the two-dimensional modelling plane in their mobilization of diagrams, Krieger’s use of the fractal implies a three-dimensional structure that can range from micro to macro. However, given the two-dimensionality of the surface of inscription, this can only be visually achieved by discursively framing the image as self-similar structures that would repeat endlessly when zooming in closer. The arrow she uses thereby obtains the meaning of a trajectory into this three-dimensional virtual space of the fractal, even though it is not present as a mark of inscription but only as a space of reference. It needs to be mentioned that also Susser, with his metaphor of the Chinese box, points towards the vertical leveling of different scales of organization. However, at least in his 1973 text on Causal Thinking this does not become further explicated as playing a major part in his selected diagrammatic expression.
Finally, the fourth diagrammatic strategy is the problematizing of distance, which is referred to by all authors but, again, not in an equally explicit way. MacMahon et al. do explicitly problematize distance in their framing of the visual figure of the web by emphasizing that a primary function of diagramming the

81
causal web is to identify which causal factors might be closer to the effect and therefore more applicable for intervention. In doing so, they imply that there is an ordinal similarity between the degree of causal impact in the world and the number of edges or the metric distance on the planar representational surface of the diagram. Susser and Krieger are precisely criticizing this implied diagrammatic correspondence between represented distance and causal impact, and at least Krieger searches for a figurative strategy to overcome the implications of MacMahon et al.’s representational device. Susser does not do this explicitly in response to the publication of MacMahon and his coauthors, but rather on a general note, and he also does not use any pictures to underline this argument: it is only through the trope of the Chinese box that he points to the causal connections of different scales. Krieger, by contrast, does explicitly pick up the question of distance and in response to the original diagram of the causal web. Her diagrammatic strategy is to negate an interpretation that equivalizes the distance in the picture space or in the number of edges with the degree of causal impact, by bringing in a virtual third dimension and which she symbolizes through the arrow that cuts across branches and edges and thereby indicates an impactful connection across scales and metric distances.
All these diagrammatic strategies make use of figurative transformations by adding or subtracting lines or by morphing webs into fractal geometries. They establish relations between figures, extending and reformatting previous inter-figurative relations, adding new forms or resampling old ones. Moreover, these processes of extending and reshaping the figurative arrangement of causal modeling cannot be reduced to the workings of the picture of the web, of the fractal or of the graph alone. They are embedded within commentaries and an argumentative context in which they obtain their role as parts of a diagrammatic strategy or practice. For example, the fractal image would hardly have been understood as a multi-scalar proposition if it were not accompanied by Krieger’s commentary. And similarly, MacMahon, Pugh and Ipsen’s diagram would not appear to be non-directional if we were simply led by reading conventions that proceed from top to bottom, without keeping their interpretative keys in mind. In other words, discursive context remains central for understanding the meaning of a diagram and its role as part of a larger argumentative structure. To understand MacMahon’s diagrammatic strategy one needs to have in mind the only discursively constructed antagonist of the linear ‚chain model’ of disease causation, which was presented before showing the diagram, and against which the latter’s presentation is argumentatively evaluated. In other words, the figurative scaffolding of their argument is characterized by the inflection between the rhetorical figure of the chain and the visual figure of the web. The distinction between both figures, then, opens up the operational space of the diagram that can be imaginatively inhabited.
Altogether, the arc from MacMahon, Pugh and Ipsen’s handbook to Krieger’s

82
intervention shows that some form of diagrammatic thinking and self-reflection had taken root in the scientific discipline of epidemiology itself. Already the diagram of the web of causes was oriented towards practicality and operationalizing the identification of targets of intervention within the gained complexity of causal thinking in epidemiology. Krieger continued this ‚operational’ orientation by stressing that the diagram was not merely meant to represent but to generate new methods of investigation. Particularly this emphasis on productivity, generativity, and operational imaging resonates with typical discussions of the qualities of the diagram or the diagrammatic in the humanities. The common function of diagrams is not only to describe but also to instruct and prescribe. The reference object in the diagrammatic strategies of MacMahon et al., Susser and Krieger was not an epidemic event that existed independent of its epidemiological observers, but their diagrammatic strategies aimed at prefiguring or instructing a self-reflexive way of doing epidemiology and at advancing an understanding of epidemiological action that necessarily becomes part of the causal model, either by the point of intervention they choose or by the frame of reference they select.
2.3 Discussion: Diagrammatic discourse and figurative series
For the final part of this chapter, I will relate the examples and first interpretations offered above to the larger context of diagrammatic theory from the previous chapter. The use of diagrams in the examples above was part of institutionalizing a specific way of debating about epidemic causality, of guiding a process of theoretical modeling and remodeling. In order to conceptualize this more thoroughly, I will pick up two of the properties of diagrammatic processes that were mentioned in the previous chapter in relation to Krämer’s (2016) systematization of diagrammatic aspects: these two properties are the propositional status of diagrams and their transfigurative potential. In addition, I will emphasize the point made by Bauer and Ernst (2010) that diagrammatic processes steer a cycle of configuration and reconfiguration. Eventually, this will bring about the question of where a diagrammatic cycle seizes to be, or in other words, where we can draw a line around discursive regularities in which diagrams participate. Since all the authors of the case study above opposed the image of the causal chain, I will start my more general reflections from this particular exemplar.
The image of the causal chain may indicate three interrelated meanings of causation: causation by touching or contact, causation as directional asymmetrical relation, and causation as determinate relation. For example, the image of the causal chain may refer to a connection between two entities by direct contact by presenting the two entities contiguously chained up in a sequence. Here we take the perspective of following one entity along the chain link towards its next neighbor without any

83
gaps between them. In another sense, the image of the causal chain may represent directional and determinate causation but without giving additional information about the contact between two neighboring entities. Instead, it simply presents two distinct moments of the chained sequence where there could still be entities between them. Either meaning might be given different emphasis depending on the context. An example where the first meaning takes the lead would be the deployment of the chain model in (early) virological discourses about infection, where the causal chain indicates a direct contact between infected and susceptible organisms. I will come back to this example in the next chapter. An instance of the second meaning would be, for example, to state the existence of a causal chain between climate change, temperature increase and disease incidence, where the proposition does not detail how each of these components touches each other. However, indicating that the relationship between these factors corresponds to a causal chain still mobilizes the possibility of direct contact and it is rather additional knowledge that needs to be brought in to bear in order to interpret this deployment of the causal chain as being gap-integrating instead of gap-free. In other words, both possible meanings of the causal chain work together: the meaning of direct contact is needed in order to be negated, to bring about the realization that we are not informed about the contact between the entities in question but only about their effect upon each other.
A typical graphical realization of an asymmetrical directed connection would be the use of an arrow. Linking different marks together by arrows would probably be the archetypical drawing of a causal chain. In order to undo this image of the chain and its implied meaning of direction, MacMahon and his coauthors specifically decided against the arrow when drawing their web and used undirected edges between two entities, marking a relation but no direction. However, MacMahon, Pugh and Ipsen nevertheless needed the reference to the causal chain as a rhetorical figure on the level of the commentary, so that the undirected edges in the diagram of the web could be read as a negation of the arrow, as signs that did not symbolize a direction. The diagram of the web clearly symbolized a relation but left open how much temporal or spatial distance lays between two entities and in which direction a causative force might flow. In other words, the diagram and the rhetorical figure formed a unit capable of a negative proposition by way of their contrast. This is not a trivial matter because the propositional status of images is contested to say the least (see, e.g., Mersch 2011). Traditionally, one would put all propositional capacity on the side of sentences and text rather than images. In the recent years, however, a number of authors have contested this exclusive use of propositionality for language, discussed the possibility of a propositional status of images, and more specifically, the possibility that images can negate (cf. Nowak 2019; Alloa 2019). The assumption that images can have propositional roles has also been extended to the "hybrid” medium of the diagram, as already indicated in the previous chapter in

84
the discussion of Krämer‘s theory of diagrams (Krämer 2016, 78-80), and diagrams feature also prominently as common examples among other authors who seek to specify the propositionality of images (see, again, Nowak 2019).
For the present case study, I would argue that the propositionality in question (the proposition of not symbolizing a direction) is achieved through the contrast between two images, between the direction-implicating rhetorical image of the chain and the undirected graph drawing that MacMahon, Pugh and Ipsen call a 'web’. The same hypothesis extends to the examples of negation in Susser’s and Krieger’s text: in the case of Krieger, the negation of distance between different causes and effect was facilitated by bringing the tree-like diagram and metric space of the causal web into opposition with the self-similar form of the fractal and its indicated direction across scales; and in the case of Susser, the diagram of the Hippocratic chain of causation was opposed to a series of increasingly more complicated diagrams with additional bifurcations and signs of direction. With Emmanuel Alloa one could call these examples “interpictorial negations” because the negation is realized through the relationship between different pictures (Alloa 2019, 65). However, it is also important to acknowledge that those propositional connections are not based on pictorial forms of representation alone, but that they subsist in the relationship between rhetorical images on the level of the commentary and the pictorial level of the diagram. In any case, whether that what generates a propositional content is an interpictorial unit or the unit of the diagram and commentary, one can approach both kinds of propositional connections on a shared conceptual plane by referring to them as figurative units.
The concept of figuration has itself accumulated a significant body of scholarship (see, e.g., Boehm, Brandstetter and von Müller 2007), whose proper reconstruction would fall outside the scope of this chapter. With Donna Haraway (1997, 11), one can understand figuration in a robust yet slim definition as an act that simultaneously makes visible an actor and a specific spatiotemporal context, and in doing so, a figuration can function to intervene in and displace an existing discursive order. We can apply the aspect of making visible both actor and spatiotemporal context to the present case study in the following way: In graphing a causal chain, we enact an image that allows us to see a process as a whole and one that includes multiple actors that share the spatiality of the process layout on the surface of the diagram. To use another example from the next chapter: In thematic cartography we make an image that allows us to see actors in the spatiality of the cartographic scale, distinguishable by color and form but related by contiguity. However, the problem with these examples is that figuration is seemingly bound up with one diagrammatic artifact and image space only. But in the case of MacMahon, Pugh and Ipsen, the graph of the causal web and the rhetorical image of the causal chain together provided for the imaginary spatiality and possible placing of actors.

85
They complemented each other in a way that made a dissonance possible and thus produced a negative proposition about directional causation.24
Haraway‘s conception that a figuration simultaneously makes space and places actors also resonates with one of the two historic forms of rhetoric figuration that Rüdiger Campe (2007) identified. According to Campe, one can distinguish between a concept of figuration by Aristotles and one by Quintilian, and it is the latter‘s conception that reappears as a dominant version in Western European aesthetics in the 18th century. Aristotle’s approach attributed figuration or the rhetorical image with an ontological function, according to which the image can bring something 'before one’s eyes’ as an actuality that has prior only been a potentiality. This approach to figuration drew its energy from the distinction between actuality and potentiality and a corresponding model of reality. The second approach to figuration, represented by Quintilian, saw figuration as a medium of narration. Narrative figuration was seen a way to spatialize the temporal modes of past, present and future. According the Campe, Quintilian‘s approach was taken up in different 18th century media from statistical writings to the tableau in theatre, which concentrated different temporal modes within one space.
The translation of the concept of of causality into diagrammatic form seems to be a fitting example of such an understanding of figuration, at least if one considers causality – as did the epidemiological authors in the case study – to be before anything else a matter of temporal sequencing, of dividing the image space into anteceding and determined variables. This spatialization of temporal divisions represents the figurative starting point into which the further figurative offerings of chain, web or fractal intervene. Each intervention creates a new figurative series and which in turn alters the figurative base line for the next series of intervention and so on and so forth. On a more general note, this implies that studying the co-figuration of diagram and commentary, or of rhetorical and pictorial image, should not be left to actualities alone, but should be addressed as shaping and expressing the figurative actualization and virtualization of a specific field of action at a particular time.
Approaching diagrams through their cycle of actualization and virtualization has also been an important aspect of the more cognitive theories of diagrams that were discussed in the previous chapter. For example, Krämer (2016, 83-4) stated
24 Compared to the prominence of the concept of figuration, developing an understanding and terminology of intermedial co-figuration has received surprisingly little attention. In relation to intermediality, Joachim Paech (2002) has argued that the re-appearance of a media-specific form in another medium is, in fact, a common characteristic of media development in general as already famously proposed by Marshall McLuhan. Intermedial figuration, then, makes this process visible through a figure of its own, a ‚third figure’, for example the figure of a transition in film or of a re-framing and cashing that becomes necessary when film is shown on television. Intermedial figuration, for Paech, is therefore a figure that gives form to intermediality itself.

86
that diagrams involve a “transfigurative potential,” while transfiguration is defined as the translation between manual acts and cognition. However, such a model of cognitive transfiguration does not fully cover the discursive specificity of the diagrammatic that is at stake in the present case study. Bauer and Ernst (2010) have emphasized that diagrams are involved in a cycle of reasoning, experimenting and inventing, which they described as an ongoing configuring and reconfiguring; for example, when engineering diagrams provide the abstract model of a machine that can then be tested in simulations and which will eventually reconfigure the model and diagram. The process of cognitive transfiguration is therefore an important part of this diagrammatic cycle of con-figuration and recon-figuration. But the scope of the diagrammatic cycle goes beyond that: Firstly, because the diagrammatic process encapsulates a whole transformative arc of reasoning, for which of course cognitive transfiguration is a primary process – especially to close the hiatus between perception and thinking in a dynamic, virtualizing way and as it has been interpreted from Kant – but this process of cognitive transfiguration would not be sufficient for describing the full process of the diagrammatic, which equally includes the epistemic acts of probing, experimenting and trying anew until a revision and reconfiguration appears adequate. Secondly, the diagrammatic process is distributed across different participants and actors who subscribe to these epistemic acts in a similar way, for example, an engineering team that iteratively comes to agree collectively on the reconfiguration of an initial sketch.
How do we apply this idea to the present case study? The configuring and reconfiguring and the transformation in reasoning that is characteristic of the diagrammatic discourse does not have to be limited to short time frames like that of an engineering process. Between MacMahon, Pugh and Ipsen on the one hand, and Krieger on the other hand, there is a continuity of configuring and reconfiguring causal models, in that they reference the image of the causal chain as a start, negate its implication, but also spin this figuration further by adding images and subtracting formal components, extending and reconfiguring the diagrammatic discourse about epidemiological causation. We could therefore speak of a recognizable diagrammatic series that spans thirty years, while also allowing for the changing of figurative connections within this series and their respective inter-spatial structure. Against the background of a semiological conception of diagrammatic iconicity, which regards iconicity itself to be rooted in inter-spatial structures (e.g. Heßler and Mersch 2009, 25), the diagrammatic only represents a special case or a particularly evident example of a general property of iconicity. From this perspective, one might say that diagrams express a general trait of iconicity by fixating marks of spatial relations on an image surface. A discursive perspective on figurative series adds to this understanding that diagrams are embedded in a longer series of structural similarities between different images, which are equally mobilized in the game of

87
expression and which together can form a figurative unit. In this figurative series of structural similarities, some diagrams can obtain an outstanding role, for example, by being placed at the end of the series as a seemingly result, against which the other figurative participants in the series appear as premises.
We could then define a diagrammatic process as the coiling and uncoiling, winding and unwinding of this figurative series of structural similarity. And in the context of the case study, this process brings forth a more or less distinguished propositional content – that is to say that the series is characterized by additions and negations between the component parts of the series. Moreover, the diagrams that obtain a particular role because they appear as the result or concretization of the series, also receive the status of an epistemic object, which even though it is not entirely finished and still in the making, it can provide for stable orientation and for claims to truthfulness, adequacy or accuracy. The stability of these outstanding diagrams is not only the result of their coherent use among a group of interpreters, but also the result of their ‚medial resistance‘. And this resistance, in turn, is not only rooted in the materiality of the carrier of inscription, but also in the diagram‘s belatedness in relation to the figurative premises: in the diagram‘s belated role in the process of argumentation and of the bringing forth of a propositional content (see Alloa 2019, 72). In order not to cut the inventive force of the diagrammatic process, however, this stability of the diagram also cannot be too ultimate, but it has to allow further figurative series. On the one hand, the format of the scientific text is designed to find an end, and if we solely consider the scope of the text, the diagrammatic seems to find its ultimate contour. On the other hand, the figurative series must also be coiled or rolled up by each reader anew and will possibly be extended at some point. This reworking of previous diagrammatic processes finds an obvious example in the sequence of texts by MacMahon, Susser and Krieger.
Finally, it is of additional historic importance that these authors also began commenting upon their own diagrammatic strategies rather than taking diagrams for mere illustrations. That, in other words, the diagrammatic discourse about epidemic causality were to also establish a kind of meta-figurative discourse, in which the use of certain diagrams was justified in this or that way. More clearly than any of the other authors, especially Krieger reflected upon processes of figuration, on the use of metaphors and diagrams, and of transforming the figurative potential of her discipline. MacMahon, Pugh and Ipsen had also reflected on the figurative potential of their field when they had criticized the image of the causal chain for not being able to sufficiently instruct decisions in epidemic control. But Krieger’s theoretical gesture moved beyond the representational and pragmatic problematization of figurations towards one that accounts for its displacing and intervening function. Mediated by Susser’s emphasis on partial ‘frames of reference’ in causal modeling, she described the figurative process in a manner that

88
was self-reflexively explicit about the value systems that any figurative strategies of theoretical modeling impose, and this dimension of her argument pointed beyond MacMahon, Pugh and Ipsen’s earlier account. We could therefore conclude that, in the context of epidemiological theory in the US between the 1960s and 1990s, and more specifically in the subarea that would sometimes be labeled as ‘critical epidemiology,’ we encounter the development of a self-reflexive diagrammatics discourse.
Overall, the chapter presented a use of diagrams for theoretical modeling that is also common in other domains of knowledge. However, it becomes a practice that is specific to the context of epidemiological theory, through the combination of different images and particular rhetorical acts and negations. The diagrammatic process of epidemiological theorizing presented here entailed acts of figurative combination, graphical subtraction, of negating the semantic of 'distance’ and 'direction’. At the same time, establishing this practice through the analysis of three example publications is necessarily limited in scope. Yet, it gives a sense of the plurality of topological acts and images that may populate the fields that I am iteratively charting through the chapters of this book. Moreover, I believe that one can use this case study to develop a perspective on the endurance of what we call a diagrammatic process. We can identify the diagrammatic as such and such as long as the cycle of figuration and reconfiguration is present; only when the last reconfiguration has 'muted’ its history, when it comes across merely as a deductive model, has the diagrammatic ceased to be. In other words, it is the moment when the roles of mediator and intermediary become (re)distributed, centered and fixed, and an image like the causal web or the network is reduced to the status of a model and to the general and main agent of representing epidemic causation. At this moment, the diagrammatic debate loses its material flux and instead of text-image and image-image combinations, the circulation of this one particular image alone seems to be sufficient. Of course, this model may be the starting point for new diagrammatic processes but for the moment it indicates a closure or fixation of the previous diagrammatic cycle. In the next chapter, we will see how such closures may be enforced strategically to install boundaries between disciplines and center epistemic practices.
89
3. Centering the geomedical map before, during and after World War II
With the previous chapter, I introduced one possible research trajectory for studying how epidemiological knowledge and diagrams might be related. It was placed there as an introduction into scientific reasoning about epidemics and to familiarize ourselves with a typical genealogical discourse about epidemic causality that characterizes epidemiological science. For the rest of the book, however, I will increasingly diverge from this trajectory. The focus will shift more and more towards diagrammatic processes in a more extended sense, that is, beyond the interaction of graph drawings and written commentaries, and beyond scientific handbooks and journal articles about epidemiological theory. Nevertheless, we will encounter the concepts of the causal chain or causal web here and there again as a theoretical reference in the materials and authors I analyze, and some key theoretical interests from the previous analysis will continue to occupy me in the chapters that follow, such as the connection between different figurative potentials. But whereas the connection in the previous chapter was one between the potentials of verbal commentary and pictographic content, the diagrammatic relationship in the present chapter will be sought between map, table, and commentary. Moreover, one of the main interests will again be how the use of diagrammatic artifacts stabilizes or coordinates a specific field of knowledge and action.
The empirical starting point of the present case study is the contemporary success of spatial analysis, and by extension, the popularity of medical geography. As I already alluded to in the previous chapter, the historical-geographical tradition in epidemiology was absorbed into a more complex methodical and methodological architecture of a multidisciplinary epidemiology after the First World War. Surprisingly, however, the geographic method regained importance during the 1930s and until the 1950s both in Germany and in the US. One could come to see this as an independent development in geography and keep it distinct from epidemiological knowledge in a wider sense, if it had not been specifically labeled as an epidemiological endeavor. Once situated in the framework of epidemiological knowledge, however, the geographic method on its own appears as a mere reduction of the spectrum of epidemiological methods and science available at the time. This reduction of epidemiological to geographical thinking and then to spatial analysis,

90
I would argue, also occupies us today and I will return to this assumption in the final chapter of this book. By way of the present chapter I wish to contextualize this centering of geo/graphical methods in epidemiological knowledge and thereby also extend the list of relevant diagrammatic media.
The juncture of geographical and epidemiological knowledge reaches far back in history and also beyond the medium of the map into various other technical ensembles that allowed for comparing mortality data or planning intervention methods.25 However, the period of disease mapping that concerns me here by way of introduction starts in the 19th century. Since then, the use of geographical methods for epidemiological enquiries has gone by different names. Among the disciplinary concretizations within this field of practice have been, for example, Geographical Pathology, Medical Topography, Medical Geography, Ecology of Health and Disease, Health Geography, Landscape Epidemiology, and most recently, Spatial Epidemiology. From the 1950s onwards, the discipline of Medical Geography has probably served as the most regular umbrella term for nesting these different yet related disciplinary developments. Contemporary handbooks of Medical Geography (e.g., Meade and Emch 2010) use the disciplinary label in this wider sense, although they also include more statistics-infused versions, which in other places might fall under the term Spatial Epidemiology (Elliott et al. 2001). Moreover, the disciplinary shaping and institutionalization of medical geography until at least the mid-20th century was intimately connected to colonial science and, more specifically, to tropical medicine and military-related research projects (Brown and Moon 2004). Further below I will detail one such project in Germany in the years around the Second World War.
Many disease maps and atlases from the 19th century used data of past disease incidences that had been recorded by early statisticians or had been published in reports by military or scientific explorers. In effect, two different data infrastructures seem to have shaped those early years of epidemiological mapping: On the one hand, rather local approaches by early statisticians, urban doctors or military field staff who would both gather data and eventually produce maps. Popular examples are the work of William Farr, Florence Nightingale, and John Snow. On the other hand, the 19th century also saw the emergence of many text-based atlases on diseases with country profiles, which integrated data from various sources without yet having an international reporting system in place (Hirsch 1881; 1883; Davidson 1892; Creighton 1894). Even though these latter compendia did not always include maps, they are prominent examples of the tradition of Medical Geography – or of the historical-geographical tradition of descriptive epidemiology – because they
25 For a history of disease mapping and medical geography, see, among others: Koch 2011; Bolton Valencius 2000; Barrett 2000. For a history of health statistics, for example: Desrosières 1993; Bayatrizi 2008, 2009.

91
described the climatic, geological, and disease characteristics of a specific area and they sometimes motivated other authors to produce maps based on their data. Some of these works were firmly rooted in colonial science and tropical medicine, while others concentrated solely on Western countries. Altogether, these two genres – the national and international atlases on the one hand and the local maps by doctors, nurses and newly established statistical offices on the other hand – are the two scalar extremes of how 19th century epidemiological mapping developed partially in combination with but sometimes also due to the lack of a standardized data infrastructure. The need to re-invent the data infrastructure of disease reporting and research was acknowledged both in the Sanitary Conference that started to take place from 1851 onwards (Huber 2006), and by scientists producing these atlas works. A common trope that arose in this context and which continues throughout the history of epidemiological knowledge as a seed of dispute was the idea that not only does ‘disease know no borders’ (King 2004) but also that ‘disease data knows no borders,’ and that traditional demographic units such as national boundaries are insufficient infrastructures for doing medical-geographic work (e.g., Davidson 1892, 12).
Throughout the 20th century, with multiple developments in the areas of international health regulations, statistics, and information and communication technologies more generally, the data infrastructure of medical geography changed drastically, due to new data sharing regulations, geographical information systems and the use of remote sensing technology, for example, for the early monitoring of epidemic risks. At the same time, the computational infrastructure transformed radically as in all other areas of life and made different mappable forms, interfaces and interactions between contributors possible. Against the background of these general changes in data and computational techniques in the 20th century, it becomes increasingly difficult to speak of a knowledge infrastructure that is limited to the specific community of medical geographers. At the same time, this also makes it more complicated to define the relation of medical geography to the science and public health practice of epidemiology. The label medical geography hardly suffices to describe the many ways in which geographical knowledge and knowhow permeated epidemiological practices.
In the present chapter, I will detail some of the knowledge infrastructure of medical geography. At the same time, I will foreground how practitioners have described the particular epistemic capacities of medical-geographic techniques and thereby hypostasized a technology rather than just a set of techniques. This technology encoded both the techniques of mapping and an epistemological framing or interpretative key that emphasized mapping as a distinct form of visual reasoning and in opposition to the traditional numerical mode of reasoning common to statistical epidemiology.

92
The years between 1930 and 1960 are particularly interesting in this respect as a bifurcation moment between the infrastructures and technology of epidemiology and medical geography and I will discuss these years in more detail below. We might understand these years as an important hinge between what epidemiological handbook historiography has termed the era of classical epidemiology, ranging from the 1830s to the end of bacteriological dominance after the First World War, and the new epidemiology that was about to emerge after the Second World War. This historical hinge also comes right after the time when different discursive offers for complexification in epidemiological theorizing had been made and which I have discussed in the previous chapter. Against this background, the case study of the present chapter presents a stark contrast and details how in the 1930s and in the context of the Second World War attempts were made to elevate the century-old discipline of medical geography to a new central position in the spectrum of epidemiological knowledge. More specifically, I will focus on how the medium of the map and the technology of mapping was promoted as a specific knowledge infrastructure for generating causal models or predictions. Importantly, in this context it does not suffice to analyze the knowledge infrastructure as the product of immanent struggles and stabilizations: it must also be addressed as a means for strategic disciplinary distinction and political alliances with fields of practice and expertise that are projected as an outside to which a newly bounded discipline can then be related by affiliation or difference.
In terms of history, I will proceed in three steps: First, I will briefly outline two primary functions of epidemiological inquiry for which mapping has been functionalized over the coupled historical development of medical geography and epidemiology – correlation inference and prognosis. I will then follow up with the investigation of medical geography shortly before and during World War II by focusing on the example of German Geomedizin and its alliance with other diagrammatic contexts and political discourses of the time. In this context, a new technique of ‘epidemiography’ was proposed and proponents reclaimed the functions of prognosis and correlation for establishing Geomedizin as an epidemiological discipline. Moreover, they emphasized the cartographic techniques of isoline or contour mapping as a dynamic form of visualization and more extensively commented upon the cognitive-aesthetic value of mapping. In a third step, I will turn to the years after the Second World War and how Geomedizin was integrated into international discourses about disease ecology and landscape ecology.
I concentrate on the example of Geomedizin for two reasons: First, a research-practical reason, in that I have easier access to the historical materials regarding this field of study, and I hope that it may assist other researchers in building upon my analysis and open it up for more comparative analysis. The second reason is

93
research-political and is meant to contextualize the claims made by the software developers mentioned in the introduction. When the company ESRI labels its take on disease mapping as ‘geomedicine’ (Davenhall 2012) it seems necessary to me to provide some background on where this label comes from and how the contemporary celebration of disease mapping – as a means of intellectual insight and inference – looks back on a long tradition of disciplinary struggles and varying political instrumentalizations.
3.1 Mapping for correlation and prognosis
Because the discourse of medical geographers that I will later discuss both relates to and distinguishes itself from epidemiology, it is necessary to understand how this relation and distinction between the disciplines was prepared by earlier forerunners. What bridges between these forerunners and later medical geographers is the capacitation of mapping for two of the main techniques and aims of epidemiological inquiry: 1) etiological hypothesis building or the inference of correlations between different disease-related factors, and 2) prognostic judgments. For the generation of hypotheses about how two things relate – for example environmental factors and disease –, the concepts of association, correlation, and causality are usually distinguished in contemporary epidemiology. From this perspective, disease mapping does not establish causality but merely a hypothesis about an association between different factors, and this level of not-yet established causality would then be further assessed to determine whether it also reaches a stochastically significant level of correlation.
However, this terminological distinction between types of relationality cannot be projected onto the historical episodes I am going to present. Rather, when claims are made in this context of using maps for the inference of epidemiological causality and correlation, this may be based on a different meaning of these terms; sometimes using them interchangeably. More important is the fact that the terminology in medical geography changed, picking up terms used in other fields of epidemiological knowledge, even though medical geographers did not follow closely the statistical meanings of these terms in their own deployment. As we will see below, at a certain point in the time around World War II maps were framed as aids for correlation and therefore for the visual supplementation of etiological hypothesis building. Because traditionally correlation is a formal concept derived from statistics, the functionalization of maps as tools for the computation of disease correlations connected with this statistical-epidemiological discourse on the one hand, while also deliberately aiming to distinguish its own graphical method from statistics’ reliance on numerical computation on the other hand.
The second objective of epidemiology for which mapping was increasingly used

94
by some authors in the years around World War II was the function of prognostic judgment. However, while in epidemiology prognosis is a long-established concept, the way it was applied to the use of maps in medical geography narrowed the concept down to forecasting. Before detailing the functionalization of the map for correlation and prognosis in the years around World War II, I consider it useful to introduce some background to these debates by returning to a century earlier, when mapping and statistics as well as prognosis and etiological hypothesis inference met without the same disciplinary institutions in place yet.
One of the most prominent and active experimenters during the early years of epidemiological mapping was William Farr, who developed a visual-statistical approach to the study of epidemics. His work is particularly interesting because it introduces both the notion of epidemiological prognosis and a visual-graphical approach to etiological hypothesis building. The visual work of Farr has been extensively reviewed by Koch (2011), so I will only present a very brief introduction. Farr worked from the 1830s onwards at the newly founded General Register Office in the UK and tested different visual formats for inferring patterns of disease from statistical data, including maps, wave plots and histograms. His aim was to infer knowledge about the association between environmental factors and disease occurrence, for example between altitude and cholera incidence, and subsequently to deduce causal hypotheses. The visual work that Farr is most known for appeared in his 1852 "Report on the Mortality of Cholera in England, 1848-1849” (Farr 1852). There, he presented a range of different graphing formats from maps to charts and combinations. Among his diagrams were also examples that displayed some form of hybridity between table and map, leading Koch to name them "table-maps" (2011, 174). For example, Farr set out to study the relationship between cholera mortality in London and a number of locational variables such as the distance to the river Thames or altitude. To assess the first relationship, he sketched a map of London with mortality rates symbolized by numbers and rough outlines of different administrative units (Figure 4). The river Thames was represented by two geometrically parallel and horizontal lines, and the different mortality numbers were lined up perfectly on an invisible horizontal grid. The numeric representation through an abstract two-dimensional grid gave the image the appearance of a table while simultaneously integrating aspects of the medium of the map by showing the mortality numbers in spatial relation to the position of the Thames and demarcating administrative boundaries.
Although Farr did not comment on the epistemic function of his diagrams in any detailed way – he only referred to them as “illustrating” (1852, IV-V) – one can see from his examples that mapping was already put to serve the first function mentioned above: to generate etiological hypotheses, for example connecting water or altitude and cholera prevalence. Moreover, it is important to note that Farr

95
Figure 4. ‘Table-maps’ by William Farr. Reprinted from Farr (1852, Part 1, 164-65).

96
experimented with the map as one possible graphing technique and presentational format among many rather than being the primary and only choice. As a statistician he also extensively used tabulations in his report and his diagrams varied greatly in style.
In addition to his visual work, Farr also wrote theoretical commentaries on the practice and history of epidemiology. Famous among his writing is the text “On Prognosis” published in 1838 (Farr [1838] 2003). He noted that the concept of prognosis had been part of epidemiological knowledge since Hippocrates, under the name of prediction, whereas Farr himself preferred to define it as “the art of foreseeing and foretelling the course and issue of diseases” (Farr [1838] 2003, 219). However, he did not wish to limit the concept to the future, and even dismissed futurity as merely “accessory.” In his account, and he emphasized that this was also Hippocrates’ understanding, the aim of prognosis was “from a given group of morbid phenomena, to determine the phenomena that will follow or that have preceded, and their mutual relations” (219). Moreover, he used the concept and technique of prognosis to divide responsibilities between the epidemiologist and physician or doctor. The epidemiologist was expected to provide general trends that could be used by doctors to infer the likely development of an individual case and suggest treatment accordingly. Farr proposed a separation of labor so to speak, with the doctor being responsible for diagnosis, the epidemiologists for prognosis, and finally the doctor coming in again for therapeutics (220).
Contemporary commentators on Farr’s text on prognosis from within the scientific discipline of epidemiology have emphasized his innovative use of life and death tables (Morabia 2004, 127-198). If we consider the table as a diagrammatic medium itself, it in fact complements the other techniques used by Farr such as maps, and in the spirit of his ‘table maps’, one can see a whole diagrammatic technology developing in his hands. However, Farr nowhere connected his later use of maps to his earlier and detailed conception of prognosis and to the media that supported prognostic techniques. It seems that for Farr the use of maps was limited to etiological research instead of being considered a prognostic tool as well.
A more extensive functionalization of mapping, which then also came to include prognosis as one of its primary objectives, can be seen roughly a hundred years after Farr when an attempt was made to institutionalize – or rather re-institutionalize – the technology of disease mapping in the years around World War II. The prefix ‘re-‘ is chosen here because of the previous decline of the historical-geographical method in epidemiology, giving way to a mix of bacteriology, statistics, and mathematical epidemiology as the dominant styles of reasoning at the time (see Chapter 2). Moreover, these attempts to re-institutionalize disease mapping between 1930 and 1960 were often embedded in developmental or military agendas. Among these attempts was, for example, the project of Geomedizin in Germany (Olzscha

97
1938; Zeiss 1944; Rodenberg 1952), military atlas projects in the USA (Simmons et al. 1944), attempts to institutionalize Medical Geography at the International Geographical Union (May 1950; 1952), and congresses on medical geography in the 1960s in the Soviet Union (Shoshin 1964). In contrast to the epidemiological practice of William Farr, these projects laid all their emphasis on the medium of the map as a paradigmatic tool for epidemiological analysis, including etiological correlations and prognosis and without distributing the work across different visual formats.
I will concentrate in the following on the German project of Geomedizin, which has a troubling history on the one hand, but which has been picked up by contemporary software developers on the other hand without much historical consciousness (Davenhall 2012). Further, practical research aspects such as language and access to primary research materials make a study of Geomedizin more feasible for me than its contemporary counterparts in the US or the Soviet Union. I will nevertheless take parts of this episode as exemplary for medical geography more generally, mainly for its turn to ecology, not least because authors in the field made occasional reference to international developments beyond their national projects.
3.2 The political epidemiography of German Geomedizin
The project of Geomedizin had different phases of development in Germany but was initially and outspokenly aligned with “Geopolitik” and the ideology of the Nazi regime at the time (Weindling 1993). Heinz Zeiss, who was the leading figure of the project and editor of the so-called Seuchenatlas (Atlas of Epidemic Diseases) during the war, explicitly emphasized the necessity of Geomedizin for military advancement (Zeiss 1944a, Einleitung). Moreover, a few years earlier Zeiss and Rodenwaldt issued a “call to the German hygienists” that if the state’s theory were to be based on principles of “Rasse und Raum,” the goal of their discipline was to arrive at a better understanding of the ecology of particular “Lebenskreise” (Rodenwaldt and Zeiss 1938, I-II). After Zeiss’ death in 1948 and despite the project’s affiliation with the racist ideology of the Nazi era, the project of Geomedizin continued further at the University of Heidelberg, under the supervision of Ernst Rodenwaldt and Helmut Jusatz. They updated the old wartime atlas of epidemic disease into a new World Atlas of Epidemic Diseases or Weltseuchenatlas in 1952 with the support of the US military (Rodenwaldt 1952) and extended it with two further volumes in the following years (Rodenwaldt and Jusatz 1956; 1961).
At multiple times, both the old and new editors of the project emphasized the map-based inference of etiological correlations and the “foresighted” and “prognostic” function of epidemiological mapping as key for Geomedizin (Jusatz

98
1938; Zeiss 1944b; Rodenwaldt 1952). However, their notion of prognosis did not have the specific epidemiological meaning given to it by William Farr a century earlier but equated it more generally with the meaning of forecast. The geomedical author Jusatz published an article in 1938 in which he set out to specifically reflect on the “possibility of an epidemiological prognosis” but simply used the notion of prognosis synonymously with “foretelling” (“Voraussage,” Jusatz 1938, 205). In 1944, he concluded his article for Zeiss’ Seuchenatlas by stating that the two functions of disease mapping were its use for prognosis and for the study of the origins of disease, or etiology (Jusatz 1944, IV). Besides prognosis, the second main task of Geomedizin according to the authors was sometimes referred to as "diagnosis" and sometimes as etiological research about the causes of disease (Zeiss 1944, Jusatz 1944). Especially Rodenwaldt’s work would be associated with this line of Geomedizin and from 1952 onwards he would also specifically speak of the maps’ potential to show "correlations" (Rodenwaldt 1952, 9).26 With their double emphasis on the correlational or etiological function of mapping on the one hand, and the prognostic function on the other, the authors of Geomedizin sought to continue typical discourses in medical geography and epidemiology, but also to establish their own disciplinary standing and methodical toolbox.
Accordingly, these authors commented more intensively and explicitly on the map medium than Farr had done in the above-mentioned publication, trying to institutionalize their discipline by means of a specific technology of mapping. One of the reasons for the authors of Geomedizin intensifying their epistemological commentary and technological intervention might have been to legitimize their projects against competing methodological developments in epidemic disease research during these years, especially against the renewed importance of statistics (see Chapter 2). An alternative interpretation could be that their aim was to connect to visual conventions in political discourse and daily news, where maps were among the primary media used to showcase the advancement of troops. Indeed, Zeiss (1944b) mentions such associations in his calls for developing a more dynamic map to facilitate the prognostic function, that could adequately represent the dynamic of epidemics similar to maps used to represent “geopolitical processes and movements.”
To achieve this, geomedical authors were particularly interested in the possibility of using isolines to represent the spread of epidemics. At the time, isolines had come to fame due to Humboldt’s use of isothermes and their standardization in climatology, but also because of their use in the depiction of travel time – so-called isochrones – since the turn of the century (Riedel 1911). The first use of
26 In earlier publications, authors affiliated with Geomedizin would speak of interrelations and coincidences, and the possibility of making visible "causal chains" (see discussion below).

99
Figure 5. Comparison of different isoline maps by Reiner Olzscha (Olzscha and Zeiss 1938, Tafel 1). Reprinted by permission from Springer Nature.

100
such isolines for the depiction of points of similar disease counts occurred in a map by Reiner Olzscha in 1938 (Figure 5), published in the Zeitschrift für Hygiene and accompanied by a foreword by Zeiss (Olzscha and Zeiss 1938). Zeiss would repeatedly come back to this example in wartime publications as one of the first steps towards a more dynamic map.
Moreover, with this journal issue and the map and article by Olzscha and Zeiss it became clear that the authors of Geomedizin aimed at more than simply another type of map. The project attempted a new “epidemiography”, as they called it, a new technology for the graphical tracing of the propagation of disease (Olzscha and Zeiss 1938). This attempt was carried over to the publications of the wartime years, where common tropes about the data infrastructure of epidemiology and public health were re-purposed to substantiate the geomedical technology. For example, it was said that traditional “statistical maps” were not sufficient anymore, and implied that the administrative boundaries that they were based on were inadequate for the tracing of epidemics and the planning of their control (Jusatz 1944, III). In other words, the authors explicitly problematized the existing data infrastructure of administrative epidemiology to instead install their own set of visualization techniques which already used more suitable data. In addition, standard “distribution maps” were criticized as being too static, and so-called “spread maps” (“Ausbreitungskarten”) were supposed to provide a more dynamic experience, spearheaded by the first dynamic map created by Olzscha (Jusatz, 1944).
Altogether, the authors of Geomedizin sought continuity with basic aims and technical terms of epidemiology on the one hand, through concepts such as correlation and prognosis, while on the other hand aligning with visual conventions from the discourse about Geopolitik, and eventually distinguishing their own approach from existing technologies in epidemiological research, especially statistical media. In addition, they attempted to objectify their technological specificity by proposing new graphical objects such as the 'dynamic map' and the figure of the isoline for geomedical inquiry.
3.3 Wider diagrammatic context: The virologists’ chain of infections
The emphasis on disease mapping as a core technology of epidemiological prognosis and correlation must be situated within a wider graphical or figurative context of experimentation and modeling at that time. In the following, I will point to one such context through the example of the diagram of the infectious chain. This will also bring back the trope of the causal chain mentioned in the previous chapter. Of course, the notion of a causal chain and that of an infectious chain must be distinguished. In fact, they seem to relate like a parent and child concept, where the causal chain

101
is a necessary conceptual prerequisite for an infectious chain to make sense. But such abstract semantic taxonomy does not tell us much about how these conceptual resources become entangled in a specific historical context. Moreover, the idea of a causal chain is so intuitive that it would be difficult to limit it to epidemiological knowledge alone. However, there are important aspects that distinguish the image of the causal chain in the context of epidemiological knowledge and especially for the years between the world wars that are in question here. The first aspect is its importance for the old bacteriological dream of hunting, tracing and tracking down the path of even the last microbe – something that Robert Koch would describe with reference to the image of an invisible “chain” (Mendelsohn 2007, 243). Although the bacteriological call to trace the last microbe would come under increasing scrutiny during the 1920s in epidemiological modeling and control – as the study of Mendelsohn mentioned in the previous chapter demonstrated – this does not devalue the influence of the general image of a microbial pathway and of its tracing. One can multiply the factors and inter-factorial connections, but the validity of how one imagines one of the factors, for example a microbial movement along a tracible pathway, is left intact. The question is whether this image of microbial chains can speak pars pro toto for the causal chaining in the whole complex. In this sense, bacteriology (and other contagion discourses before it) has handed down an exemplary instantiation of a causal chain in epidemiology that would be difficult to undo even if one multiplies the factors. The second aspect that particularized the epidemiological chain at this time was the development of virology during the 1920s and its propagation of the concept of the infectious chain (Infektkette). Together, the image of tracing microbes and that of the infectious chain are important diagrammatic features of epidemiological knowledge during these years and also influenced how authors from the field of geomedicine expressed and developed their own diagrammatic style.
For the publication of a popular science magazine in 1937, the geomedical author Ernst Rodenwaldt claimed that the aim of every epidemiologist should be to establish a “gap-less causal chain” (“Lückenlose Kausalreihe,” Rodenwaldt 1937). In his own exemplary case study, he claimed to have done so by establishing a gapless causal chain between geomorphological features, for example deforestation, and the emergence of disease. With this proposal he not only alluded to an intuitive and popular model of causality that works by linear contact, but he also mobilized a salient bacteriological and virological image of the time and what would stand in for epidemiological knowledge more generally. The same image of the gapless causal chain would later be picked up by other geomedical authors such as Jusatz (Jusatz 1958). Importantly, the meaning of the causal chain did not entail that it cannot branch out and include other causal factors. More important was that by way of the figure of the chain something implicit could be made explicit: a connecting line that

102
brings to light an otherwise imperceptible causal process. This call for the making explicit of causal chains as a standard protocol for epidemiological science coincided with attempts to institutionalize particular inscription practices during these years. Geomedicine is one such example, aiming at the geographical explications of causal chains. Virology would be another one, targeting the so-called infectious chain by drawing abstract diagrams of the entities and pathways involved. These two fields did not exist independent of one another; geomedical authors would appropriate the infectious chain diagrams for their own work.
The schematic representation of infectious chains was used by the hygienist Emil Gotschlich in a handbook on hygiene as early as 1913 and for the particular study of plague (Gotschlich 1913, Figure 6a). Within the early years of virology, the Hungarian-Swiss virologist Robert Doerr started using the term ‘infectious chain’, first in a handbook on internal medicine published in 1931 and later in a handbook on virology published in 1938 (Doerr 1931, 1938). An important bridge between these virological and hygienic takes on a schematic representation of infectious chains and geomedicine was the bacteriologist Horst Habs. Habs was employed at the Hygiene Institute of the Berlin University, which was directed by geomedical author Heinz Zeiss, and where other geomedical authors such as Jusatz and Rodenwaldt were also employed. In 1942, Habs published an article with a graphical schematization of an infectious chain, citing both the hygienic and virological traditions as inspiration (Habs 1942, Figure 6b). The interest among geomedical authors in this type of schematic epidemiological representation continued until after the war, when Rodenwaldt and Bader used the visual diagram of the infectious chain in their handbook on hygiene (1951, 443-457). These first diagrams distinguished between types of chains depending on the number of biological species involved, abbreviated each organism by one letter, symbolized the contact between two organisms using arrows, and used additional signs such as +, –, and small letters for their status as healthy, infectious, or immune individuals. By using brackets and mathematical exponentiation, these diagrams usually resembled formal languages. Seeliger (1953) used the same symbolic code in an article published in the new journal Beiträge zur Hygiene und Epidemiologie on the study of dysentery, an infection of the intestine (Figure 6c). He added food as an additional part of the chain besides different kinds of organisms. Another ten years later, Jusatz (1963) combined this diagrammatic tradition of the infectious chain with his interest in ecological models of disease causation and began to also include the environment as part of the chain.
Looking at these diagrams in comparison, the infectious chain diagram became increasingly complex over time, involving more and more factors. Moreover, it stepped outside of a one-dimensional linearity to indicate either the ending and beginning of a new chain, or a different categorial order of species, or simply to
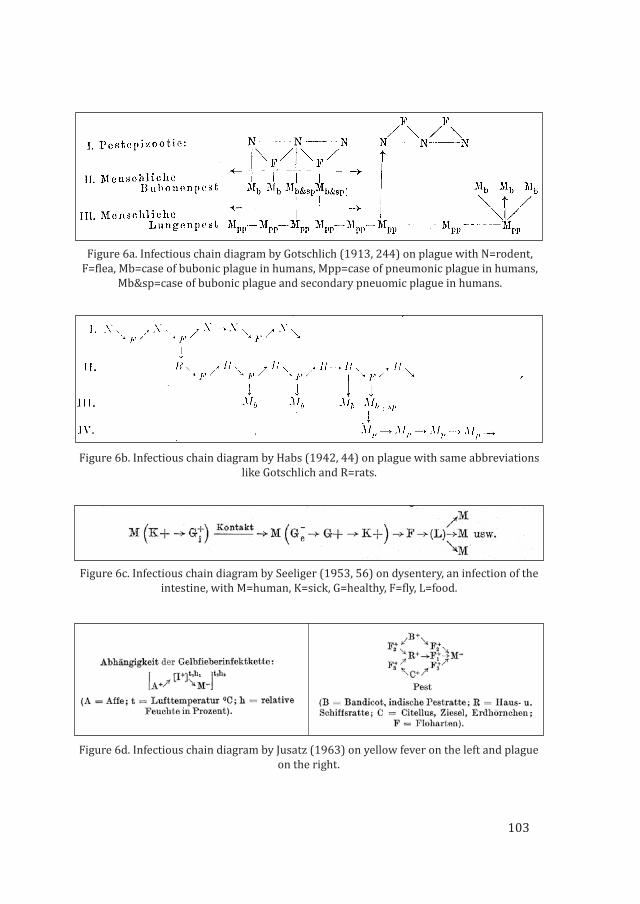
103
Figure 6c. Infectious chain diagram by Seeliger (1953, 56) on dysentery, an infection of the intestine, with M=human, K=sick, G=healthy, F=fly, L=food.
Figure 6d. Infectious chain diagram by Jusatz (1963) on yellow fever on the left and plague on the right.
Figure 6b. Infectious chain diagram by Habs (1942, 44) on plague with same abbreviations like Gotschlich and R=rats.
Figure 6a. Infectious chain diagram by Gotschlich (1913, 244) on plague with N=rodent, F=flea, Mb=case of bubonic plague in humans, Mpp=case of pneumonic plague in humans,
Mb&sp=case of bubonic plague and secondary pneuomic plague in humans.

104
make space to show bidirectionality. The integration of environmental factors as in Jusatz’s diagram (Figure 6d, left), however, was elevated to an entirely different order outside the parentheses, as if to say that environmental factors were conditioning the whole of the causally chained complex. Moreover, the last step of formalization brought the initially intuitive diagrammatic idea of a chain closer and closer to a typical mathematical equation. However, even though the factors involved might have grown more complex, the chain diagram in all its guises insisted on the concreteness of the causal relation, visually represented as an arrow, rather than illustrating the simultaneity of factors whose association had yet to be objectified.
3.4 Postwar ecological turn and diagrammatic discourse
After the war, the project of Geomedizin found a new home at the University of Heidelberg and was continued by Ernst Rodenwaldt and Helmut Jusatz. With the changing political and also supervisory context, the way in which disciplinary alliances and boundaries were drawn began to change as well. On the one hand, the authors published handbook introductions about epidemiology in general rather than taking the position of a spokesperson for geomedicine alone (Rodenwaldt and Bader 1951; Jusatz 1963). On the other hand, Jusatz began to discuss conceptual overlaps with the newly emerging discipline of landscape ecology (Jusatz 1958). This reference to landscape and to explicitly ecological models had never been absent but it was now pursued in a different academic environment, and joined similar developments in international medical geography. Landscape ecology had already been introduced into the German context in 1939 by the geographer Carl Troll (Troll 1939), who after the war also wrote a positive review of Rodenwaldt’s Weltseuchenatlas (Troll 1953). Both landscape ecology and Geomedizin were equally interested in finding new ways of geographical imaging and thereby accounting for environmental relationships. In 1958, Jusatz commented on the integration of a landscape-ecological analysis with geographical medicine. In this article, he emphasized that the geomedical understanding of environments differs from earlier medical geographers of the 19th century such as August Hirsch who had based their analysis on “clinical appearances,” while geomedical research is based on the assumption of a “nosological unity of disease type and pathogen” (Jusatz 1958, 285). He connected this to the idea that a pathogen can also be present without leading to apparent clinical symptoms, as “silent infection,” and that the same pathogen can also exist outside humans in other animal species but nevertheless within a particular place. Still with the same terms he employed during wartime, Jusatz described these places as either “disease spaces” (“Krankheitsräume”) or “epidemic spaces” (“Seuchenräume”) and particularly emphasized the notion of “potential disease spaces” and “potential situations” in a similar way he had highlighted

105
the prognostic function of mapping during the war (1958, 287). The notion of landscape from landscape ecology was intended to encode similar assumptions, that landscape types can be labelled and classified according to the pathogens that could potentially reside there. Technically, a landscape was supposed to be both an image and a spatial container for disease-ecological complexes, one that can be clearly located in space and compared over time.
The interest in combining ecological theories about epidemic disease with an understanding of mapping as being able to imaginatively accommodate and place these ecological complexes of factors was part of a wider trend in international medical geography during the 1950s. For example, when reporting to the International Geographical Union about the scope of Medical Geography, the French-American medical geographer Jacques May indicated that the initial plan of the commission had been to replace Medical Geography with the term “ecology of health and disease” (May 1952, 212). Although May was sympathetic to an ecological rendering of diseases involving multiple causal pathways from physical to social factors, his aim was not to replace medical geography but to outline its own ecological reasoning. In his historical study of disease mapping, Tom Koch (2005, 216) writes about May: “His goal was nothing less than to rewrite the study of endemic and epidemic disease in a manner that would expose the ecologies that fostered the relationship between agent, host, and vector.” And indeed, with his books The Ecology of Human Disease (1958) and Studies in Disease Ecology (1961), May further underlined this ecological foundation. In the same way that Jusatz had used the notion of ‘silent infections’ to stress the mapping of possible epidemic zones, or landscapes, May also declared that one important function of medical geography would be to identify “silent zones” in which all the factors for disease were there “except man” (May 1950, 27). Moreover, May asserted that medical geography might be used for development policies and techniques: “Medical geography could become a preliminary step to the redemption of backward countries throughout the world” (1950, 40). Another argument that corresponded with Jusatz was the reference to a nosology of place, or the idea that the ‘unity of pathogen and disease’ is congruent with the holistic picture of a particular landscape or habitat. In fact, such a model can be found not only in the publications of Jusatz and May but also in the Soviet branch of medical geography. There, this idea served to better predict and plan the future, to recognize the potential of environments: Shoshin (1964, 71) called the nosological unity of pathogen and disease the environmental “nosocomplex” and the predictive counterpart to the etiological nosocomplex the “nosoprognostic” function of medical geography.
Thus, two aspects of the larger discursive context of medical geography after the war must be emphasized: On the one hand, we find an increasing emphasis on ecological reasoning, which in itself was not very new. Not only has there been a

106
long tradition of ecological models in epidemiology, but also, as Anne Harrington (1995) has shown, holistic discourse existed all along in Weimar Germany and served both a national-socialist ideology as well as its opponents and therefore covered a whole spectrum of nuances and politicizations. Already in the racialized version of Geomedizin proposed by Rodenwaldt and Zeiss before the war, a presumably holistic integration of humans with their environment served as a causal background framework (Rodenwaldt and Zeiss 1938). On the other hand, we also see in the ecological turn after the war a continued emphasis on the predictive function of mapping. But it is now more explicitly connected to the potentialization of environments that mapping is supposed to make visible. At least in the context of wartime Geomedizin, the prognostic function of mapping was overshadowed initially by the call for dynamic maps that had put strong emphasis on predicting spread dynamics rather than environmental potential. After the war and with Jusatz more explicit turn towards landscape-ecological frameworks, the potentials of an environment as diagrammed actor in the causal chain of infection moved to the foreground.
However, against the discursive background just presented, some remarks by Jusatz and May speak against a narrative of ecological complexity and interwovenness. After all, their projects were driven by the attempt to institutionalize or re-institutionalize a system of visualization whose legitimacy would largely depend on the causal or correlational judgments it made possible and on the figurative and technological conventions that structured their own professional field and that of a wider professional public. In other words, their conceptual rendering of ecological complexity was constrained by their simultaneous attempt for adapting and innovating the technological condition of their field. In his article on landscape ecology, Jusatz (1958, 289) referenced Rodenwaldt’s proposal from the 1930s that a “gap-less causal chain” should be established by the analyst (Rodenwaldt 1937). Even though the figurative potential of the reductive causal chain undermined in a way other concepts presented in the text, it offered one particular advantage: because the proposal claimed the existence of causal chains, it became more legitimate, intuitive and widely understandable to map ‘the environment’ as an individual part of this chain, as something that other technologies and disciplines that were occupied with other parts of the causal chain – such as laboratories – could not make visible.27
27 If the image of the fractal in the previous chapter was supposed to counter the reductiveness of the causal chain, here the causal chain was mobilized in order to strengthen the tool of the map and reduce the object of the environment to a map-able actor.

107
3.5 Narrating the epistemic specificity of geomedical technology
The main authors of the different generations of the Geomedizin project (Zeiss, Rodenwaldt, Jusatz), all reflected about the epistemic specificity of the new visualization apparatus at hand. They repeated and shared a number of aspects throughout the forty years of the project’s existence, but at times they also chose to highlight different aspects. I want to summarize some of their assumptions about the epistemic role of Geomedical technology, because they point to possible continuities (and differences) in the way disease mapping is conceptualized in the following chapters. Moreover, discussing these aspects helps me to emphasize a wider meaning of epistemic specificity beyond the simple mobilization of a map for making epidemic events visible, and which resonates with the analytical framework that was introduced at the beginning of this book. In this view, the epistemic specificity of a field of practice involves particular techniques of reading, looking and drawing; specific alliances and boundaries between social groups; objectifications, subjectifications, and inter-medial connections; and sometimes a macro-epistemic framing, by which authors seek to embed their own technological narrative within larger currents of their time.
As far as similarities are concerned, most of the above-mentioned authors referenced in some way the practice of comparison, more specifically, comparing disease maps of an area from different periods of time, in order to identify the regular circumstances in which diseases stay endemic, disappear or reappear in an area. In fact, Rodenwaldt (1952) retrospectively identified the beginnings of what would later become his interest in Geomedizin as the moment when he saw a historical map and a contemporary one about the geomorphology of an area sitting side by side. Moreover, all of the authors emphasized the necessity of a "dynamic map" presentation for adequately investigating the dynamic ('the coming and going’) of the epidemic, and for drawing prognostic conclusions about epidemic events and endemic conditions in the future. None of the authors further detailed what exactly the specific epistemological scope of the property "dynamic" in this case entails – if it is reducible to a correspondence aspect, whereby a dynamic map is one that represents adequately the dynamic of an epidemic, or if it is a pragmatic aspect, whereby dynamic means the ability of the map to animate the dynamic of the analytical mind to perform prognosis, the movement that is necessary to extrapolate into the future. Rather than making any of these explanations explicit, the epistemological adequacy of the dynamic map was rather explained by way of opposing traditional 'static maps' and by placing the dynamic aspect in continuity with other and related disciplines (such as epidemiological prognosis, or the visual discourse of 'geopolitics').
Slight differences existed in how Jusatz and Rodenwaldt mobilized medial differences in order to promote the technology of Geomedizin, and whether they

108
emphasized what one might call the "synoptic dispositif" of cartography. By this I mean the presumed capacity of a map to facilitate an overview of a relationship within one picture.28 Mobilizing the synoptic dispositif in epistemic explanations of cartography was already traditional by the time, as is testified by Jusatz’s quote of mid-19th century medical cartographer August Petermann, who had highlighted the possibility of viewing statistical data in a map all at once and in relation to each other.29 However, Jusatz did not pick up on the synoptic quality, but only on the boundary between statistical illustration and cartography. For example, he distinguished maps from cartograms, which according to him merely served to illustrate statistics that would otherwise remain hard to read (Jusatz 1944, 2 of 7). By contrast, Rodenwaldt’s (1952) introduction of the Weltseuchenatlas specifically refers to this capacity to concentrate multiple correlations in one image. Interestingly, Rodenwaldt used this framing in order to connect the project to the wider 'visual culture' of his time. He declared that the "attitude of our contemporaries to many problems is observant, not only in an intellectual but visual sense. Our whole education is an education in looking." The atlas project, he continued, facilitated such a visual account rather than having to read and excerpt "printed text."30 In other words, whereas Rodenwaldt explained the epistemic capacity of the geomedical map through the synoptic dispositif, and connected it to a medial difference between map and text, Jusatz emphasized the difference between maps and cartograms to further demarcate the boundary between statistics and
28 It is named a dispositif here, because it concretizes a relationship between onlooker (who supposedly can overview and discern patterns from this overview) and image, or more generally, between gaze and picture, between subject positions and objectified presence.
29 „Während die Symbole der Massen statistischer Daten in Figuren – und seien sie auch noch so klar in systematische Tabellen eingeordnet – doch nur einen einförmigen Eindruck darbieten, vermitteln die gleichen Angaben in einer Karte verkörpert, auf einmal die relative Bedeutung und das Verhältnis der einzelnen Zahlenangaben zusammen mit ihrer Stellung, Ausdehnung und Entfernung“ (Petermann quoted in Jusatz 1944, 2 of 7, emphasis added).
30 "Alle Korrelationen, die wir im Stande sind, statistisch oder beschreibend zu erfassen, in einem Kartenbild zu vereinen, soweit die Möglichkeiten bildlicher Darstellung es erlauben, ist das Ziel, das sich die Kartographie der Geomedizin setzt. Die Einstellung unserer Zeit zu vielen Problemen ist betrachtend, nicht immer nur im Sinne geistigen, häufig rein visuellen Betrachtens. Unsere ganze Erziehung ist eine Erziehung im Schauen. Der Besitz dieses Kartenwerkes wird daher seinem Benutzer das Lesen ausführlicher Drucktexte, aus denen er sich meist erst durch ein Exzerpt ein konkretes der epidemiologischen Abläufe zu machen imstande ist, ersparen. Soweit überhaupt die Möglichkeiten kartographischer Darstellung es erlauben, soll der Benutzer des Kartenwerkes in den Stand gesetzt werden, aus dem Kartenbild mit nur einem Blick eine klare Einsicht in möglichst viele Voraussetzungen und Zusammenhänge zu gewinnen" (Rodenwaldt 1952, n.p.).

109
Geomedizin, and thereby outline the epistemic adequacy of the geomedical map through disciplinary comparison.
Finally, Rodenwaldt, Jusatz, and Zeiss equally expressed the assumption that disease maps can be used to discover "correlations" and interrelations (Rodenwaldt 1952), "coincidences" (Jusatz 1944), and "combinations" (Zeiss 1944) between different factors that determine whether an epidemic appears or disappears. Even more, this combinational capacity of the map medium was framed as a technological possibility that could be further scaled up; that only the beginning had been achieved, and that many more combinations are imaginable for the future (Zeiss 1944). An important part was played in Zeiss' promotion of this new technology of Geomedizin by using the genealogical narrative about cartographic predecessors from the history of medical geography. He framed this history in a way such that there had indeed been many earlier pioneers, but that these were after all scattered into individual attempts, and that Geomedizin developed against the backdrop of an "unstructured and un-methodical field" of disease mapping. We will see both the technological promise of integrating further combinations and the narrative of an existing but unstructured field of maps and data that awaits ordering appearing again in the following chapter when authors narrate the technical milieu of computerized disease mapping.
The quest to develop new combinations and identify correlations, but also the major aim of facilitating prognosis, had a particular impact on how geomedical authors envisioned their own technology in-between, in correspondence with, and in distinction to other disciplines. Although prognosis by way of a dynamic map was believed to be the specialty of the geomedical toolbox, Zeiss also declared that this was not enough, but that there was a need for a "hygienist who reads them [the maps] with cool reason and trained critique," (Zeiss 1944, my translation) and that he [sic] must equally take bacteriological and clinical findings into consideration. If one does not, the enterprise becomes mere "fortune telling" ("Wahrsagerei"). No mention was made, however, of the fact that the hygienist’s critical look beyond the map might also mobilize other media of epidemiological inquiry, such as those used in statistical analysis. The projected interdisciplinary position was limited to one between bacteriology and medicine and on the level of ideas rather than technology. Apart from these two disciplinary 'combinations,’ Zeiss repeatedly emphasized the connection and intellectual debt to the concept of Geopolitik and related visualization efforts, whose map styles had become widely known through broadcastings, according to Zeiss. The supposedly interdisciplinary role of Geomedizin and in relation to the combinatory promise of its technology, was even more explicitly described by Jusatz in 1983. He stated that the geomedical "researcher is forced to leave his desk or laboratory in order to study different disciplines, each concerned with separate aspects of the possible influences of

110
environmental factors. Without needing to become a specialist in another discipline, he thus comes into contact with other sciences and has to establish relations with botany, zoology, geology and climatology" (Jusatz 1983, 56). Along similar lines, and when looking back at the Weltseuchenatlas from 1952, he also confessed that "this principle of co-ordinating evidence from […] different disciplines was not then entirely successful in every one of the atlas's sheets" (54, emphasis added).
3.6 Discussion: Inter-diagrammatic relations and epistemic centering
The present chapter allows both for systematic and historical insights about diagrammatic knowledge infrastructures and their role in differentiating the wider realm of epidemiological knowledge in Germany before, during and immediately after the Second World War. Through systematic insights, the chapter connects to the previous one in that it emphasizes the connection between different figurative entities which only in their combination characterize the specific diagrammatic infrastructure of the activity complex in question. And it also connects to the previous case study by highlighting the epistemic framing of these figurative ensembles: by pointing to the establishment not of a meta-figurative discourse (like in the case of the social epidemiologists of the 1990s) but at least to the articulation of a meta-instrumental discourse by which actors comment upon the medium of the map and table as apparatuses of observation instead of mere illustrations. As in the previous chapter, the figurative connection of different diagrammatic forms of writing can be taken as a first indicator of a diagrammatic discourse that aims at reconfiguring epidemiological models. But different from the previous analysis, these figurative series in the present case study did not consist of diagrams of the same time kind, but they consisted of different diagrammatic media such as table and map. And rather than being aligned in a figurative series to form an argument or a proposition, table and map were related as each other’s potentially operative supplement. They were addressed as technical possibilities, so to speak, to potentially extent the operative space of the map or the table, instead of being sequenced in a line of argument. They formed each other’s virtual milieu rather than a figurative series. Actualizing this milieu in a specific way meant to enact boundaries between different traditions of knowledge. In the case of the table-maps by Farr, the diagrammatic was realized by fusing the table and the map as two diagrammatic artifacts from different communicative genres: one stemming from a statistical tradition of numeric calculation and the other from the emerging discipline of medical geography. Combining both offered a space of graphical experimentation to Farr. By contrast, in the case of Geomedizin and roughly a hundred years after Farr‘s table-maps, authors would deliberately undo the relation between the two

111
diagrammatic artifacts of table and map to elevate the map as the single tool of the trade and promote their disciplinary recognition.
However, that does not foreclose the importance of figurative series in the present case study. As far as the wider figurative context is concerned that was contemporaneous with the diagrammatic infrastructure of Geomedizin, we saw that wartime Geomedizin developed in mutual exchange with the diagramming of virological chains of infection. Moreover, the trope of a chain, be it one of infection or of a causal chain more generally, continued to be expressed in the commentary that accompanied geomedical maps. The trope of the causal chain suggested reading the map in a linear way and basing inferences upon this linearity. At the same time, the cross-fertilization of virological diagramming, spatial tropes and maps also affected what can become recognized as a figure in the map. This could especially be seen in Jusatz’s publication after the war, where the environment or landscape itself could be read as an actor in the causal chain of epidemic infection – in the space of a virological diagram and in the space of the map. In other words, figurative aspects in this diagrammatic exchange between map, virological diagram and spatial trope affected each other and the individuation of diagrammatic infrastructures in the wider realm of epidemiological knowledge. Moreover, the diagrammatic figure of the environment could thereby obtain the status of an ‘epistemic object’ in the sense of Rheinberger: an object within a representational space that was stable enough to establish the cartographic practice as epistemically adequate, and which was simultaneously plastic enough to be potentially refined over the course of action.
For identifying relevant historical aspects in the diagrammatic processes, relations and materialities of the present case study, I will turn to six different heuristic dimensions of historical dis/continuity: epistemic routines and tasks, forms of subjectification and objectification, and figurative series and instruments. By epistemic routines I am referring to actions that are considered trustworthy for making knowledge claims and which have already obtained a certain stability and signature that allows them to circulate independent from specific epistemic settings. They are therefore different from “epistemic practices” in the sense given to them by Knorr Cetina, which are situated in their boundedness to an epistemic object and instrumental setting, and which might remain implicit rather than named as such by actors in the field. An important epistemic routine in the present case study was the act of comparison, which had been a fundamental scientific practice already before the proponents of the Geomedizin reclaimed in for their own project. It seems likely that by explicitly mentioning comparison as a practice that supports the epistemic infrastructure of Geomedizin, the authors sought to establish a historical continuity with established scientific practice. In other words, it was one among different strategies to pass the “threshold of scientificity” (Foucault 2002 [1969], 206) for geomedical authors. In a similar way, their reference to the epistemic tasks

112
of prognosis and etiology established continuity with the tradition of epidemiology. In this case it was not the continuity with scientific practice in general, which geomedical authors sought to achieve, but more particularly the continuity with the ‘classic’ age of scientific epidemiology, for which they could then propose their own contemporary set of tools.
The dimension of subjectification, in the present case study, refers to the subject positions that authors have claimed for the geomedical scientist. In this case, the position they had chosen was supposed to mark a difference from established disciplines. They claimed that the geomedical researcher would need to be an expert that moves at the interstices of existing disciplines. Moreover, subjectification cannot be disentangled from objectification in the sense that every ascribed subject position is highlighted in relation to an object of knowledge. In the present case study, one of the central objects of geomedical knowledge practice was the correlation between environmental factors and disease prevalence (or ‘environmental causation’), and the ideal type of the geomedical researcher was accordingly presented as the one who can combine environmental and medical information and switch between these disciplines.
The aspect of objectification is intimately connected to the last two dimensions of historical continuity and discontinuity that I mentioned above, that is, to the framing and use of representational devices and scientific instruments. As already mentioned above, geomedical authors would comment upon their maps by reference to the trope of a chain of infection and causation that was typical for earlier discourses in bacteriology and also increasingly formalized in diagrams both by bacteriological authors at the time and in the younger discipline of virology. By situating their own practice within this wider figurative context, geomedical authors established continuity with other subdisciplines in the area of epidemiology. This continuity supported claims about the adequacy of the representational device of the map with its presumed ability to make visible the causal force of the environment in the chain of epidemic events as well as the vector of spread. In contrast, if we don’t focus on the figurative series in whose context a diagrammatic medium is articulated, but on the way how this medium has been elevated to the status of an instrument on its own, we can see that this instrumental perspective was used to mark a rupture between traditions in epidemiology and geomedical technology, for example, to downplay the importance of statistical tables and instead foreground the use of maps. In other words, whereas geomedical authors aligned their own techniques with the figurative tradition of bacteriology and virology, they distinguished them from the instrumental tradition in statistical epidemiology.
Against this background, we have seen in the present chapter two aspects of the diagrammatic infrastructure of geomedicine and at whose center stood the map: firstly, the diagrammatic infrastructures that realized a figurative series

113
(connecting map, trope of the causal chain, and causality diagrams) by which the environment could be rendered as an actor, as having the agency to determine disease prevalence. And secondly, the diagrammatic infrastructure of choosing the map over the table and granting it the status of an epistemic instrument that has the capacity for bringing forth epidemiological knowledge in a particular way, and which was epitomized in the label of the ‘dynamic map’31. The dynamic map was framed as being able to represent the dynamic of a referent (the movement of an epidemic) but also to animate a prognostic thought. The structure or working of the instrument was aligned with thinking in this double sense: it fit the theoretical model of causality in which the environment could appear as a figure, and it fit the aspired task of thinking to imaginatively move forward and make prognostic judgments.
Altogether, the present case study has followed how the diagrammatic artifact of the geomedical map was centered as the primary medium of choice for the construction of epidemiological knowledge. The map was given the status of a mediator that has the agency to transform epidemiological foresight and inference, rather than just ‚illustrating numbers‘ as it was claimed cartograms did. As with all mediator assignments (see chapter 1), this centering of the map entailed the reduction or black boxing of other knowledge-infrastructural components on which the transformative power of the geomedical map supposedly rests. As discussed above, the map was embedded within an apparatus of visualization and a figurative series that entailed multiple diagrammatic relations – between, for example, the concept of the causal chain, the graphing of chains of infection, images of geopolitical expansion, but also a series of infrastructural processes that make disease mapping possible. Yet, in the case of Geomedizin, neither the methods of data gathering nor those of interpolation were directly commented upon, something that would become the first line of criticism for contemporary statistical epidemiologists as we will see in later chapters. And if questions of data infrastructure and computational infrastructure were problematized, this was usually not for the construction of the map, but in pointing to the shortcomings of existing statistical infrastructure. The centering of the map therefore consisted of a series of boundary-drawings that made some mediations revert to the background or delegate them to an
31 When building up a genealogical narrative about the discipline of Geomedizin, Jusatz (1944) referenced August Petermann’s (1848) discussion of maps as media that bring into view a relative account of statistical values within the plane of the map. For Jusatz, Geomedizin’s turn towards a dynamic map highlighted yet another quality of the diagrammatic than Petermann alluded to. Marking this difference is revealing. While Petermann’s account pointed to a diagrammatic of the map, which at the end would still need the symbolic interpretation of numbers, Jusatz’s account of the diagrammatic worth pursuing implicitly emphasized the possibility for an iconic interpretation of movement.

114
outside from which the geomedical technology could be distinguished; and it also entailed the making of shared boundaries with specific disciplinary traditions such as epidemiological prognosis and diagnosis, as well as geopolitical ideology. In other words, the epistemic centering of the geomedical map involved „boundary work“ (Gieryn) and in turn objectified the map and geomedical visualization as a „boundary object“ (Star) or „conscription device“ (Henderson) that simultaneously divided and brought together different disciplines and sources of data.

115
4. Overlaying in computerized medical geography, 1965-1975
GIS and computer mapping began to reshape professional cartography and also medical geography in the mid-1960s (Foresman 1998, Chrisman 2004). The Canadian Geographic Information System is commonly recognized as the forerunner of GIS by using a computer mapping system developed by a company called Spartan Air Services as well as IBM between 1962 and 1967, becoming operational in 1971 (Tomlinson 1998). In parallel, from 1965 onwards, the Harvard Laboratory for Computer Graphics and Spatial Analysis developed different software packages for calculating and visualizing geographical data, most famously SYMAP and ODYSSEY (Chrisman 2004). Eventually, the work of the Harvard Laboratory led to the commercialization of GIS software in the 1980s and is epitomized by the company ESRI and its standard software ArcGIS.
As far as medical geography is concerned in this context, the use of computer mapping in the United States and Great Britain during the late 1960s and early 1970s was limited to a number of pioneer studies. In Britain, this was connected to the project of a national atlas of disease mortality by the medical geographer G. Melvyn Howe (see Howe and Philips 1983; Koch 2005). Howe used computers to combine the calculation of area-specific mortality ratios – defined by size of population and disease incidence – with a map projection, "marry[ing] the rigor of national statistical calculations with a mapped surface" (Koch 2005, 229). In the United States, an important study carried out at this time was an Army-funded research project on "Computerized Mapping of Disease” (Hopps et al. 1968), but which was eventually discontinued. Moreover, the medical geographer R.W. Armstrong discussed some of the new possibilities of digital computing and new printing techniques in a handbook on Medical Geography that was published in 1972 (McGlashan 1972), demonstrating the use of the program SYMAP (Armstrong 1972). The present chapter will concentrate on the US-American context of medical geography through the latter two examples of Hopps et al. (1968) and Armstrong (1972), and approach their conceptualizations as prototypical for the development of GIS.
As we will see below, although Hopps et al. (1968) and Armstrong (1972) do not explicitly mention the term GIS, which was not common at the time, they reference

116
two important practices of computer mapping which would be defining for the understanding of GIS: the practice of overlaying and the practice of synthesizing, integrating or combining data from different datasets, for example, environmental and disease data. Moreover, they divided the mapping process/system into operational units such as data preparation, analysis and output. This operational layout is still representative of discussions of GIS today. For example, the two contemporary medical geographers Melinda Meade and Michael Emch state in their recent handbook of medical geography that GIS "revolutionized” disease mapping in three ways: by allowing for spatial data integration, by facilitating spatial analysis, and by offering new techniques of visualization (Meade and Emch 2010, 93). As far as the first item is concerned, GIS is said to make it possible to link different datasets simply by location. In pre-GIS infrastructures, so the assumption goes, one needed to put much more work into establishing a relation between different items, whereas with GIS one could now "integrate two different maps: one of the locations of homes and the disease status of people living in them, and the other of sewerage and septic systems” (87). Their terminology here is revealing: On the one hand, they framed 'data integration’ as the revolutionary core of GIS. On the other hand, they comment upon this development by highlighting the possibility to 'integrate two maps.’ Integration is the keyword that bridges both developments, whether the integration of data or the integration of maps.
This implicit or seemingly self-evident semantic slip between map integration and data integration becomes less 'natural’ when looking at the birth years of computerized mapping and GIS. What one can see in this context, is that the transformation from map integration to data integration entails a number of related transformations: First, the map becomes a two-dimensional surface in a three-dimensional combinational or conjectural space. Not only does a map present data points adjacent to each other which might therefore be correlated, but by putting different maps above each other, the technology also opens a vertical axis of possible correlations. Conversely, this technical and conceptual milieu prioritizes the possibility of correlations becoming visible on the plane of the map, and that below this plane further yet invisible correlations are awaiting revelation. Second, the map becomes multiple – input, intermediate, output – in the order of the new visualization technology. Of course, older mapping technology also had sketch maps before there was a final product. But in the case of GIS and the prototypes of GIS here discussed, these different versions of a map served as separate operational 'platforms’ where each of them could connect to different analytical purposes, practices and frictions during the attempt to automatize them. Third, and connected to the previous point, map cells become programmable sub-units that can be rewritten for further calculations and iterations, partially facilitating a turn towards 'trial and error’ cartographic methods of correlation testing and trend inference.
117
Fourth, the concept of 'overlaying’ coordinates between human knowhow and machine processes thereby helps to consolidate the idea of data/map integration through an intuitive visual-haptic schema. This last aspect of overlaying will take up significant space in the present chapter because it connects to a familiar technique in the domain of geography, if not to a "cultural technique” (Geoghegan 2013) more broadly, and it served to 'enroll’ peripheral printing devices into the agentive matrix of computerized mapping. As an operational schema, overlaying coordinates between different operations in the larger organization of the GIS or proto-GIS technology links these operations by way of similarity, and thereby becomes a candidate for diagrammatic theory.
However, before beginning my analysis, I believe it is necessary to point out its methodological limits, especially with regard to the schematic function of overlaying. To accredit overlaying with such a powerful function is to some extent a stipulation. It remains impossible for me and my methodological toolbox to explain through empirical analysis how overlaying links 'causally’ to the concept of integrating maps or data. But this also falls outside the scope and promise of my research. Investigations and causal explanations of this sort might better be addressed by psychological and neuro-phenomenological methodologies. In the present chapter, I will instead point to semantic and pragmatic similarities, or conceptual intensifications, in the historical context here studied. These intensifications occur between the notions of overlaying, synthesizing and, finally, interpolating. They might be seen as three connected resources that shape the conceptual milieu in which map integration is transformed into data integration. Moreover, this conceptual milieu is entangled with a technical milieu; more specifically, with the diagrammatic possibilities that grow out of the connection between table and map. This connection has already played a significant part in the argumentation of the authors that were presented in the last chapter. In the present chapter, it will be picked up again with reference to the US-American context, to the work of the medical geographer Jacques May and to its automatization in the context of proto-GIS systems.
4.1 Computerized Mapping of Disease
In 1965, the US Armed Forces Institute of Pathology together with an association representing different pathology departments at US-American universities, received funding from the Department of Defense to develop a system for the "computerized mapping of disease” (abbreviated as MOD). This research was carried out from 1965 to 1968, when it was discontinued, but a report was made public that summarized their findings up to the moment the project stopped (Hopps et al. 1968). The project was undertaken by a number of people but contemporary sources usually mention

118
Howard Hopps as the report’s main author (Armstrong 1972).32 Besides assessing and recommending general computer system requirements and possibilities, one of the major aims of the project was to combine disease and environmental data. This goal, the report did not tire of stating, was based on the assumption that "it is the ecology of an area which determines what diseases might become serious problems” (Hopps et al. 1968, 9-2).
Because the project was intended as a capacity assessment without necessarily being implemented, it presented a general methodology and assessed the possibilities presently available but also made a final recommendation (6-13–6-15). The computer system they designed, and which was simply referred to as "the MOD,” would ideally have a "collated and integrated” database at its disposal with geographic, clinical medical, microbiological, meteorologic, geologic, demographic, economic, agricultural and other kinds of data (Figure 7). In theory, the queries made by the user would activate one of the three subsystems of the computer or
32 According to the report’s acknowledgments, the project was headed by Harlan Firminger as project scientist and Howard Hopps as associate scientist. I will adapt the citation method of referring to Hopps as the main author of the report.
Figure 7. General diagram of the MOD system with the original caption “Generalized MOD system concept showing how a query is acted upon by the computer system.” Reprinted
from Hopps et al. (1968, 1-17, fig. 1-1).

119
activate them one after another: the “retrieval subsystem” that would retrieve the relevant data according to a general dictionary file; the “synthesis subsystem” that would perform calculations on the data; and the “output subsystem” that would generate different kinds of output from the retrieved and calculated data (Figure 8). Theoretically possible output media were lists, tables, block diagrams, and maps. However, for the more detailed design of the model system Hopps et al. focused on maps and 'reports’ as the only two output types they considered.
In terms of implementation, the authors suggested punch cards and magnetic tape for input because they were widely available and familiar; and magnetic tape for storage at first to then be changed to magnetic disk later on. The main memory was determined by the transistor-based hardware of the selected computer, but it was highlighted that it needed to be able to store 50,000 words for a detailed map and the language of the program. For output they recommended plotters but also tested line printers as a feasible option. All plotters were to be used "offline,” that is, they had their own magnetic tape units, and an operator would have to literally transport data tapes from the computer to the plotter. The information on these tapes consisted "solely of a series of X-Y plotter coordinate points and an indication of whether the plotter pen is up or down between these points” (7-77). As far as the computer itself was concerned, the authors did not propose any particular computer to be used, but rather described the required functional capacities and the limitations it might face.33 To test their system requirements and programs, the project team either rented computers or used available ones from governmental and research facilities.34
In order to assess what it would take to actually implement the MOD project, the project team was also particularly sensitive to the amount of "data friction” (Edwards 2010) that any process might create in terms of resources to be spent. The whole process that would lead to inputting data into the computer system was subdivided into a) managing data collection by filing data sources, b) extracting data from these sources and transferring them into "data extraction forms,” c) checking and editing these data extraction forms for errors, d) keypunching the edited forms onto punch cards, e) checking and entering punch cards into the computer system,
33 "While speed is not a prime factor in the information storage and retrieval tasks, it is a factor in the processing of the hundreds of thousands of data points which are required in mapping. This means that the computer selected must represent a compromise between one designed for information storage and retrieval tasks (usually a small, slow machine) and one designed for general scientific tasks (usually larger and faster)” (Hopps et al. 1968, 6-15).
34 Among the computers they explicitly mentioned were the CDC 3100 and 3600, IBM 7090 and 7094, all of which were room-filling machines at the time. The only tested plotter they mentioned explicitly was the drum-printer CalComp 564 (Hopps et al. 1968, 6-15).

120
Figure 8. Flowchart of the MOD system. Reprinted from Hopps et al. (1968, 7-5, fig. 7-1).

121
and finally f) storing corrected workable data input cards. Most of these processes would be distributed among different operators (Hopps 1968, 5-4). By far the most work would be necessary in the process of extracting the operable data from external sources (9-5). The data extraction cards would include information on disease, location etc. and already indicate which categories of information would be related to which variable in the computer language. The process of data extraction was problematized as the greatest challenge in a system such as the MOD and it was even suggested by Armstrong (1972) that it was eventually the reason for the project’s discontinuation.
Whereas the possible data friction was acknowledged and described in detail, less mention was made of the efforts required to program, debug and maintain35 the computer program or what Edwards described as "computational friction” – though the report did mention that it would take one and a half years for two programmers to get the computer program set up (9-5). However, both the report and contemporary commentators such as Armstrong (1972) and Howe (1970) reflected upon another issue that the introduction of such a system faces and which we might call 'epistemic friction.’ This revolves in this case around the problem of the most 'resource-efficient’ division of labor between human analytic and synthetic capacities and computer calculation.
4.1.1 Epistemic friction and the coordination of human and machine
Reservations about computer mapping must have been widespread at the time considering Armstrong’s remark that "most cartographers prefer not to call the computer graphic a map because it is mechanically drawn” (Armstrong 1972, 69). Yet, as one follows the commentator’s review of contemporary computer mapping examples one is pointed to scenarios where computer mapping proves to be useful; that is, where "extensive data analyses are required and where many maps in a series are necessary” (80). Within the overall operational sequence of input, analysis, preparing for presentation, and eventual output, it is the analysis phase in which computers are most advantageous according to Armstrong, because they can quickly and accurately perform "a large number of tedious calculations” (75). Accordingly, computer maps are especially helpful for the production of statistical maps, where one needs to calculate aggregates and ratios, such as relative morbidity and mortality, for example. And computer maps are also said to play out their strengths in quickly producing new maps as long as the underlying data structure and data source remain the same. For Armstrong, this was particularly
35 The report does mention 'maintenance,’ but not in the sense of ongoing technical care and repair but rather in a sense of storage.

122
promising in the case of surveillance, where similar input data is constantly fed in and maps need to be updated promptly. In reverse, however, he also makes clear that wherever more substantial work on the data pre-processing before analysis is necessary, the effort might be too high for using computer mapping, especially if data from different sources are being compared.
There is a tendency to 'believe' the results of a computing machine and it is important to remember that computers do nothing to improve data quality. It is just as easy to be fascinated by an inaccurate computer graphic as by an accurate one! In comparative mapping, such as where a series of overlays depicting medical and environmental variables are being drawn from a data bank, it is obviously important to be using comparable data. (Armstrong 1972, 79)
Finally, Armstrong was also skeptical about some of the presentational possibilities of computer maps – especially of isopleth maps, where the preparation (finding the optimal line through a series of points that must be interpolated) is sometimes more difficult to automatize compared to simply doing it by hand. He even suggests that in the case of statistical maps, which he considered a good application for computer mapping as mentioned above, the maps might only serve as "working maps for later draughting” (81). Similar skepticism regarding the presentational quality of computer maps was shared by other commentators such as Howe (1970), who wrote in his short review of computer mapping: "Though not of high aesthetic quality they are nevertheless excellent working maps. Their advantage lies in that they are completed in a fraction of the time required by conventional methods” (Howe 1970, 17).
Some of the reservations of their contemporaries were also shared by the authors of the MOD report. Since they were promoting a design of a computer mapping system, their reservations were voiced as cautions, yet were voiced repeatedly. For example, they emphasized the need to secure data quality and stressed the effort that is necessary to extract this data from existing sources. From the outset they assumed that their current situation of medical geography was characterized by an abundance of information, but which was scattered across too different sources. They projected as their historic task to concentrate this data in a system such as the MOD, but also to safeguard that this information has a minimum set of quality markers. For this, the whole system was designed in a way such that each 'data point’ encodes very different aspects of information: not only place, time, disease name and numeric value, for example, but also the type of measurement and other such information that today might be called meta-data. At the same time, Hopps et al. also acknowledged that sometimes sources might not provide all the

123
necessary information, so they defined a minimal set of informational aspects that a 'data point’ should carry in order to be allowed for further handling and eventual comparison.
Given the importance of the pre-processing of data, the authors also marked this as a distinctive line between human work and machine work: "Although electronic data processors are very efficient at storage and retrieval of data, and can carry out very complex searches for correlates, these machines cannot do the essential selection and preprocessing of data which, among many other things, includes a value judgement as to the validity of the data which is fed to them" (Hopps et al. 1968, iv). They framed the final output phase in a similar way to how Hopps et al. cautioned about the distribution between machine and human agency during the 'input phase’, emphasizing that it is for a human capacity for judgment, for "visual pattern comparison” (11) and for correlation inference that the system was designed:
In the MOD computerized system it is the user, not the system, who makes correlations between the raw data and output map, evaluating the various factors which make the map look as it does. The computer system will not perform analysis of the maps produced nor will it make judgments; it will merely manipulate (according to rigidly defined algorithms) extracted, formatted data (from that pool of data which was previously put into the system) and output these manipulated data in the form of maps or other reports, in the manner specified. (Hopps et al. 1968, 8-9)
Altogether, epistemic friction is explicitly problematized along the operational units of the system such as input/data preparation, analysis, plot preparation, and output. It is also implicitly structured along the divisions of a cognitive system into main tasks and sub tasks and its respective implementing algorithms, representational media and hardware. The main tasks of correlation recognition and visual pattern identification remain within the confines of human agency. Some of the supporting subtasks, by contrast, were discussed as being more efficiently handled by the machine, especially the different kinds of calculations with the inputted data points. Interestingly, Hopps referred to these machine processes of calculation as "synthesis.” In the case of other subtasks, however, the division between human and machine agency is less decided. For example, preparing the maps for plotting necessitates the use of automatized interpolation methods. At the same time, also the human map viewer is said to perform interpolation as a default perceptual action. Interpolation seems to be a hybrid that connects between both worlds. On the one hand, Hopps stressed that disease maps and other "statistical maps” make

124
"abstract statistical surfaces [visible] which cannot actually be seen or observed directly in the field, but which must be calculated from field observational data” (3-16). On the other hand, he also added that this observational data is necessarily incomplete and that "all maps are constructed by interpolation techniques, of one sort or another, from a finite (comparatively small) number of observed data points. Map-making techniques are compromises between mathematically rigorous portrayal and psychologically realistic portrayal” (3-14). Interpolation seems to be a technical term that could be applied across the divide between mathematics and psychology, machine calculation and human vision.
Whether they are automatically performed by machines, practiced by humans, or both, all three processes – recognizing correlation, synthesis, and interpolation – seem to have in common that they work on the relationship between data. The combination of these technical terms shaped the semantic milieu in which the conceptual transformation from map to data integration could occur. However, one of the most important technical terms in facilitating this transformation has not yet been discussed. This is the practice of overlaying, which imbues the medium of the map with a particular epistemic role in a three-dimensional associational space, and coordinated – like interpolation – across the divide of human and machine.
4.1.2 Overlaying and a three-dimensional associational space
Hopps mentioned overlaying and comparing as the epistemically most productive techniques of medical geography for arriving at judgments about disease correlations, and as something that purely mathematical calculations would not be able to obtain: "Overlaying and visual pattern comparing is a very powerful process because it permits human detection of relationships so complex that standard mathematical methods may be unable to detect them” (11). Through these techniques it would become possible, the authors contended, to move beyond the correlation between disease and only one variable towards a multi-factorial analysis. To afford for this multifactorial reading, the comparison had to move either in the horizontal or vertical dimension: "Logically, a map represents only one dependent variable (or one disease-environmental factor), but more than one variable can be represented either by a series of maps […] or by overprinting the mapped patterns of several such variables onto the same base sheet” (3-15). Horizontal comparison and vertical overlaying were joined together in offering the combinatory or calculative space for the analysis.
To move from the mode of comparison to the one of overlaying in one stroke needs to be emphasized here, because it creates a continuity that also has historical meaning. Comparing map series as a way of visually understanding changes in environmental variables was already mentioned by earlier medical geographers as

125
we saw in the previous chapter. Overlaying, by contrast, was a common technique but without being emphasized as strongly as a particular epistemic capacity as it was here in the moment of its automatic implementation through overprinting. The main infrastructural affordance for a transformation of overlaying was not, however, the computer but the printer: the computer still outputted two distinct map values onto magnetic tape but because the printer could re-print along the same coordinates, the overlay materialized. In other words, there was still a sense of literal over-inscription in place, of the touching of maps upon each other.
Despite the emphasis on overlaying as a capacity for inference and recognition, the tactility and material intricateness of the process remained only implicit in Hopps’ account. The paradigmatic reference for his model of conjectural insight and inference such as the recognition of correlations was the 'visual pattern’ and as such he also addressed the technicality and materiality of the map. He stated that among the different output media "maps were chosen as the principal pattern-form.” The choice of the word 'pattern form’ is curious here. It was a common terminus technicus in geography at that time, where maps would display street patterns, vegetation patterns, disease patterns etc. At the same time, patterns were also already adapted to machine recognition and not only an object of human sight. Armstrong (1972), for example, describes how aerial photographs were scanned by "pattern-recognition computers” in other subareas of geography. Hopps’ reference to "visual pattern comparing” and the map as "pattern form” enacted this historical meaning of the word pattern that would ascribe adaptability to human and machinic operation alike. Yet, despite the applicability of pattern recognition across different operations and ontological domains, and thus beyond a particular sensorial modality, the emphasis he eventually put on 'visual pattern comparing’ continued to make vision primary. Although he emphasized the practice of overlaying and that it was automated through overprinting, he did not make any reference to the creative capacity of touch that lies at the bottom of overlaying. One could come to conclude that Hopps et al. argued in a conventional 'ocular-centric’ framework, capacitating human concept acquisition or judgment based on vision and pattern seeing rather than acknowledging the haptic knowledge of overlaying.
However, to reduce the report’s epistemic framework to a question of a single sensory modality would miss an important aspect: For Hopps et al. the epistemic promise of the MOD system was first and foremost connected to the two-dimensionality of the medium of the map, to the capacity to see correlations or associations in the cartographic plane, and to be able to virtually extend this plane in the vertical dimension. This vertical virtuality works in a positive and negative way. The associational plane of the map could be extended vertically through overlaying, but it could also be vertically undercut by invisible relationships below the map’s radar. The latter is meant in a very literal way as Hopps et al. showed in

126
Figure 9. Diagram of possible relationships envisioned by the authors of the MOD system. Original caption: “Types of relationships among disease and environmental data. The eye
of the observer is evident at the left. Those connections above the surface are readily seen; those below the surface are not.” Reprinted from Hopps et al. (1968, 8-8, fig. 8-2).

127
a diagram of possible relationships (Figure 9). Altogether, the visual modality of 'seeing’ what is presented in a map is of course important. But even more pertinent is the materiality of the map as a planar surface of inscribed relations that entails a virtual above and below.
4.2 Context 1: Digital disease complexes and the integration of table and map in the work of Jacques May
The MOD project must be contextualized within the conceptual currents that had affected the development of medical geography in the US in the 1950s. In fact, according to Koch (2005, 231), the MOD project itself had started to form already during these years, and it was only in the mid-1960s that it would materialize as a research project. At the beginning of the 1950s, medical geography was stretched between attempts to re-institutionalize it as a discipline of its own (see also the previous chapter) and to integrate it into a larger disciplinary bundle of health ecology (May 1952). A particularly prominent voice in this development was Jacques May, who became the director of the newly found division of medical geography at the American Geographical Society in 1948 (see Brown and Moon 2004). Briefly presenting some of his ideas and statements in the following has two aims: On the one hand, it helps to put the disease-ecological framework of the MOD project into a historical context, by showing that such frameworks had become the rule rather than an exception in medical geography at the time. On the other hand, it also helps to flesh out the technological continuity in which the MOD project stood, that is, in a continuity of separating digital databases of disease complexes from their automatized mapping.
In 1950, May published his vision of the "methods and objectives" of medical geography in a long article in the Geographical Review (May 1950). At the conceptual core of his framework stood the idea of a "complex" of factors that causes disease, and which can be divided into the multifold relationships between what he called "pathogens" and "geogens." Pathogens or pathological factors included "causative agents, vectors, intermediate hosts, reservoirs, man” (10). The geographical factors or geogens, by contrast, consisted of "climate, water, soil, and cultural habits" (15), among others. For May, the primary task of medical geography was to study these geogens and "correlate [them] individually with every one of the pathogens.” To heuristically structure this endeavor, he came up with three types of complexes depending on how many factors were involved: two-factor, three-factor and four-factor-complexes. Moreover, in order to methodologically and technologically structure the project, he distributed this correlational analysis across a table and a map view.
A combination of aspects of the two media of map and table existed already with
128
William Farr in the mid-19th century, as we saw in the previous chapter, where these aspects became integrated in one image. In general, it seems fair to say that the combination of map and table belongs to a traditional repertoire of epidemiological publications since the days of 'classical epidemiology,' although it is usually realized as a comparison between different media rather than within one image. With May and in the mid-20th century, however, this combination of table and map takes yet another form: neither as an integration of different conventions of showing within one image space, nor as a comparison across different media, but rather as an operative sequencing of digital modeling and diagrammatic demonstration.
May used tabulation in order to collect different kinds of pathogen-geogen-complexes, divide them according to the number of factors they involved, and digitally code the correlation between these factors as either established (+), nonexistent (-) or unknown. His distribution of analytical work had the table facilitate an overview of possible relationships between different factors, while the map provided an overview of where the factors would actually or could potentially coincide. Especially the latter role of the map, as a medium for showing potential areas where outbreaks might occur but where they are not prevalent at present, was significantly emphasized by May. The map would thereby allow users to identify "silent zones" (May 1950, 28).36 On the one hand, this points to the same observation briefly mentioned in the previous chapter in the accounts of the medical geographer Jusatz and Soviet medical geographers at around the same time: that through the medium of the map, the environment was cast as an agent capable of determining the cause of disease and as a potentiality – one that can determine economic development in this or that direction and which can be designed. On the other hand, similar to what was discussed in the first chapter, the map on its own cannot provide for a negative proposition. It is through the comparison with the table, which presents this or that potential correlation, that the map can indicate the absence of the prevalence of this or that disease.
However, it would be wrong to conclude that the table summarized theoretical-etiological models, while the map simply demonstrated the empirical instantiations or non-instantiations of the existing models. The map also served to identify them in the first place. In a discussion about the association between drinking water and dental diseases, May wrote that the "systematic study of the various waters man uses and correlation with the map of diseases might lead to new discoveries" (May 1950, 29). Moreover, in his report to the International Geographical Union about
36 "The mapping of these silent zones is of paramount interest to the study of medical geography. Of equal interest is the delimitation of endemic zones, where the complex maintains itself as a whisper between the loud outbreaks of epidemics. The passage from endemicity to epidemicity is one of the most important problems medical geography may help to solve" (May 1950, 28).

129
the goals and methods of medical geography, May proposed a three-step research process: firstly, the carrying out of "sample studies of populations to build the picture of the extent of the exposure", where he points to a map of yellow fever as an example of this sort; secondly, an analysis of the influence of climatic factors on the pathogen, which may also include experimental research; thirdly, the carrying out of "synthetic regional studies" that show which different diseases coincide within a locale and therefore within similar climatic conditions. For May, the map seemed to be relevant media for all these steps, turning it into an instrument for the discovery of relationships rather than merely for demonstrating previously known ones. In other words, the map did not rank in any way behind the medium of the table in terms of its creative contribution to analytical processes. The distinction between tabulation and mapping was rather a question of technological design: of differentiating and sequencing the representation of abstract relationships and the representation of those relationships in geographical space.
Altogether, table and map formed an operative sequence, in which they 'instructed' each other. The relationships found through mapping would instruct their abstraction and subsequent digital representation in the table. Conversely, the table would instruct which factors should be mapped. Table and map were not integrated as two aspects within one image, or as different perspectives on one phenomenon in comparison, but as parts of a technological continuum. Their operative sequencing prefigured an analytical technology for the study of disease ecologies. The 'telos' of this technology was the digitization of disease complexes, thereby preparing the path for the automatization of medical-geographic processes in the MOD project.
In a report to the International Geographical Union, May declared with reference to Hippocrates and other historical proponents of environmental disease causation before them, that "it looks as though technology had very nearly caught up with the ambitions of our predecessors and as though it might now be possible to get the real, but concealed, picture of diseases which our precursors lacked” (May 1952, 212). The fact that he alludes to the possibility of a picture being concealed additionally connects to the epistemic framework of the MOD project. For both May and Hopps et al. the complex of ecological factors can exist visibly on the picture plane or otherwise remain concealed while still being a picture. The picture is not only that which represents but also the ontological plane in relation to which a correlational complex exists.
4.3 Context 2: SYMAP, 1967-1976
Parallel to the MOD project, proto-GIS software was developed by the Harvard Laboratory for Computer Graphics and Spatial Analysis and its first popular product

130
was the package SYMAP. At the same time, the computer graphics laboratory also sought interaction with other disciplines and potential areas of application (Chrisman 2004), among which was landscape planning. In 1967, the landscape architect and assistant professor at Harvard Carl Steinitz used the software SYMAP for the analysis of a peninsula in the state of Virginia. According to GIS historian Chrisman, this research project "had all the components of any GIS enterprise: base layers, computer-generated intermediaries, and results […] the main results were produced by a map overlay” (2004, 4). Some years after the project, Steinitz and his colleagues published an article on the history of the overlay technique (Steinitz, Parker and Jordan 1976). The article also covered GIS and it seems that the genealogy of overlaying was narrated so that GIS appeared at the spearhead of history. Thus, this article is worth investigating in more detail because it exemplifies how far overlaying had become a key technical term throughout the development of GIS, connecting old and new, but also consolidating the still young infrastructure of computerized mapping.
Steinitz, Parker and Jordan’s article commenced with early land use overlays from 1912 and slowly progressed into the computer age, establishing a continuity between analogue systems and computer-based GIS. The authors used the word "data map” or "data source map” for each map that contains particular environmental information, for example, rock type, farmland, water, etc. (444). After discussing "hand-drawn graphic analysis systems” that would overlay analogue data maps on the light table, they described the corresponding computer process and how it might make some of the envisaged tasks more efficient. Whereas in the analogue mapping procedure one needed to redraw a map each time by hand if one wished to make a new overlay composite or add another data map, the authors claimed that this additional effort could be greatly minimized in the computer environment. This entailed not only a faster printing of maps, but also the storing of mappable items that could be selectively recalled and reused for different map projects. In other words, rather than understanding the map as a solid object, it was disintegrated into reusable and recodable subunits that are stored in a database: "… one makes not one data map, but a separable, mappable file component for each subvariable. The computer allows the selective recall and recoding of these subvariables […] the more and varied uses to which the data variable is put, the more efficient the computer-like process becomes” (450, original emphasis).
Steinitz et al.’s description deconstructs the map into its smaller information-bearing units, which become objects in a database, a file component, rather than iconic artifacts that represent a piece of territory. Hopps et al. too emphasized in their research project on computerized disease mapping the central importance of how the underlying database is structured and categorized. What is particular in Steinitz’s description is the sense of moving from a map, previously overlaid with

131
other maps in analogous ways, into a datafile component that is the re-codable basis for overlaying. The entity is not a fixed trace but a programmable module. Thus, the status of the map has multiplied: it can be an input source; an efficiently reproducible intermediate or output artifact; and a programmable interface for encoding and recoding, calculation and analysis whose visibility or perceptibility is at least contingent. This semantic and pragmatic extension of the map and vis-à-vis the database was pre-figured by earlier examples of diagrammatic co-figuration, where the extension of the operational space was facilitated through linking the medium of the table with that of the map. We saw one such example above with Jacques May. Steinitz et al. – as well as Hopps et al. previously – built on this figurative and operative potential of the table-map link by introducing the database file and map cell as additional media of geographical analysis.
At the end of Steinitz’s article, the authors stated that for design work, "using computers has clearly shown the efficacy of iterative synthesis methods, with rapid evaluation being the key to trial-and-error design. This style of probe-and-test is difficult to do with the traditional data map process” (Steinitz, Parker and Jordan 1976, 453). Also for the case of medical geography, Armstrong (1972) and Hopps (1968) acknowledged this capacity to reduce the cost in repeated analysis, be it for surveillance or testing correlations. But with their reference to 'trial and error’ Steinitz et al. sketched the technology even more clearly than the others as an experimental environment. Overlaying and recoding map cells were two major scripts in this environment.
Altogether, the practice of overlaying seemed to have served as a productive diagrammatic scheme for consolidating GIS software. Firstly, it connected to the overlaying practice that mapmakers had been familiar with since at least the beginning of the century. Secondly, it was re-implemented in the technique of automatic overprinting, where a printer would over-print a line twice to generate different hatchings and symbols, instructed by values in a mathematical coordinate grid. Thirdly, it worked well within the same intuitive three-dimensional mathematical reference system.
Even though overlaying has been present for decades, as Steinitz’s article shows, during the late 1960s and early 1970s it became articulated as a more generalizable form and matter of operation that might apply to the work of electronic computer systems and traditional analogue ones. This emphasis on the generative potential of overlaying perhaps connects Steinitz’s reflection and the development of GIS more generally with the simultaneous publications on computerized mapping by Medical Geographers at the time, as we saw with Hopps above. Even more, overlaying comes to be reclaimed as an epistemic capacity of outstanding value. Not only Hopps is exemplary here, but also the medical geographer R. W. Armstrong, who in his handbook article on computer disease mapping refers to the notion of overlaying

132
as methodologically equal to statistical tests. Under the heading of "geographical correlation" he writes: "By overlay, or statistical tests of association, the degree of geographical association between health related and other variables could be shown and directions for further research indicated" (1972, 82). Altogether, it appears as if overlaying fills the place that the graphical calculus had taken before, as a map-based alternative to statistical styles of reasoning. This is a curious historical change, as overlaying was never emphasized as much in the epistemic discourse in older medical geography as it was then in the context of computer-based overlays.
4.4 Discussion: Proto-diagrammatic schema
With the present chapter I have continued to investigate a case study from the professional discipline of medical geography by focusing on the diagrammatic infrastructure of a particular research project, switching from the wartime context of Germany to the postwar context of the United States. In the previous chapter, the diagrammatic infrastructure of geomedicine was discussed as a boundary device by which its proponents enacted differences of knowledge practices in epidemiology. In the present chapter, the diagrammatic infrastructure has taken the role to support the design of a computer system that automatizes the mapping of disease. As such, this diagrammatic infrastructure of the system design also configured a set of epistemic rules about how medical geography discovers otherwise hidden ecological relationships and how it responds to an abundance of potentially related but dispersed data sources from different disciplines. Whereas the first epistemic rule refers to medical geography‘s context of discovery, the second relates to the inter-disciplinary position of medical geography and the envisaged system‘s capacity to coordinate now and in the future between different sources of data.
Even though both case studies are situated in different historical and geographical contexts, the comparison helps to draw out some aspects of each of them more pointedly. Wartime geomedicine problematized the map as a surface vis-à-vis an onlooker and how both of them could be aligned in their dynamic animation, coupling the dynamic intellectual act of prognosis and the figure of the waveform or isoline. This proposal was supported by a specific figurative context such as the diagram of the infectious chain that equally emphasized to abstract an epidemic trajectory from a two-dimensional surface; and by an operative context such as the instrumental negation of the statistical medium of the table. The MOD project during the 1960s, by contrast, problematized the map as a three-dimensional representational device where the dichotomy of visible/concealed was mirrored by the dichotomy of above/below surface. Moreover, the MOD project appropriated the connection between table and map as an operative possibility for the design of the computer system and translated it into the relationship between a generative

133
database and a potential output medium.Another comparative similarity worth emphasizing is that the authors of
both case studies referenced the practice of comparison. Emphasizing the value of comparison was common in medical geography and already known from 19th century atlas works and the comparison of numeric tables. In addition, comparison was an epistemic routine in scientific observation. Transferring this process to the comparison of two maps of the same locale in order to infer change and hypotheses about causal agents was more particular to the context of medical geography during the mid 20th century and was also emphasized as an epistemic practice in the previous case study. In the present case study, this fairly established epistemic routine of comparison has been further translated to make sense of the practice of overlaying and its epistemic weight. Overlaying had been regularly performed in analogue mapmaking before, but it seems as if it would only be stressed explicitly as an epistemic capacity at the moment it could be implemented in computer overprinting.
The importance of overlaying in the present chapter cannot be overstated. It framed and coordinated different parts of the system by way of a figure of speech as well as by being a technique practiced and implemented across different parts of the system to be constructed, from printer to human geographer. With overlaying, we also most clearly moved beyond a narrowly visual understanding of schematic coordination, as here the tactile experience is key. Only because of the correspondence of touch relations between overprinting and analogue map making, could the schema of overlaying exercise its coordinating function. In turn, it would also perforate the epistemic discourse. Overlaying became, perhaps for the first time, articulated as one of the most essential epistemic capacities of human disease mapping. Can this schema of overlaying also be considered a diagram? In other words: Where do we place overlaying on the spectrum between schema and diagram?
Overlaying inherits basic embodied orientations such as below/above and in front/behind that define image schemata and body schemata (Lakoff and Johnson 1980). Moreover, overlaying enacts a three-dimensional operational space that structures or schematizes how we make calculations, comparisons and correlational judgments. The latter attribute distinguishes the case of overlaying from what has been discussed as diagrammatic in the previous case studies: There, we followed the isoline across a cartographic surface; saw how correlations between two items were made that were presented next to each other in the plane of the map, or which were tabulated in the two-dimensional space of the table; and we saw comparison between flat data plots. Even in the context of computer use, and if we only focus on the punch card as a two-dimensional storage medium for discrete signs, the operational space of the diagrammatic is only extended within this scope of two-

134
dimensional surface. Against this background, the concept of a three-dimensional operational space for epidemiological knowledge practice is indeed particular and significantly challenges our understanding of diagrammatic coordination.
Yet, map overlaying does not show itself as graphical form. It disappears in the synthesized hatches it creates. Of course, overlaying is embodied and experienced by the operator, but it is not as such externalized into graphical form. It will be, however, at a later point in the development of GIS and Graphical User Interfaces, and what will eventually become the dominant layer view of contemporary design software (Manovich 1999). But for the time being, in the historical context presented here, overlaying remains a schema without graphical form, but one that configures a system design that to a certain extent prefigures the technology of GIS. We could therefore call overlaying a proto-diagrammatic schema.37 What makes it proto-diagrammatic, is not only the fact that overlaying historically precedes the visualization of the schema on a two-dimensional image plane, for example in the context of later graphical user interfaces. Overlaying is also proto-diagrammatic in a functional sense, because the schema helps to reconfigure a model of the cartographic context of discovery. And this model is eventually also visualized as a flat diagram in the report of the MOD project (see figure 9 above). In fact, by having not been reduced (yet) to the two-dimensional image plane, three-dimensional schemata seem to provide a virtual surplus for the actualization of a figure as picture; the three-dimensional schema is a source of inspiration for the ongoing process of a diagrammatic configuration and reconfiguration.
Finally, overlaying is surrounded by other, related schemata with a seemingly similar virtualizing tendency, such as interpolation and data integration, which shape the figurative context of the meaning of overlaying. All of these related schemata seem to describe – or structure – the synthesis of two discrete entities into a third new one, whereby the former entities withdraw from recognition. We are said to focus on the interpolated value, the integrated datum, or the overprinted cross-hatching, i.e. the result of connectivity and synthesis, and accept the withdrawal of that which has been connected. In so doing, these schemata mutually stabilize
37 Among theorists of body schemata, Mark Johnson has explicitly highlighted the difference between schema and diagram, stating that schemata “are dynamic patterns rather than fixed and static images, as their visual diagrams represent them” (Johnson, Mark. 1987. The Body in the Mind. The Bodily Basis of Meaning, Imagination, and Reason. Chicago: Chicago University Press, p. 30, cited after Schneider, Ernst and Wöpking 2016, 104). In their introduction to the text, Ernst and Wöpking add that for Johnson diagrams do not adequately represent the processual nature and three-dimensionality of the body schemata (Schneider, Ernst and Wöpking 2016, 92). This also applies to my own extended use of the diagrammatic. Even though we can bring back the processual character if we choose the analytical unit of a diagrammatic process that works across different media of configuration and reconfiguration, the three-dimensionality still appears to be excluded.

135
each other and the knowledge infrastructure of the MOD system, and perhaps the one of early GIS as well. Moreover, these schemata also affect the modeling of epistemic action by separating synthesis and observation and, as far as synthesis is concerned, by turning around 180 degrees its main point of orientation. The human operator is not the central reference point towards which all synthesis functions of disease mapping are put into perspective. Instead, the new central reference point is to facilitate the connectivity of different data points and an important epistemic question becomes how operations of synthesis (i.e. overlaying, data integration and interpolation) are best distributed in terms of productivity and resource efficiency.
With the next chapter, I will continue the present emphasis on proto-diagrammatic schemata and their role in coordinating epidemiological knowledge practices due to their three-dimensional surplus. But the geographical and disciplinary context of the investigation will change once again: this time to the design of an epidemic surveillance infrastructure in the framework of the WHO anti-malaria campaign during the 1960s.


137
5. Architectural schemes of containment during the WHO Malaria Eradication Program, 1956-1969
Whereas in the previous case studies I focused on epidemiological theory and medical geography, I will extend the corpus in the following by turning to the area of epidemic surveillance. The general line of inquiry remains the same, however: I will inquire how the diagrammatic in the wider sense (as a process of configuration and reconfiguration, of figurative virtualization and actualization), and diagrams in the more particular empirical sense (as maps, tables, lists, schemata, etc.) come to stabilize and coordinate topological action in the context of epidemic surveillance system. The techniques of addressing, cross-referencing, aggregating, interpolating or visualizing surveillance data, or at least parts of it, have been increasingly automatized and digitized over the course of the second half of the 20th century as the last chapter already pointed to. In the present chapter, however, I will turn to a case study that still precedes some of these changes in data and computational infrastructure, especially the introduction of GIS. In doing so, I believe, I can emphasize a particular way in which spatial information may coordinate diagrammatically, without being lured too easily into reducing it to the work of relative positioning in the context of GIS. The particular type of diagrammatic coordination that I want to highlight revolves instead around schemata of containment, for which epidemiological practice is well known at least since the beginning of quarantine.
Before going into the specifics of the case study, I will first introduce this new area of interest that is epidemic surveillance by distinguishing it from the larger context of surveillance in general. As is well known, techniques of surveillance have received enormous scholarly attention in the humanities in recent decades, often departing from Michel Foucault’s famous analysis of general regimes of surveillance. Although Foucault made exemplary reference to epidemiological practices on multiple occasions, nowhere did he outline a specific understanding and transformation of epidemic surveillance. In Discipline and Punish (Foucault [1975] 1995), he presented surveillance practice in military camps, in the factory and in schools, with a major focus on the 18th century, and he also cited historical sources that explicitly used the term surveillance at the time, but without specific reference to an epidemiological use of the concept. Surveillance was approached on a more generalized level, as a creeping technology of disciplinary power, one that

138
increasingly affects different parts of society, and which perpetuates and habituates the typical disciplinary strategies of parceling, classifying and controlling behavior and the smallest details of life as if from the inside. In an earlier article (Foucault [2002] 1974) about the history of social medicine in France, England, and Germany, he explicitly mentioned for all cases the institutionalized collection of health information, and the concept of Medical Police for the German context, but at this point without using the word surveillance (but indeed observation). It was only in a similar article a couple of years later (Foucault [2002] 1979), and after he had published Discipline and Punish, that he used the term surveillance in the context of medical police but without further detail. If epidemic surveillance had been of specific interest to him, he would have made more of this term in the context of collecting and managing public health data in the 18th and 19th centuries. It is precisely this narrowing of the meaning of surveillance to questions of data management that we will see in 20th century epidemiological discourse. Altogether, Foucault’s focus was on discussing surveillance in the context of society-wide disciplinary strategies and in their historical transformation, rather than concentrating on the concept of epidemic surveillance specifically.
Against this background I consider it necessary to re-particularize the study of epidemic surveillance to avoid falling victim to misunderstanding some of the terms used within the field or running the danger of not being sufficiently attentive to its particular techniques, practices and mediators. Possible misunderstandings of the technical concepts used in the field start already with the terminological distinction between control and surveillance. Epidemic control includes various strategies, for example quarantine, vaccination, vector and environmental control, or information campaigns aiming to change human behavior. The technology of surveillance crosses most of these strategies in a peculiar way, insofar as it provides protocols for how to collect and calculate disease-related information and for the dissemination of this information, which in turn initiates, measures and regulates control efforts. In other words, the terms surveillance and control have a distinctive meaning in the context of epidemiological knowledge and one that might not be congruent with their understandings elsewhere. I consider it necessary to reconstruct these distinctive meanings and how they have been negotiated in the context of the case study below, and thus sketch a more particular history of these terms. The trade-off of this perspective, however, is that I will have to disregard the larger historical epistemes that shape surveillance practice and thinking across provinces of thought.
A more particularized history of 'surveillance medicine’ was proposed, for example, by Armstrong (1995) that is worth recalling here as an entry point. From the earlier work of Foucault, Armstrong extracted three spatial orders that he used as heuristic guidelines: the cognitive mapping of the causes of disease, the

139
spatialization of the patient’s body, and spaces of care. In addition, he described historical transformations of medicine that would each register in these three spatial orders. The historical transformations went from "bedside medicine” to "hospital medicine,” occurring at the end of the 18th century according to Armstrong, and then towards Surveillance Medicine in the 20th century. The last historical marker might seem surprising at first because if there is such a thing as a characteristic space of surveillance medicine, wouldn’t this be the 'calculative space’ of probabilities and normal distribution curves affecting all population studies much earlier, at the latest in the 19th century? It seems that Armstrong wanted to move the introduction of surveillance medicine into the 20th century because of particular tools and techniques that increasingly accompanied medical practice, corresponding with his aim to write a history of medical surveillance, rather than surveillance more generally. Such tools and techniques were the "height and weight growth chart” for children (beginning of the 20th century), the "socio-medical survey” (World War II), and finally the introduction of community health centers. All three techniques correspond with the three spatial orders that Armstrong took from Foucault as indicative of historical transformations: The growth chart affected the mental mapping of causality (or better: correlation between height, weight, and well-being), the socio-medical survey positioned the body in relation to its environment and lifestyle, the community center provided new spaces of care. In fact, it was this last spatialization that occurred most obviously after World War II, according to Armstrong, through "emphasis on comprehensive health care, and primary and community care,” and which "underpinned the deployment of explicit surveillance services such as screening and health promotion” (Armstrong 1995, 398). For surveillance medicine to consolidate, it needed all three techniques and transformations in all three spatial orders. Only for this reason did Armstrong situate surveillance medicine in the mid-20th rather than the early 19th century or even earlier.
Armstrong’s uptake of Foucault’s history of medicine and of surveillance points to more particular historical trajectories of surveillance in relation to the materials and techniques that medicine began using and which were eventually institutionalized as a technology of their area of expertise. I consider it necessary to employ the same gesture towards surveillance in epidemiology. But I do not attempt to trace transformations in these respective spatial orders, and as far as the 'aesthetic’ affordances of new surveillance techniques are concerned, I think Armstrong repeated some rather common tropes that need scrutinizing. He stated, for example, that "the extension of a medical eye over all the population is the outward manifestation of the new framework of Surveillance Medicine” (400). But associating surveillance with 'total oversight’, and vision in general, misses in my opinion many important modes and modalities of surveillance technology.

140
Beyond these differences, however, I do follow a similar path of concentrating on the particular surveillance techniques in epidemiology and of taking seriously the articulations and periodization that are expressed by actors in the field. At the beginning of the chapter and before going into the particular case study, I will give a brief and selective introduction to important concepts and terms in epidemic surveillance in the 20th century in order to situate the 1950s and 1960s as the focus years of my case study thereafter.
5.1 A very brief history of epidemic surveillance in the 20th century
In articles that appeared in The Lancet at the turn from the 19th to the 20th century, the English word surveillance was still being used to refer to the inspection of infectious diseases at border crossings, especially at harbors. Correspondents from various parts of the world would report on the local 'epidemiological situation’ and use the term surveillance in such a manner. Then, over the course of the 1920s and 30s, more and more articles in the same journal started using the term surveillance slightly differently, that is, as a method for continuously assessing potential cases of epidemic disease by consulting and re-consulting persons at risk. Moreover, the context in which this was applied diversified. Authors did not only speak of surveillance in the context of border traffic anymore, but also of the control of measles in schools, where surveillance is supposed to be performed regularly by local nurses, or of the surveillance of tuberculosis, for example. Yet, in the epidemiological handbooks of Hamer and Greenwood from the same time, and which I discussed in the second chapter, one still finds no references to the concept of surveillance. Also in the American Journal of Epidemiology there is no mention of surveillance until the mid-1930s, and even then, it continues to be mentioned very rarely over the following twenty years. It is only by the 1950s that a terminology of epidemiological surveillance began to institutionalize in the way we see it continuing until today. The reason to assume that surveillance terminology in epidemiology, despite the longer historical genealogy of a surveillance episteme in general, took an institutionalizing turn in the 1950s has to do with the installment of surveillance programs by several directors of newly established institutions of disease control in the USA and at the WHO. Alexander Langmuir, then director of the newly founded Center for Disease Control in the US, conceptualized surveillance as a new technology in a number of articles in the early 1960s, and after having initiated the Polio Surveillance Program in the mid-1950s. At the same time the WHO’s malaria program that I will discuss below was launched, which conceptualized surveillance as one of its core techniques. Even Langmuir acknowledged the importance of the 'malaria story’ for the new age of surveillance after World War II. In 1959, one of the WHO officers in India engaged in malaria surveillance wrote: "As surveillance is a relatively new concept,

141
its procedures are often empirical. However completely medical institutions may diagnose and report malaria cases they will only form a small or large proportion of the totality of malaria prevalent in the country” (Viswanathan 1959, 11-12). And at the end of the 1960s, then-director of the WHO Smallpox Program, D.A. Henderson, published the report "Surveillance – The Key to Smallpox Eradication,” in which he considered surveillance "the single most important component of the present global eradication effort” (Henderson 1968, 2).
Something must have changed in the conception of surveillance in the 1950s that led to its institutionalization as part of the epidemiological apparatus. The term surveillance in itself was not new to public health officers of the 1950s but a new formalized understanding of surveillance had begun to take hold. According to Langmuir (1963, 182), former surveillance was oriented towards the individual patient, whereas the new surveillance meant "continued watchfulness over the distribution and trends of incidence through the systemic collection, consolidation and evaluation of morbidity and mortality reports and other data.” Moreover, he added that the dissemination of this knowledge is also "intrinsic” to the concept of surveillance, and one might imaginatively assume that this would also mean assuring adequate infrastructure for this dissemination. Although his focus on dissemination infrastructures is itself a novelty, the other points do not seem to differ much from the work of statistical officers at the beginning of the 19th century, and Langmuir also mentions them as predecessors. To regularly produce 'weekly mortality reports’ and to have a larger statistical base at one’s disposal, might be seen as an intensification rather than a change in practice. However, an important additional aspect hides behind the short formulation "and other relevant data” in the definition above. For example, for the case of a proposed influenza surveillance, Langmuir proposed also looking at local newspapers articles about school closings and school absenteeism, and at the general absence numbers from national public sector statistics. This attitude that existing medical infrastructure might not be enough for collecting the necessary information also underpinned the quote above by the malaria officer in India. The new surveillance had to establish its own data infrastructure; or that seemed to be the assumption. Finally, a last and very important difference was that surveillance, at least in the formulation of Langmuir, was anticipatory in nature and interested in short-term changes rather than the long-term future (1963, 190).
Since these developments in the 1950s and 1960s, surveillance technology has further institutionalized and become a regular functional unit of public health. Contemporary handbooks of epidemiology overlap in their descriptions of surveillance on at least four aspects: Surveillance is said to be ongoing (as compared to monitoring), incomplete, action-oriented, and timely (Yarnell and O’Reilly 2013, 302; Webb, Bain and Page, 481; Last 2001, 174-75). Moreover, a common distinction

142
is made between routine surveillance, and event-based surveillance. Routine surveillance includes only traditional sources such as hospitals, laboratories, and general practitioners, who are part of a regular notification system and also obliged to report certain diseases. Event-based surveillance, by contrast, may entail more sources outside the traditional chain, but is hoped to be quicker in finding emerging health threats. Syndromic surveillance is another term connected to event-based surveillance, but there is less agreement about what it entails. In many cases, it is oriented towards the surveillance of highly frequent but also more vaguely defined diseases such as ILI – influenza-like illness – and by means of using a broad range of untraditional sources. Because new data infrastructures, the probing for alternative sources of information, and information dissemination in general all play such a key role in surveillance, contemporary authors from within the field have proposed labels such as "infodemiology” (Eysenbach 2002) to stress this new sensitivity to information source, validity and timeliness. On the one hand, putting too much emphasis on the contemporary information revolution risks obscuring the fact that the interest in other, non-standardized information sources such as gossip and rumor had already been there for quite some time, for example, when states asked their diplomatic missions to report rumors about public health threats in their host country at the end of the 19th century. On the other hand, the speed and public scope by which disease information is disseminated has undoubtedly reached a peak not seen before. Consequently, the majority of research about epidemic surveillance in the humanities has concentrated on the integration of different kinds of media and information sources into the surveillance apparatus and the new relation to futurity and uncertainty that is expressed by these contemporary forms of event-based surveillance and syndromic surveillance.
With this larger discursive background in mind, I will turn in the following to a case study from the 1950s and 60s, where the scope of epidemic surveillance was fundamentally negotiated, both materially and conceptually. At the same time, this case study introduces an understanding of the diagrammatic that shouldn’t be limited to the viewing of planar images and therefore to the affordances of the visual field alone. Instead, I will emphasize how surveillance and control practice was coordinated by a basic and schematic model of architectural knowledge that offered to integrate a certain pragmatic plasticity, statistical operability, and embodied schemes of containment. This model knowledge is also chosen for discussion here because it eventually failed and underwent a process of refiguration.
5.2 Case Study: The WHO Malaria Eradication Program, 1955-1969
The WHO took up its work in 1948, taking over some of the functions that had previously been held by the League of Nations Health Organization before World

143
War II. In the first years of its existence, the newly founded organization appointed several expert committees to discuss current developments in what was perceived as major global diseases, and in order to develop control techniques that could be standardized and potentially applied to different parts of the world. Among these expert committees was also one on malaria, building upon already existing international attention to and funding for anti-malaria efforts between the two world wars (Zylberman 2008). Research prior to the WHO years had raised the hope of using insecticide spraying to combat the further spread of the disease. By extension, the WHO optimistically initiated the so-called Malaria Eradication Program, which set out to standardize a worldwide eradication scheme based on the technique of spraying insecticides. Moreover, since first cases of resistance against insecticides began to appear in those years, the eradication program gained additional urgency and it was hoped it would be quickly implemented before the insecticide lost its efficiency. However, in 1969, thirteen years after the program’s launch, the initial euphoria about the eradication scheme was tempered (Bruce-Chwatt 1984). The actual attempts at a complete eradication had failed in different countries and its very possibility was reformulated in much more cautious terms. The new direction suggested that malaria could not be eradicated as quickly as initially thought and the WHO called for a more flexible approach (WHO 1971, 5).
The Malaria Eradication Program between the 1950s and late 1960s offers an analytically interesting window into a particular technological rationale, at a time when international reporting infrastructure was still in the making, where location data could not be easily shared through GPS and GIS infrastructure, and where the WHO considered it necessary to support countries in installing a statistical and thus epidemiological apparatus in the first place. In other words, the malaria program entailed a great deal of infrastructure development – both health infrastructure and information infrastructure. Accordingly, the eradication scheme was divided into four phases: a preparatory one that included mapping and the collection of existing information about a region, an attack phase that included spraying, a consolidation phase that included active surveillance, and finally a maintenance phase (WHO 1957, 30-33). For a country to transition to the consolidation and maintenance phases it had to establish some of the necessary health and surveillance infrastructure that would allow protection in the future. However, at the center of the technology of eradication stood the method of spraying, closely followed by the 'new’ technique of surveillance (1957, 54).
Spraying and surveillance made for a double package because after spraying, surveillance had to verify whether case numbers had dropped or not and potentially initiate a more locally focused second round of spraying. Moreover, epidemic surveillance was and still is often distinguished into active and passive surveillance, where passive surveillance means the reporting of cases to hospitals or other

144
traditional 'posts’ that would then report to the program manager, and active surveillance means to go into affected areas and search for cases and non-cases. Surveillance infrastructure therefore belongs to the wider category of reporting infrastructures that were not equally established in all the geographies the WHO felt responsible for – either because passive surveillance posts such as hospitals did not exist or did not report, or because active surveillance was not possible because sufficient maps did not exist of these areas, or because there was a lack of staff, or because community members refused to report. Therefore, where a surveillance infrastructure was not possible – either not existing or impossible to create – the system builders of the program believed that the malaria eradication scheme could not be applied from the outset. This was the case with most African countries along the Equator (MacDonald 1957, 176).
Given the importance and novel formalism of surveillance, it is also worth noting the conceptual differences that the authors of the WHO eradication scheme maintained between the three terms eradication, control, and surveillance. Whereas the concept of control was about the repeated and “unending” reduction of disease transmission below a critical level, eradication aimed at the complete interruption of transmission with a definite end (WHO 1957, 5, 8-9). Surveillance came in as "an essential part of an eradication organization [that] is the element that distinguishes an eradication from a control programme” (1957, 56). It was considered to be a new method of repeated and focused case detection on a different scale and with a different mindset than traditional statistical methods such as the survey (WHO 1957, 54; WHO 1961, 15). Moreover, there was not only a functional distinction between the terms but also an ontological one. Control meant the real-world intervention in the ecology of the disease, for example, by means of spraying insecticides and therefore interrupting the habitat of mosquitoes. Surveillance, by contrast, meant a representational practice.
The two-tiered setup of control on the one side and surveillance on the other, bundled together under the banner eradication, is perhaps best illustrated by a quote from George MacDonald, who served as an expert advisor to the WHO malaria program and also published a monograph about malaria control around the same time (MacDonald 1957). In this monograph, MacDonald wrote that the "malaria eradication programme includes an administrative machine managing two main components, a vector control programme which is attempting to stop transmission and a surveillance mechanism attempting to measure the diminution of the reservoir of infective cases" (1957, 176, emphasis added). Both control and surveillance were seen as mechanical components working together, but while surveillance revolved around numeric representation, control interacted with the living mosquito by means of spraying.
Surveillance was a component intended to prevent the re-introduction of cases,

145
to monitor success rates, and to focus available resources on particular areas etc. But in the frame of the eradication scheme surveillance was not integrated as a part of control but as a complementary functional unit of different ontological scope. Perpendicular to this perspective, I want to inquire in the following about the knowledge infrastructure that mediated between these two functional components.
5.3 Geographical knowledge infrastructure in a pre-GIS environment
The data infrastructure of the Malaria Eradication Program involved numerous inscription media and standardized inscription practices. At the most local level, the data collection was facilitated by a so-called "case card” (Figure 10), on which any identified cases of malaria were registered, and locality sketch maps. Maps allowed malaria investigators to navigate, but they also provided addresses that needed to be registered together with the malaria case on the case card. This geographical information allowed officers further down the chain of operations to locate and eventually map aggregate case numbers. These were then translated into tables, curves or simply writing and published in mission reports that were sent to the regional headquarters. Importantly, each of these administrative levels had their own diagrammatic environments and mapping practices. Maps at different stages of the program differed in diagrammatic context and style.
In the following, I will concentrate on three different realms of map-related practices. The first type is called Geographical Reconnaissance, applies to the level of a particular locality and has its roots in military intelligence. The goal here was to collect basic geographical information and provide navigational maps for the epidemiological surveillance staff who would later (re)visit particular houses or hospitals. The second type of interest is the mapping of regional or national surveillance infrastructure at the administrative level of national supervisors, who evaluated the infrastructural capacity of the region or country. The third type, finally, is not concerned with existing surveillance infrastructure itself, but with the mapping of limit cases of surveillance, such as nomadic forms of housing and mobility. This kind of mapping and discourse primarily occupied the headquarters in Geneva, and they commissioned geographers to produce maps for them.
5.3.1 Geographical Reconnaissance
Geographical Reconnaissance (GR) was considered one of the first steps in all field missions and therefore part of the preparatory phase of eradication (WHO 1962, 14; Cavalié 1961). If a country did not already provide coherent geographical information, the mapping staff produced a new locality sketch map of the epidemic

146
areas, which involved the indexing of houses, and marking of inhabitant numbers. In addition, GR officers were supposed to attach a house visit card to each house and measure its surface in order to later determine the amount of spray needed. Accordingly, GR had a very local and fine-grained focus and it was this quality that linked it to the techniques of spraying and surveillance, which would follow in the next two phases of the eradication scheme. "Surveillance operations are sharply differentiated from survey,” as one of the expert reports made clear, and it "demands a totally different mental and statistical approach” (WHO 1961, 15). Whereas a survey targeted populations and drew on samples, surveillance was supposed to aim at individuals with the goal to identify new cases. To find these individuals, and more specifically in the case of active surveillance where field staff would not go to hospitals but revisit potentially epidemic areas, addresses had to be known. Thus, in the rural context individual houses were the primary object of interest in order
Figure 10. Malaria case card used in the Malaria Eradication Program in Turkey. Reprinted with permission from “Manual for Reporting Procedures and Records – Malaria Eradication Campaign, Turkey, 1960”, Records of the Archives of the Parasitology
Collection of the Communicable Diseases Documentation Centre at WHO Headquarters (ARC007, WHO7.0115)

147
to make surveillance possible and spraying quantifiable. In 1965, the WHO published a book-length manual in order to standardize
the work of Geographical Reconnaissance in the context of the malaria campaign. The report defined GR as a set of "census, mapping, and sampling procedures, [which] determine the quantity, quality, location, and accessibility of human habitation” (WHO 1965, 8). Moreover, the manual trained reconnaissance workers in the identification of housing types and settlement patterns in order to correctly group houses into villages and number them effectively (Figures 11a, 11b, 11c). Depending on how a settlement or housing block was structured, it was the task of the GR staff to number houses in a way that would make it easy for malaria officers arriving later to navigate quickly and effectively through the villages. In other words, houses were important orientation and anchor points for subsequent officers in the surveillance chain, and for the statistical apparatus in general. Putting them on a map, however, did not simply mean a marking of dots and the invention of an address, but it also enacted connections between those dots and possible trajectories for future field visitors. In fact, the manual stated that a "good house numbering system is one which leads from one house to the next logically with a minimum of effort. Any malaria employee should recognize the system in use and be able to locate houses readily even without a sketch” (75).
Yet, to establish such a system hinges on the question of what is considered to be a house or housing unit, and the manual gave the following definition, adopted from the general terminology handbook of the malaria eradication project: A house is "any structure other than a tent or mobile shelter which serves as a dwelling,” and, moreover, "a house to be numbered as a unit consists of a structure or a group of contiguous structures, including the living room and dependencies, which is occupied continuously or periodically by a single family and consequently accessible for spraying or inspection” (74). The definition of the house thereby prefigured the operational demands from the system, to be accessible for spraying and inspection, and it also represented preexisting assumptions about living styles and social relationships, according to which the focus was put on permanent dwellings with single families as inhabitants.
Altogether, the importance given to the correct recognition and designation of houses as the preparatory part of the malaria eradication effort cannot be overstated. Even in cases where routine geographical reconnaissance work was not possible, at least the "house numbering [and] house cards” was to be prepared (WHO 1978, TK WHO7.0119)38. For example, in the case of the project in Sri Lanka,
38 Sources from the Records of the Archives of the Parasitology Collection of the Communicable Diseases Documentation Centre at WHO Headquarters will be cited here and in the following in this format: WHO *Year of Publication* , *File Number* (e.g. TK WHO…) and, if applicable, also the *jacket number* (JKT…) of the record.

148
Figures 11a, 11b, 11c. Instructional maps for how to perform house numbering in the field. Reprinted with permission from WHO (1965, 76-77) with the following original captions:
A) “House-numbering system for closely-grouped houses in easily-recognizable rectangular blocks (locality sketch not needed)”; B) “House numbering system for closely-grouped
houses in irregular blocks (locality sketch not needed)”; C) “House numbering system for scattered houses.”

149
the regional officer was concerned that houses and villages might not have been captured in a rigorous enough manner and began comparing the lists between two different units of the program:
There is a list of villages maintained by each field overseer, vigilance unit officer and regional officer for their respective areas. These lists give the names of village and population and number of houses in each, and are expected to be kept up to date as new houses come up and old ones are abandoned. […] It was found that in one supervisor’s area in the Southern Region, there were 73 villages in the revenue office list but only 52 in the list furnished to the malaria supervisor. […] This has a serious implication in that malaria cases can get 'lost’ and never be found until a serious focus is, by accident, observed. (WHO 1964, SL WHO70143_G)
The housing unit became a core unit of the to-be-established statistical apparatus and knowledge infrastructure against which the trustworthy functioning of the malaria program would be evaluated. However, it is important to remember that despite its general importance the inscription media and practices around this housing unit differed. We are speaking of a context in which there was no continuous and distributed geographic information system in place for the whole program but rather a situation that resembles Latour’s study of Portuguese explorers, whose media networks consisted of a 'cascade of inscription’ that would end up in a paper-based 'center of calculation’. In the case of the Malaria Eradication Program, if a base map was used by local field staff to gather epidemiologically relevant information and inscribe it onto a case card, then this information would be re-represented at the next level in other formats, such as lists and tables with numeric area codes, and in turn this information would later be re-represented again in written reports, or another kind of map, and so on and so forth, until it finally reached the central administrative programming unit in the respective state office or in the Regional WHO headquarters.
5.3.2 Evaluating Surveillance Infrastructure
While Geographical Reconnaissance was coupled with the identification of individual houses or groups of houses, the geographical assessment at the national supervision level was instead concerned with area assessment. These officers would produce their own maps on a different scale, in which they distinguished areas within a country according to their epidemic potential and current phase of the project. Besides maps on vector and parasite distribution, the mapping of surveillance infrastructure was also an important function of map-based assessment

150
at this level. For example, in the case of the national malaria service in Sri Lanka a series of maps of national scale accompanied the so-called "Plan of Operations” (WHO 1965, SRL-MPD-001(A)). These operational plans were also legal documents that had to be signed by both the country and the WHO. In this particular case, the maps accompanying the plan showed the distribution of so-called 'active and passive surveillance posts.’ By active surveillance the officers meant the deliberate visiting of a house and collection of blood samples by a staff member of the campaign. By passive case detection they referred to the identification of malaria cases at hospitals and other medical institutions, after patients themselves decided to visit the facilities.
The likely reason for mapping these surveillance posts was to assess the infrastructural capacity of the malaria mission in Sri Lanka. As said above, the road to successful eradication was perceived as a question of effective timing. Eradication could only be achieved, so the rationale went, if the setup was applied on a time-limited scale: first spraying, then tight surveillance, and eventually permanent vigilance – altogether eradicating the disease before resistance against the insecticide could spread. Surveillance was particularly critical for this project as it followed spraying and was said to prevent the reintroduction of cases. Missing the timely reporting of a single case, could be responsible for falling back behind all the efforts spent.
By mapping existing surveillance infrastructure in the case of Sri Lanka the program coordinator would assess the possibility of whether the eradication scheme could transition into the national health service, and thereby if the infrastructure provided for what was called the "maintenance phase” or last phase of the project (WHO 1962, 22). In the eyes of the WHO program designers and advisors, maintaining eradication was also linked to the existence of a proper geographical and administrative layout of surveillance, in order to detect new or imported cases in the future. If this was done, the country was considered to be independently capable of continuing the malaria efforts initiated by international agencies. In this way, the technique of mapping surveillance infrastructure at the national or regional level also mediated a kind of technical national sovereignty.
Besides the different functions of mapping at this administrative level, the design of maps also multiplied. Whereas Geographical Reconnaissance and especially the house numbering system had been standardized, it seems that the design of maps at other administrative levels was largely up to the particular context. This is at least the sense one gets from the variety of maps from different missions that are conserved in the malaria files of the Parasitology Collection of the WHO Archives. Hardly any of the maps resemble each other formally. Even within one and the same mission context, mapping styles were multiple. For example, in the above-mentioned case of the Sri Lanka mission, the files contained the already mentioned dot maps

151
of surveillance posts as well as hand-colored choropleth maps with transmission vectors inscribed upon them. The only continuity between these maps was the outline of the state of Sri Lanka. Yet, within the confines of these state boundaries appeared a drawing space that was experimented with in different ways. Eventually, the different maps were produced on transparent sheets of paper to allow for analogue overlaying and therefore facilitating comparison. On the one hand, this plurality of cartographic styles simply testifies once again to what has been stressed already in the previous chapters: that epidemiological knowledge operates across different types of diagrammatic media, and consequently, also across different maps. On the other hand, the variations in map design are also indicative of the mapping environment in which the malaria project was operating more generally: instead of a homogenous display of maps across geographies and administrative units, as we are accustomed to in the context of contemporary computer mapping systems, mapping was a very situated practice, despite a standardized geographical information system based on housing units at the most local level.
5.3.3 Mapping ‘technical’ problems
There is little information on how maps about the Malaria Eradication Project were used and handled at the WHO headquarter division that was responsible for this project. Yet, there are folders of maps from this division that were archived and which do not belong to particular missions or do not appear in the context of particular assessment reports. It is likely, that it is these maps that are specific to the headquarters and which can give us, together with the general program and expert reports, a glimpse into the mapping and geographical knowledge practices at this level of administration. Here, one does not find the same mapping of surveillance infrastructure and aggregate cases that occupied the national and local units. Nor does one find the locality sketch maps that were produced at the level of Geographical Reconnaissance. But one can nevertheless identify a specific form of mapping at this level of the eradication apparatus, which is focused on research and technical questions that affected or threatened to affect the whole program. Two questions or 'problems’ were particularly important and repeatedly addressed in this context: housing and population movement.
For example, the archival records suggest that during the 1960s officers at the WHO headquarters in Geneva were particularly interested in the larger triangle in the Middle East where Turkey, Syria, Iraq, and Iran meet. More specifically, a series of maps indicates that they focused on the assessment of population movement in the area. This interest might also stem from earlier evaluations of the malaria campaign in Turkey. The Turkish malaria mission had been perceived as particularly promising, but the fact that transmission could nevertheless not be interrupted was blamed

152
on the confluence of different forms of population movement: seasonal migration inside the country as well as trans-border migration between Turkey and Iraq, but also nomadism in the same border regions. Especially nomadism is of interest here. Population movement was perceived as potentially problematic for the anti-malaria efforts not only because it was feared that people and trade could carry mosquitoes and the plasmodium parasite to non-endemic areas. This problematization of population movement also revolved around a technical conception of nomadism, as characterized by its 'lack’ of permanent dwellings (WHO 1975, WHO7.0118 JKT10). And without permanent dwellings, both the technique of indoor spraying and the statistical apparatus prepared by Geographical Reconnaissance could not take hold.
This problematization of types of housing extended beyond the WHO’s particular interest in the Middle East. They commissioned the external geographer Ralph Mansell Prothero from Liverpool University to study and map the different types of population movement as well as dwelling types across the whole of the African continent. Identifying housing types, and more specifically the material of indoor walls, was important in figuring out which insecticide spray would stick permanently to which wall type. Among the files in the WHO archives is a series of three maps by Mansell Prothero produced in 1961, which he later republished in a monograph on the subject (Mansell Prothero 1965). The three maps contained information on types of dwelling (wall and roof material), on different settlement patterns, and on forms of subsistence economy including pastoralism and nomadic agriculture and hunting. However, despite the variety of movement maps that Mansell Prothero also produced, the ones that endured at the headquarter division were those that paid particular attention to the different types of housing.
5.4 The house as containment scheme between surveillance and control
At the time of the Malaria Eradication Program, infectious disease epidemics had already been recognized as 'emergent’ phenomena, which needed a certain number of infections to circulate in a community in order to be sustained. George Macdonald, one of the expert advisors of the WHO Malaria Eradication Program, had himself contributed significantly to a formal definition of epidemic thresholds (Macdonald 1952). Interrupting the circulation and therefore pushing the number of infections below a critical level was crucial for all epidemic control efforts, including that of malaria. In addition, the 'new’ technology of surveillance was regarded as important because it assessed the control efforts already spent and because it was thought to guarantee quick identification of new cases that might lead to another breach of the epidemic threshold. This interplay of emergence or threshold knowledge with the technologies of surveillance and spraying marked the specific epidemiological

153
rationale of control at the time. But this was a largely academic knowledge. Thresholds were not described
and circulated among the participants of the network, and they were therefore not part of the writing or inscription system that coordinated between the different functional parts of the program. The coordination was rather guaranteed by other means: by standardized mediators such as the case card or blood smear, for example, and by practical instructions through trainings and manuals. In addition, formal units and information categories served to coordinate, making sure all participants attended to similar objects. This equally counted for epidemiological categories (for example, disease and vector classifications), administrative categories (for example, 'vigilance units’, 'surveillance posts’, etc.), and for geographical categories. The partitioning of the terrain into specific 'area codes’ made it possible to address these areas in a similar way by participants at multiple levels of the program.
Another such category with a coordinating function was the unit of the house as illustrated above. This might appear to be a truism, because from the postal system to most demographic projects the house unit is a conventional category. But I believe that in the context of the Malaria Eradication Project, there might be more to take from the function of this category. It appears that the unit of the house served as an ideal point of coordination between the necessity of (indoor) spraying and that of surveillance, or in other words, between the two halves of the administrative machine of eradication, between intervention and measurement. Moreover, this unit was described and worked upon in great detail. GR staff did not only put houses on the map but also measured the interior wall space. The deployment and evaluation of spray was then calculated from these geometries and by staff at another administrative level. In turn, whether or not the spraying was effective was measured by entomologists on the ground who developed a method to collect dead mosquitoes inside the house. For them, the enclosed interior space became a miniature statistical device by itself.39
All these different practices and participants were coordinated most effectively by the very basic concept of a house, as a three-dimensional and conventionally closed volume that can be located at a specific place in space and time. The house unit functioned as a relay container, where one order of collection could be brought into contact with another collection, for example the collection of mosquitoes by the program’s entomologists with the collection of active cases by the program’s malariologists, or with the collection of topographic features by the reconnaissance workers. Its specific capacity was to establish equivalence across several collections
39 A manual on entomological methods for malaria control described how to estimate the number of mosquitoes in the following way: by laying a white blanket on the floor of the closed interior space and spraying the whole room, then counting all mosquitoes laying on the sheet (WHO 1975, 10).

154
at once. Moreover, the object of the house had the potential to work with different dimensions. It allowed for flat inscription – and subsequent displaceability – and for three-dimensional containment. On the one hand it worked as an intuitive statistical category, easily recognizable and translatable into measurements and flat inscriptions. As an abstracted inscription it could be mobilized across the whole of the machine and create a juncture for different activities. On the other hand, it connoted volumetric properties and boundaries that were easily associated and made operable for capture, containment and intervention. Its corporeality was essential for providing an imaginary model of containment that worked with the practices of different actors. In fact, the thematic focus on housing also adopted an already long-established discourse about architectural solutions to the control of malaria, from concrete building suggestions in colonial literature about tropical medicine to the protective screens suggested by Italian malariologists at the turn of the century.40
However, the most interesting aspect of the house unit in the present context is that it was an object that registered both ‘the programs and anti-programs’ (Latour 1991) of the campaign: On the one hand, it was projected as something that would facilitate indoor spraying and surveillance, according to the housing standards of the program managers. On the other hand, residents could live in temporary structures instead or they would simply use their homes differently than was expected and programmed by the malaria eradication regime. Accordingly, the WHO sent experts to the field to assess how people used their houses. Providing information not only on types but also ways of habitation was standard practice. But it also turned the house into a potential defunct of the program. Final evaluation reports emphasized that inhabitants slept outside or on the roofs of their houses during warm seasons, and pictured this behavior as critical for the campaign.41
In fact, the question of housing became a 'technical matter’ for the project managers. Here, it is worth recalling how the annual reports of the expert advisory group of the program defined the 'technicality’ of the eradication project. They did not do so directly, but indirectly, by categorizing "failures” or "problems” of the program into operational, administrative and technical problems (WHO 1961, 4-6; WHO 1967, 34). Interestingly, technical problems comprised a mix of a) human ecology and habits, b) vector resistance and behavior, and c) parasite resistance (WHO 1967, 34; WHO 1971, 19). How people used their habitation fell under this category of technical problems:
40 For example: Murray 1895; Celli 1900; see also the image of a door screen by Celli reproduced in Kirby et al. 2008.
41 This can be found, for example, in numerous evaluation reports on the Malaria Eradication Project in Turkey (TK WHO7.0117-JKT7-8; TK WHO7.0118-JKT9-10; TK WHO7.0119-JKT11).

155
In reviewing the programmes it was noted that in some of them technical problems have arisen from the following causes: […] 4. Factors related to human ecology, such as population movements, outdoor sleeping, types of dwellings unsuitable for the use of residual insecticides… (WHO 1967, 34)
The reason for labeling these problems as 'technical’ was their relationship to the main technique of control of the whole program, which was vector control by way of insecticide spraying, and technical problems occurred wherever the efficiency of this control technique was seemingly compromised. The adjective technical was employed in a mere instrumental sense to refer to the means of achieving the task of control, to push disease transmission below a certain limit and eventually completely end transmission. Therefore, framing housing practices as a technical problem makes evident that higher administrative levels of the project problematized the house as a control device rather than as a statistical and informational unit. Yet, we saw that the house was equally crucial for spanning Geographical Reconnaissance and surveillance. The coordinating power of the housing object lay precisely in its capacity to bridge between 'the two main components of the administrative machine of the Malaria Eradication Project’ (Macdonald 1957), i.e. surveillance and control, while being intuitively rooted in a basic schema of containment.
5.5 Discussion: Figurative coordination in place of diagrammatic infrastructure
The present chapter has tentatively developed the hypothesis that architecture worked as a medium and coordinating relay for the system of malaria eradication at the WHO in the 1950s and 60s. It coordinated central operational chains of the eradication apparatus as was defined in chapter 1, by integrating different sets of action through a shared image or figure of the closed interior space, and in relation to which the different groups (entomologists, epidemiologists, geographical reconnaissance workers and system builders) within the organization established a similar practice of engaging with the technological model of eradication. However, despite its coordinating role, the image of the closed interior space – or architecture more generally – did not stabilize the controversy about the most effective control strategies; nor did it facilitate the success of implementing eradication across different geographies. It did not stabilize the tension between different understandings and usages of housing, between the "programs" and "anti-programs" (Latour 1991) that developed around the use of architecture in different geographies. In this sense, it failed to stabilize at one end while succeeding

156
in coordination at another end.The choice of this case study was particularly motivated by its historical setting
of being situated before the widespread availability of a global homogenized GIS infrastructure and at a moment when a 'new’ formalization of the technology of surveillance was made explicit in some parts of public health discourse. However, this should not be mistaken for a view that geographical-statistical practices have been evened out in the contemporary GIS environment. Indeed, contemporary GIS software tends to homogenize the design of maps and automatizes formerly manual practices of overlaying, as we have seen in the previous chapter. It is also based on a statistical grid of addresses upon which practices of navigation, intervention planning, repeated data collection, comparison, trend analysis, evaluation and surveillance are nowadays built on a global scale. But even though the rules of making such a statistical grid have been internationally harmonized through certain standards, this does not mean that this grid applies everywhere in the same granularity or that it is always up to date. Geographical reconnaissance continues to be part of the statistical apparatus up to the present, in different intensities across the globe, and despite a seemingly global geographical information system. Consequently, the Geographical Information System should not be confused with what Taylor (1990) called the "Geographical Knowledge System", or GKS. The use of global GIS infrastructure is not a constitutive but a contingent aspect of GKS. Geographical knowledge systems may still have their own focus and practices: The location of trees may be less important than the location of rivers, for example; some map designs might be more valued than others, and the rhythm of re-mapping may be set to the particular demands of the knowledge system.
Looking back at the Malaria Eradication Program of the WHO, this episode can equally be approached as the building of such a geographical knowledge system for which the building of a geographical information system was perceived necessary but without the latter being congruent with the former. The question of coordination belongs to the knowledge system rather than the information system. It testifies to the coordination of particular and situated interests, epistemic practices and resources. The geographical interest in housing was linked to the precondition that the control system envisaged, that is, the importance of housing for spraying, rather than specific topographical features. It was also linked to the demands of the emerging technology of surveillance, making it possible to revisit these houses on regular intervals, to quantify case detection and number of mosquitos. And it was linked to a simple epistemic resource because it represented a supposedly universal blueprint for containment. These different aspects turn the housing unit into a candidate medium for epistemic coordination, but it still needs to be discussed whether we can also speak of a diagrammatic coordination here. My proposal is the following: I perceive of the interplay between tables and maps as a diagrammatic

157
infrastructure, and that contemporary GIS provides such an infrastructure in a standardized fashion. In the case of the MEP, this kind of infrastructure had not yet been standardized and homogenized to this extent; nonetheless, it had developed a knowledge infrastructure that entailed figurative coordination through the proto-diagrammatic schema of the housing unit.
5.5.1 Re-configuration across cognitive tasks
Diagrammatic regularity in the previous case studies was established through figurative connections – specific combinations of spatial tropes, maps, graphs, and tables. In the present case study, my analysis commenced from a different if not opposite angle. It was not the diagrammatic artifacts from which I started but a spatial reference object that obtained a diagrammatic function through establishing similarity. One could argue that this change in analytical perspective risks forgetting the media of inscription that implement this diagrammatic process. Instead of focusing on this or that architectural drawing, I have rather spoken of knowledge about architecture, about the interior space of a house, or about the practice of housing. A typical diagrammatic medium for architectural knowledge is that of a floor plan, iconically related to this or that building by similarity. I equally allude to the iconicity of an architectural schema in the present case study: to the similarity between the containering of epidemiological control and that of a walled house which facilitates part of the plastic effectiveness of architecture within the organization. But in my case, and different from that of a floor plan, architecture is not graphically inscribed in external media, but rather calls upon the container model as an embodied schema.
A basic embodied 'container schema’ was famously proposed by Lakoff and Johnson (1980) and supposedly gave rise to a series of container metaphors in our ontological reasoning: for example, speaking of substances as containers. Lakoff and Johnson 'root’ this understanding in the fact that "we are physical beings, bounded and set off from the rest of the world by the surface of our skins, and we experience the rest of the world as outside us. Each of us is a container, with a bounding surface and an in-out orientation. We project our in-out orientation onto other physical objects […] Rooms and houses are obvious containers” (Lakoff and Johnson 1980, 29). In their understanding, then, the container schema appears as a transcultural basis that we develop and deploy from early childhood onwards. However, placing all the emphasis on such an understanding of 'basic’ embodied schemata as that which implements the mimetic effectiveness of architecture, risks proposing a merely deductive diagrammatic process, where general figures or schemata are always already there and merely applied to the world but not transformed. To prove that architectural knowledge works in a diagrammatic way, as was outlined in the

158
first chapter, I must therefore unpack how it also goes beyond the mere application of a schema and mediates a process of reconfiguration.
The scale on which this reconfiguration must be traced is not the body of a human individual, however, but the organizational scale of the eradication program. Still, approaching this level as being composed of different cognitive projects and tasks helps to outline how the coordination and diagrammatic reconfiguration is performed beyond mere deduction. For example, the eradication systems consisted of a control and a surveillance component and for either one architecture might be approached as a medium for realizing their respective tasks. Moreover, it is a worthwhile exercise to further differentiate this mediating function of the architectural object from a perspective of traditional cognitive system theory with its distinction of task, algorithm and implementation (Hutchins 1996, 50). Choosing such a systemic perspective is legitimized by the fact that the field I am investigating is itself occupied with the design of an eradication 'system,’ composed of an 'administrative machine with control and surveillance as its two main components’ (Macdonald).
To start with the control component, the main object and task of control was to keep the distribution of malaria below a critical level, and as derivatives of this, to restrict the mobility of malaria-infected humans, and prevent the reproduction of malaria transmitting mosquitos, the development of plasmodia in the human body, and bodily contact between humans and mosquitos. Algorithmic means and techniques of control, which were supposed to help in accomplishing these tasks and subtasks, were the spraying of insecticides, vaccination, border control, the drying of swamps and other breeding places of mosquitos, the installment of mosquito nets in interior rooms, the wearing of specific clothing, the seeking of refuge in mosquito-free dwellings, etc. On the level of how to materially implement these tasks and their supportive algorithms, we can finally approach architecture as both a practical and material implementation. Houses materially implement the technique of spraying by providing walls on which the spray stays. They also materially and practically implement the prevention of bodily contact between humans and mosquitos – at least theoretically in the housing model that system designers projected – through protective walls. These implementing functions of architecture are assumed to exist in the general, meaning that a function does not only implement control in this or that case, but that it can be used deductively as a model for implementing control efforts in this and the next number of cases. If it fails its implementing function, it can be removed from the list and replaced by another means of implementation, or its failure might shift the focus to other means on the list, such as putting more funding and research into controlling bodily contact between mosquitos and humans through clothing and mosquito nets, for example. As a consequence of this failure, the model category of architecture might be altered,

159
but this does not mean that it will be redesigned as a means of implementation. The same gesture of approaching control as a cognitive task of the
malaria eradication system, with its specific algorithms, representations and implementations, must then also be applied to the second major component of the system, that is, surveillance, and how it provides a possible framework in which to situate the medium of architecture. The main task and object of surveillance is the recognition of disease trends in a population (Langmuir), and deriving from this, the repeated detection of cases of disease in a population or region. The algorithms that are hoped to facilitate this task are house visits, interviews, laboratory validation, transformation of data into discrete form, data aggregation, different methods of calculation, numerical or cartographic comparison, etc. These algorithms are materially implemented through, for example, case cards, local maps, blood smears, motorcycles, laboratory equipment, calculation aids, table and map displays, mail and other forms of telecommunication. Architecture exists in this arrangement primarily as an address in the information system of surveillance, and the sourcing or production of this address is part of geographical reconnaissance, which itself might be considered a task that supports both surveillance and control. Knowledge of addresses and territorial boundaries is essential to surveillance because it safeguards repeatability. In order to see trends, the last and next data collection must be sourced from the same addresses or aggregates. In other words, architecture is enacted in an extremely reductive way across the system of surveillance – merely as an address in an information system.
For a further comparative interpretation of this 'cognitive description’ of the role of architecture in the Malaria Eradication Program, one can now make use of the terminological distinction between mediators and intermediaries that was discussed at the beginning of the book. It seems that for the task of surveillance, architecture-as-address was merely an intermediary which made data capture and comparison possible, but which did not have any figurative function beyond the address, and which lacked plasticity. For control and system evaluation, by contrast, architecture obtained the role of a mediator, which did not merely exercise or transmit control commands with precision, but was a more complicated means whose transmitting function regularly broke down. It was problematized for stabilizing or not stabilizing between program and anti-program. In addition, the distinction between mediator and intermediary also corresponds with more or less figurative plasticity. In the case of surveillance, the figuration of architecture as address was settled, putting it forward as an actor within an information system that has the capacity to transmit information accurately and no more. In the case of control, the figuration of architecture as this or that actor within this or that framework remained precarious and it was approached over and again, at last in its geographical distribution. If we wish to infer a conclusion about the status of

160
the medium of architecture for the whole eradication program, one would need to integrate this double status as intermediary or address in the surveillance context, and as mediator or plastic housing object in the control context. However, instead of trying to integrate them, we might instead interpret architecture as a multiple technical object, which in the context of one task stabilizes and in the other case threatens to de-stabilize.
Yet, despite its ambivalent status in terms of stabilization, the housing object does not lose the capacity to coordinate. It coordinated as address in the information system of surveillance, by providing a fixed variable to which different data values can be attached and prepared for comparison. It also coordinated in the control context by fixating and dividing the intertwined flow of mosquitos and humans. And it coordinated across the system by offering a joint orientation scheme based on containment, for informational, biological and ecological containment. However, what has not yet been discussed in sufficient detail is how this coordination is not just a form of co-orientation but also involves a transformative process of modelling and remodeling, of configuration and reconfiguration, that might speak to the concept of diagrammatic coordination.
Here, the present case study is informative because it shows how a presumably basic orientation scheme is literally turned inside out, by which a container can be permeable and always refers back to its outside. The thinking of the outside and permeable border does not erase the orientation scheme but adds to it and reconfigures the original model. Architectural knowledge obtains a coordinating function in the present context precisely because it facilitates these adaptations and additions on a theoretical level, while being firmly rooted in the empirical. On this general level, I would argue, we can eventually also reclaim a diagrammatic function of the medium of architecture, which allows us to reconfigure this general orientation schema, even without being inscribed in a diagram in the more literal sense. Indeed, we find its transformative involvement in a cycle of theoretical modeling that goes from the deductive application of a general model of architecture to the empirical identification of deviances that alters the general model, widens its extensiveness insofar as to accommodate a wider class of architectural types, and which eventually initiates new actions. What is missing is the graphical support of the abductive step of hypothesis building, which has been so characteristic of diagrams and which is based on their abstract, reductive, and after all aesthetic offer to recombine the presented parts and become involved in the thought game of possibilities. In the present case of the organization of malaria eradication, the production of knowledge about architecture and housing proceeds top-down (deductively) and bottom-up (inductively) without offering a graphical experimentation plane in-between. Similar to the previous case study, we can speak in this context of a proto-diagrammatic schematization and figurative coordination.

161
An important question remains: What kind of categorical transformation is being performed – a transformation of a category of thinking, which is only anchored in this exercising thinking, or a category of organization which is also anchored in other processes? What is brought into an oppositional encounter within the organization of the Malaria Eradication Program is an ideal thinking of architecture and housing on the one hand with a figuration of empirical findings about architecture and housing on the other. This may lead to a transformation of the way in which members of the malaria campaign thought of architecture and housing to make space for more forms of housing, but this category transformation is limited to 'interiorizations’ and embodiments. It does not change anything about the idealized expression of housing and architecture on the organizational level, such as a transformation of the standardization of the housing unit. What it does change, however, is the design of the task: Different subtasks, techniques and means are emphasized, and new subtasks and research programs are initiated; for example, the mapping of anti-programs such as nomadic dwelling. In this way, the figuration of architecture and housing on lower administrative levels has effects on higher levels of the organization and on decisions about which new control actions are initiated, even though the standardization of organization-wide categories might not be altered.
Finally, there are two reasons why I consider the technology of the Malaria Eradication Program interesting from a historical perspective on epistemologies of surveillance and control: Firstly, eradication was portrayed as a closed system. Once its failings became obvious, calls for a more flexible design emerged. Interestingly, surveillance came out strengthened from this failed eradication attempt. Standardized practices of surveillance had been established and exercised that would continue to exist even after the end of the eradication program, such as passive and active case detection, for example. It seems as if surveillance obtained its status of a more flexible type of control vis-à-vis and through the failure of a more static system. Secondly, surveillance was described as something that did not belong to control, but that complemented it. Control was seen as an operation of a different mode or ontology that intervenes in the ecology of the disease while surveillance was thought to deal with another grip on reality, with its symbolic processing. This division of labor seems to resonate with the meaning of surveillance that began to take hold in the second half of the 20th century, where surveillance is largely synonymous with information management and intelligence. However, it is important to remember that this distinction is a discursive regularity found in the written accounts of system builders, and not an intrinsic property of either surveillance or control. The distinction can be challenged through an analysis of situated object enactments that cross both epistemological and ontological descriptions. In the present case study, for example, one could read the role of the

162
housing object or architecture more generally as something that allows one to move across these distinctions. The conditions for this mediation of the housing object between control and surveillance are not universal, as a reference to basic embodied schemes of containment might risk indicating. They also did not merely continue a century-old practice of medical police’s interest in architectures of quarantine. Instead, the conditions were historically specific due to the particular understanding and materialities of epidemic surveillance and control at the time.

163
6. Charting the temporal shape of outbreak detection algorithms in epidemic surveillance
Over the course of the second half of the 20th century, surveillance has increasingly been treated as a synonym for information gathering or intelligence. In addition, questions about the automatization of epidemic information gathering and statistical analysis have developed into an area of research and development of its own, sometimes called “Public Health and Epidemiology Informatics” (Thiébaut and Thiessard 2017). Public health organizations employ not only surveillance staff with a background in public health or epidemiology, often focusing on specific diseases, but also informatics specialists who work on the automatization of data analysis as well as of the dissemination and presentation of data through platforms and graphical user interfaces. Annemarie Mol proposes speaking of objects of disease as multiples because of the varying ways of enacting these objects in laboratory practice, statistical practice and clinical practice (Mol 2002). The same can be claimed, I believe, for the objects enacted in public health organizations, where in an informatics research environment a potential epidemic event is enacted differently than in the routine work of a surveillance officer.
The present chapter presents my attempt to trace these differences in how people engage with the performance of automatic outbreak detection algorithms and with the object of a threshold of emergence. On the one hand, thresholds of disease emergence have been investigated and formalized in epidemiological theory at multiple points over the course of the last hundred years, and they must be considered as belonging to a core set of research objects that epidemiological and public health workers are familiar with by professional training. On the other hand, in the context of surveillance and informatics, thresholds of emergence are connected to the question how to signal and detect the breaching of these thresholds. The epidemiological knowledge about thresholds of emergence in a public health organization is therefore couched between the wider professional familiarity with disease thresholds, and the rather differently distributed familiarity and experience of thresholds as informatic signaling events. In the present chapter, I am therefore not only studying the topological object of an emergence threshold and how it is diagrammatically represented, but also the related threshold object of an alarm signal and its own diagrammatic representation, both of which I believe to be a key

164
part of epidemiological knowledge practice.However, my attempt at studying these objects and their respective
diagrammatic formatting was somewhat compromised by the impossibility of field access to local public health departments in Germany, where I wished to study the use of these algorithmic processes and objects in situ. Because access was denied in all cases, I must instead limit myself to a reconstruction of how members of the epidemiological informatics community enact these algorithmic processes and the object of thresholds, drawing from document research and interviews. Yet, during my interviews it became clear that the functioning of these algorithms had met with criticism in the past from health officers who were less familiar with informatics, and that graphical user interfaces were currently being developed that took up trends in popular data visualization, including a promise for more intuitive understanding. It is for this reason that I think one can still receive insights from this case study, and about the difference in object enactment that it implies, despite the partial lack of field access.
At the minimum, the chapter offers an important topological object in epidemiological knowledge that has not received enough attention so far: that is, the object of a threshold that accompanied many theoretical accounts of epidemic emergence throughout the 20th century.42 And it presents an empirical example of a diagram that I have not previously discussed, and which is known as the quality control chart. These charts are used to check whether an algorithm has correctly triggered an alarm and they do so by visualizing a threshold line above which one would expect an outbreak and not only a minor aggregation of cases. Moreover, these charts allow for a specific mimetic experience of the emergency event called outbreak – in the double meaning of emergence and event – where the viewer is led to trace the passing of a border or threshold and iconic-diagrammatically comprehend the concept of an outbreak event. This iconic form of visualizing outbreaks, emergence and algorithmic performance is common in the work of system evaluation and for informatics specialists but less so in the work of public health personnel, who are informed about outbreak alarms through tabulated numbers. Taking this difference seriously, I also wish to present an example where diagrammatic standardization and coordination across an organization may fail or may be absent.
Finally, with this chapter I am also indicating a knowledge interface between epidemiological organizations and programming communities outside these organizations. This interface will be picked up in the following chapter and the present chapter may serve as a bridge between the focus on islands of
42 For example, Lotka and Sharpe 1923; Kermack and McKendrick 1927; Macdonald 1952; see also Holmes 1997.
165
epidemiological expertise that have occupied me so far and the focus on the transaction between these islands and technical expertise in their environment. In other words, in terms of epistemic practices and how epistemic objects are enacted, informatics specialists working within public health organizations might have more in common with the programming communities outside these organizations than with other public health staff of the same organization.
6.1 Outbreak detection algorithms and surveillance systems
Part of the work of informatic specialists in public health organizations is the conception and realization of algorithms that can assist in public health surveillance by way of automatizing the collection or dissemination of information, the perfomance of standard mathematical operations and the detection of statistical deviations. There are numerous algorithms involved in the practice of epidemiology, if we consider algorithms in their wider definition as a "set of step-by-step procedures, often expressed mathematically” (Striphas 2015, 403), increasingly performed by computers and opaque to human observers. The algorithm I will engage with in the following is an algorithm that automatically detects outbreaks in numerical patterns, in the data that has been inputted into an epidemiological surveillance system. These algorithms also go by the name of aberration detection algorithms. Aberration detection itself is an old statistical technique that could be argued to date back to the basic statistical law of error applied to normal distribution curves (Bates 2002, 248). Its further statistical or mathematical formalization for the automatic analysis of epidemiological data occurred in the 1960s (Ederer, Myers and Mantel 1964) and has been refined ever since. In the present context, I will look more specifically into cases where aberration detection algorithms have been integrated into early warning systems, and I consider early warning systems as a specific kind of surveillance system – a kind that is reflexive about the formalization of different temporal modalities.
However, it needs to be kept in mind from the outset that algorithms in general, and aberration detection algorithms in particular, cannot be treated as a singular entity. First of all, algorithms are usually "entrenched” with human procedures and "self-entrenched” with various connected algorithms, thereby creating a "multiple opacity” (Roberge and Seyfert 2017, 9-10). In addition, in the present case one also finds a variety of statistical and mathematical methods engrained into the algorithm’s procedural unfolding, adding another layer of entrenchment, if one considers the knowhow necessary to understanding these methods and the historical genealogies they individually open up to. Consequently, system builders, programmers, and public health offers may have very different experiences of, knowledge about and ways of engaging with the functioning of these algorithms
166
and what they entail. They may also have very different ways of visualizing these algorithms, the mathematical calculations they entail and the results they produce.
Against this background of multiple entrenchments and epistemic requirements, I find it helpful to distinguish between different discursive contexts and levels of description in the analysis that follows. For example, a distinction can be drawn between cases where algorithmic parts are being discussed in detail from those where algorithms are addressed more generally in their role within early warning systems. Accompanying concepts and attributed functions may be construed differently in these discursive contexts. For example, in system-level descriptions anticipation is often highlighted as an aim of early warning, and aberration detection is construed as one of the tools employed to achieve this. By contrast, in more detailed descriptions of the algorithmic parts and the mathematical methods used by these algorithms, the aim of anticipation is rarely mentioned. These different discursive contexts are important because to speak of detection algorithms in the context of anticipation imbues them with a future orientation and frames them as a linear activity. Whereas the more technical description of algorithms given by developers and programmers renders them instead as composed wholes, iterative procedures that entail different possible timings within themselves. In line with the discussions in the previous chapters, these discursive contexts provide part of the figurative potential of a field of action. Moreover, such a distinction between description levels and discursive context also corresponds with a different use of images to illustrate the work of algorithms. System-level descriptions usually do not visualize the larger components that an algorithm is comprised of. By contrast, algorithm-level descriptions are presented in flowcharts, task structure diagrams, mathematic formulas, or programming code.
In the following, I will start with two different levels of description and their respective context: Firstly, with a system-level description, where outbreak detection algorithms are put in relation to the categorization of surveillance systems; secondly, with an algorithm-level description, where emphasis is put on how to evaluate the technical functioning of an algorithm. Both levels frame the temporality of algorithmic performance and of the context which it is supposed to serve differently.
6.1.1 Event and anticipation in the context of system-level descriptions
System-level descriptions of epidemic surveillance and early warning systems are usually found in written guidelines, framework reports and handbooks, and they are impacted by larger discursive developments such as policy decisions that might exceed the specific arena of public health. More specifically, the description of early warning systems in epidemiology is embedded in the larger normative and

167
technological change towards anticipatory security epistemologies that deal with and attempt to formalize future uncertainty (Adey and Anderson 2012, 101). At the same time, they only continue a longer-established interest in epidemiology for anticipatory judgments in a more automated and informationally complex fashion. As mentioned in the chapter above, already in the 1960s the then-CDC director Langmuir considered epidemiological surveillance to be an anticipatory technique which is not interested in the long trends but in the near future (Langmuir 1963, 190). Over the last decades, however, the description of anticipation as one of the main aims of surveillance systems has brought about further categorical distinctions for assessing this function. For example, two categories that are particularly important for the development of early warning systems are the validity and timeliness of information. The design of early warning systems is often described as depending on how to trade the possibility to receive information early enough against the validity of this information, and the question of validity further depends on which sources are used (Berger, Shiau and Weintraub 2005). On the one hand, so the thinking goes, one cannot wait for all potential disease data to come from verified sources in the context of a routine surveillance system, for example from hospitals, laboratories and general practitioners that are legally obliged to notify national control agencies of certain diseases. On the other hand, one does not want to "float” the system with false signals from unverified sources, as one of my interlocutors at a public health agency in Germany described it. Unverified sources could be, for example, news outlets but also ambulance calls that have not yet been verified by a detailed examination. The list of potentially interesting, unverified sources is growing bigger and bigger, with information from social media channels as a new frontier. Altogether, a general trend in the development of surveillance and early warning systems over the last half a century could thus be summarized as weighing which types of input data to consider in order to fulfill the demands of anticipatory biosecurity. This development has been concentrated around two terminological inventions in the most recent decades: syndromic surveillance and event-based surveillance.
The term syndromic surveillance is not precisely defined nor consistently used but gained momentum in the late 1990s and early 2000s in order to counter re-emerging infectious diseases early on and in novel ways (Fearnley 2008). One could sum up the general interest of syndromic surveillance systems as the use of pre-diagnostic data sources, but what exactly is included among them varies greatly: they can be emergency calls, hospital admission data before any doctor consultation, sick leaves from work or schools, drug sales, but also social media data, even though the integration of the latter is still in an experimental stage. An earlier system for the surveillance of pre-diagnostic data was published as an "early detection” surveillance system in 1989 by French epidemiologists. It included data

168
from various, also unverified sources similar to the list just mentioned, with the exception of social media data (Hannoun, Dab and Cohen 1989).
The second terminological invention that set the tone of descriptions of contemporary surveillance systems was the classification of "event-based surveillance.” The above-mentioned syndromic surveillance may in fact be considered as simply a special kind of event-based surveillance. Webb, Bain and Page (2017, 324) describe event-based surveillance as distinct from other kinds of surveillance due to three factors: it operates with sums or groups of cases rather than individual ones; it uses loose case definitions so that it does not exclude any potential health threat even though its symptoms are only vaguely formulated; and this type of surveillance "is not concerned about who reports an event.” In other words, the list of sources of event-based surveillance may well include news outlets, but in turn it puts additional emphasis on "confirmation” after an outbreak has been detected. Interestingly, the authors claim that such a system is particularly useful for receiving early notifications about countries where regular reporting infrastructure is not in place (2017, 325).
Besides these new names for surveillance systems and the emphasized tradeoff between validity and timeliness, system-level descriptions of contemporary epidemic surveillance also use long-established concepts for assessing the ratio between identified health threats and diagnostically valid health threats. The traditional terms deployed to describe this ratio are the sensitivity and specificity of a system in question. They describe how likely it is that cases were missed or that cases have been detected that in fact are not cases. Although these terms have been used for the statistical evaluation of scientific and diagnostic tests more generally (see, e.g., Wilson and Jungner 1968; Yerushalmy 1947) and did not come about only with event-based and syndromic surveillance in epidemiology, the choice of the word sensitivity is peculiar because it prefigures that the system has an interior body, the sum of its input, which can be measured against the cases that are actually occurring 'out there’.
Altogether, I take early detection, early warning, syndromic surveillance, and event-based surveillance as related concepts, which are all similarly embedded in systemic descriptions with the following features: they all widen the list of information sources, trade validity and timeliness, and are aimed either at the immediate now of an 'event’ or at the immediate future with an anticipatory promise. Exemplary text genres in which descriptions of such concepts can be found are governmental guideline reports, surveillance handbooks and specific meta-analyses of surveillance systems in epidemiological journals. In terms of their style of presentation, it is worth emphasizing that even though all of them mention algorithms that are involved in performing early warning work, they do not deploy images to visualize them and their performance. It is rather in the context of the

169
more detailed accounts of algorithms that I will discuss next where images are used to describe their functioning and which are, compared to formulas, the only intuitive interface for recognizing their operational aspects.
6.1.2 Visualizing the performance of aberration detection algorithms
Whereas system-level descriptions such as the above-mentioned ones can be found in surveillance handbooks and governmental guideline reports, with a fairly accessible use of technical language, a detailed description of the algorithms involved must be sought from more specialized research papers or from the information sharing platforms of programming communities. Many epidemiological surveillance algorithms have been translated, for example, into the statistical programming language R, which is publicly accessible online. As mentioned in the introduction, I will in the following only focus on algorithms used for outbreak detection or what is called aberration detection. In simple terms, aberration is an excessive value beyond what is considered the norm. It is so common in the areas of biostatistics and public health, that it sometimes blends into other terms such as 'clustering’ as if they were synonymous (Stroup et al. 1989). Although aberration detection usually refers to a set of specific statistical methods that are submerged in one algorithmic unit, it was recently also 'upgraded’ to provide the name for a whole new system. In 2003, the CDC presented an "Early Aberration Reporting System” – in short EARS – for bioterrorism preparedness (Hutwagner et al. 2003). This example has become canonical in biostatistical programming, beyond the specific framework of bioterrorism preparedness, and during interviews I conducted with employees of a public health agency in Germany it was referred to as one of the most famous contemporary versions of an aberration algorithm in public health in general.
The authors of EARS describe their technical understanding of aberration detection as "the change in the distribution or frequency of important health-related events when compared with historical […] or recent” data (Hutwagner et al. 2003, 90). While historical data refers to data that is at least three years old, recent data is supposed to include data published in the last nine days. In order to find the right mathematical methods for whatever temporal depth they were aiming at or for which they had the relevant data available, the authors of EARS then tested five different methods to calculate aberrations. They eventually suggested three refined methods to be used in contexts where little historical data was available.
The first important difference between this level of description and the previous one is that the notion of an (epidemic) event becomes a relative unit that is not so much about the future or immediate present but stretches into the past in various levels of depth. Reminiscent of what William Farr wrote about epidemiological prognostics in 1838, the future appears to be "accessory” to the statistician (Farr

170
[1838] 2003, 219). Moreover, the fact that different mathematical methods are chosen for varying temporal depths adds additional contingency to the event that an algorithm is about to detect. The algorithm may choose from a set of methods that are most appropriate for the present context or to compare between different methods. If it was said at the beginning that algorithms are connected with other algorithms, it must be added for the present case that this entanglement equally includes varying mathematical methods and depths of time.
The second particularity of this level of description is that authors use images to model or evaluate the working of an algorithm, visualizing the architecture of all the related methods and subunits that are involved in an algorithmic ensemble – for example, by way of algorithmic flow charts (e.g., Stanford BMIR 2008). In addition, control charts are used to assess the performance of the whole ensemble and compare whether certain methods and temporal depths accurately triggered an early warning alarm (e.g., Höhle 2007). It is especially the image of the control chart that I want to focus on for the rest of the present chapter.
Control charts were originally invented in the 1920s to determine the point above which a product or machine in the manufacturing process deviates too far from what was expected (Bayart 2000). Such charts have been used to assess the functioning of aberration detection by Höhle (2007), for example, who translated the algorithms into the popular statistical programming language R. Höhle compared different kinds of aberration detection algorithms and corresponding mathematical methods to see how they would respond differently to the same data set (Figure 12). The results were that both methods triggered alarms differently and with a different correspondence with 'actually’ occurring cases. The distinction between an alarm event and outbreak event is important here since both can have their own threshold characteristics. Usually, surveillance literature refers to epidemics and outbreaks as if they were ‘real-life’ events, and to cluster and alarm as if they were data events or representational events (Stroup et al. 1989, Höhle 2007). It seems that this literature makes a distinction between what has occurred (outbreak) and what can indicate this occurrence according to statistical and computational processes (alarm); however, both have the status of events that only occur after passing a certain threshold. The general function of the epidemiological control chart is to compare both events, and thereby render them equal in the visual logic of the chart.
Moreover, the charts make evident the contingency of both the event and the threshold line. It is not only the event concepts of the alarm and outbreak that are addressed and made equivalent as processual and contingent entities, but the event concept of threshold passing – as the mathematical event after which an alarm signal is triggered – is rendered visible in the order the control charts. Altogether, by way of control charts, this context of description provides for a different figurative

171
knowledge not only of algorithmic work but also of the event concept of outbreak and alarm, by dynamically presenting and visually comparing border crossing moments.
6.2 Re-designing the Graphical User Interface of a surveillance software
Whereas so far I have described the discourse that frames the building of new surveillance systems and paradigms, and then the discourse and visual practices that are common in engaging with the development of detection algorithms, I now want to turn to the Graphical User Interfaces that present the output of these algorithmic performances to public health personnel. I will focus in the following on the example of the Robert Koch Institute (RKI) in Germany and draw from their publicly accessible software documentation and three expert interviews that I conducted with health officers and programmers at the RKI in 2016.43 Their
43 The first interviewee had been involved in the design and redesign of the RKI’s routine surveillance system. The second interviewee was technically responsible for the current and planned surveillance software and led a group of programmers. This second interview involved the informant’s live demonstration of the current software on screen. The third
Figure 12. Comparison of two algorithms (CDC and Farrington) with ⧻ = outbreak, ∆ = alarm, dotted line = threshold, bars = number of infections, by Höhle (2007, fig. 4). Reprinted by
permission from Springer Nature.

172
software "SurvNet@RKI” (Ritter 2016) allows public health officers and any other official subscribers to receive a weekly44 and disease-specific signal report, which shows current case numbers and where excesses have been automatically detected. To give an example: a group of health officers both in local health offices and in regional and national ones, all of whom hypothetically specialize in the surveillance of salmonella, might subscribe to receive the weekly signal report on salmonella cases. The report itself would be automatically generated by algorithms similar to the ones described above, and according to other rules defined by the developers and programmers of the software. In terms of appearance, the report shows a table view with numeric case counts from different regions and at different weeks, with additional written comments and hyperlinks to display the whole timespan of several weeks as a curve (Figure 13). Importantly, the report contains color-coded cells that emphasize, together with the bold accentuation of the numbers, that there is an excess of cases at these particular points and that an alarm has been triggered.
According to the programmers of such reports, several public health officers were skeptical at first towards the idea of automatically generated outbreak indicators. These reservations had not only to do with a general sentiment against a change of work habits or felt loss of agency, but also with the general concern already familiar from the system-level description given above: that the number of 'false positives’ could increase and result in unnecessary work – namely, that the algorithms could generate warnings without any critical conditions behind them. Although these reservations seem to have decreased, the signal report implies yet another level of friction which has to do with its visual appearance. For programmers and some system builders the concept of an alarm or signal is less a punctual event, I contend, but it remains imbued with process knowledge and thereby becomes recognizable as an achievement, for example in the layout of a flowchart or control chart. For software users and receivers of these signal reports, who don’t have such algorithmic background knowledge, the alarm or signal is presented as if it were a punctual event, only visualized by color and typographic accentuation. Whereas the control chart makes a process visible whose movement one can trace over the surface of the diagram, the colored and bold number only symbolizes by convention and within a binary code of bold/non-bold or colored/non-colored. It serves to indicate punctual occurrence of an event as yes or no, rather than staging its process and aiming at mimetic comprehension.
As said at the beginning, unfortunately I could not validate these theoretical
interview consisted of a group discussion with the second expert and the supervised group of programmers. All interviews took place on the premises of the RKI in Berlin in April and November 2016.
44 These reports could also be assembled and received in higher frequencies, but weekly is the default rhythm.

173
Figure 13. Computer Screen at the Robert-Koch-Institute displaying a weekly report of a particular disease, photograph of the author.
0.91
0.80
0.78
0.77
0.67
0.35
0.20
signalnumber
signalnumber
signalnumber
signalnumber
signalnumber
signalnumber
signalnumber
disease
cases
reference
time
states
regions
sex
age group
subtypes
+–
choropleth mapwith highlighted areas
Figure 14. Interface mockup for planned surveillance system at Robert-Koch-Institute, abstracted reconstruction by the author from field photograph.

174
assumptions in the field by engaging with public health officers directly about their impression of these signal reports. Yet, I sensed a certain unease with the visual appearance of the tabulated report in the accounts of the programmers whom I interviewed. At the time of my field research in 2016, the RKI was preparing for a new surveillance system to be implemented by 2020 and there were also attempts at re-designing the GUI of some of their software components. In a mockup presented to me in one of my interviews (Figure 14), the display resembled contemporary dashboard designs and, importantly, it also contained a control chart with its characteristic threshold line. Whether or not this is a GUI design that will be available across the whole organization remains to be seen. But it already signals that the medium of the control chart has moved outside special interest publications and is potentially being considered for integration into a popular dashboard design, be it for showing what is possible at the time or for allowing a more intuitive – that is, mimetic – visual comprehension of the performance of algorithms.
6.3 The temporal shape(s) of outbreak detection
Above I have pointed towards the possibility that within one organization and surveillance system there might be different ways that event concepts such as threshold, outbreak and alarm are enacted in the interaction with figurative offerings made in the specific contexts of description and visualization. Part of this line of thinking is the belief that concepts are not only built up and maintained through an abstract mental performance but also through the perceptual interaction with verbal and graphical expressions and inscription. Despite this belief in perceptual concept building, I want to develop the ideas from the previous section further by turning to philosopher Helen Steward, whose work on the philosophy of mind has mainly focused on linguistic examples. Still, her differentiation of temporal concepts in linguistic practice are helpful, I believe, for further specifying the difference between the varying enactments of outbreak signals and of the performance of algorithms that were presented above.
Steward (1997) differentiates between the temporality of states, of activities/ processes, and of accomplishments/achievements, with the overall aim of delimiting what is too quickly addressed as a mental state and to distinguish states from events. Three ideas from Steward’s dense discussion might be of help for the present context. The first idea is that even though states and events might both 'depend’ on change, they are not equally 'composed’ by it (Steward 1997, 897 of 3832). Steward argues that states can be distinguished from events because states do not have temporal parts. This framework applies to the case study in that outbreaks can be conceived as events with temporal parts, for example the part of crossing a threshold. By contrast, the state of vigilance, which is often used to describe surveillance, does not
175
have temporal parts of its own but is characterized by persisting through time. The second idea is the emphasis on achievement and accomplishment as the mediating categories between activities and state-related terms (999). In accomplishing or achieving something, and ignoring their difference at this point, an event is lured into the middle zone between process and state. Both the production of an alarm and the emergence of an outbreak might bear the signature of this mediating category of an achievement because they transition a system through a threshold process into a state of epidemicity or of being alarmed. The third aspect I propose to borrow from Steward is the idea that things – including events, states, processes – have a "temporal shape” and that composed wholes usually consist of the same temporal shape; otherwise we take them to be distinct (898). Diagrams may hold the potential to bring different temporal shapes together as if they belong to the same spatialized time.
To return to the case study, the possible meaning of an alarm signal on the algorithmic level of description, afforded by control charts and flow diagrams, could be that they are calculative 'achievements’ relative to a system’s memory. Rather than being experienced as a fixed binary switch, they are conceptualized as dynamic entities in the processing and curving along the surface of the control chart and their passing of a threshold. Outside the chart an alarm signal might be taken to be a punctual occurrence without temporal parts, and threshold passing to be an event with temporal parts, where both cannot be synthesized into one object. In the environment of the diagram of the control chart it seems to become possible to enact them as pertaining to the same object. However, this type of visualization is at present limited to the algorithmic level of description and not used by system level descriptions, and it also does not appear in the signal reports that public health officers subscribe to. Rather, they are presented with the event of an alarm and of threshold-passing through color-coded numeric cells, which are sharply distinguished from their surroundings, representing binary switches with only two possible states, and therefore imbue the alarm signal with the temporal form of a "punctual occurrence” (Steward 1997, 1030). Altogether, both graphical milieus therefore offer a different temporal shape for the enactment of alarm signals and threshold passing.
This line of analysis has epistemological and ontological (in the sense of Mol’s (2002) proposal of multiple object enactments) consequences. The epistemological follow-up is to assess whether thresholds and alarms thus construed are believed to correspond with outbreaks, and whether graphical mediation intervenes in this process already on the level of perceptual adequacy conditions. In other words, do these differences in how an alarm is graphically presented impact whether or not a signal is considered reliable and adequate, not so much whether it confirms as true in correspondence with an event in the world, but if it gives us epistemic warrant

176
that it could be true? In one way, the signal makes a proposition whether there is an outbreak or not and thereby the correspondence question becomes one of correspondence truth. In another way, the alarm sign may be designed in a way that it resembles a potential worldly event or our expectation of this worldly event, and even though this similarity correspondence does not involve claims of truthfulness, one might trust the correspondence as accurate and intuitively evident. This second relation might determine whether we would believe a correspondence to be reliable and adequate, even though we do not yet know whether it truly corresponds with an outbreak in the world. If this is the case, then we would need to lift some of the epistemic burden of background knowledge about algorithmic processes, since we might also trust their adequacy based on perceptual affordances. In other words, do I only trust a signal more if I know how it has been processed and come about? Maybe it is enough to see the temporal shape of achievement taking place to feel justified in believing that there is a process with an outcome, and vice versa, that this or that outcome does not come from nowhere but from a process that I can see rather than one that is blackboxed.
With this in mind, we can put the control chart and the signal report side by side and stipulate that they are not trusted in the same way given the different intuitive evidence of their respective temporal shape. In the case of the signal report, it seems that neither the process by which the alarm was generated was available to public health officers, nor any iconic similarity between alarm and outbreak. The bold number and intense redness of the table cell did not provide much similarity with an outbreak. The control chart, by contrast, evidently or intuitively presents alarm and outbreak through diagrammatic similarity. It shows the likeliness of their respective temporal shapes of achievement – of the passing of a threshold line. To give another example where diagrammatic media makes the similarity of temporal shapes and thus of two objects evident: The high degree of iconicity between a map showing wave rings and the concept of an epidemic breaking out(wards) might make someone trust this correspondence more easily. Altogether, with the conceptual framework of Steward, we can hypothesize that whether or not we trust a signal based on a similarity correspondence between an outbreak event and an alarm event depends on the similarity or dissimilarity of their temporal shapes. This might be extended to explain the shortcomings of the signal report in the case study: Signal reports showed a punctual event rather than an event of emergence and they did not provide intuitive evidence of the processes that led to this event. It is unlikely that public health officers who are trained in etiological knowledge about the determinants of epidemics would easily perceive of an outbreak as a punctual occurrence, but that they have rather grown accustomed to pulling them onto the scale between process and state argued for above, that is, into the realm of achievements and affordances. And as much as this holds for their concepts of

177
outbreaks it might also hold for their concepts of alarm, which by being part of the epidemiological data infrastructures they are constantly interacting with could not possibly be simply a punctual occurrence. This counts for biostatistician-turned-programmers and public health officers alike. Thus, if recipients of signal reports already believe all along that outbreaks as much as alarms bear the temporal shape of emergence and thus of a process of achievement, rather than that of punctual occurrences, they might mistrust signal reports not only reflectively and for reasons of 'false signals’ but also for being represented as if they were events but with a non-intuitive temporal shape.
The ontological uptake of this line of analysis takes the difference between states and events seriously and adds that the difference between discursive contexts and graphical environment can lead to different object enactments. For example, vigilance, preparedness, and timeliness – all of which are typical objects on the level of system descriptions – are fundamentally different objects than outbreak and alarm and can’t be composed of them. Whereas the former are states, the latter are events or processes. Also, the discourse of a single time against which timeliness is measured and which puts the event of an outbreak and alarm into the same framework, does not hold on the level of algorithmic description anymore where alarms have a relative temporal depth. Of course, both types of discourse are causally relevant for each other, but they differ in their ontological commitment to different temporal shapes. To put it another way, more in line with Mol’s (2002) multiple ontology of diseases: in these different contexts one is led to enact different versions of the objects outbreak and alarm. Although I do not have enough empirical material to show how these potential differences manifest in situated embodiments, there is strong reason to believe that these diagrammatic mediations and discursive contexts provide for different modes of objectification.
6.4 Discussion: Diagrammatic coordination of event objects
The main point of the above analysis was that the object of a potential outbreak event as well as the algorithmic object of alarm signals cannot be easily reduced to only one form and material, but how they are enacted depends on different graphical milieus, how they spatialize events and processes in the order of inscription media, and on the various contingent micro-temporalities involved in algorithmic performance, for example, how far back an outbreak detection algorithm reaches to make its prediction. Emphasizing the multiplicity of objects and temporal shapes would not be of further interest, perhaps, if it were not in the context of organizational knowledge where scholarship often assumes more monolithic objects and forms. For example, Weir and Mykhalovskiy (2002) stated in relation to the "vigilance apparatus” of international health organizations such

178
as the WHO that "early warning outbreak detection facilitates the time and space relations required for global emergency vigilance. [...] The time of local outbreak and the time of international public health knowledge are made part of a single, continuous, accelerated global time” (2012, 107). By contrast, the above analysis turned in another direction and emphasized instead the multiple and discontinuous timings in epidemiological knowledge production.
Firstly, I marked these differences relative to levels of description, or in other words, relative to discursive contexts. For example, on the level of system descriptions and in the context of policy debates, discussions of new developments in the area of automatic outbreak detection highlighted the timeliness of information and the urgency of an anticipatory attitude. These descriptions usually construed near-future trends as the aim of surveillance and implied a linear ordering of time. By contrast, on the level of more detailed descriptions of outbreak detection algorithms, the emphasis was put on the processes and operational cycles that such algorithms need to perform and, equally, on the processual nature and operational contingency of the object of an alarm event. Outbreak alarms were construed as algorithmic achievements that could mobilize different temporal depths rather than one single time. Secondly, I marked the differences in temporality and object enactment relative to the graphical milieus in which they take place. More specifically, I compared tabulated reports with control charts. These two contexts differ in the way they relate the temporal shape of an outbreak with that of an alarm signal. Control charts stage this relationship by way of diagrammatic similarity, by graphically tracing the passing of a critical threshold for both objects, and therefore making them comparable in terms of their temporal shape. Tabulated reports, by contrast, do not allow for such diagrammatic similarity. They present alarm signals as binary switches that can either occur or not occur, and do not establish equivalence with the temporal shape of an outbreak.
Against the background of this case study (particularly the control chart) and the larger theoretical interest of this book, one could come to conclude that diagrams spatialize the temporal shapes of objects of epidemiological knowledge. They establish a plane of equivalence – in the literal sense of a planar surface of inscription – and thereby coordinate between two seemingly distinct ontological units: that of an epidemic outbreak and that of an informational or calculative event. Of course, they might also coordinate between different people in the surveillance organization as was discussed above with the possibility of publishing control charts on routine surveillance dashboards. But focusing not on the coordination between people but between objects widens the perspective: coordination may also entail how algorithmic processes enact objects such as an alarm. Given the general invisibility or 'multiple opacity’ of algorithms, diagrams like the control chart indeed offer to coordinate between algorithmic objectifications and those that only

179
become epistemic objects on the level of human knowledge. However, the graphical plane of equivalence still offers quite a variety of
possible notations and spatializations of temporal shapes, which may lead a viewer to dissociate rather than associate epistemic objects: whether an event is drawn as a line or as a dot, for example, and even then, two lines may indicate a different temporal meaning within the context of the whole image. A straight vertical line and a diagonal line in a two-axis coordinate system are usually interpreted differently, because by convention we are used to reading the progress of time in the horizontal direction whereas the vertical line may be stagnating. Even if only curves are chosen for notation, this may still not be enough for associating them temporally. In the case of the control chart an important graphical object was added to underscore the similarity of the temporal shapes of the epidemic and alarm curve, which thereby additionally marked the diagrammatic space of equivalence. This was the object of a threshold. Only against the threshold do the outbreak and alarm curves become represented as if they were achievements rather than processes or punctual occurrences. Altogether, the diagram of the control chart in the given context of epidemiological surveillance expresses a threefold coordination between outbreak, alarm, and threshold as interrelated epistemic objects. The specificity of the diagrammatic mediation of practicing outbreak detection is situated in the relationship between these three.
To mark this relationship as situated is also to say that it does not persist easily over time but that it might contrast with a history of other diagrammatic relationships between these objects. The turn towards the diagrammatic coordination of epistemic objects must still involve a cycle of configuration and reconfiguration if it is supposed to correspond with the guiding signature of diagrammatic processes traced throughout the book. In the present case study, this cycle revolved around the relationship between outbreak and alarm events and eventually led to the objectification of their diagrammatic similarity. The diagrammatic cycle departed from the figuration of an alarm signal as the indexical result of machine calculation, epitomized in the design of tabulated signal reports, and then reconfigured the space in which the similarity relation between outbreaks and alarms would come into being, not only by showing them in comparison, but also by adding the threshold.
Finally, one can speculate whether the choice for a diagrammatic coordination of these objects is partially the product of the public health informatics community‘s increasing epistemic valuation of iconic modes of representation. What makes the map so powerful in the wider realm of epidemiological knowledge, both at the public and professional ends, is among other things its potential for iconic similarity. With the present case study, I could show how this capacitation of iconic similarity has been integrated for new interface designs in the context of epidemic
180
surveillance, even though they do not focus on maps. In their case, it is rather the prospect of an iconic experience of a threshold being passed instead of a spreading wave. The reference to Steward particularly helped me to make this point. This is because the figurative knowledge of an outbreak event cannot be reduced to a punctual occurrence, but rather corresponds with the temporal shape of breaking a threshold. Control charts offer to make this temporal shape visible, allowing for an iconic-diagrammatic comparison of outbreak events and alarm events, for a comparison of algorithmic performance and epidemiological knowhow, and they help enact a threshold object that contains both outbreak and alarm as equalized temporal parts.
It is questionable whether this turn towards iconic-diagrammatic modes of representation is the result of organization-specific developments or rather the effect of an interface popularization, where epidemic surveillance practice adapts design principles from other fields of knowledge. The capacitation of iconic-diagrammatic modes of reasoning and experience would then not only be a characteristic of epidemic surveillance and medical geography, and of different fields of epidemiological knowledge, but of wider extension and of a more general scope. It might be seen as characteristic of a more general episteme, one that is based on the evidentiary promise of diagrammatic iconicity. Or it might be seen as a characteristic aspect of the process of science popularization itself. In other words, one does not find it by comparing across specific fields of epistemic practice, but rather regards it as typical of a process of communication between such fields, and as a field of practice in itself. The following chapter and the conclusion will discuss the process of popularization in further detail. For the present case, one can keep in mind that this turn towards intuitive threshold visualization speaks already to a process of exchange, one between biostatistical programmers and discourses in the area of information visualization.
181
7. Popularizing Medical Geography in the 2000s
Disease maps have become a prominent medium for engaging with epidemiological knowledge beyond their special uses in scientific practice and public health institutions. They are canonized visual instruments in public news outlets, supplementing the ongoing trend towards data journalism. In fact, online newspapers do not only re-distribute disease maps by professional geographers but publish their own maps and interactive visualizations on their data blogs, sometimes even letting readers experiment with their data and form of presentation. Moreover, these online newspaper and other dedicated visualization blogs also regularly comment on the history of data visualization and mapping, including disease mapping. What repeats in many of their comments about medical geography is the old idea that by combining data from various locations in the synoptically accessible space of a map, human observers can derive meaningful patterns otherwise not available to them and their limited sensorial capacities. I want to call this idea an epistemic model as it also implies an understanding, trust or belief in a specific form of knowledge production, in specific mental and perceptive capacities and in the larger data and computational infrastructure at hand. However, public uptakes of medical geography or of the technology of disease mapping also appropriate this epistemic model and make it fit the contemporary context of distributed or networked data sharing. Thus, for the present and last chapter, I want to inquire about the popularity and popularization of disease mapping, how it is entangled with the reconfiguration of existing epistemic models, and how an analysis of this process may provide us with further aspects of diagrammatic coordination than the previous chapters have described.
Two conceptual frameworks seem particularly helpful in this respect. On the one hand, the concepts of epistemic culture and macro-epistemic culture that were already outlined in the first chapter. The diagrammatic process that is specific to certain fields of practice in medical geography and which forms part of their specific epistemic culture must be distinguished from the diagrammatic 'technology’ that reifies some of these aspects into a more reductive model of disease mapping, as it circulates in and adapts to the wider realm of a macro-epistemic culture. The second conceptual framework that is of interest here is the theory of science popularization. Popularization research has a long tradition which I will cursorily introduce in the first section below. However, whereas popularization research has to a large extent

182
focused on scientific concepts and the dissemination of their written or visual representation, I am instead interested in the popularization of specific action complexes and how this is simultaneously entangled with processes of epistemic modeling and remodeling. Reduction is key in this process of popularization. Where disease mapping is taken as representative of the knowledge practices that make epidemics visible, the other techniques and models in epidemiological knowledge production are sidelined. In such cases, the popularization of disease maps seems to (re)produce a reductive account of epidemic events and epidemiological knowledge production that does not correspond with the one of professional epidemiologists even though it is presented as if it did.
In general, this process of a popularization of disease mapping needs to be seen against the background of many large-scale transformations in information technologies during the second half of the twentieth century: such as the development of GIS, the increased availability of public internet access and personal computers, as well as the trend in software and interface development towards the design of collaboration services and interoperability. The success of public software applications for digital cartography since the 1990s resulted in an extension of geographical knowledge creation beyond scientific experts, private sector professionals, and state institutions. Exemplary of this development are applications such as Google Maps and Open Street Map and concepts such as Volunteer Geographic Information (VGI), participatory GIS, neogeography, or the notion of the 'geoweb’. Professional geographers have taken different positions regarding this development: Some have conceptualized these developments in a rather euphoric manner (Goodchild 2007) while others have proposed assessing public GIS applications more critically (e.g., Warf and Sui 2010; Leszczynski and Wilson 2013; Sieber and Haklay 2015). Either way, professional geographical discourse about the public availability of GIS applications has itself played an important role in the popularization of medical geography, by treating disease mapping as an exemplary case in point through which the power of GIS can be made evident. It is this exemplary status of disease mapping that we will repeatedly encounter in the empirical vignettes of the present chapter.
7.1 Popularization research and popular epidemiology
In the history of science, an interest in the popularization of scientific knowledge can already be found in the work of Ludwik Fleck (Fleck 1935, 146-64). In more recent years, and after decades of a rather skeptical treatment of the term, the concept of popularization was rediscovered and developed further into an established area of scholarship of its own (Nikolow and Bluma 2002; Stichweh 2003; Schirrmacher 2008). This has been increasingly linked to an interest in visual cultures and the

183
role of images in and of science in the process of popularization (Nikolow and Bluma 2002; Heßler 2005; Hüppauf and Weingart 2008). Authors would inquire, for example, about specific images of scientific findings or images of science in general. Outside the history of science and as far as geographical knowledge is concerned, the geographer Michael Goodchild was perhaps the first to use the term "popularization” for cartographic technology and in the face of newly emerging public mapping applications (Goodchild 2007, 214). Goodchild did not make much of the term, however; nor did he contextualize its theoretical scope and origins. Nevertheless, his reference is particularly revealing for the present context and I will come back to his example in the empirical vignettes further below.
Usually, the word popularization would indicate that some kind of movement of knowledge is taking place between different groups. This is not a unidirectional movement but a process of communication that transforms all participating communities (Nikolow and Bluma 2002, 204; Heßler 2005, 287). Traditional accounts of science popularization initially implied a more linear movement from scientists to interested publics to the wider public. This conception has been more and more replaced by a model of a public sphere that is imagined as a space of necessary exchange between scientists and various publics alike, be it for securing the legitimacy of scientific research or other forms of support (Schirrmacher 2008; Stichweh 2003). Due to the outdated context and meaning from which the term science popularization has been taken, Schirrmacher (2008, 80) pointed out that usage of the term largely decreased over the 20th century. The renewed interest in popularization in the more recent decades must therefore be seen as a reflexive new take on the question of knowledge exchange between scientific projects and their various publics. Other theoretical traditions have approached this process as boundary work (Gieryn 1983) mediated by boundary objects (Star and Ruhleder 1989) or as trading zones (Galison 1997) between different actors.
Against this background, some words of caution are necessary about the identification of the groups between and through which I assume a popularization takes place in the present case. One might assume this to be the community of professional medical geographers, epidemiologists, and 'the public.’ But obviously this notion does not suffice if we treat the public as a fragmented and relational entity like the above-mentioned models imply. A community of geographers might be regarded as an expert public by epidemiologists. It might seem handy then to distinguish expert publics from a wider public. However, this distinction, too, has limitations. On the one hand, because members of a professional community are at the same time also members of a wider public, unless we confine our window of analysis to a specific situation in which they only take either role. On the other hand, because especially in the context of neogeography wider public and expert publics overlap in complicated ways: While online programming and data visualization

184
communities attract lay people as well as members of various professions (all of which might be expert publics to one another), they also jointly participate in the further development of software infrastructures and therefore interact with geography and epidemiology through the exchange of technical expertise. Moreover, these programming communities also become one of the target audiences for public relation campaigns by public health institutions and in the wake of open data initiatives. Altogether then, the notions of an expert core group, an expert public, their respective audiences as well as the concept of a wider public are all slippery terms. Their overall flexibility and relationality cannot be easily anchored.
However, one might invert this perspective and instead start from a specific medium or technology in whose light the particular status and relationality of these groups can be recognized in their specific situatedness. This is in my case the technology of disease mapping. At the same time, this inversion makes it necessary to look not only at one such situation but compare different ones in which the same technical artifact or operational chain is at work. Thus, rather than starting from a readymade and an extensive catalogue of community types that participate in the popularization of epidemiology in general, I will confine myself to particular vignettes, in which the status of experts, affected publics (Marres 2007), expert publics, and audiences are carved out in specific ways and in relation to their engagement with the technology of disease mapping.
As this technology is at the same time the very entity that is being popularized, we will see that its pragmatic and semantic plasticity is transformed in the process of popularization. The complex set of techniques that characterizes the practice of disease mapping in medical geography – which above was called a situated knowledge infrastructure after Edwards (2010) – becomes objectified during the process of popularization so that it can be easily reemployed for other contexts and commentaries. As we will see below, a repeating strategy for this objectification is to refer to the historical example of John Snow and thereby personify the technology of medical geography. John Snow mapped cholera cases in a London neighborhood in 1852 and thereby visually identified their common proximity to a public water pump. The map was used by Snow to construct a visual argument about the etiological correlation between water as transmitting vector and cholera incidence. In addition, he proposed removing the handle of the water pump as a means to control the epidemic and retrospectively 'verified’ this decision by plotting the decrease of cholera cases after the removal. The story of John Snow has been referenced so often by later medical geographers and epidemiologists that the medical historian Koch has termed it "mythical” (Koch 2011, 229). In any case, the repeated reference to Snow by medical geographers and epidemiologists likely amplified also its exemplary uptake in popularizing disease mapping.
Finally, it needs to be emphasized that the popularization of disease mapping

185
cannot be limited to the age of neogeography. Public actors such as activist movements already made use of disease mapping before the success of digital cartography. For example, the sociologist Phil Brown (1997) used the term 'popular epidemiology’ to describe the way activists from the toxic waste movement in the United States appropriated epidemiological techniques, including mapping, to mobilize their claims in disputes with public health institutions. In his analysis, Brown distinguished different stages of action taken by community activists and this heuristic of a technological sequencing resonates with the analytical lens that I will deploy below. According to Brown, the activists first conducted interviews in order to then, secondly, "hypothesize a connection” – in Brown’s case study between water toxins and disease. Because these hypothetical correlations usually failed to initiate action on the government side, as a third step the movement would be forced to work on a "common perspective” to convince public and governmental actors. Precisely for this stage of persuasion, the mapping of cases became not only crucial but already conventional, according to Brown: "lay mapping [...] is almost an instinctual public reaction. Patricia Nonnon did it in the Bronx with leukemia. A woman in Coeur d'Alene, Idaho tracked down two entire high school graduating classes when she noticed a huge cancer increase” (Brown 1997, 141). In Brown’s analysis, disease mapping is not only a stand-alone tool, but it takes part in a set of techniques from data gathering to data visualization and with the aim of creating authorized truth claims. The making of maps is part of a larger protocol that includes different steps and the logic of this set of techniques is perceived as evidently scientific. Moreover, Brown himself made reference to the historical example of John Snow’s cholera map in order to describe this form of popular epidemiology. He stated that with their tedious gathering of local data and subsequent mapping, the activists "return to the roots laid down by Snow” (138-139) and thereby tried to gain access to the community of experts. Thus, in Brown’s account, popular epidemiology combined the same data sourcing strategies, the same compositional strategies and same advocacy expectations that made up Snow’s system. In other words, not just a map but the technology of disease mapping eventually travelled from scientific experts to affected communities.
Brown’s example is historically interesting because it shows that a public engagement with disease mapping was already solidified by the mid-1990s when he wrote his paper. In addition, we can see that the plasticity of the popularized entity in Brown’s account is wide enough to include a whole set of procedures and programs, one that we could therefore term a technology. However, it must be distinguished from the concepts of knowledge infrastructure and styles of reasoning that were introduced in the first chapter. These two latter notions were characterized by their immanent stabilization of a community of practice and they are therefore saturated with a situated specificity and complexity. In other

186
words, the community emerged through or co-individuated with these knowledge infrastructures or styles of reasoning. From the perspective of popularization research this is hardly possible, as the popularizing entity is supposed to enter a group from its outside and, in the above case, decisively as a copycat in order to gain the right to speak. The popularized entity might of course become part of the knowledge infrastructure of popular epidemiologists, but in itself it cannot obtain the former’s complex particularity: it can only transform into becoming part of another type of assemblage, which will then of course be complex in its own right.
What might therefore be taken from Brown’s example and accounting of popular epidemiology is that the popularizing entity is necessarily reductive when compared to knowledge infrastructures and styles of reasoning, but that it is nevertheless complicated enough to be called a technology. At the same time, his case study is too limited in scope for discussing the wider popularity of disease mapping, because it refers to the particular situation of affected publics that came to imitate epidemiological knowledge infrastructures in the struggle for recognition by scientists and governmental actors. In the vignettes that follow, I will instead turn towards cases where the technology of medical geography has been appropriated by communities that have not been affected by epidemic events, but which rather pick it up as a technological example.
7.2 Popularizing disease mapping – Trading zones between geography, data visualization, and software development
In contrast to the more in-depth case study analyses of the previous chapters, in the following I will draw from a succession of short vignettes to describe a repeating way in which medical geography has been addressed as an example technology for contemporary developments in collaborative online work and new digital mapping infrastructures. The context in which actors engage with disease mapping in such a manner are general discourses about the public use of GIS in the wider discipline of geography, or the contexts of data journalism and programming exercises, for example. All these actors take on the role of expert publics or 'exoteric circles’ (Fleck) of the 'scientific community’ (see Jacobs 2006) of medical geographers and epidemiologists. However, another way of putting them into perspective would be to start from disease mapping as if it were an object in its own right, and objectified operational chain, which could be enacted in different ways. We might then be able to discern some of these ways if we look at a short series of contexts in comparison. What becomes clear in this perspective is that disease mapping in enacted as a visualization technology or as a 'technology of making visible’ and that this enactment includes breaking the technology apart into epistemic subprocesses as well as appropriating these subprocesses in a contemporary context. This is

187
similar to Brown’s discussion of the health activists who he described as popular epidemiologists. But the difference is that in the following vignettes the aim of engaging with the technological sequence and subprocesses of disease mapping is not advocacy of a public health issue, but the fleshing out of technological possibilities.
A development that facilitated the wider popularity of disease mapping was the opening of geographical infrastructure for public access and the emergence of new collaborative and networked forms of geographical knowledge production. One of the labels that was given to this process was Volunteer Geographic Information (VGI), which the geographer Michael Goodchild, among others, was responsible for (Goodchild 2007). Goodchild has advocated the role of popular GIS and its 'democratizing’ potential for some time (Butler 2006). In an article from 2007, he outlined the general scope of his concept of citizen contribution in geographical knowledge, and emphasized the importance that Google mashup technology had played in this process. Goodchild wrote: "Google Earth and Google Maps popularized the term mash-up, the ability to superimpose geographic information from sources distributed over the web” (Goodchild 2007, 214). This was written two years after the first Google mashups were created (Singel 2005) and in the same year that the company introduced its developer page "Google Mashup Editor.” This editor was supposed to simplify as well as accelerate the production of mashups. Importantly, although mashups were connected to a mapping application, their meaning went beyond cartographic visualization by being defined more generically as "a way to combine applications and data together in one interface and harness the power of data feeds” (McDonald 2007). They were considered the "first web 2.0 application” exemplifying that "the future of the internet will be created from interlocking connections of open data services” (Singel 2005). In geography, however, the mashup became the name for the narrower meaning of "an online application or web site that seamlessly combines content from several sources. Geographic information systems (GIS) mashups typically combine spatial data and maps from several web sources” (Zaslavski 2008, 408).
Goodchild’s article picked up on the euphoria and promises that were attached to the term 'mashup’ and it was in this context that he would bring disease mapping into the picture. Goodchild himself is not a medical geographer but, as the article suggested, he had used mashups and the possibility of interlocking open data services by recreating Snow’s cholera map from the 19th century. Goodchild stated that he had combined a historical base map from a private collector, online information on water infrastructure and data on cholera deaths from his own website (Goodchild 2007, 214). The way that Goodchild used the example of John Snow has an important implication. It turned the example into a practicable and testable infrastructural model. He not only reproduced an image from the history of

188
science but decomposed the famous artifact of Snow’s cholera map into a dataset and operational chain that could be re-enacted by contemporary and also lay cartographers. Where Snow had sourced cholera data from different residents in the London neighborhood in painstaking on-the-ground 'show leather epidemiology’ to then combine it all on a map, Goodchild collected the data from different sources on the web. This was an important update of Snow’s method. Goodchild suggested that mashups could facilitate valuable insights by combing data in one place while at the same time efficiently distributing the work of data collection. He therefore used the model of Snow but also span it further.
In Goodchild’s account, the object of disease mapping obtains a particular status halfway between an infrastructural reduction and an apparatus of visualization that reaches beyond the form and content of a certain type of image. On the one hand, the plasticity or extensiveness of the infrastructural model remains limited compared to the situated knowledge infrastructures of a medical geographer like Snow and its historical context. It even appears relatively reductive if compared to Brown’s account of 'popular epidemiology’, which referred to the fact that a whole set of procedures from the epidemiological apparatus had been imitated – including the techniques and narratives it uses and the purposes it serves. The association between mashup technology and Snow in the account of Goodchild, by contrast, reduces disease mapping to a minimal set of actions: to distributed sourcing and the combination of data in one place. This reduction detaches from the knowledge-infrastructural complexity and situatedness of epidemiological knowledge production. Once detached, disease mapping becomes a technological object – or figuration – stripped of its initial friction and readied to be reemployed in other contexts, for example for innovations in neogeography. On the other hand, the popularized object of disease mapping carries an infrastructural and performative meaning that goes beyond the form and content of Snow's cholera map and therefore beyond traditional accounts of popularization based solely on the circulation of pictures or terms. Instead, disease mapping is popularized as a particular visualization infrastructure that entails a tacit familiarity with the making and linking of datasets in producing these maps.
This tendency of popularizing disease mapping not only in terms of a particular map image but as a visualization infrastructure can be equally found in the area of (data) journalism, where it is connected to a contemporary interest in data visualization. Specific data blogs, such as the Guardian Data Blog,45 serve as an additional pathway to further popularize medical geography as an infrastructural model and example. Besides a general public these blogs likely attract a diverse
45 "The Guardian Data Blog,” The Guardian, accessed September 29, 2018, https://www.theguardian.com/data.

189
professional audience, including other journalists, programmers, designers, and statisticians. That is to say that many readers may have come to know medical geography in different ways already before consulting such blogs on data visualization. For example, Edward’s Tufte’s reference to epidemiologists and medical geographers in his seminal handbooks and articles on data visualizations (for example, in Tufte 1997) might have already familiarized many data visualization enthusiasts with the work of medical geographers and epidemiologists. Furthermore, statisticians most probably came across medical geography and epidemiology in their professional training. Yet, what data journalism websites add to potentially already existing ideas about medical geography is that they also offer original data, programming code or displaying techniques for readers to experiment with.
For example, in an early article posted on the Guardian Data Blog from 2013, the data journalist Simon Rogers wrote about "John Snow’s data journalism” and how his mapping supposedly "changed the world” (Rogers 2013). He apparently took the inspiration for coining Snow as a historical precedence for data visualization from another blog on public health. However, Rogers also went further than only reiterating the story and provided a link to the cholera data used by Snow in order to test new browser applications and invited readers to do the same. In other words, the article did not only popularize medical geography in general or a particular person such as John Snow, but similar to what Goodchild (2007) indicated, it popularized a dissembled version of medical-geographic technology by offering to reenact some of its functional parts in a contemporary technical context. In addition, engaging with disease mapping as an infrastructural model and through a reference to Snow’s cholera mapping has extended beyond data blogs to several other platforms, where programmers and data visualization enthusiasts share their ideas or ask for assistance. For example, a so-labeled "John Snow dataset” had also been published as an experimental blueprint on the statistical programming platform r-bloggers.com (Charpentier 2015). Members are offered the dataset and programming code as an example tutorial for how to produce cartographic mashups with Google Maps.
Altogether, that the highly individualized "hero tale” (Koch 2011, 229) of Snow's mapping of cholera could be mobilized as a blueprint for distributed knowledge appears almost paradoxical. This hero narrative hinges on the personalized agency of Snow, who himself went out to the neighborhood where cholera occurred, gathered data and plotted it onto a map for proposing an etiological association and advocating it in the form of a visual argument. In other words, the narrative suggests that the epistemic act is located in the brain, shoes and hands of the researcher John Snow. The exemplification of mashup applications through a reference to Snow’s disease map projects this personalized cognitivism of the hero tale onto the promise of a distributed organization. Such a personification of mashup technology holds

190
the model of a distributed cognitive infrastructure together in a familiar fashion – in the agency of a human cognizer. At the same time, disease mapping becomes popularized as an infrastructural model and example that references a number of subprocesses and which together form an apparatus of visualization: data gathering, the linking of databases, the display of this data on a graphical surface for synoptic overviewing and pattern recognition. However, recognizing an apparatus of visualization as such and reducing the complex procedure of disease mapping to the status of an adequate model for this apparatus of visualization is itself a historical process. Disease mapping can become an infrastructural model because it seems to correspond neatly with macro-epistemic models of contemporary knowledge production, for example, the valuation of distributed work, interlinking services and the facilitating of pattern recognition from large amounts of data. In sum, the popularization of disease mapping seems to be carried by two different kinds of figuration: by the rhetorical device of personifying the technology through reference to John Snow, and by turning disease mapping into an infrastructural model for data visualization that can be experimented with.
Before I discuss the larger theoretical implications of these vignettes above, it is worth noting that the epistemic adequacy of the visualization infrastructure of GIS-based disease mapping is far from self-evident, and that it has been debated differently in the wider spectrum of epidemiological knowledge. On the one hand, sourcing data from different datasets, integrating them via a common location identifier, and visualizing them as map overlays is firmly rooted as adequate in professional geography and medical geography – as has already been discussed in detail in chapter four. On the other hand, some statistically trained epidemiologists have been critical towards even these initial forms of GIS, especially if they are claimed as ways to infer and demonstrate correlational judgments. In a recent handbook on Spatial Epidemiology, different authors worried, for example, about how statistical validity could be affected in the event that integrated datasets generate the assumption that two factors from different datasets are possibly associated (Alexander and Boyle 2001; Wakefield, Kelsall and Morris 2001; Järup 2001). They counter this promise of GIS with probabilistic statistical arguments, or with skepticism about the original quality of the data and how it has been collected or aggregated. Moreover, some make the claim that when everything can be connected, some kind of clustering of factors necessarily appears but does not have much interpretative value (Alexander and Boyle 2001). Within the wider spectrum of epidemiological knowledge, we therefore find a disagreement about whether practices and techniques of GIS are considered reliable for the production of epidemiological knowledge. This disagreement about the role of GIS in epidemiological science disappears in the popularized uptake of medical geography in discourses about mashups.
191
7.3 Pathways, reduction, and object of popularization
How do the above-mentioned vignettes fit into existing models of popularization, in regard to the distribution media that help disseminate the popularizing entity, and even more importantly, for specifying what the object and vehicle of this popularization are? In his early model of science popularization from 1935 (Fleck 1935; 1936), Ludwik Fleck described different pathways and means by which popularization occurs. Four pathways of popularization were particularly important for him and also served to distinguish core groups of scientists from their expert publics and wider audience. These were scientific journals, handbooks, textbooks, and popular books (Fleck 1935, 148; Fleck 1936, 295). In the present context, the pathways for popularizing medical geography are besides science journals and handbooks, also programming platforms, data visualization blogs, and data-focused newspaper outlets.
Moreover, Fleck sketched the steps of popularization as a successive reduction of complexity and implied that image-providing figures of speech are important vehicles for this process, for example the image of key and lock for the serological theory of specificity (Fleck 1935, 149-155). Fleck’s model of popularization is particularly interesting in relation to his famous conception of thought styles that are said to characterize a specific thought collective, for example, the collective of a particular branch of scientists, or in our case, medical geographers. Compared to his conception of thought styles, the object of a popularization can only be a more reductive entity but not the style itself. Even though the process of popularization may lead to a situation where elements of the thought style of one group start mingling with the thought style of other groups, that which popularizes remains only a fraction of what characterizes a thought style. The same counts for the theoretical concepts of 'styles of reasoning’ and 'knowledge infrastructures’ that were presented at the beginning of this book. They are situated complexes and depend on a number of factors that have developed into characterizing a community of knowledge workers. This original complexity cannot be transferred through a process of popularization whose object is reductive by default.
In a more contemporary account of popularization, Stichweh (2003, 213) distinguished four types of popularization: an interdisciplinary popularization, a pedagogical popularization, a political popularization, and a general popularization. Political popularization in Stichweh’s understanding refers to the presentation of scientific knowledge to institutions and possible funders for securing future research infrastructure rather than a popularization intervening in or even initiating a political dissensus. For general popularization, the author mentions similar pathways to the ones already discussed by Fleck, adding radio and television as additional means. An important addition to Fleck’s model is made by Stichweh in regard to the reductive quality of popularization. He states

192
that two different framings are equally common in processes of popularization: either a "unification of science [where] nuances and variants are not articulated” or "a confrontation of schools” that allows for dramatization (Stichweh 2003, 216). The popularization of medical geography bears the signature of the first of Stichweh’s alternatives, in that it is popularized as a default and unproblematic technology of epidemiological knowledge production, erasing the differences and debates between medical geographers and 'spatial’ epidemiologists, for example. Moreover, the popularization of mashups by way of the example of John Snow also gets rid of the dissensus or unease about the mythical status of the Snow narrative. However, Stichweh was pointing to cases where scientists were actively involved in the process of popularizing ideas which they are familiar with. In the mashup discourse and its accompanying popularization of John Snow there is no such participation of medical geographers or epidemiologists who could account for the historical or contemporary dissensus about the use of GIS and the reference to Snow. At most it was Goodchild, and therefore an author from the wider area of geographic information science rather than medical geography specifically, who actively participated in the process of popularization.
Other contemporary theorists of popularization research have emphasized the role of visualizations in the popularization of science (Nikolow and Bluma 2002) and pointed out that until the early 2000s popularization research often concentrated on the role of texts and museums for popularizing scientific knowledge (Heßler 2005, 287). However, even though images themselves have found their place in popularization research, this interest has not so much extended to visualization infrastructure beyond a specific image. By contrast, STS scholarship has traditionally been interested in visualization infrastructure but often seems to avoid the concept of popularization. In two more recent publications about visualization research from an STS perspective (Coopmans et al. 2014; Carusi et al. 2015), the term popularization was hardly used at all or as a name for what one does not focus on.
This missed encounter has consequences for how to theorize the objects and vehicles of a process of popularization, where it is techniques and technologies of making visible that become more popular, as in the present case. In the vignettes presented above, the popularized entity was an infrastructural model of disease mapping – a set and sequence of actions that included distributed data gathering, storing data in interoperable databases and integrating data on a map. But this object was also a visualization technology in an epistemically more saturated sense: its popularization involved the belief that this infrastructure adequately serves to make visible what would otherwise remain unseen, and it entailed presumptions about how to economically organize cognitive and perceptive capacities – effectively distributing source work, overcoming the computational shortcomings of human operators, and capacitating the visual recognition of patterns within one graphical

193
surface. The popularized entity was therefore a technology of making visible and it only individuated as such by associating existing cognitive and aesthetic models in the wider context of culture with sequences of action from the history of science and with technical protocols in software development. In other words, the popularized entity does not exist before this process and is simply moved from one group to a wider public. But it comes into being through the interaction of different groups and scales of epistemic culture. These groups, in turn, obtain their roles as publics, audiences, and experts in relation to the object that is popularized. After all, this follows the idea in contemporary popularization research mentioned above, that it is not an unidirectional process but an interactive and recursive process.
Moreover, the case of mashups also allows us to problematize whether an understanding of popularization bound to 'image-providing terms’ (Fleck) or visual artifacts is not too limited in terms of the material in which it is implemented, allowing for graphical inscriptions but not for the embodied performance of the set of actions that a technical term encodes. Focusing only on text or pictures, and on the content or form of this text or picture, risks downplaying the role of actually performing and (re)enacting the popularizing image in question. Instead, one must add that the vehicles of popularization are not only the media/form that move across distant communicators; popularization also entails a scripting of activities that must be enacted and embodied. For example, popularization of mashups is also scaffolded in the perceptual experience of overlaying or in the activities of sourcing and compiling data and scripting these processes in code. The data blogs and programming platforms mentioned in the vignettes above, presented disease mapping as an infrastructural model to experiment with, to reenact and adapt its infrastructure in a contemporary technological setting and thereby experiment with what is technically possible. This has important analytical consequences if we consider the performing of such activities as a way to provide the performer with a certain epistemic trust in the popularizing entity. Performing such activities and perceptions might habitually turn them into adequate truth bearers or epistemic warrants. As such they are integrated into existing epistemic models or help to transform them.
7.4 Discussion: Exemplifying diagrammatic infrastructure
In contrast to the previous chapters, the present case study did not revolve around an institutionalized form of epidemiological expertise (or around the boundary making of this institution, for example, of a discipline) but around a form of technical expertise that developed in relation to a particular version of epidemiological knowledge that is supposedly embodied by a specific visualization infrastructure. For the conclusion of this case study I want to further interrogate this relation between
194
the form of technical expertise and the presumed epidemiological visualization infrastructure, and I will discuss this relation as a process of exemplification. For the group of technical experts discussed above, epidemiological visualization infrastructure did not only embody a desired process architecture but it also exemplified a model of how trustworthy knowledge is exercised. In other words, it represented or exemplified a reliable knowledge infrastructure to them.
By making reference to John Snow’s method of epidemiological inquiry, authors did not just import a set of actions revolving around disease mapping, but they also affirmed the epistemic adequacy of these actions. They affirmed the possibility that these methods will lead to a justified true belief. Collecting data from different sources, bringing them together in the space of a map, using visual oversight to infer patterns and make correlational judgments – all of these processes were considered adequate ways of producing knowledge or potential truth claims. In addition, epistemic adequacy or reliability was also provided by the practice of overlaying. The haptic sense of overlaying has accompanied the whole development of GIS since its early days and – as I detailed in chapter four – it was semantically transferred to the concept of data integration. Integrating maps or data, and overlaying maps and data are treated synonymously. This haptic sense of overlaying and data integration extends to the case of mashups. Here, an attempt is made to reimplement a similarly haptic experience in the design of web application, where one does not only ‚integrate data’ as thematic layers upon a base map but also ‚integrates services’ of modulating data. The tactility of mapped information ‚touching’ each other extends to how the operation of the ‚seamless interrelated connections of open data services’ is imagined. That the term mashup was used for both a layering map service and for the connecting of data services should be taken seriously. By establishing a link between mashups and historical medical geography, one also cultivates a sense of infrastructural touch.
Moreover, authors did not stay with the infrastructural model imported from the practice of John Snow. In the context of the mashup discourse they added distributed work as another dimension of contemporary knowledge practice. The epistemic adequacy of collecting data from different sources remained the same as before, but the practice of doing this collecting was affirmatively distributed among anonymous contributors, who in turn could only be made equal parts of the data collection if there was a topological medium that facilitated similarity and operability between them. Indirectly, then, this topological medium was also accepted and integrated into the epistemic model. Of course, software developers may well have considered distributed data collection and sharing a trustworthy form of knowledge production (or of a preliminary step that might lead to trusted knowledge claims) before engaging with disease mapping. It might have been at least tentatively part of their epistemic culture. Yet, disease mapping served as an ideal example that was able

195
to flesh out this tentative belief. It appears that it served to exemplify an epistemic model as much as it facilitated a discourse about its remodeling, moving from the John Snow model to the mashup model. The exemplification served to 'configure and reconfigure’ what could be done with public GIS and in this sense bears the signature of a diagrammatic process as it has been used throughout this book. In addition, it is important to acknowledge that this diagrammatic cycle of modeling and remodeling was specific to the popularization dynamic described above and it would not fit, for example, the epistemic problematization that characterized the GIS debate in medical geography and spatial epidemiology.
After all, that disease mapping is mobilized as an example of mashup technology provides an interesting performative and aesthetic twist if we were to explain the large interest in disease maps in contemporary visual culture. If one thinks of a purely semantic and hermeneutic analysis of the popularity of disease mapping, it might be interpreted that these maps derive their popularity from making connectivity visible in a cultural milieu, where networks and interconnections have become key objects of desire and interest. However, in the mashup context, disease maps have become popular for the operational infrastructure, the epistemic models and the aesthetic affordances they seem to exemplify.
Altogether, the popularization of disease mapping has the signature of a diagrammatic process in two respects: Firstly, it is implemented in the combination of different diagrammatic media such as database table, map display and overlaying schema, whereby the operative space of each of these media is extended. And secondly, the popularization of disease mapping is a diagrammatic process in the sense that it configures and reconfigures the scope and meaning of mashup technology. In this latter sense, the diagrammatic of disease mapping became a vehicle for popularizing a more generic technology in the making (what would be refered to as ‘mashup’) rather than the background processes of a particular field of epidemiological expertise. In other words, the diagrammatic process of the popularized version of disease mapping served to contour the generalizability and scope of this technology in the making. The configuration of a generalizable program of action was implemented in the exemplary enactment of this diagrammatic process and by figures of speech that collapsed the diffuse agency of this diagrammatic process into a single term or historical agent. Both, the exemplary practice and the figurative concentration seemed to be necessary in this process, because between them a productive difference could open – e.g. between concentrating the agency in the work of a single historical persona and distributing the agency in the work of a networked group of collaborators. This difference appears to be productive for expressing the general scope of the technology‘s program of action, which seems likely generalizable if framed in the tradition of a historical practice but whose contemporary scope of application and adaptation is not yet fixed. The

196
technology‘s general scope of application is still to be contoured, and the figurative exemplification of a historical agent and the performative exemplification through reenacting the diagrammatic process of disease mapping online, are both tokens in the game of generalization. Moreover, this process of exemplification has served to mediate between different domains of expertise – not between a 'more original’ and a receiving domain, but between two domains that are altogether different from the 'original’ context to which that which is referenced by the example supposedly belongs. The exemplification mediates between the discourse and diagrammatic context of the work of programmers and software developers and that of geographers and journalists. Whereas the latter may tend to present disease mapping as exemplary of epidemiological knowledge, the former may lean towards treating it as an exemplary area of application or training set for technological experimentation.
For another way of looking at this, we can revisit the dual perspective on mediator and knowledge infrastructure that was introduced in the first chapter. Different kinds of objectification have been involved in the present case study, which blur any clear-cut identification of mediator and knowledge infrastructures. On the one hand, we saw the disursive making of the mashup object, which was proposed as an object that entails a wide range of topological capacities: from the capacity of overlaying and database interoperability to the promise of a spatial analysis of correlations. On the other hand, the legitimacy of the mashup discourse depended on a reliable knowledge infrastructure that itself was made explicit by way of exemplary objectification: by exemplifying a context of application and by exemplifying a historical agent. While the mashup object instituted the promise for a new program of action, exemplification connected this proposal to existing programs. These different kinds of objectification specified the framing and components for a position of epistemic agency in the context of public GIS software, aligned the activity of software developers, geographers and visualization specialists, and thereby individuated the actor-network that I have previously described as the popularization of medical geography.

197
8. Conclusion
Epidemiological knowledge can be construed as a historically changing constellation in which certain positions of speaking, certain disciplinary institutionalizations, certain arrangements of physical objects and instrumental settings, certain protocols and discursive and nondiscursive practices, and certain other ways of doing things epidemiologically reliably or truthfully become obtainable while others do not. In such an understanding, which would largely be informed by Foucault’s archaeology of knowledge, expressions of epidemiological knowledge exceed scientific knowledge and point to the possible existence of a wide-ranging spectrum of different fields of epidemiological knowledge. This book has been about the relationship of diagrammatic processes and topological objects, and how this relationship informs us when drawing boundaries within this spectrum of epidemiological knowledge. Rather than providing an assessment of this spectrum as a whole, I concentrated on selected fields of practice which revolved around debates, visual artifacts, and techniques in epidemiological theory, medical geography, epidemic surveillance and eventually also around the popularization of medical geography. Even though each of these fields of epidemiological knowledge is characterized by a myriad of topological operations across different levels of organization, certain technologies and forms of epistemic enculturation have concretized within the above-mentioned fields and which center some topological operations over others and bring about specific versions of topological objects, for example, of the objects of emergence, spread, and containment. How these different kinds of centering and object enactments have come about and what they entail, can only be understood within the particular practice contexts from which they evolve. The case studies set out to detail such processes. Moreover, taking inspiration from the more situated, object-, practice- and instrument-oriented focus on ‘epistemic cultures’ in science studies, the case studies described different 'topological cultures' that interactively shape the framework of epidemiological knowledge. However, towards the end of the study, I also switched to a more general level in order to discuss how the process of centering some topological operations and objects within specific epistemic cultures or communities is potentially co-determined by developments on the level of 'macro-epistemic culture’ (Knorr Cetina).
Empirically, each of the case studies concentrated not on topological operations of any kind but on processes that involve diagrams or diagrammatic media,

198
assuming that this roots my study in a scene of research more familiar to media theory. Moreover, this turn from topology to diagrams had research practical reasons. Initially, I was equipped with an interest in topological action because I assumed that epidemiology and topology fundamentally overlap, and that epidemiology must be treated as a specific instance –maybe a paradigm case– of topological practice. But I found it increasingly difficult to bring this analytical lens of topology to life. As a heuristic notion, it tends to scale up too quickly, especially where topology is rendered synonymous with connectivity. By turning to diagrams and the diagrammatic I therefore switched to a concept and research object that promises to keep a focus on local media techniques as much as inheriting the interest in topology. The diagrammatic obviously relates strongly to topology in the sense that both refer to the formative or generative primacy of spatial relations over essentialized coordinates. But in my understanding of the term, the diagrammatic is more limited in its application to relations of structural similarity: it is in most cases connected to graphical inscription as empirical objects of study, and in all cases to figurative modeling processes. Moreover, it was paramount to situate the notion of the diagrammatic and follow how it obtains its role and status of a topological mediation of significant epistemic weight in particular fields of epidemiological knowledge. This also meant that the concept of the diagrammatic could not be made too narrow, for example by only focusing on schematic line drawings and maps, because this would limit the possibility of sensitizing myself to the specifics of each field of practice. In other words, the meaning of the diagrammatic needed to be more specific than topological mediation in general, but more extensive than only referring to a surface of inscription between writing and picturing. Eventually, my main analytical unit for this research became the diagrammatic cycle that coordinates the modeling and remodeling, configuring and reconfiguring of epidemiological knowledge in each specific field of practice, rather than a specific form of graphical inscription.46
For the present conclusion, I want to look back at the different case studies presented in this book in a more comparative way. However, this comparison cannot claim to arrive at a historical regularity, as the case studies are too limited in number and too different in their specific focus. Rather, the comparison will iterate some of the theorizations made at the end of each chapter. Moreover, the methodical approach of this book was to move through a series of case studies that would concretize the concepts given in Chapter 1, but which would also successively reframe my initial assumption about the scope of diagrammatic processes in epidemiological knowledge. The conclusion must therefore also return to the initial
46 For the downside of extending the concept of the diagrammatic beyond the specific hybrid mediality between writing and picturing, see Bauer and Ernst (2010, 25).

199
perspective from which I started. Thus, in the following, I will proceed in three steps: I will first review each case study and remind the reader of key findings from each of them. I will particularly summarize the case studies along five dimensions: what different types of media were involved in a diagrammatic process and how they interacted; how this interaction individuated a diagrammatic cycle of configuring and reconfiguring epidemiological knowledge; which topological objects were specified through these diagrammatic processes; how the overall diagrammatic processes became objectified themselves and granted epistemic agency, thereby obtaining the status of mediators; and what is the scope of each case study between the scale of a research project and that of an epistemic culture. I will then, secondly, summarize some of the more abstract ideas about the stabilizing function of diagrams and the diagrammatic as it became clearer over the course of the case studies. Part of this also means problematizing the relationship between the diagrammatic processes of each field and the topological objects they help to enact. Finally, this will lead me to the third part of this conclusion where I come back to my initial curiosity about how epidemiological knowledge became an exemplary object of interest in the humanities and, more specifically, in media studies. Against the background of the discussion in the previous chapter, I will theorize this as a technological exemplification of epidemiological knowledge in relation to contemporary "topological culture” (Lury, Parisi, Terranova 2012).
8.1 Reviewing the case studies
The first case study presented a debate in epidemiological theory about causal diagrams and the wider discursive context of causal modeling in epidemiological history. The case study revolved around two example publications, one from the 1960s and one from the 1990s, where graphs were used to visualize an argument about epidemic causality. In addition, the written commentary mobilized rhetorical tropes such as the causal web or the causal chain. The interplay of these two media – of the medium of the graph and that of the rhetorical image – was theoretically captured as a process of co-figuration. Together they established the 'trans-figurative potential’ (Krämer 2016) of this field of practice, that is, of the practice of diagramming epidemic causality. This co-figuration created the conditions in which a diagrammatic cycle of configuring and reconfiguring models of epidemic causality would obtain its particular shape. More specifically, the diagrammatic cycle was facilitated by two specific practices: the subtraction of lines and the negation of direction. They would assist in crafting 'scale' as a primary topological object of concern. By subtracting lines and negating direction, the authors sought to reconfigure the metric and scalar assumptions of existing epidemiological models about relationships between cause and effect. Moreover, on the level of the

200
commentary authors objectified the schematic agency of an image like the causal chain. It was not merely addressed as an intermediary, but as a mediator that needs to be updated or replaced, and the same gesture was later applied to the image of the causal web. This case study appeared at the beginning in order to familiarize readers with important concepts in scientific epidemiology and to interrogate a first intuitive understanding of diagrams. However, the scope of the particular example publications remains limited. They do not testify to an epistemic culture or style of reasoning, but simply introduced an important discursive thread and the wider ecological context in which the realization of diagrammatic process in epidemiological theory must be situated.
In the second case of wartime Medical Geography and Geomedizin, maps were used to visualize spread and co-occurrence and to facilitate prognosis and correlation inference. At the same time, diagrammatic technologies were explored as a boundary device by which one discipline could distinguish itself from another – for example, German Geomedizin from statistical epidemiology – or to align with other fields of practice – for example, with geopolitical iconography or with graphical concepts in bacteriology and virology such as the 'chain of infection.’ Again the map entered a co-figurative ensemble with other media, where authors mobilized the trope of the causal and infectious chain to further delimit the map’s figurative potential and establish continuities with other fields of expertise. Three kinds of diagrammatic or topological objects were specified by this arrangement: the object of the isoline as a specific type of graph that embodies the epistemic potential to make map reading more dynamic and facilitate prognosis; the object of landscape as something that can be inscribed in an image, that can contain different causal elements, and that can also be placed as a potential agent in the abstract figurative space of a causal chain; and finally the object of correlation as that specific kind of relationship that can not only be inferred statistically, but which can be made visible on the surface of the map. Moreover, the case study also reconstructed how geomedical authors developed a particular line of argumentation about the epistemic potential of mapping: Emphasis was put on the representation of epidemic movement in a map through isolines, on its ability to combine different environmental factors to identify correlations, and on the geomedical practitioner who moves between disciplines. Some of these aspects were objectified in the notion of the 'dynamic map.’ The dynamic map obtained the role of a mediator: that of a primary agent in a new apparatus of visualization. It promised to make epidemic events visible in a way that had not been possible before. In terms of the scope of this case study, it focused on a group of researchers who sought after disciplinary boundary-making and political alliance with the ideology of the state; however, without providing enough material for the dense internal scaffolding of an epistemic culture.
In the third case study, my analysis focused on the practice of overlaying and

201
how a cartographic imagination shaped the conception of epidemic relationships as being above and below the surface of inscription. Empirically, the case study revolved around a research project about the Computerized Mapping of Disease (MOD), which was conducted in the United States in the late 1960s, and around the wider development of GIS during these years. In terms of historical context, the case study pointed to the diagrammatic relationship between table and map and an interest in revealing hidden ecological correlations which both were important aspects for the disciplinary development of medical geography in the 1950s, and which paved the way for the computer systems of the 1960s. However, the analysis gave prior emphasis to the practice of overlaying because it served as a coordinating schema between graphical inscription and non-graphical touch, and enabled the establishment of continuity between new computational infrastructures and embodied knowhow. With the emphasis on overlaying, the chapter further extended the concept of diagrammatic processes from that of the previous case studies, because it situated the configuration and reconfiguration of epidemiological knowledge not in the relationship between different kinds of graphical inscription, or between rhetorical tropes and drawings, but between graphical memory and embodied schemata. To terminologically indicate this difference, I chose to speak of overlaying as a proto-diagrammatic schema. The practice of overlaying specified the diagrammatic or topological object of correlation within this particular setting, adding a different perspective to that of the previous case study. Here, correlation was not merely placed on the surface of inscription, but above and below in a three-dimensional and multimodal associational space. By discussing the meaning of overlaying in accounts of medical geographers as well as GIS professionals, the case study traced the making of an epistemic community beyond the confines of a particular research setting such as the MOD project. Within this epistemic community, overlaying came to be recognized as a mediator of substantial epistemological import and was historicized as a predecessor to GIS. At the same time, the case study dated back to a historical context in which GIS infrastructure was novel and still in the making, and where it had not yet become a ubiquitous objectification of epistemic value and therefore exemplary of a technological discourse on the level of a macro-epistemic culture.
In the fourth case study, I turned to an institutional context in which epidemiological knowledge is regularly practiced, that is, to the context of the World Health Organization and its Malaria Eradication Project of the 1950s and 60s. This project sought to establish a geographical information, surveillance and epidemic control system in a series of member states. A variety of different diagrammatic artifacts were mobilized in this process, many of which had been traditional tools of epidemiological practice, such as charts, numeric tables, and maps. However, the design of the eradication project took place in a time when the WHO had just

202
been established. Infrastructural friction was common, and digital GIS had not yet become the global standard for coordinating transnational information collection. Moreover, the concepts of epidemic surveillance, control and eradication were (re)negotiated as the project went along. Thus, the Malaria Eradication Program hinged on the search for a common unit of intervention and measurement that would be operative on the level of geographical information, surveillance and control equally. It was found in the architectural unit of the permanent dwelling. This unit of the indoor space or permanent dwelling, however, was not worked upon in graphical form. Its objective status was already taken for granted, inheriting an intuitive sense of containment. At the same time, it was this conception of a house as an ideal model of containment that would have to be reconfigured in the encounter with different cultures of inhabitation on the ground, leading to an ongoing quarrel of 'technical’ readjustment and evaluation within the Malaria Eradication Program. For diagrammatic theorizing this means that although there was little graphical representation of architecture, the schematizing function of the housing unit in its three-dimensional figurativeness and its practical plasticity was paramount. I therefore propose that we still consider this to be an example of a diagrammatic cycle in which a typical topological object of epidemiological knowledge – the concept of containment – became configured and reconfigured. In addition, the practice of housing was framed as a technical issue and thereby obtained the status of a mediator that literally interrupts or does not interrupt disease transmission as well as the eradication of disease. The social scope of the case study was marked by the organizational setting of the WHO and the particular structure of its malaria eradication campaign, rather than a particular research project in whose light one could identify an epistemic culture of this or that sort. Yet, also in such an 'institutional ecology' (Star & Griesemer 1989), diagrams and prototype-diagrammatic schemata can serve as boundary objects that coordinate or fail to coordinate across social worlds. The housing unit provided an example of such attempts at figuratively coordinating across members of the field.
In the fifth case study, I moved on towards more contemporary forms of epidemic surveillance by focusing on early warning systems and the use of outbreak detection algorithms. The analysis concentrated on how the outbreaks calculated by these algorithms are visualized. I took this outbreak knowledge as a characteristic type of epidemic surveillance that is also genuinely topological because it renders visible how a number of identified cases cluster until they reach a threshold beyond which they are considered to constitute an epidemic outbreak. The history of epidemiology provides a variety of diagrammatic techniques that are aimed at critical thresholds and concepts of emergence at least since the 1920s. In my particular case study for this chapter, however, I focused on the context of automatically produced threshold calculations as part of contemporary outbreak detection algorithms. A primary

203
diagrammatic medium for assessing algorithmic performance are so-called control charts, whereas a primary medium for visualizing the calculated alarm to public health officers was tabulated and color-coded numbers – at least in the particular setting I investigated. I argued that this different diagrammatic process also enacts different versions of the topological object of thresholds, which in turn corresponds with a distinction between the epistemic practice of programmers and public health staff, even though they might belong to the same organization. Drawing from interviews with staff of the Robert-Koch-Institute in Germany, I was able to show that the algorithmic computation of outbreak signals was at the beginning performed 'in the dark’; its visual control by means of control charts was only visible to the community of programmers who worked on such applications. However, at the point of the interviews, in around 2015, my interlocutors also pointed to the possibility that this condition of visibility might change; that the publication of control charts might become a default design of institutionally used data interfaces, and therefore a diagrammatic medium for a wider range of public health officers. The chapter provided two interpretations of this envisioned change: According to the first interpretation, the change resulted from the previously missing diagrammatic coordination of how outbreak signals are enacted across the institutional context of an epidemic surveillance organization; according to the second, the change occurred because of developments in the organization’s environment, for example in areas of interface design and data visualization, and therefore because of currents that might better be addressed on the analytical level of a macro-epistemic culture. The case study thereby paved the way for the analysis of the subsequent chapter and its focus on epistemic frameworks beyond professionally confined fields of practice.
Finally, with the last chapter, I turned to the 'popularization' (in the sense discussed in the history of science) of medical geography in the early 2000s and against the background of collaborative online mapping applications and so-called mashups. This field continued the epistemic capacitation of disease mapping previously described insofar that it placed great emphasis on the cognitive potential of mapping for correlation testing. In fact, authors picked from among these already established capacities in medical geography to reify and repurpose them for infrastructural and economic development. The cognitive potentializing of disease mapping in the mashup discourse, however, did not only draw on diagrammatic iconicity between map and onlooker. It established a similarity between historical examples and contemporary ones based on their shared protocols and action sequences of breaking mapping into processes of sourcing, compiling and presenting data. Imagining disease mapping through this sequence of actions made it possible to associate it with the contemporary model of a socio-cognitively distributed data infrastructure.

204
8.2 Concluding remarks on diagrammatic processes, topological objects and the exemplary role of epidemiology
Two analytical lines of flight combine in the selected case studies: Firstly, an interest in the 'material’ and 'phenomenal' variability of diagrammatic processes – the stretching of the operative and figurative space of the diagrammatic process across different media such as maps, tables, and rhetorical figures, but also across different embodied schemata such as overlaying and containing, or across the experience of temporal shapes. Secondly, an interest in the coordinating and stabilizing role of diagrammatic relationships within and across social groups. One might have initial reservations against the second perspective on the grounds that it risks overemphasizing stability and that it does not take change into account. But this obstacle, I believe, can be avoided by emphasizing the continuous generative capacity of the diagrammatic. The diagrammatic does not provide stability by fixed figures and objects but by setting the operative conditions for an ongoing process of modeling and remodeling, configuring and reconfiguring. The more extensive concept of the diagrammatic undercuts the stability of an actual diagram by introducing a potential operative extension and figurative revision cycle. Thus, diagrammatic stability refers to the operative and figurative virtualization and actualization that a group undergoes in its engagement with diagrams, or with different diagrammatic media and their connections.
Over the course of the investigation, the virtual/actual differential of a diagrammatic process came more clearly into view only after moving through the medial specificities of the different case studies. Perhaps I would not have recognized the contingency of relating the concept of a causal chain to the operative space of a map in medical geography if I had not seen the meaning of the chain being problematized in epidemiological theory. Only by comparison did it become clear that the trope of the causal chain together with the map linearizes and largely reduces the figuration of epidemic causality. Moreover, the comparison brought to light that some diagrams might be prioritized and centered, as was the case with the 'dynamic map’ in the context of Geomedizin, where the possible extension of the operational space of the map by tables and statistical images was virtually existent but not actualized. In the popularization of disease mapping in the context of mashup technology, by contrast, one could see how the diagrammatic becomes targeted itself. Software developers aim at the realm of potential inter-operability, provided through the interlocking of diagrammatic media. Since it has been claimed that diagrams extend the operational space of graphical action, mashups target this potential extension of action, and allow for a variety of diagrammatic actualizations, whether in mapping applications, spreadsheets, or data visualization programs.
Some of the other prioritized forms or figures that we have encountered in the

205
previous case studies include: the web or fractal in the context of epidemiological theory, the isoline Form in the context of Geomedizin, and the form of the control chart in the context of surveillance system monitoring. Considered on their own, none of these forms or figures are specific to the field of practice they were taken from but could be also encountered in other contexts around the same time: the web and fractal in ecology and chaos theory, the isoline in communication and political geography, and the control chart in economics, for example. What made these figures/forms specific to the practice complex of each case study was their relationship to other figures and media of figuration, as well as their treatment as epistemically adequate or reliable in the first place. The configuration and reconfiguration of a model of epidemic causation, for example, was exercised through the connections between the figures of the chain and the web, between the graphical inscription and rhetorical figuration, both positively and negatively. These diagrammatic connections shape, scaffold and stabilize the epistemic practice of a field of (epidemiological) knowledge and so do their media of inscription.
However, the stability of such practice complexes cannot be derived solely from the diagrammatic connections but must equally take into consideration the knowledge objects that these diagrammatic processes help to enact. In the framework of this book, diagrammatic stability referred to epistemic practices which are by default ‘objectual practices’ to some extent (Knorr Cetina 2001). Any epistemic practice complex is likely populated by a plethora of objects but the ones that are of most interest for the question of the stabilizing role of diagrammatic processes are topological objects. I assume that the enactment of topological objects is specific to an epistemic practice complex by virtue of the diagrammatic process that supports certain types and sequences of object enactment. The way that the topological object of an epidemic threshold is enacted in the context of aberration detection algorithms is specific not only to the organization of public health work and to the different modes of reasoning across such organization, but also to the visual evidencing that is afforded by control charts, signal reports and other diagrammatic representations of boundary crossings (see chapter 6). A similar diagrammatic specificity has been claimed for the topological objects of (causal) scale and direction in chapter 2, for the topological objects of (epidemic) environment and landscape in chapter 3, for the methodic-topological objects of spatial correlation and association both in chapter 3 and 4, and for the object of containment in chapter 5. All of these objectual topological enactments are specific to each case study and their particular diagrammatic infrastructure.
In a similar way like the diagrammatic adds to the stability of an epistemic practice by a generative cycle, also the stability of topological objects must be thought of as being open for refinement. The diagrammatic circuiting between general model and particular presentation serves as a specific mode of epistemic objectification.

206
Over the course of the diagrammatic process of configuring and reconfiguring, knowledge objects exist relative both to the model and their instantiation and they cannot be fixed on either side. In this understanding, the diagrammatic process and its mode of objectification seem to exhibit properties that are similar to those of experimentation. Given the complexity and scholarly attention paid to the practice of scientific experiments in the history of science (for an overview, see Pickering 1992), however, it might be preferable not to simply equate diagrammatic processes with experimentation. Instead, diagrammatic processes might rather be seen as key drivers in the shaping and maintenance of an experimental complex but they cannot replace the latter’s breadth. Especially Rheinberger’s (1992, 1998) conception of an “experimental system” vis-à-vis his notion of “epistemic things” shows a family resemblance between diagrammatic and experimental objectification. For example, Rheinberger states that experimental systems must be capable of “generating surprises” and that they “display their dynamics in a space of representation in which graphemes, material traces, are produced, are articulated and disconnected, and are placed, displaced, and replaced” (Rheinberger 1998, 287). These aspects correspond with the cycle of configuration and reconfiguration that Bauer and Ernst (2010, 25)47 have used to describe diagrams, and with the “surprise” that is central to Peirce‘s conception of abductive reasoning, for which the diagram is a case in point (Reichertz 2013). It is this openness for reconfiguration that is functionally shared by the experimental system and by the diagrammatic process that links abstract model and particular graphical presentation.
Emphasizing not only the openness of the epistemic process of experimentation but also the openness of its targeted object of knowing has also been pronounced by other authors in the history and philosophy of science. Gaston Bachelard, whose work features prominently in Rheinberger’s own discussion, explained his concept of ‘phenomenotechnique’ by stating that in the process of experimentation ”phenomena must now be carefully selected, filtered, and purified; they must be cast in the mold of scientific instruments. [...] Thus the relation between the phenomena and the noumena of science is no longer to be seen as some remote and rather indolent dialectics; it is, instead, an alternating movement which always tends toward the effective realization of the noumenon” (Bachelard [1934] 1991, 54). In other words, Bachelard anchored the object of interest for the experimenter not in a finished and stable result but in a process, in a movement and tendency toward realization. To name yet another author for whom the openness of the epistemic object in the process of scientific practice is of particular importance, one can turn to Karin Knorr Cetina. Her proposal of epistemic practice as an "objectual practice"
47 Bauer and Ernst also specifically reference Rheinberger’s concept of an experimental system and epistemic things when discussing the problem that diagrammatic theory is at risk of moving too far beyond the medium of diagram.

207
(Knorr Cetina 2001) was equally based on a certain openness and unfinished nature of this process of objectification. For Knorr Cetina, “knowledge objects” have an “open, unfolding character” and they might be encountered only partially, whereby the “signifying force of partial objects (of epistemic objects in general) resides in the pointers they provide to further exploration” (Knorr Cetina 2001, 192 and 194). This unfolding and open form of epistemic objectification resonates with the kind of diagrammatic objectification discussed before. In a quasi-experimental fashion, the diagrammatic process remains open to the possibility of revision and further modeling. Its object remains emphatically unfinished and needs further completion by application or remodeling.48
Whereas this mode of epistemic objectification is internal to the specific diagrammatic nexus of a field of practice that is often bounded by profession, discipline or scope of a research project, the last chapter of the book also pointed to another mode and analytic level of objectification, which reduces a diagrammatic process to a generic entity that is applicable across different professional practices. The chapter discussed the process of the popularization of medical geography, and the specific mode of diagrammatic objectification was not sought in the quasi-experimental unfolding of an epistemic object, but in the way that a diagrammatic infrastructure has been reified into a generic apparatus of visualization, captured by the name ‘mashup’. Proponents of this generic apparatus would apply it to a number of different problems and historical contexts, from medical geography to the analysis of housing markets, for example, and they would further abstract from this generic apparatus to propose the design of interlinking data services. At this point, however, it would be misleading to perceive of the generic apparatus of visualization or the concept of mashup as being entirely fixed objects. In the process of their application or realization, their meaning and extension is reworked. I proposed to describe this tendency or movement of ‘metastable’ objectification with the help of the vocabulary of exemplification. Exemplars are metastable in regard to categorization. The general category of which something is an example is not yet decided while the example might become its paradigm case and therefore reinforce the reality of this category. Examples are powerful on the level of a scientific community, as Thomas Kuhn famously introduced with his theory of paradigms (see Hacking 2012). With the previous chapter I proposed that exemplification is also a powerful mode of objectification on the level of macro-epistemic culture, where it mediates the metastability of technological application and realization.
Functionally, exemplification seems to mirror the orientation towards 'unfolding objects' that also characterized experimentation and the diagrammatic
48 This openness can also be the ground for further affective attachment to the object, a desire for the object that is generated by its lack of completeness (Knorr Cetina 2001, 190-193).

208
cycle in my description above. Perhaps we could think of all three of these processes – of diagrammatic actualization/virtualization, of experimentation, and of exemplification – as related concepts for the description of the metastability of epistemic action but for different scales of analysis. We can place diagrammatic processes on an axis with experimentation as one pole and exemplification as the other pole. Diagrammatic processes can become part of an experimental system, which makes the scope of the diagrammatic more specific; or diagrammatic processes might tend to exemplification and application, which makes their scope more generic or unspecific.
With this in mind, I can now return to my initial curiosity about the interest in epidemiology in cultural and media studies that I discussed in the introduction. It seems to me that this interest commences from the pole of viewing the epidemic as example and to approach the topological objects and topological acts that revolve around the knowledge and prevention of epidemics as exemplary. Epidemiology served as an example to Michel Foucault when he studied different forms of governmentality. It provided him with a case in point for technologies of discipline and control, without exhausting the general category. In fact, epidemiology was an early example for Foucault but over time seemed to lose its primary status in his writing, giving way to other examples of governmentality such as prisons, sexuality and self-care. In the case of the media theorist Eugene Thacker, who I discussed in the introduction, the exemplary status of the technology of epidemiology took yet another turn. In contrast to Foucault, he did not use it to make a historical argument but an ontological one about the mode of existence of networks. This mode of existence was described by Thacker as topological intensification. The integration of informational and biological processes in epidemiological practice served for him as an example of this topological intensification of networks. At the same time, by emphasizing the "layering of networks" in his own description of this process, and by referring to medical geography as a typical technology of epidemiological knowledge production, he also embedded his exemplification in a macro-epistemological framework that values mapping as an adequate investigative tool (i.e. his ontological reasoning was embedded in a historical context). This epistemic framing of mapping was adequate on Thacker’s account – and perhaps in slight distinction to the mashup discourse – not so much because it makes patterns visible and connects distributed cognizers, but because it is affectively adequate. Mapping and overlaying networks expressed the dual sense of mapping as tactile touch and integration of data which affectively generates topological intensity.49
49 As I have shown in Chapter 4, this tactile and integrative modeling of the epistemic practice of overlaying can already be found in the early years of computerized disease mapping. However, it was not made explicit but was part of the tacit knowledge infrastructure of medical geographers and related geographical communities.

209
In most of my case studies, I set out to counter-balance this general line of thinking about exemplary epidemiological instruments by turning towards different fields of epidemiological practice, showing that diagrammatic processes and topological objects co-stabilize in very specific material and figurative arrangements. But these more micro investigations do not imply that I disapprove of macro accounts of epidemiological knowledge in observations of contemporary media culture. To the contrary, I think that macro accounts of epidemiological practice beyond the sciences are just as valuable for understanding the many different degrees of technical objectification. For example, Thacker’s account pointedly testifies to the objectification of epidemiological technology when it is translated to a generic kind of practice and how it is integrated in the epistemic framework of an equally historically situated macro-epistemic culture. When addressing epidemiological technology on the level of a macro-epistemic culture, it appears that it has been reified as a multimodal apparatus of visualization and connectivity: as an instrument for making visible unseen correlations, and as an instrument for connecting, touching, and integrating different maps, databases, and data collectors. An epidemiological apparatus of visualization seems to provide an ideal example of bringing these two aspects of contacting and imaging together; standing in for a knowledge infrastructure that couples contact as epistemic topological object with (carto-)graphing as epistemic practice.
One way of explaining this particular exemplary role of epidemiology would be to point to the long historical career of the "mapping impulse" (Alpers 1983, 119-68) or "cartographic impulse" (Krämer 2016, 19) on the one hand, and of epidemiology as a border technology on the other hand – both in the sense of the borders of the state and territories, and in the way epidemiology has been used to ascribe conceptual boundaries to social groups, forms of life, and the inside/outside of the body. In other words, epidemiological technology thus appears as a long-established scene of negotiating separation and contact, and as a symbolic relay for societal self-observation (see also Hansen 2012). For most of this conclusion, however, I was not so much interested in historical genealogy and conceptual tradition as that which gives stability and coordinates the example of epidemiological knowledge production on the analytical level of popularization. Instead, I was more interested in the performative stability that makes the example of epidemiology so fertile in the contemporary condition of knowledge production and media-cultural theorizing. Against the background of what I outlined above and in the last chapters, I would conclude that the objectification of epidemiological practice beyond the sciences provides not merely a mirror or framing of “topological culture” (Lury, Parisi, Terranova 2012), but rather an experimental milieu in which topological culture acts out theories of epistemic agency. These theories or models are, for example, distributed knowledge production, the interoperability of services and databases,

210
the making-visible of correlations through graphical inscription, and a cutting through of analogue/digital distinctions by curating a sense of touch for digital infrastructures.

211
Bibliography
Ackerknecht, Erwin Heinz. 1989. Geschichte Der Medizin. Stuttgart: Enke.Adey, Peter, and Ben Anderson. 2012. “Anticipating Emergencies: Technologies of
Preparedness and the Matter of Security.” Security Dialogue 43 (2): 99–117.Ahrens, Wolfgang, Klaus Krickeberg, and Iris Pigeot. 2005. “An Introduction to
Epidemiology.” In Handbook of Epidemiology, edited by Wolfgang Ahrens, and Iris Pigeot, 1–40. Berlin: Springer.
Alexander, F.E., and P. Boyle. 2001. “Do Cancers Cluster?” In Spatial Epidemiology: Methods and Applications, edited by Paul Elliott, Jon Wakefield, Nicola Best, and David Briggs, 302–15. Oxford: Oxford University Press.
Alloa, Emmanuel. 2019. “Ikonische Negation. Unter Welchen Umständen Können Bilder Verneinen.” In Bild Und Negativität, edited by Lars Nowak, 51–82. Würzburg: Königshausen und Neumann.
Alpers, Svetlana. 1983. The Art of Describing: Dutch Art in the Seventeenth Century. Chicago: University of Chicago Press.
Amin, Ash, and Joanne Roberts. 2008. “Knowing in Action: Beyond Communities of Action.” research policy 37 353–69.
Armstrong, David. 1995. “The Rise of Surveillance Medicine.” Sociology of Health & Illness 17 (3): 393–404.
Armstrong, R.W. 1972. “Computers and Mapping in Medical Geography.” In Medical Geography: Techniques and Field Studies, edited by N.D. McGlashan, 69–85. London: Melthuen.
Bachelard, Gaston. 1991. “Extracts From ‘The New Scientific Mind’.” In Gaston Bachelard, Subversive Humanist. Texts and Readings, edited by Mary McAllester Jones, 46–60. Madison: The University of Wisconsin Press.
Balsamo, Anne. 1998. “On the Cutting Edge: Cosmetic Surgery and the Technological Production of the Gendered Body.” In The Visual Culture Reader, edited by Nicholas Mirzoeff, 223–33. London: Routledge.
Barrett, Frank A. 2000. Disease and Geography: The History of an Idea. Toronto: York University.
Bates, David W. 2002. Enlightenment Aberrations. Error and Revolution in France. Ithaca: Cornell University Press.
Bauer, Matthias, and Christoph Ernst. 2010. Diagrammatik. Einführung in Ein Kultur- Und Medienwissenschaftliches Forschungsfeld. Bielefeld: transcript.

212
Bayart, Denis. 2000. “How to Make Chance Manageable: Statistical Thinking and Cognitive Devices in Manufacturing Control.” In Cultures of Control, edited by Miriam R. Levin, 151–74. Amsterdam: Harwood.
Bayatrizi, Zohreh. 2008. Life Sentences. The Modern Ordering of Mortality. Toronto: University of Toronto Press.
Bayatrizi, Zohreh. 2009. “Counting the Dead and Regulating the Living: Early Modern Statistics and the Formation of the Sociological Imagination (1662-1897).” The British Journal of Sociology 60 (3): 603–21.
Berger, Magdalena, Rita Shiau, and June M Weintraub. 2005. “Review of Syndromic Surveillance: Implications for Waterborne Disease Detection.” Journal of Epidemiology and Community Health 60(6): 543–50.
Berlant, Lauren. 2007. “On the Case.” Critical Inquiry 33 (4): 663–72.Bigg, Charlotte. 2011. “A Visual History of Jean Perrin’s Brownian Motion Curves.”
In Histories of Scientific Observation, edited by Lorraine Daston, and Elizabeth Lunbeck, 156–79. Chicago: The University of Chicago Press.
Bijker, Wiebe E., and Trevor J. Pinch. 1987. “The Social Construction of Facts and Artifacts: Or How the Sociology and Science and the Sociology of Technology Might Benefit Each Other.” In The Social Construction of Technological Systems. New Directions in the Sociology and History of Technology, edited by Wiebe E. Bijker, Thomas Parke Hughes, and Trevor J. Pinch, 17–50. Cambridge, MA: The MIT Press.
Boehm, Gottfried, Gabriele Brandstetter, and Achatz von Müller, eds. 2007. Figur Und Figuration. Studien Zu Wahrnehmung Und Wissen. Paderborn: Fink.
Bolton Valencius, Conevery. 2000. “Histories of Medical Geography.” Medical History Supplement No. 20: 3–30.
Borck, Cornelius. 2016. “How We May Think: Imaging and Writing Technologies Across the History of the Neurosciences.” Studies in History and Philosophy of Biological and Biomedical Sciences 57: 112–20.
Bowker, Geoffrey C., and Susan Leigh Star. 2000. Sorting Things Out. Classification and Its Consequences. Cambridge, MA: The MIT Press.
Bradford Hill, Austin. 1965. “The Environment and Disease: Association or Causation.” Proceedings of the Royal Society of Medicine 58 (5): 295–300.
Breilh, Jaime. 2008. “Latin American Critical (’Social’) Epidemiology: New Settings for an Old Dream.” International Journal of Epidemiology 37 (4): 745–50.
Brown, Phil. 1997. “Popular Epidemiology Revisited.” Current Sociology 45 (3): 137–56.
Brown, Tim, and Graham Moon. 2004. “From Siam to New York: Jacques May and the ‘Foundation’ of Medical Geography.” Journal of Historical Geography 30 (4): 747–63.
213
Bruce-Chwatt, Leonard. 1984. “Malaria: From Eradication to Control.” New Scientist 1406: 17–20.
Butler, Declan. 2006. “The Web-Wide World.” Nature 439: 776–78.Büttner, Petra, and Reinhold Muller. 2016. Epidemiology. Oxford: Oxford University
Press.Callon, Michel. 1986. “Some Elements of a Sociology of Translation: Domestification
of the Scallops and the Fishermen of St Brieuc Bay.” In Power, Action and Belief: A New Sociology of Knowledge?, edited by John Law, 196–223. London: Routledge.
Campe, Rüdiger. 2007. “Aktualität Des Bildes. Die Zeit Rhetorischer Figuration.” In Figur Und Figuration. Studien Zu Wahrnehmung Und Wissen, edited by Gottfried Boehm, Gabriele Brandstetter, and Achatz von Müller, 163–82. München: Fink.
Cartwright, Lisa. 2015. “Visual Science Studies: Always Already Materialist.” In Visualization in the Age of Computerization, edited by Annamaria Carusi, Aud Sissel Hoel, Timothy Webmoor, and Steve Woolgar, 243–68. New York: Routledge.
Carusi, Annamaria, Aud Sissel Hoel, Timothy Webmoor, and Steve Woolgar, eds. 2015. Visualization in the Age of Computerization. New York: Routledge.
Cavalié, Ph. 1961. Geographical Reconnaissance for the Malaria Eradication. Pilot Project in North Cameroun. Geneva: WHO.
Celli, A. 1900. “Remarks on the Epidemiology and Prophylaxis of Malaria in the Light of Recent Researches.” British medical journal 1 (2041): 301–6.
Chadarevian, Soraya de. 1993. “Graphical Method and Discipline. Self-Recording Instruments in Nineteenth-Century Physiology.” Studies in History and Philosophy of Science Part A 24 (2): 267–91.
“Change in Name.” 1965. American Journal of Epidemiology 81 (1): 1–1.Chrisman, Nick. 2004. Charting the Unknown. How Computer Mapping At Harvard
Became Gis. Redlands: ESRI Press.Coopmans, Catelijne, Janet Vertesi, Michael Lynch, and Steve Woolgar, eds. 2014.
Representation in Scientific Practice Revisited. Cambridge, MA: The MIT Press.Crang, Mike, and Nigel Thrift, eds. 2000. Thinking Space. London: Routledge.Creighton, Charles. 1894. A History of Epidemics in Britain, 2 Volumes. Cambridge:
Cambridge University Press.Daston, Lorraine, and Peter Galison. 1992. “The Image of Objectivity.” Representations
40: 81–128.Daston, Lorraine, and Peter Galison. 2007. Objectivity. New York: Zone Books.Davenhall, Bill. 2012. Geomedicine. Geography and Personal Health (Ebook).
Redlands: ESRI.Davidson, Andrew. 1892. Geographical Pathology: An Inquiry Into the Geographical
Distribution of Infective and Climatic Diseases. Edinburgh: Y.J. Pentland.Deleuze, Gilles. 1992. Foucault. Frankfurt a.M.: Suhrkamp.

214
Deleuze, Gilles, and Félix Guattari. 1987. A Thousand Plateaus – Capitalism and Schizophrenia. Minneapolis: University of Minnesota Press.
Desrosières, Alain. 1993. The Politics of Large Numbers: A History of Statistical Reasoning. Cambridge, MA: Harvard University Press.
Doerr, Robert. 1931. “Die Lehre Von Den Infektionskrankheiten in Allgemeiner Darstellung.” In Lehrbuch Der Inneren Medizin. Band 1, edited by G.v. Bergmann, Berlin: Springer.
Doerr, Robert. 1938. “Die Entwicklung Der Virusforschung Und Ihre Problematik.” In Die Entwicklung Der Virusforschung Und Ihre Problematik, Morphologie Der Virusarten, Die Züchtung Der Virusarten Außerhalb Ihrer Wirte, Biochemie Und Biophysik Des Virusses, edited by Robert Doerr, and Curt Hallauer, 1–125. Wien: Springer.
Dugdale, Anni. 1999. “Materiality: Juggling Sameness and Difference.” In Actor Network Theory and After, edited by John Law, and John Hassard, 113–35. Oxford: Blackwell.
Dünne, Jörg, and Stephan Günzel, eds. 2006. Raumtheorie. Grundlagentexte Aus Philosophie Und Kulturwissenschaften. Frankfurt a.M.: Suhrkamp.
Ederer, Fred, Max H. Myers, and Nathan Mantel. 1964. “A Statistical Problem in Space and Time: Do Leukemia Cases Come in Clusters?” Biometrics (3): 638–26.
Edwards, Paul N. 2010. A Vast Machine: Computer Models, Climate Data, and the Politics of Global Warming. Cambridge, MA: The MIT Press.
Elliott, Paul, Jon Wakefield, Nicola Best, and David Briggs, eds. 2001. Spatial Epidemiology: Methods and Applications. Oxford: Oxford University Press.
Emirbayer, Mustafa, and Ann Mische. 1998. “What is Agency?” The American Journal of Sociology 103 (4): 962–1023.
Esposito, Roberto. 2011. Immunitas: The Protection and Negation of Life. Cambridge: Polity.
Eysenbach, Gunther. 2002. “Infodemiology: The Epidemiology of (Mis)information.” The American Journal of Medicine 113 (9): 763–65.
Farr, William. 1852. Report on the Mortality of Cholera in England, 1848-1849. London: Clowes and Sons.
Farr, William. 2003. “On Prognosis.” Sozial und Präventivmedizin 48: 219–24.Fearnley, Lyle. 2008. “Signals Come and Go: Syndromic Surveillance and Styles of
Biosecurity.” Environment and Planning A 40: 1615–32.Fleck, Ludwik. 1935. Entstehung Und Entwicklung Einer Wissenschaftlichen Tatsache.
Frankfurt a.M.: Suhrkamp.Fleck, Ludwik. 1936. “Das Problem Einer Theorie Des Erkennens.” In Ludwik Fleck.
Denkstile Und Tatsachen, edited by Sylwia Werner, and Claus Zittel, Frankfurt a.M.: Suhrkamp.

215
Flexner, Simon. 1922. “Experimental Epidemiology - Introductory.” The Journal of Experimental Medicine 36 (1): 9.
Foresman, Timothy W., ed. 1998. The History of Geographic Information Systems. Perspectives From the Pioneers. Upper Saddle River, NJ: Prentice Hall PTR.
Foucault, Michel. 1995. Discipline and Punish. The Birth of the Prison. New York: Random House.
Foucault, Michel. 2002a. “The Birth of Social Medicine.” In Power. Essential Works of Foucault, 1954-1984. Volume 3, edited by James D. Faubion, 134–56. London: Penguin Books.
Foucault, Michel. 2002b. “The Politics of Health in the Eighteenth Century.” In Power. Essential Works of Foucault, 1954-1984. Volume 3, edited by James D. Faubion, 90–105. London: Penguin Books.
Foucault, Michel. 2002c. The Archeology of Knowledge. London: Routledge.Foucault, Michel. 2003. The Birth of the Clinic. An Archaeology of Medical Perception.
New York: Routledge.Fuller, Steve. 1994. “Making Agency Count. A Brief Foray Into the Foundations of
Social Theory.” American Behavioral Scientist 37 (6): 741–53.Galison, Peter. 1997. Image and Logic: A Material Culture of Microphysics. Chicago:
University of Chicago Press.Galloway, Alexander, and Eugene Thacker. 2007. The Exploit: A Theory of Networks.
Minneapolis: University of Minnesota Press.Geoghegan, Bernard Dyonisius. 2013. “After Kittler: On the Cultural Techniques of
Recent German Media Theory.” Theory, Culture & Society 30 (6): 66–82.Gieryn, Thomas F. 1983. “Boundary-Work and the Demarcation of Science From
Non-Science: Strains and Interests in Professional Ideologies of Scientists.” American Sociological Review 48 (6): 781–95.
Gittelman, Michelle. 2007. “Does Geography Matter for Science-Based Firms? Epistemic Communities and the Geography of Research and Patenting in Biotechnology.” Organization Science 18 (4): 724–41.
Goldman, Alvin, and Bob Beddor. 2016. “Reliabilist Epistemology.” In The Stanford Encyclopedia of Philosophy, edited by Edward N. Zalta, https://plato.stanford.edu/archives/win2016/entries/reliabilism/.
Goodchild, Michael F. 2007. “Citizens as Sensors: The World of Volunteered Geography.” GeoJournal 69 (4): 211–21.
Goodman, Nelson. 1997. Sprachen Der Kunst. Entwurf Einer Symboltheorie. Frankfurt a.M.: Suhrkamp.
Gotschlich, Emil. 1913. “Pest.” In Die Infektionskrankheiten. Die Pflanzlichen Parasiten. Spezielle Darstellung. Anhang: Infektionskrankheiten Zweifelhafter Ätiologie, edited by Max Rubner, Max von Gruber, and Martin Ficker, 208–79. Leipzig: Verlag von S. Hirzel.
216
Gradmann, Christoph, and Thomas Schlich, eds. 1999. Strategien Der Kausalität. Konzepte Der Krankheitsverursachung Im 19. Und 20. Jahrhundert. Pfaffenweiler: Centaurus-Verlagsgesellschaft.
Greimas, Algirdas J. 1989. “The Veridiction Contract.” New Literary History 20 (3): 651–60.
Griesemer, James R. 1991. “Must Scientific Diagrams be Eliminable? The Case of Path Analysis.” Biology and Philosophy 6: 155–80.
Gumbrecht, Hans Ulrich, and Karl Ludwig Pfeiffer. 1988. Materialität Der Kommunikation. Frankfurt a.M.: Suhrkamp.
Günzel, Stephan. 2007. “Raum – Topographie – Topologie.” In Topologie. Zur Raumbeschreibung in Den Kultur- Und Medienwissenschaften, edited by Stephan Günzel, 13–29. Bielefeld: transcript.
Habs, Horst. 1942. “Grundlagen Der Allgemeinen Epidemiologie.” In Die Ansteckenden Krankheiten. Ihre Epidemologie, Bekämpfung Und Spezifische Therapie, edited by Max Gundel, 35–52. Leipzig: Georg Thieme.
Hacking, Ian. 1992. “Statistical Language, Statistical Truth and Statistical Reason: The Self-Authentification of a Style of Reasoning.” In The Social Dimensions of Science, edited by Ernan McMullin, 130–57. Notre Dame, Indiana: Notre Dame University Press.
Hacking, Ian. 2002. Historical Ontology. Cambridge, MA: Harvard University Press.Hacking, Ian. 2012. “Introductory Essay.” In The Structure of Scientific Revolutions.
50th Anniversary Edition, by Thomas S. Kuhn, XII–XXXVII. Chicago: The University of Chicago Press.
Hamer, William. 1928. Epidemiology: Old and New. London: Kegan Paul, Trench, Trubner & Co.
Hannoun, C., W. Dab, and J. M. Cohen. 1989. “A New Influenza Surveillance System in France: The Ile-De-france “grog”. 1. Principles Andmethodology.” European Journal of Epidemiology 5 (3): 285–93.
Hansen, Mark B. N. 2009. “System-Environment Hybrids.” In Emergence and Embodiment: New Essays on Second-Order Systems Theory, edited by Bruce Clarke, and Mark B. N. Hansen, 113–42. Durham: Duke University Press.
Hansen, Mark B. N. 2012. “Foucault and Media: A Missed Encounter?” The South Atlantic Quarterly 111 (3): 497–528.
Haraway, Donna. 1997. Modest_witness@second_millennium. Femaleman_meets_oncomouse: Feminism and Technoscience. New York: Routledge.
Haraway, Donna. 1998. “The Persistence of Vision.” In The Visual Culture Reader, edited by Nicholas Mirzoeff, 191–98. London: Routledge.
Harrington, Anne. 1995. Reenchanted Science: Holism in German Culture From Wilhelm Ii to Hitler. Princeton: Princeton University Press.

217
Henderson, D.A. 1968. Surveillance – the Key to Smallpox Eradication. Geneva: WHO.Henderson, Kathryn. 1998. On Line and on Paper. Cambridge, MA: The MIT Press.Heßler, Martina. 2005. “Bilder Zwischen Kunst Und Wissenschaft. Neue
Herausforderungen Für Die Forschung.” Geschichte und Gesellschaft 31 (2): 266–92.
Heßler, Martina, and Dieter Mersch. 2009. “Bildlogik Oder Was Heißt Visuelles Denken?” In Logik Des Bildlichen. Zur Kritik Der Ikonischen Vernunft, edited by Martina Heßler, and Dieter Mersch, 8–62. Bielefeld: transcript.
Hirsch, August. 1881. Handbuch Der Historisch-Geographischen Pathologie – Erste Abtheilung: Die Allgemeinen Acuten Infectionskrankheiten. Vom Historisch-Geographischen Standpunkte Und Mit Besonderer Berücksichtigung Der Aetiologie. Stuttgart: Verlag von Ferdinand Enke.
Hirsch, August. 1883. Handbuch Der Historisch-Geographischen Pathologie – Zweite Abtheilung: Die Chronischen Infections- Und Intoxikationskrankheiten, Parasitäre Krankheiten, Infectiöse Wundkrankheiten Und Chronische Ernährungsanomalien. Vom Historisch-Geographischen Standpunkte Und Mit Besonderer Berücksichtigung Der Aetiologie. Stuttgart: Verlag von Ferdinand Enke
Höhle, Michael. 2007. “Surveillance: An R Package for the Monitoring of Infectious Diseases.” Computational Statistics 22 (4): 571–82.
Holmes, Elizabeth Eli. 1997. “Basic Epidemiological Concepts in a Spatial Context.” In Spatial Ecology. The Role of Space in Population Dynamics and Interspecific Interactions, edited by David Tilman, 111–36. Princeton: Princeton University Press.
Hopps, Howard C., Roger J. Cuffey, Jerome Morenoff, Wayne L. Richmond, and Joseph Sidley. 1968. The Mapping of Disease (MOD) Project. The Geographic Distribution of Infectious Disease. Final Report. The Universities Associated for Research and Education in Pathology (UAREP) & The Armed Forces Institute of Pathology (AFIP) / Geographic Pathology Division.
Howe, Melvyn G. 1970. “Some Recent Developments in Disease Mapping.” Perspectives in Public Health 90 (1): 16–20.
Howe, Melvyn G., and David R. Phillips. 1983. “Medical Geography in the United Kingdom, 1945-1982.” In Geographical Aspects of Health, edited by N.D. McGlashan, and J.R. Blunden, 33–52. London: Academic Press.
Huber, Valeska. 2006. “The Unification of the Globe By Disease? The International Sanitary Conferences on Cholera, 1851-1894.” Historical journal 49 (2): 453–76.
Hüppauf, Bernd, and Peter Weingart, eds. 2008. Science Images and Popular Images of the Sciences. New York: Routledge.
Hutchins, Edwin. 1996. Cognition in the Wild. Cambridge, MA: The MIT Press.

218
Hutwagner, Lori, William Thompson, G Matthew Seeman, and Tracee Treadwell. 2003. “The Bioterrorism Preparedness and Response Early Aberration Reporting System (Ears).” Journal of Urban Health: Bulletin of the New York Academy of Medicine 80 (2): 89–96.
Jacobs, Struan. 2006. “Models of Scientific Community: Charles Sanders Peirce to Thomas Kuhn.” Interdisciplinary Science Reviews 31 (2): 163–73.
Jakobson, Roman. 1965. “Quest for the Essence of Language.” Diogenes 13 (51): 21–37.
James, William. 1912. Essays in Radical Empiricism. New York: Longmans, Green & Co.
Järup, L. 2001. “The Role of Geographical Studies in Risk Assessment.” In Spatial Epidemiology: Methods and Applications, edited by Paul Elliott, Jon Wakefield, Nicola Best, and David Briggs, 415–33. Oxford: Oxford University Press.
Jordanova, Ludmilla. 1989. Sexual Visions. Images of Gender in Science and Medicine Between the Eighteenth and Twentieth Centuries. Madison, Wisconsin: The University of Wisconsin Press.
Jusatz, Helmut J. 1938. “Über Das Rhythmische Auftreten Von Grippeepidemien Und Die Möglichkeit Einer Epidemiologischen Prognose.” Zeitschrift für Hygiene und Infektionskrankheiten 121 (3): 185–207.
Jusatz, Helmut J. 1944. “Aufgaben Und Methoden Der Medizinischen Kartographie.” In Seuchenatlas, edited by Heinz Zeiss, not paginated. Gotha: Justus Perthes.
Jusatz, Helmut J. 1958. “Die Bedeutung Der Landschaftsökologischen Analyse Für Die Geographisch-Medizinische Forschung.” Erdkunde 12 (4): 284–89.
Jusatz, Helmut J. 1963. “Allgemeine Epidemiologie.” In Handbuch Der Kinderheilkunde, edited by H. Opitz, 14–37. Berlin: Springer.
Jusatz, Helmut J. 1983. “Geomedicine in Germany, 1952-1982.” In Geographical Aspects of Health, edited by N.D. McGlashan, and J.R. Blunden, 53–62. London: Academic Press.
Kassung, Christian. 2007. Das Pendel. Eine Wissensgeschichte. Paderborn: Wilhelm Fink Verlag.
Kaufman, J.S., and C. Poole. 2000. “Looking Back on ‘Causal Thinking in the Health Sciences’.” Annual Review of Public Health 21: 101–19.
Kermack, W. O., and A. G. McKendrick. 1927. “A Contribution to the Mathematical Theory of Epidemics.” Proceedings of the Royal Society A: Mathematical, Physical and Engineering Sciences 115 (772): 700–21.
King, Nicholas B. 2004. “The Scale Politics of Emerging Diseases.” In Landscapes of Exposure. Knowledge and Illness in Modern Environments, edited by Greg Mitman, Michelle Murphy, and Christopher Sellers, 62–76. Washington: Georgetown University.

219
Kingsland, Sharon E. 1985. Modeling Nature: Episodes in the History of Population Ecology. Chicago: University of Chicago Press.
Kirby, Matthew J., Paul J. Milligan, David J. Conway, and Steve W. Lindsay. 2008. “Study Protocol for a Three-Armed Randomized Controlled Trial to Assess Whether House Screening Can Reduce Exposure to Malaria Vectors and Reduce Malaria Transmission in the Gambia.” Trials 9 (1): 33.
Knorr Cetina, Karin. 1999. Epistemic Cultures: How the Sciences Make Knowledge. Cambridge, MA: Harvard University Press.
Knorr Cetina, Karin. 2001. “Objectual Practice.” In The Practice Turn in Contemporary Theory, edited by Theodore R. Schatzki, Karin Knorr Cetina, and Eike von Savigny, 184–97. London: Routledge.
Knorr Cetina, Karin. 2005. “Culture in Global Knowledge Societies: Knowledge Cultures and Epistemic Cultures.” In The Blackwell Companion to the Sociology of Culture, edited by Mark D. Jacobs, and Nancy Weiss Hanrahan, 65–79. Malden, MA: Blackwell.
Knorr Cetina, Karin, and Werner Reichmann. 2015. “Epistemic Cultures.” In International Encyclopedia of the Social & Behavioral Sciences, Vol. 7, 873–80. Amsterdam: Elsevier.
Koch, Tom. 2005. Cartographies of Disease Maps, Mapping, and Medicine. Redlands, California: ESRI Press.
Koch, Tom. 2011. Disease Maps. Epidemics on the Ground. Chicago: The University of Chicago Press.
Krämer, Sybille. 2003. “<Schriftbildlichkeit> Oder: Über Eine (Fast) Vergessene Dimension Der Schrift.” In Bild, Schrift, Zahl, edited by Sybille Krämer, and Horst Bredekamp, 157–76. München: Wilhelm Fink Verlag.
Krämer, Sybille. 2005. “‚operationsraum Schrift’: Über Einen Perspektivwechsel in Der Betrachtung Der Schrift.” In Schrift. Kulturtechnik Zwischen Auge, Hand Und Maschine, edited by Gernot Grube, Werner Kogge, and Sybille Krämer, 23–57. München: Wilhelm Fink.
Krämer, Sybille. 2006. “The Cultural Techniques of Time-Axis Manipulation: On Friedrich Kittler’s Conception of Media.” Theory, Culture & Society 23 (7-8): 93–109.
Krämer, Sybille. 2016. Figuration, Anschauung, Erkenntnis. Grundlinien Einer Diagrammatologie. Frankfurt a.M.: Suhrkamp.
Krämer, Sybille, and Horst Bredekamp. 2003. “Kultur, Technik, Kulturtechnik: Wider Die Diskursivierung Der Kultur.” In Bild, Schrift, Zahl, edited by Sybille Krämer, and Horst Bredekamp, 11–22. München: Wilhelm Fink Verlag.
Krämer, Sybille, and Anita McChesney. 2003. “Writing, Notational Iconicity, Calculus: On Writing as a Cultural Technique.” MLN 118 (3): 518–37.

220
Krieger, Nancy. 1994. “Epidemiology and the Web of Causation: Has Anyone Seen the Spider.” Social Science & Medicine. 39 (7): 887–903.
Krieger, Nancy. 2015. “The Real Ecological Fallacy: Epidemiology and Global Climate Change.” Journal of Epidemiology and Community Health 69 (8): 803–4.
Kusch, Martin. 2011. “Reflexivity, Relativism, Microhistory: Three Desiderata for Historical Epistemologies.” Erkenntnis 75 483–95.
Lakoff, George, and Mark Johnson. 1980. Metaphors We Live By. Chicago: University of Chicago Press.
Landwehr, Achim. 2009. Historische Diskursanalyse. Frankfurt a.M.: Campus Verlag.Langmuir, Alexander D. 1963. “The Surveillance of Communicable Diseases of
National Importance.” The New England Journal of Medicine 268 (4): 182–92.Last, John M., ed. 2001. A Dictionary of Epidemiology. Oxford: Oxford University
Press.Latour, Bruno. 1986. “Visualization and Cognition: Thinking With Eyes and Hands.”
Knowledge and Society 6: 1–40.Latour, Bruno. 1990. “Drawing Things Together.” In Representation in Scientific
Practice, edited by Michael Lynch, and Steve Woolgar, 19–68. Cambridge, MA: The MIT Press.
Latour, Bruno. 1991. “Technology is Society Made Durable.” In A Sociology of Monsters: Essays on Power, Technology and Domination, edited by John Law, 103–31. London: Routledge.
Latour, Bruno. 1993. We Have Never Been Modern. New York: Harvester Wheatsheaf.Latour, Bruno. 1994. “On Technical Mediation - Philosophy, Sociology, Genealogy.”
Common Knowledge 3 (2): 29–64.Latour, Bruno. 1996. “Cogito Ergo Sumus! Or Psychology Swept Inside Out By the
Fresh Air of the Upper Deck…. A Review of Ed Hutchins’ Cognition in the Wild.” Mind, Culture, and Acitivity 3 (1): 54–63.
Latour, Bruno. 1998. “How to be Iconophilic in Art, Science and Religion.” In Picturing Science, Producing Art, edited by Caroline A. Jones, and Peter Galison, 418–40. New York: Routledge.
Latour, Bruno. 2005. Reassembling the Social: An Introduction to Actor-Network-theory. Oxford: Oxford University Press.
Latour, Bruno, Michael Cuntz, and Lorenz Engell. 2013. “Den Kühen Ihre Farbe Zurückgeben: Von Der Ant Und Der Soziologie Der Übersetzungen Zumm Projekt Der Existenweisen – Bruno Latour Im Interview Mit Michael Cuntz Und Lorenz Engell.” Zeitschrift für Medien- und Kulturforschung 4 (2): 83–100.
Latour, Bruno, and Steve Woolgar. 1979. Laboratory Life. The Construction of Scientific Facts. Princeton: Princeton University Press.
Lenoir, Timothy, ed. 1998. Inscribing Science. Scientific Texts and the Materiality of Communication. Stanford, California: Stanford University Press.

221
Leszczynski, Agnieszka, and Matthew W. Wilson. 2013. “Guest Editorial: Theorizing the Geoweb.” GeoJournal 78: 915–19.
Lévi-Strauss, Claude. 1969. The Elementary Structures of Kinship. Boston: Beacon Press.
Lewin, Kurt. 1934. “Der Richtungsbegriff in Der Psychologie. Der Spezielle Und Allgemeine Hodologische Raum.” Psychologische Forschung 19: 249–99.
Lindkvist, Lars. 2005. “Knowledge Communities and Knowledge Collectivities: A Typology of Knowledge Work in Groups.” Journal of Management Studies 42 (6): 1189–210.
Lipsitz, Lewis A., and Ary L. Goldberger. 1992. “Loss of ‘Complexity’ and Aging.” JAMA 267 (13): 1806–9.
Lorey, Isabell. 2011. Figuren Des Immunen: Elemente Einer Politischen Theorie. Zürich: Diaphanes.
Lotka, Alfred J., and F.R. Sharpe. 1923. “Contributions to the Analysis of Malaria Epidemiology.” The American Journal of Hygiene 3: 1–121.
Luke, Douglas A. 2012. “Viewing Dissemination and Implementation Research Through a Network Lens.” In Dissemination and Implementation Research in Health: Translating Science to Practice, edited by R.C. Brownson, G.A. Colditz, and E.K. Proctor, 154–74. Oxford: Oxford University Press.
Luke, Douglas A., and Jenine K. Harris. 2007. “Network Analysis in Public Health: History, Methods, and Applications.” Annual Review of Public Health 28: 69–93.
Lundberg, George A., and Margaret Lawsing. 1937. “The Sociography of Community Relations.” American Sociological Review 2 (3): 318–35.
Lury, Celia, Luciana Parisi, and Tiziana Terranova. 2012. “Introduction: The Becoming Topological of Culture.” Theory, Culture & Society 29 (4-5): 3–35.
Lynch, Michael. 1991. “Science in the Age of Mechanical Reproduction: Moral and Epistemic Relations Between Diagrams and Photographs.” Biology and Philosophy 6: 205–26.
Lynch, Michael, and Steve Woolgar, eds. 1990. Representation in Scientific Practice. Cambridge, MA: The MIT Press.
Lynch, Michael, and Steve Woolgar. 2014. “Preface.” In Representation in Scientific Practice Revisited, edited by Catelijne Coopmans, Janet Vertesi, Michael Lynch, and Steve Woolgar, vii–ix. Cambridge, MA: The MIT Press.
Lynteris, Christos. 2017. “Zoonotic Diagrams: Mastering and Unsettling Human-Animal Relations.” Journal of the Royal Anthropological Institute 23: 463–85.
MacDonald, George. 1952. “The Analysis of Equilibrium in Malaria.” Tropical Diseases Bulletin 49 (9): 813–829.
MacDonald, George. 1957. The Epidemiology and Control of Malaria. London: Oxford University Press.

222
MacMahon, Brian, Thomas F. Pugh, and Johannes Ipsen. 1960. Epidemiologic Methods. London: J. & A. Churchill.
Manovich, Lev. 1999. “Database as Symbolic Form.” Convergence. The International Journal of Research into New Media Technologies 5 (2): 80–99.
Mansell Prothero, Ralph. 1965. Migrants and Malaria. London: Longmans, Green.Marres, Nortje. 2007. “The Issues Deserve More Credit: Pragmatist Contributions
to the Study of Public Involvement in Controversy.” Social Studies of Science 37 (5): 759–80.
May, Jacques M. 1950. “Medical Geography: Its Methods and Objectives.” Geographical Review 40 (1): 9–41.
May, Jacques M. 1952. “Report to the Commission on Medical Geography of the International Geographical Union 1952 – History, Definition, and Problems of Medical Geography: A General Review.” Social Science & Medicine. Part D: Medical Geography 12 (3‚4): 211–19.
May, Jacques M. 1958. The Ecology of Human Disease. Springfield: MD Publications.May, Jacques M. 1961. Studies in Disease Ecology. New York: Hafner Publishing.McDonald, Paul. “Mashups Made Easy.” Mashup Editor Blog, May 30, 2007, http://
googlemashupeditor.blogspot.com/2007/05/.McGlashan, Neil D., ed. 1972. Medical Geography: Techniques and Field Studies.
London: Methuen.Meade, Melinda S., and Michael Emch. 2010. Medical Geography. New York: Guilford.Mendelsohn, J. A. 2007. “Von Der Ausrottung Zum Gleichgewicht. Wie Epidemien
Nach Dem Ersten Weltkrieg Komplex Wurden.” In Bakteriologie Und Moderne. Studien Zur Biopolitik Des Unsichtbaren 1870-1920, edited by P. Sarasin, S. Berger, M. Hänseler, and M. Spörri, 239–83. Frankfurt a.M.: Suhrkamp.
Mersch, Dieter. 2008. “Visual Arguments: The Role of Images in Sciences and Mathematics.” In Science Images and Popular Images of the Science, edited by Bernd Hüppauf, and Peter Weingart, Ebook. New York: Routledge.
Mersch, Dieter. 2011. “Aspects of Visual Epistemology: On the ‘logic’ of the Iconic.” In Images in Language: Metaphors and Metamorphoses, edited by András Benedek, and Kristof Nyiri, 161–86. Frankfurt a.M.: Peter Lang.
Mirzoeff, Nicholas, ed. 1998. The Visual Culture Reader. London: Routledge.Mitchell, Peta. 2012. Contagious Metaphor. London: Bloomsbury.Mol, Annemarie. 1999. “Ontological Politics. A Word and Some Questions.” In Actor
Network Theory and After, edited by John Law, and John Hassard, 74–89. Oxford: Blackwell.
Mol, Annemarie. 2002. The Body Multiple. Ontology in Medical Practice. Durham: Duke University Press.
Morabia, Alfredo, ed. 2004. A History of Epidemiological Methods and Concepts. Basel: Springer.
223
Moreno, J. L. 1934. Who Shall Survive? A New Approach to the Problem of Human Interrelations. Washington: Nervous and Mental Disease Pub. Co.
Munster, Anna. 2013. An Aesthesia of Networks. Conjunctive Experience in Art and Technology. Cambridge and London: The MIT Press.
Murray, J. 1895. How to Live in Tropical Africa: A Guide to Tropical Hygiene. The Malaria Problem: The Cause, Prevention, and Cure of Malarial Fever. London: George Philip.
Netz, Reviel. 1999. The Shaping of Deduction in Greek Mathematics. A Study in Cognitive History. Cambridge: Cambridge University Press.
Neufeld, Fred. 1924. “Experimentelle Epidemiologie. Kritischer Bericht Über Einige Neuere Forschungsergebnisse.” Klinische Wochenschrift 3 (30): 1345–51.
Neufeld, Fred. 1927. “Fortschritte Und Rückschritte Der Epidemiologischen Forschung.” Deutsche Medizinische Wochenschrift 53 (17): 687–90.
Neufeld, Fred. 1935. “Die Entwicklung Der Epidemiologischen Forschung Seit Robert Koch.” Klinische Wochenschrift 14 (21): 737–41.
Neumann, Sascha. 2012. “Teilnehmende Objektivierung Und Anwesenden. Zum Verhältnis Von Ethnographie Und Feldtheorie in Der Erziehungswissenschaftlichen Forschung.” In Feld Und Theorie. Herausforderungen Erziehungswissenschaftlicher Ethnographie, edited by Barbara Friebertshäuser, Helga Kelle, Heike Boller, Sabine Bollig, Christina Huf, Antje Langer, Marion Ott, and Sophia Richter, 57–70. Opladen: Budrich.
Nikolow, Sybilla, and Lars Bluma. 2002. “Bilder Zwischen Wissenschaft Und Öffentlichkeit.” N.T.M. 10: 201–8.
Nowak, Lars. 2019. “Bild Und Negativität. Zur Einführung in Die Problematik.” In Bild Und Negativität, edited by Lars Nowak, 9–48. Würzburg: Königshausen und Neumann.
Olzscha, Reiner, and Heinz Zeiss. 1938. “Die Epidemiologie Und Epidemiographie Der Cholera in Russland. Ein Beitrag Zur Geomedizin. Mit Einem Vorwort Von H. Zeiss.” Zeitschrift für Hygiene 121: 1–26.
Packer, Jeremy, and Stephen B. Crofts Wiley, eds. 2012. Communication Matters. Materialist Approaches to Media, Mobility and Networks. New York: Routledge.
Paech, Joachim. 2002. “Intermediale Figuration – Am Beispiel Von Jean-Luc Godards Histoire(s) Du Cinéma.” In Mediale Performanzen. Historische Konzepte Und Perspektiven, edited by Jutta Eming, Annette Jael Lehmann, and Irmgard Maassen, 275–95. Freiburg: Rombach Litterae.
Palermos, Orestis, and Duncan Pritchard. 2016. “The Distribution of Epistemic Agency.” In Social Epistemology and Epistemic Agency: Decentralizing Epistemic Agency, edited by Patrick J. Reider, 109–26. London: Rowman & Littlefield.
Parascandola, Mark. 2011. “The Epidemiologic Transition and Changing Concepts of Causation and Causal Inference.” Revue d’histoire des sciences 64 243–62.

224
Parikka, Jussi. 2007. Digital Contagions. A Media Archaeology of Computer Viruses. New York: Peter Lang.
Peirce, Charles Sanders. 1998a. “A Syllabus of Certain Types of Logic.” In The Essential Peirce: Selected Philosophical Writings, Volume 2 (1893-1913), edited by The Peirce Edition Project, 258–99. Bloomington: Indiana University Press.
Peirce, Charles Sanders. 1998b. “Prolegomena Zu Einer Apologie Des Pragmatizismus.” In Naturordnung und Zeichenprozess. Schriften über Semiotik und Naturphilosophie. Mit einem Vorwort von Ilya Prigogine. Herausgegeben und eingeleitet von Helmut Pape, 316–27. Frankfurt a.M.: Suhrkamp.
Petchesky, Rosalind Pollack. 1987. “Fetal Images: The Power of Visual Culture in the Politics of Reproduction.” Feminist Studies 13 (2): 263–92.
Pickering, Andrew, ed. 1992. From Science as Knowledge to Science as Practice. Chicago: The University of Chicago Press.
Ragland, Ellie, and Dragan Milovanovic. 2004. Lacan: Topologically Speaking. New York: Other Press.
Reckwitz, Andreas. 2003. “Grundelemente Einer Theorie Sozialer Praktiken: Eine Sozialtheoretische Perspektive.” Zeitschrift für Soziologie 32 (4): 282–301.
Reichertz, Jo. 2013. Die Abduktion in Der Qualitativen Sozialforschung: Über Die Entdeckung Des Neuen. Wiesbaden: Springer VS.
Reider, Patrick J. 2016. “Introduction: What is Social Epistemology and Epistemic Agency.” In Social Epistemology and Epistemic Agency: Decentralizing Epistemic Agency, edited by Patrick J. Reider, vii–xvi. London: Rowman & Littlefield.
Renggli, Cornelia. 2014. “Komplexe Beziehungen Beschreiben. Diskursanalytisches Arbeiten Mit Bildern.” In Bilder in Historischen Diskursen, edited by Franz X. Eder, Oliver Kühschelm, and Christina Linsboth, 45–61. Wiesbaden: Springer VS.
Rheinberger, Hans-Jörg. 1992. Experiment, Differenz, Schrift. Zur Geschichte Epistemischer Dinge. Marburg an der Lahn: Basilisken-Presse.
Rheinberger, Hans-Jörg. 1998. “Experimental Systems, Graphematic Spaces.” In Inscribing Science. Scientific Texts and the Materiality of Communication, edited by Timothy Lenoir, 285–303. Stanford, California: Stanford University Press.
Rheinberger, Hans-Jörg. 2006. Zur Epistemologie Des Konkreten. Studien Zur Geschichte Der Modernen Biologie. Frankfurt a.M.: Suhrkamp.
Rheinberger, Hans-Jörg, and Michael Hagner, eds. 1993. Experimentalisierung Des Lebens. Experimentalsysteme in Den Biologischen Wissenschaften 1850 - 1950. Berlin: Akademie-Verlag.
Riedel, Johannes. 1911. Anregungen Für Die Konstruktion Und Die Verwendung Von Isochronenkarten. Inaugural-Dissertation. Leipzig: Universität Leipzig.
Ritter, Sabine. 2016. Survnet@rki – Das Meldesystem Zum Ifsg. Anwenderhandbuch. Arbeitsversion 1.7. Berlin: Robert-Koch-Institut (RKI).

225
Roberge, Jonathan, and Robert Seyfert. 2017. “Was Sind Algorithmuskulturen.” In Algorithmuskulturen: Über Die Rechnerische Konstruktion Der Wirklichkeit, edited by Robert Seyfert, and Jonathan Roberge, 7–40. Bielefeld: transcript.
Rodenwaldt, Ernst. 1937. “Lückenlose Kausalreihe Einer Endemie.” Forschungen und Fortschritte. Nachrichtenblatt der Deutschen Wissenschaft und Technik 13 (9): 118–19.
Rodenwaldt, Ernst. 1952a. “Einleitung.” In Weltseuchenatlas/ World Atlas of Epidemic Diseases. Volume 1, edited by Ernst Rodenwaldt, not paginated. Hamburg: Falk.
Rodenwaldt, Ernst, ed. 1952b. Weltseuchenatlas/ World Atlas of Epidemic Diseases. Volume 1. Hamburg: Falk.
Rodenwaldt, Ernst, and Richard-Ernst Bader. 1951. “Grundlagen Der Allgemeinen Epidemiologie.” In Lehrbuch Der Hygiene, edited by Ernst Rodenwaldt, and Richard-Ernst Bader, 443–57. Berlin: Springer.
Rodenwaldt, Ernst, and Helmut J. Jusatz, eds. 1956. Weltseuchenatlas/ World Atlas of Epidemic Diseases. Volume 2. Hamburg: Falk.
Rodenwaldt, Ernst, and Helmut J. Jusatz, eds. 1961. Weltseuchenatlas/ World Atlas of Epidemic Diseases. Volume 3. Hamburg: Falk.
Rodenwaldt, Ernst, and Heinz Zeiss. 1938. “Lebenskreise. Ein Aufruf an Die Deutschen Hygieniker.” Zeitschrift für Hygiene und Infektionskrankheiten 121 (3): 1–4.
Rogers, Simon. “John Snow’s Data Journalism: The Cholera Map That Changed the World.” The Guardian Datablog, March 15, 2013, https://www.theguardian.com/news/datablog/2013/mar/15/john-snow-cholera-map.
Rosen, George. 1953. “Cameralism and the Concept of Medical Police.” Bulletin of the History of Medicine 27: 21–42.
Rötzer, Florian. 1994. “Ästhetik Der Wissenschaft?” In Vom Chaos Zur Endophysik. Wissenschaftler Im Gespräch, edited by Florian Rötzer, 9–38. München: Boer.
Saracci, Rodolfo. 2015. “Introducing the History of Epidemiology.” In Teaching Epidemiology: A Guide for Teachers in Epidemiology, Public Health and Clinical Medicine, edited by Jørn Olsen, Naomi Greene, Rodolfo Saracci, and Dimitrios Trichopoulos, 3–29. Oxford: Oxford University Press.
Sarasin, P., S. Berger, M. Hänseler, and M. Spörri. 2007. “Bakteriologie Und Moderne. Eine Einleitung.” In Bakteriologie Und Moderne. Studien Zur Biopolitik Des Unsichtbaren 1870-1920, edited by P. Sarasin, S. Berger, M. Hänseler, and M. Spörri, 8–43. Frankfurt a.M.: Suhrkamp.
Sarasin, Philipp. 2011. “Was Ist Wissensgeschichte.” Internationales Archiv für Sozialgeschichte der deutschen Literatur 36: 159–72.
Schatzki, Theodore R., Karin Knorr Cetina, and Eike von Savigny, eds. 2001. The Practice Turn in Contemporary Theory. London: Routledge.

226
Schaub, Mirjam, ed. 2005. Ansteckung - Zur Körperlichkeit Eines Ästhetischen Prinzips. Paderborn: Fink.
Scheffer, Thomas, and Jörg Niewöhner, eds. 2010. Thick Comparison: Reviving the Ethnographic Aspiration. Leiden: Brill.
Schirrmacher, Arne. 2008. “Nach Der Popularisierung. Zur Relation Von Wissenschaft Und Öffentlichkeit Im 20. Jahrhundert.” Geschichte und Gesellschaft 34: 73–95.
Schlich, Thomas. 1999. “Einführung. Strategien Der Kausalität: Konzepte Der Krankheitsverursachung Im 19. Und 20. Jahrhundert.” In Strategien Der Kausalität. Konzepte Der Krankheitsverursachung Im 19. Und 20. Jahrhundert, edited by C. Gradmann, and T. Schlich, 3–28. Pfaffenweiler: Centaurus.
Schneider, Birgit, Christoph Ernst, and Jan Wöpking, eds. 2016. Diagrammatik-Reader. Grundlegende Texte Aus Theorie Und Geschichte. Berlin: De Gruyter.
Schüttpelz, Erhard. 2008. “Der Punkt Des Archimedes. Einige Schwierigkeiten Des Denkens in Operationsketten.” In Bruno Latours Kollektive, edited by Georg Kneer, Markus Schroer, and Erhard Schüttpelz, 234–59. Frankfurt a.M.: Suhrkamp.
Schüttpelz, Erhard. 2013. “Elemente Einer Akteur-Medien-theorie.” In Akteur-Medien-theorie, edited by Tristan Thielmann, and Erhard Schüttpelz, 9–67. Bielefeld: transcript.
Seeliger, Heinz. 1953. Die Laboratoriumsdiagnostik Der Bakterienruhr. Leipzig: Johann Ambrosius Barth Verlag.
Serres, Michel. 1982. Hermes. Literature, Science, Philosophy. Baltimore: The Johns Hopkins University Press.
Shoshin, A. A. 1964. “Geographical Aspects of Public Health.” Soviet Geography: Review & Translation 5 (7): 68–72.
Sieber, Renée E., and Mordechai Haklay. 2015. “The Epistemology(s) of Volunteered Geographic Information: A Critique.” Geo: Geography and Environment 2: 122–36.
Siegert, Bernhard. 2015. Cultural Techniques: Grids, Filters, Doors, and Other Articulations of the Real. New York: Fordham University Press.
Simmons, J.S., T.F. Whayne, G.W. Anderson, and H.M. Horack. 1944. Global Epidemiology: A Geography of Disease and Sanitation. Philadelphia: J.B. Lippincott Company.
Singel, Ryan. “Map Hacks on Crack.” Wired.com, February 2, 2005, https://www.wired.com/2005/07/map-hacks-on-crack/.
Smith, George Davey, and Ezra Susser. 2002. “Zena Stein, Mervyn Susser and Epidemiology: Observation, Causation and Action.” International Journal of Epidemiology 31 (1): 34–58.
Snyder, Joel. 1998. “Visualization and Visibility.” In Picturing Science Producing Art, edited by Caroline A. Jones, and Peter Galison, 379–400. London: Routledge.

227
Sørensen, Estrid. 2010. “Producing Multi-Sited Comparability.” In Thick Comparison: Reviving the Ethnographic Aspiration, edited by Jörg Niewöhner, and Thomas Scheffer, 43–78. Leiden: Brill.
Stanford BMIR (Stanford Center for Biomedical Informatic Research). Biostorm (project website). Last modified January 12, 2009. https://biostorm.stanford.edu/home.
Star, Susan Leigh, and James R. Griesemer. 1989. “Institutional Ecology, ‘Translations’ and Boundary Objects: Amateurs and Professionals in Berkeley’s Museum of Vertebrate Zoology, 1907-39.” Social Studies of Science 19 (3): 387–420.
Steinitz, Carl, Paul Parker, and Lawrie Jordan. 1976. “Hand-Drawn Overlays: Their History and Prospective Uses.” Landscape Architecture September: 444–55.
Steward, Helen. 1997. The Ontology of Mind: Events, Processes, and States (Kindle Edition). Oxford: Clarendon Press.
Stichweh, Rudolf. 2003. “The Multiple Public of Science: Inclusion and Popularization.” Soziale Systeme 9: 210–20.
Striphas, Ted. 2015. “Algorithmic Culture.” European Journal of Cultural Studies 18 (4-5): 395–412.
Stroup, Donna F., G. David Williamson, Joy L. Herndon, and John M. Karon. 1989. “Detection of Aberrations in the Occurence of Notifiable Diseases Surveillance Data.” Statistics in Medicine 8: 323–29.
Subramanian, S.V., K. Jones, A. Kaddour, and N. Krieger. 2009. “Revisiting Robinson: The Perils of Individualistic and Ecologic Fallacy.” International Journal of Epidemiology 38 (2): 342–60.
Susser, Mervyn. 1973. Causal Thinking in the Health Sciences. Oxford: Oxford University Press.
Susser, Mervyn. 1985. “Epidemiology in the United States After World War II.” Epidemiologic Review 7: 147–77.
Susser, Mervyn, and Ezra Susser. 1996. “Choosing a Future for Epidemiology.” American Journal of Public Health 86 (5): 674–77.
Taylor, Peter J. 1990. “Editorial Comment: GKS.” Political Geography Quarterly 9 (3): 211–12.
Taylor, Peter J., and Ann S. Blum. 1991a. “Ecosystem as Circuits: Diagrams and the Limits of Physical Analogies.” Biology and Philosophy 6: 275–94.
Taylor, Peter J., and Ann S. Blum. 1991b. “Pictorial Representation in Biology.” Biology and Philosophy 6: 125–34.
Terris, Milton. 1983. “The Complex Tasks of the Second Epidemiologic Revolution: The Joseph W. Mountin Lecture.” Journal of Public Health Policy 4 (1): 8–24.
Thacker, Eugene. 2004. “Networks, Swarms, Multitudes.” Ctheory.net, https://journals.uvic.ca/index.php/ctheory/article/view/14542/5389.

228
Thacker, Eugene. 2005. “Living Dead Networks.” The Fibreculture Journal 4 (18), http://four.fibreculturejournal.org/fcj-018-living-dead-networks/.
Thiébaut, R, and F Thiessard. 2017. “Public Health and Epidemiology Informatics.” Yearbook of Medical Informatics 26 (1): 248–51.
Thomas, Stefan. 2019. Ethnografie. Eine Einführung. Wiesbaden: Springer VS.Thrift, Nigel. 2014. “The ‘Sentient’ City and What it May Portend.” Big Data & Society
1(1): 1–21.Tomlinson, Roger. 1998. “The Canada Geographic Information System.” In The
History of Geographic Information Systems. Perspectives From the Pioneers, edited by Timothy W. Foresman, 21–32. Upper Saddle River, NJ: Prentice Hall PTR.
Troll, Carl. 1953. “Ein Markstein in Der Entwicklung Der Medizinischen Geographie: Zum Erscheinen Von E. Rodenwaldt’s Weltseuchenatlas (World-Atlas of Epidemic Diseases).” Erdkunde 7 (1): 60–64.
Troll, Carl. 1939. “Luftbildplan Und Ökologische Bodenforschung. Ihr Zweckmäßiger Einsatz Für Die Wissenschaftliche Erforschung Und Praktische Erschließung Wenig Bekannter Länder.” Zeitschrift der Gesellschaft für Erdkunde zu Berlin 7,8: 241–298.
Trostle, James. 1986. “Anthropology and Epidemiology in the Twentieth Century: A Selective History of Collaborative Projects and Theoretical Affinities, 1920 to 1970.” In Anthropology and Epidemiology, edited by Craig R. Janes, Ron Stall, and Sandra M. Gifford, 59–94. Dordrecht: D. Reidel.
Tufte, Edward. 1997. Visual Explanations. Images and Quantities, Evidence and Narrative. Cheshire: Graphic Press.
Viswanathan, D.K. 1959. Mechanisms and Procedures in Malaria Eradication. Geneva: WHO.
Vogl, Joseph. 1999. “Einleitung.” In Poetologien Des Wissens Um 1800, edited by Joseph Vogl, 7–16. München: Fink.
Wakefield, J.C., J.E. Kelsall, and S.E. Morris. 2001. “Clustering, Cluster Detection, and Spatial Variation in Risk.” In Spatial Epidemiology: Methods and Applications, edited by Paul Elliott, Jon Wakefield, Nicola Best, and David Briggs, 128-152. Oxford: Oxford University Press.
Warf, Barney, and Daniel Sui. 2010. “From Gis to Neogeography: Ontological Implications and Theories of Truth.” Annals of GIS 16 (4): 197–209.
Webb, Penny, Chris Bain, and Andrew Page. 2017. Essential Epidemiology: An Introduction for Students and Health Professionals. Cambridge: Cambridge University Press.
Weindling, Paul. 1993. “Heinrich Zeiss, Hygiene and the Holocaust.” In Doctors, Politics and Society, edited by Dorothy Porter, and Roy Porter, 174–87. Amsterdam: Rodopi.

229
Weir, Lorna, and Eric Mykhalovskiy. 2012. Global Public Health Vigilance: Creating a World on Alert. New York: Routledge.
Wilson, J.M.G., and G. Jungner. 1968. Principles and Practice of Screening for Disease. Geneva: WHO.
WHO (World Health Organization). 1957. Expert Committee on Malaria: Sixth Report. Geneva: WHO.
WHO (World Health Organization). 1961. Expert Committee on Malaria: Eighth Report. Geneva: WHO.
WHO (World Health Organization). 1962. Expert Committee on Malaria: Ninth Report. Geneva: WHO.
WHO (World Health Organization). 1965. Geographical Reconnaissance for Malaria Eradication Programmes. Geneva: WHO.
WHO (World Health Organization). 1967. Expert Committee on Malaria: Thirteenth Report. Geneva: WHO.
WHO (World Health Organization). 1971. Expert Committee on Malaria: Fifteenth Report. Geneva: WHO.
WHO (World Health Organization). 1975. Manual on Practical Entomology in Malaria. Geneva: WHO.
Yarnell, John, and Dermot O’Reilly. 2013. Epidemiology and Disease Prevention. A Global Approach. Oxford: Oxford University Press.
Yerushalmy, Jacob. 1947. “Statistical Problems in Assessing Methods of Medical Diagnosis, With Special Reference to X-Ray Techniques.” Public Health Reports (1896-1970) 62 (40): 1432–49.
Zaslavsky, Ilya. 2008. “GIS Mashups.” In Encyclopedia of GIS, 408. Boston: Springer.Zeiss, Heinz. 1944a. “Einleitung.” In Seuchenatlas. Herausgegeben Im Auftrag Des
Wehrmachtssanitätswesens, edited by Heinz Zeiss, Gotha: Justus Perthes.Zeiss, Heinz. 1944b. “Medizinische Kartographie Und Seuchen-Bekämpfung.” In
Seuchenatlas. Herausgegeben Im Auftrag Des Chefs Des Wehrmachtssanitätswesens, edited by Heinz Zeiss, not paginated. Gotha: Justus Perthes.
Zeiss, Heinz, ed. 1944c. Seuchenatlas. Herausgegeben Im Auftrag Des Chefs Des Wehrmachtssanitätswesens. Gotha: Justus Perthes.
Zylberman, Patrick. 2008. “A Transatlantic Dispute. The Etiology of Malaria and the Redesign of the Mediterranean Landscape.” In Shifting boundaries of public health : Europe in the twentieth century, edited by Lion Murard Susan Gross Solomon, Patrick Zylberman, 269–96. Rochester: University of Rochester Press.

230
Curriculum Vitae
Der Lebenslauf entfällt aus datenschutzrechtlichen Gründen / The curriculum vitae is not included in the PDF version for reasons of data protection.