dialogue 2: the cost of longevity risk and what...
TRANSCRIPT

Moderator: Kevin Olsen, News Editor, Pensions & Investments
David Druley, Managing Director and Head of Global Pension Practice Cambridge Associates
Olga Fuentes, Ph.D., Deputy Chairman of Regulation Superintendence of Pensions – Chile
R. Dale Hall, FSA, MAAA, CERA, CFA, Managing Director of Research Society of Actuaries (SOA)
William F. McCloskey, CFA, VP, Longevity Reinsurance, Prudential Financial
DIALOGUE 2: The Cost of Longevity Risk and
What Plan Sponsors Can Do About It

R. DALE HALL, FSA, MAAA, CERA, CFA
MANAGING DIRECTOR OF RESEARCH
SOCIETY OF ACTUARIES
DIALOGUE 2:
The Cost of Longevity Risk and
What Plan Sponsors Can Do About It

RP-2014 Mortality Tables
• Developed by SOA’s Retirement Plans Experience Committee
• Data studied from privately sponsored defined benefit plans
• Mortality rates for employees, healthy annuitants and disabled retirees
• Tables in aggregate and for Blue / White Collar and Bottom / Top Quartile Income
• RPEC_2014 Improvement Model
• Update to RP-2000
• Input to IRS review of mortality for minimum funding rules

Impact of New Assumptions• Annuity Values, $1 per month beginning at attained age 62,
discounted at 6%, Calendar Year 2014
Attained Age
Male:RP-2000, Scale
AA
Male:RP-2014, MP-
2014 Increase
Female:RP-2000, Scale
AA
Female:RP-2014, MP-
2014 Increase
45 4.36 4.48 2.8% 4.43 4.75 7.1%
55 7.74 7.98 3.0% 7.95 8.45 6.3%
65 10.99 11.47 4.4% 11.46 12.09 5.5%
75 7.87 8.70 10.5% 8.70 9.40 8.1%
85 4.67 5.48 17.4% 5.59 6.18 10.5%

Observed Mortality Improvement and Forward Modeling
100959085807570656055504540
195119611971198119912001201120210.03-0.0350.025-0.030.02-0.0250.015-0.020.01-0.0150.005-0.010-0.005
-0.005-0
-0.01--0.005-0.015--0.01
Age
Historical data source: US (SSA) Males 40-100; 1950-2005
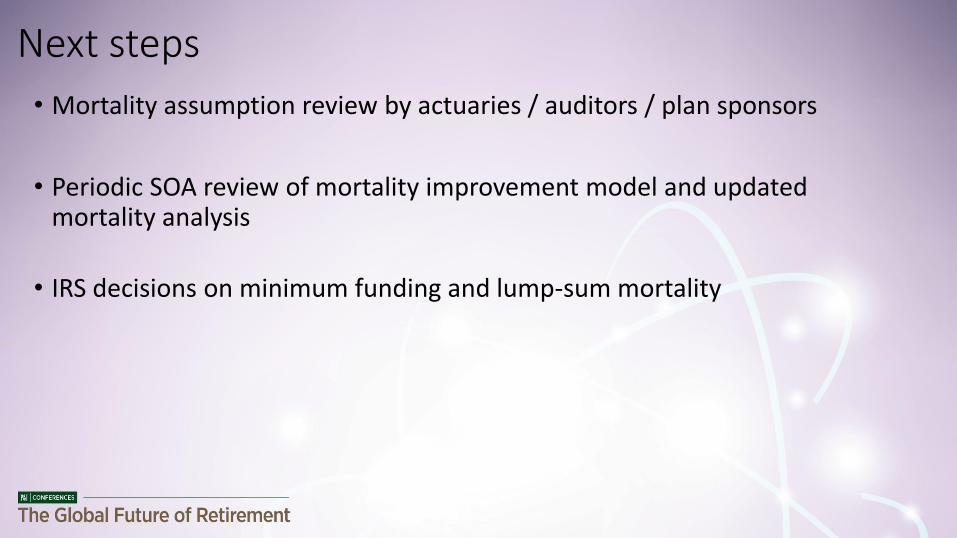
Next steps
• Mortality assumption review by actuaries / auditors / plan sponsors
• Periodic SOA review of mortality improvement model and updated mortality analysis
• IRS decisions on minimum funding and lump-sum mortality

William McCloskey
Vice President, Longevity Reinsurance
Prudential Financial, Inc.
DIALOGUE 2:
The Cost of Longevity Risk and
What Plan Sponsors Can Do About It

The U.K. Leads The World in Transaction Volume and Innovation
Data in USD billionsSources: LIMRA, Hymans Robertson and Prudential analysis, YE 2014
Cumulative Annual Transaction Totals by Country/Product
U.S. AllTransactions
U.K. Buy-outs& Buy-ins
U.K. LongevityRisk Transfer
Canada AllTransactions
0
50
100
150
200
250
300
2007 2008 2009 2010 2011 2012 2013 2014

There Are Some Key Differences Between the U.S. and the U.K. That Drive Different Risk Practices
U.S. Corporate U.K. Corporate
Funding Rules Weaker Stronger
Items in purple encourage risk management and risk transfer.
Liabilities Almost No COLAs Almost All COLAs
Mortality Tables Updated Every 10 Years Every Year
Balance Sheet Impact Mark-to-Market Mark-to-Market
Income Statement Impact Smoothed Mark-to-Market
PBGC Premium / PPF Levy Not Risk-Based Risk-Based
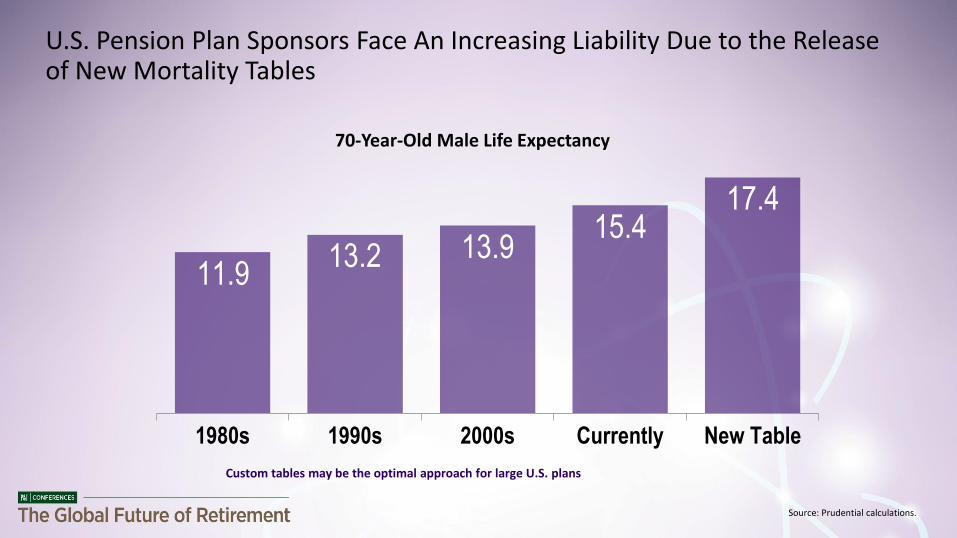
U.S. Pension Plan Sponsors Face An Increasing Liability Due to the Release of New Mortality Tables
Source: Prudential calculations.
1980s 1990s 2000s Currently New Table
13.2 13.915.4
17.4
11.9
Custom tables may be the optimal approach for large U.S. plans
70-Year-Old Male Life Expectancy

U.S. Pension Plan Sponsors Are Beginning to Recognize the Potential Effects of Longevity Risk
A recent survey revealed:
63% of plan sponsors with $5 billion to $15 billion in assets under management indicated they have a very high awareness of the impact of longevity risk.
When asked what action they would take if their plan’s liabilities increased due to the implementation of these updated mortality calculations:
– 12% of private plan sponsors said they would transfer risk to an insurer
– 22% said they’d offer lump sums
– 25% indicated they would implement a liability-driven investment strategy
– 23% indicated they would allow additional voluntary pension contributions
Source: Pension Plan De-Risking Report North America 2015

This presentation is intended only for the use of the individual or entity to which it is addressed, and may contain confidential information. The information contained herein is not for further distribution without the express consent of Prudential Retirement.
This discussion document describes product concepts that are not final. It has been prepared for discussion purposes only. It is not an offer to enter into any agreement. This document does not completely describe the terms of any potential transaction or final product design, and any transaction would be subject to applicable legal and regulatory requirements; internal, legal and regulatory approvals; and final legal documentation. Any indication of pricing provided in this document is for illustrative purposes only.
Prudential does not provide legal, regulatory or accounting advice. Therefore the plan sponsor and its advisors should seek legal, regulatory and accounting advice regarding the legal, regulatory or accounting implications of the insurance contract. This information is provided with the understanding that the recipient will discuss the subject matter with its own legal counsel, auditor and other advisors.
Insurance and reinsurance products are issued by either Prudential Retirement Insurance and Annuity Company (PRIAC), Hartford, CT, or The Prudential Insurance Company of America (PICA), Newark, NJ. Both are wholly owned subsidiaries of Prudential Financial, Inc. (PFI) and have no affiliation with Prudential plc of the United Kingdom. Each company is solely responsible for its financial condition and contractual obligations. Neither PRIAC nor PICA are authorized by the U.K. Prudential Regulation Authority or the Financial Conduct Authority, nor do they offer insurance or reinsurance in the United Kingdom. PRIAC and PICA do provide off-shore reinsurance to companies that have acquired U.K. pension risks through transactions with U.K. plan sponsors. PRIAC and PICA are not authorized or regulated by the Office of Superintendent of Financial Institutions for Canada or by the Financial Services Commission of Ontario.
Prudential’s Traditional Buy-out is a group annuity contract issued by PICA, Newark, NJ 07102. Amounts contributed are deposited in PICA’s general account. Any payment obligations or guarantees are contingent on the claims-paying ability of PICA, and are subject to certain limitations, terms and conditions.
Prudential’s Portfolio Protected Buy-out and Prudential’s Portfolio Protected Buy-in are group annuity contracts issued by PICA, Newark, NJ 07102. Amounts contributed to the contracts are deposited in a separate account established by PICA. Payment obligations specified in the group annuity contracts are insurance claims supported by the assets in the separate account and, if such assets are not sufficient, by the full faith and credit of PICA, subject to certain limitations, terms and conditions.
Products not available in all states.
0278523-00001-00

DAVID R. DRULEY, CFA
MANAGING DIRECTOR, HEAD OF GLOBAL PENSION PRACTICE
CAMBRIDGE ASSOCIATES, LLC
DIALOGUE 2:
The Cost of Longevity Risk and
What Plan Sponsors Can Do About It

The cost of longevity and thus longevity risk is simple:
It is the risk a plan becomes underfunded due to increasing life expectancies and therefore increasing liabilities.
There are a range of insurance based solutions for dealing with longevity risk but they come with a cost.
Buyins and Buyouts
Longevity swaps
Plan sponsors could also pay for this underfunding via increased contributions but that is an expensive solution.
The preferred manner of paying for the cost of increased longevity would be to generate higher returns if that could be done without significantly increasing liability relative risk.
If increased longevity has increased defined benefit pension liabilities by 5% - 10%, a pension will need to generate 25-50 bps in increased annual returns over a 20 year period to cover the increased liability.
Mitigating Longevity Risk In a Defined Benefit Pension—The Investment Solution

Mitigating Longevity Risk In a Defined Benefit Pension—The Investment Solution
How to pay for increased longevity by generating higher portfolio returns in a risk efficient manner
Better diversify portfolios across asset classes and exposures to optimize risk adjusted returns
Efficiently use return enhancing betas such as private equity, venture capital, and private real assets
Increased longevity allows for longer time horizons and greater investment in illiquid assets
Retain internal or external resources to generate alpha. Active risk is uncorrelated to beta risk in the portfolio thus if an institution can generate positive alpha, it is very powerful from a portfolio management perspective.

Note: Average Pension asset allocation is based on an average of the UK, U.S., and Canadian mean pension asset allocations sourced from State Street, Greenwich Associates, and Canadian Institution Investment Network. Nominal returns are based on Cambridge Associates ‘ standard equilibrium assumptions calculated over a 25 year period. 20 bps
of alpha assumes 30 bps of alpha net 10 bps of oversight cost. Past performance is not a guarantee of future returns.
45.7
35.0
32.9
32.5
6.2
5.0
2.6
15.0
3.810.0
2.58.8
0%
10%
20%
30%
40%
50%
60%
70%
80%
90%
100%
Average Pension Alternative Allocation
Cash & Other
Private NaturalResources
Private Equity
Hedge Funds
Real Estate
Fixed Income
Global Equity
Mitigating Longevity Risk In a Defined Benefit Pension—The Investment Solution
Standard Deviation 10.2% 10.0%
Expected Return 8.0% 8.3%
Alpha 0.0% 0.2%
Total Targeted Return 8.0% 8.5%

Olga Fuentes
Deputy Chairman of Regulation
Superintendence of Pensions, Chile
DIALOGUE 2:
The Cost of Longevity Risk and
What Plan Sponsors Can Do About It

BACKGROUND
Increased longevity is a world phenomena
Latin America, including Chile, is still in the phase of demographic dividend about to enter a major aging step. This imposes a risk but also an opportunity.
Public policies design and implementation requires technical expertise, a long term view of their impact, and continuous evaluation to introduce the necessary adjustments on time.
Main goal/challenge: pension adequacy without risking sustainability in an environment of higher life expectancy
Longevity risk and the cost of higher longevity in a DC scheme it is the risk that:
Future pensioners received a lower pension than expected i.e. a lower RR and/or
T he balance to finance a programmed withdrawal get exhausted beforehand.
Relevant risks: Investment risk, human capital/labor risk, risk of annuitization, and longevity risk

CHILEAN PENSION SYSTEM: MAIN CHARACTERISTICS & ACTUAL REGULATION
Multi-pillar scheme: Solidarity pillar + DC mandatory contributions in personal accounts + voluntary savings Total Savings: US$ 174 bn. (72 % GDP). Total Affiliates: 9,8 millions. Coverage: 65%. Multi fund: Funds A-E depending on % invested in equity. Funds administered by 6 PFM.
ACTUAL REGULATION
(1) Partial protection against longevity risk by introducing an adjustment factor into programmed withdrawal.
(2) Buffering effect of the Pension solidarity contribution
02
46
8
Den
sity
0 .2 .4 .6 .8 1
TR sin APS TR con APS
Mujer, educación terciaria, baja densidad, estrategia por defecto
Distribución Tasas de Reemplazo
RR without SP RR with SP

MORTALITY TABLES (MT) : UPDATING PROCESS
MT are jointly established by the Superintendence of Pensions (SP) and the Superintendence of Securities and Insurance (SVS).
By law, the adequacy of these tables need to be assessed periodically
Updating process: 2014-2016
Data validation & Proposal of new tables
Discussion with the market (3 months)
Definition of new tables: end of 2015, valid from: July 1st, 2016
The updating process is receiving the technical assistance of the OECD
Key: Mortality tables incorporate future mortality improvements

OTHER FACTORS TO CONSIDER: LABOR AND FINANCIAL MARKETS
Higher life expectancy effect on pension values is reinforced by the following:
Decreasing evolution of interest rates globally.
In a DC scheme, participation is closely linked to occupational status
Labor market risk implies density of contributions 52% on average. Large heterogeneity (low income women, 31%)
In general, actual pension levels do not live up to the expectations of the population.

POSIBLE SOLUTIONS & FINAL REMARKS
Make the employer and employee to contribute not only to increase savings but also a contribution/fee for an insurance against longevity risk
Modify/ propose new pension products to better insure against longevity risk: temporal income + deferred annuities; start buying annuities gradually prior to retirement age.
Other broader measures to the system:
Parametric changes (contribution rate, retirement age)
Improve the multi-fund scheme (risk-return tradeoff, restrictions to access to risky funds) and the default investment strategy
Increase coverage and benefits of the Solidarity Pillar. Improve the mean-tested methodology.
Increase the incentives for voluntary savings
Financial education to increase population awareness

Moderator: Kevin Olsen, News Editor, Pensions & Investments
David Druley, Managing Director and Head of Global Pension Practice Cambridge Associates
Olga Fuentes, Ph.D., Deputy Chairman of Regulation Superintendence of Pensions – Chile
R. Dale Hall, FSA, MAAA, CERA, CFA, Managing Director of Research Society of Actuaries (SOA)
William F. McCloskey, CFA, VP, Longevity Reinsurance, Prudential Financial
DIALOGUE 2: The Cost of Longevity Risk and
What Plan Sponsors Can Do About It