dichotic pitches as illusions of binaural unmasking. ii. the fourcin pitch and the dichotic...
TRANSCRIPT

Redistri
Dichotic pitches as illusions of binaural unmasking.II. The Fourcin pitch and the dichotic repetition pitch
John F. Culling,a) David H. Marshall, and A. Quentin SummerfieldMRC Institute of Hearing Research, University of Nottingham, University Park, Nottingham NG7 2RD,United Kingdom
~Received 21 February 1996; revised 2 March 1998; accepted 4 March 1998!
The predictions of three models are compared with respect to existing experimental data on theperception of the Fourcin pitch~FP! and the dichotic repetition pitch~DRP!. Each model generatesa central spectrum~CS!, which is examined for peaks at frequencies consistent with the perceivedpitches. A modified equalization-cancellation~mE-C! model of binaural unmasking@Culling andSummerfield, J. Acoust. Soc. Am.98, 785–797~1995!# generates a CS which reflects the degree ofinteraural decorrelation present in each frequency channel. This model accounts for the perceivedfrequencies of FPs, but produces no output for DRP stimuli. A restricted equalization-cancellation~rE-C! model @Bilsen and Goldstein, J. Acoust. Soc. Am.55, 292–296 ~1974!# sums thetime-varying excitation in corresponding frequency channels, without equalization, to form a CS. Acentral activity pattern~CAP! model @Raatgever and Bilsen, J. Acoust. Soc. Am.80, 429–441~1986!# generates a CS by scanning an interaural cross-correlation matrix across frequency. TherE-C and CAP models yield inaccurate predictions of the perceived frequencies of FPs, but predictthe occurrence of the DRP and its correct pitch. The complementary predictions of the mE-C modelcompared to the rE-C and CAP models, together with the evidence that the FP is clearly audible forthe majority of listeners, while the DRP is faintly heard by a minority of listeners, suggest that themE-C model provides the best available account of the FP, and that the DRP is produced by aseparate mechanism. ©1998 Acoustical Society of America.@S0001-4966~98!06006-8#
PACS numbers: 43.66.Ba, 43.66.Dc, 43.66.Pn@RHD#
ies
de
o
twio
enth
oi
cangera
ltdr-
ses.ter-
hift
istheting
ly
m-neeti-
byralne
ner-,
id
rtainn-
thet ituc-ise
or
INTRODUCTION
A dichotic pitch occurs when broadband noises applto the two ears creates a pitch percept through a procesbinaural interaction. Four dichotic pitches have beenscribed. Two of them, the Huggins pitch~Cramer and Hug-gins, 1958! and the binaural edge pitch~Klein and Hartmann,1981!, are addressed in a companion paper~Culling et al.,1998!. That paper reports psychoacoustic experiments whresults suggest that a more accurate and parsimoniouscount of the detection and perceived frequency of thesepitches is provided by a modified equalization-cancellat~mE-C! model of binaural unmasking~Culling and Summer-field, 1995! than by models proposed previously. The prespaper is concerned with the other two dichotic pitches:Fourcin pitch~FP! ~Fourcin, 1970! and the dichotic repeti-tion pitch ~DRP! ~Bilsen and Goldstein, 1974!.
The FP and the DRP are produced by presenting nbinaurally with large interaural delays (.1 ms). At least oneof the interaural delays must be larger than those whichoccur for human listeners in the free field, although the raof interaural delays which give rise to the FP and DRP ovlaps the range which can produce the perception of lateization. To produce the FP@Fig. 1~a!# two independentnoises with different interaural delays are presented simuneously~Fourcin, 1970!. A noise is heard containing a sounwith an identifiable pitch. The pitch is related to the diffe
a!New address: University Laboratory of Physiology, Parks Road, OxfOX1 3PT, United Kingdom.
3527 J. Acoust. Soc. Am. 103 (6), June 1998 0001-4966/98/103(
bution subject to ASA license or copyright; see http://acousticalsociety.org/c
dof-
seac-o
n
te
se
ne
r-l-
a-
ence between the interaural delays applied to the two noiThe pitch is ambiguous when the two noises are both inaurally in-phase~i.e., only delayed!. An unambiguous pitchis heard if one of the noises is given an interaural phase sof p radians. Measurements by Bilsen and Wesdorp~1974;Bilsen, 1977! showed that in this latter condition the FPmatched by listeners to a tone whose period is equal todifference between the interaural delays used in generathe dichotic stimulus.
Fourcin ~1970! reported that no pitch was heard if onone noise was presented. Later, Bilsen and Goldstein~1974!showed that a faint pitch could be heard in these circustances. They called this pitch the ‘‘Dichotic RepetitioPitch’’ @Fig. 1~b!#. The name emphasizes a similarity in thgeneration of the DRP to the generation of monaural reption pitches~Bilsen, 1966!. A monaural repetition pitch isheard in a broadband noise which has been comb filteredsummation with a delayed copy of itself. Like the monaurepetition pitch, the DRP is matched by listeners to a towhose period is equal to the interaural delay used in geating the stimulus~Bilsen and Goldstein, 1974; Bilsen1995!.
In fact, one of Fourcin’s listeners in his 1958 tests dreport hearing a DRP~Fourcin, 1995!. Fourcin ~1970! didnot report the phenomenon because he was uncewhether this pitch was an artefact. The difficulty most listeers experience in hearing the DRP and its similarity tomonaural repetition pitch have prompted concerns thamight be produced by cross talk through air or bone condtion between the left-ear and right-ear channels, giving r
d
35276)/3527/13/$10.00 © 1998 Acoustical Society of America
ontent/terms. Download to IP: 131.230.73.202 On: Mon, 22 Dec 2014 17:20:29

erha
nd
o
bo
al
t fntncfohiral’rnF
elelartht
tha
.’ad
itc
h’s
d’’
ntoave-
therettedec-
d
t-gor-rgesdif-nedorsncy.
a-entorsal-andnci-ap-p-
ncytofi-arernal
cen-rnalrumge
ofonede-n-thein-
re-pe-rs
is
Redistri
to a repetition pitch which is detected monaurally. Howevthis concern now appears to be unfounded, since DRPsbeen reported~a! at sensation levels as low as15 dB~Bilsen, 1995! where such cross talk would be inaudible, a~b! using insert earphones~Culling, 1996! which generatevery low levels of interaural cross talk~Killion et al., 1985!.
In summary, the FP@Fourcin~1970!; Fig. 1~a!# is a rela-tively robust phenomenon. It can be heard by the majoritylisteners. In contrast, the DRP@Bilsen and Goldstein~1974!;Fig. 1~b!# is a weaker phenomenon. It is not heard easilyall listeners. It would be desirable, therefore, for modelsthe two phenomena to predict that the FP has materigreater strength than the DRP.
I. THE PRESENT INVESTIGATION
This paper describes three models which can accounthe occurrence of dichotic pitches and examines the extewhich each model predicts the DRP and the FP. The pripal finding is that the rE-C and CAP models account wellthe DRP, but make erroneous predictions of the FP, wthe mE-C model cannot predict the DRP, but gives accupredictions of the FP. In addition, since the mE-C modeaccount of the FP relies on the use of independent intedelays in each frequency channel, the exitence of thecorroborates that aspect of the model.
In the following section, Sec. II, we describe the modin qualitative terms. In Sec. III we describe how the modwere implemented computationally. In Sec. IV we compthe accuracy with which the models predict examples ofFP and the DRP, explain their mechanisms, and discussreasons for the accuracy of their predictions.
II. THREE MODELS OF THE FP AND THE DRP
The models are essentially qualitative. They shareproperty of generating a spectral display of energy plotteda function of frequency, often termed a ‘‘central spectrumCentral spectra are interpreted in much the same way in emodel: the presence of peaks at the frequency of the funmental and/or its harmonics is taken as evidence of a pcorresponding to that fundamental frequency.
FIG. 1. Schematic illustration of the stimulus configurations which give rto ~a! the Fourcin pitch and~b! the dichotic repetition pitch.
3528 J. Acoust. Soc. Am., Vol. 103, No. 6, June 1998
bution subject to ASA license or copyright; see http://acousticalsociety.org/c
,ve
f
yfly
ortoi-rletesalP
sseehe
es
’cha-h
A. Restricted E-C model „rE-C…
Bilsen and Goldstein~1974! described a model of the FPand the DRP which was based on aspects of Durlac~1960, 1972! equalization-cancellation~E-C! model of bin-aural masking release. We call their model the ‘‘restricteE-C model ~rE-C!. The rE-C model is distinct from the‘‘modified’’ E-C ~mE-C! model which is described below. Inthe rE-C model, the signals from the two ears are filtered iseparate passbands, internal noise is added, and the wforms in corresponding channels from the two ears are eisummed or cancelledwithout any process of time or phasequalization. The resulting energy in each channel is ploas a function of channel frequency to produce a central sptrum.
B. Central activity pattern „CAP… model
Bilsen ~1977, 1995!, Raatgever~1980!, and Raatgeverand Bilsen~1977, 1986! suggested a model of the DRP anthe FP which shares similarities with Jeffress’~1948, 1972!account of sound localization. Their ‘‘central activity patern’’ ~CAP! model incorporates the ideas that, followinperipheral frequency analysis, time-varying excitation in cresponding frequency channels from the two ears conveon coincidence detectors through internal delay lines offerent lengths. Therefore, each coincidence detector is tuto a particular interaural delay. A set of coincidence detectcovers a range of interaural delays for each center frequeThus, the coincidence detectors form a two-dimensional mtrix in frequency and interaural delay. The CAP for a givstimulus represents the output of the coincidence detecacross this matrix. For the purposes of predicting pitch vues and the lateralization of pitch images, RaatgeverBilsen assumed that the pattern of activity across the coidence detectors for a particular center frequency can beproximated by a cross-correlation function. They further aproximated the cross-correlation function for each frequechannel with a sinusoid. This approximation is equivalentthe assumption that auditory frequency selectivity is innitely fine at each center frequency. The resulting CAPsinterpreted by scanning across frequency at a chosen intedelay to produce a central spectrum. It is assumed thattral mechanisms can inspect central spectra at all intedelays, but that attention is focused on a single spectwhich displays clear evidence of harmonicity or laramounts of modulation in spectral amplitude as a functionfrequency. An ambiguous pitch occurs when more thanwell-modulated spectrum is available, and the pitchesrived from each are different. The model predicts that listeers hear sounds with spectral properties corresponding toattended spectrum, which are lateralized according to theternal delay of the spectrum in which it is detected.
C. Modified equalization cancellation „mE-C… model
Culling and Summerfield~1995! described a modifiedversion of Durlach’s equalization-cancellation~E-C! modelwhich is designed to account for the binaural maskinglease of complex sounds. This mE-C model simulatesripheral frequency selectivity using time-domain filte
e
3528Culling et al.: Dichotic pitches. II
ontent/terms. Download to IP: 131.230.73.202 On: Mon, 22 Dec 2014 17:20:29

m
wo
l-n
ayenc-
ctan
areF
th
dtlin
toh
ri
ente
ne
dtla
thllenda
este
. Is-
aug
-toby
ns,ndtnal
ies
-
hen;
ow-ing-ac-
been-ual
ed
a-us-
rms
ex-hean-
m-e-testpli-the
of-f a
estthens.s ating
aksB.
Redistri
whose shapes and bandwidths approximate those of huauditory filters ~Pattersonet al., 1987, 1988!. The time-varying excitation in corresponding channels from the tears is equalized as far as possible by applying~i! adjust-ments in rms level1 and ~ii ! internal delays of up to6 halfthe period of the center frequency of the channel~but nogreater than65 ms!, and is then cancelled~to the extent thatequalization was achieved! through subtraction. The equaization process is performed independently in each frequechannel~i.e., using different adjustments of internal deland level, if necessary!. The residual energy in each channafter subtraction is plotted as a function of center frequeto generate a central spectrum@termed a ‘‘recovered spectrum’’ by Culling and Summerfield~1995!#. Culling et al.~1998! demonstrated that recovered spectra display spepeaks at frequencies consistent with the Huggins pitchthe binaural edge pitch.
III. IMPLEMENTATION OF THE MODELS
The models were implemented in a common formTheir input was the digitized waveforms of the sounds psented to the left and right ears in a stimulus generating aor a DRP. Their outputs were displays of central spectra;is, plots of energy as a function of frequency.
A. The E-C model
In order to simplify comparisons with the CAP anmE-C models, the rE-C model was implemented in a slighdifferent way from that described by Bilsen and Goldste~1974!. They made the reasonable assumption that audifrequency channels have Gaussian-shaped passbands wbandwidths correspond to psychophysical estimates of ccal bandwidths measured by Zwicker and Feldkeller~1967!.Our implementation of the rE-C model reflects more recestimates of the shapes and bandwidths of auditory fil~Patterson, 1976; Moore and Glasberg, 1983!. Auditory fre-quency selectivity was modeled with the Pattersonet al.~1987, 1988! gamma-tone filterbank, whose frequency chanels have passbands which approximate a roundexponential shape and equivalent rectangular bandwiwhich vary with center frequency according to the formuprovided by Moore and Glasberg@1983, Eq.~3!#. Moore andGlasberg’s formula specifies somewhat narrower bandwidin channels than those suggested by Zwicker and FeldkeFollowing frequency analysis, the waveforms in correspoing frequency channels from the two ears are both addedsubtracted. For each of these operations separately, thsulting rms energy in each channel is plotted in dB afunction of channel center frequency to generate two alnative central spectra.
B. The CAP model
Three versions of the CAP model were implementedthe first version, here called the ‘‘original’’ version, croscorrelation functions at each frequency were calculatedsinusoidal functions of internal delay using the formulas sgested by Raatgever and Bilsen@1986, Eq. 6!#. Following
3529 J. Acoust. Soc. Am., Vol. 103, No. 6, June 1998
bution subject to ASA license or copyright; see http://acousticalsociety.org/c
an
cy
ly
rald
t.-P
at
y
ryose
ti-
trs
-d-hs
sr.-ndre-ar-
n
s-
Raatgever~1980!, the principle of superposition was assumed to hold when this version of the model was usedmodel the FP; the CAP for a FP stimulus was generatedsumming the two CAPs for appropriate DRP configuratioproducing an interference pattern. In the seco~‘‘weighted’’ ! version of the model, the CAP from the firsversion was weighted according to frequency and interdelay in the manner suggested by Raatgever~1980, Eqs. IV.1and IV.2!, thereby giving greatest emphasis to frequencaround 600 Hz and to ‘‘central’’ locations~i.e., those close tothe median plane!. This central-weighting function was previously postulated by Colburn~1973, 1977! to account forthe variation of the BMLD with frequency. The third~‘‘smoothed’’! version of the model was used to examine teffects of incorporating more realistic frequency resolutiothe across-frequency scans from the first version were lpass filtered using a rounded-exponential-shaped movaverage filter, whose bandwidth varied with frequency incordance with Moore and Glasberg@1983, Eq.~3!#. Witheach version of the model, the resulting CAP could eitherscanned across frequency at any fixed internal delay to gerate an across-frequency scan, or analyzed for individpeaks across all scans which are particularly prominent.
C. The mE-C model
The mE-C model was implemented in the way describby Culling and Summerfield~1995! and Culling et al.~1998!. Stimulus waveforms were filtered using the gammtone filterbank and peripheral transduction was simulateding the Meddis~1986, 1988! hair-cell model; the waveformsin corresponding frequency channels were equalized inlevel1 and then internal delay using delays of up to65 ms;the waveforms were cancelled using subtraction over aponentially tapering window with a 50-ms time constant; tresidual rms energy was plotted in dB as a function of chnel center frequency.
IV. RESULTS OF MODELING THE DRP
The ability of the models to predict DRPs was systeatically examined for stimuli with a range of interaural dlays. We report results obtained with a representativestimulus which consisted of a segment of white noise, ducated in the left-and right-ear channels, and leading atright ear by 4 ms. Bilsen and Goldstein~1974! showed thatthe pitch frequencies of DRP stimuli are the reciprocalstheir interaural delays,t(2,t,12 ms). So, a 4-ms interaural delay should generate a pitch equivalent to that o250-Hz tone.
A. The rE-C model
Figure 2 shows the central spectrum of the DRP tstimulus generated by the present implementation ofrE-C model for both the subtraction and addition operatioThe spectrum from the addition operation contains peakthe harmonics of the fundamental frequency correspondto the DRP: 250, 500, 750 Hz, etc. The low-frequency peare well defined with a peak–valley ratio of about 5–10 dAs observed by Bilsen and Goldstein~1974!, the rE-C model
3529Culling et al.: Dichotic pitches. II
ontent/terms. Download to IP: 131.230.73.202 On: Mon, 22 Dec 2014 17:20:29
thve
reonaedsimidrt trcninhe
rath
ese
-pe
ighc
epyd
ofdan
HzH0a
lo-es-
n oftch-
ods
f
y
verd-
Redistri
predicts a clear pitch at the frequency of the DRP usingaddition operation. Using the subtraction operation, howethe pattern of peaks and valleys is inverted.
The model produces a central spectrum with the corpattern using the addition operation for the following reasThe filtered waveforms in corresponding channels areproximately sinusoidal waveforms of equal frequency. Whadded together, the amplitude of the resulting waveformpends, therefore, on the phase difference between thesesoids. In channels whose center frequencies are integertiples of the reciprocal of the interaural delay, the sinusofrom the delayed ear are delayed by an integer numbecycles, and their phases are therefore similar to those aother ear. As a result, the waveforms maximally reinfoeach other when they are summed. Conversely, in chanwhose center frequencies are located half-way betweenger multiples of the reciprocal of the interaural delay, tphases at the two ears differ by approximatelyp radians, andthe waveforms cancel when summed. Thus, with an interal delay of 4 ms, reinforcement occurs at frequenciesare integer multiples of 250 Hz.
B. The CAP model
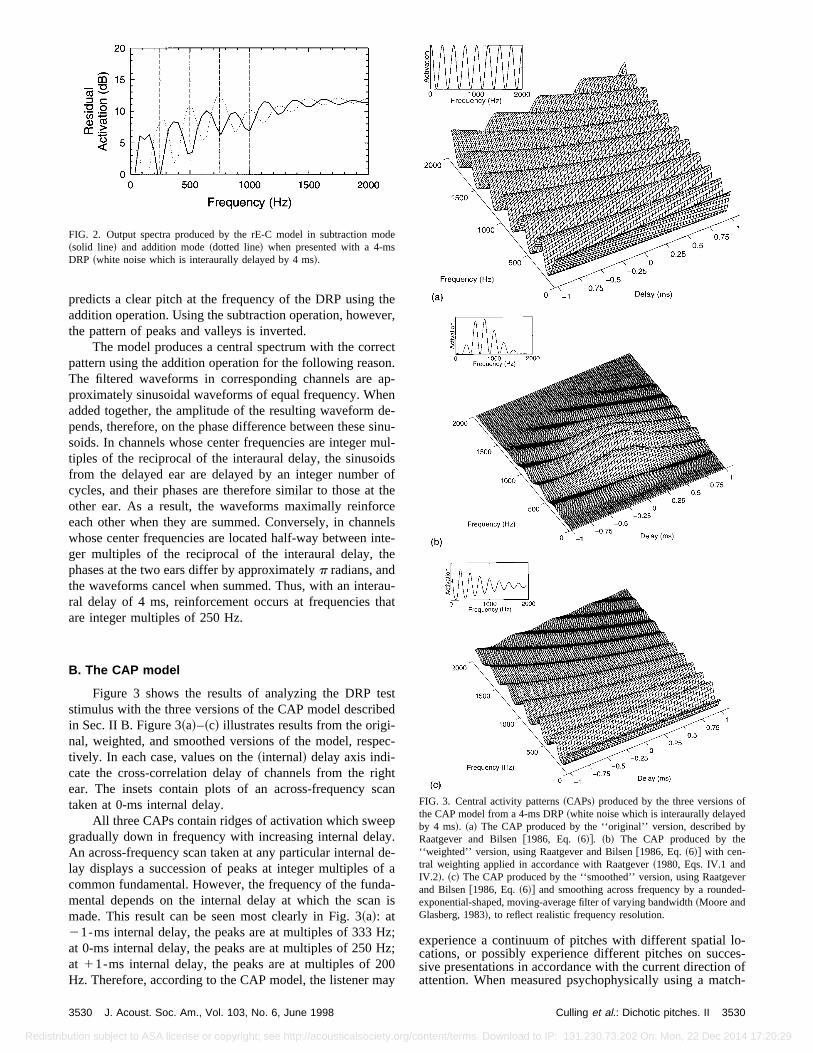
Figure 3 shows the results of analyzing the DRP tstimulus with the three versions of the CAP model describin Sec. II B. Figure 3~a!–~c! illustrates results from the original, weighted, and smoothed versions of the model, restively. In each case, values on the~internal! delay axis indi-cate the cross-correlation delay of channels from the rear. The insets contain plots of an across-frequency staken at 0-ms internal delay.
All three CAPs contain ridges of activation which swegradually down in frequency with increasing internal delaAn across-frequency scan taken at any particular internallay displays a succession of peaks at integer multiplescommon fundamental. However, the frequency of the funmental depends on the internal delay at which the scamade. This result can be seen most clearly in Fig. 3~a!: at21-ms internal delay, the peaks are at multiples of 333at 0-ms internal delay, the peaks are at multiples of 250at 11-ms internal delay, the peaks are at multiples of 2Hz. Therefore, according to the CAP model, the listener m
FIG. 2. Output spectra produced by the rE-C model in subtraction m~solid line! and addition mode~dotted line! when presented with a 4-mDRP ~white noise which is interaurally delayed by 4 ms!.
3530 J. Acoust. Soc. Am., Vol. 103, No. 6, June 1998
bution subject to ASA license or copyright; see http://acousticalsociety.org/c
er,
ct.
p-ne-nu-ul-sofheeelste-
u-at
td
c-
tan
.e-a-is
;z;0y
experience a continuum of pitches with different spatialcations, or possibly experience different pitches on succsive presentations in accordance with the current directioattention. When measured psychophysically using a ma
e
FIG. 3. Central activity patterns~CAPs! produced by the three versions othe CAP model from a 4-ms DRP~white noise which is interaurally delayedby 4 ms!. ~a! The CAP produced by the ‘‘original’’ version, described bRaatgever and Bilsen@1986, Eq. ~6!#. ~b! The CAP produced by the‘‘weighted’’ version, using Raatgever and Bilsen@1986, Eq.~6!# with cen-tral weighting applied in accordance with Raatgever~1980, Eqs. IV.1 andIV.2!. ~c! The CAP produced by the ‘‘smoothed’’ version, using Raatgeand Bilsen@1986, Eq.~6!# and smoothing across frequency by a roundeexponential-shaped, moving-average filter of varying bandwidth~Moore andGlasberg, 1983!, to reflect realistic frequency resolution.
3530Culling et al.: Dichotic pitches. II
ontent/terms. Download to IP: 131.230.73.202 On: Mon, 22 Dec 2014 17:20:29

a
eraoh
gheth
otrs-t’’
roPnid
thtoavreAdg
a-P
es-Ce
on4
oti
om
lssearon
th
onoh
del
ith
ase
f 0mase
in-r,e-
with
ne
hase0
eir
Redistri
ing paradigm~Bilsen and Goldstein, 1974; Bilsen, 1995!, thepitch of the DRP always corresponds to the pattern of pefound in the central across-frequency scan~i.e., at 0-ms in-ternal delay!. One way in which the correct prediction can bmade consistently is to invoke the principle of centweighting which was incorporated in the weighted versionthe model@Fig. 3~b!#, and might emphasize features whicare located close to the median plane. However, the weiing function does not fulfill this role in the model, since thmodel searches for spectra which are well modulated insense that they have high peak-to-valley ratios~Bilsen,1997!. The central weighting cannot have any effect uppeak-to-valley ratios within a single scan, so an eccenscan is no less likely to display high modulation in this senthan a central one.2 The resulting ambiguity is thought responsible for the fact that the perceived pitch is ‘‘fain~Bilsen, 1995!.
Figure 3 shows that the three versions of the model pduce CAPs which contain broadly similar cues for the DRThe assumption of infinitely high frequency resolutiowhich is inherent in Raatgever and Bilsen’s use of sinusoas an approximation to cross-correlation functions inoriginal version of the model, is not critical for the modelpredict the DRP. This assumption was also found to hlittle influence on predictions of the Fourcin pitch which adiscussed below. In contrast, the original version of the Cmodel predicts both the Huggins pitch and the binaural epitch while the smoothed version does not~Culling et al.,1998!. For simplicity, further illustrations in the present pper of the predictions of the CAP model are based on CAobtained from the original version of the model@as in Fig.3~a!#.
C. The mE-C model
The spectra recovered by the mE-C model in responsthe DRP are irregular noise spectra with no sign of peakmultiples of 250 Hz. There is no evidence that the mEmodel can predict the DRP. This outcome is easy to undstand from the mechanism of the model. The stimulus ctains identical white noise which is interaurally delayed byms. The model can apply internal delays of up to 5 ms befcanceling the signals so the model applies a compensa4-ms internal delay and then cancels the waveforms cpletely.
V. RESULTS OF MODELING THE FP
Before considering the responses of the three modethe Fourcin pitch it is worth considering a representativeof example stimuli on which they may be tested. Therethree interesting dichotomies which divide the possible cfigurations of a two-noise Fourcin pitch:~1! whether or notone of the two noises is interaurally inverted,~2! whether ornot the delay applied to one of the noises lies withinecological range of delays~i.e., 6600ms!, and ~3! in thecase of a stimulus in which one noise is inverted andnoise has a delay within the ecological range, whether thare the same noise or different noises. To explore eacthese dichotomies requires a minimum of five cases~a!–~e!.
3531 J. Acoust. Soc. Am., Vol. 103, No. 6, June 1998
bution subject to ASA license or copyright; see http://acousticalsociety.org/c
ks
lf
t-
e
nice
-.
,se
e
Pe
s
toat
r--
reng-
tot
e-
e
eseof
We have chosen to investigate stimuli for whicht12t2
54 ms; the delays used were either62 ms, or 0 and 4 ms.
A. The rE-C model
Figure 4 shows spectra recovered by the rE-C mofrom the five test stimuli, using the addition~dotted-linespectra! and subtraction~solid-line spectra! operations. Fig-ure 4~a! contains the spectra recovered from a stimulus winteraural delays of62 ms. Figure 4~b! contains the spectrarecovered from the same stimulus, but with one noise phshifted by p radians at one ear. Figure 4~c! contains thespectra recovered from a stimulus with interaural delays oand 4 ms. Figure 4~d! contains the spectra recovered frothe same stimulus, but with the 4-ms-delayed noise phshifted byp radians at one ear. Figure 4~e! shows the spectrafrom the same stimulus, but with the undelayed noiseverted. Bilsen and Wesdorp~1974! found that listeners heaa clear pitch corresponding to a tone, whose frequencyf ,can be predicted using Eq.~1! when one noise is phasshifted, wheretd is the difference in interaural delay between the two noises in milliseconds (t12t2). In the casesshown in Fig. 4~b!, ~d!, and~e!, therefore, a pitch of 250 Hz
FIG. 4. Output spectra produced by the rE-C model when presenteddifferent FP stimuli in subtraction mode~solid lines! and addition mode~dotted lines!. ~a! Two independent noises delayed by62 ms. ~b! Twoindependent noises delayed by62 ms; one noise is also phase shifted at oear byp radians.~c! Two independent noises delayed by 0 and 4 ms.~d!Two independent noises delayed by 0 and 4 ms; one noise is also pshifted at one ear byp radians.~e! Two independent noises delayed byand 4 ms; the first noise is also phase shifted at one ear byp radians. In eachpanel, the different stimuli are signified by schematic illustrations of thcross-correlation functions.
3531Culling et al.: Dichotic pitches. II
ontent/terms. Download to IP: 131.230.73.202 On: Mon, 22 Dec 2014 17:20:29

anub.
Fm
uo
revidrailec
Hles
ip-
nin
itioioini-
thf-eRthh
sc
.thig
n
Aisisatf
ic
d
erebe
io.ra-sther,ore,gionose-
d be
oa-t-cednd
ar-of-inular
theithinted
e-s
he
f in-
llto-to-
-
d
he
Redistri
is heard. When neither noise is phase shifted, BilsenWesdorp~1974! reported that listeners hear an ambiguopitch which is matched to a tone whose frequency canpredicted using Eq.~2!. Thus, the examples shown in Fig4~a! and ~c! would be matched to 204 and 323 Hz:
f 51000/utdu, ~1!
f 51000/utd60.9u. ~2!
The rE-C model does not predict these outcomes.reasons which will be elucidated fully in Sec. V C, an abiguous pitch is predicted fortd54 ms when the spectrumdisplays peaks at odd multiples of 125 Hz. An unambiguopitch is obviously predicted when peaks occur at multiples250 Hz. The vertical dashed lines in Fig. 4 indicate the fquencies at which peaks should appear in order to prothese correct predictions. On this basis, none of the spectFig. 4~a!–~c! reflect the pitches which should be heard, whin Fig. 4~d! and~e!, one of the two spectra show the correpattern while the other does not. Figure 4~a!, which shouldbe ambiguous, has spectra with peaks at multiples of 500and at odd multiples of 250 Hz, rather than at odd multipof 125 Hz. Figure 4~b!, which should be unambiguous, haone featureless spectrum and one with peaks at odd multof 125 Hz rather than multiples of 250 Hz, implying an ambiguous pitch rather then an unambiguous one. Figure 4~c!,which should be ambiguous, shows a featureless patterthe subtraction~solid! spectrum, and an inverted patternthe addition~dotted! spectrum. Figure 4~d!, which should beunambiguous, shows the appropriate pattern in the add~dotted! spectrum, but the inverse pattern in the subtract~solid! spectrum. Figure 4~e! shows the appropriate patternthe subtraction~solid! spectrum, but the inverse in the addtion ~dotted! spectrum. Thus, although each of Fig. 4~d! and~e! is predicted correctly by one or another operation ofrE-C model~with different operations required to predict diferent cases!, it is not clear how the model would select thappropriate operation each time. In the case of the Dwhich was analyzed in Sec. IV A, one could argue thataddition spectrum should be selected because it gives amonic spectrum. If that rule were applied here, the pitcheFig. 4~d! and ~e! would both be unambiguous, because eastimulus generates the option of a harmonic spectrumsummary, therefore, the rE-C model does not predictFourcin pitch, since none of the spectra produced in F4~a!–~c! are correct, although cases~d! and ~e! can be pre-dicted correctly by selecting different operations for differecases.
B. The CAP model
In order to properly assess the performance of the Cmodel in predicting the perception of Fourcin pitches itnecessary to consider in a little more detail the mechanby which scans and features within scans are selected. Rgever and Bilsen~1986! nominated three cues which mighbe used in this process, but did not propose algorithmsevaluating the cues and combining the information whthey provide. The cues are~1! depth of spectral modulationwithin a scan,~2! harmonicity of the peaks within a scan, an
3532 J. Acoust. Soc. Am., Vol. 103, No. 6, June 1998
bution subject to ASA license or copyright; see http://acousticalsociety.org/c
dse
or-
sf-ein
t
zs
les
in
nn
e
Pear-ofhIne.
t
P
mat-
orh
~3! other spectral patterning. We shall confine ourselves hto the first two cues, whose detection and evaluation canimplemented computationally with relative ease.
Depth of modulation is defined as peak-to-valley ratHowever, modulation cannot be calculated simply as thetio of the largest maximum in the function to the smalleminimum; if it were so, then all scans in a Fourcin pitcstimulus would be judged to have equal modulation. Rathpeaks must be compared with adjacent valleys. Furthermthose peaks which are close to the spectral dominance reare assumed to play a greater role in selection than thfurther away~Bilsen, 1997!, so each ratio is weighted according to the function suggested by Raatgever~1980, Eq.IV.1!. Finally, it seems reasonable that themeanweightedpeak-to-valley ratio across all the peaks in the scan shoulthe relevant selection parameter.
It would be a straightforward matter to select a psychcoustically appropriate metric for harmonicity from the lierature. However, as will become clear, the peaks produby the CAP model in response to Fourcin pitch stimuli teeither to be precisely harmonic, or quite inharmonic, sosimple dichotomous distinction will serve the current pupose. It is also unclear how information about degree-harmonicity and depth-of-modulation might be combinedan overall salience measure, but, again, for these particstimuli, no conflict of interpretation turns on this issue.
As a result of these considerations, our modeling ofprocess of selecting scans and of selecting features wscans has the following steps. First, the CAP is generausing Eq. ~3!, where the magnitude of the pattern at frquency f and delayt i is related to the two external delayapplied to the noises in the stimulit1 andt2 . Equation~3! isderived from Raatgever and Bilsen’s~1986! Eq. ~6!, whichgives the CAP for a single noise source, by following tprinciple of superposition~Raatgever, 1980!. Addition orsubtraction is used depending upon whether the noise oteraural delayt2 has been interaurally inverted~subtractionbeing employed in the inverted case!. We have added a smashift parameter,s, that prevents the CAP from evaluatingzero and causing problems when calculating the peakvalley ratio. The results below were produced usings50.01:
CAP~ f ,t i !
5~12s!
321cos~2pt i f 12p f t1!6cos~2pt i f 12p f t2!
41s.
~3!
Each scan~at internal delayt i! is assessed for its modulation index ~mean weighted peak-to-valley ratio!, M , bylocating all then peaks of height,Pj , and valleys of height,Vj , that occur in the range 0–2 kHz@Eq. ~4!#. In Eq. ~4! wj
is the mean weight of thej th peak and valley calculateaccording to Eqs.~5! and~6! from Raatgever~1980!, wherefis the frequency at which the peak or valley is found. Tvalue ofs scales the values ofM ~a quasi-power-law com-
3532Culling et al.: Dichotic pitches. II
ontent/terms. Download to IP: 131.230.73.202 On: Mon, 22 Dec 2014 17:20:29

in
d
le
fiienb
renin
una
sans,
esenncy
.hees,
dichroxi-
ouldngens
-allitch
gu-
s
dsa
d
s o
ural
Redistri
pression!, but does not affect the delays at which maximaM (t i) occur:
M ~t i !5( j 51
n ~Pj /Vj !wj
( j 51n wj
, ~4!
w~ f j !5exp~@ f j /30022#2!, f j,600 Hz, ~5!
w~ f j !5exp~@ f j /60021#2!, f j>600 Hz, ~6!
One or more well-modulated scans are then assessetheir harmonic content. Figure 5 shows the variation ofM asa function of internal delay for each of the five exampstimuli. A number of prominent peaks inM are evidentwhich have been labelled~lower case numerals! for futurereference. Dashed vertical lines have been drawn on theure at6600ms, which represent the approximate boundarof the ecological range of delays. Well-modulated scawhich occur at substantially larger internal delays shouldregarded with some scepticism, as there is no biologicalson for the auditory system to have developed a scanmechanism which operates outside this range.3
Figure 6 shows the central spectra which can be foby scanning at each of the delays which were labelled
FIG. 5. The modulation index,M , as a function of internal delay of scantaken from central activity patterns~CAPs! produced according to Eq.~3!for different FP stimuli.~a! Two independent noises delayed by62 ms. ~b!Two independent noises delayed by62 ms; one noise is also phase shifteat one ear byp radians.~c! Two independent noises delayed by 0 and 4 m~d! Two independent noises delayed by 0 and 4 ms; the second noise isphase-shifted at one ear byp radians.~e! Two independent noises delayeby 0 and 4 ms, the first noise is also phase shifted at one ear byp radians.In each panel, the different stimuli are signified by schematic illustrationtheir cross-correlation functions. Prominent peaks have been markedreference by lower case numerals.
3533 J. Acoust. Soc. Am., Vol. 103, No. 6, June 1998
bution subject to ASA license or copyright; see http://acousticalsociety.org/c
for
g-ssea-g
ds
prominent peaks inM in Fig. 5. Table I gives the frequencieof the most prominent spectral peaks in each of these scalong with the closest fitting fundamental frequency (F0) foreach set. TheF0’s were derived by a weighted least-squarfitting procedure in which the squared difference betweeach peak frequency and the matched harmonic frequewas weighted according to the peak frequency using Eqs~5!and ~6!.4 TheseF0’s are discrepant in many cases with tpitch-matching data collected by Bilsen and his colleaguas summarized by Eqs.~1! and ~2!. As noted above, theexpected pitch from Eq.~1! for Fig. 5~b!, ~d!, and~e! is 250Hz, while those from Eq.~2! for Fig. 5~a! and~c! are 204 and323 Hz. These predictions are correct only in cases~c! and~e!: in case~c! an ambiguous pitch is correctly predictewhose frequency is 336, 297, or 214 Hz, depending on whscan is selected; 336 and 214 Hz may be acceptable appmations to 323 or 204 Hz; in case~e!, an unambiguous pitchof 250 Hz is correctly predicted@Fig. 6~eii!# by the scan atzero delay and it seems reasonable that the other scan shbe neglected since it comes from a delay outside the ra6600ms. In the other cases, the CAP model’s predictioare incorrect: in case~a! a pitch of 500 Hz is strongly predicted by a scan which is both the most modulated ofscans investigated and also perfectly harmonic, but the pshould be ambiguous; in case~b! pitches of 290, 302, and417 Hz are predicted when the pitch should be unambiously 250 Hz; similarly in case~d!, pitches of 290, 248, and
.lso
ffor
FIG. 6. Across-frequency scans from the CAP at each of the interadelays marked in Fig. 5~i–iii !, for each of the five example stimuli~a!–~e!.The scans have been weighted according to Eq.~5! in order to emphasizethe features within the dominance region.
3533Culling et al.: Dichotic pitches. II
ontent/terms. Download to IP: 131.230.73.202 On: Mon, 22 Dec 2014 17:20:29

he fivepeaks
ll cases,
3534 J. Acoust. S
Redistribution subject to ASA
TABLE I. The frequencies at which prominent peaks occur in the best modulated scans for each of texample Fourcin pitch stimuli. The frequencies are derived from the unweighted scans, but only thosewhich show prominently in the panels of Fig. 6~showing the weighted scans! are listed. In the two casesindicated in the penultimate column, the frequencies of the peaks form a perfect harmonic series. For athe closest fittingF0’s, according to a weighted least-squares metric, are given in the last column.
Panel ofFig. 6
t1
~ms!t2
~ms! Inverted?t i
~ms!Peak 1~Hz!
Peak 2~Hz!
Peak 3~Hz!
Peak 4~Hz!
Peak 5~Hz! Harmonic?
ClosestF0 ~Hz!
ai! 22000 2000 n 0 500 1000 1500 y 500aii! 2500 432 768 1232 1568 n 396aiii! 1500 432 768 1232 1568 n 396
bi! 22000 2000 y 2650 158 596 912 1349 n 290bii! 2300 630 1118 n 302biii ! 400 386 864 n 417
ci! 0 4000 n 21000 317 683 1000 n 336cii! 2650 290 591 900 1203 n 297ciii ! 650 425 643 862 1080 1294 n 214
di! 0 4000 y 21350 158 596 912 1349 n 290dii! 2800 460 790 1102 n 248diii ! 800 307 518 732 943 1149 n 178
ei! 4000 0 y 21150 363 679 1076 n 346eii! 0 250 500 750 1000 1250 y 250
. I
enec
r
pra,edditces
ath
dzei
ze
e
-be
ral
ise
t FPus-
178 Hz are predicted when the pitch should be 250 Hzthis last case, the correct pitch is among those predictedthe model, but unlike case~e!, there is no reason to believthat the 250-Hz pitch should be preferred over the altertives, as the scans containing each pitch lie outside thelogical range. The CAP model can account for cases~c! and~e!, but it is clearly in error when compared with Eqs.~1! and~2! in cases~a!, ~b!, and~d!.
In summary, the CAP model fails to predict the FP corectly in an important set of cases. Raatgever~1980! hasshown that some stimulus configurations produce approate results and the CAP model can also predict the lateization of the pitch for these stimuli~Raatgever and Bilsen1986!. However, our more systematic exploration yieldclearly erroneous predictions. Interestingly, both here anRaatgever’s treatment, the model predicts the Fourcin pfor stimulus configurations in which one of the two noishas a small delay~i.e., within the ecological range! relativelywell. We have shown here that when the delays are equalopposite, and thus both outside the ecological range,CAP model is clearly at odds with Eqs.~1! and ~2!, and theextensive empirical data on which they are based~Bilsen,1997, Fig. 5!.
C. The mE-C model
Figure 7 contains spectra recovered by the mE-C moin response to the same five FP stimuli which were analyby the other two models. The predictions are consistent wthe pitches heard in these stimuli, which were summariby formulas suggested by Bilsen and Wesdorp~1974!. Psy-chophysically, cases~b!, ~d!, and ~e! yield unambiguouspitches of 250 Hz. Correspondingly, Fig. 7~b!, ~d!, and ~e!contains peaks at integer multiples of 250 Hz, consistwith an unambiguous pitch of 1000/(td) Hz; i.e., 250 Hz inthe case where the interaural delays are62 ms. Psycho-
oc. Am., Vol. 103, No. 6, June 1998
license or copyright; see http://acousticalsociety.org/c
nby
a-o-
-
ri-l-
inh
nde
eld
thd
nt
physically, cases~a! and ~c! yields ambiguous pitches. According to Bilsen and Wesdorp the pitches should1000/(td60.9) Hz or 204 and 323 Hz, where the interaudelays are62 ms. Figure 7~a! and ~c! shows dips at mul-tiples of 250 Hz. This pattern might be expected to give r
FIG. 7. Spectra recovered by the mE-C model in response to differenstimuli. On each panel, the different stimuli are signified by schematic illtrations of their cross-correlation functions.
3534Culling et al.: Dichotic pitches. II
ontent/terms. Download to IP: 131.230.73.202 On: Mon, 22 Dec 2014 17:20:29

oais
ea-eb
areesoorntau
ld
anlaoe
ththnoichio
cy-
iveion
dorfnot
E-Cbyn-tingthepe-
n’susendthen-
ple
ec-
bener-knig-
itch
ncytedof
the
norischal
eafiv5cl
ratedma-ve-
cor-
Redistri
to an unambiguous pitch with a fundamental frequency125 Hz, represented by odd-numbered harmonics. Thebiguity which is heard by listeners can be explained if itassumed that the first harmonic is inaudible or is very wand that de Boer’s~1956, 1976! rule can, therefore, be applied to the remaining components. This assumption is rsonable given the weakness of binaural masking releaselow about 200 Hz. de Boer’s rule states that the pitch ofinharmonic series will correspond to the fundamental fquency whoseconsecutiveharmonic frequencies best fit thfrequencies in the stimulus. Figure 8 compares the resultsuch a fitting process, using a weighted, least-squares prdure, with the predictions of the Bilsen and Wesdorp fmula. Harmonics 1–5 and 2–6 of an adjustable fundamefrequency were fitted to the frequencies of the first fivedible peaks in the [email protected]., odd harmonics 3–11 of 1/(2td)#.The two fits, matching to different sets of harmonics, yietwo points at each value oft1 . The ordinate of Fig. 8 is thereciprocal of the fitted fundamental, because the figuredesigned for comparison with Fig. 5 of Bilsen~1977!.
Bilsen’s figure shows matches between various FPsmonaural repetition pitches generated with interaural de(tm); that data was used to derive the Bilsen and Wesdformula. For simplicity, only the results of modeling a subsof the data in Bilsen’s figure are shown in Fig. 8, but bothpredictions of the Bilsen and Wesdorp formula and ofpresent fitting process can be extended to the other cotions in Bilsen’s figure by horizontal translation. Twweighting functions were used in the fitting process wh~1! weighted the input frequencies according to the variat
FIG. 8. Predictions of the ambiguous pitches of the FP stimuli which dohave any interaural phase inversion. The figure is designed for compawith Bilsen ~1977, Fig. 5!, and consequently shows the period of the mating fundamental frequency on the ordinate. Predictions from the empiricderived Bilsen and Wesdorp formula@Eqs.~1! and~2!#, which represent theobserved data, are shown as filled circles. Predictions from a simple lsquares fitting procedure which matched the frequencies of the firstaudible components produced by the mE-C model to the harmonics 1–2–6 of an adjustable fundamental frequency are shown as open cirPredictions from a similar, but weighted, fit~see text! are shown as opendiamonds.
3535 J. Acoust. Soc. Am., Vol. 103, No. 6, June 1998
bution subject to ASA license or copyright; see http://acousticalsociety.org/c
fm-
k
a-e-
n-
ofce--al-
is
dy
rpteedi-
n
in the strength of binaural masking release with frequen@Eqs.~5! and ~6!# and ~2! weighted the fitted harmonics according to harmonic number in order to reflect the relatdominance of low-numbered harmonics in pitch percept~Ritsma, 1967! using the formula suggested by Cohenet al.@1995, Eq.~9!#. Each of these weighting functions improvethe quality of the fit~compare open circles and diamonds fthe combined effect!. The quality of fit was also poorer ifewer than five components were compared, but didchange if more components were compared.
Further evidence that the spectra produced by the mmodel predict listeners’ percepts correctly is providedFourcin’s ~1958! pitch-matching data. Fourcin asked listeers to match the FP to the pitch of a pure tone by adjusthe magnitude of one of the two delays. He found thatmatching difference in delays was always related to theriod of the tone by a simple-number ratio. The majority5 ofFourcin’s data can be reconciled with those from Bilsegroup if one assumes that Fourcin’s listeners, cued by theof a pure-tone comparison stimulus, listened analytically amatched the frequency of the second spectral peak inrecovered spectrum to that of the tone, while Bilsen’s listeers, cued by the use of a comparison stimulus with multispectral peaks~the monaural repetition pitch!, listened syn-thetically and matched the pitch of the whole recovered sptrum.
The action of the mE-C model in this context maybetter understood by looking at a cross-correlogram geated ~as in the mE-C model! using a gammatone filterbanand hair cell model, but then following it by cross correlatioof corresponding frequency channels from the two ears. Fure 9 shows such a cross correlogram for a Fourcin pstimulus generated using delays of62 ms with inversion ofone noise at one ear. The pattern clearly shows frequeregions where the cross-correlation function is modulaand those where it is nearly flat, the latter being bandsdecorrelation. These bands of decorrelation give rise to
ton-ly
st-eor
es.
FIG. 9. Cross correlogram of a Fourcin pitch stimulus with delays of62 msand inversion of one noise at one ear. The cross correlogram was geneby passing the left- and right-channel waveforms through a pair of gamtone filterbanks, with frequency channels 25 Hz apart. The filtered waforms were processed by the Meddis~1986, 1988! hair cell model and thenwaveforms from corresponding channels from left and right were crossrelated over and exponentially tapering window~time constant 50 ms!.
3535Culling et al.: Dichotic pitches. II
ontent/terms. Download to IP: 131.230.73.202 On: Mon, 22 Dec 2014 17:20:29

arE-tth.eeis
enineon
aict ts
ysthonp
beth
min
pif-f
twa
so
of
ear.e
g
n.el-
ant
r-
qs.
ill,ithinof
ual-meen
of
nighh
ed
o-ths
Redistri
perception of the frequency components which are hetogether, as the pitch. In other frequency bands, the mmodel finds delays at which the cross correlation is amaximum and is able, using those delays, to equalizewaveforms to some extent and so to partially cancel themthe decorrelated bands this process is impossible, becauswaveforms are dissimilar at all delays. Notice that in ordfor the model to cancel all the frequency bands which dplay correlation, different delays must be used at differfrequencies. This feature of the mE-C model, originallycluded in order to account for the masking release of spein the NpSo condition, is essential to the correct predictiof the Fourcin pitch.
D. Mathematical analysis
The scope of the mE-C model can be generalized tostimulus configurations by considering the process whgives rise to these results. It should be emphasized thaanalysis that follows is not a detailed mathematical analyof the computational model described above; the analtakes account of only the most essential features ofmodel, optimal delay and cancellation. This simplificatican be justified on the grounds that we have found theripheral nonlinearities of the Meddis hair cell model tosuperfluous to the prediction of the Fourcin pitch usingcomputational model.
The stimuli are filtered by the peripheral auditory systeinto narrow frequency bands within which the two noisesa FP stimulus interact. Each channel admits a small grousinusoidal components of similar frequency but widely dfering amplitudes and phases. At each ear, and at eachquency, corresponding sinusoidal components from thenoises summate vectorially. The resultant componentsillustrated in Fig. 10 here:t1 andt2 are the interaural delayof the two noises;f is the difference in the phase of the twsources at the left ear, ranging from 0 to 2p at frequency,f ;b andc are the amplitudes, from a Rayleigh distribution,the two sources at frequency,f ; andu is 0 orp depending on
FIG. 10. Vector diagrams illustrating the vector summation of componefrom each of the two noises in a Fourcin pitch stimulus at the left and rears. The amplitudes of these two components,b andc, are the same at eacear. The phases of the two components~at source! differ by f. The noisesare interaurally delayed byt1 andt2 , and the second noise is phase shiftby u at the right ear. The resultant amplitudes,aL andaR , and the resultantphase difference,CR12p f t12CL , can be derived using the sine and csine rules~see text!. For completeness, the other angles have been givenusual labels for the vertices of a triangle when describing the sine and corules.
3536 J. Acoust. Soc. Am., Vol. 103, No. 6, June 1998
bution subject to ASA license or copyright; see http://acousticalsociety.org/c
d,Cae
Inther-t
-ch
llhheisisat
e-
e
of
re-ore
whether or not one noise source has been inverted at oneEquations~7! and ~8! specify the signal at each ear, at onfrequency. HereL(t) andR(t) are the signals at each ear:
L~ t !5aL sin~2p f t1CL!, ~7!
R~ t !5aR sin~2p f ~ t1t1!1CR!. ~8!
From Fig. 10, Eqs.~7! and ~8! can be expanded, usinthe sine and cosine rules:
L~ t !5Ab21c212bc cos~f!
3sinS 2p f t1sin21F c sin~f!
Ab21c212bc cos~f!G D ,
~9!
R~ t !5Ab21c212bc cos~f12p f @t22t1#1u!
3sinS 2p f ~ t1t1!1sin21
3F c sin~f12p f @t22t1#1u!
Ab21c212bc cos~f12p f @t22t1#1u!G D .
~10!
The model applies an internal delay,t i , to these twosignals in order to align the sinusoids at each ear~say delay-ing R relative to L! and also an amplitude compensatioEach channel will admit many such sinusoids, so for canclation to be effective, the required internal delay,t i , and theinteraural difference in amplitude must be relatively constacross all frequencies within the channel.
Consider first the equalization of amplitude. The inteaural difference in amplitude,Damp, at a given frequencymay be calculated by subtracting the amplitude parts of E~9! and ~10!:
Damp5Ab21c212bc cos~f!
2Ab21c212bc cos~f12p f @t22t1#1u!.
~11!
Since f will be uniformly distributed within a givenfrequency band, the differences in resultant amplitudes win most cases, also be random across the frequencies wthat channel. Thus, the interaural differences in amplitudethe component frequencies within a channel cannot be eqized simultaneously, guaranteeing that there will be soresidue after cancellation. However, it may readily be sefrom Eq.~11! that, for certain values oft1 , t2 , andf , Damp,will evaluate to zero for allf, all b, and all c. When u5p, Damp50, for integersN, where
f 5~2N11!/~2@t22t1# !. ~12!
Also, whenu50, Damp50 for all f, where
f 5N/@t22t1#. ~13!
In fact, the variance ofDamp, averaged over allf ~0–2p!, is a cyclic function off , which is zero where Eqs.~12!and ~13! are satisfied and maximal at intermediate valuesf . To derive the frequencies at whichDamp is maximally
tst
eine
3536Culling et al.: Dichotic pitches. II
ontent/terms. Download to IP: 131.230.73.202 On: Mon, 22 Dec 2014 17:20:29

i-
aadg-
c
la-cr
s
und
re
es
n-le
tua
aelnuwwl her
rey
silto
entore
oc-ratec-st,
tputelyay
ismAP
theug-
untand
tedce
odeltheto
cypli-ittleerethedis-y and. Insedand
t tohech
aly-n,
ter-elrean-
CAPited
the
f theRPof
Redistri
variable, therefore, the roles of Eqs.~12! and ~13! may bereversed; Eq.~12! gives the frequencies of maximum varability in Damp when neither noise is inverted and Eq.~13!gives the frequencies of maximum variability inDamp whenone noise is inverted. Near the minima of the functioncomponents are roughly equal in amplitude at each earso it may be possible to cancel them without any amplituequalization, but at the maxima, the components enterinfrequency channel will have widely differing interaural amplitude ratios and so cannot be cancelled. Hence, thesethe same frequencies which give peaks in the residual avation produced by the mE-C model~e.g., Fig. 7!.
Next, considering the equalization of delay, a simipattern is found. Equations~9! and ~10! can be used to determine the internal delay at which cancellation takes plaThis internal delay depends upon the phase of the sine teof Eqs.~9! and ~10!. The optimum delay for cancellation irelated to the interaural phase difference,Dphase, which isgiven by
Dphase5sin21F c sin~f!
Ab21c212bc cos~f!G22p f t1
2sin21F c sin~f12p f @t22t1#1u!
Ab21c212bc cos~f12p f @t22t1#1u!G .
~14!
From these equations, it can be seen that the optiminternal delay for cancellation of a single frequency depeupon the two interaural delays,t1 andt2 , the amplitudes,band c, the interaural phase difference,f, and upon fre-quency, f . However, as with amplitude equalization, theare certain frequencies at which the values ofb, c, and fhave no effect onDphase. These are the same frequenciwhich give zero interaural amplitude differences@Eqs. ~12!and ~13!#. Furthermore, within an auditory frequency chanel there will be limited variation inf , so the same internadelay should suffice for all frequencies within the channSo, the same frequencies which have no interaural amplidifferences also have interaural phase differences whichindependent of the random features of the two noises,are therefore consistent across a given frequency chann
Thus, the mE-C model always predicts that when onoise is inverted, a pitch will be heard whose period is eqto the difference in the interaural delays applied to the tnoises, and that when neither noise is inverted the pitchbe related to an odd-harmonic series, whose fundamentaa period which is half the difference between the two intaural delays.
VI. DISCUSSION
This paper has considered the respects in which thmodels can account for the occurrence and the frequenctwo dichotic pitches: the dichotic repetition pitch~Bilsen andGoldstein, 1974! and the Fourcin pitch~Fourcin, 1970! ~Fig.1!. It was noted in the Introduction that the FP is heard eaby the majority of listeners, while the DRP is more difficuto hear. Accordingly, it would be desirable for a model,
3537 J. Acoust. Soc. Am., Vol. 103, No. 6, June 1998
bution subject to ASA license or copyright; see http://acousticalsociety.org/c
llndea
areti-
r
e.ms
ms
l.dere
nd.ealoillas-
eof
ly
r
models, to predict that the FP is produced by a differmechanism from the DRP, and that the FP is generally msalient.
The rE-C model makes accurate predictions of thecurrence and frequency of the DRP, but makes inaccupredictions of the FP. Similarly, the CAP model makes acurate predictions of the DRP, but not of the FP. In contrathe mE-C model accounts for the FP, but produces no oufor a DRP stimulus. Thus, none of the models accuratpredict both pitches, suggesting that the FP and DRP mdepend on different mechanisms, with the mE-C mechanaccounting for the FP and either the rE-C and/or Cmechanisms accounting for the DRP.
The mE-C model accounts for the FP, as shown inpresent paper, and for two other dichotic pitches, the Hgins pitch~HP! ~Cramer and Huggins, 1958! and the binauraledge pitch~BEP! ~Klein and Hartmann, 1981!, as shown in acompanion paper~Culling et al., 1997!. Overall, the mE-Cmodel provides a more accurate and straightforward accoof the detection and perceived frequency of the FP, HP,BEP than do other models.
It is less obvious whether the DRP should be attributo the rE-C or the CAP mechanisms. There is little differenbetween the output spectrum generated by the rE-C mperforming addition and an across-frequency scan fromCAP taken at 0-ms internal delay. The first correspondsthe addition of the waveforms in corresponding frequenchannels from the two ears, and the second to their multication. In a compressive nonlinear system, there may be lpractical difference between the two results. However, thare some grounds for favoring the CAP model. AlthoughrE-C model directly generates an output spectrum whichplays evidence of the DRP, it is, as its name implies, onlpartial implementation of equalization-cancellation, awould have no major role beyond accounting for the DRPcomparison, an attraction of the CAP model is that it is baon well-established mechanisms of sound localizationbinaural masking release~Colburn and Durlach, 1978!.
Across-frequency scanning is more or less equivalenacross-frequency grouping by common interaural delay. TmE-C model was designed partly on the principle that suacross-frequency grouping does not occur in binaural ansis ~Culling and Summerfield, 1995; Hukin and Darwi1995; Darwin and Hukin, 1997!. The model consequentlyanalyzes each channel independently of all others. It is inesting to note that without this feature the mE-C modwould not predict the FP correctly, so its success in this aprovides an independent verification of the principle of chanel independence. On the other hand, the success of themodel in accounting for the DRP suggests that some limacross-frequency scanning does occur. Yet, the ridges inCAP for DRP stimuli are clear~e.g., Fig. 3! and should beeasily extracted by a scanning process. The weakness opitch sensation which most listeners experience in a Dstimulus is, therefore, a testament to the limited efficiencyacross-frequency scanning.
3537Culling et al.: Dichotic pitches. II
ontent/terms. Download to IP: 131.230.73.202 On: Mon, 22 Dec 2014 17:20:29

e:-aainndol’ssee
othe
asegicef
trod
a
corgte
beynoEqfitn
sin
ine
ggcin
th
k
co
d
c-
ut
r-
-dis-
-
.
’’
-mon
in-
-m-
-
l-
,’’
-a
.
s in
e
r
st.
perR.E,
e
t
Redistri
ACKNOWLEDGMENTS
The authors would like to thank the following peoplAlain de Cheveigne´ and Adrian Fourcin for helpful comments on previous versions of this manuscript; Johann Rgever, Frans Bilsen, and Julius Goldstein for respondhelpfully to our enquiries about the workings of the CAP arE-C models; Chris Darwin for recommending the useweighting functions to improve the fit between the modepredictions of pitch matches and those observed by Biland Wesdorp; and Frans Bilsen and Bill Hartmann for ththorough and thoughtful reviews.
1The rms levels from left- and right-ear channels are calculated andwaveform is scaled so that the rms will be the same as that of the oDifferent delays are then tested using this fixed level adjustment.
2There has to be a limit to the range internal delays at which scans are mHowever, no explicit specification for the model has been given. Bil~1997! agrees with the current authors that scans well outside the ecolorange ('6600ms) should be neglected. The exact limit has materialfects on the predictions of the model.
3It is an empirical fact that neural units with large characteristic delays@upto 61/(2 f )# exist in the mid-brain~e.g., McAlpineet al., 1996, Fig. 6B!.Possibly, the developing auditory system may have little precise conover the delays which are implemented. However, across-frequency mlike the CAP model require that such units are connected in a systemway to units in higher centers~i.e., information from units with differentcharacteristic frequencies but the same characteristic delays must bebined!. It is difficult to see how such systematic connections across lainteraural delays could arise in development or evolution when the sysis never exposed to broadband sounds with such large delays.
4The fitting procedure minimized the squared difference in frequencytween all peaks in the scan and a series of consecutive harmonics bjusting theF0 of the harmonic series. All peaks in the scan were used,just those listed in Table I, but each peak was weighted according to~5! and~6!, so that the other peaks will have played a minor role in theThe height of the peak and the depth of the adjacent valleys wereconsidered in this process. The best fits were invariably obtained uharmonic series which began with the 1st harmonic.
5Fourcin~1958! summarized the results of his pitch matching data as giv1/td52/3f and 1/td51/2 f , where f is the frequency of the tone for thuninverted and inverted cases, respectively. Fourcin~1970! summarized thesame matches as 1/td52/3f and 1/td51/2 f . The raw data on which boththese summaries were based showed a mixture of the two patterns, suing the occurrence of octave errors. The differences between Foursummaries reflect alternative ways in which he attempted to correctoctave errors. However, the majority of matches fit the 1/td52/3f and1/td51/2 f lines, which are consistent with matches to the second peathe mE-C model’s recovered spectrum. The matches fitting 1/td5 f are alsoconsistent with the mE-C model as matches to the first peak in the reered spectrum. Only the matches fitting 1/td54/3f must, according to themE-C model, be interpreted as octave errors.
Bilsen, F. A. ~1966!. ‘‘Repetition pitch: monaural interaction of a sounwith the repetition of the same, but phase-shifted sound,’’ Acustica17,295–300.
Bilsen, F. A. ~1977!. ‘‘Pitch of noise signals: Evidence for a central spetrum,’’ J. Acoust. Soc. Am.61, 150–161.
Bilsen, F. A. ~1995!. ‘‘What do dichotic pitch phenomena tell us abohearing?,’’ inAdvances in Hearing Research,edited by G. A. Manley, G.M. Klump, C. Koppl, H. Fastl, and H. Oeckinghaus~World Scientific,Singapore!.
Bilsen, F. A.~1997!. Personal communication.Bilsen, F. A., and Goldstein, J. L.~1974!. ‘‘Pitch of dichotically delayed
noise and its possible spectral basis,’’ J. Acoust. Soc. Am.55, 292–296.Bilsen, F. A., and Wesdorp, C.~1974!. ‘‘Dichotic pitch phenomena and thei
common spectral basis,’’ inProceedings of the Eighth International Congress on Acoustics~Goldcrest, London!.
Cohen, M. A., Grossberg, S., and Wyse, L. L.~1995!. ‘‘A spectral networkmodel of speech perception,’’ J. Acoust. Soc. Am.98, 862–879.
3538 J. Acoust. Soc. Am., Vol. 103, No. 6, June 1998
bution subject to ASA license or copyright; see http://acousticalsociety.org/c
t-g
f
nir
ner.
de.nal
-
olelstic
m-em
-ad-ts..otg
g
est-’se
in
v-
Colburn, H. S.~1973!. ‘‘Theory of binaural interaction based on auditorynerve data. I. General strategy and preliminary results on interauralcrimination,’’ J. Acoust. Soc. Am.54, 1458–1470.
Colburn, H. S.~1977!. ‘‘Theory of binaural interaction based on auditorynerve data. II. Detection of tones in noise,’’ J. Acoust. Soc. Am.61,525–533.
Colburn, H. S., and Durlach, N. I.~1978!. ‘‘Models of binaural interaction,’’in Handbook of Perception, Vol. IV, edited by E. C. Carterette and PMorton ~Academic, New York!, pp. 467–518.
Cramer, E. M., and Huggins, W. H.~1958!. ‘‘Creation of pitch throughbinaural interaction,’’ J. Acoust. Soc. Am.30, 858–866.
Culling, J. F.~1996!. ‘‘Dichotic pitches as illusions of binaural unmasking,J. Acoust. Soc. Am.99, 2515.
Culling, J. F., and Summerfield, Q.~1995!. ‘‘Perceptual separation of concurrent speech sounds: absence of across-frequency grouping by cominteraural delay,’’ J. Acoust. Soc. Am.98, 785–797.
Culling, J. F., Summerfield, Q., and Marshall, D. H.~1998!. ‘‘Dichoticpitches as illusions of binaural unmasking I: Huggins’ pitch and the baural edge pitch,’’ J. Acoust. Soc. Am.103, 3509–3526.
Darwin, C. J., and Hukin, R. W.~1997!. ‘‘Perceptual segregation of a harmonic from a vowel by interaural time difference and frequency proxiity,’’ J. Acoust. Soc. Am.102, 2316–2324.
de Boer, E.~1956!. ‘‘On the ‘Residue’ in Hearing’’~doctoral dissertation,Amsterdam!.
de Boer, E.~1976!. ‘‘On the ‘Residue’ in Auditory Pitch Perception,’’ inHandbook of Sensory Physiology Vol. 3,edited by W. D. Keindel and W.D. Neff, pp. 479–584.
Durlach, N. I.~1960!. ‘‘Note on the equalization-cancellation theory of binaural masking level differences,’’ J. Acoust. Soc. Am.32, 1075–1076.
Durlach, N. I.~1972!. ‘‘Binaural signal detection: Equalization and cancelation theory,’’ in Foundations of Modern Auditory Theory, Vol. II,editedby J. V. Tobias~Academic, New York!.
Fourcin, A. J.~1958!. ‘‘Speech perception and bandwidth compressionS.R.D.E. report #1126.
Fourcin, A. J.~1970!. ‘‘Central pitch and auditory lateralization,’’ inFre-quency Analysis and Periodicity Detection in Hearing, edited by R. Plompand G. F. Smoorenburg~Sijthoff, The Netherlands!.
Fourcin, A. J.~1995!. Personal communication.Hukin, R. W., and Darwin, C. J.~1995!. ‘‘Effects of contralateral presenta
tion and of interaural time differences in segregating a harmonic fromvowel,’’ J. Acoust. Soc. Am.98, 1380–1387.
Jeffress, L. A.~1948!. ‘‘A place theory of sound localization,’’ J. CompPhysiol. Psychol.61, 468–486.
Jeffress, L. A.~1972!. ‘‘Binaural signal detection: vector theory,’’ inFoun-dations of Modern Auditory Theory, Vol. II, edited by J. V. Tobias~Aca-demic, New York!.
Killion, M. C., Wilber, L. A., and Gudmundsen, M. A.~1985!. ‘‘Insertearphones for more interaural attenuation,’’ Hearing Instruments36, 34–36.
Klein, M. A., and Hartmann, W. M.~1981!. ‘‘Binaural edge pitch,’’ J.Acoust. Soc. Am.70, 51–61.
McAlpine, D., Jiang, D., and Palmer, A. R.~1996!. ‘‘Interaural delay sen-sitivity and the classification of low best-frequency binaural responsethe inferior colliculus of the guinea pig,’’ Hearing Res.97, 136–152.
Meddis, R.~1986!. ‘‘Simulation of mechanical to neural transduction in thauditory receptor,’’ J. Acoust. Soc. Am.79, 702–711.
Meddis, R. ~1988!. ‘‘Simulation of auditory-neural transduction: furthestudies,’’ J. Acoust. Soc. Am.83, 1056–1063.
Moore, B. C. J., and Glasberg, B. R.~1983!. ‘‘Suggested formulae for cal-culating auditory-filter bandwidths and excitation patterns,’’ J. AcouSoc. Am.74, 750–753.
Patterson, R. D.~1976!. ‘‘Auditory filter shapes derived with noise stimuli,’’J. Acoust. Soc. Am.59, 640–654.
Patterson, R. D., Nimmo-Smith, I., Holdsworth, J., and Rice, P.~1987!. ‘‘Anefficient auditory filterbank based on the gammatone function,’’ papresented to the I.O.C. speech group on auditory modelling at R.S.December 14–15.
Patterson, R. D., Nimmo-Smith, I., Holdsworth, J., and Rice, P.~1988!.‘‘Spiral VOS final report, Part A: The auditory filter bank,’’ CambridgElectronic Design, Contract Report~A.P.U. 2341!.
Raatgever, J.~1980!. ‘‘On the Binaural Processing of Stimuli with DifferenInteraural Phase Relations,’’ doctoral dissertation, Delft University.
Raatgever, J., and Bilsen, F. A.~1977!. ‘‘Lateralization and dichotic pitch as
3538Culling et al.: Dichotic pitches. II
ontent/terms. Download to IP: 131.230.73.202 On: Mon, 22 Dec 2014 17:20:29

y of
Redistri
a result of spectral pattern recognition,’’ inPsychophysics and Physiologof Hearing, edited by E. F. Evans and J. P. Wilson~Academic, London!.
Raatgever, J., and Bilsen, F. A.~1986!. ‘‘A central theory of binaural pro-cessing. Evidence from dichotic pitch,’’ J. Acoust. Soc. Am.80, 429–441.
3539 J. Acoust. Soc. Am., Vol. 103, No. 6, June 1998
bution subject to ASA license or copyright; see http://acousticalsociety.org/c
Ritsma, R.~1967!. ‘‘Frequencies dominant in the perception of the pitchcomplex sounds,’’ J. Acoust. Soc. Am.42, 191–198.
Zwicker, E., and Feldkeller, R.~1967!. Das Ohr als Nachrichtenempfa¨nger~Hirzel, Stuttart, Germany!, 2nd ed.
3539Culling et al.: Dichotic pitches. II
ontent/terms. Download to IP: 131.230.73.202 On: Mon, 22 Dec 2014 17:20:29