dicin paper erie - iza institute of labor economicsftp.iza.org/dp11245.pdfdicin paper erie iza dp...
TRANSCRIPT

DISCUSSION PAPER SERIES
IZA DP No. 11245
Ahmed ElsayedJackline Wahba
Political Change and Informality: Evidence from the Arab Spring
DECEMBER 2017
Any opinions expressed in this paper are those of the author(s) and not those of IZA. Research published in this series may include views on policy, but IZA takes no institutional policy positions. The IZA research network is committed to the IZA Guiding Principles of Research Integrity.The IZA Institute of Labor Economics is an independent economic research institute that conducts research in labor economics and offers evidence-based policy advice on labor market issues. Supported by the Deutsche Post Foundation, IZA runs the world’s largest network of economists, whose research aims to provide answers to the global labor market challenges of our time. Our key objective is to build bridges between academic research, policymakers and society.IZA Discussion Papers often represent preliminary work and are circulated to encourage discussion. Citation of such a paper should account for its provisional character. A revised version may be available directly from the author.
Schaumburg-Lippe-Straße 5–953113 Bonn, Germany
Phone: +49-228-3894-0Email: [email protected] www.iza.org
IZA – Institute of Labor Economics
DISCUSSION PAPER SERIES
IZA DP No. 11245
Political Change and Informality: Evidence from the Arab Spring
DECEMBER 2017
Ahmed ElsayedIZA
Jackline WahbaUniversity of Southampton and IZA
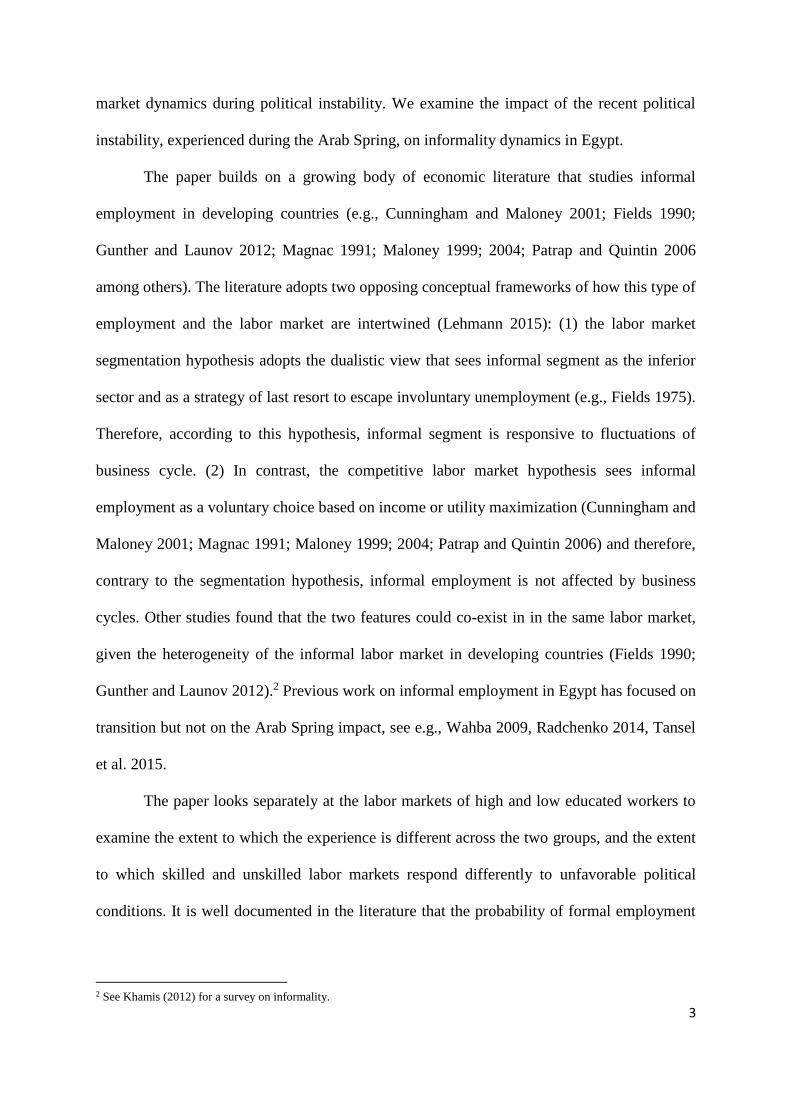
ABSTRACT
IZA DP No. 11245 DECEMBER 2017
Political Change and Informality: Evidence from the Arab Spring1
This paper examines informality during the political and economic turmoil that accompanied
the Arab Spring revolution in Egypt. The paper focuses on unprotected employment and
the extent to which it changed by educational level right after the January Uprising of 2011.
We find that over time and particularly after the revolution, informal employment has
increased for both high- and low-educated workers however, through different paths: high
educated were more likely to be stuck in informality, whilst low-educated formal workers
were more likely to lose their contracts. The results suggest a high level of rigidity in the
Egyptian labor market even in the wake of the Arab Spring.
JEL Classification: J21, J23, J24, J31, O17
Keywords: informal employment, job contracts, Arab Spring
Corresponding author:Ahmed ElsayedIZASchaumburg-Lippe-Strasse 5-953113 BonnGermany
E-mail: [email protected]
1 Financial support from the Economic Research Forum (ERF) is gratefully acknowledged. The authors acknowledge
the comments and suggestions of Ragui Assaad, Gary Fields, Hartmut Lehmann, Mark Rosenzweig, Anzelika Zaiceva,
as well as participants of the 2015 ERF Workshop on Labor Market Dynamics in MENA, Cairo, Egypt, and the 2016
IZA/OECD/World Bank/UCW Workshop: Job Quality in Post-transition, Emerging and Developing Countries, Rome,
Italy.

2
1. Introduction
The Arab Spring in 2011 was perceived by many as an opportunity for change, a revolution
against lack of good job opportunities, lack of economic and social justice and rising corruption.
In particular, for many young people they felt excluded in accessing decent jobs and future
higher living standards. Many workers have had to rely on low quality jobs in the informal
sector to earn their living, with no job contracts and little stability and security. At the same
time, without a job contract workers do not benefit from social security coverage as well as
other rights and benefits such as paid holidays and health insurance and with little chance of
moving to formal employment as those jobs have become scarcer.
We focus on the case of Egypt, where the aftermath of the 2011 Uprising is still ongoing.
We aim to examine the effects of the Arab Spring on informality in the Egyptian labor market.
We study the immediate/short-term impact in the wake of the Arab Spring, but also provide
evidence on the development of informal employment over the previous two decades which
has been on the rise absorbing substantial number of workers in the Egyptian labor market.
We ask to what extent informal employment cushioned workers during the political
turmoil in Egypt. The previous literature shows that informality increases during economic
slowdowns and business cycles (e.g., Elbahnasawy et al. 2016; Fiess et al. 2010), however, no
much evidence exists on the responsiveness of labor informality to political turmoil. Political
instability usually results in decline in physical and human capital investments, and therefore,
leads to slowdown in economic growth, see for example, Aisen and Veiga 2013; Alesina and
Perotti 1996. On one hand, informal employment could act as a buffer during downturns when
people are laid off or looking for new jobs. However, given the rigidity of the Egyptian labor
market, see Assaad (2014), whether informal employment absorb shed workers or shed
workers itself is an empirical question. Thus, our paper is among the first that examine labor
3
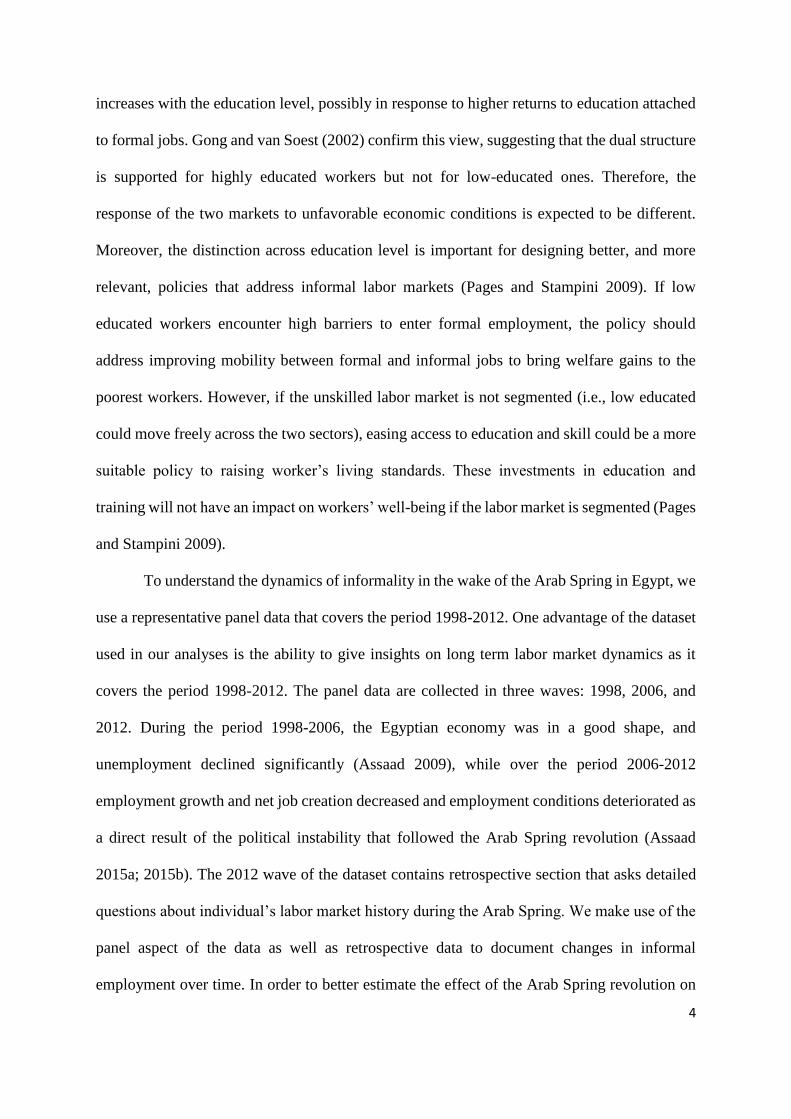
market dynamics during political instability. We examine the impact of the recent political
instability, experienced during the Arab Spring, on informality dynamics in Egypt.
The paper builds on a growing body of economic literature that studies informal
employment in developing countries (e.g., Cunningham and Maloney 2001; Fields 1990;
Gunther and Launov 2012; Magnac 1991; Maloney 1999; 2004; Patrap and Quintin 2006
among others). The literature adopts two opposing conceptual frameworks of how this type of
employment and the labor market are intertwined (Lehmann 2015): (1) the labor market
segmentation hypothesis adopts the dualistic view that sees informal segment as the inferior
sector and as a strategy of last resort to escape involuntary unemployment (e.g., Fields 1975).
Therefore, according to this hypothesis, informal segment is responsive to fluctuations of
business cycle. (2) In contrast, the competitive labor market hypothesis sees informal
employment as a voluntary choice based on income or utility maximization (Cunningham and
Maloney 2001; Magnac 1991; Maloney 1999; 2004; Patrap and Quintin 2006) and therefore,
contrary to the segmentation hypothesis, informal employment is not affected by business
cycles. Other studies found that the two features could co-exist in in the same labor market,
given the heterogeneity of the informal labor market in developing countries (Fields 1990;
Gunther and Launov 2012).2 Previous work on informal employment in Egypt has focused on
transition but not on the Arab Spring impact, see e.g., Wahba 2009, Radchenko 2014, Tansel
et al. 2015.
The paper looks separately at the labor markets of high and low educated workers to
examine the extent to which the experience is different across the two groups, and the extent
to which skilled and unskilled labor markets respond differently to unfavorable political
conditions. It is well documented in the literature that the probability of formal employment
2 See Khamis (2012) for a survey on informality.
4
increases with the education level, possibly in response to higher returns to education attached
to formal jobs. Gong and van Soest (2002) confirm this view, suggesting that the dual structure
is supported for highly educated workers but not for low-educated ones. Therefore, the
response of the two markets to unfavorable economic conditions is expected to be different.
Moreover, the distinction across education level is important for designing better, and more
relevant, policies that address informal labor markets (Pages and Stampini 2009). If low
educated workers encounter high barriers to enter formal employment, the policy should
address improving mobility between formal and informal jobs to bring welfare gains to the
poorest workers. However, if the unskilled labor market is not segmented (i.e., low educated
could move freely across the two sectors), easing access to education and skill could be a more
suitable policy to raising worker’s living standards. These investments in education and
training will not have an impact on workers’ well-being if the labor market is segmented (Pages
and Stampini 2009).
To understand the dynamics of informality in the wake of the Arab Spring in Egypt, we
use a representative panel data that covers the period 1998-2012. One advantage of the dataset
used in our analyses is the ability to give insights on long term labor market dynamics as it
covers the period 1998-2012. The panel data are collected in three waves: 1998, 2006, and
2012. During the period 1998-2006, the Egyptian economy was in a good shape, and
unemployment declined significantly (Assaad 2009), while over the period 2006-2012
employment growth and net job creation decreased and employment conditions deteriorated as
a direct result of the political instability that followed the Arab Spring revolution (Assaad
2015a; 2015b). The 2012 wave of the dataset contains retrospective section that asks detailed
questions about individual’s labor market history during the Arab Spring. We make use of the
panel aspect of the data as well as retrospective data to document changes in informal
employment over time. In order to better estimate the effect of the Arab Spring revolution on
5
informality, we supplement that analysis by utilizing Egyptian Labor Force Survey (LFS)
repeated cross section quarterly data between 2010 and 2014.
Our findings suggest that uncontracted work has increased over the last two decades,
but through two mechanisms. First, this was driven by the increase in the share of highly-
educated workers who were stuck in the informal employment, and secondly through the higher
share of low-educated formal workers who lost their job contracts and became informally
employed. We also find that informal employment particularly increased in the wake of the
Arab Spring revolution for the two groups, but the increase is more pronounced for the highly
educated. Those results suggest that the political instability harmed all educational groups but
the educated were hurt more, compared to the low educated, ironically as they were the
initiators of the recent political changes.
The structure of the paper is as follows: Section 2 reviews the previous related literature.
Section 3 provides background information on the Egyptian labor market and the recent
political changes in the country. Section 4 describes the data and the sample. Section 5 focuses
on the data analyses through examining determinants and dynamics of informality, the impact
of the Arab Spring, and potential mechanisms behind the findings. Section 6 concludes.
2. Related Literature
Despite the large body of economic literature on informality in developing countries, a
generally accepted conceptual framework of how this type of employment and the labor market
are intertwined does not exist (Lehmann 2015). Traditionally, informality was viewed as a
stepping stone where workers wait for formal sector jobs- due to Fields (1975) seminal work.
In this context, the informal sector is the less advantaged sector of a dualistic labor market, a
marginal sector in its contribution to economic growth and the overall economy. Within this
sector, informal workers are ‘involuntary’ employed as they are excluded from the benefits of
6
the formal sector and barriers to entry prevent them from moving to the formal labor market.
However, others (e.g., Cunningham and Maloney 2001; Maloney 1999; 2004), have questioned
this traditional view and argued that informal workers and the self-employed in particular are
voluntarily employed in the informal labor market, which is not marginal, nor segmented but
is integrated with the formal sector and contributes significantly to employment and output.
Several empirical studies have embarked on investigating those opposing views by focusing
on labor mobility or formal-informal wage gap. The argument being that if the labor market is
not segmented then there will be mobility between informal and formal employment. Similarly,
wage equalization between informal and formal sectors should occur.
Labor market dynamics have attracted a lot of attention in the informal employment
literature; see for example, Maloney (1999), Maloney (2004), Gong et al. (2004), among others
who have focused in particular on Mexico. Maloney (1999) offered one of the very early
studies of worker transitions between sectors and found little evidence in support of the
dualistic labor market view in Mexico. On the other hand, Bosch and Maloney (2010) find that
in Argentina, Brazil and Mexico, the self-employed face voluntary entry into the informal
sector, while informal salaried workers face a segmented market and queue in the informal
sector. This is observed in particular during downturns when informality increases in periods
of high unemployment suggesting a very traditional view of the role of the informal sector as
a shock absorber. One of the few studies which distinguishes between the educational levels of
workers, Gong and van Soest (2002) find that for the lower educated workers, the dualistic
view of the labor market is not a good description, but for the higher educated, on the other
hand, the urban labor market in Mexico has traditional dualistic features. Evidence for other
developing countries and transitional economies also suggest mixed results, see for example
Lehmann (2015) for a survey on informal employment in transitional economics. On the whole,

7
the dualistic nature of labor market is country specific and depends on its institutions, but also,
and more importantly, on the definition of informality used (self-employed versus salaried
workers).
There are a few studies on informality in Egypt. Wahba (2009) looks at whether the
informal sector is a stepping stone or a dead end and finds that informal employment is a
stepping-stone for highly educated men. However, for low-educated workers and women
informal employment could be a dead end. Radchenko (2014) uses non-parametric techniques
to estimate heterogeneity in the Egyptian labor market over the period 1998-2006, and shows
evidence for triple heterogeneity, offering support to both segmented and competitive views
on informal labor. More recently, Tansel and Ozdemir (2014) study labor market dynamics in
the Egypt by examining transitional probability across eight labor market states and conclude
that the labor market is highly static. Tansel et al. (2015) examine the wage gap, across the
wage distribution, between informal and formal sector workers in Egypt, and adopting a similar
methodology to Bargain and Kwenda (2015), namely Fixed Effects Quantile Regression, find
a substantial gap in favor of formal sector workers. They also show that informal wage penalty
increases with education and has increased over time across all quantiles.
Despite the growing economic literature that investigates the impact of economic
downturns on informal employment cycles (e.g., Elbahnasawy et al. 2016; Fiess et al. 2010),
there is hardly any evidence in the literature on the impact of political instability on informality.
This paper is the first to exploits the political turmoil that accompanied the Arab Spring
revolution to study the dynamics of informality in Egypt.

8
3. The Egyptian labor market
This section provides a brief background to the role played by the various labor market
institutions and how they impact on the functioning of the labor market in Egypt. In the 1960s,
the government passed a law that guaranteed employment to all secondary, technical institutes,
and university, graduates to encourage education and to provide safety net. However, this has
led to an overstaffed and inefficient public sector. From the 1960s to the 1980s, the Egyptian
public sector was the main creator of employment opportunities and typically the preferred
sector by most new entrants to the labor market. The economic reforms of the 1990s have
curbed new employment opportunities in the public sector and initiated a privatization program
of existing public enterprises, but the size of the private formal sector, although growing fairly
rapidly, has continued to be small. As a result, unemployment rates among the new entrants to
the labor market increased. At the same time, the growth of the private formal sector in job
creation and absorption has been limited resulting in an increase in informal employment where
jobs are not covered by social insurance or legal employment contracts.
Thus, labor market institutions in the form of guaranteed government employment has
resulted in a segmented labor market. However, with the downsizing of the labor market, youth
unemployment increased by more than 50 percent in the 1990s, and unemployment mostly
affected the educated youth driven by the public sector hiring practices. The youth still
expected the government to provide them with jobs and queue for public sector jobs. In addition,
the private sector has been very slow in absorbing new workers which has exacerbated the
problem. With the increase in (educated) labor supply, informality became the only resort for
many new entrants.
Until July 2003, existing labor legislation had been rather stringent both for workers
and for employers, leading to lack of enforcement. In 2003, the Egyptian government embarked
9
on various labor market reforms with the goal of increasing flexibility in hiring/firing in the
private sector which went some way toward providing more flexibility (Wahba and Assaad
2017). However, with the onset of the financial crisis in 2008, employment growth and net job
creation decreased and employment conditions deteriorated (Assaad and Krafft 2015b).
Moreover, irregular wage work, the type of employment that is most closely associated with
vulnerability and poverty, has risen substantially (Assaad and Krafft 2015b).
One defining problem for Egyptian labor market has been the lack of a dynamic private
sector. Egypt has a very large small and medium (SME) sector that is heavily skewed towards
small and very small companies: just 1.6 per cent of all enterprises have more than 10
employees and only 0.2 per cent have more than 50 employee (Loewe et al. 2013). As
documented by Loewe et al. (2013), the main obstacle faced by SMEs is with regard to the
regulatory environment, namely the unpredictability and arbitrariness of law enforcement
rather than the cost and time needed for compliance.
In essence despite protective labor market regulation in Egypt which applies only to
public sector and formal private employees, informal workers are not protected and their jobs
are not regulated, most workers remain largely unprotected and work without a job contract.
Law enforcement is rather weak, with no labor inspectorates that effectively enforce worker
rights and supervise the implementation of labor regulations, see Angel-Urdinola and Kuddo
(2010).
Another major trend in the Egyptian labor market has been the continued improvement
in the educational composition of the working age population. However much of the
investment in human capital has been in pursuit of the credentials needed to access public sector
jobs rather than the skills demanded by the labor market. As such the public sector employment
was used by the political regime as a tool to calm down politically salient groups mainly the
educated middle class as part of the social contract they have struck with the citizens. As a

10
result, by using the labor market as means to distribute rents the government undermined the
functioning of the labor market and its ability to efficiently allocate human capital to its most
productive uses and to signal the kind of human capital investments that are needed, see Assaad
(2014)).
Driven by the unfavorable economic situation and frustration among young people who
received education but were unable to reap the requisite economic benefits from it (Campante
and Chor 2012), young people from around the country took an active role in the January 25th
revolution in 2011. Although there are debates about the main reasons behind the uprising, lack
of formal jobs, equity and inclusion are prime contenders, see by for example, Devarajan and
Ianchovichina (2017). Loosely organized through social media, young Egyptians poured onto
Tahrir Square and other meeting points around the country to demand their human rights and
a voice in their own futures. The riots succeeded in toppling a 30-year old regime. However,
since then the country has undergone several political fluctuations and changes of power, with
civil unrest, violence and continued protests. Assaad and Krafft (2015a; 2015b) showed that
conditions in the Egyptian labor market have deteriorated markedly as a result of the economic
crisis that accompanied the revolution.
In the wake of the revolution, there were attempts to introduce minimum wages, and
increase workers’ voice and trade union power all of which came to a halt with the intensive
civil unrest and the political instability that dominated the 2-3 years afterwards. Although on
one hand, one would have expected that with the uprising, there would have been the desire
and opportunity for political reforms providing workers more rights and voice, those did not
materialize and were accompanied by economic uncertainty and political instability. While the
uprising was initiated by the breakdown of the social contract, the aftermath (at least in the
short and medium term) did not mend or initiate a new social contract, leaving in particular the
young educated middle classes unhappy due to their failure to change the political and social

11
environment in order to achieve a better life, see Silver et al. (2017). In the next sections, we
examine the changes in informality over time and in particular in the aftermath of the Arab
Spring to document the potential changes experienced in the labor market by unprotected
workers.
4. Data and descriptive statistics:
4.1. Data
We use data from the Egypt Labor Market Panel Survey (ELMPS) which is a nationally-
representative panel dataset that covers the Egyptian labor market and collected detailed
information about demographic characteristics of the households and individuals interviewed.
The survey was carried out three times in 1998, 2006, and 2012 by the Economic Research
Forum (ERF) in cooperation with the Egyptian Central Agency for Public Mobilization and
Statistics (CAPMAS), the Egyptian government’s prime statistical agency.3
The ELMPS dataset contains detailed information about employment status, education
levels, and individual and household background characteristics across the three waves, in
addition to rich information about labor market outcomes over the life cycle using retrospective
questions about labor market history. We make use of the panel aspect of the data as well as
retrospective data to document changes in informal employment over time, particularly after
the Arab Spring revolution in 2011, and estimate the probability of switching from/to
informality over time and the wage implications of that transition.4
We use lack of job contract as our measure of informality, and focus our analysis on
private non-agriculture waged workers (PNAW). Given the low female labor force
3 For more details, see Assaad and Krafft (2013).
4 We further use data from the annual Egypt Labor Force Survey (LFS) for the time period 2010-2014. See Section 5.2 and
Appendix B for details.
12
participation in general and in the private sector in particular causing huge selectivity, we limit
our analysis to men, aged 20 years or more in 1998 and less than 60 years in 2012.
Our total sample of interest is comprised of 6,787 observations for 5,575 individuals in
non-agriculture waged employment for whom we have complete information about
employment status, education levels, and individual characteristics. We distinguish between
high and low educated workers and define high educated as those with secondary or higher
education and low educated as those below secondary education. 5 Given the potential
differences between the two groups in the pattern of informality, we examine them separately.
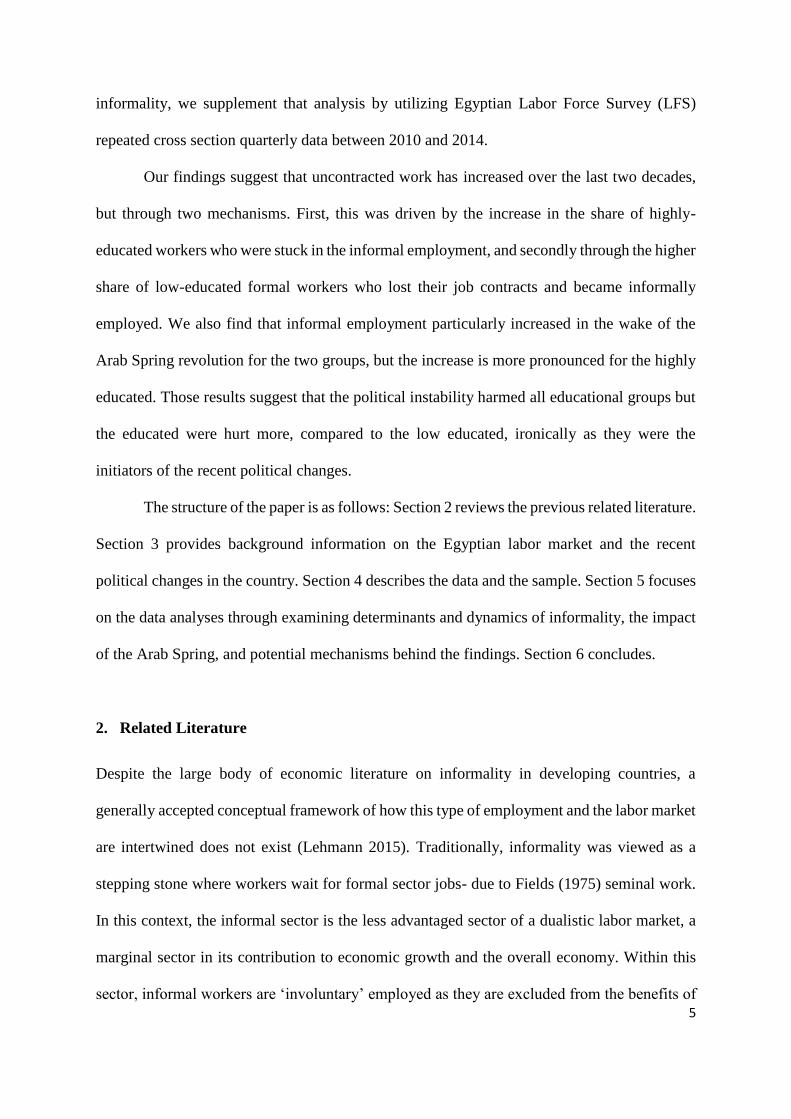
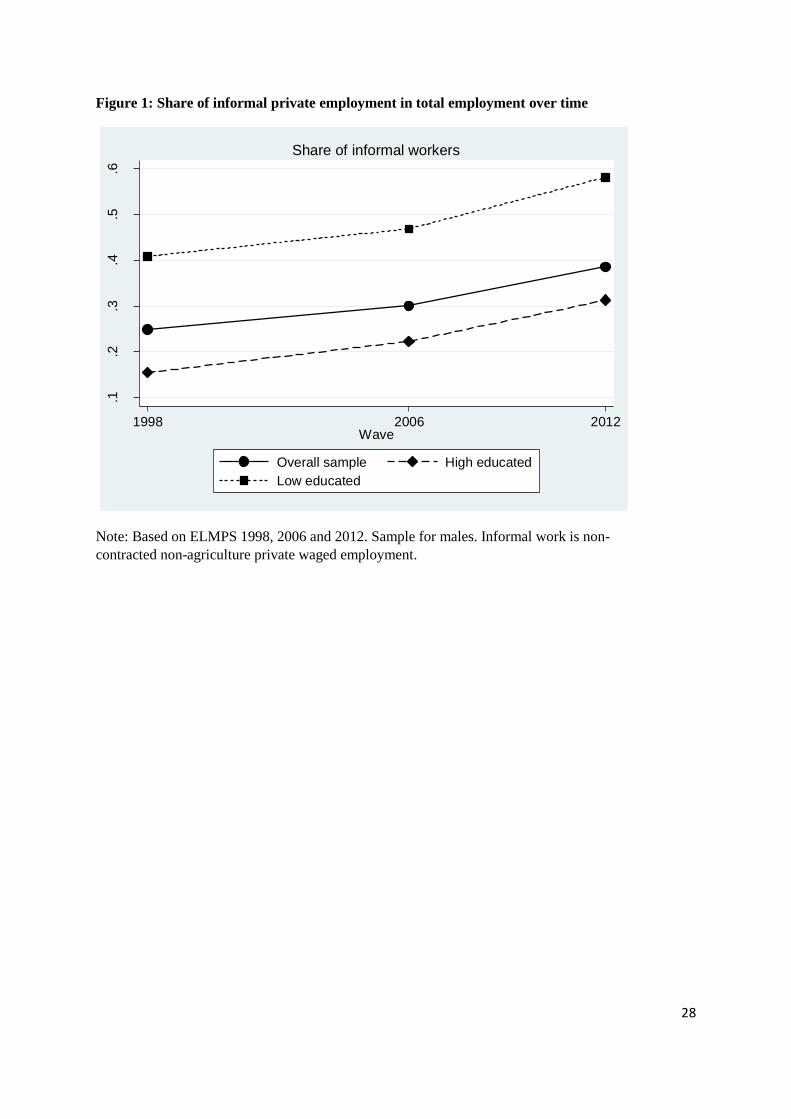
The share of informal employment has increased over time from 25% in 1998 to 30%
in 2006 and then to 39% in 2012. Table A1 shows the change in the share of those employed
without contracts (informal employment), relative to all other employment status, over the
three waves of the survey. Figure 1 clearly shows the increase in the share of informal workers,
those with no job contracts, over time especially between 2006 and 2012 by educational level.
Both low- and high-educated workers witnessed increase in in their informal employment.
However, high-educated workers witnessed almost a doubling of the share of informal
employment between 1998 and 2012. Table A2 provides the characteristics of informal
workers and their work compared to formal workers (contracted workers in private waged non-
agriculture employment). A number of interesting features emerge. First, there is a positive
wage premium for formal work relative to informal employment, an issue we will investigate
further later. Also, the share of high-educated workers increased in both formal and informal
workers between 1998 and 2012 reflecting the secular increase in educational attainment over
the last few decades. This also shows that informal work is becoming more dominated by high
5 As a robustness check, and since obtaining university education is the main marker of social prestige, we repeated all the
analyses using an alternative breakdown between those who have a high school diploma or lower versus those who have
university education or higher. The results are similar.
13
educated workers: 60% of informal workers were high educated in 2012 compared to only 40%
in 1998. We investigate below the employment dynamics focusing on the difference between
the high- and the low-educated.
5. Data analyses
In order to study informality in the aftermath of the Arab Spring in Egypt, we examine (i) the
probability of holding an unprotected (informal) job over time, (ii) the probability of
transitioning into and out of informal employment over time before examining both patterns
and trends before and after the 2011 Revolution.
5.1 The Probability of Informal Employment
First, we examine the probability of informal employment over time. For this purpose, we
estimate the following model:
𝐼𝑁𝐹𝑖𝑡∗ = 𝛼𝑖 + 𝛽1𝑇𝑡 + 𝛽2𝑋𝑖𝑡 + 𝜀𝑖𝑡 (1)
Where 𝐼𝑁𝐹𝑖𝑡∗ is a dummy variable that takes the value one if the individual is informally
employed (i.e., uncontracted), and zero if he is formally employed (i.e., has a contract). 𝑇𝑡 is a
dummy indicator for waves 2006 and 2012, relative to the baseline of 1998. 𝑋𝑖𝑡 is a vector of
control variables including age, age squared, work experience, work experience squared,
marital status, urban vs. rural area dummy, household size, education, firm size, and industry
dummies. We use the three waves as repeated cross-sections.
Table 1 shows the coefficients of Equation 1. The table estimates three models: (1) a
linear probability model (LPM) which ignores the panel aspect of the data, (2) a random effect
model (RE) to take into account the panel features, and finally (3) a fixed effects panel model
(FE) to control for unobserved heterogeneity for the overall sample (Columns 1-3), low
educated (Columns 4-6), and high educated (Columns 7-9). Informality significantly increased
between 2006 and 2012 for both low educated and high educated. However, using individual
14
FE model, the estimates show that for the same individual, the probability of informal
employment has not changed over time.
5.2 Formal/informal employment transitions
Worker transitions between sectors provide evidence on the dualistic labor market, and on
whether the informal sector is a stepping stone or a dead-end which could have been a cause
of the increased frustration of the educated group if they were unable to move to better formal
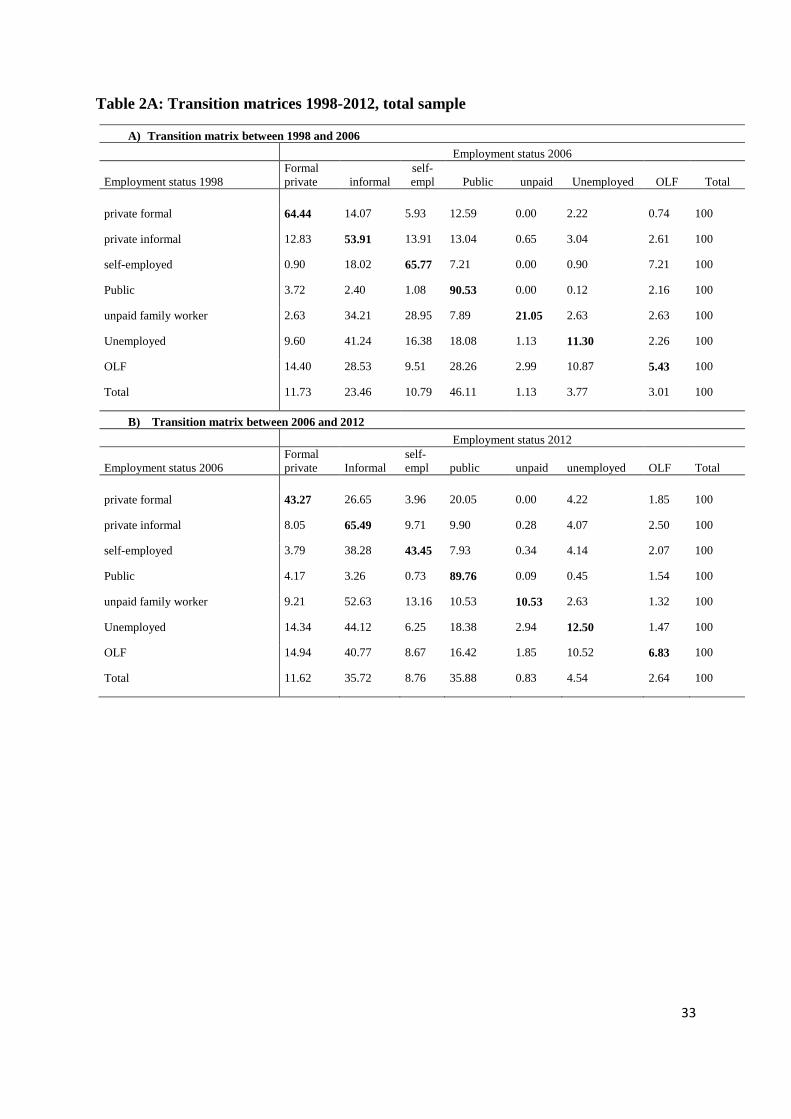
jobs. Table 2A shows the matrix of raw transition probabilities for the overall sample between
1998 and 2006 (Panel A) and between 2006 and 2012 (Panel B). The elements on the main
diagonal of the matrix show the probability that an individual remains in a given state. The
table shows that between 1998 and 2006, the probability to remain in formal employment (with
contract) was about 64% and decreased to 43% between 2006 and 2012. The probability to
remain in informal employment (without a contract) increased from 54% between 1998 and
2006 to 65% between 2006 and 2012. The share of workers who switched from informal to
formal employment decreased from about 13% between 1998 and 2006 to 8% between 2006
and 2012. The share of workers who lost their contracts (i.e., moved from formal to informal
employment) increased significantly from 14% between 1998 and 2006 to about 27% between
2006 and 2012 suggesting perhaps that the turmoil has had an impact.
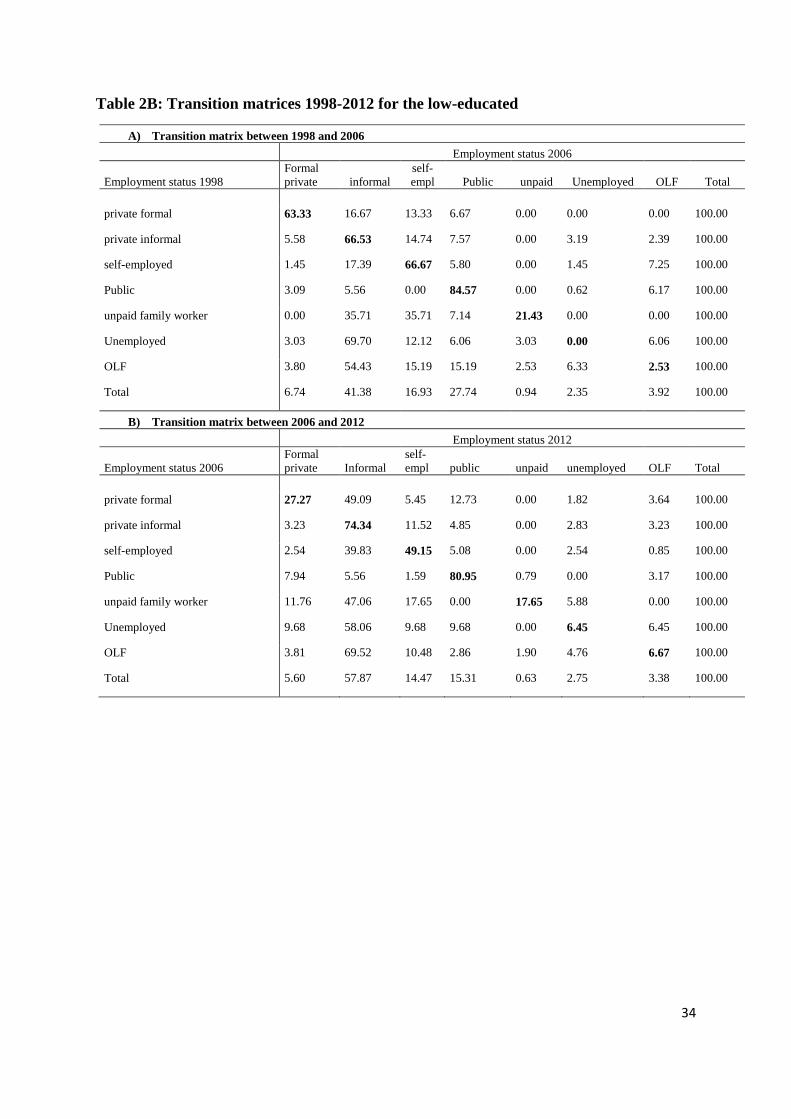
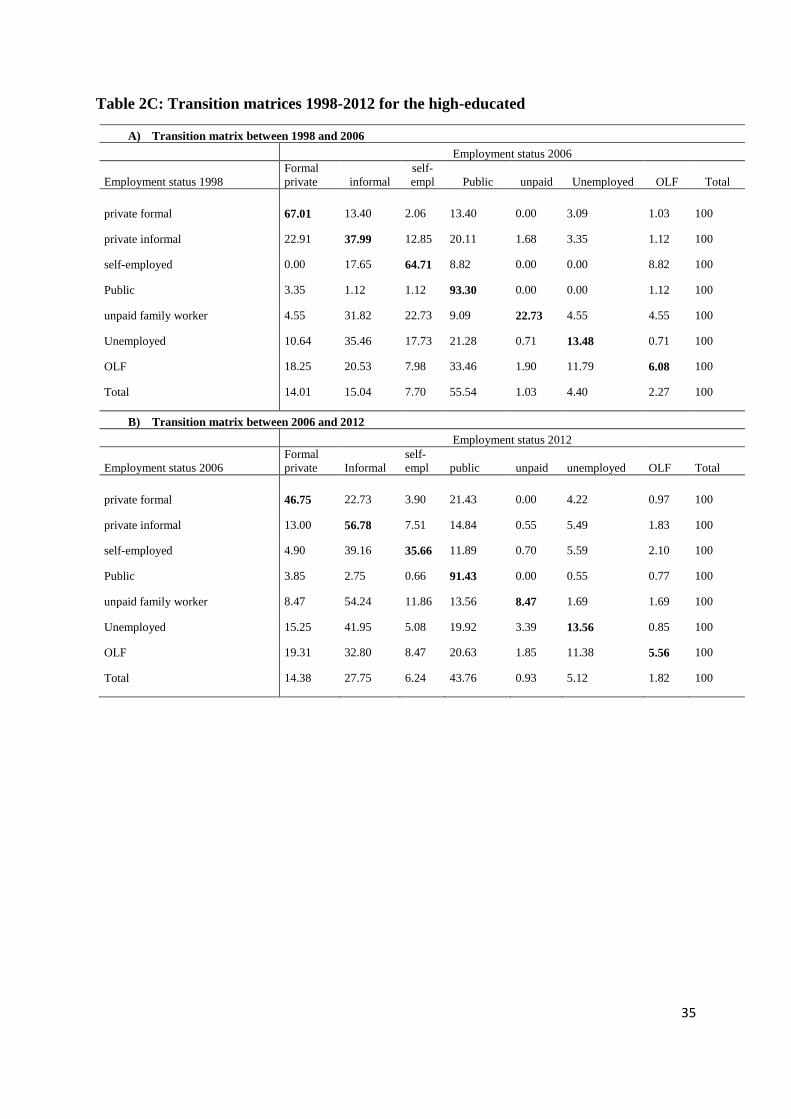
Given that the pattern of informality is expected to be different between low educated
and high educated workers, we show the transition matrix by education level. Tables 2B and
2C show the transition matrix for the low educated and high educated, respectively. For the
low educated, the probability to remain in formal employment decreased substantially from 63%
between 1998 and 2006 to only 27% between 2006 and 2012. About 17% only of the formal
low educated switched to informal employment between 1998 and 2006. This increased to 49%
between 2006 and 2012. The share of workers who remain in informal employment increased
15
from 67% to 74%, and the share of those who moved from informal to formal decreased from
6% to 3%. For the high educated, the share of those remaining in formal employment decreased
from 67% to 47%. The share of those remained informal employment increased from 38 to 57
percent. The share of those graduating from informal to formal employment decreased from 23
percent to 13 percent. The share of switchers from informal to formal increased from 13% to
23%. The estimates of the raw transitions suggest that informality increased for low educated
and high educated for different reasons. Low educated were more likely to lose their contracts,
and move from formal to informal workers. However, high educated were more likely to be
stuck in informal employment.
To account for observable characteristics when studying the dynamics of informal
employment across the three waves of the survey, we estimate the likelihood of switching from
(in)formal employment in one wave to different employment status in the next wave using
Multinomial Logit (MNL) model:
Pr(𝑋𝑖,𝑡+𝑛) = 𝑗 | 𝑋𝑖,𝑡 = 𝑘) = exp (𝑍𝑖�́�𝑗|𝑘)
∑ exp (𝑍𝑖�́�𝑙|𝑘)𝐾𝑙=0
(2)
where Xi is the labor market state of individual i at time t (initial time) or at t+n (later time). k
is the state of origin and j is the destination state. Zi is a vector of control variables for individual
i. We are interested in mobility from the informal private employment to the other states as
well as from the private formal employment to the other states. The MNL model is estimated
by the maximum likelihood estimation method.
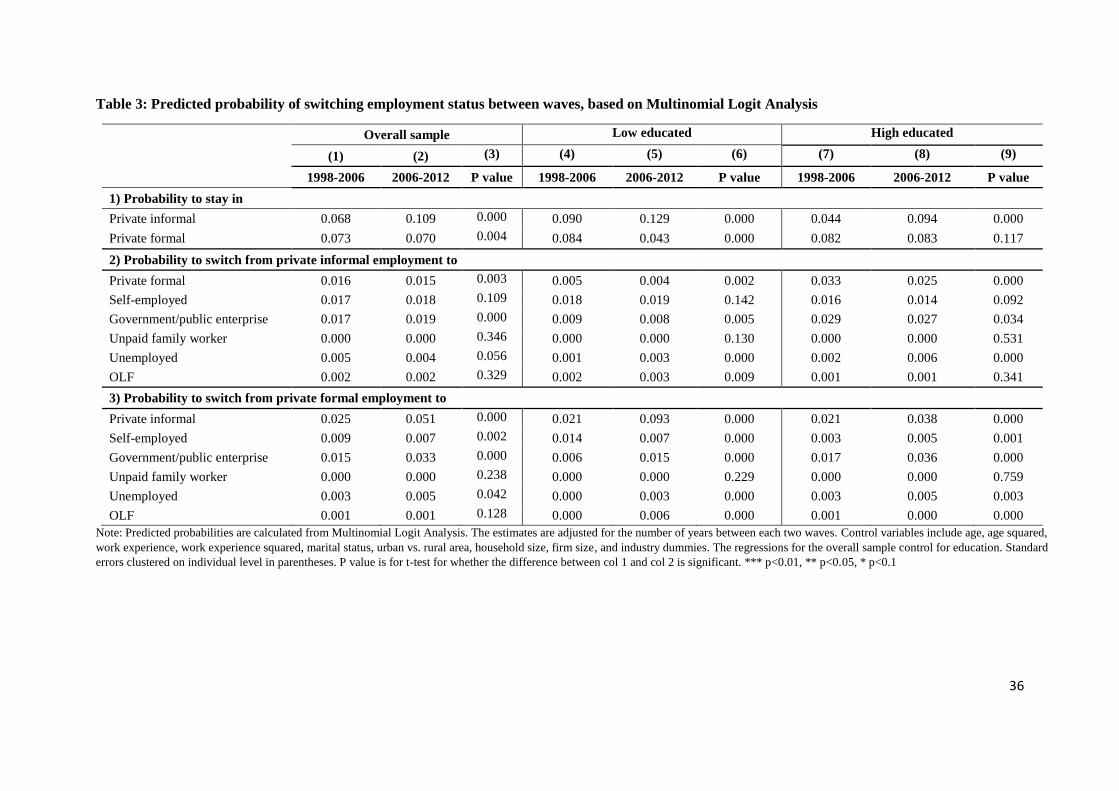
Table 3 shows the average predicted probabilities estimated from the MNL model above,
adjusted by the number of years between each two waves. Columns 1-3 show the estimated for
16
the whole sample, Columns 4-6 show the estimates for the low-educated, and Columns 7-9
show the estimates for the high educated.
The table shows the same pattern as the transition matrices above, namely that for the
period 2006-2012 compared to 1998-2006, the probability to remain in informal employment
increased, and the probability to remain formally employed decreased. The probability to
switch from informal to formal (from formal to informal) employment decreased (increased).
Compared to the high-educated, the low educated witnessed a strong reduction in the
probability to stay formally employed. The high-educated, however, were more likely to stay
in informal employment. The table suggests that the probability to switch from formal to
informal employment is a major reason for the increase in informality among the low-educated,
while for the highly educated, the decline in the probability to stay in informal employment is
the main driver of the increase in informal employment.
Interestingly, we find also some evidence on transitions from formal employment to
self-employment over time. The literature shows that economies going through recessions are
likely to experience a shift from tradable (i.e., salaried formal) to non-tradable (i.e., self-
employment informal) sectors, which would strengthen informality (see, for example, Fiess et
al. 2010)). Table 3 shows that while switching from formal employment to self-employment
over the period 2006-2012, compared to 1998-2006, decreased for the low-educated, it
significantly increased among high-educated workers. This could be explained by the
difference between the two educational groups in the ability to accumulate financial capital
during formal employment to start self-employment in periods of economic downturn.
To examine the determinants of transition from and to informality and whether this has
changed over time for the two educational levels, Table 4 shows the marginal effects estimates
of a probit model of the determinants of moving out of and into formal and informal
employment. Column 1 and 2 show the estimates of the probability to move from informal to
17
formal employment between 1998 and 2006 (Column 1) and between 2006 and 2012 (Column
2) compared to stay in informality. Columns 3 and 4 show the estimates of moving from formal
to informal employment compared to staying in formal employment. The table shows that
between 1998 and 2006 highly educated were more likely than low educated to move from
informal to formal employment. However, the two groups were not significantly different in
the probability to escape informality between 2006 and 2012. Moreover, there was no
significant difference between the low and high educated in moving from formal to informal
employment between 1998 and 2006. However, the low educated were more likely to move
from formal to informal employment between 2006 and 2012.
5.3 Informal Employment and the Arab Spring
An important aspect, which we need to delve further into, is whether the recent political
changes that Egypt witnessed have had an impact on the labor market dynamics and in
particular on movement out of informality. Given the long time frame between 2006 and 2012,
we cannot claim that the findings we show above are solely due to the economic downturn that
accompanied the Arab Spring revolution. To better investigate the impact of the revolution on
informality, we use data from the retrospective section in the 2012 wave of the ELMPS data to
examine three aspects: (i) the probability of starting an informal employment; (ii) the
probability of moving from informal to formal employment, and (iii) the probability of moving
from formal to informal employment.
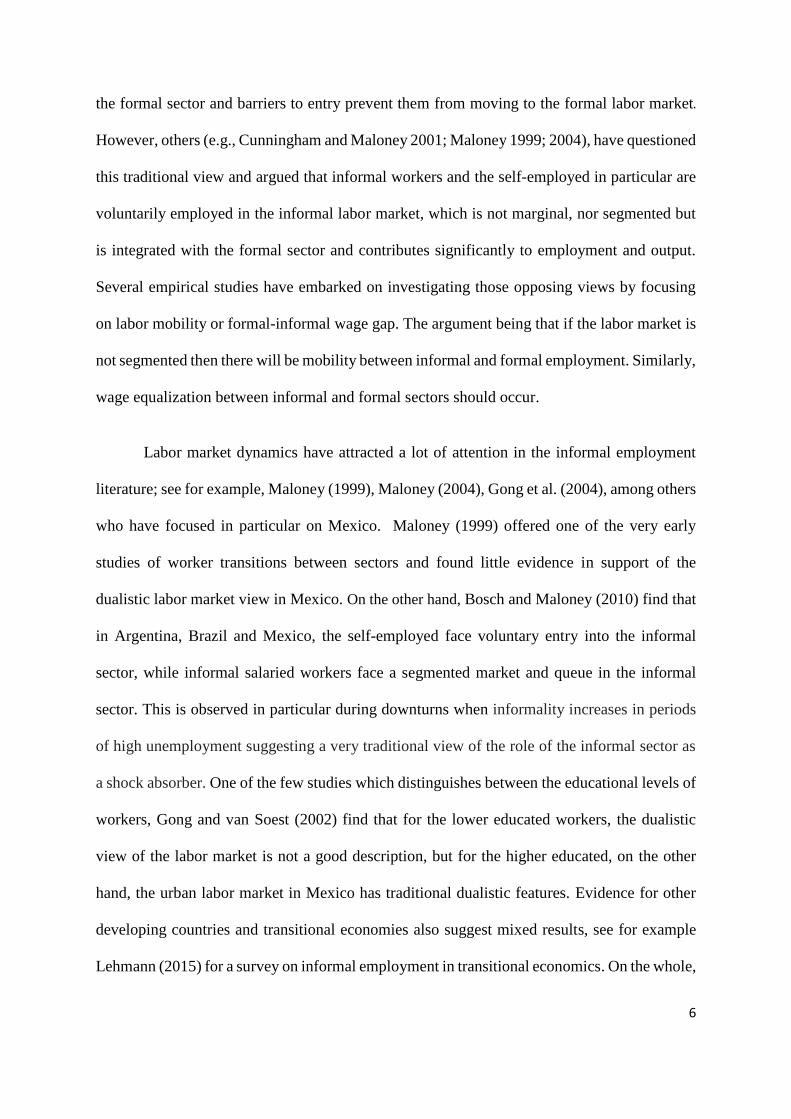
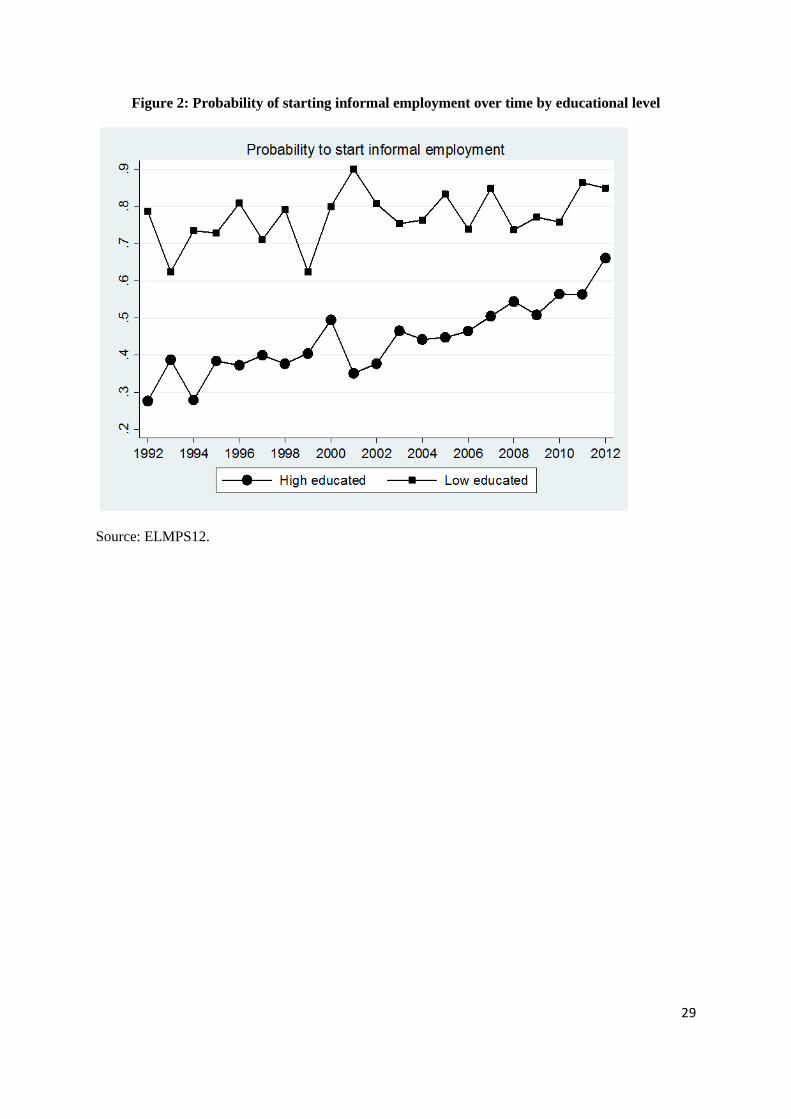
Figure 2 shows the probability of starting informal employment over time. The figure
clearly shows that informal employment has been continuously increasing over time.6 However,
6 This is in line with the findings shown in Section 5.1 using the panel data structure.

18
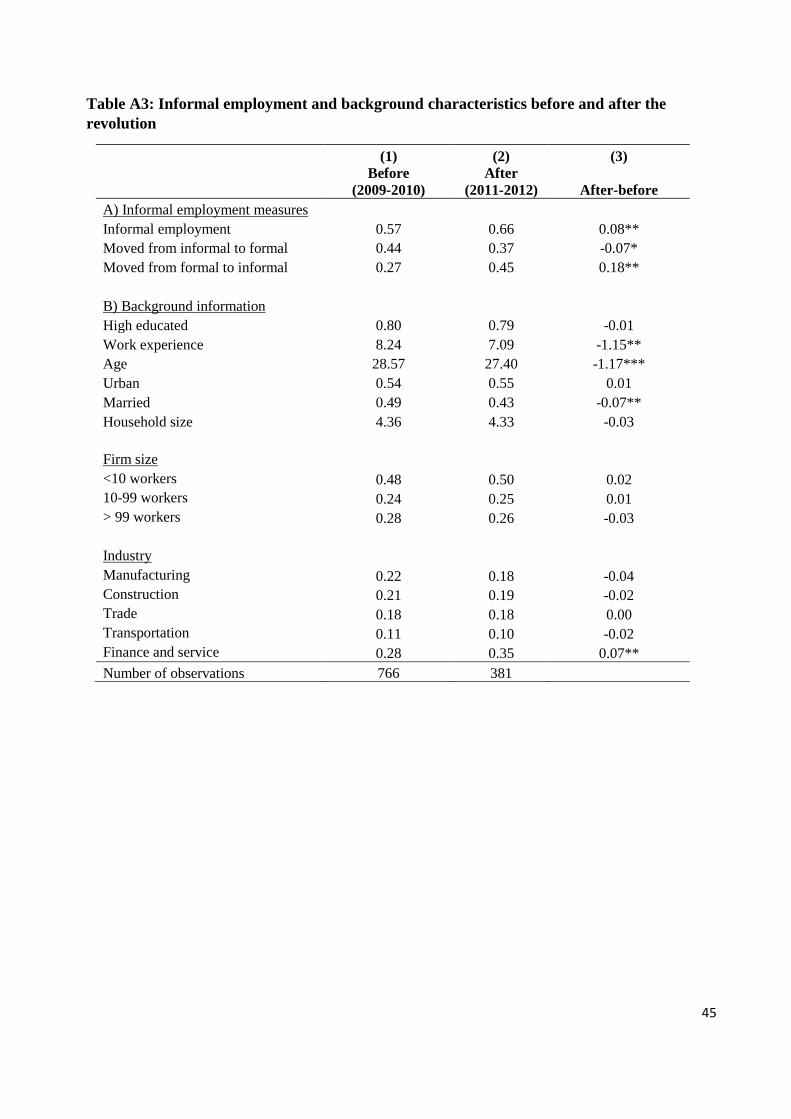
the increase has been much more pronounced after the revolution (i.e., in 2011 and 2012).7 We
focus on those who started employment two years before (i.e., in 2009 and 2010) and two years
after the revolution (i.e., in 2011 and 2012).8 As Table A3 shows, the share of those who
started private informal employment increased significantly from 57% before the revolution to
66% after the revolution. The table shows no significant differences in background
characteristics except work experience and age which are mechanically lower for the group
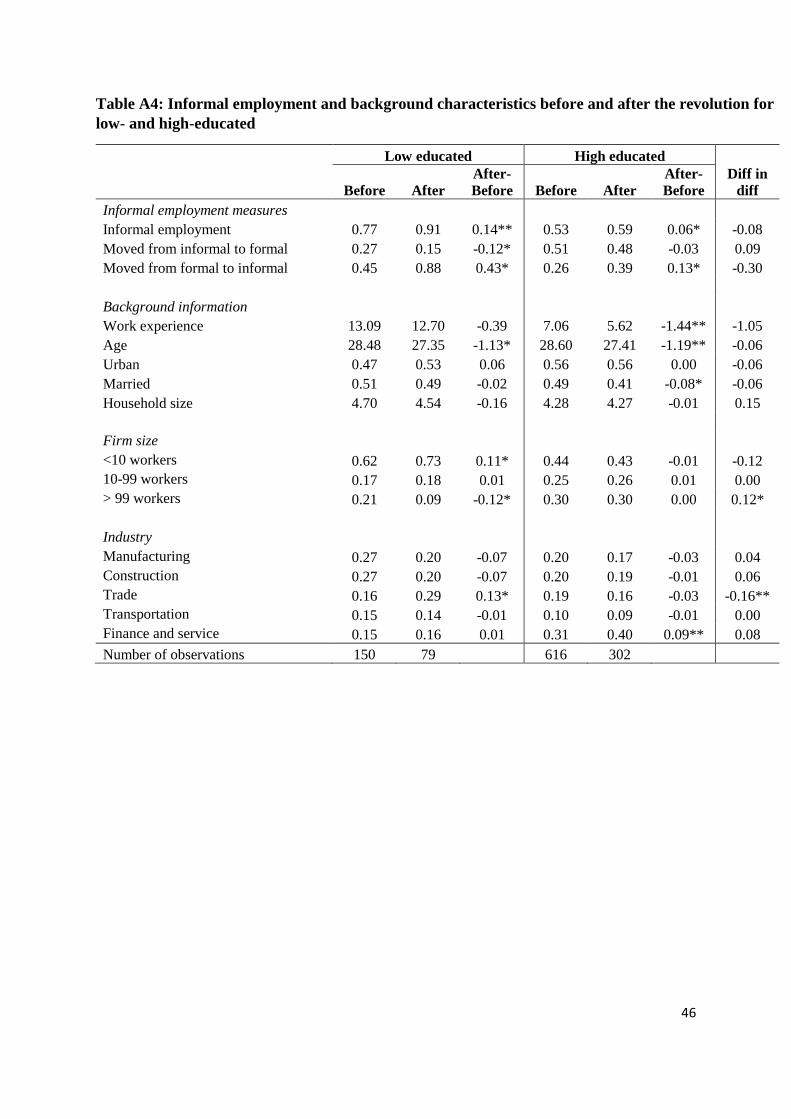
after the revolution. Distinguishing between low- and high-educated individuals also shows an
increase in starting informal jobs as opposed to formal ones after the revolution for both
educational groups - Table A4. At the same time, the share of those who moved from informal
to formal employment decreased from 44% to 37% and those who moved from formal to
informal employment increased from 27% to 45% - Table A3. Similar patterns are observed
for both educational groups (Table A4).
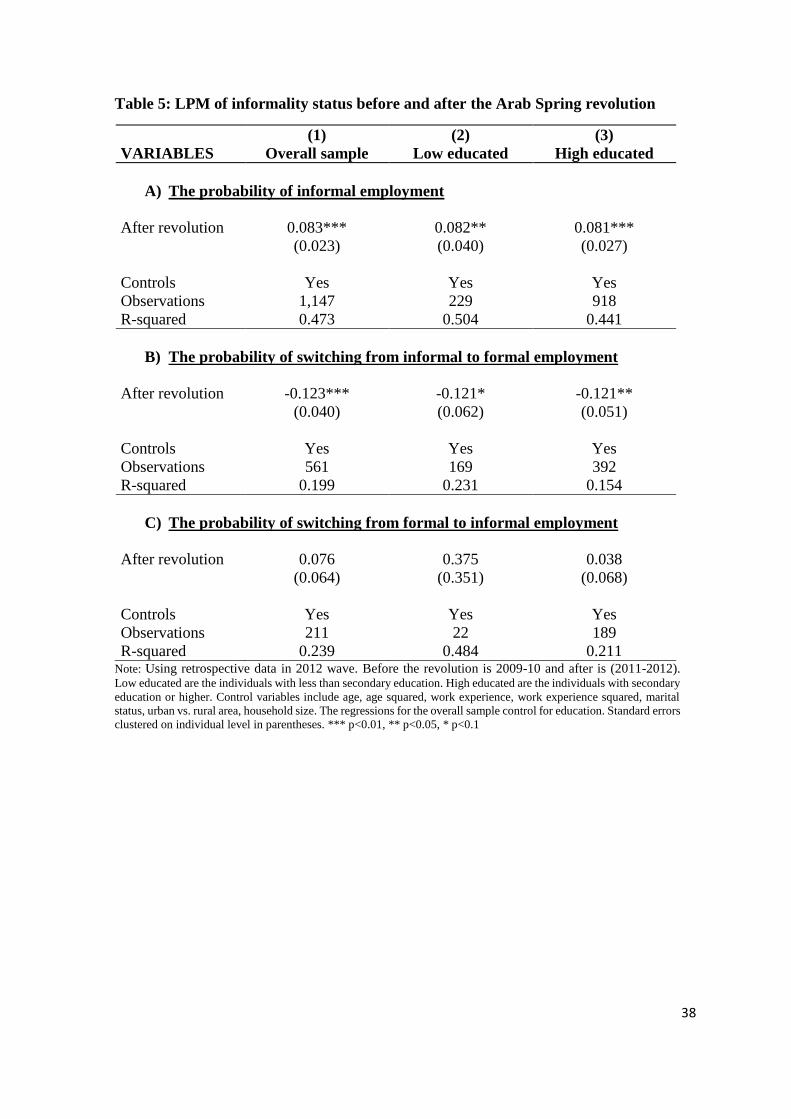
To estimate the probability of starting informal employment (i.e., employment without
job contract) before and after the revolution, we estimate the probability of starting informal
employment and capture the revolution using a dummy variable that takes the value 1 if
employment started after the revolution (i.e., in 2011-2012), and 0 before the revolution (i.e.,
in 2009-2010) and control for relevant individual characteristics. Table 5 Panel A shows the
estimates for the probability to start informal employment in general. The table shows that the
Arab Spring revolution increased the probability to start informal employment for the two
educational groups, and decreased the probability to switch from informal to formal
employment. We then estimate the probability of moving from informal to formal employment
before and after the revolution (Panel B), and likewise the probability of moving from formal
7 The 2012 wave was conducted between March and June in 2012.
8 As the Arab Spring revolution in Egypt took place early in 2011 between Jan.25 and Feb.11, we assume that the year 2011
is post-revolution.
19
to informal employment (Panel C). The estimates show that the probability of switching from
informal to formal employment has decreased for both low-and high educated individuals,
while the probability of moving from formal to informal has increased, but is not statistically
significant.9 Hence, the political turmoil seems to have increased informality through pushing
more individuals to start informal rather than formal jobs and fewer workers were able to move
out of informality in the period just after the revolution compared to that before.
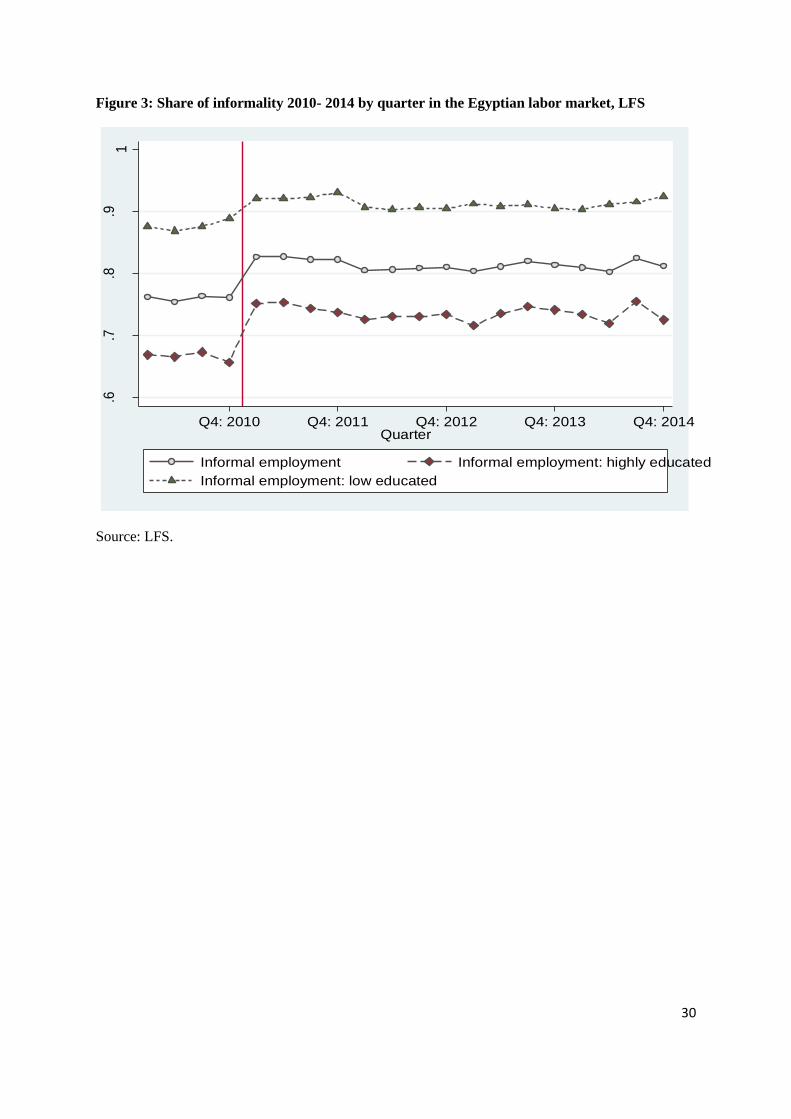
In order to have a better picture of the possible effect of the Arab Spring in informality
we use repeated cross-section waves of 2010-2014 from the Egyptian Labor Force Quarterly
Data. See B1 for a description of the dataset and the descriptive statistics of our sample in Table
B1. These data are nationally representative quarterly data (each three months). We adopt a
regression discontinuity strategy and estimate the following model:
𝐼𝑁𝐹𝑖∗ = 𝛼𝑖 + 𝛽1𝑅𝑒𝑣𝑖 + 𝛽2𝑋𝑖 + 𝛾𝑡𝑟𝑒𝑛𝑑𝑡 + 𝜀𝑖𝑡 (3)
Where 𝐼𝑁𝐹𝑖∗ is a dummy variable for informal employment, 𝑅𝑒𝑣𝑖 is a dummy variable for the
revolution (i.e., 2011 or after), 𝑋𝑖 is a vector of individual observable characteristics, 𝑡𝑟𝑒𝑛𝑑𝑡 is
a vector for time trend polynomials (i.e., year quarters and year quarter squares), and 𝜀𝑖𝑡 is the
error term.
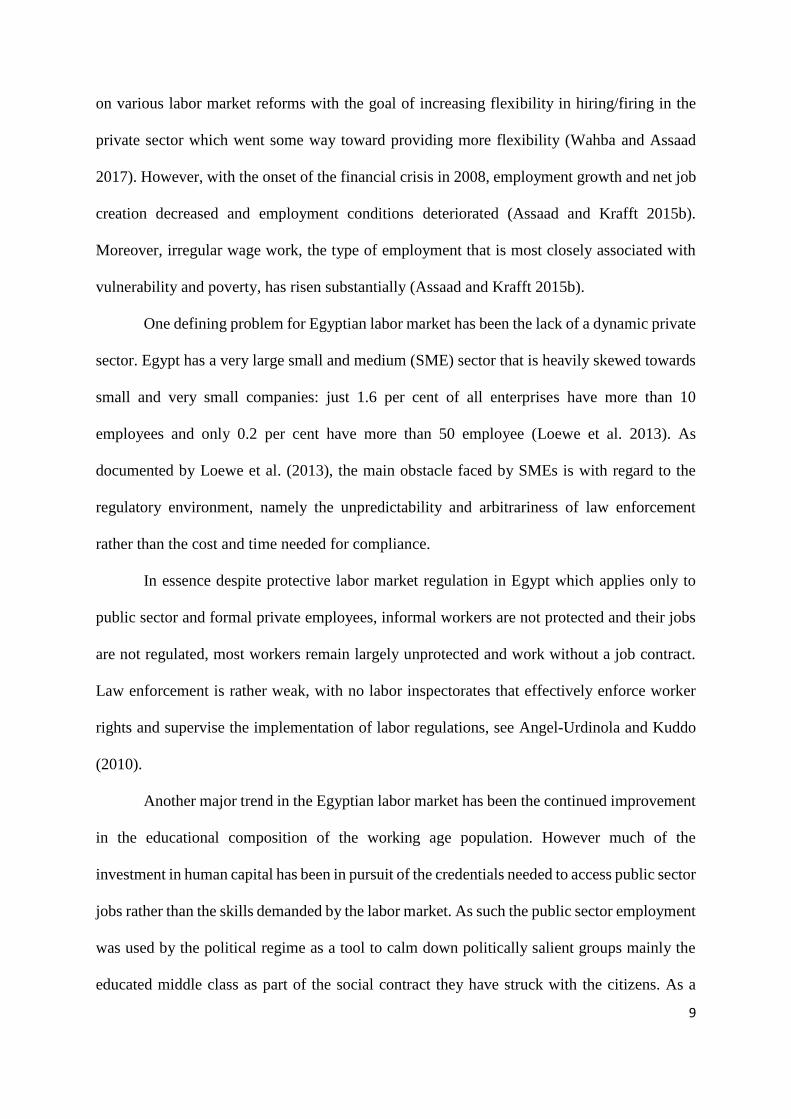
We again run the analysis separately for the high-educated (secondary and above) and
the low-educated (below secondary). Figure 3 clearly shows a jump in private informal after
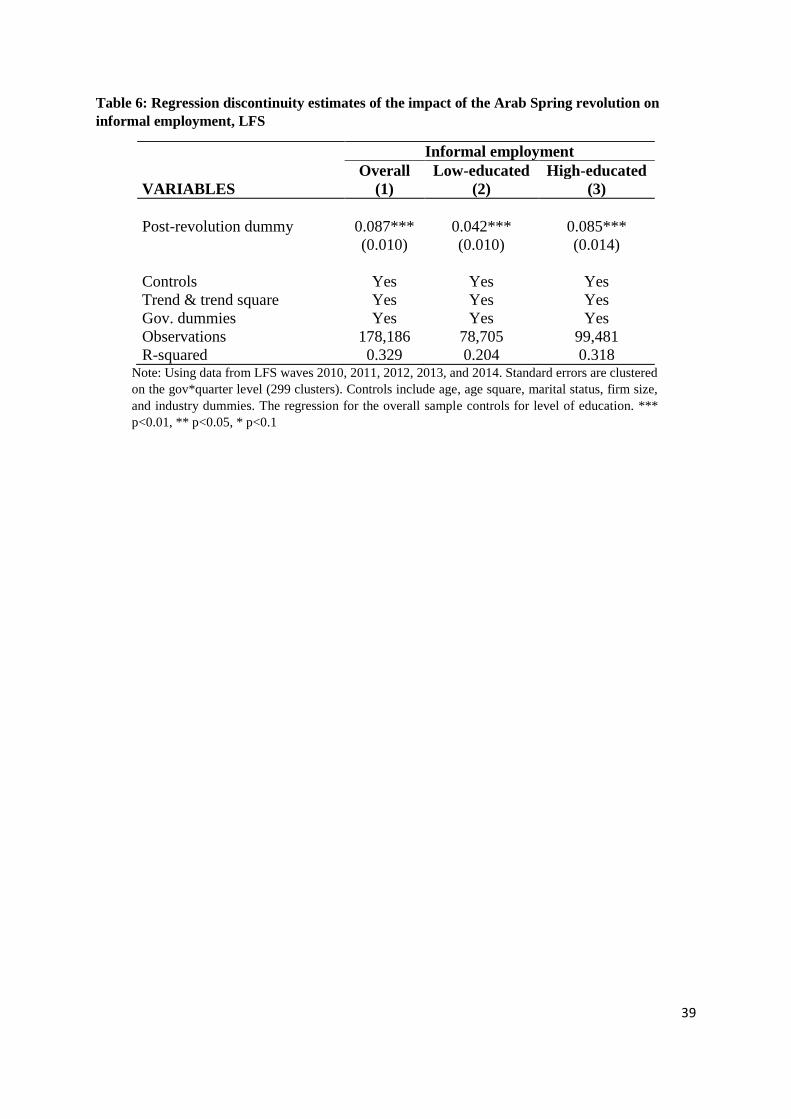
the Arab Spring revolution for the two groups. Table 6 shows the regression discontinuity
coefficients of equation 3. The table supports our previous findings that informality increased
in the aftermath of the Arab Spring in Egypt. The increase is more pronounced for the highly
educated relative to the low-educated.
9 This is probably due to the few number of observations.
20
5.4 Possible Mechanisms
To explore the underlying factors behind our findings, we first examine the nature of formal-
informal job transitions experienced to illicit whether such moves were voluntary or
involuntary. For this purpose, we exploit the retrospective section of the Egypt Labor Market
Panel Survey (ELMPS) which contains a set of detailed questions on the history of job statuses.
The retrospective data shows that for those who switched from formal to informal employment,
about 80% changed their occupations (defined by 2-digit categories), while among those who
switched from informal to formal, 60% changed their occupations.10
The nature of occupational change associated with switching to/from informality could
provide better picture about the mechanisms of change. If workers are switching to higher-
quality jobs, this suggests that the switch is likely to be voluntary. If workers are switching to
lower-quality jobs, this suggests that the change is demand driven and that workers have little
impact on choosing it.
To capture the direction of the change we created an index of the occupational skills
using occupations’ median monthly wages from the Egyptian labor force survey 2010. We
estimate the following two equation for the direction of change
∆𝑜𝑐𝑐_𝑠𝑘𝑖𝑙𝑙𝑖 = 𝛾0 + 𝛾2𝑀𝑜𝑣𝑒_𝑓𝑖 + 𝛾3𝑍𝑖 + 𝜀𝑖 (4)
∆𝑜𝑐𝑐_𝑠𝑘𝑖𝑙𝑙𝑖 = 𝜃0 + 𝜃2𝑀𝑜𝑣𝑒_𝑖𝑛𝑓𝑖 + 𝜃3𝑍𝑖 + 𝜀𝑖 (5)
Where ∆𝑜𝑐𝑐_𝑠𝑘𝑖𝑙𝑙 is the change in occupational skill (estimated by median log wage) when
switching from one occupation to another in the retrospective data. 𝑀𝑜𝑣𝑒_𝑓𝑖 is a dummy
variable that takes the value 1 if the switch is from informal (uncontracted) employment to
10 The data also shows that among those who switched from formal to informal employment, 70% switched
industry, and among those who switched from informal to formal employment, 65% switched industries. This
suggests a high degree of segmentation in the Egyptian labor market.
21
formal (contracted) employment, and 0 otherwise. 𝑀𝑜𝑣𝑒_𝑖𝑛𝑓𝑖 is a dummy variable that takes
the value 1 if the switch is from formal (contracted) to informal (uncontracted) employment,
and 0 otherwise. Zi is a vector of individual characteristics in the initial period, and εi is the
error term.
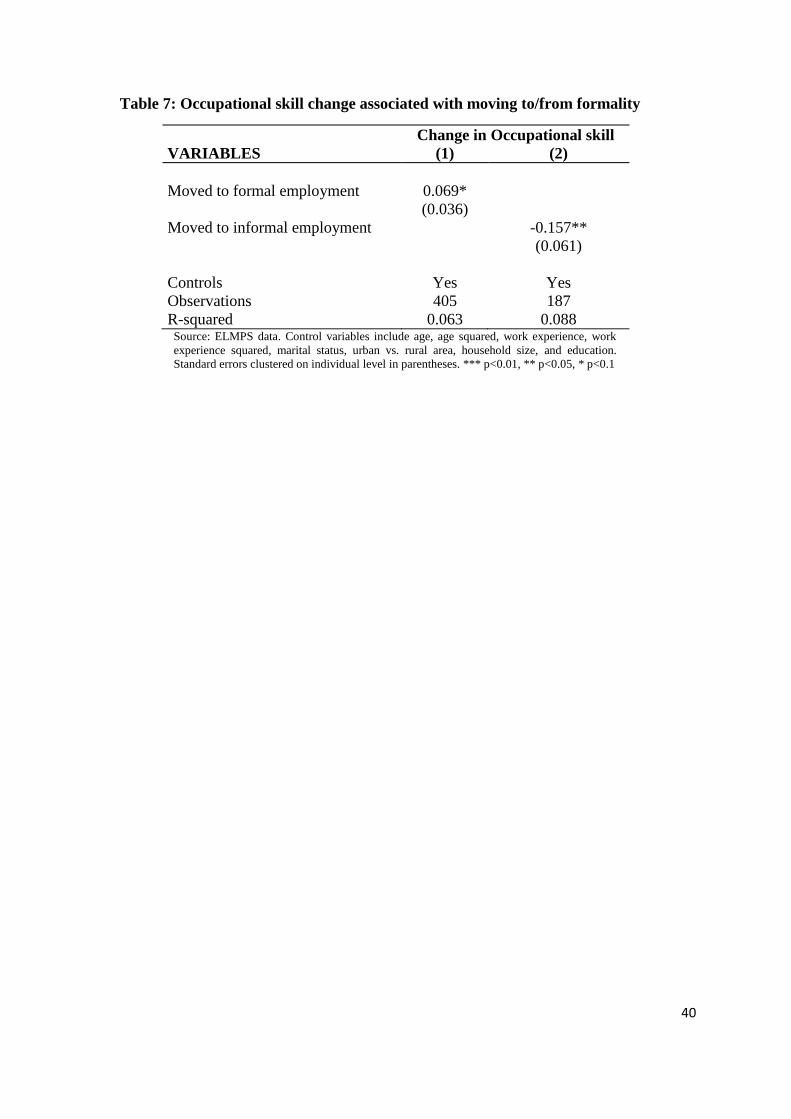
Table 7 shows the estimates of the regression. Column 1 shows the estimates for
equation (4) and Column 2 shows the estimates for equation (5). The table shows that moving
from informal to formal employment is associated with an increase in the job skill (measured
by median wage), while moving to informality is associated with occupational downgrading in
terms of skill. This suggests that moving to informality is involuntary.11 These findings are in
line with Yassin (2015) who documents a remarkable slowdown in the expansion of formal
private jobs between 2010 and 2011, as well as a decrease in the hiring rate in the formal private
wage employment, and an increased difficulty for a non-employed individual to find jobs
during the period after the revolution.
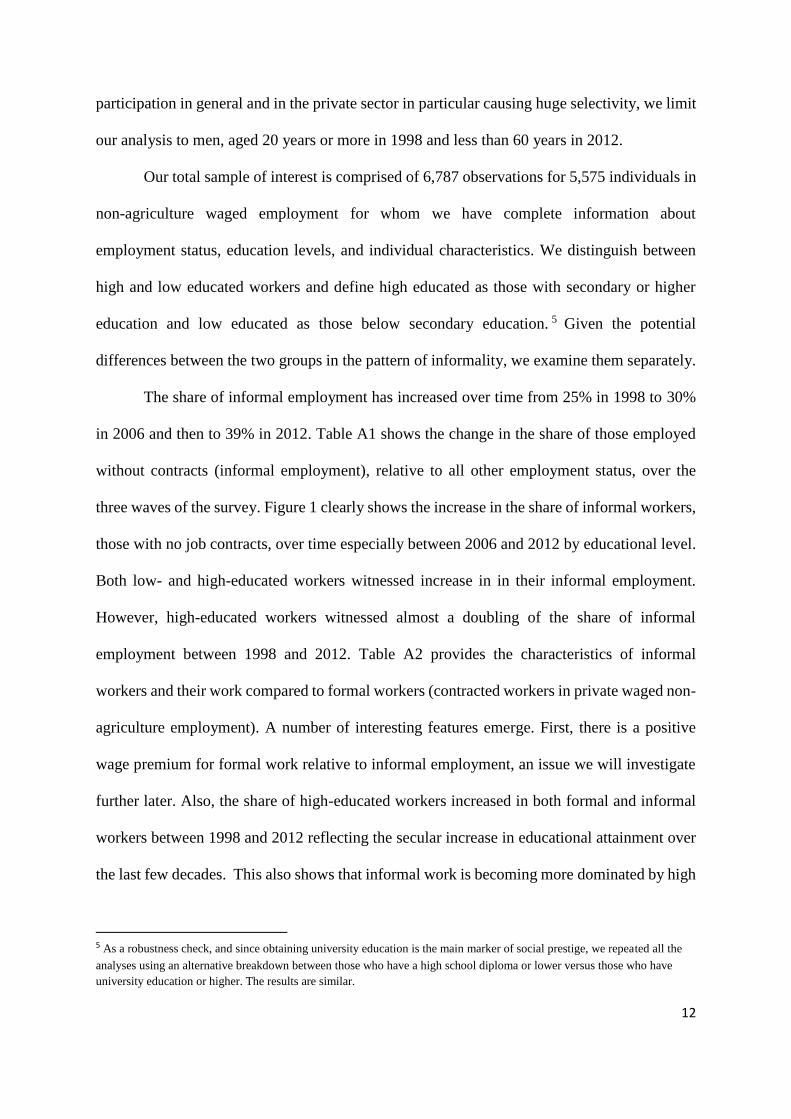
The Arab Spring seems to have also a direct effect on the formality of firms. Using data
from the Middle East and North Africa Enterprise Surveys (MENA ES), Figure 4 shows the
share of firms formally registered over years. The share of firms formally registered decreased
significantly after the revolution.12
Furthermore, Assaad et al. (2017) find that while the composition of labor supply is
increasingly shifting toward more educated workers, this is not matched with the creation of
jobs with greater human capital requirements. The private sector is creating jobs in a few
11 Although this does not tell if occupational change take place within the same firm, the broader definition of
occupational change suggests change of employers.
12 Based on data from 2,897 firms in Egypt collected in 2014 (See: http://ebrd-beeps.com/data/mena-es-2013-
2015/)
22
sectors that do not appeal to educated workers, namely construction, trade, and transport. These
sectors offer mostly informal jobs and that are often precarious and intermittent.
Overall, the evidence suggests the Arab Spring has had a significant impact on the
economy affecting in the short run certain sectors badly such as the tourism sector, and slowing
down foreign investment. In addition, given the rigidity of the labor market, this has led to very
little labor market mobility: no hiring but limited firing underscoring further the rigidity and
lack of dynamism in the Egyptian labor market.
5.5 Benefits of formality
It is not surprising that having an unprotected job might entail a loss of several advantages
compared to protected employment. Without a job contract workers do not benefit from social
security coverage as well as other rights and benefits such as paid holidays and health insurance.
Moreover, it is well documented in the literature that informal employment is associated with
a pay penalty (e.g., Bargain and Kwenda 2015; Tansel et al. 2015; Elbadouai et al. 2008; Pagés
and Stampini 2009). It is paramount to understand the benefits and costs of holding a protected
job and how this changed over time. We first examine the wage differential between both types
of employment to quantify the attractiveness of contracted private formal jobs. Wage is defined
by log hourly net wage, as opposed to gross wage, which represents a major advantage of the
ELMPS dataset over other data sources that have been used to investigate pay gaps between
informal and formal employment using gross wages. This makes the analyses robust to the
impact of taxes which could affect formal but not informal workers, without having to make
extra calculations of taxes that may lead to measurement errors. Wages are only observed at
the time of survey- 1998, 2006 and 2012- the three waves of the ELMPS. To investigate wage
differentials between workers with contracts and those without over time, we estimate the
following equation:

23
𝑙𝑜𝑔 𝑊𝑖𝑡 = 𝛾0 + 𝛾1𝐼𝑛𝑓𝑖𝑡 + 𝛾2𝑍𝑖𝑡 + 𝜀𝑖𝑡 (6)
Where 𝑙𝑜𝑔 𝑊𝑖𝑡 is the log hourly net wage, 𝐼𝑛𝑓𝑖𝑡 is a dummy variable for informal
(uncontracted) employment, and 𝑍𝑖𝑡 is a vector of control variables for individual demographic
characteristics such as age, work experience, urban/rural residence, marital status and
employment characteristics such as firm size and industry.
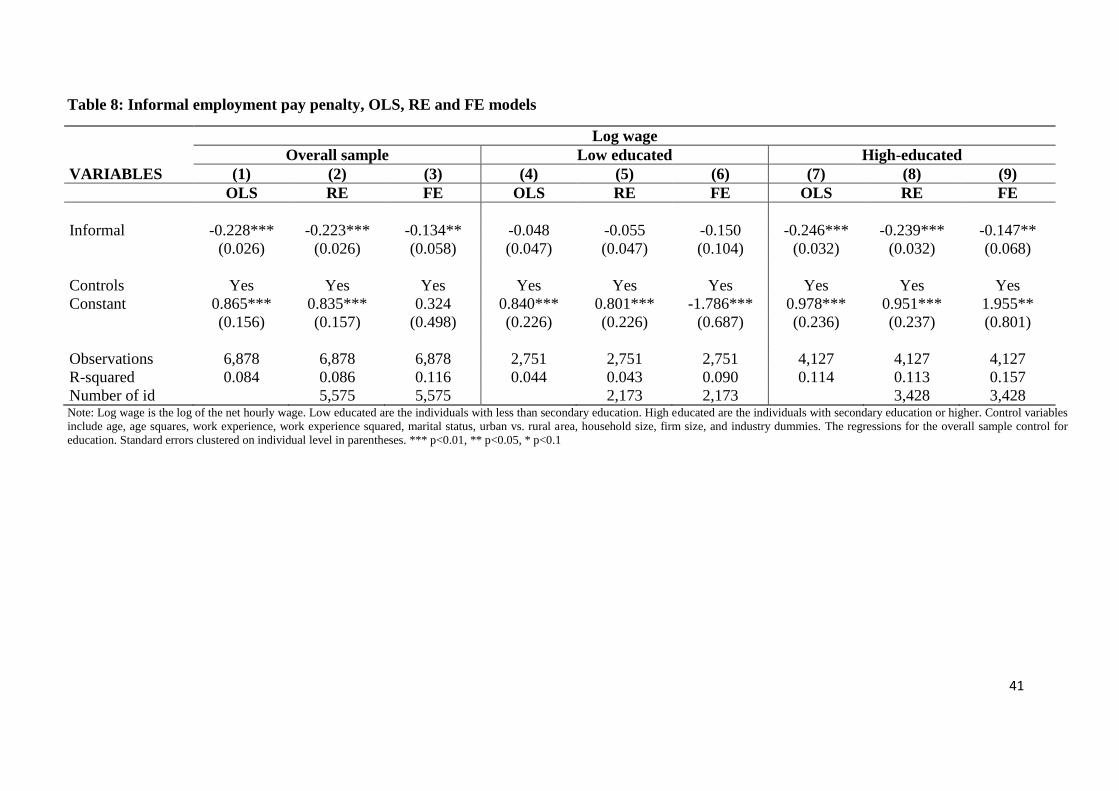
Table 8 examines the wage gap between informal and formal employment using pooled
OLS regression across the three waves, RE and FE models. The table shows that informal
employment is associated with a wage penalty of 22 log points in the OLS and RE models, and
13 percentage points in the FE model. The pay penalty is significant only for the high educated.
Accounting for unobserved heterogeneity by using the FE model reduces the penalty but does
not eliminate it.
To investigate changes in informal employment pay gap over time, we use the panel
sample and estimate the following equation of log wages as a function of individual
characteristics (Zit), a dummy variable for informal jobs – work without contract -(𝐼𝑛𝑓𝑖𝑡), a
dummy for the wave (1998, 2006, and 2012) and the interaction between informal work and
Wave. The coefficient of interest is 𝜋.
log 𝑊𝑖𝑡 = γ𝜃0 + 𝜃1𝑍𝑖𝑡 + 𝜎𝐼𝑛𝑓𝑖𝑡 + 𝜏𝑊𝑎𝑣𝑒𝑡 + 𝜋[𝐼𝑛𝑓𝑖𝑡 ∗ 𝑊𝑎𝑣𝑒𝑡] + 𝜀𝑖𝑡 (7)
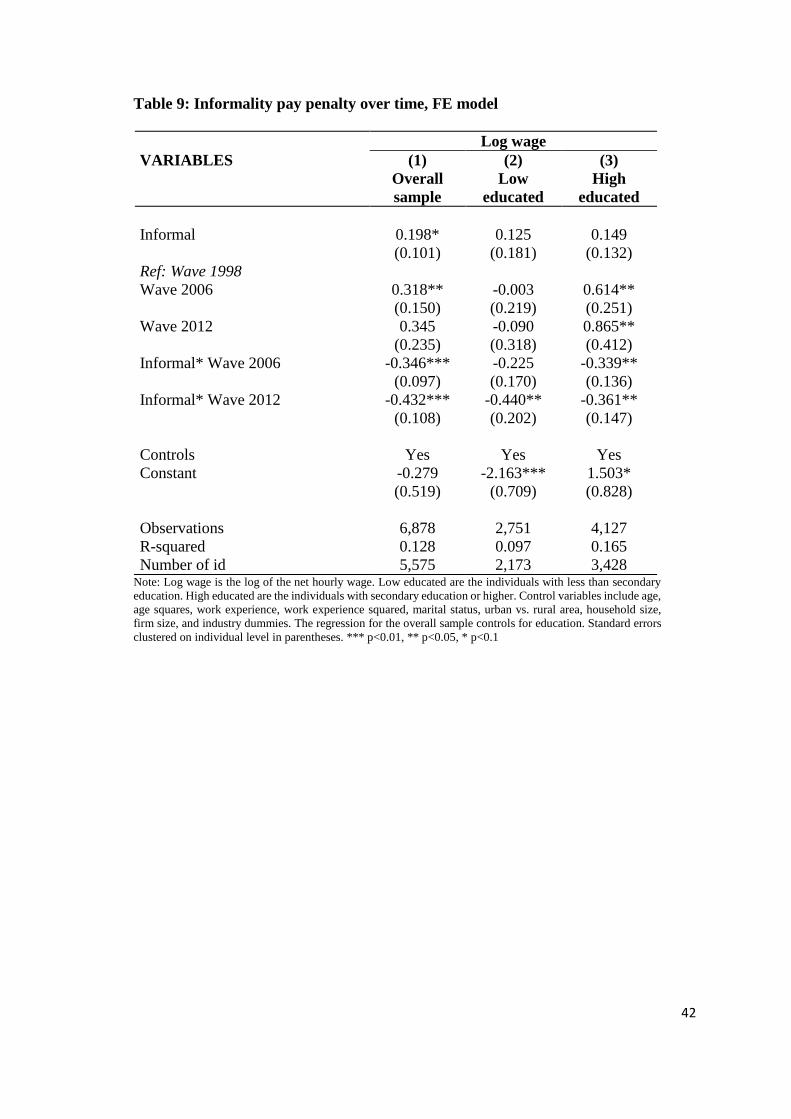
Controlling for individual fixed effects, Table 9 shows the FE model after controlling
for the interaction between wave dummies and informal employment dummy. The table shows
that informal pay penalty increased significantly over time for both low- and high-educated
workers. In essence this underscores the monetary advantages of formal jobs, and moreover
how the divergence between informal and formal wage gap increased in particular for the
24
educated, perhaps fueling the frustration of that group about their lack of decent formal job
opportunities before the 2011 revolution and straight afterwards.
6. Conclusion
This paper focuses on the dynamics of informality and asks whether workers face more labor
market barriers during political instability and whether low educated unprotected workers fare
the same as high-educated unprotected workers during periods of political turmoil.
Using data from Egypt, our findings suggest that the incidence of working without job
contract has increased over time for both groups, but for different reasons. In particular, the
increase in informality between 2006 and 2012 was driven by the highly educated workers who
remained in informal employment, and the low-educated formal workers who lost their job
contracts and became informally employed.
Furthermore, the evidence seems to suggest that the Arab Spring has affected
informality even more. The probability to start an informal employment increased after the
revolution for both the educated and low educated workers. Conditional on being informally
employed, the probability to move to formal employment decreased after the revolution.
Overall, our results show that during the political turmoil, informality has increased and
the high educated workers were affected more than the low-educated. This suggests that the
Revolution might have led to more frustration amongst the young educated workers at least in
the short term, and possibly in the medium term given the continuation of unstable political
and economic conditions in Egypt.
25
References
Aisen, A. and Veiga, F.J., 2013. How does political instability affect economic growth?.
European Journal of Political Economy, 29, pp.151-167.
Alesina, A. and Perotti, R. 1996. “Income distribution, political instability, and investment”.
European economic review, 40(6), pp.1203-1228.
Angel-Urdinola, D. and A. Kuddo. 2010 “Key Characteristics of Employment Regulations in
the Middle East and North Africa.” World Bank SP Discussion Paper 1006. Washington DC:
The World Bank.
Assaad, R. (2009). Labor supply, employment and unemployment in the Egyptian economy,
1988–2006. In R. Assaad (Ed.), The Egyptian labor market revisited (pp. 1–52). Cairo:
American University in Cairo Press.
Assaad, R. and Krafft, C., 2013. The Egypt labor market panel survey: introducing the 2012
round. IZA Journal of Labor & Development, 2(1), pp.1-30.
Assaad, R. and Krafft, C., 2015a. “The evolution of labor supply and unemployment in the
Egyptian economy: 1988-2012. In Assaad, R. and Krafft: “The Egyptian Labor Market in an
Era of Revolution”, Oxford University Press. pp.1-26.
Assaad, R., & Krafft, C. 2015b. “The Structure and Evolution of Employment in Egypt: 1998-
2012”. In Assaad, R. and Krafft: “The Egyptian Labor Market in an Era of Revolution”, Oxford
University Press. pp.27-51.
Assaad, R., C. Krafft and S. Yassin. 2017 “Job creation or labor absorption? An analysis of
private sector employment growth by industry in Egypt.” Economic Research Forum, mimeo.
Bargain, O. and Kwenda, P. 2014. “The Informal Sector Wage Gap: New Evidence Using
Quantile Estimations on Panel Data”, Economic Development and Cultural Change, 63
(1):117-153.
Bosch, M., & Maloney, W. 2010. “Comparative Analysis of Labor Market Dynamics Using
Markov Processes: An Application to Informality”, Labour Economics, 17(4), 621–631.
Campante, F.R. and Chor, D., 2012. “Why was the Arab world poised for revolution?
Schooling, economic opportunities, and the Arab Spring”, Journal of Economic Perspectives,
26(2), pp.167-187.
Cunningham, W. V. and Maloney, W. F. 2001, “Heterogeneity among Mexico’s
Microenterprises: An Application of Cluster and Factor Analysis”, Economic Development
and Cultural Change 50 (1): 131 – 156.
Devarajan Shantayanan and Ianchovichina, Elena. 2017, “ A Broken Social Contract , Not
High Inequality led to the Arab Spring”, Review of Income and Wealth, forthcoming.

26
El Badaoui, E., Strobl, E., and Walsh, F. 2008. “Is there an informal employment wage penalty?
Evidence from South Africa”, Economic Development and Cultural Change, 56 (3): 683-710
Elbahnasawy, Nasr G . Ellisa, Michael A, and Adom, Assandé Désiré 2016, “Political
Instability and the Informal Economy”, World Development 85: 31–42.
Fields, G., 1975. “Rural-Urban migration, urban unemployment and underemployment, and
job search activity in LDCs”, Journal of Development Economics 2, 165 – 187.
Fields, G., 1990. “Labour market modelling and the urban informal sector: theory and
evidence. In: D. Thurnham, B. Salomé and A. Schwarz (eds.) The Informal Sector Revisited,
OECD, Paris.
Gatti R., D. Angel-Urdinola, J. Silva, and A. Bodor, 2011. Striving for Better Jobs. The
Challenges of Informality in Middle East and North Africa Region. Washington, DC: World
Bank, Directions in Development, No: 90271
Gong, X., Van Soest, A. and Villagomez, E., 2004, “Mobility in the Urban Labor Market: A
Panel Data Analysis for Mexico,” Economic Development and Cultural Change 53(1):
1-36.
Gong, X., Van Soest, A, 2002, “Wage differentials and mobility in the urban labour market: a
panel data analysis for Mexico”, Labour Economics 9: 513 – 529.
Günther, I. and Launov, A., 2012. Informal employment in developing countries: Opportunity
or last resort?. Journal of development economics, 97(1), pp.88-98.
Johnson, S., Kaufmann, D., and Zoido-Lobaton., 1998, “Regulatory Discretion and the
Unofficial Economy,” American Economic Review 88(2): 387- 392.
Lehmann, H., 2015. Informal employment in transition countries: empirical evidence and
research challenges. Comparative Economic Studies, 57(1), pp.1-30.
Leowe, M. at el. 2013. Which Factors Determine the Upgrading of Small and Medium-Sized
Enterprises (SMEs)? The case of Egypt. DIE, no . 76.
Magnac, T., 1991. Segmented or competitive labor markets. Econometrica 59 (1),
165–187.
Maloney, W., 1999, “Does Informality Imply Segmentation in Urban Labor Markets?
Evidence from Sectoral Transitions in Mexico,” The World Bank Economic Review 13
(2): 275 – 302.
Maloney, W., 2004, “Informality Revisited,” World Development 4(8):655-679.
Pagés, C. and Stampini, M. 2009. “No Education, no Good Jobs? Evidence on the Relationship
between Education and Labor Market Segmentation.” Journal of Comparative Economics 37
(2): 387 – 401.
Pratap, S., Quintin, E., 2006. Are labor markets segmented in developing countries? A
27
semiparametric approach. European Economic Review 50 (7), 1817–1841.
Radchenko, N., 2014. Heterogeneity in informal salaried employment: Evidence from the
Egyptian labor market survey. World Development, 62, pp.169-188.
Silver, Hannah C., Caudill, Steven B. and Mix, Franklin G. 2017, “ Human capital and life
satisfaction in economic transition: Econometric evidence from pre- and post-Arab Spring
Egypt”, Economics of Transition, 25 (2): 165-184.
Tansel, A. and Ozdemir, Z. A. 2014, “Determinants of Transitions across Formal / Informal
Sectors in Egypt”, Economic Research Forum Working Paper Series 899.
Tansel, A. Keskin, H. I. and Ozdemir, Z. 2015, “Is There an Informal Employment Wage
Penalty in Egypt?” IZA Discussion Paper Series. No. 9359.
Wahba, J. 2009. “Informality in Egypt: A Stepping Stone or a Dead End?”. Economic Research
Forum Working Paper Series 456. Cairo, Egypt.
Wahba, J. and Assaad, R. 2017, “Flexible labor regulations and informality in Egypt,”
Review of Development Economics 21 (4), 962-984.
Yassin, Shaimaa 2015, “ Job Accession, Separation, and Mobility in the Egyptian Labor
Market over the Past Decade.” In Assaad, R. and Krafft: “The Egyptian Labor Market in an
Era of Revolution”, Oxford University Press.
28
Figure 1: Share of informal private employment in total employment over time
Note: Based on ELMPS 1998, 2006 and 2012. Sample for males. Informal work is non-
contracted non-agriculture private waged employment.
.1.2
.3.4
.5.6
1998 2006 2012Wave
Overall sample High educated
Low educated
Share of informal workers
29
Figure 2: Probability of starting informal employment over time by educational level
Source: ELMPS12.
30
Figure 3: Share of informality 2010- 2014 by quarter in the Egyptian labor market, LFS
Source: LFS.
.6.7
.8.9
1
Q4: 2010 Q4: 2011 Q4: 2012 Q4: 2013 Q4: 2014Quarter
Informal employment Informal employment: highly educated
Informal employment: low educated

31
Figure 4: Share of firms formally registered by year
Source: MENA Enterprise Survey, EBRD.
.4.6
.81
Sh
are
of
firm
s f
orm
ally
re
gis
tere
d
2006 2008 2010 2012 2014Year

32
Table 1: Probability of informal employment, LPM, RE, and FE models.
Informal employment
Overall sample Low educated High educated
(1) (2) (3) (4) (5) (6) (7) (8) (9)
VARIABLES LPM RE FE LPM RE FE LPM RE FE
Ref: Wave 1998
Wave 2006 -0.012 -0.014 -0.027 0.002 0.001 -0.069 -0.032* -0.034* 0.044
(0.011) (0.011) (0.061) (0.012) (0.012) (0.062) (0.018) (0.018) (0.119)
Wave 2012 0.062*** 0.060*** 0.053 0.041*** 0.041*** -0.059 0.064*** 0.062*** 0.230
(0.011) (0.011) (0.104) (0.012) (0.012) (0.105) (0.017) (0.017) (0.202)
Controls Yes Yes Yes Yes Yes Yes Yes Yes Yes
Observations 6,878 6,878 6,878 2,751 2,751 2,751 4,127 4,127 4,127
R-squared 0.481 0.482 0.168 0.336 0.332 0.085 0.493 0.492 0.244
N. of individuals 5,575 5,575 2,173 2,173 3,428 3,428 Note: Low educated are the individuals with less than secondary education. High educated are the individuals with secondary education or higher. Control variables include age, age squares, work experience,
work experience squared, marital status, urban vs. rural area, household size, firm size, and industry dummies. The regressions for the overall sample control for education. Standard errors clustered on individual
level in parentheses. *** p<0.01, ** p<0.05, * p<0.1
33
Table 2A: Transition matrices 1998-2012, total sample
A) Transition matrix between 1998 and 2006
Employment status 2006
Employment status 1998
Formal
private informal
self-
empl Public unpaid Unemployed OLF Total
private formal 64.44 14.07 5.93 12.59 0.00 2.22 0.74 100
private informal 12.83 53.91 13.91 13.04 0.65 3.04 2.61 100
self-employed 0.90 18.02 65.77 7.21 0.00 0.90 7.21 100
Public 3.72 2.40 1.08 90.53 0.00 0.12 2.16 100
unpaid family worker 2.63 34.21 28.95 7.89 21.05 2.63 2.63 100
Unemployed 9.60 41.24 16.38 18.08 1.13 11.30 2.26 100
OLF 14.40 28.53 9.51 28.26 2.99 10.87 5.43 100
Total 11.73 23.46 10.79 46.11 1.13 3.77 3.01 100
B) Transition matrix between 2006 and 2012
Employment status 2012
Employment status 2006
Formal
private Informal
self-
empl public unpaid unemployed OLF Total
private formal 43.27 26.65 3.96 20.05 0.00 4.22 1.85 100
private informal 8.05 65.49 9.71 9.90 0.28 4.07 2.50 100
self-employed 3.79 38.28 43.45 7.93 0.34 4.14 2.07 100
Public 4.17 3.26 0.73 89.76 0.09 0.45 1.54 100
unpaid family worker 9.21 52.63 13.16 10.53 10.53 2.63 1.32 100
Unemployed 14.34 44.12 6.25 18.38 2.94 12.50 1.47 100
OLF 14.94 40.77 8.67 16.42 1.85 10.52 6.83 100
Total 11.62 35.72 8.76 35.88 0.83 4.54 2.64 100
34
Table 2B: Transition matrices 1998-2012 for the low-educated
A) Transition matrix between 1998 and 2006
Employment status 2006
Employment status 1998
Formal
private informal
self-
empl Public unpaid Unemployed OLF Total
private formal 63.33 16.67 13.33 6.67 0.00 0.00 0.00 100.00
private informal 5.58 66.53 14.74 7.57 0.00 3.19 2.39 100.00
self-employed 1.45 17.39 66.67 5.80 0.00 1.45 7.25 100.00
Public 3.09 5.56 0.00 84.57 0.00 0.62 6.17 100.00
unpaid family worker 0.00 35.71 35.71 7.14 21.43 0.00 0.00 100.00
Unemployed 3.03 69.70 12.12 6.06 3.03 0.00 6.06 100.00
OLF 3.80 54.43 15.19 15.19 2.53 6.33 2.53 100.00
Total 6.74 41.38 16.93 27.74 0.94 2.35 3.92 100.00
B) Transition matrix between 2006 and 2012
Employment status 2012
Employment status 2006
Formal
private Informal
self-
empl public unpaid unemployed OLF Total
private formal 27.27 49.09 5.45 12.73 0.00 1.82 3.64 100.00
private informal 3.23 74.34 11.52 4.85 0.00 2.83 3.23 100.00
self-employed 2.54 39.83 49.15 5.08 0.00 2.54 0.85 100.00
Public 7.94 5.56 1.59 80.95 0.79 0.00 3.17 100.00
unpaid family worker 11.76 47.06 17.65 0.00 17.65 5.88 0.00 100.00
Unemployed 9.68 58.06 9.68 9.68 0.00 6.45 6.45 100.00
OLF 3.81 69.52 10.48 2.86 1.90 4.76 6.67 100.00
Total 5.60 57.87 14.47 15.31 0.63 2.75 3.38 100.00
35
Table 2C: Transition matrices 1998-2012 for the high-educated
A) Transition matrix between 1998 and 2006
Employment status 2006
Employment status 1998
Formal
private informal
self-
empl Public unpaid Unemployed OLF Total
private formal 67.01 13.40 2.06 13.40 0.00 3.09 1.03 100
private informal 22.91 37.99 12.85 20.11 1.68 3.35 1.12 100
self-employed 0.00 17.65 64.71 8.82 0.00 0.00 8.82 100
Public 3.35 1.12 1.12 93.30 0.00 0.00 1.12 100
unpaid family worker 4.55 31.82 22.73 9.09 22.73 4.55 4.55 100
Unemployed 10.64 35.46 17.73 21.28 0.71 13.48 0.71 100
OLF 18.25 20.53 7.98 33.46 1.90 11.79 6.08 100
Total 14.01 15.04 7.70 55.54 1.03 4.40 2.27 100
B) Transition matrix between 2006 and 2012
Employment status 2012
Employment status 2006
Formal
private Informal
self-
empl public unpaid unemployed OLF Total
private formal 46.75 22.73 3.90 21.43 0.00 4.22 0.97 100
private informal 13.00 56.78 7.51 14.84 0.55 5.49 1.83 100
self-employed 4.90 39.16 35.66 11.89 0.70 5.59 2.10 100
Public 3.85 2.75 0.66 91.43 0.00 0.55 0.77 100
unpaid family worker 8.47 54.24 11.86 13.56 8.47 1.69 1.69 100
Unemployed 15.25 41.95 5.08 19.92 3.39 13.56 0.85 100
OLF 19.31 32.80 8.47 20.63 1.85 11.38 5.56 100
Total 14.38 27.75 6.24 43.76 0.93 5.12 1.82 100
36
Table 3: Predicted probability of switching employment status between waves, based on Multinomial Logit Analysis
Overall sample Low educated High educated
(1) (2) (3) (4) (5) (6) (7) (8) (9)
1998-2006 2006-2012 P value 1998-2006 2006-2012 P value 1998-2006 2006-2012 P value
1) Probability to stay in
Private informal 0.068 0.109 0.000 0.090 0.129 0.000 0.044 0.094 0.000
Private formal 0.073 0.070 0.004 0.084 0.043 0.000 0.082 0.083 0.117
2) Probability to switch from private informal employment to
Private formal 0.016 0.015 0.003 0.005 0.004 0.002 0.033 0.025 0.000
Self-employed 0.017 0.018 0.109 0.018 0.019 0.142 0.016 0.014 0.092
Government/public enterprise 0.017 0.019 0.000 0.009 0.008 0.005 0.029 0.027 0.034
Unpaid family worker 0.000 0.000 0.346 0.000 0.000 0.130 0.000 0.000 0.531
Unemployed 0.005 0.004 0.056 0.001 0.003 0.000 0.002 0.006 0.000
OLF 0.002 0.002 0.329 0.002 0.003 0.009 0.001 0.001 0.341
3) Probability to switch from private formal employment to
Private informal 0.025 0.051 0.000 0.021 0.093 0.000 0.021 0.038 0.000
Self-employed 0.009 0.007 0.002 0.014 0.007 0.000 0.003 0.005 0.001
Government/public enterprise 0.015 0.033 0.000 0.006 0.015 0.000 0.017 0.036 0.000
Unpaid family worker 0.000 0.000 0.238 0.000 0.000 0.229 0.000 0.000 0.759
Unemployed 0.003 0.005 0.042 0.000 0.003 0.000 0.003 0.005 0.003
OLF 0.001 0.001 0.128 0.000 0.006 0.000 0.001 0.000 0.000
Note: Predicted probabilities are calculated from Multinomial Logit Analysis. The estimates are adjusted for the number of years between each two waves. Control variables include age, age squared,
work experience, work experience squared, marital status, urban vs. rural area, household size, firm size, and industry dummies. The regressions for the overall sample control for education. Standard
errors clustered on individual level in parentheses. P value is for t-test for whether the difference between col 1 and col 2 is significant. *** p<0.01, ** p<0.05, * p<0.1

37
Table 4: Predicted probability of moving out of and into formal and informal
employment between each two waves, based on a probit model
Informal-formal Formal-informal
VARIABLES (1) (2) (3) (4)
1998-2006 2006-2012 1998-2006 2006-2012
Highly educated 0.209** 0.039 0.007 -0.286***
(0.087) (0.034) (0.078) (0.069)
Urban -0.092* -0.064** -0.096 0.018
(0.053) (0.025) (0.090) (0.071)
Age 0.049 -0.005 -0.100 -0.024
(0.038) (0.016) (0.075) (0.044)
Age square -0.001 0.000 0.001 0.000
(0.001) (0.000) (0.001) (0.001)
Work experience -0.003 -0.004 0.033 -0.010
(0.011) (0.006) (0.026) (0.020)
Work exp. square -0.001 -0.000 -0.001 0.000
(0.000) (0.000) (0.001) (0.001)
Married 0.029 -0.069** 0.186* 0.121
(0.057) (0.029) (0.096) (0.090)
Household size -0.001 -0.006 0.031*** 0.008
(0.008) (0.005) (0.011) (0.013)
Ref: Firm <10 workers
Firm 10-99 workers 0.110* 0.160*** -0.597 -0.210**
(0.067) (0.044) (75.775) (0.096)
Firm>=100 workers 0.440*** 0.262*** -0.844 -0.302***
(0.158) (0.093) (75.775) (0.092)
Ref: Manufacturing
Construction 0.017 -0.057* -0.119 0.188
(0.064) (0.030) (5.804) (0.144)
Trade 0.008 0.019 0.233** 0.049
(0.063) (0.036) (0.113) (0.092)
Transportation -0.091 -0.046 -0.125 0.055
(0.062) (0.036) (13.006) (0.106)
Finance and services -0.078 0.007 -0.145 0.040
(0.080) (0.043) (14.854) (0.088)
Observations 265 675 89 223 Note: Balanced sample of observations. Control variables include age, age squared, work experience, work experience
squared, marital status, urban vs. rural area, household size, education, firm size, and industry dummies. Standard errors
clustered on individual level in parentheses. *** p<0.01, ** p<0.05, * p<0.1.
38
Table 5: LPM of informality status before and after the Arab Spring revolution
(1) (2) (3)
VARIABLES Overall sample Low educated High educated
A) The probability of informal employment
After revolution 0.083*** 0.082** 0.081***
(0.023) (0.040) (0.027)
Controls Yes Yes Yes
Observations 1,147 229 918
R-squared 0.473 0.504 0.441
B) The probability of switching from informal to formal employment
After revolution -0.123*** -0.121* -0.121**
(0.040) (0.062) (0.051)
Controls Yes Yes Yes
Observations 561 169 392
R-squared 0.199 0.231 0.154
C) The probability of switching from formal to informal employment
After revolution 0.076 0.375 0.038
(0.064) (0.351) (0.068)
Controls Yes Yes Yes
Observations 211 22 189
R-squared 0.239 0.484 0.211 Note: Using retrospective data in 2012 wave. Before the revolution is 2009-10 and after is (2011-2012). Low educated are the individuals with less than secondary education. High educated are the individuals with secondary
education or higher. Control variables include age, age squared, work experience, work experience squared, marital
status, urban vs. rural area, household size. The regressions for the overall sample control for education. Standard errors
clustered on individual level in parentheses. *** p<0.01, ** p<0.05, * p<0.1
39
Table 6: Regression discontinuity estimates of the impact of the Arab Spring revolution on
informal employment, LFS
Informal employment
Overall Low-educated High-educated
VARIABLES (1) (2) (3)
Post-revolution dummy 0.087*** 0.042*** 0.085***
(0.010) (0.010) (0.014)
Controls Yes Yes Yes
Trend & trend square Yes Yes Yes
Gov. dummies Yes Yes Yes
Observations 178,186 78,705 99,481
R-squared 0.329 0.204 0.318 Note: Using data from LFS waves 2010, 2011, 2012, 2013, and 2014. Standard errors are clustered
on the gov*quarter level (299 clusters). Controls include age, age square, marital status, firm size,
and industry dummies. The regression for the overall sample controls for level of education. ***
p<0.01, ** p<0.05, * p<0.1
40
Table 7: Occupational skill change associated with moving to/from formality
Change in Occupational skill
VARIABLES (1) (2)
Moved to formal employment 0.069*
(0.036)
Moved to informal employment -0.157**
(0.061)
Controls Yes Yes
Observations 405 187
R-squared 0.063 0.088 Source: ELMPS data. Control variables include age, age squared, work experience, work
experience squared, marital status, urban vs. rural area, household size, and education.
Standard errors clustered on individual level in parentheses. *** p<0.01, ** p<0.05, * p<0.1
41
Table 8: Informal employment pay penalty, OLS, RE and FE models
Log wage
Overall sample Low educated High-educated
VARIABLES (1) (2) (3) (4) (5) (6) (7) (8) (9)
OLS RE FE OLS RE FE OLS RE FE
Informal -0.228*** -0.223*** -0.134** -0.048 -0.055 -0.150 -0.246*** -0.239*** -0.147**
(0.026) (0.026) (0.058) (0.047) (0.047) (0.104) (0.032) (0.032) (0.068)
Controls Yes Yes Yes Yes Yes Yes Yes Yes Yes
Constant 0.865*** 0.835*** 0.324 0.840*** 0.801*** -1.786*** 0.978*** 0.951*** 1.955**
(0.156) (0.157) (0.498) (0.226) (0.226) (0.687) (0.236) (0.237) (0.801)
Observations 6,878 6,878 6,878 2,751 2,751 2,751 4,127 4,127 4,127
R-squared 0.084 0.086 0.116 0.044 0.043 0.090 0.114 0.113 0.157
Number of id 5,575 5,575 2,173 2,173 3,428 3,428 Note: Log wage is the log of the net hourly wage. Low educated are the individuals with less than secondary education. High educated are the individuals with secondary education or higher. Control variables
include age, age squares, work experience, work experience squared, marital status, urban vs. rural area, household size, firm size, and industry dummies. The regressions for the overall sample control for
education. Standard errors clustered on individual level in parentheses. *** p<0.01, ** p<0.05, * p<0.1
42
Table 9: Informality pay penalty over time, FE model
Log wage
VARIABLES (1) (2) (3)
Overall
sample
Low
educated
High
educated
Informal 0.198* 0.125 0.149
(0.101) (0.181) (0.132)
Ref: Wave 1998
Wave 2006 0.318** -0.003 0.614**
(0.150) (0.219) (0.251)
Wave 2012 0.345 -0.090 0.865**
(0.235) (0.318) (0.412)
Informal* Wave 2006 -0.346*** -0.225 -0.339**
(0.097) (0.170) (0.136)
Informal* Wave 2012 -0.432*** -0.440** -0.361**
(0.108) (0.202) (0.147)
Controls Yes Yes Yes
Constant -0.279 -2.163*** 1.503*
(0.519) (0.709) (0.828)
Observations 6,878 2,751 4,127
R-squared 0.128 0.097 0.165
Number of id 5,575 2,173 3,428 Note: Log wage is the log of the net hourly wage. Low educated are the individuals with less than secondary
education. High educated are the individuals with secondary education or higher. Control variables include age,
age squares, work experience, work experience squared, marital status, urban vs. rural area, household size,
firm size, and industry dummies. The regression for the overall sample controls for education. Standard errors
clustered on individual level in parentheses. *** p<0.01, ** p<0.05, * p<0.1

43
Appendix A
Table A1: Share of individuals in different employment status over time, in percent
Employment status Overall 1998 2006 2012 2012-1998 % % % % P value
Private formal 9.25 6.60 10.11 9.73 0.000
Private informal 32.75 24.91 30.07 38.55 0.000
Self-employed 7.94 6.20 8.70 8.09 0.000
Government/Public Enterprise 27.06 33.22 27.18 24.17 0.000
Unpaid family worker 1.68 2.11 2.02 1.19 0.000
Unemployed 6.81 8.94 6.90 5.77 0.000
OLF 14.51 18.02 15.02 12.50 0.000 Note: Based on ELMPS 1998, 2006 and 2012, sample for males. P value is for t-test for whether the difference between
1998 and 2012 is significant.

44
Table A2: Characteristics of informal and formal private waged workers
(1998-2012)
Overall 1998 2012
(1) (2) (4) (5) (7) (8)
Informal Formal Informal Formal Informal Formal
Log hourly wage 1.36 1.66 1.26 1.46 1.41 1.71
High educated 0.53 0.84 0.39 0.74 0.60 0.88
Work experience 13.05 11.88 13.42 11.92 12.96 11.70
Age 30.23 32.90 29.73 31.78 30.68 33.30
Urban 0.56 0.75 0.70 0.84 0.51 0.71
Married 0.58 0.70 0.49 0.58 0.64 0.75
Household size 5.02 4.29 5.93 5.10 4.62 3.89
Firm Size
<10 workers 0.81 0.12 0.83 0.08 0.80 0.08
10-99 workers 0.15 0.37 0.15 0.45 0.15 0.31
> 99 workers 0.04 0.51 0.03 0.47 0.05 0.61
Industry
Manufacturing 0.22 0.43 0.28 0.54 0.19 0.41
Construction 0.29 0.08 0.22 0.07 0.32 0.08
Trade 0.21 0.16 0.23 0.17 0.20 0.17
Transportation 0.16 0.09 0.17 0.11 0.16 0.05
Finance and service 0.13 0.24 0.10 0.10 0.13 0.29
Num. of observations 5,393 1,483 806 219 2,787 688
Note: Based on ELMPS 1998, 2006 and 2012. Sample for males.
45
Table A3: Informal employment and background characteristics before and after the
revolution
(1) (2) (3)
Before
(2009-2010)
After
(2011-2012) After-before
A) Informal employment measures
Informal employment 0.57 0.66 0.08**
Moved from informal to formal 0.44 0.37 -0.07*
Moved from formal to informal 0.27 0.45 0.18**
B) Background information
High educated 0.80 0.79 -0.01
Work experience 8.24 7.09 -1.15**
Age 28.57 27.40 -1.17***
Urban 0.54 0.55 0.01
Married 0.49 0.43 -0.07**
Household size 4.36 4.33 -0.03
Firm size
<10 workers 0.48 0.50 0.02
10-99 workers 0.24 0.25 0.01
> 99 workers 0.28 0.26 -0.03
Industry
Manufacturing 0.22 0.18 -0.04
Construction 0.21 0.19 -0.02
Trade 0.18 0.18 0.00
Transportation 0.11 0.10 -0.02
Finance and service 0.28 0.35 0.07**
Number of observations 766 381
46
Table A4: Informal employment and background characteristics before and after the revolution for
low- and high-educated
Low educated High educated
Before After
After-
Before Before After
After-
Before
Diff in
diff
Informal employment measures
Informal employment 0.77 0.91 0.14** 0.53 0.59 0.06* -0.08
Moved from informal to formal 0.27 0.15 -0.12* 0.51 0.48 -0.03 0.09
Moved from formal to informal 0.45 0.88 0.43* 0.26 0.39 0.13* -0.30
Background information
Work experience 13.09 12.70 -0.39 7.06 5.62 -1.44** -1.05
Age 28.48 27.35 -1.13* 28.60 27.41 -1.19** -0.06
Urban 0.47 0.53 0.06 0.56 0.56 0.00 -0.06
Married 0.51 0.49 -0.02 0.49 0.41 -0.08* -0.06
Household size 4.70 4.54 -0.16 4.28 4.27 -0.01 0.15
Firm size
<10 workers 0.62 0.73 0.11* 0.44 0.43 -0.01 -0.12
10-99 workers 0.17 0.18 0.01 0.25 0.26 0.01 0.00
> 99 workers 0.21 0.09 -0.12* 0.30 0.30 0.00 0.12*
Industry
Manufacturing 0.27 0.20 -0.07 0.20 0.17 -0.03 0.04
Construction 0.27 0.20 -0.07 0.20 0.19 -0.01 0.06
Trade 0.16 0.29 0.13* 0.19 0.16 -0.03 -0.16**
Transportation 0.15 0.14 -0.01 0.10 0.09 -0.01 0.00
Finance and service 0.15 0.16 0.01 0.31 0.40 0.09** 0.08
Number of observations 150 79 616 302
47
Table A5: Propensity score matching first stage estimates
Probability to switch from informal to formal employment
1998-2006 2006-2012
(1) (2) (3) (4) (5) (6)
Variables Whole
sample
Low
educated
High
educated
Whole
sample
Low
educated
High
educated
High educated 0.609**
0.656***
(0.261)
(0.136)
Work experience -0.071** -0.054 -0.060 -0.013 -0.024 -0.015
(0.026) (0.039) (0.042) (0.014) (0.025) (0.018)
Age 0.054* -0.035 0.093** 0.012 0.039 0.011
(0.028) (0.054) (0.037) (0.015) (0.027) (0.019)
Urban 0.465* 0.468 0.602* 0.527*** 0.913*** 0.436***
(0.248) (0.364) (0.358) (0.113) (0.281) (0.130)
Married 0.243 0.808* (-0.006 -0.401** -0.462** -0.358**
(0.268) (0.474) (0.358) (0.128) (0.218) (0.160)
Household size -0.012 -0.029 0.003 -0.047* -0.001 -0.073**
(0.035) (0.055) (0.049) (0.024) (0.042) (0.029)
Number of
Observations
286 164 101 675 341 334
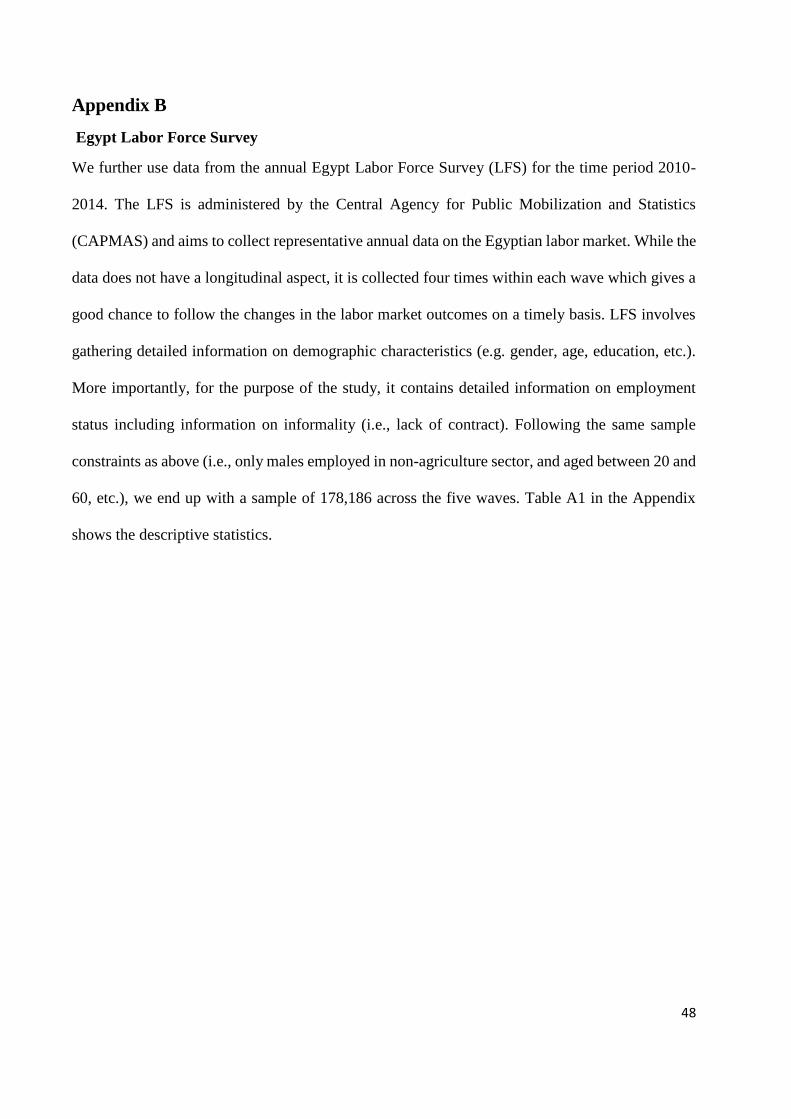
48
Appendix B
Egypt Labor Force Survey
We further use data from the annual Egypt Labor Force Survey (LFS) for the time period 2010-
2014. The LFS is administered by the Central Agency for Public Mobilization and Statistics
(CAPMAS) and aims to collect representative annual data on the Egyptian labor market. While the
data does not have a longitudinal aspect, it is collected four times within each wave which gives a
good chance to follow the changes in the labor market outcomes on a timely basis. LFS involves
gathering detailed information on demographic characteristics (e.g. gender, age, education, etc.).
More importantly, for the purpose of the study, it contains detailed information on employment
status including information on informality (i.e., lack of contract). Following the same sample
constraints as above (i.e., only males employed in non-agriculture sector, and aged between 20 and
60, etc.), we end up with a sample of 178,186 across the five waves. Table A1 in the Appendix
shows the descriptive statistics.
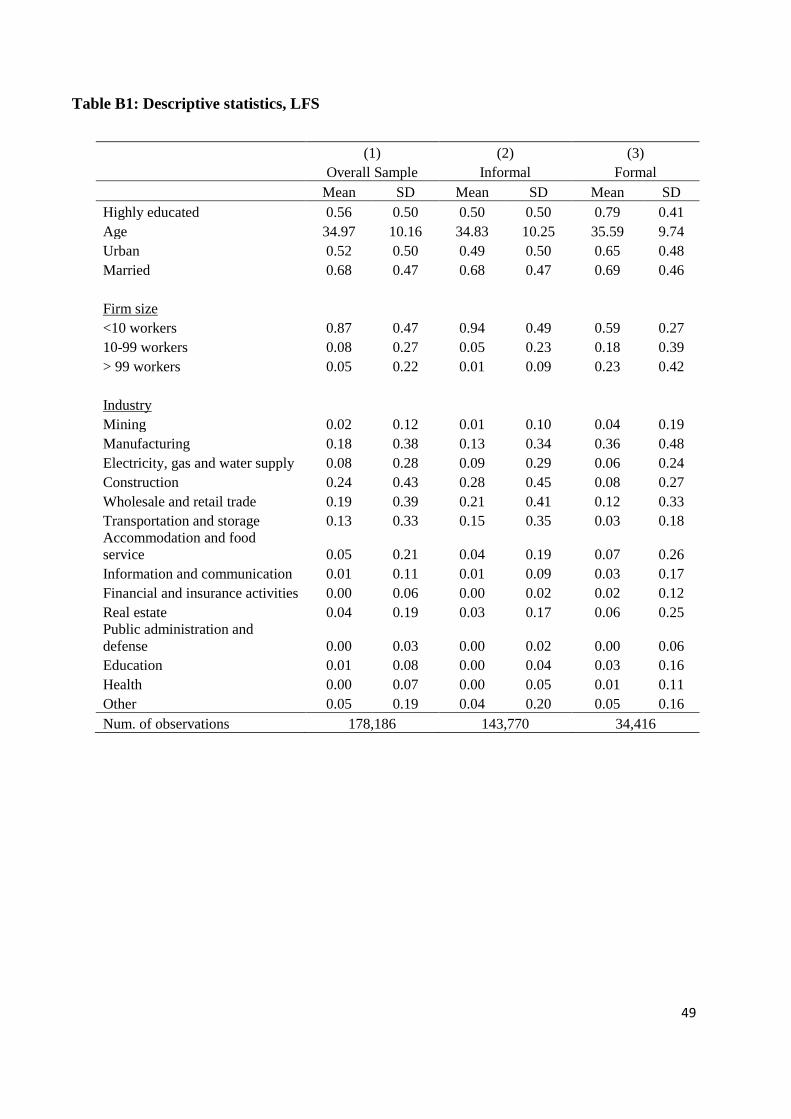
49
Table B1: Descriptive statistics, LFS
(1) (2) (3)
Overall Sample Informal Formal
Mean SD Mean SD Mean SD
Highly educated 0.56 0.50 0.50 0.50 0.79 0.41
Age 34.97 10.16 34.83 10.25 35.59 9.74
Urban 0.52 0.50 0.49 0.50 0.65 0.48
Married 0.68 0.47 0.68 0.47 0.69 0.46
Firm size
<10 workers 0.87 0.47 0.94 0.49 0.59 0.27
10-99 workers 0.08 0.27 0.05 0.23 0.18 0.39
> 99 workers 0.05 0.22 0.01 0.09 0.23 0.42
Industry
Mining 0.02 0.12 0.01 0.10 0.04 0.19
Manufacturing 0.18 0.38 0.13 0.34 0.36 0.48
Electricity, gas and water supply 0.08 0.28 0.09 0.29 0.06 0.24
Construction 0.24 0.43 0.28 0.45 0.08 0.27
Wholesale and retail trade 0.19 0.39 0.21 0.41 0.12 0.33
Transportation and storage 0.13 0.33 0.15 0.35 0.03 0.18
Accommodation and food
service 0.05 0.21 0.04 0.19 0.07 0.26
Information and communication 0.01 0.11 0.01 0.09 0.03 0.17
Financial and insurance activities 0.00 0.06 0.00 0.02 0.02 0.12
Real estate 0.04 0.19 0.03 0.17 0.06 0.25
Public administration and
defense 0.00 0.03 0.00 0.02 0.00 0.06
Education 0.01 0.08 0.00 0.04 0.03 0.16
Health 0.00 0.07 0.00 0.05 0.01 0.11
Other 0.05 0.19 0.04 0.20 0.05 0.16
Num. of observations 178,186 143,770 34,416