dicom segmentation and stl creation for 3d printing: a
TRANSCRIPT

RESEARCH Open Access
DICOM segmentation and STL creation for3D printing: a process and softwarepackage comparison for osseous anatomyTakashi Kamio* , Madoka Suzuki, Rieko Asaumi and Taisuke Kawai
Abstract
Background: Extracting and three-dimensional (3D) printing an organ in a region of interest in DICOM imagestypically calls for segmentation as a first step in support of 3D printing. The DICOM images are not exported to STLdata immediately, but segmentation masks are exported to STL models. After primary and secondary processing,including noise removal and hole correction, the STL data can be 3D printed. The quality of the 3D model isdirectly related to the quality of the STL data. This study focuses and reports on the DICOM to STL segmentationperformance for nine software packages.
Methods: Multidetector row CT scanning was performed on a dry human mandible with two 10-mm-diameterbearing balls as a phantom. The DICOM image file was then segmented and exported to an STL file using ninedifferent commercial/open-source software packages. Once the STL models were created, the data (file) properties andthe size and volume of each file were measured, and differences across the software packages were noted.Additionally, to evaluate differences between the shapes of the STL models by software package, each pair of STLmodels was superimposed, with the observed differences between their shapes characterized as the shape error.Results: The data (file) size of the STL file and the number of triangles that constitute each STL model were differentacross all software packages, but no statistically significant differences were found across software packages. Thecreated ball STL model expanded in the X-, Y-, and Z-axis directions, with the length in the Z-axis direction (body axisdirection) being slightly longer than that in the other directions. The mean shape error between software packages ofthe mandibular STL model was 0.11mm, but there was no statistically significant difference between them.
Conclusions: Our results revealed that there are some differences between the software packages that perform thesegmentation and STL creation of the DICOM image data. In particular, the features of each software packageappeared in the fine and thin areas of the osseous structures. When using these software packages, it is necessary tounderstand the characteristics of each.
Keywords: 3D printing, Computed-aided design, DICOM image, FDM 3D printer, Oral and maxillofacial surgery,Patient-specific, STL file
© The Author(s). 2020 Open Access This article is licensed under a Creative Commons Attribution 4.0 International License,which permits use, sharing, adaptation, distribution and reproduction in any medium or format, as long as you giveappropriate credit to the original author(s) and the source, provide a link to the Creative Commons licence, and indicate ifchanges were made. The images or other third party material in this article are included in the article's Creative Commonslicence, unless indicated otherwise in a credit line to the material. If material is not included in the article's Creative Commonslicence and your intended use is not permitted by statutory regulation or exceeds the permitted use, you will need to obtainpermission directly from the copyright holder. To view a copy of this licence, visit http://creativecommons.org/licenses/by/4.0/.The Creative Commons Public Domain Dedication waiver (http://creativecommons.org/publicdomain/zero/1.0/) applies to thedata made available in this article, unless otherwise stated in a credit line to the data.
* Correspondence: [email protected] of Oral and Maxillofacial Radiology, The Nippon DentalUniversity, 1-9-20 Fujimi-cho, Chiyoda-ku, Tokyo 102-8159, Japan
Kamio et al. 3D Printing in Medicine (2020) 6:17 https://doi.org/10.1186/s41205-020-00069-2

BackgroundDigital Imaging and Communications in Medicine(DICOM) is the leading standard around the worldwithin the medical imaging information field. Three-dimensional (3D) printing from DICOM images has becomeeasier with the advancement of technologies such as medicalengineering, imaging engineering, and the evolution anddecreasing costs of hardware and software. Patient-specific3D models are now being used in many situations withinthe oral and maxillofacial surgery fields, including education,surgical planning, and surgical simulation [1–4].3D printing of DICOM images works with stacked 2D
images that must be segmented to a data format requiredby the 3D printer. For this purpose, DICOM images arenow being segmented to a 3D computer-aided design(CAD) format for intermediate data, on which primaryprocessing, such as region of interest (ROI) setting, can beperformed. Of the approximately 100 file formats of 3DCAD data that are used as 3D native files and intermediatefiles [5], a stereolithography (STL) file format is the mostcommonly used format for 3D printing [6, 7]. There aremany commercial (fee-based) and open-source (free-of-charge) software packages for segmenting DICOM imagesto STL data, all of which can run on a general-purposepersonal computer (PC).Our 3D printing system uses a fused deposition model-
ing (FDM) desktop 3D printer, which is suitable for fabri-cating solid 3D models. We utilize 3D models in oral andmaxillofacial surgery that operate on osseous structures,such as tooth extraction, jaw cysts, jaw bone tumors, andjaw deformities [8]. As described in a previous report [9],even in the oral and maxillofacial fields, surgeons use theiranatomical knowledge and experiences to understand theanatomical structures on preoperative images or on thepatient intraoperatively. 3D models are particularly usefulbecause curved surfaces and minute areas are difficult tounderstand via a PC display. Compared to the number ofcase reports utilizing 3D models, there have been very fewreports on 3D printing know-how, that is, creating “neces-sary and sufficient” 3D printable data. We thereforeneeded to learn 3D printing through trial and error. In2018, we reported in 3D Printing in Medicine a “one-stop3D printing lab” that enables data creation for 3D printingin one facility [8]. In this lab, it is possible to fabricate “in-expensive” 3D models, where the first step toward 3Dprinting is segmenting the DICOM images and creatingthe STL (3D CAD) model. We have found that the shapeof the created STL model varies slightly from one softwarepackage to another. The quality of the STL data affectsthe 3D printing, and improper STL data can lead to theunsuccessful fabrication of 3D models [10].In this study, we focus on the performance of software
packages that segment and create DICOM images toSTL data and report on a comparative analysis across
the packages to understand the differences of each andtheir characteristics. The purpose of this study was toinvestigate the points to be noted in creating STL datafor 3D printing to promote the use of 3D models in thefield of oral and maxillofacial surgery.
MethodsIn this study, PC applications that export DICOMimages into STL file format data (or that offer a segmen-tation function) are referred to as “STL data” “softwarepackages”, and a 3D surface model (virtual 3D model)created from STL data is referred to as “an STL model”.Multidetector row CT (MDCT) scanning was performed
on a dry human mandible with two 10-mm-diameteraluminum bearing balls attached to the left and rightmental regions as phantoms (Fig. 1). A gap of approxi-mately 1mm was maintained between the mandible andball to aid segmentation with a PC. The DICOM imageswere exported to STL files in binary format using one ofthese packages. First, the data (file) size and volume of theSTL file that constitutes each STL model were evaluated.Next, all mandible STL models were compared to assesswhether there were differences in the shapes of the createdSTL models that could be correlated with differences insoftware and, if so, which areas were affected. In addition,the result of a morphological change by reducing the datasize of the mandible STL model is discussed.
MDCT scanner and scanning parametersThe phantom was scanned with a 64-slice MDCT (Aqui-lion 64, Canon Medical Systems Corp. formerly ToshibaMedical Systems, Tochigi, Japan) with the followingscanning parameters: 120 kV tube voltage, 50 mAs, 0.5mm slice thickness, 240 mm FOV, 512 × 512 matrix, andconvolution kernel FC30.As a reconstruction filter for MDCT, FC30, a high-
resolution reconstruction image filter used for boneimaging in clinical practice, was used [11].
Software used for segmenting DICOM images to STL dataand the evaluation procedureDICOM to STL data segmentationTable 1 shows details of the nine software packages availablefor this purpose that can be run on a PC. ROIs and thresh-olds were set for each software package to create the STLmodel. The threshold for binarization was set to 350 as avoxel value (brightness value) corresponding to a CT valueacross all software packages. For packages that support a par-ameter for resolution, it was set to the “maximum”. Somesoftware packages were able to reduce the data size whensegmenting to STL data; for these packages, “no data sizereduction (or minimum)” or “no smoothing” was selected.The software simply sets the threshold for binarization anddoes not add any other functions such as brush/touch-up.
Kamio et al. 3D Printing in Medicine (2020) 6:17 Page 2 of 12

Fig. 1 Axial view of the dry human mandible with two 10-mm-diameter aluminum bearing balls attached to the left and right mental regions asphantoms displayed on VE3. The CT value was measured by IMJ, and the mean value inside each ball was approximately 350 HU
Table 1 STL data segmentation software packages used in this study (Accessed 15th Dec 2019)
Software package(Abbreviations)
Version Developer/Provider
Web site
3D Slicer(3DS)
4.10.2 Surgical Planning Lab, Harvard Medical School, Harvard University, MA, USA
http://www.slicer.org
3DView(3DV)
1.2 RMR Systems Ltd., East Anglia, UK
http://www.rmrsystems.co.uk/volume_rendering.htm
Image J(IMJ)
1.48 National Institutes of Health, Bethesda, MD, USA
https://imagej.nih.gov/ij
InVesalius 3(IN3)
3.1.1 Renato Archer Information Technology Centre, São Paulo, Brazil
https://invesalius.github.io
Mimicsa
(MCS)22.0.0.524 Materialise, Leuven, Belgium
https://www.materialise.com/en/medical/mimics-innovation-suite/mimics
The Medical Imaging Interaction Toolkit(MIT)
2018.04.2 German Cancer Research Center, Heidelberg, Germany
http://mitk.org
OsiriX Lite(OSX)
11.0.0 Pixmeo SARL, Geneva, Switzerland
http://www.osirix-viewer.com
Seg3D(S3D)
2.4.4 Scientific Computing and Imaging Institute, Salt Lake City, Utah, USA
http://www.sci.utah.edu/cibc-software/seg3d.html
Volume Extractor 3.0a
(VE3)3.6.0.7 i-Plants Systems, Iwate, Japan
http://www.i-plants.jp/hp/products/ve3aCommercial software
Kamio et al. 3D Printing in Medicine (2020) 6:17 Page 3 of 12

STL data can store information in two different ways,namely, binary encoding and ASCII encoding. The twoformats contain the same information regarding themodel, but the binary format is much more compact; itwill produce smaller files (but they should work thesame). In this study, the STL data were exported in abinary format. ImageJ, by default, does not have an STLsegment function, so a plugin tool (3D Viewer, https://imagej.nih.gov/ij/plugins/3d-viewer) was installed.
3D coordinate system and measurementFigure 2 shows the coordinate system in 3D space and themeasurement of the length of the STL models in the X-,Y-, and Z-axis directions using the polygon editing soft-ware POLYGONALmeister Ver. 4 (PMV4, UEL Corp.,Tokyo, Japan) [12]. The coordinate system used in thisstudy was based on the DICOM standard; that is, thepositive X-axis points toward the phantom’s left side, thepositive Y-axis points toward the phantom’s posterior andthe positive Z-axis points from the inferior direction to thesuperior direction.
Superimposition and shape error evaluationTo determine the shape error (shape differences betweentwo models that are signed differences), CAD comparisonand inspection software SpGauge 2014.1 (SpG, AronicosCo., Ltd., Shizuoka, Japan) was used for performing thesuperimposition and measurement. For the superimpos-ition, one of two STL models was moved using the best-fitsurface-based registration algorithm of SpG, with theoperation repeated until the movement amount with theother STL model approached as close to 0.00mm as
possible. The mean, maximum, and minimum shapeerrors were recorded, with expansion indicated as positiveand contraction indicated as negative. In the color map-ping, positive errors were displayed in warm colors, andnegative errors were displayed in cool colors.
Statistical analysisThe Kruskal-Wallis test was performed using the mean ab-solute deviation of the file size of the data and the numberof triangles of the ball STL model and the mandible STLmodel created from each software package. To determinethe tendency of the morphological change when segmentingthe STL model from the DICOM images of large and smallstructures (in this study, large; mandible, small; ball), thecorrelation between the mandible STL model and the ballSTL model was determined using the Spearman’s rank cor-relation coefficient applied to the difference between lengthsin each of the X-, Y-, and Z-axis directions and the differ-ences in volume. Comparisons between the ball STL modelswere performed by one-way ANOVA followed by Tukey’smultiple comparison test. After superimposition, the shapeerror of the mandible STL models was evaluated using theKruskal-Wallis test, and multiple comparisons wereperformed via the Steel-Dwass test. Statistical analysis wasperformed using open-source statistical analysis software RVer.3.6.1 [13], with a statistical significance level set at 5%.
ResultsThe data (file) size and the number of triangles weredifferent for each software, and the maximum data (file)size was 71.0MB, the number of triangles of the man-dible STL model was approximately 1.25 million (IN3).
Fig. 2 The 3D surface model (virtual 3D model) created from STL data displayed on PMV4. The coordinate system in 3D space, with the lengthmeasurement of the STL models in the X-, Y-, and Z-axis directions. Lengths and volumes of the highlighted areas shown in green for themandible STL model (a) and for the ball STL model (b and c) were measured
Kamio et al. 3D Printing in Medicine (2020) 6:17 Page 4 of 12

The minimum data (file) size was 22.9MB, the numberof triangles of the mandible STL model was approxi-mately 450,000 (MCS) (Table 2). There were no statisti-cally significant differences between the nine softwarepackages for data (file) size and number of triangles.For the ball STL model, the lengths in the X-, Y-, and
Z-axis directions exceeded 10mm, with the length of theZ-axis direction longer than that of the X-, and Y-axisdirections, with significant differences between thelengths of the ball STL model across software packages(Fig. 3). One software package (MCS) showed largerlength values for the X- and Y-axis directions than theother eight software packages (Fig. 4). A negligible tolow correlation was observed between the ball STLmodel and the mandible STL model for the lengths ofthe X-, Y-, and Z-axis directions. With regard to volume,a high correlation was found between the ball STLmodel and the mandible STL model (Table 3). One soft-ware package (IN3) showed a larger volume value thanthe other eight packages (Fig. 5). Evaluation after super-imposition of the STL models found slight variations in
each software package, with a mean shape error of 0.11mm, a maximum shape error of + 1.69 mm, a minimumshape error of − 1.55mm, a median shape error of 0.08mm and a 95% confidence interval of 0.08 to 0.135. Nosignificant differences were found for the shape erroracross software packages (standard deviation 0.08, p-value 0.393).The number of triangles in the mandible STL model
was reduced to 200,000, and their morphological changeswere evaluated. The mean shape error of that STL modelrelative to the models with the largest number of trianglesand the mean numbers of triangles was almost 0mm.
DiscussionWe divided our workflow into three steps, each of whichrequires a different file format. Step 1 involves acquiringa 3D volume image of the patient as a DICOM imagefile. Step 2 entails segmenting the anatomical structurefrom surrounding structures and exporting it to thevirtual 3D model in STL file format. The segmentationof osseous structures and soft tissue is relatively easy.However, in many cases, it is difficult to create an STLmodel for two reasons. One reason is that thin osseousstructures (e.g., bone surrounding the nasal cavity, or-bital floor) and narrow tissue gaps (e.g., upper and lowerjoint cavity between the temporal bone and themandible) are not clearly reproduced in the STL model.Second, many artifacts (e.g., metal artifacts and/or beamhardening from dental prostheses) reduce the readabilityof the images and prevent segmentation. Step 3 concernsthe 3D printing of the physical 3D model, which requiresthe use of “G-code” generation software to produce G-codeas the 3D printable data [14]. Each step of the entireprocess, namely, the segmentation of DICOM images, theprocessing of STL data, the generation of G-code data, andthe performance of the 3D printer itself, affects the accur-acy of the final 3D model. Creating STL data is the mostimportant operation in fabricating the 3D model.
Table 2 Data size and number of triangles for the STL modelcreated by each software package. aCreated in binary format
Softwarepackage
File size(Megabytes)a
Number of triangles
Ball STL modelb Mandible STL model
3DS 56.3 MB 7468 1,087,868
3DV 55.7 MB 7444 1,086,540
IMJ 55.5 MB 7412 1,074,036
IN3 71.0 MB 7068 1,247,962
MCS 22.9 MB 3212 448,878
MIT 56.1 MB 7468 1,087,612
OSX 55.9 MB 7450 1,081,660
S3D 56.3 MB 7472 1,089,572
VE3 48.3 MB 7380 953,042aConstructed in binary STL formatbMean value of left and right ball STL model measurements
Fig. 3 Length measurements of the ball STL model. The solid line indicates the measured value of the length of each ball STL model in the X-, Y-, and Z-axis directions, and the dotted line indicates the mean value of the lengths of all models across all software packages
Kamio et al. 3D Printing in Medicine (2020) 6:17 Page 5 of 12
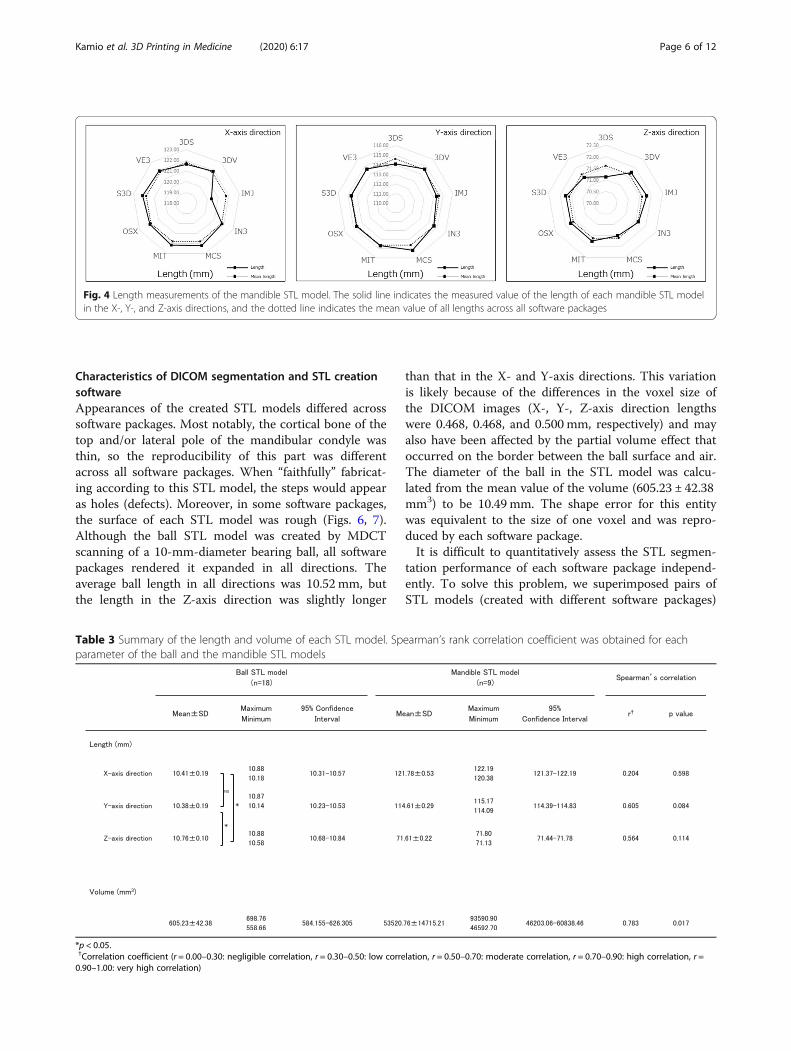
Characteristics of DICOM segmentation and STL creationsoftwareAppearances of the created STL models differed acrosssoftware packages. Most notably, the cortical bone of thetop and/or lateral pole of the mandibular condyle wasthin, so the reproducibility of this part was differentacross all software packages. When “faithfully” fabricat-ing according to this STL model, the steps would appearas holes (defects). Moreover, in some software packages,the surface of each STL model was rough (Figs. 6, 7).Although the ball STL model was created by MDCTscanning of a 10-mm-diameter bearing ball, all softwarepackages rendered it expanded in all directions. Theaverage ball length in all directions was 10.52 mm, butthe length in the Z-axis direction was slightly longer
than that in the X- and Y-axis directions. This variationis likely because of the differences in the voxel size ofthe DICOM images (X-, Y-, Z-axis direction lengthswere 0.468, 0.468, and 0.500 mm, respectively) and mayalso have been affected by the partial volume effect thatoccurred on the border between the ball surface and air.The diameter of the ball in the STL model was calcu-lated from the mean value of the volume (605.23 ± 42.38mm3) to be 10.49 mm. The shape error for this entitywas equivalent to the size of one voxel and was repro-duced by each software package.It is difficult to quantitatively assess the STL segmen-
tation performance of each software package independ-ently. To solve this problem, we superimposed pairs ofSTL models (created with different software packages)
Fig. 4 Length measurements of the mandible STL model. The solid line indicates the measured value of the length of each mandible STL modelin the X-, Y-, and Z-axis directions, and the dotted line indicates the mean value of all lengths across all software packages
Table 3 Summary of the length and volume of each STL model. Spearman’s rank correlation coefficient was obtained for eachparameter of the ball and the mandible STL models
*p < 0.05.†Correlation coefficient (r = 0.00–0.30: negligible correlation, r = 0.30–0.50: low correlation, r = 0.50–0.70: moderate correlation, r = 0.70–0.90: high correlation, r =0.90–1.00: very high correlation)
Kamio et al. 3D Printing in Medicine (2020) 6:17 Page 6 of 12

on each other; the difference between each pair wasvisualized and measured as a shape error. Although thedifferences between shapes of the created STL modelswere visible on the shape error image, no significant dif-ferences were found across all mandible STL models.Figure 8 shows images captured by the superimpositionand visualization of S3D and MIT, which had the mini-mum shape error. Figure 9 shows images of MCS andVE3 with a maximum shape error. The reason the shapeerrors could be seen by the software packages, althoughonly slightly, was that the binarization algorithms differacross the software packages. Binarization means creat-ing an isosurface. The isosurface refers to the boundarysurface of the target area formed by setting an
appropriate threshold and is generally approximated bya polyhedron as a patch model consisting of a set of finetriangles. The method of creating isosurfaces fromvolume data is a useful tool and has been used in awide range of fields, such as the 3D visualization ofCT data and modeling of arbitrary shapes by animplicit function expression. A number of methodshave been proposed [15–17].The shape error appeared because of differences in
image processing near the threshold values, such as thethin cortical bone or strongly curved surface. The colormaps of Figs. 8 and 9 are colored as green to yellowareas, with mean distances of approximately 0.30 mm.This distance is smaller than one voxel size. Regarding
Fig. 5 Volume measurements of the ball STL models. The solid lines indicate the measured value of the volume of each STL model, and thedotted lines indicate the mean volume across all software packages
Kamio et al. 3D Printing in Medicine (2020) 6:17 Page 7 of 12

the roughness of the surface of the STL model, it wasthought that the influence of the unevenness was small.Therefore, it was considered that the shape error wasnot affected. It is difficult to judge the pass/fail of anerror that differs depending on the software package ob-tained in this study because there is no correct answer.Considering the spatial resolution of MDCT, it can beassumed that this kind of error is acceptable in fabricat-ing 3D models for clinical use in oral and maxillofacialsurgery [18–20]. A more thorough analysis of the shapeerror by region of the mandible could be considered toallow quantification of some of the qualitative findingspresented.
Reducing STL data sizeSTL data represent a 3D shape as a collection of smalltriangles. The number of triangles depends on the size,shape and internal structure of the object. More com-plex features and higher resolution lead to an increase inthe number of triangles in the segmented STL data.Processing a large number of triangles draws heavily onthe processing power of a PC; the calculation is time-consuming and can affect subsequent operations. Areduction in the number of triangles directly leads to areduction in the data size. However, a reduction in thenumber of triangles may also cause a morphologicalchange [21]. Therefore, the mandible STL model wassuperimposed before and after the reduction in thenumber of triangles to evaluate the dimensional change,
and the shape error was observed. To reduce the num-ber of triangles to 200,000, i.e., the number of trianglesrecommended in the report [22], the “simplify data byspecifying the number of triangles” function of PMV4was used [23]. Figure 10 shows the before and after re-duction in the number of triangles and the color mapafter the superimposition of the STL model with the lar-gest volume and number of triangles (IN3; 1.24 million).As a result, although the surface of the STL model withthe reduced number of triangles (200,000) was some-what rough when displayed on the monitor, the meanshape error of that STL model relative to the modelswith the largest and the mean numbers of triangles wasalmost 0 mm. It was clarified that data reduction in themandible STL model of any software package could re-duce the data size and did not affect the morphologicalchange. Considering that the minimum laminating pitchof the FDM desktop 3D printer that we use is 0.05 mm(https://www.mutoh.co.jp/3d/doc/product_lineup.pdf),this supports the inference that the recommended num-ber of triangles was both necessary and sufficient for 3Dprinting.
Limitations and prospectsThere is the opinion that the use of a surface scannercan provide a precise morphological evaluation. A sur-face scanner was not used in this study. This is becausewe do not have a scanner, nor do we have the skill tobuild it. Therefore, we use only the DICOM image data
Fig. 6 Shape error (signed differences) measurement after superimposing pairs of STL models using SpG. The black square indicates the meanvalue, the upper limit indicates the maximum value, and the lower limit indicates the minimum value. Multiple comparisons of the shape error ofeach mandible STL model were performed, and no significant difference was found
Kamio et al. 3D Printing in Medicine (2020) 6:17 Page 8 of 12

acquired by MDCT scanning to evaluate the accuracy ofeach software package.In the evaluation of the data size, the number of
triangles, and the morphology of the created STLmodels, there was a problem that there was no goldstandard value. Therefore, we solved this issue byperforming multiple comparisons of all STL models.In this study, since only a dry human mandible wasused, the segmentation operation with surroundinganatomical structures on a PC, such as soft tissue,was not performed. When performing the 3D printingof a patient’s DICOM data, the segmentation of softtissues and osseous structures is required. We haveno manual measurement (e.g., measurement with acaliper) so it is expected that the measurement resultswill differ depending on the observer. In addition,
optical three-dimensional measurements that requireverifying the accuracy of the measurement deviceitself in advance were not performed.Shape errors are inevitable because of the spatial reso-
lution limits of MDCT. However, when using 3D modelsin fields that require more detailed operations, such asmicroscopic surgery, other modality options should beconsidered, such as the use of limited cone-beam CT,which is expected to produce a better high-definitionSTL model. In this study, an MDCT scanner was usedto segment DICOM images to STL data under the con-dition of a fixed voxel value binarization threshold. Inaddition to differences between patients, physics-basedfactors such as the irradiation dose and other differencesin the MDCT models and scanning parameters may alsoaffect the difficulty of creating STL models [24, 25].
Fig. 7 Closer view of the dry human mandibular condyle (a), the STL model created from DICOM images using 3DS (b), 3DV (c), IMJ (d), IN3 (e),MCS (f), MIT (g), OSX (h), S3D (i) and VE3 (j). Threshold settings for binarization were the same for all software packages; however, the createdsurface was slightly different for each model, with differences most notable in thin areas of the cortical bone (arrowhead)
Kamio et al. 3D Printing in Medicine (2020) 6:17 Page 9 of 12

Although no segmentation in the true sense was per-formed in this study, in the clinical use of 3D print-ing technology, setting a threshold for 3D printingrequires medical knowledge, especially tomographicimage anatomy, as well as the knowledge of the mo-dalities of the imaging principles. It seems necessaryto understand the features of the software package forSTL segments as well.This study does not aim to rank software packages.
There are some differences between DICOMsegmentation and STL creation depending on the
software, so it is desirable to understand and usethese characteristics.
ConclusionsWe evaluated nine commercial/open-source softwarepackages that create DICOM images to STL data. Ourevaluation included superimposing STL models cre-ated by different software packages over each other tovisualize and measure the shape error. Although slightdifferences were found, the differences were within theslice thickness of the MDCT. In conclusion, when
Fig. 8 Comparison of STL models between S3D (a) and MIT (b), where the shape error between the two STL models was the minimum value.Visualization of the shape error (signed differences) after superimposition is shown on the right (c). Almost all of the STL model was green. Themean error between the two STL models was 0.00 mm (maximum + 0.16 mm, minimum − 0.17 mm)
Fig. 9 Comparison of the STL model of MCS (d) and VE3 (e), which showed the largest shape error between any two STL models. Visualization ofthe shape error (signed differences) after superimposition is shown on the right (f). The whole mandible is depicted as green to yellow (shapeerror range of approximately 0.0 mm - 0.5 mm), with occasional orange to red parts. The mean shape error was 0.27 mm (maximum + 0.80 mm,minimum − 0.81 mm)
Kamio et al. 3D Printing in Medicine (2020) 6:17 Page 10 of 12

using segmentation software, it is essential to under-stand the features and characteristics of the softwarepackage to align its use with the intended purpose. Increating/designing data for 3D printing of fine and/orthin structures, it is important to pay close attention tosetting the threshold for the ROI and for binarizingDICOM images.
Abbreviations3D: Three (3) dimensional; 3DS: 3D Slicer (software package); 3DV: 3DView(software package); CAD: Computer-aided design; CT: Computed tomography;DICOM: Digital Imaging and Communications in Medicine (file format);FDM: Fused deposition modeling; IMJ: ImageJ (software package); IN3: InVesalius 3(software package); MCS: Mimics (software package); MDCT: Multidetector rowcomputed tomography; MIT: The Medical Imaging Interaction Toolkit (softwarepackage); OSX: OsiriX Lite (software package); PC: Personal computer; ROI: Regionof interest; S3D: Seg3D (software package); STL: Stereolithography (file format);VE3: Volume Extractor 3.0 (software package)
Authors’ contributionsTKm conceived the study and drafted the study outline. TKm and RAcollected the requisite data, implemented the software and carried out theanalyses. MS, RA and TKw interpreted the data and drafted the manuscript.All authors read and approved the final manuscript.
FundingNo specific funding sources to declare for this research.
Availability of data and materialsReaders interested in the data should contact the authors.
Ethics approval and consent to participateThe study protocol was reviewed and approved by the institutional reviewboards of the participating institutions.
Consent for publicationNot applicable.
Competing interestsThe authors declare that they have no competing interests.
Received: 2 March 2020 Accepted: 10 July 2020
References1. Kikano E, Grosse Hokamp N, Ciancibello L, Ramaiya N, Kosmas C, Gupta
A. Utility of virtual monoenergetic images from spectral detectorcomputed tomography in improving image segmentation for purposesof 3D printing and modeling. 3D Print Med. 2019;5:1. https://doi.org/10.1186/s41205-019-0038-y.
2. Punyaratabandhu T, Liacouras PC, Pairojboriboon S. Using 3D models inorthopedic oncology: presenting personalized advantages in surgicalplanning and intraoperative outcomes. 3D Print Med. 2018;4:12. https://doi.org/10.1186/s41205-018-0035-6.
3. Flores RL, Liss H, Raffaelli S, Humayun A, Khouri KS, Coelho PG, Witek L. Thetechnique for 3D printing patient-specific models for auricularreconstruction. J Craniomaxillofac Surg. 2017;45:937–43. https://doi.org/10.1016/j.jcms.2017.03.022.
4. Suojanen J, Leikola J, Stoor P. The use of patient-specific implants inorthognathic surgery: a series of 32 maxillary osteotomy patients. JCraniomaxillofac Surg. 2016;44:1913–6. https://doi.org/10.1016/j.jcms.2016.09.008.
5. McHenry K, Bajcsy P. An overview of 3D data content, file formats andviewers. Nat Center Supercomp Appl. 2008;1205:22 https://www.archives.gov/files/applied-research/ncsa/8-an-overview-of-3d-data-content-file-formats-and-viewers.pdf (Accessed 14 Dec 2019).
6. Di Prima M, Coburn J, Hwang D, Kelly J, Khairuzzaman A, Ricles L. Additivelymanufactured medical products–the FDA perspective. 3D Print Med. 2016;2:1–6. https://doi.org/10.1186/s41205-016-0005-9.
7. Christensen A, Rybicki FJ. Maintaining safety and efficacy for 3D printing inmedicine. 3D Print Med. 2017;3:1–10. https://doi.org/10.1186/s41205-016-0005-9.
8. Kamio T, Hayashi K, Onda T, Takaki T, Shibahara T, Yakushiji T, Shibui T, KatoH. Utilizing a low-cost desktop 3D printer to develop a “one-stop 3Dprinting lab” for oral and maxillofacial surgery and dentistry fields. 3D PrintMed. 2018;4:6. https://doi.org/10.1186/s41205-018-0028-5.
9. Aghdasi N, Li Y, Berens AM, Harbison RA, Moe KS, Hannaford B. Efficientorbital structures segmentation with prior anatomical knowledge. J MedImaging. 2017;3:034501. https://doi.org/10.1117/1.JMI.4.3.034501.
10. Hällgren S, Lars P, Jens E. 3D data export for additive manufacturing-improving geometric accuracy. Procedia Cirp. 2016;50:518–23. https://doi.org/10.1016/j.procir.2016.05.046.
Fig. 10 Visualization of the STL model created with IN3, which had the largest volume and number of triangles, the STL model with thereduced number of triangles, and the shape error (signed distances) after superposition. When the original number of 1,247,962 (a)triangles were reduced to 200,000 (b), the surface of the STL model appeared to be slightly rough. In the color map, the entire area wasgreen (c). The mean shape error was 0.02 mm
Kamio et al. 3D Printing in Medicine (2020) 6:17 Page 11 of 12

11. Anam C, Fujibuchi T, Budi WS, Haryanto F, Dougherty G. An algorithm forautomated modulation transfer function measurement using an edge of aPMMA phantom: impact of field of view on spatial resolution of CT image. JAppl Clin Med Phys. 2018;19:244–52. https://doi.org/10.1002/acm2.12476.
12. Tanimoto S. Collaborative research on polygon engineering with RIKEN.Unisys Technol Rev. 2012;32:283–92 (in Japanese). http://www.unisys.co.jp/tec_info/tr114/11413.pdf. (Accessed 14 Dec 2019).
13. R Core Team. R: A language and environment for statistical computing.Vienna: R Foundation for Statistical Computing; 2019. https://www.R-project.org/ (Accessed 15 Dec 2019).
14. Brown AC, De Beer D, Conradie P. Development of a stereolithography(STL) input and computer numerical control (CNC) output algorithm for anentry-level 3-D printer. S Afr J Ind Eng. 2014;25:39–47. https://doi.org/10.7166/25-2-675.
15. Lorensen WE, Cline HE. Marching cubes: a high resolution 3d surfaceconstruction algorithm. ACM Siggraph Comp Graph. 1987;21:163–9. https://doi.org/10.1145/37401.37422.
16. Doi A, Suzuki S, Yamasa F, Itoh F, Matsui K, Sachio M, Itoh S. VolumeExtractor Ver.3.0 -3D Image Processing and 3D Model Re-construction. IIEE J.2008;37:1037–43. https://doi.org/10.11371/iieej.37.1037.
17. Hubert M, Krzysztof O. Improvement of image binarization methods usingimage preprocessing with local entropy filtering for alphanumericalcharacter recognition purposes. Entropy. 2019;21(6):562. https://doi.org/10.3390/e21060562.
18. Shepherd S, Macluskey M, Napier A, Jackson R. Oral surgery simulatedteaching; 3D model printing. Oral Surg. 2017;10:80–5. https://doi.org/10.1111/ors.12228.
19. Kamio T, Kato H. Autotransplantation of impacted third molar using 3Dprinting technology: a case report. Bull Tokyo Dent Coll. 2019;60:193–9.https://doi.org/10.2209/tdcpublication.2018-0058.
20. Kato H, Kamio T. Diagnosis and endodontic Management of FusedMandibular Second Molar and Paramolar with Concrescentsupernumerary tooth using cone-beam CT and 3-D printing technology:a case report. Bull Tokyo Dent Coll. 2015;56:177–84. https://doi.org/10.2209/tdcpublication.56.177.
21. Chen YH, Ng CT, Wang YZ. Generation of an STL file from 3D measurementdata with user-controlled data reduction. Int J Adv Manuf Technol. 1999;15:127–31. https://doi.org/10.1007/s001700050.
22. Mitsouras D, Liacouras P, Imanzadeh A, Giannopoulos AA, Cai T, KumamaruKK, George E, Wake N, Caterson EJ, Pomahac B, Ho VB, Grant GT, Rybicki FJ.Medical 3D printing for the radiologist. Radiographics. 2015;35:1965–88.https://doi.org/10.1148/rg.2015140320.
23. Tanimoto S. Polygon Editing Functions for 3D-Printing. Unisys Technol Rev.2016;36:97–114 (in Japanese). https://www.unisys.co.jp/tec_info/tr129/12905.pdf (Accessed 15 Feb 2020).
24. Leng S, McGee K, Morris J, Alexander A, Kuhlmann J, Vrieze T, McColloughCH, Matsumoto J. Anatomic modeling using 3D printing: quality assuranceand optimization. 3D Print Med. 2017;3:6. https://doi.org/10.1186/s41205-017-0014-3.
25. Cai T, Rybicki FJ, Giannopoulos AA, Schultz K, Kumamaru KK, Liacouras P,Demehri S, Shu Small KM, Mitsouras D. The residual STL volume as a metricto evaluate accuracy and reproducibility of anatomic models for 3Dprinting: application in the validation of 3D-printable models of maxillofacialbone from reduced radiation dose CT images. 3D Print Med. 2015;1:2.https://doi.org/10.1186/s41205.
Publisher’s NoteSpringer Nature remains neutral with regard to jurisdictional claims inpublished maps and institutional affiliations.
Kamio et al. 3D Printing in Medicine (2020) 6:17 Page 12 of 12