did british colonialism promote democracy? divergent ... · subsequent convergence in democracy...
TRANSCRIPT
Did British Colonialism Promote Democracy?Divergent Inheritances and Diminishing Legacies*
March 30, 2017
Abstract
Many scholars have argued that British colonial rule promoted post-independence democracy, butthere has been considerable debate over the robustness of this result and its causes. Contradicting exist-ing theories, we show that this relationship follows a strong temporal pattern. Although former Britishcolonies were considerably more democratic than other countries immediately following independence,subsequent convergence in democracy levels has eliminated these differences in the post-Cold War pe-riod. Neither pre-colonial traits, geographical and policy variation among British colonies, post-colonialinfluences, nor existing theories of colonial influence account for this finding. We argue that divergentpolicy approaches to decolonization by European powers contributed to this pattern. Britain more con-sistently treated democratic elections as a prerequisite for gaining independence, leading to higher initiallevels of democracy. However, these policies did not reflect differences in social or institutional supportfor democracy, leading to mean reversion and convergence over time.
Keywords: Democracy, Colonialism
*We thank participants at the University of Rochester’s Comparative Politics Workshop for helpful feedback on an earlier draft.
1 Introduction
What explains cross-national variation in democracy? This central question of political science is especially
relevant for the numerous countries that gained independence after World War II. Although many of these
countries have authoritarian governments, numerous others have experienced pluralistic government—some
for long periods, some for only short spells—despite lacking structural factors such as high income per
capita, European settlers, and strong civil societies often touted as causes of democracy. To explain this
variation, many scholars have examined legacies from the colonial period. This focus appears pertinent
because most countries outside of Europe inherited their political institutions directly from the colonial
state, and considerable evidence demonstrates that colonial institutions have influenced a wide variety of
social and economic outcomes (Acemoglu et al. 2001, 2002; Engerman and Sokoloff 2011; Lindberg and
Smith 2014).
The literature on colonial causes of democracy has often focused on the relevance of colonizer identity,
specifically: Did British colonialism promote democracy relative to colonization by other powers? Political
science research has produced mixed conclusions. Early arguments and evidence championed a positive
British democratic legacy (Emerson 1960; Huntington 1984; Weiner 1987; Lipset et al. 1993; more recently
see Bernhard et al. 2004 and Olsson 2009), and scholars routinely control for a British colonial rule dummy
in cross-national democracy regressions. However, many more recent statistical studies do not replicate the
beneficial British effect (Hadenius 1992; Barro 1999; Przeworski et al. 2000; Woodberry 2012). Comple-
menting these inconsistent empirical results, many recent studies have instead examined other aspects of the
colonial or pre-colonial era such as Protestant missionaries (Woodberry 2012; Lankina and Getachew 2012),
pre-colonial state development and colonial-era European settlers (Hariri 2012), or broader measures of in-
direct/direct rule (Lange 2004, 2009). Some of this research explicitly rejects the importance of colonizer
identity. The literature on economic development features a similar debate, with support for the importance
of colonizer identity (La Porta et al. 1998; Grier 1999; Lee and Schultz 2012; Mahoney 2010) countered
by arguments that other aspects of colonial rule were more important (Acemoglu et al. 2001; Kohli 2004;
Engerman and Sokoloff 2011).
This paper provides evidence that British colonial rule does indeed matter for democracy levels even when
accounting for alternative colonial and pre-colonial effects. However, the British legacy changes over time—
1
a previously unnoticed pattern. Although British colonial rule tended to bequeath a positive democratic
inheritance at independence, this legacy diminished afterwards. In countries’ first full year of independence,
the average difference is over six points on the standard 20-point polity2 scale. However, there is no dis-
cernible difference in democracy levels between ex-British and non-former British colonies between 1991
and 2014.
We first perform numerous statistical tests to demonstrate the existence and robustness of this pattern. Cross-
sectional models estimate a moderately large association between British rule and democracy among all
post-independence years, but this correlation is shown to be much stronger at independence and is com-
pletely absent in a post-1991 sample. This result is robust to adding a standard set of democracy covariates,
to changing democracy measures, to expanding the sample to include the entire period since 1800, and to
controlling for compelling alternative explanations studied in previous research. In fact, the findings qualify
conclusions about previously posited historical causes of democracy. These temporally contingent findings
also hold among many subsets of British colonies, including briefly and indirectly ruled British colonies.
We show only a very large amount of bias from unobserved covariates could explain away the estimated
effect at independence. Finally, claims that omitted variables explain the finding have difficulty identifying
factors that—in addition to covarying with colonizer identity—strongly covary with democracy levels at
independence but not several decades afterwards.
This temporal pattern contradicts existing theories of British colonialism and democracy. In contrast to
standard cultural theories, the effects tended not to be long-lasting. In contrast to theories that reject the
relevance of British colonialism or focus on heterogeneity within the British empire, there was a strong
relationship at independence and even among indirectly ruled British colonies. Thus, establishing this novel
temporal pattern demonstrates the need for a new explanation, despite wide-ranging debates about British
colonialism.
The second part of the paper argues that differences during the decolonization era are a central mechanism.
Focusing on decolonization builds off a smaller strand of the existing historical literature (Smith 1978;
Kahler 1984; Spruyt 2005) and contrasts with existing prominent political science theories focused on long-
term cultural or institutional factors. Britain was more willing to allow gradual transition to colonial rule than
were other major colonial powers, and one more tailored to local circumstances. Consequently, Britain pro-
moted more competitive elections prior to granting independence and avoided the successful anti-colonial
2

revolutions that ended European rule in many other colonies. These factors correlate with democracy levels
at independence, as do mechanisms that help to explain Britain’s decolonization strategy relative to other
European powers: democracy level of the metropole and strength of the colonial lobby.
However, the democratic gap at independence emerged from contingent arrangements rather than from
British-ruled territories having higher underlying societal demand for democracy. Evidence from time series
regressions demonstrate patterns of both (1) democratic reversals shortly after independence in ex-British
colonies and (2) greater democratic gains by non-former British colonies several decades after independence,
as “Third Wave” international influences engendered liberalization of decolonization-induced dictatorships.
Whereas long-term cultural and institutional accounts of British colonialism do not anticipate either pattern,
they are consistent with our argument that mean reversion gradually eroded short-term decolonization ef-
fects. We also show the decolonization mechanisms that correlate with democracy levels at independence
do not correlate with post-1991 democracy levels.
This paper provides three broader contributions to studying each of democracy and colonialism, which the
conclusion elaborates upon. First, our evidence forces a rethinking of which colonial legacies are most im-
portant for democracy. Contrary to recent arguments, we show that the effects of British colonialism are not
reduced to the type of people that populated British colonies (e.g., British settlers, Protestant missionaries).
Furthermore, many factors emphasized in the recent literature receive less consistent support than the British
colonial legacy. Second, we show that these new findings in part follow from examining multiple samples
and periods, rather than a single and potentially unrepresentative time period and/or sample. This suggests
that disaggregated analysis—although rare in this literature—is crucial for understanding colonial legacies.
Finally, the results provide insights into studying international democracy promotion and externally con-
trolled institution-building, and suggest that international attempts at democracy promotion may often exert
stronger short-term than long-term effects.
2 Existing Research on Colonial Origins of Democracy
Existing research has presented three main types of arguments relating British colonialism and democracy.
First, Britain fostered post-colonial democracy by altering the political institutions and/or culture of its terri-
tories in ways that increased demand for democracy. A second, closely related perspective is that the Britain
effect is conditional on the type of colonial rule it practiced and should only appear in certain types of British
3
colonies. A final school argues against any positive Britain effect, and instead that cross-empire differences
can be explained by other colonial-era factors or by pre-colonial differences between empires. Although
these three groups of arguments create different implications for the Britain-democracy relationship, they
also share a common shortcoming: none can explain why the effect of British colonialism should have been
strongly positive at independence and should have dramatically diminished over time.
2.1 Culture and Institutions
Scholars have proposed numerous mechanisms to link British colonial rule to stronger post-colonial democ-
racy, focusing primarily on cultural and institutional explanations. Weiner’s (1987) frequently cited con-
tribution posits two main mechanisms through which Britain promoted “tutelary democracy” (18). First,
Britain promoted bureaucratic structures that maintained order through the rule of law rather than through
arbitrary authority. Because these administrative institutions gradually become indigenous, colonial sub-
jects gained experience with law-based governance (see also Narizny 2012, 362; Abernethy 2000, 406; and
Treisman 2000, 418-427). Second, Britain provided a limited system of representation and elections that
enabled political elites to learn to use and to internalize the norms of democratic procedures (see also Lipset
et al. 1993, 168; Diamond, 1998, 8; and Abernethy 2000, 367). Although France also introduced elec-
tions in many of its African colonies prior to independence, Britain tended to grant greater responsibilities
to its elected legislative organs, whereas France practiced a more centralized style of rule (Emerson 1960,
232). These arguments are closely related to arguments about other beneficial British institutional legacies:
common law (La Porta et al. 1998) and parliamentary institutions with strong legislative constraints on the
executive (Abernethy 2000, 367). Another closely related argument emphasizes the role of human capi-
tal (Glaeser et al. 2004)—specifically, higher education levels in former British colonies (Diamond 1998,
9)—in shaping economic and political outcomes.
A common theme among these cultural and institutional arguments is that the positive British effect should
be long-term. That is, if superior culture or institutions enhanced demand for democracy at independence,
then these same factors should promote subsequent democratic stability. These theories therefore face dif-
ficulties accounting for change over time—especially because, as shown below, British colonies did tend to
experience sharp democratic reversals after independence.
4
2.2 Heterogeneity Within the British Empire
Many have qualified these pro-Britain arguments by instead positing that only certain British colonies re-
ceived beneficial inheritances. These arguments concern how Britain governed its various territories, in
particular, how directly it ruled them. One proxy for directness of rule is length of British colonial rule in
a territory. Huntington (1984, 206) asserts that British colonial rule should only have promoted democracy
in countries it ruled for a long period, whereas the democratic record of former British colonies in Africa,
“where British rule dates only from the late nineteenth century, is not all that different from that of the for-
mer African colonies of other European powers.” Olsson (2009) provides statistical evidence that the length
of British colonial rule mattered. Mahoney (2010), though not explicitly discussing democracy, emphasizes
the intensity of colonial rule and its interaction with colonizer origin.
Lange (2004, 2009) statistically examines heterogeneity within the British empire by measuring the direct-
ness of British rule with the percentage of court cases in the 1950s that were heard in customary rather
than British colonial courts. More customary court cases correspond to less direct rule. Among a sample of
ex-British colonies, he demonstrates a positive relationship between direct rule and post-colonial democracy
(2004, 915). An even more extreme type of British indirect rule occurred in its Middle Eastern colonies,
which were acquired as Mandate territories after World War I and/or ruled indirectly through monarchs.
There is also evidence that Britain ruled more directly in its forced settlement colonies, in particular by
granting metropolitan legal rights to colonial subjects prior to World War II (Owolabi 2015). This is closely
related to Mamdani’s (1996) hypothesis that two-tiered colonial legal systems, prevalent in African colonies,
contributed to subsequent political dysfunction.
These arguments differ from unconditional pro-Britain positions by implying that British rule should be
associated with democracy in areas where it was especially intrusive (such as the settler and plantation
colonies), but not in other areas (such as the African and Middle Eastern colonies that gained independence
after 1945). However, similar to cultural and institutional arguments, these theories do not carry obvious
implications for pronounced changes over time in the strength of the Britain effect. British colonies ruled
directly and/or for long periods should be stable democracies since independence, whereas indirectly ruled
countries should not be democratic at independence or afterwards.
5

2.3 Alternative Historical Explanations
Other recent work on historical causes of democracy has argued that the identity of the colonizer is relatively
unimportant. This research instead posits that alternative aspects of the colonial or pre-colonial era that
correlate with colonizer identity offer greater explanatory power.
Two recent contributions critique the British colonialism-democracy thesis by arguing that cross-empire
Protestant missionary influence accounts for the beneficial aspects of British colonial rule: “Some scholars
suggest that British colonialism fostered democracy . . . but this may be because [Protestant missionaries]
had greater influence in British colonies” (Woodberry 2012, 254). Although British colonies tended to have
higher education levels, stronger civil societies, and more electoral participation prior to independence,
Woodberry claims these are entirely accounted for by the larger number of Protestant missionaries in British
colonies (255). Lankina and Getachew (2012, 466-7) similarly argue: “With respect to the societal under-
pinnings for democratic development, the record of British colonialism is not very laudable. . . . Our call to
isolate the impact of missionary activity from that of colonial authority rests on the role of Christian missions
in the promotion of education.” Empirically, Woodberry (2012) demonstrates that the British colonialism
dummy becomes statistically insignificant and substantively small when controlling for colonial-era Protes-
tant missionaries using a large sample of countries (minus Europe and neo-Europes) with democracy level
averaged between 1950 and 1994. This resembles Hadenius’ (1992, 133) earlier finding that controlling for
Protestant population share explains away the Britain effect.
Hariri (2012) offers a different account that links the pre-colonial and colonial eras, providing evidence that
(1) territories with a long history of statehood have experienced lower levels of post-Cold War democracy
and (2) a proxy for European settler influence positively correlates with democracy. Although Hariri does
not focus on the Britain-democracy thesis, the general thrust of Hariri’s (2012) framework resembles Wood-
berry (2012) and Lankina and Getachew (2012): specific colonial-era actors caused democracy rather any
inherent features of different empires. Similarly, pre-colonial characteristics of territories, i.e., selection ef-
fects, impact prospects for the directness of rule and for democracy promotion rather than the identity of the
colonizer. Acemoglu et al.’s (2001) related contribution about colonial-era European settlers and economic
institutions explicitly draws this conclusion: “it appears that British colonies are found to perform substan-
tially better in other studies in large part because Britain colonized places where [large-scale European]
settlements were possible, and this made British colonies inherit better institutions” (1388).
6

Like other existing arguments about Britain and democracy, these alternative historical explanations do not
anticipate changes in the efficacy of British colonialism over time. They posit that after controlling for the
causally important historical factors—and therefore addressing selection effects—British rule should not
correlate with democracy either at independence or anytime afterwards.
3 Empirical Setup
3.1 Samples
A key feature of the current study is to examine multiple time periods. The core models examine corre-
lations among all post-independence years, the first full year of independence,1 and only post-1991 years.
The latter period corresponds with the end of the Cold War, which is theoretically relevant for reasons dis-
cussed in the mechanism sections below. However, the appendix also shows the results are similar using
different definitions of “early” and “late” periods since independence (Appendix Table A.8). The appendix
also presents models that interact British colonialism with years since independence and calendar years (Ap-
pendix Table A.9). Using disaggregated time periods provides an important difference between our study
and other recent colonialism-democracy articles that only analyze average outcomes over long or poten-
tially unrepresentative time periods. For example, Woodberry (2012) only examines average democracy
levels between 1950 and 1994 and Hariri (2012) only analyzes average democracy levels between 1991 and
2007. Studying multiple periods enables distinguishing short-term from long-term effects, which is crucial
for theory assessment.
We also examine two different country samples among countries with Polity IV data (Marshall and Gurr
2014): the set of former colonies that gained independence from a Western European country between
World War II and 1980, and the set of all non-European countries. The first sample is relatively large (73
countries) and groups together countries that are similar in experiencing decolonization around the same
time. This ensures that when examining long-term effects in the post-Cold War era (a commonly studied
period in colonialism studies, e.g., Acemoglu et al. 2001; Hariri 2012), countries have experienced post-
colonial periods of roughly similar length. The post-1945 independence sample also alleviates concerns
about temporally heterogeneous colonizer legacies—considering different modes of colonial rule and atti-
tudes toward democracy promotion in different waves of decolonization—and concerns that highly unrep-1Polity IV measures its variables in December 31 of the given year.
7

resentative colonies such as “neo-British” settler colonies (United States, Canada, Australia, New Zealand)
drive the results.2
However, to demonstrate that the temporally contingent Britain effect does not depend upon this particular
sample, we re-run every specification in Tables 1 to 3 with a sample of all non-European countries (includ-
ing never-colonized countries). The results for all non-European countries show that including the bulk of
the former Spanish empire and the neo-Britains do not substantively change the findings for British colo-
nialism, whereas comparing results from the two samples carries important implications for other prominent
colonialism-democracy hypotheses.
Appendix Table A.1 lists all countries in the full sample by year of independence, from which we also
constructed the 1945 to 1980 sample.
3.2 Data
Colonizer identity. We follow standard definitions of overseas colonialism to measure British colonialism.
Some cases are complicated because Britain exerted minimal internal control (Arabian peninsula colonies),
were ruled for a very short period of time (Middle Eastern Mandate territories colonized after World War I),
or were transferred after World War II (former Italian colonies). We use Wahman, Teorell, and Hadenius’
(2013) data, which code the former two categories but not the latter as British colonies. However, we show
that our results do not hinge on including Middle Eastern countries in the British empire—and, in fact, this
coding decision biases against finding a positive Britain-democracy correlation at independence.
Democracy. We use the standard polity2 variable from the Polity IV dataset (Marshall and Gurr 2014) to
measure democracy. In addition to wide usage in the literature, this dataset is also advantageous because of
its broad temporal coverage: 1800 to the present. The appendix provides robustness checks using Cheibub
et al.’s (2013) update of Przeworski et al.’s (2000) binary democracy variable, which has coverage starting
in 1946, and Coppedge et al.’s (2016) polyarchy measure from the V-Dem dataset (coverage starts in 1900).
Separately, although coding democracy scores at independence may seem to be an error-prone process,
there do not appear to be strong concerns about measurement error in polity2 at independence relative to
other times and places. The Polity coders do not flag any cases of coding uncertainty in the year after
independence, compared to 33 cases in later years of our sample.2Owolabi (2015, 45) discusses additional advantages of studying a post-1945 independence sample.
8

Finally, although it is standard in the literature to use aggregated democracy measures, the appendix also
presents robustness checks based on various subindices of democracy drawn from the Polity IV and V-Dem
datasets to assess whether British rule only influenced specific institutional features.
Table A.2 details the various covariates used below. Table A.3 provides summary statistics for each vari-
able.
4 Statistical Evidence for a Time-Varying British Legacy
The cross-tabular patterns for British versus non-British ex-colonies are striking. Over half of British ex-
colonies were democratic at independence, compared to only one non-British colony (Appendix Table A.4
provides details). However, since 1991, only 23% of ex-British colonies have had an average polity2 score
of at least 6, compared to 16% of non-British colonies. Figure 1 illustrates these two key cross-sectional
patterns in the data by plotting average polity2 score for ex-British and non-former British colonies against
years since each country gained independence, among post-1945 decolonization cases. It contains the first
35 years of independence because this is the longest time period that enables a constant sample of coun-
tries. First, ex-British colonies were strikingly more democratic on average at independence than other ex-
colonies. Second, this gap narrowed considerably over time. Because many countries in the sample gained
independence in the early 1960s, the period of 30-to-35 years after independence roughly corresponds to the
peak of the “Third Wave” in the mid-1990s.
Figure 1: Ex-British Colonies Versus Other Countries, by Years Since Independence
−3−2
−10
12
3M
ean
Polit
y Sc
ore
0 5 10 15 20 25 30 35Years Since Independence
British Non−British
Notes: The vertical axis shows the average polity2 score for ex-British colonies and for other countries in our sample, averagedacross the number of years since a particular country achieved independence.
9
This section statistically establishes the core cross-sectional patterns—robustly strong correlation at inde-
pendence and consistently weak post-1991 correlation—before subsequent sections explain why British
colonies were advantaged at independence followed by convergence over time. The cross-sectional findings
are robust to adding a standard set of democracy covariates, to changing democracy measures, to controlling
for variables posited in research suggesting that Britain simply selected better colonies, and to examining ei-
ther a post-1945 decolonization sample or all non-European countries. These temporally contingent findings
also hold among many subsets of the British empire, including briefly ruled and indirectly ruled colonies.
We show only a very large amount of bias from unobserved covariates could explain away the estimated
effect at independence. Finally, any claim that omitted variables can explain away the temporally heteroge-
neous pattern must identify factors that—in addition to covarying with colonizer identity—strongly covary
with democracy levels at independence but not several decades afterwards.
We present results from pooled OLS models that use country-year as the unit of observation and cluster
standard errors by country. The basic model estimated in Table 1 is:
polity2it = α+ δBritishColonyi + βXit + εit, (1)
where polity2it is the polity2 score for country i in year t, δ is the main parameter of interest, and Xit is a
vector of covariates that varies across specifications.
4.1 Core Results
Table 1, Panel A examines countries that gained independence after 1945 from a Western European country,
and Panel B uses the expanded sample of all non-European countries with polity2 data. Column 1 in both
panels pools all sample years. It recovers the common finding in the existing large-N literature: former
British colonies are in general more democratic than other countries. Column 2 demonstrates that this
relationship remains even when controlling for a set of five standard democracy covariates in Panel A:
logged annual GDP per capita, logged annual population, logged annual oil and gas production per capita,
Muslim percentage of the population in 1980, and ethnic fractionalization.3
3Three of the 73 countries in the core sample are missing GDP per capita data in all years (four at
independence), which accounts for the discrepancy in sample size between the specifications that include
these covariates versus those that do not. Because of missing data on the three time-varying covariates in the19th century, the Panel B regressions with controls only include ethnic fractionalization and Muslims (two
10
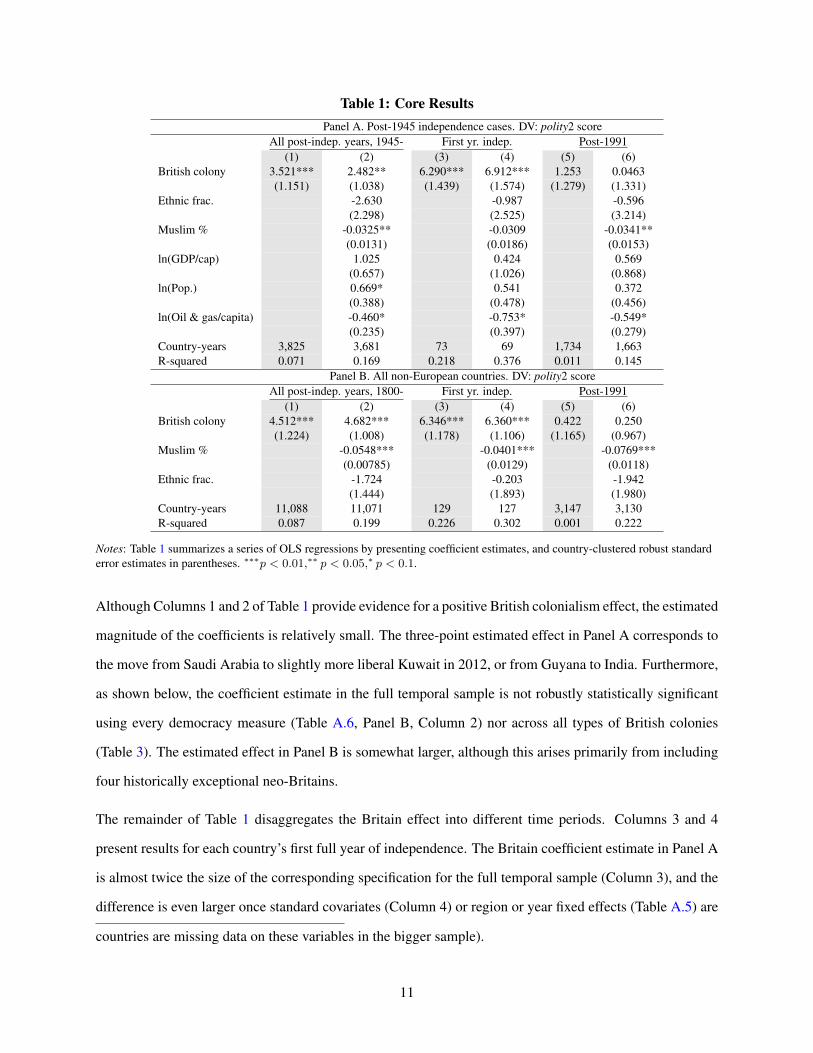
Table 1: Core ResultsPanel A. Post-1945 independence cases. DV: polity2 score
All post-indep. years, 1945- First yr. indep. Post-1991(1) (2) (3) (4) (5) (6)
British colony 3.521*** 2.482** 6.290*** 6.912*** 1.253 0.0463(1.151) (1.038) (1.439) (1.574) (1.279) (1.331)
Ethnic frac. -2.630 -0.987 -0.596(2.298) (2.525) (3.214)
Muslim % -0.0325** -0.0309 -0.0341**(0.0131) (0.0186) (0.0153)
ln(GDP/cap) 1.025 0.424 0.569(0.657) (1.026) (0.868)
ln(Pop.) 0.669* 0.541 0.372(0.388) (0.478) (0.456)
ln(Oil & gas/capita) -0.460* -0.753* -0.549*(0.235) (0.397) (0.279)
Country-years 3,825 3,681 73 69 1,734 1,663R-squared 0.071 0.169 0.218 0.376 0.011 0.145
Panel B. All non-European countries. DV: polity2 scoreAll post-indep. years, 1800- First yr. indep. Post-1991
(1) (2) (3) (4) (5) (6)British colony 4.512*** 4.682*** 6.346*** 6.360*** 0.422 0.250
(1.224) (1.008) (1.178) (1.106) (1.165) (0.967)Muslim % -0.0548*** -0.0401*** -0.0769***
(0.00785) (0.0129) (0.0118)Ethnic frac. -1.724 -0.203 -1.942
(1.444) (1.893) (1.980)Country-years 11,088 11,071 129 127 3,147 3,130R-squared 0.087 0.199 0.226 0.302 0.001 0.222
Notes: Table 1 summarizes a series of OLS regressions by presenting coefficient estimates, and country-clustered robust standarderror estimates in parentheses. ∗∗∗p < 0.01,∗∗ p < 0.05,∗ p < 0.1.
Although Columns 1 and 2 of Table 1 provide evidence for a positive British colonialism effect, the estimated
magnitude of the coefficients is relatively small. The three-point estimated effect in Panel A corresponds to
the move from Saudi Arabia to slightly more liberal Kuwait in 2012, or from Guyana to India. Furthermore,
as shown below, the coefficient estimate in the full temporal sample is not robustly statistically significant
using every democracy measure (Table A.6, Panel B, Column 2) nor across all types of British colonies
(Table 3). The estimated effect in Panel B is somewhat larger, although this arises primarily from including
four historically exceptional neo-Britains.
The remainder of Table 1 disaggregates the Britain effect into different time periods. Columns 3 and 4
present results for each country’s first full year of independence. The Britain coefficient estimate in Panel A
is almost twice the size of the corresponding specification for the full temporal sample (Column 3), and the
difference is even larger once standard covariates (Column 4) or region or year fixed effects (Table A.5) are
countries are missing data on these variables in the bigger sample).
11
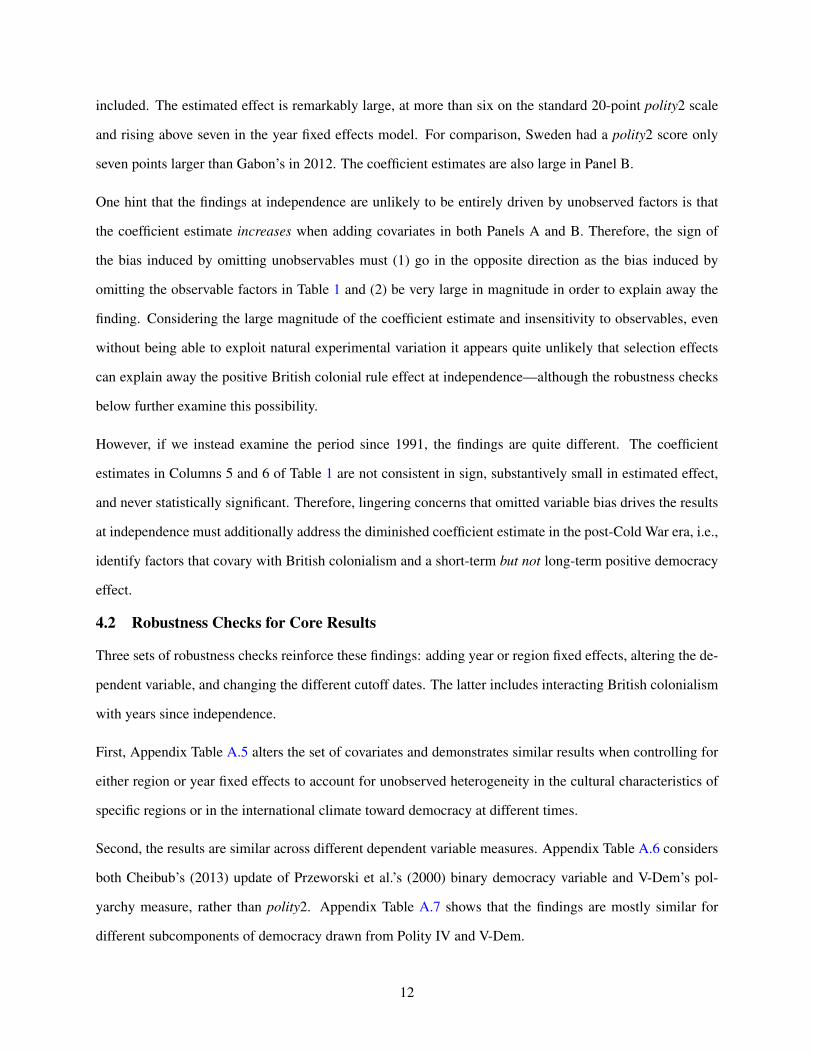
included. The estimated effect is remarkably large, at more than six on the standard 20-point polity2 scale
and rising above seven in the year fixed effects model. For comparison, Sweden had a polity2 score only
seven points larger than Gabon’s in 2012. The coefficient estimates are also large in Panel B.
One hint that the findings at independence are unlikely to be entirely driven by unobserved factors is that
the coefficient estimate increases when adding covariates in both Panels A and B. Therefore, the sign of
the bias induced by omitting unobservables must (1) go in the opposite direction as the bias induced by
omitting the observable factors in Table 1 and (2) be very large in magnitude in order to explain away the
finding. Considering the large magnitude of the coefficient estimate and insensitivity to observables, even
without being able to exploit natural experimental variation it appears quite unlikely that selection effects
can explain away the positive British colonial rule effect at independence—although the robustness checks
below further examine this possibility.
However, if we instead examine the period since 1991, the findings are quite different. The coefficient
estimates in Columns 5 and 6 of Table 1 are not consistent in sign, substantively small in estimated effect,
and never statistically significant. Therefore, lingering concerns that omitted variable bias drives the results
at independence must additionally address the diminished coefficient estimate in the post-Cold War era, i.e.,
identify factors that covary with British colonialism and a short-term but not long-term positive democracy
effect.
4.2 Robustness Checks for Core Results
Three sets of robustness checks reinforce these findings: adding year or region fixed effects, altering the de-
pendent variable, and changing the different cutoff dates. The latter includes interacting British colonialism
with years since independence.
First, Appendix Table A.5 alters the set of covariates and demonstrates similar results when controlling for
either region or year fixed effects to account for unobserved heterogeneity in the cultural characteristics of
specific regions or in the international climate toward democracy at different times.
Second, the results are similar across different dependent variable measures. Appendix Table A.6 considers
both Cheibub’s (2013) update of Przeworski et al.’s (2000) binary democracy variable and V-Dem’s pol-
yarchy measure, rather than polity2. Appendix Table A.7 shows that the findings are mostly similar for
different subcomponents of democracy drawn from Polity IV and V-Dem.
12
Third, the chosen date cutoffs do not seem to affect the findings, either. Appendix Table A.8 demonstrates
that the coefficient estimates from Columns 3 and 4 of Table 1 are similar when analyzing average polity2
score over each country’s first six years of independence, instead of just the first year. We address below
why the coefficient estimates are somewhat smaller when expanding the initial post-independence period
to six years. Additionally, the findings from Columns 5 and 6 of Table 1 are qualitatively unchanged when
defining “recent” years as either all post-30 years of independence or only 2012, rather than the post-1991
period. Finally, Appendix Table A.9 includes all years and interacts British colonialism with either year or
years since independence. It provides evidence for a significant declining effect over time.
4.3 Selecting Better Colonies?
Many studies have proposed colonial or pre-colonial factors other than British colonization as predictors of
democracy. Table 2 and Appendix Tables A.10, A.11, and A.12 evaluate prominent alternative historical ac-
counts. These tables generate two main takeaways. First, alternative historical accounts do not explain away
the Britain effect even though, as discussed below, many of them likely introduce post-treatment bias into
the regression estimates. The Britain coefficient remains large and statistically significant in every regres-
sion in the first year of independence (Columns 3 and 4 of each panel), and the coefficient estimates from
the whole-sample regressions are also minimally impacted (Columns 1 and 2). Second, the disaggregated
time periods and samples we present suggest important qualifications to arguments about other colonial
legacies. These findings mitigate concerns that Britain—which, as the world’s leading naval power in the
19th century, was well-positioned to annex the most economically and strategically desirable colonies—
simply colonized places that were inclined to become more democratic regardless of which European power
colonized them.
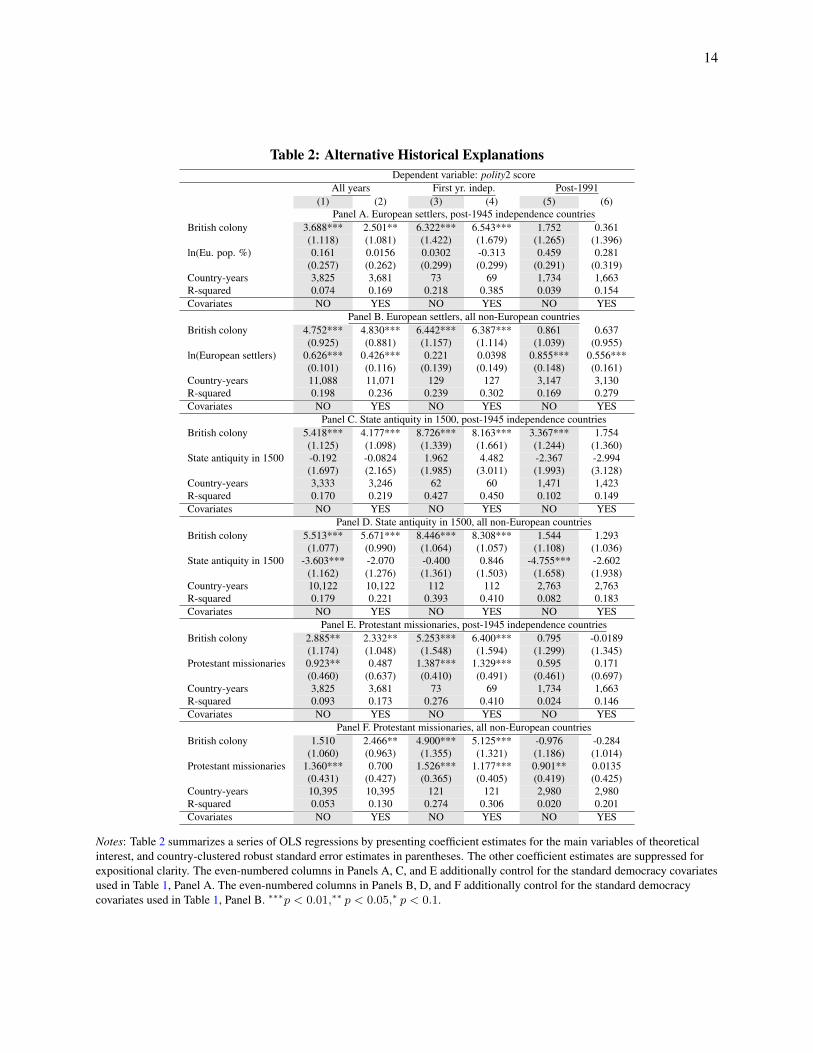
Panels A and B of Table 2 assess the European settlers thesis—premised on the idea that settlers transplanted
pro-democratic institutions—which does not explain away the temporally contingent Britain effect and it-
self receives circumscribed support. When examining post-1945 decolonization cases, the European settler
coefficient is consistently small in magnitude and never statistically significant. Among all non-European
countries, the settlers thesis receives support in all years and in post-1991 years but not at independence.
Therefore, European settlers may explain some variation in post-colonial democracy, but these differences
did not exist at independence. This finding contrasts with Acemoglu et al.’s (2001) and Hariri’s (2012) hy-
pothesis that colonial European settlers transplanted representative institutions from their home countries.
13
14
Table 2: Alternative Historical ExplanationsDependent variable: polity2 score
All years First yr. indep. Post-1991(1) (2) (3) (4) (5) (6)
Panel A. European settlers, post-1945 independence countriesBritish colony 3.688*** 2.501** 6.322*** 6.543*** 1.752 0.361
(1.118) (1.081) (1.422) (1.679) (1.265) (1.396)ln(Eu. pop. %) 0.161 0.0156 0.0302 -0.313 0.459 0.281
(0.257) (0.262) (0.299) (0.299) (0.291) (0.319)Country-years 3,825 3,681 73 69 1,734 1,663R-squared 0.074 0.169 0.218 0.385 0.039 0.154Covariates NO YES NO YES NO YES
Panel B. European settlers, all non-European countriesBritish colony 4.752*** 4.830*** 6.442*** 6.387*** 0.861 0.637
(0.925) (0.881) (1.157) (1.114) (1.039) (0.955)ln(European settlers) 0.626*** 0.426*** 0.221 0.0398 0.855*** 0.556***
(0.101) (0.116) (0.139) (0.149) (0.148) (0.161)Country-years 11,088 11,071 129 127 3,147 3,130R-squared 0.198 0.236 0.239 0.302 0.169 0.279Covariates NO YES NO YES NO YES
Panel C. State antiquity in 1500, post-1945 independence countriesBritish colony 5.418*** 4.177*** 8.726*** 8.163*** 3.367*** 1.754
(1.125) (1.098) (1.339) (1.661) (1.244) (1.360)State antiquity in 1500 -0.192 -0.0824 1.962 4.482 -2.367 -2.994
(1.697) (2.165) (1.985) (3.011) (1.993) (3.128)Country-years 3,333 3,246 62 60 1,471 1,423R-squared 0.170 0.219 0.427 0.450 0.102 0.149Covariates NO YES NO YES NO YES
Panel D. State antiquity in 1500, all non-European countriesBritish colony 5.513*** 5.671*** 8.446*** 8.308*** 1.544 1.293
(1.077) (0.990) (1.064) (1.057) (1.108) (1.036)State antiquity in 1500 -3.603*** -2.070 -0.400 0.846 -4.755*** -2.602
(1.162) (1.276) (1.361) (1.503) (1.658) (1.938)Country-years 10,122 10,122 112 112 2,763 2,763R-squared 0.179 0.221 0.393 0.410 0.082 0.183Covariates NO YES NO YES NO YES
Panel E. Protestant missionaries, post-1945 independence countriesBritish colony 2.885** 2.332** 5.253*** 6.400*** 0.795 -0.0189
(1.174) (1.048) (1.548) (1.594) (1.299) (1.345)Protestant missionaries 0.923** 0.487 1.387*** 1.329*** 0.595 0.171
(0.460) (0.637) (0.410) (0.491) (0.461) (0.697)Country-years 3,825 3,681 73 69 1,734 1,663R-squared 0.093 0.173 0.276 0.410 0.024 0.146Covariates NO YES NO YES NO YES
Panel F. Protestant missionaries, all non-European countriesBritish colony 1.510 2.466** 4.900*** 5.125*** -0.976 -0.284
(1.060) (0.963) (1.355) (1.321) (1.186) (1.014)Protestant missionaries 1.360*** 0.700 1.526*** 1.177*** 0.901** 0.0135
(0.431) (0.427) (0.365) (0.405) (0.419) (0.425)Country-years 10,395 10,395 121 121 2,980 2,980R-squared 0.053 0.130 0.274 0.306 0.020 0.201Covariates NO YES NO YES NO YES
Notes: Table 2 summarizes a series of OLS regressions by presenting coefficient estimates for the main variables of theoreticalinterest, and country-clustered robust standard error estimates in parentheses. The other coefficient estimates are suppressed forexpositional clarity. The even-numbered columns in Panels A, C, and E additionally control for the standard democracy covariatesused in Table 1, Panel A. The even-numbered columns in Panels B, D, and F additionally control for the standard democracycovariates used in Table 1, Panel B. ∗∗∗p < 0.01,∗∗ p < 0.05,∗ p < 0.1.
In addition, the null results in Panel A suggest that pro-settler findings are driven entirely by comparing
early independence cases in the New World to late-decolonizing Old World countries—a concerning basis
for counterfactual comparison because many differences besides European settlers distinguish these areas
of the world.
The thesis that areas with longer histories of statehood above the local level should be less democratic, eval-
uated in Panels C and D, receives even weaker support. Overall, the results are similar to those for European
settlers: no support in the post-1945 decolonization sample; and, among all non-European countries, some
support in all years and post-1991, but not at independence. Every specification for the first year of indepen-
dence has a positive sign, i.e., opposite from theoretical prediction. Absent theoretical guidance, it appears
concerning for a hypothesis about a historical legacy that the effect finds support only in very recent years.
And even for the two specifications in which the state antiquity hypothesis receives support, the coefficient
estimate diminishes considerably in magnitude when adding additional covariates (Panel D, Columns 2 and
6). Appendix Table A.10 demonstrates similar results as in Panels A through D of Table 2 when controlling
for related pre-colonial or early colonial factors: European settler mortality rates (Acemoglu et al. 2001),
historical population density (Acemoglu et al. 2002), years elapsed since a territory’s Neolithic transition
(Hariri 2012), and the date of colonial conquest.
The Protestant missionary hypothesis also cannot explain away the Britain effect at independence,4 and
itself appears to follow a similar temporal pattern. In both samples in Panels E and F, the hypothesis receives
somewhat strong support in all years, and very strong support at independence but not after 1991. Additional
theorizing is needed to explain this temporally contingent pattern because existing pro-missionary arguments
rely on the types of structural cultural influences that seemingly should imply a long-term in addition to a
short-term effect (Woodberry 2012; Lankina and Getachew 2012). Tables A.11 and A.12 show that two
related human capital explanations (secondary education and literacy) also cannot explain away the Britain
effect, nor can standard geographical controls.
Two theoretical considerations should be noted. First, it is not clear a priori whether these colonial-era fac-
tors are truly alternative explanations—implying that omitted variables bias the Britain coefficient estimate
in regressions that do not include these factors—or are consequences of the Britain treatment, which would4The magnitude of the coefficient estimate for British colonialism in Panel F relative to Panel B of Table
1 is somewhat attenuated because Woodberry (2012) is missing data for the four neo-Britains.
15

imply that controlling for them introduces post-treatment bias to the Britain coefficient estimate. For exam-
ple, if colonies that factually had large Protestant missionary populations would have hosted similarly large
missions even had they been counterfactually colonized by a different power, then Protestant missionaries
are an alternative explanation for the Britain-democracy correlation. If instead large missionary popula-
tions were a consequence of British colonial rule, then Protestant missionaries are a mechanism connecting
British colonialism and democracy. Because it is not clear theoretically whether concerns about omitted
variable bias or post-treatment bias are more relevant for these data, it is reassuring that the Table 1 and
Table 2 findings for British colonialism are quite similar.
Second, pre-colonial factors provide a poor theoretical explanation for the time-varying nature of the British
colonialism-democracy relationship. Although Britain may have colonized areas with some inherent affin-
ity for democracy, it seems implausible that Britain colonized areas more inherently likely to experience
democracy at independence, but not to remain more democratic than the rest of the post-colonial world over
time. At the very least, the literature provides no guidance for what such a selection mechanism might look
like.
4.4 Heterogeneity Within the British Empire
Another possible concern with the Table 1 results is that because the British empire exhibited diverse forms
of rule, it is uninformative to consider British colonialism as a whole. Certainly, the British empire was
notable for the cultural and geographic diversity of areas it ruled and for the variety of institutional forms
adopted to govern them. Various British bureaucracies—such as the Colonial Office, India Office, the For-
eign Office, and for-profit corporations—established their own local institutions and followed divergent
policies toward local inhabitants and traditional authorities. If the effects of British colonialism were con-
centrated only in colonies that received a specific institutional inheritance, it would be strong evidence of
the importance of these institutions rather than factors common to all British colonies.
We demonstrate instead that even British colonies with “weak” institutional inheritances were more demo-
cratic than non-British colonies at independence. This is consistent with the temporally contingent pattern
shown above, although in some models more intensely ruled British colonies (which is, of course, endoge-
nous to many local traits) has a positive effect on democracy even after 1991. Table 3 examines the post-1945
decolonization sample and Appendix Table A.13 demonstrates that the results are qualitatively identical for
all non-European countries.
16

Table 3: Heterogeneity Within the British EmpireDependent variable: polity2 score. Sample: post-1945 decolonization countries
Panel A: Direct vs. indirect British ruleAll years First yr. indep. Post-1991
(1) (2) (3) (4) (5) (6)British direct rule 7.835*** 6.740*** 10.61*** 11.26*** 4.942** 4.022
(1.750) (2.213) (1.498) (2.004) (1.979) (2.981)British indirect rule 1.944 1.273 4.794*** 5.526*** -0.0305 -0.627
(1.240) (1.077) (1.671) (1.754) (1.368) (1.314)Country-years 3,825 3,681 73 69 1,734 1,663R-squared 0.145 0.224 0.287 0.434 0.072 0.189Covariates NO YES NO YES NO YES
Panel B: Metropolitan British rights vs. notAll years First yr. indep. Post-1991
(1) (2) (3) (4) (5) (6)Br w/ metropolitan rights 9.577*** 9.236*** 10.32*** 10.83*** 6.686*** 6.431**
(1.501) (2.006) (1.619) (2.454) (1.549) (2.507)Br w/o metropolitan rights 1.751 1.598 5.096*** 6.230*** -0.354 -0.364
(1.153) (1.010) (1.649) (1.654) (1.339) (1.293)Country-years 3,825 3,681 73 69 1,734 1,663R-squared 0.188 0.251 0.269 0.404 0.124 0.216Covariates NO YES NO YES NO YES
Panel C: Long vs. short British ruleAll years First yr. indep. Post-1991
(1) (2) (3) (4) (5) (6)Long British rule 7.422*** 6.425*** 8.653*** 8.798*** 5.001*** 4.625***
(1.248) (1.500) (1.656) (2.010) (1.345) (1.737)Short British rule 0.00197 -0.0376 4.058** 5.574*** -2.295 -2.336*
(1.271) (1.098) (1.955) (1.901) (1.447) (1.315)Country-years 3,825 3,681 73 69 1,734 1,663R-squared 0.221 0.268 0.274 0.399 0.183 0.275Covariates NO YES NO YES NO YES
Panel D: Exclude Middle EastAll years First yr. indep. Post-1991
(1) (2) (3) (4) (5) (6)British colony 4.259*** 3.506*** 8.290*** 8.712*** 1.998 0.842
(1.114) (1.140) (1.342) (1.489) (1.231) (1.517)Country-years 3,338 3,194 64 60 1,532 1,461R-squared 0.109 0.126 0.399 0.449 0.030 0.036Covariates NO YES NO YES NO YES
Panel E: Only AfricaAll years First yr. indep. Post-1991
(1) (2) (3) (4) (5) (6)British colony 2.348** 1.683 7.682*** 8.083*** 0.435 -0.804
(1.157) (1.209) (1.787) (1.909) (1.551) (1.467)Country-years 2,057 2,057 41 41 981 981R-squared 0.036 0.053 0.366 0.380 0.002 0.064Covariates NO YES NO YES NO YES
Notes: See notes to Table 2 (Panels A, C, E).
Panels A through C present results for three measures of the directness or intensity of British rule. In Panel
A, we code a British colony as experiencing direct British rule if less than 20 percent of its court cases in the
1950s were heard in customary courts, whereas British indirect rule composes the remaining British colonies
(Lange 2004).5 Panel B disaggregates British colonialism using Owolabi’s (2015) dichotomous measure of
whether colonial subjects possessed legal rights equivalent to metropolitan citizens’. Panel C disaggregates5There is a natural break in Lange’s variable around 20 percent.
17
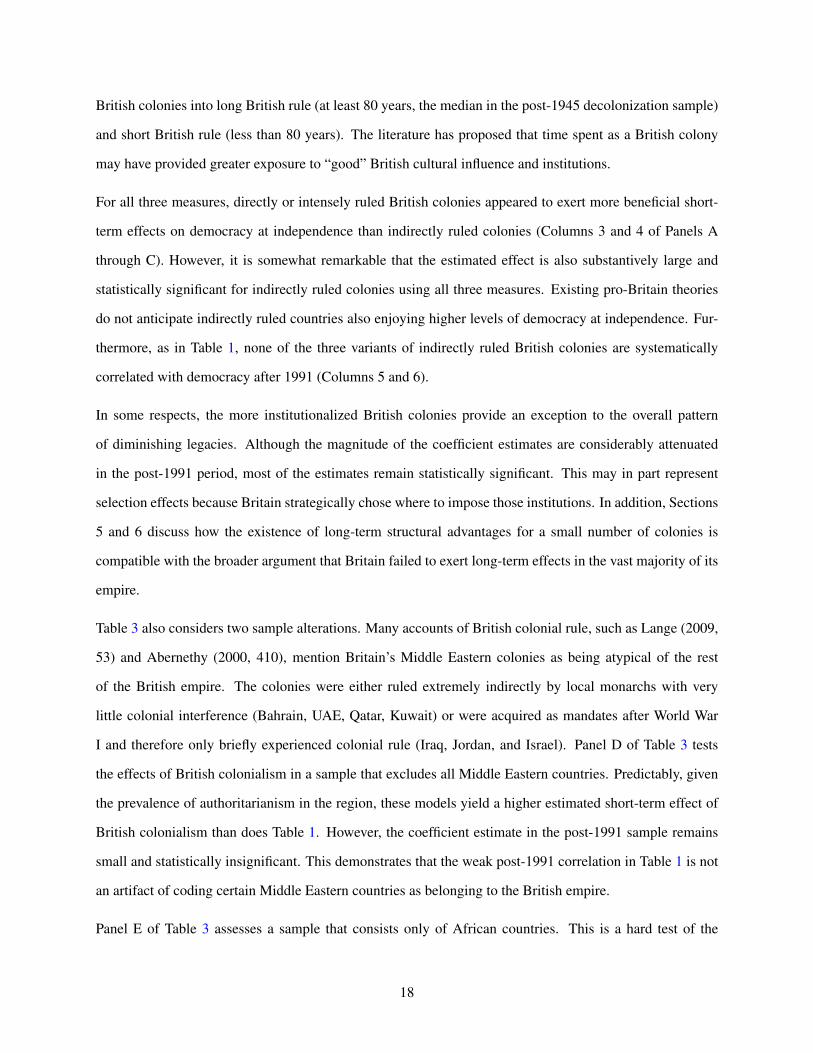
British colonies into long British rule (at least 80 years, the median in the post-1945 decolonization sample)
and short British rule (less than 80 years). The literature has proposed that time spent as a British colony
may have provided greater exposure to “good” British cultural influence and institutions.
For all three measures, directly or intensely ruled British colonies appeared to exert more beneficial short-
term effects on democracy at independence than indirectly ruled colonies (Columns 3 and 4 of Panels A
through C). However, it is somewhat remarkable that the estimated effect is also substantively large and
statistically significant for indirectly ruled colonies using all three measures. Existing pro-Britain theories
do not anticipate indirectly ruled countries also enjoying higher levels of democracy at independence. Fur-
thermore, as in Table 1, none of the three variants of indirectly ruled British colonies are systematically
correlated with democracy after 1991 (Columns 5 and 6).
In some respects, the more institutionalized British colonies provide an exception to the overall pattern
of diminishing legacies. Although the magnitude of the coefficient estimates are considerably attenuated
in the post-1991 period, most of the estimates remain statistically significant. This may in part represent
selection effects because Britain strategically chose where to impose those institutions. In addition, Sections
5 and 6 discuss how the existence of long-term structural advantages for a small number of colonies is
compatible with the broader argument that Britain failed to exert long-term effects in the vast majority of its
empire.
Table 3 also considers two sample alterations. Many accounts of British colonial rule, such as Lange (2009,
53) and Abernethy (2000, 410), mention Britain’s Middle Eastern colonies as being atypical of the rest
of the British empire. The colonies were either ruled extremely indirectly by local monarchs with very
little colonial interference (Bahrain, UAE, Qatar, Kuwait) or were acquired as mandates after World War
I and therefore only briefly experienced colonial rule (Iraq, Jordan, and Israel). Panel D of Table 3 tests
the effects of British colonialism in a sample that excludes all Middle Eastern countries. Predictably, given
the prevalence of authoritarianism in the region, these models yield a higher estimated short-term effect of
British colonialism than does Table 1. However, the coefficient estimate in the post-1991 sample remains
small and statistically insignificant. This demonstrates that the weak post-1991 correlation in Table 1 is not
an artifact of coding certain Middle Eastern countries as belonging to the British empire.
Panel E of Table 3 assesses a sample that consists only of African countries. This is a hard test of the
18

colonizer influence hypothesis because Britain’s African colonies tended to experience short durations of
colonial rule, and were poorly institutionalized and characterized by systems of rule that denied full legal
rights to large sections of the population (Mamdani 1996). By contrast, most cases frequently cited as
examples of positive British institutional legacies, such as India and the Caribbean nations, are outside of
Africa (Diamond 1988, 6). However, the estimated short-term effect of British colonialism is in fact larger
in Africa than among all post-1945 independence countries, and yields the same pattern of strong short-term
but not long-term effects—contrary to Huntington’s (1984, 206) assertion that British colonialism had no
effect in Africa.
In sum, these results consistently demonstrate that British colonialism exerted a positive effect at least in the
short-term across a wide variety of colonial experiences and geographical regions. This includes areas where
the institutional legacies of British rule have frequently been characterized as weak or even negative.
4.5 Additional Robustness Checks: Post-Colonial Influence andDisaggregating European Colonizers
The appendix demonstrates that these results are qualitatively similar under two additional robustness checks.
First, we examine the role of superpower rivalry during the Cold War and post-colonial military presence
(Table A.14). Second, we disaggregate non-British colonies by their colonizer, showing that no single non-
British colonizer drives the findings (Table A.15).
5 Mechanisms I: British Democratic Advantages at Independence
What explains this temporally contingent effect? Despite wide-ranging debates about British colonialism,
no existing political science theories can explain the strong short-term yet weak long-term effect of British
rule. The remainder of the paper presents an alternative theory that integrates Britain’s relatively gradual
and flexible approach to decolonization into traditional arguments, accompanied by statistical and qualitative
evidence. The theory builds off more historically oriented research on decolonization (Smith 1978; Kahler
1984; Spruyt 2005). This section focuses on democracy levels at independence, and the next section explains
why the effect declined over time, using the postwar sample.6
6The remainder of the paper only analyzes the post-1945 decolonization sample for three reasons. First,
to explain change over time, it is important that countries gained independence within the same epoch so
that years since independence roughly align with calendar years and shifts in the international climate for
19

To explain British colonies’ democratic advantages at independence, we argue that relative to its imperial
rivals, Britain was more adept at encouraging democratic preparation prior to granting independence and at
tailoring the timing of independence to individual colonies’ democratic development. Britain also tended
to grant independence in response to strong local demands—which prevented having to relinquish the post-
colonial state to guerrilla movements—although in some cases Britain was forced to rush its timetable to
independence and these colonies did not enjoy the same advantages as other British colonies. By contrast,
other colonizers alternated between an undignified hurry to relinquish colonial possessions and inflexibly op-
posing independence. Statistical evidence demonstrates these decolonization differences—which stemmed
in part from Britain’s relatively high level of democracy and less entrenched colonial lobby—help to explain
divergent democratic inheritances.
5.1 Democracy as an “Honourable” Exit Strategy
Britain more actively encouraged democratic preparation prior to granting independence and tailored the
timing of independence to individual colonies’ democratic development (Young 1970). Britain generally
followed its decolonization strategy of transferring “complete power to colonies as soon as the transfer
could be made decently—that is, to a democratically elected government which could reasonably be held
to represent a ‘national will”’ (Fieldhouse 1986, 8), although of course not every colony met this ideal.
The final pre-independence election tended to culminate a longer process of democratic devolution to fulfill
Britain’s goal of an “honourable exit” (Young 1970, 482). This produced structures for democratically
electing national officials. For example, India gained independence from Britain in 1947, but wealthy voters
had elected national and provincial legislators since the early 1920s, and elected officials had controlled all
the executive departments in some provinces since the 1930s. This required developing political parties,
such as the Congress Party, that provided a foundation for democratic contestation at independence.
Even in poorer and less institutionalized Nigeria, Britain imposed a federal constitution in 1954 designed to
balance sharp regional divisions and to prevent undemocratic power concentration by any one group. In the
late 1950s, as France pushed out its African colonies, in Nigeria, “the Secretary of State for the Colonies
democracy promotion. Second, the modes of Western European colonial rule and decolonization among
their older, primarily New World colonies were very different than for their more recent, primarily Old
World colonies. Finally, as a practical matter, much of the colonial-era data we use below is unavailable for
early decolonization cases.
20
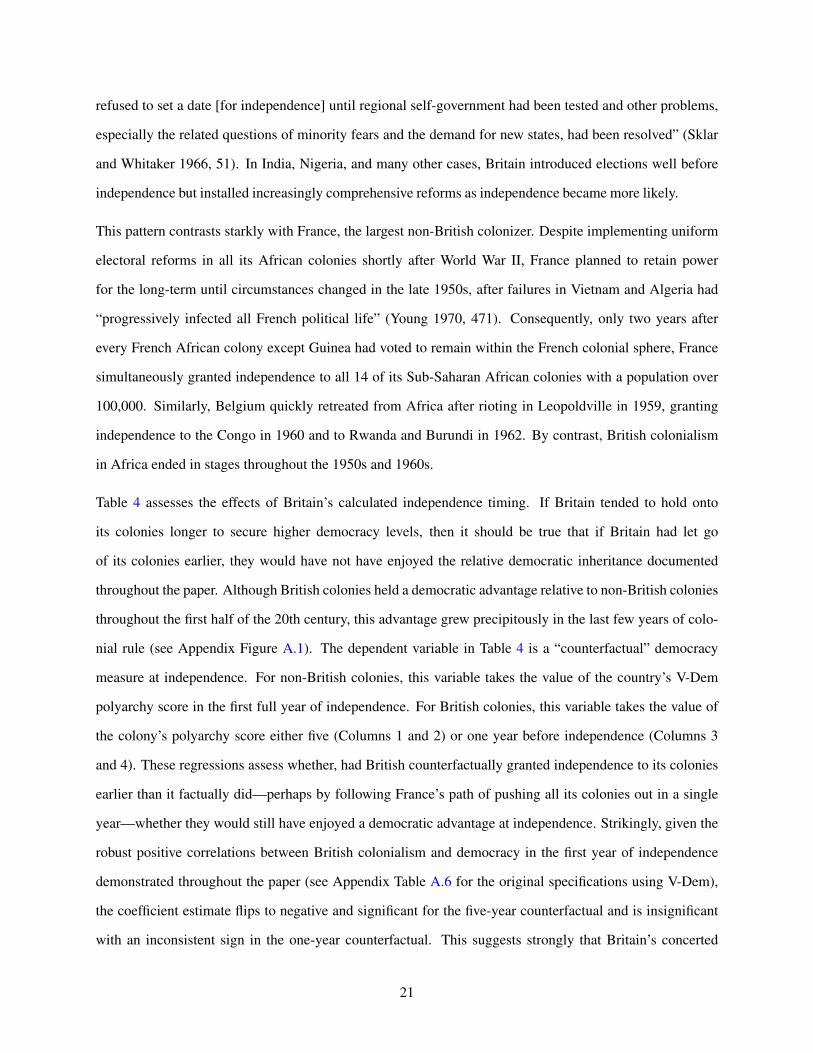
refused to set a date [for independence] until regional self-government had been tested and other problems,
especially the related questions of minority fears and the demand for new states, had been resolved” (Sklar
and Whitaker 1966, 51). In India, Nigeria, and many other cases, Britain introduced elections well before
independence but installed increasingly comprehensive reforms as independence became more likely.
This pattern contrasts starkly with France, the largest non-British colonizer. Despite implementing uniform
electoral reforms in all its African colonies shortly after World War II, France planned to retain power
for the long-term until circumstances changed in the late 1950s, after failures in Vietnam and Algeria had
“progressively infected all French political life” (Young 1970, 471). Consequently, only two years after
every French African colony except Guinea had voted to remain within the French colonial sphere, France
simultaneously granted independence to all 14 of its Sub-Saharan African colonies with a population over
100,000. Similarly, Belgium quickly retreated from Africa after rioting in Leopoldville in 1959, granting
independence to the Congo in 1960 and to Rwanda and Burundi in 1962. By contrast, British colonialism
in Africa ended in stages throughout the 1950s and 1960s.
Table 4 assesses the effects of Britain’s calculated independence timing. If Britain tended to hold onto
its colonies longer to secure higher democracy levels, then it should be true that if Britain had let go
of its colonies earlier, they would have not have enjoyed the relative democratic inheritance documented
throughout the paper. Although British colonies held a democratic advantage relative to non-British colonies
throughout the first half of the 20th century, this advantage grew precipitously in the last few years of colo-
nial rule (see Appendix Figure A.1). The dependent variable in Table 4 is a “counterfactual” democracy
measure at independence. For non-British colonies, this variable takes the value of the country’s V-Dem
polyarchy score in the first full year of independence. For British colonies, this variable takes the value of
the colony’s polyarchy score either five (Columns 1 and 2) or one year before independence (Columns 3
and 4). These regressions assess whether, had British counterfactually granted independence to its colonies
earlier than it factually did—perhaps by following France’s path of pushing all its colonies out in a single
year—whether they would still have enjoyed a democratic advantage at independence. Strikingly, given the
robust positive correlations between British colonialism and democracy in the first year of independence
demonstrated throughout the paper (see Appendix Table A.6 for the original specifications using V-Dem),
the coefficient estimate flips to negative and significant for the five-year counterfactual and is insignificant
with an inconsistent sign in the one-year counterfactual. This suggests strongly that Britain’s concerted
21
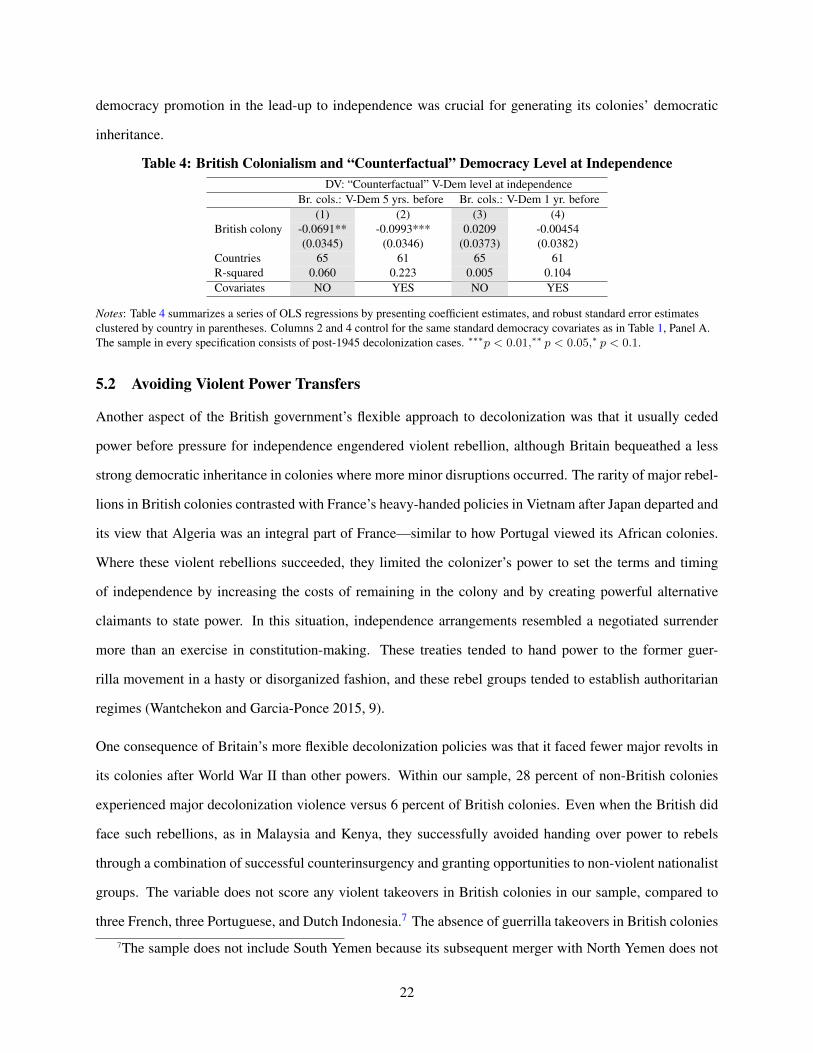
democracy promotion in the lead-up to independence was crucial for generating its colonies’ democratic
inheritance.
Table 4: British Colonialism and “Counterfactual” Democracy Level at IndependenceDV: “Counterfactual” V-Dem level at independence
Br. cols.: V-Dem 5 yrs. before Br. cols.: V-Dem 1 yr. before(1) (2) (3) (4)
British colony -0.0691** -0.0993*** 0.0209 -0.00454(0.0345) (0.0346) (0.0373) (0.0382)
Countries 65 61 65 61R-squared 0.060 0.223 0.005 0.104Covariates NO YES NO YES
Notes: Table 4 summarizes a series of OLS regressions by presenting coefficient estimates, and robust standard error estimatesclustered by country in parentheses. Columns 2 and 4 control for the same standard democracy covariates as in Table 1, Panel A.The sample in every specification consists of post-1945 decolonization cases. ∗∗∗p < 0.01,∗∗ p < 0.05,∗ p < 0.1.
5.2 Avoiding Violent Power Transfers
Another aspect of the British government’s flexible approach to decolonization was that it usually ceded
power before pressure for independence engendered violent rebellion, although Britain bequeathed a less
strong democratic inheritance in colonies where more minor disruptions occurred. The rarity of major rebel-
lions in British colonies contrasted with France’s heavy-handed policies in Vietnam after Japan departed and
its view that Algeria was an integral part of France—similar to how Portugal viewed its African colonies.
Where these violent rebellions succeeded, they limited the colonizer’s power to set the terms and timing
of independence by increasing the costs of remaining in the colony and by creating powerful alternative
claimants to state power. In this situation, independence arrangements resembled a negotiated surrender
more than an exercise in constitution-making. These treaties tended to hand power to the former guer-
rilla movement in a hasty or disorganized fashion, and these rebel groups tended to establish authoritarian
regimes (Wantchekon and Garcia-Ponce 2015, 9).
One consequence of Britain’s more flexible decolonization policies was that it faced fewer major revolts in
its colonies after World War II than other powers. Within our sample, 28 percent of non-British colonies
experienced major decolonization violence versus 6 percent of British colonies. Even when the British did
face such rebellions, as in Malaysia and Kenya, they successfully avoided handing over power to rebels
through a combination of successful counterinsurgency and granting opportunities to non-violent nationalist
groups. The variable does not score any violent takeovers in British colonies in our sample, compared to
three French, three Portuguese, and Dutch Indonesia.7 The absence of guerrilla takeovers in British colonies7The sample does not include South Yemen because its subsequent merger with North Yemen does not
22
spared its new states “a potentially potent source of antidemocratic pressure” (Diamond 1988, 9).
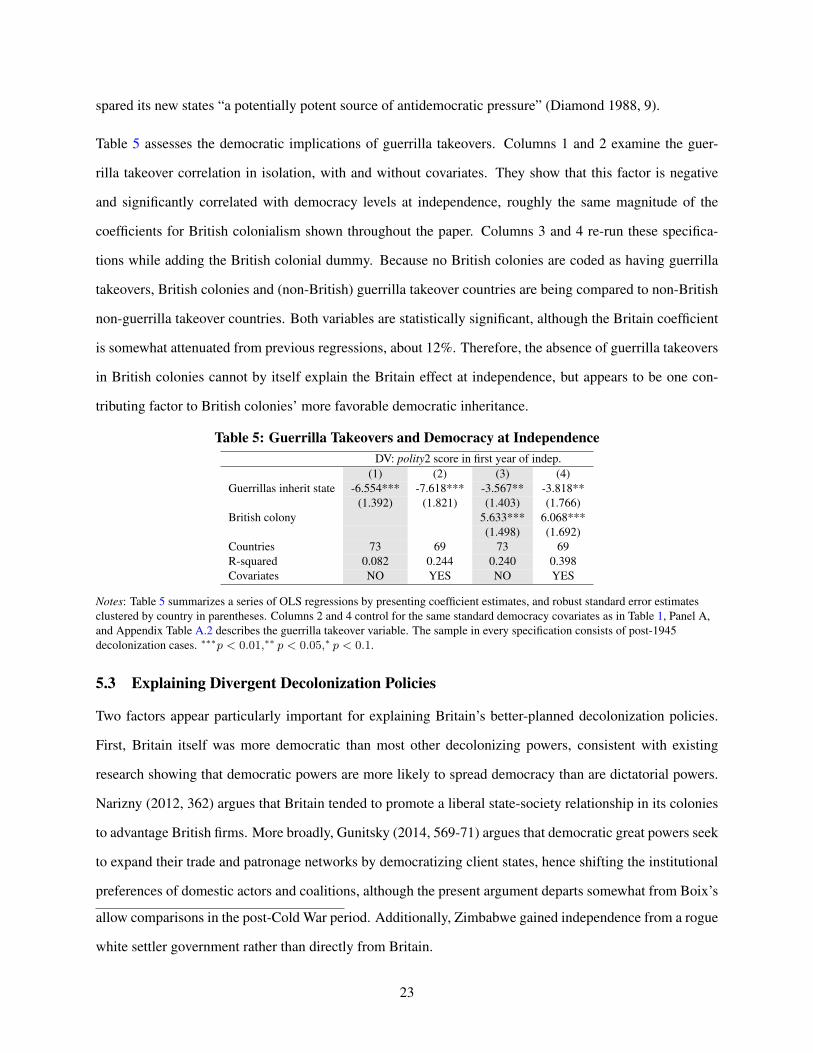
Table 5 assesses the democratic implications of guerrilla takeovers. Columns 1 and 2 examine the guer-
rilla takeover correlation in isolation, with and without covariates. They show that this factor is negative
and significantly correlated with democracy levels at independence, roughly the same magnitude of the
coefficients for British colonialism shown throughout the paper. Columns 3 and 4 re-run these specifica-
tions while adding the British colonial dummy. Because no British colonies are coded as having guerrilla
takeovers, British colonies and (non-British) guerrilla takeover countries are being compared to non-British
non-guerrilla takeover countries. Both variables are statistically significant, although the Britain coefficient
is somewhat attenuated from previous regressions, about 12%. Therefore, the absence of guerrilla takeovers
in British colonies cannot by itself explain the Britain effect at independence, but appears to be one con-
tributing factor to British colonies’ more favorable democratic inheritance.
Table 5: Guerrilla Takeovers and Democracy at IndependenceDV: polity2 score in first year of indep.
(1) (2) (3) (4)Guerrillas inherit state -6.554*** -7.618*** -3.567** -3.818**
(1.392) (1.821) (1.403) (1.766)British colony 5.633*** 6.068***
(1.498) (1.692)Countries 73 69 73 69R-squared 0.082 0.244 0.240 0.398Covariates NO YES NO YES
Notes: Table 5 summarizes a series of OLS regressions by presenting coefficient estimates, and robust standard error estimatesclustered by country in parentheses. Columns 2 and 4 control for the same standard democracy covariates as in Table 1, Panel A,and Appendix Table A.2 describes the guerrilla takeover variable. The sample in every specification consists of post-1945decolonization cases. ∗∗∗p < 0.01,∗∗ p < 0.05,∗ p < 0.1.
5.3 Explaining Divergent Decolonization Policies
Two factors appear particularly important for explaining Britain’s better-planned decolonization policies.
First, Britain itself was more democratic than most other decolonizing powers, consistent with existing
research showing that democratic powers are more likely to spread democracy than are dictatorial powers.
Narizny (2012, 362) argues that Britain tended to promote a liberal state-society relationship in its colonies
to advantage British firms. More broadly, Gunitsky (2014, 569-71) argues that democratic great powers seek
to expand their trade and patronage networks by democratizing client states, hence shifting the institutional
preferences of domestic actors and coalitions, although the present argument departs somewhat from Boix’s
allow comparisons in the post-Cold War period. Additionally, Zimbabwe gained independence from a rogue
white settler government rather than directly from Britain.
23

(2011, 815) claim that democratic powers only seek to export democracy to wealthier states where they
expect democracy to be stable. Whereas existing research focuses mainly on post-independence Western
influence, we suggest that a similar phenomenon occurred during post-World War II decolonization—part of
the Cold War period often thought to be a low tide for international democracy promotion. Across empires,
the United States, Belgium, and Netherlands were also stably democratic, whereas Portugal and Spain were
both authoritarian until the end of the decolonization era. France, although never fully authoritarian, went
through a less democratic period during the 1950s and 1960s when Charles de Gaulle revised the constitution
to personalize power after gaining office following a military revolt in Algeria.
Second, the political power of social groups that favored continued colonial rule—in particular, European
settlers and business interests—were weaker in Britain. French citizens in Algeria could vote in French
elections and their lobby often held the balance of power in unstable Fourth Republic governments. They
successfully frustrated any moves towards decolonization until the late 1950s (Marshall 1973). Investors
with interests in the colonies composed another pressure group that favored limiting devolution. France
protected firms in its colonies against international competition (Kahler 1984) and Belgium’s largest com-
pany, the Societe Generale de Belgique, controlled 60 percent of the Congo’s economy (Peemans 1975,
182). By contrast, although pro-colonial interests were present in Britain, the country possessed a less
powerful pro-colonial lobby than did other colonial powers (Spruyt 2005). For example, in Rhodesia, the
British government pressured European settlers to grant broader rights to Africans, and in 1968 overcame
pro-settler forces in the House of Lords to impose economic sanctions on the rogue settler regime (Coggins
2006).
Table 6 supports two empirical implications of colonizers’ divergent democratization commitments. Panel A
examines the metropole’s polity2 score in each country’s year of independence. Panel B uses the Manifesto
Project’s (Gabel and Huber 2000) measure of the degree to which metropolitan political parties’ manifestos
mentioned decolonization and anti-imperialism, a proxy for the power of colonial lobbies. Higher levels
of metropole democracy and heightened political party attention to decolonization are each significantly
correlated with ex-colonies’ polity2 scores at independence (Columns 1 and 2). These factors also somewhat
attenuate the British colonialism effect at independence, with the coefficient estimates ranging from 27 to
41 percent lower than in regressions that omit both intervening factors but use the same sample.
24
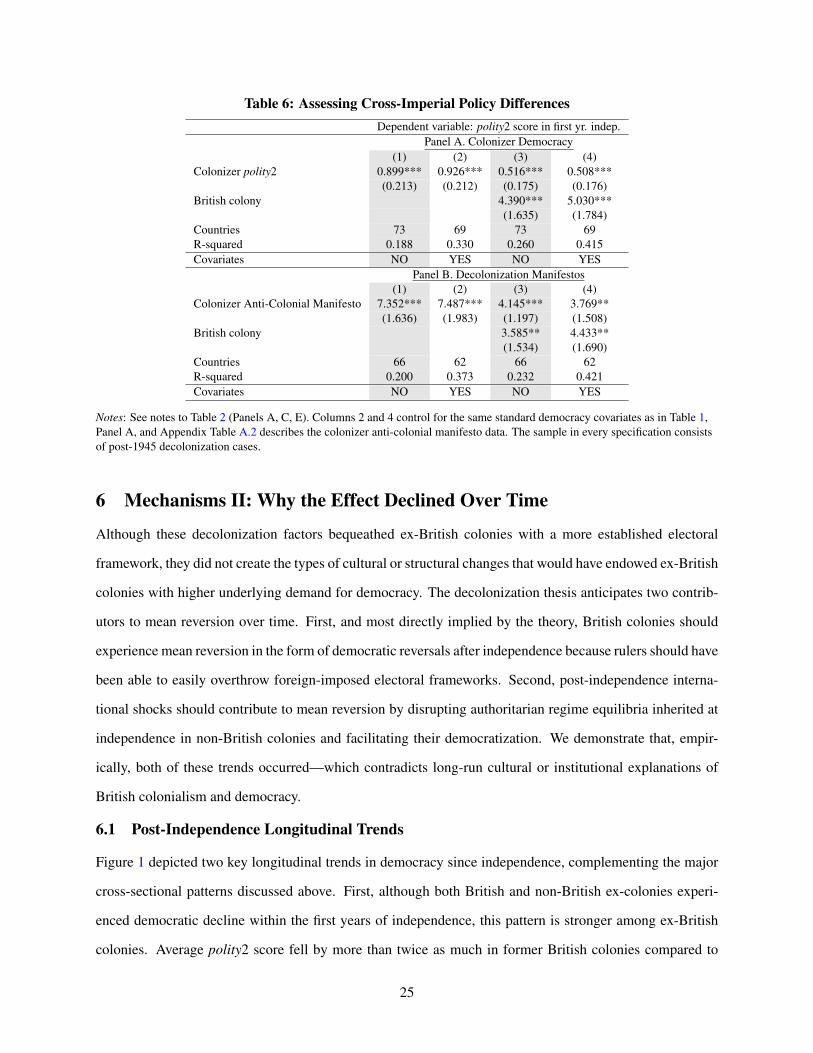
Table 6: Assessing Cross-Imperial Policy DifferencesDependent variable: polity2 score in first yr. indep.
Panel A. Colonizer Democracy(1) (2) (3) (4)
Colonizer polity2 0.899*** 0.926*** 0.516*** 0.508***(0.213) (0.212) (0.175) (0.176)
British colony 4.390*** 5.030***(1.635) (1.784)
Countries 73 69 73 69R-squared 0.188 0.330 0.260 0.415Covariates NO YES NO YES
Panel B. Decolonization Manifestos(1) (2) (3) (4)
Colonizer Anti-Colonial Manifesto 7.352*** 7.487*** 4.145*** 3.769**(1.636) (1.983) (1.197) (1.508)
British colony 3.585** 4.433**(1.534) (1.690)
Countries 66 62 66 62R-squared 0.200 0.373 0.232 0.421Covariates NO YES NO YES
Notes: See notes to Table 2 (Panels A, C, E). Columns 2 and 4 control for the same standard democracy covariates as in Table 1,Panel A, and Appendix Table A.2 describes the colonizer anti-colonial manifesto data. The sample in every specification consistsof post-1945 decolonization cases.
6 Mechanisms II: Why the Effect Declined Over Time
Although these decolonization factors bequeathed ex-British colonies with a more established electoral
framework, they did not create the types of cultural or structural changes that would have endowed ex-British
colonies with higher underlying demand for democracy. The decolonization thesis anticipates two contrib-
utors to mean reversion over time. First, and most directly implied by the theory, British colonies should
experience mean reversion in the form of democratic reversals after independence because rulers should have
been able to easily overthrow foreign-imposed electoral frameworks. Second, post-independence interna-
tional shocks should contribute to mean reversion by disrupting authoritarian regime equilibria inherited at
independence in non-British colonies and facilitating their democratization. We demonstrate that, empir-
ically, both of these trends occurred—which contradicts long-run cultural or institutional explanations of
British colonialism and democracy.
6.1 Post-Independence Longitudinal Trends
Figure 1 depicted two key longitudinal trends in democracy since independence, complementing the major
cross-sectional patterns discussed above. First, although both British and non-British ex-colonies experi-
enced democratic decline within the first years of independence, this pattern is stronger among ex-British
colonies. Average polity2 score fell by more than twice as much in former British colonies compared to
25
others in the six years after independence, 2.7 points compared to 1.3. After 15 years of independence, non-
British colonies had average polity2 scores only 0.1 less than at independence, whereas the average score in
British colonies had fallen by 3.8 points.
Second, ex-British colonies have not benefitted from international trends toward democratization in the
1980s and 1990s as strongly as have other countries. In the three decades following the initial wave of
democratic reversals, former British colonies have almost an identical level of democracy as they did a
decade after independence—compared to a 1.5 point increase among other countries. Because many coun-
tries in the sample gained independence in the early 1960s, the period of 30-to-35 years after independence
roughly corresponds to the peak of the “Third Wave” in the mid-1990s.
Tabular data in Appendix Table A.4 display a similar pattern. Over half of the British democracies at
independence have had average polity2 scores less than 6 since 1991. Furthermore, not a single ex-British
colony that was not democratic at independence has experienced an average polity2 scores of at least 6 since
1991—compared to 16 percent of non-British colonies.
Table 7 assesses these trends statistically by estimating a series of dynamic panel models. The basic model
estimated is:
polity2it = βi + θpolity2it−1 + ρInd.Y earsit + δBritishColonyi × Ind.Y earsit + βXit + εit, (2)
where polity2it is the polity2 score for country i in year t, polity2it−1 is the lagged dependent variable, δ
is the main parameter of interest, βi is a vector of country fixed effects, Ind.Years is the number of years
since independence, and Xit is a vector of time-varying covariates that differs across the specifications.
Controlling for country fixed effects enables estimating time trends without the confounding influence of
any time invariant heterogeneity among countries. Regarding additional technical details, these models do
not estimate the direct effect of BritishColony because it is perfectly collinear with the vector of country
fixed effects. Year fixed effects are not included because they would make the time trend coefficients un-
interpretable. Because dynamic panel models with unit fixed effects create the possibility of Nickell bias,
Appendix Table A.16 instead uses Arellano-Bond dynamic panel models that instrument for the lagged vari-
ables and demonstrates similar findings. Finally, every model uses Driscoll-Kraay standard errors.
26

Table 7: British Colonialism and Democracy: Time Series ResultsDependent variable: polity2 score
All years All years 1st 6 yrs. 1st 6 yrs. After 6 yrs. After 6 yrs.post-indep. post-indep. post-indep. post-indep.
(1) (2) (3) (4) (5) (6)Post Ind. Years 0.0242*** 0.0384*** -0.0741 -0.220*** 0.0248*** 0.0322***
(0.00402) (0.00594) (0.0526) (0.0696) (0.00462) (0.00714)Post Ind. Years*British Col. -0.0116** -0.00951** -0.255** -0.350** -0.0109** -0.00996**
(0.00474) (0.00464) (0.122) (0.146) (0.00479) (0.00463)Country-years 3,809 3,666 431 407 3,376 3,257Number of countries 73 70 73 69 73 70Country FE and LDV YES YES YES YES YES YESCovariates NO YES NO YES NO YES
Marginal effectsPost Ind. Years | Br. colony= 1 0.013*** 0.029*** -0.329*** -0.569*** 0.014*** 0.022***
(0.003) (0.003) (0.103) (0.156) (0.003) (0.007)Post Ind. Years | Br. colony= 0 0.024*** 0.038*** -0.073 -0.215*** 0.025*** 0.032***
(0.004) (0.006) (0.051) (0.069) (0.005) (0.007)
Notes: Table 7 summarizes a series of dynamic time series regressions (described in Equation 2) by presenting coefficientestimates for the main variables of theoretical interest, and Driscoll-Kraay standard error estimates in parentheses that model aone-year lag. The other coefficient estimates are suppressed for expositional clarity. The bottom panel presents marginal effectestimates calculated from the same model. Every specification includes country fixed effects and a lagged dependent variable. Theeven-numbered columns additionally control for the three time-varying standard democracy covariates in Table 1, Panel A. Thesample in every specification consists of post-1945 decolonization cases. ∗∗∗p < 0.01,∗∗ p < 0.05,∗ p < 0.1.
Table 7, Column 1 demonstrates a positive trend in year-to-year changes in democracy score over time8
but also that ex-British colonies have experienced less pronounced gains. Column 2 adds time-varying
standard democracy covariates used in Table 1 and produces similar results. The remaining specifications
demonstrate the temporal contingency of these findings. The marginal effects component of Columns 3 and
4 demonstrates that British colonies exhibited a statistically significant decline in democracy levels in the
first six years of independence. Although the trend for all countries was anti-democratic during this period,
it is larger in British colonies than in other countries. By contrast, the pattern after the first six years of
independence resembles the full-sample pattern. Former British colonies gained in democracy levels over
time, but not by as much as other ex-colonies.
6.2 Democratic Reversals Shortly After Independence
The decolonization thesis directly anticipates the democratic reversals shortly after independence demon-
strated in Table 7. Because the bulk of democratic reforms occurred just prior to independence (see Table
4 and Appendix Figure A.1)—and therefore tended not to engender deep structural changes in society—it8Note that including the lagged dependent variable in the time series regressions means that we are
modeling trends in democratic changes relative to preceding years, rather than trends in the variable itself,
as in Figure 1.
27
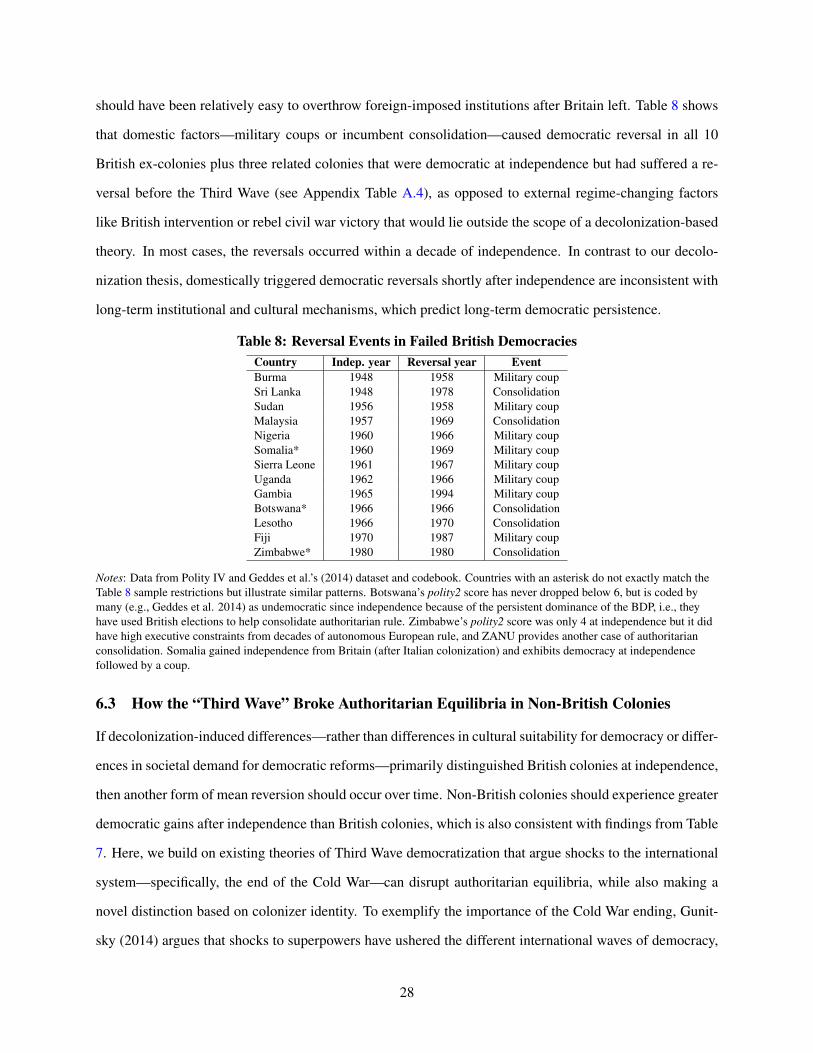
should have been relatively easy to overthrow foreign-imposed institutions after Britain left. Table 8 shows
that domestic factors—military coups or incumbent consolidation—caused democratic reversal in all 10
British ex-colonies plus three related colonies that were democratic at independence but had suffered a re-
versal before the Third Wave (see Appendix Table A.4), as opposed to external regime-changing factors
like British intervention or rebel civil war victory that would lie outside the scope of a decolonization-based
theory. In most cases, the reversals occurred within a decade of independence. In contrast to our decolo-
nization thesis, domestically triggered democratic reversals shortly after independence are inconsistent with
long-term institutional and cultural mechanisms, which predict long-term democratic persistence.
Table 8: Reversal Events in Failed British DemocraciesCountry Indep. year Reversal year EventBurma 1948 1958 Military coupSri Lanka 1948 1978 ConsolidationSudan 1956 1958 Military coupMalaysia 1957 1969 ConsolidationNigeria 1960 1966 Military coupSomalia* 1960 1969 Military coupSierra Leone 1961 1967 Military coupUganda 1962 1966 Military coupGambia 1965 1994 Military coupBotswana* 1966 1966 ConsolidationLesotho 1966 1970 ConsolidationFiji 1970 1987 Military coupZimbabwe* 1980 1980 Consolidation
Notes: Data from Polity IV and Geddes et al.’s (2014) dataset and codebook. Countries with an asterisk do not exactly match theTable 8 sample restrictions but illustrate similar patterns. Botswana’s polity2 score has never dropped below 6, but is coded bymany (e.g., Geddes et al. 2014) as undemocratic since independence because of the persistent dominance of the BDP, i.e., theyhave used British elections to help consolidate authoritarian rule. Zimbabwe’s polity2 score was only 4 at independence but it didhave high executive constraints from decades of autonomous European rule, and ZANU provides another case of authoritarianconsolidation. Somalia gained independence from Britain (after Italian colonization) and exhibits democracy at independencefollowed by a coup.
6.3 How the “Third Wave” Broke Authoritarian Equilibria in Non-British Colonies
If decolonization-induced differences—rather than differences in cultural suitability for democracy or differ-
ences in societal demand for democratic reforms—primarily distinguished British colonies at independence,
then another form of mean reversion should occur over time. Non-British colonies should experience greater
democratic gains after independence than British colonies, which is also consistent with findings from Table
7. Here, we build on existing theories of Third Wave democratization that argue shocks to the international
system—specifically, the end of the Cold War—can disrupt authoritarian equilibria, while also making a
novel distinction based on colonizer identity. To exemplify the importance of the Cold War ending, Gunit-
sky (2014) argues that shocks to superpowers have ushered the different international waves of democracy,
28

and characterizes 1989 to 1995 as the only hegemonic shock since 1947. Haggard and Kaufman (2016, 9)
show that the number of regime transitions in 1990 and 1991 far exceeded that in any other years between
1980 and 2008. This grounds why we distinguished the post-1991 period throughout the paper.
In five of the six non-British cases that had an average polity2 score of at least 6 after 1991 (Benin, Cape
Verde, Lebanon, Madagascar, Mali, Philippines; see Appendix Table A.4), five transitioned to democracy
in or after 1991 and the other (Philippines) occurred in 1987. Thus, democratization in non-British colonies
has been primarily triggered by international forces decades after independence that provided the first major
shock to destabilize colonial-inherited regimes. Angola and Mozambique provide additional relevant exam-
ples for the theory because of their guerrilla origins, although each has fallen short of full democracy. Rebels
seized control of the government in both countries at independence in 1975 after long decolonization wars
with Portugal. These countries fit the general pattern in Table 5 that guerrilla regimes were undemocratic
at independence. However, intense Cold War rivalries in these countries reached a detente in the late 1980s
(Reno 2011, 76), which fostered a lasting liberalization of Mozambique’s formerly one-party regime in the
1990s (Manning 2005) and (briefly) free and fair parliamentary elections in Angola in 1992 (Fituni 1995,
152). The effect of the end of the Cold War on liberalizing decolonization-induced dictatorships is therefore
consistent with the diminishing British colonial legacy over time.
Arguing that international shocks can break colonially rooted authoritarian equilibria fits the data better than
existing explanations. Long-term cultural and institutional theories of British colonialism seem to anticipate
the opposite pattern. These theories posit that ex-British colonies should have superior cultural preconditions
for democracy. Therefore, even British colonies that experienced democratic reversions after independence
should still have more favorable preconditions for democratization and should therefore be advantaged—
certainly not systematically disadvantaged—during pro-democratic international periods. Separately, many
have argued that France has been more supportive of authoritarian rulers in its ex-colonies than have other
Western powers after the Cold War (Levitsky and Way 2010), yet four of the six “late democratizers” among
non-British colonies in our data were French (Benin, Lebanon, Madagascar, Mali).
6.4 Empirically Assessing Decolonization Mechanisms After the Cold War
A final implication of this focus on democratic reversals after independence and post-Soviet breakup shocks
to the international system is that the decolonization mechanisms assessed in Tables 5 and 6 should correlate
weakly with post-1991 democracy levels. Table A.17 supports this implication. In contrast to existing
29

arguments that revolutionary takeovers tend to engender highly durable authoritarian regimes, the coefficient
estimate for guerrilla takeover at independence is small in magnitude and null in the post-1991 period (Panel
A). Metropole democracy score exhibits a similar pattern (Panel B). The coefficient estimate for colonizer
manifesto diminishes by 58 percent in Column 1 between the independence and post-1991 samples (Panel
C). Although the estimate remains statistically significant, a handful of colonies in the small empires (U.S.,
Dutch, Belgian) drive the result (results available upon request).
7 Conclusion
Many scholars have argued that British colonial rule promoted post-independence democracy, but there has
been considerable debate over the robustness of this result and its causes. Contradicting existing theories, we
show that this relationship follows a strong temporal pattern. Although former British colonies were consid-
erably more democratic than other countries immediately following independence, subsequent convergence
in democracy levels has eliminated these differences in the post-Cold War period. Neither pre-colonial traits,
geographical and policy variation among British colonies, post-colonial influences, nor existing theories of
colonial influence account for this finding. We argue that divergent policy approaches to decolonization by
European powers contributed to this pattern. Britain more consistently treated democratic elections as a
prerequisite for gaining independence, leading to higher initial levels of democracy. However, these policies
did not reflect differences in social or institutional support for democracy, leading to mean reversion and
convergence over time.
These main contributions produce three additional, broader implications. First, they force a rethinking of
which colonial legacies are most important for democracy and why. The effects of British colonial rule can-
not be reduced to the types of people that populated British colonies—such as European settlers (Acemoglu
et al. 2001; Hariri 2012) or Protestant missionaries (Woodberry 2012; Lankina and Getachew 2012)—
contrary to arguments in these publications. Furthermore, after assessing correlations for other posited
colonial-era legacies in various samples and time periods in Table 2, we raised important questions about
theoretical underpinnings and statistical robustness of these factors. These considerations advance debates
on colonialism and democracy and should help to spark additional research. But the results also mod-
ify triumphalist narratives of British superiority common in popular accounts of comparative development
(e.g., Ferguson 2012) as well as more nuanced arguments focused on long-term structural changes induced
by British colonialism. This should influence additional discussion of how and why British colonialism
30
mattered.
Second, the current paper’s focus on different samples and time periods provides a set of best practices
for other studies of colonial legacies, whether studying democracy or other outcomes such as economic
development (Engerman and Sokoloff 2011; Acemoglu et al. 2001). Most theories about colonial factors
implicitly or explicitly posit long-term effects, and often authors only study time periods well after indepen-
dence. But assessing short-term effects is also crucial for assessing theories, at least absent a mechanism
positing only increasing returns over time. Additionally, because Western Europe decolonized in two main
periods that were highly correlated with global location—most Old World colonies in the 19th century and
most New World colonies after World War II—results that rely entirely on comparing countries in one period
to the other raise questions regarding the plausibility of the counterfactual comparisons. Studying different
samples of colonies can yield crucial insights.
Third, the findings carry implications for understanding the efficacy of international democracy promotion.
Even studies that have examined Western democracy promotion outside the Cold War era, such as Boix
(2011), Narizny (2012), and Gunitsky (2014), have mainly focused on over-time variation in the interna-
tional climate rather than within-era comparisons of countries. The results here show that nearly all of the
variation among post-colonial nations during the “second wave” of democracy can be explained by British
colonialism—because essentially all non-British colonies were non-democratic at independence (see Ap-
pendix Table A.4). However, despite the more concerted effort by Britain to promote democracy within its
empire, these cases also highlight the frequent shortcomings of international democracy promotions. Al-
though outsiders can create democratic institutions in otherwise unpromising contexts, the effects of these
interventions may only be short-term unless they are accompanied by deeper structural changes that in effect
increase societal demand for democracy.
Our findings of a substantial but non-durable effect of colonialism echoes findings concerning the mixed for-
tunes of post-colonial Western attempts at nation-building in occupied countries (Fearon and Laitin 2004;
Krasner 2004). For example, political leaders in Iraq thwarted U.S.-implanted electoral institutions shortly
after the United States began major disengagement (Dodge 2012)—similar to many ex-British colonies.
Similarly, post-Cold War Western engagement has been successful at promoting greater electoral competi-
tion that frequently falls short of full-blown democracy (Levitsky and Way 2010). Contemporary democracy
promotion faces similar challenges as did extrication from British imperial rule over fifty years ago.
31

8 ReferencesAbernethy, David B. 2000. The Dynamics of Global Dominance: European Overseas Empires, 1415-1980.New Haven, CT: Yale University Press.
Acemoglu, Daron, Simon Johnson, and James A. Robinson. 2001. The Colonial Origins of ComparativeDevelopment: An Empirical Investigation. American Economic Review 91: 5: 1369–1401.
Acemoglu, Daron, Simon Johnson, and James A. Robinson. 2002. Reversal of Fortune: Geography andInstitutions in the Making of the Modern World Income Distribution. Quarterly Journal of Economics 117:4: 1231–1294.
Barro, Robert J. 1999. Determinants of Democracy. Journal of Political Economy 107: 6: S158-S183.
Bernhard, Michael, Christopher Reenock, and Timothy Nordstrom. 2004. The Legacy of Western OverseasColonialism on Democratic Survival. International Studies Quarterly 48: 225-50.
Bilinski, Adam. 2015. Paths to Success, Paths to Failure: Historical Trajectories to Democratic Stability.Ph.D dissertation, Department of Political Science, University of Florida.
Boix, Carles. 2011. Democracy, Development, and the International System. American Political ScienceReview 105: 4: 809–828.
Cheibub, Jose Antonio, Jennifer Gandhi, and James Raymond Vreeland. 2010. Democracy and DictatorshipRevisited. Public Choice 143: 2-1: 67–101.
Coggins, Richard. 2006. Wilson and Rhodesia: UDI and British Policy Towards Africa. ContemporaryBritish History 20: 3: 363–381.
Coppedge, Michael, Staffan Lindberg, Svend-Erik Skaaning and Jan Teorell. 2016. “Measuring High LevelDemocratic Principles Using the V-Dem Data.” International Political Science Review 37(5):580593.
Diamond, Larry. 1988. Introduction. In Democracy in Developing Countries, Vol. 2: Africa, Eds. LarryDiamond, Juan J. Linz, and Seymour Martin Lipset, pp. 1–32. Boulder, CO: Lynne Rienner.
Dodge, Toby. 2012. “Iraq’s Road Back to Dictatorship.” Survival, 54(3): 147-168.
Emerson, Rupert. 1960. From Empire to Nation: The Rise to Self-Assertion of Asian and African Peoples.Cambridge, MA: Harvard University Press.
Engerman, Stanley L. and Kenneth L. Sokoloff. 2011. Economic Development in the Americas since 1500:Endowments and Institutions. New York, NY: Cambridge University Press.
Fearon, James D., and David D. Laitin. 2004. Neotrusteeship and the Problem of Weak States. InternationalSecurity, 28: 4: 5–43.
Ferguson, Niall. 2012. Empire: How Britain made the modern world. London, UK: Penguin Press.
Fieldhouse, D.K. 1986. Black Africa 1945-1980: Economic Decolonization and Arrested Development.Crows Nest, Australia: Unwin Hyman.
Fituni, Leonid L. 1995. The Collapse of the Socialist State: Angola and the Soviet Union. In CollapsedStates: The Disintegration and Restoration of Legitimate Authority, Ed. I. William Zartman, pp. 143-156.Boulder, CO: Lynne Rienner.
Gabel, Matthew J., and John D. Huber. 2000. Putting Parties in their Place: Inferring Party Left-Right Ideo-logical Positions from Party Manifestos Data. American Journal of Political Science 44: 1: 94–103.
32
Geddes, Barbara, Joseph Wright, and Erica Frantz. 2014. “Autocratic Breakdown and Regime Transitions:A New Data Set.” Perspectives on Politics 12(2): 313-331.
Glaeser, Edward L., Rafael la Porta, Florencio Lopez-de-Silanes, and Andrei Shleifer. 2004. Do InstitutionsCause Growth? Journal of Economic Growth 9: 3: 271–303.
Grier, Ruth. 1999. Colonial Legacies and Economic Growth. Public Choice 98: 317–355.
Gunitsky, Seva. 2014. “From Shocks to Waves: Hegemonic Transitions and Democratization in the Twen-tieth Century.” International Organization, 68(3): 561–597.
Hadenius, Axel. 1992. Democracy and Development. New York, NY: Cambridge University Press.
Haggard, Stephan and Robert R. Kaufman. 2016. Dictators and Democrats: Masses, Elites, and RegimeChange. Princeton: Princeton University Press.
Hariri, Jacob Gerner. 2012. The Autocratic Legacy of Early Statehood. American Political Science Review106: 3: 471–494.
Huntington, Samuel P. 1984. Will More Countries Become Democratic? Political Science Quarterly 99: 2:193–218.
Kahler, Miles. 1984. Decolonization in Britain and France: The Domestic Consequences of InternationalRelations. Princeton, NJ: Princeton University Press.
Kohli, Atul. 2004. State-Directed Development: Political Power and Industrialization in the Global Periph-ery. New York: Cambridge University Press.
Krasner, Stephen D. 2004. “Sharing Sovereignty: New Institutions for Collapsed and Failing States.” Inter-national Security, 29(2): 85-120.
La Porta, Rafael, Florencio Lopez-de-Silanes, Andrei Shleifer, and Robert W. Vishny. 1998. Law andFinance. Journal of Political Economy 106: 1113–1155.
Lange, Matthew. 2004. British Colonial Legacies and Political Development. World Development 32:905–922.
Lange, Matthew. 2009. Lineages of Despotism and Development: British Colonialism and State Power.Chicago, Il: University of Chicago Press.
Lankina, Tomila and Lullit Getachew. 2012. Mission or Empire, Word or Sword? The Human Capi-tal Legacy in Post-Colonial Democratic Development. American Journal of Political Science 56: 465-83.
Lee, Alexander and Kenneth Schultz. 2012. Comparing British and French Colonial Legacies: A Disconti-nuity Analysis of Cameroon. Quarterly Journal of Political Science 7: 1–46.
Levitsky, Steven and Lucan A. Way. 2010. Competitive Authoritarianism: Hybrid Regimes After the ColdWar. New York, NY: Cambridge University Press.
Lindberg, Staffan I. and Benjamin Smith, Eds. 2014. Colonial Legacies and Democracy. American PoliticalScience Association Comparative Democratization Newsletter. March.
Lipset, Seymour Martin, Kyoung-Ryung Seong, and John Charles Torres. 1993. A Comparative Analysisof the Social Requisites of Democracy. International Social Science Journal 45: 155-75.
33

Mahoney, James. 2010. Colonialism and Postcolonial Development: Spanish America in ComparativePerspective. New York, NY: Cambridge University Press.
Mamdani, Mahmood. 1996. Citizen and Subject: Contemporary Africa and the Legacy of Late Colonialism.Princeton, NJ: Princeton University Press.
Manning, Carrie. 2005. “Assessing Adaptation to Democratic Politics in Mozambique.” In The Fate ofAfrica’s Democratic Experiments: Elites and Institutions, Eds. Leonardo A. Villalon and Peter VonDoepp.Bloomington, IN: Indiana University Press, pp. 221-245.
Marshall, D. Bruce. 1973. The French Colonial Myth and Constitution-Making in the Fourth Republic. NewHaven, CT: Yale University Press.
Marshall, Monty G. and Ted Robert Gurr. 2014. Polity IV Project: Political Regime Characteristics andTransitions, 1800-2013. Available at http://www.systemicpeace.org/polity/polity4.htm. Accessed 4/10/16.
Narizny, Kevin. 2012. Anglo-American Primacy and the Global Spread of Democracy: An InternationalGenealogy. World Politics 64: 2: 341–373.
Olsson, Ola. 2009. “On the Democratic Legacy of Colonialism.” Journal of Comparative Economics 37:534–551.
Owolabi, Olukunle P. 2015. “Literacy and Democracy Despite Slavery: Forced Settlement and PostcolonialOutcomes in the Developing World.” Comparative Politics 48: 1: 43–78.
Peemans, Jean-Philippe. 1975. “Capital Accumulation in the Congo Under Colonialism: The Role of theState.” In Duignan, Peter, and Lewis H. Gann, Eds., Colonialism in Africa 1870-1960. Vol. 4. New York,NY: Cambridge University Press, pp. 165-212.
Przeworski, Adam, Michael Alvarez, Jose Antonio Cheibub, and Fernando Limongi. 2000. Democracy andDevelopment: Political Institutions and Well-Being in the World, 1950-1990. New York, NY: CambridgeUniversity Press.
Reno, William. 2011. Warfare in Independent Africa. New York: Cambridge University Press.
Sklar, Richard L. and C.S. Whitaker, Jr. 1966. The Federal Republic of Nigeria. In National Unity andRegionalism in Eight African States, Ed. Gwendolen M. Carter. Ithaca, NY: Cornell University Press, pp.7–150.
Smith, Tony. 1978. A Comparative Study of French and British Decolonization. Comparative Studies inSociety and History, 20: 1: 70–102.
Spruyt, Hendrik. 2005. Ending Empire: Contested Sovereignty and Territorial Partition. Ithaca, NY:Cornell University Press.
Treisman, Daniel. 2000. The Causes of Corruption: A Cross-National Study. Journal of Public Economics76: 399–457.
Wahman, Michael, Jan Teorell, and Axel Hadenius. 2013. Authoritarian Regime Types Revisited: UpdatedData in Comparative Perspective. Contemporary Politics 19: 1: 19–34.
Wantchekon, Leonard, and Omar Garcia-Ponce. 2015. “Critical junctures: independence movementsand democracy in Africa.” Princeton, NJ: Working paper, Department of Political Science. Available athttp://omargarciaponce.com/wp-content/uploads/2013/07/critical junctures.pdf. Accessed 6/7/16.
34

Weiner, Myron. 1987. Empirical Democratic Theory. In Myron Weiner and Ergun Ozbundun, Eds., Com-petitive Elections in Developing Countries.
Woodberry, Robert D. 2012. The Missionary Roots of Liberal Democracy. American Political ScienceReview 106: 2: 244–274.
Young, Crawford. 1970. “Decolonization in Africa.” In Colonialism in Africa 1870-1960, Volume 2, Eds.Peter Duignan and L.H. Gann. New York, NY: Cambridge University Press, pp. 450–502.
35
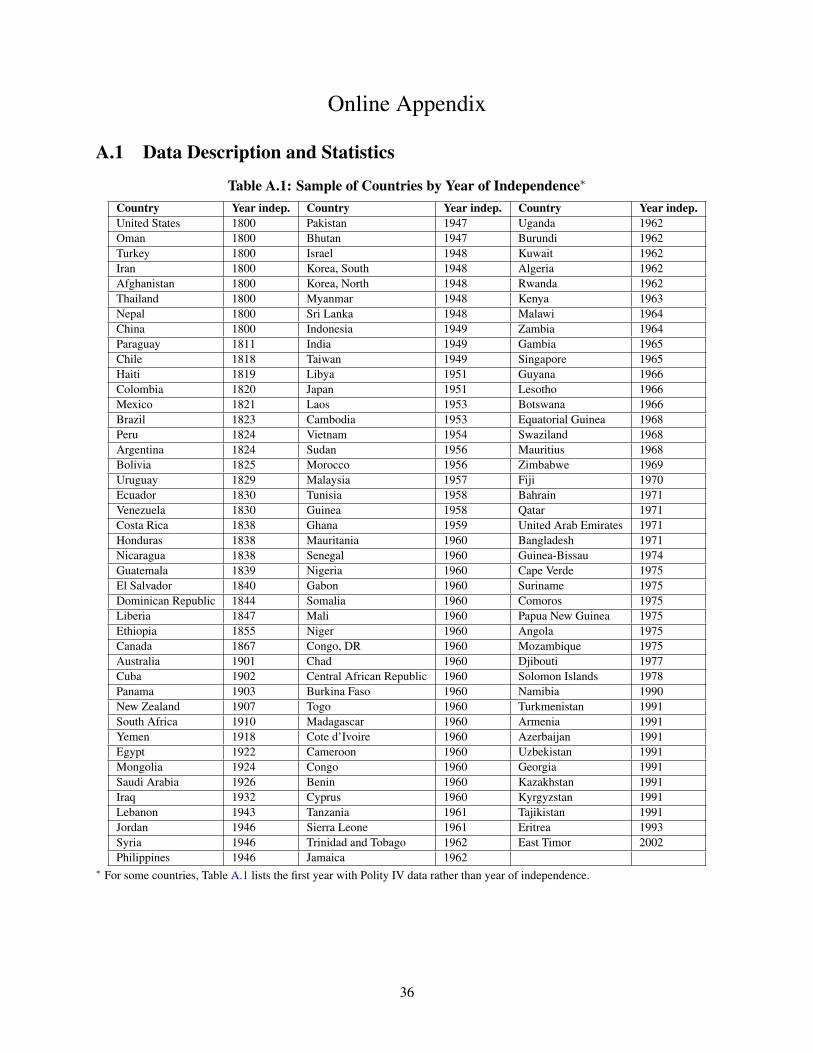
Online Appendix
A.1 Data Description and Statistics
Table A.1: Sample of Countries by Year of Independence∗
Country Year indep. Country Year indep. Country Year indep.United States 1800 Pakistan 1947 Uganda 1962Oman 1800 Bhutan 1947 Burundi 1962Turkey 1800 Israel 1948 Kuwait 1962Iran 1800 Korea, South 1948 Algeria 1962Afghanistan 1800 Korea, North 1948 Rwanda 1962Thailand 1800 Myanmar 1948 Kenya 1963Nepal 1800 Sri Lanka 1948 Malawi 1964China 1800 Indonesia 1949 Zambia 1964Paraguay 1811 India 1949 Gambia 1965Chile 1818 Taiwan 1949 Singapore 1965Haiti 1819 Libya 1951 Guyana 1966Colombia 1820 Japan 1951 Lesotho 1966Mexico 1821 Laos 1953 Botswana 1966Brazil 1823 Cambodia 1953 Equatorial Guinea 1968Peru 1824 Vietnam 1954 Swaziland 1968Argentina 1824 Sudan 1956 Mauritius 1968Bolivia 1825 Morocco 1956 Zimbabwe 1969Uruguay 1829 Malaysia 1957 Fiji 1970Ecuador 1830 Tunisia 1958 Bahrain 1971Venezuela 1830 Guinea 1958 Qatar 1971Costa Rica 1838 Ghana 1959 United Arab Emirates 1971Honduras 1838 Mauritania 1960 Bangladesh 1971Nicaragua 1838 Senegal 1960 Guinea-Bissau 1974Guatemala 1839 Nigeria 1960 Cape Verde 1975El Salvador 1840 Gabon 1960 Suriname 1975Dominican Republic 1844 Somalia 1960 Comoros 1975Liberia 1847 Mali 1960 Papua New Guinea 1975Ethiopia 1855 Niger 1960 Angola 1975Canada 1867 Congo, DR 1960 Mozambique 1975Australia 1901 Chad 1960 Djibouti 1977Cuba 1902 Central African Republic 1960 Solomon Islands 1978Panama 1903 Burkina Faso 1960 Namibia 1990New Zealand 1907 Togo 1960 Turkmenistan 1991South Africa 1910 Madagascar 1960 Armenia 1991Yemen 1918 Cote d’Ivoire 1960 Azerbaijan 1991Egypt 1922 Cameroon 1960 Uzbekistan 1991Mongolia 1924 Congo 1960 Georgia 1991Saudi Arabia 1926 Benin 1960 Kazakhstan 1991Iraq 1932 Cyprus 1960 Kyrgyzstan 1991Lebanon 1943 Tanzania 1961 Tajikistan 1991Jordan 1946 Sierra Leone 1961 Eritrea 1993Syria 1946 Trinidad and Tobago 1962 East Timor 2002Philippines 1946 Jamaica 1962
∗ For some countries, Table A.1 lists the first year with Polity IV data rather than year of independence.
36

37
Table A.2: Data Sources Not Described in Paper
Variable Notes and description SourceStandard democracy covariates
Ethnic fractionalization Computed as 1-Herfindahl index of ethnic group shares. Alesina (2003)Muslim percentage ofpopulation
Measured in 1980. La Porta et al. (1999)
GDP per capita Logged annual GDP per capita. We use Penn World Table(Feenstra et al. 2013) data and impute estimates from linearregressions using Maddison (2008) in years of missing PennWorld Table data. Missing values pre-1950 and post-2011 areimputed from the country’s score in 1950 and 2011, respec-tively.
Feenstra et al. (2013),Maddison (2008)
Population Logged annual population. We use Penn World Table (Feenstraet al. 2013) data and impute estimates from linear regressionsusing Maddison (2008) in years of missing Penn World Tabledata. Missing values pre-1950 and post-2011 are imputed fromthe country’s score in 1950 and 2011, respectively.
Feenstra et al. (2013),Maddison (2008)
Oil and gas production Logged annual oil and gas production per capita Ross (2013)Alternative historical explanations
European settlers To capture Acemoglu et al.’s (2001) and Hariri’s (2012) hy-potheses about European settlers, we use the log of Europeanpopulation share at the date closest to independence with avail-able data.
Easterly and Levine(2016)
State antiquity A territory’s combined years with government above local level.Following Hariri (2012), state antiquity is calculated in 1500.
Putterman (2008)
Protestant missionaries Number of Protestant missionaries per 10,000 people in 1923. Woodberry (2012)Geographic variables Indicator for landlocked countries, indicator for islands, dis-
tance to a coast, latitude.Woodberry (2012)
Rainfall Average precipitation is the long-term average in depth (overspace and time) of annual precipitation in the country, measuredin millimeters per year.
World Bank (2016)
Secondary education Percentage of the population with some secondary education(averaged between 1960 and 1985).
Woodberry (2012)
Literacy Following Owolabi (2015), we code adult literacy rates fromUnited Nations (1980) for the year closest to 1960 with avail-able data.
United Nations (1980)
OtherLength of British colo-nial rule
Calculated by taking the difference between Hensel’s (2014) in-dependence year and Ertan, Fiszbein, and Putterman’s (2016)colonial onset year.
Hensel (2014); Ertan,Fiszbein, and Putter-man (2016)
Guerrillas inherit state Fearon and Laitin’s (2003) dataset provided a candidate list ofconflicts. We consulted secondary sources to assess whether thegroup involved in violence gained control of the state at inde-pendence. Those cases are coded as 1, all others are 0.
Fearon and Laitin(2003), secondarysources
Colonizer anti-colonialmanifesto
We averaged party-election-level data across all party-electionsbetween 1945 and 1960, excluding political parties that neverheld office during this period. These scores reflect the powerof colonial lobbies, with party commitment to decolonizationmuch higher in Britain and Holland than in Belgium or France.This variable is not coded for Portuguese or Spanish colonies,where political parties were illegal, or for Italian colonies thatwere ruled as trustee states after World War II.
Gabel and Huber(2000)
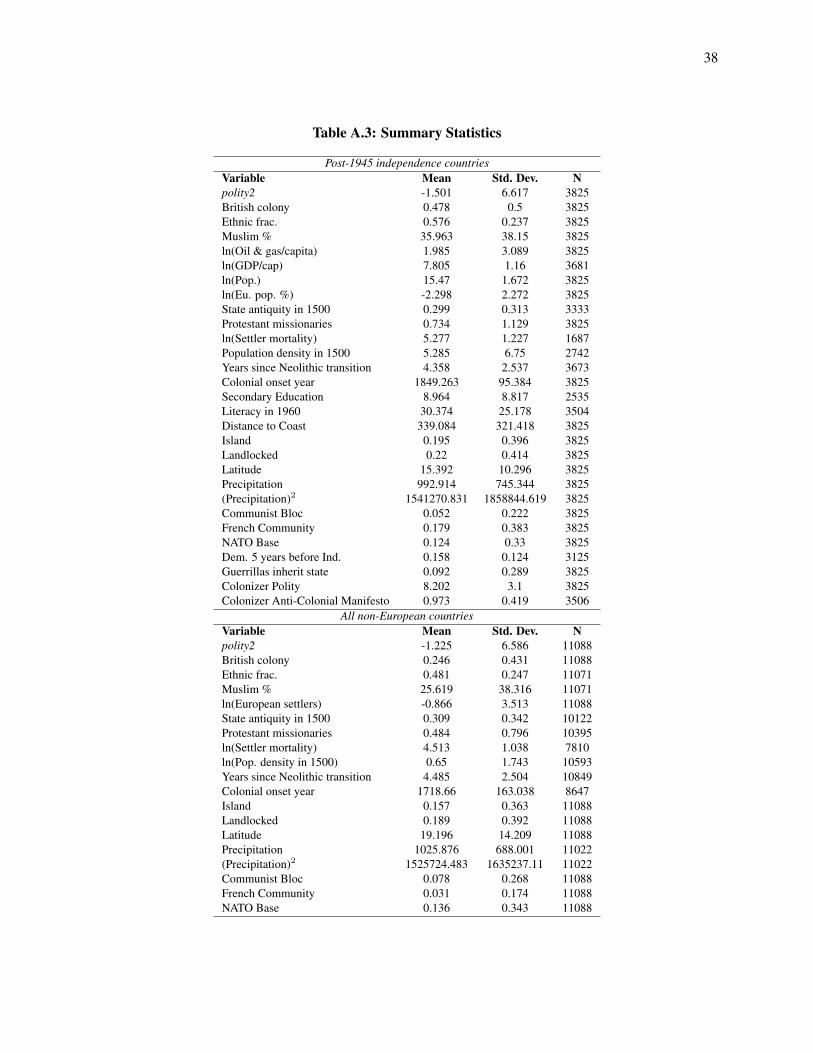
38
Table A.3: Summary Statistics
Post-1945 independence countriesVariable Mean Std. Dev. Npolity2 -1.501 6.617 3825British colony 0.478 0.5 3825Ethnic frac. 0.576 0.237 3825Muslim % 35.963 38.15 3825ln(Oil & gas/capita) 1.985 3.089 3825ln(GDP/cap) 7.805 1.16 3681ln(Pop.) 15.47 1.672 3825ln(Eu. pop. %) -2.298 2.272 3825State antiquity in 1500 0.299 0.313 3333Protestant missionaries 0.734 1.129 3825ln(Settler mortality) 5.277 1.227 1687Population density in 1500 5.285 6.75 2742Years since Neolithic transition 4.358 2.537 3673Colonial onset year 1849.263 95.384 3825Secondary Education 8.964 8.817 2535Literacy in 1960 30.374 25.178 3504Distance to Coast 339.084 321.418 3825Island 0.195 0.396 3825Landlocked 0.22 0.414 3825Latitude 15.392 10.296 3825Precipitation 992.914 745.344 3825(Precipitation)2 1541270.831 1858844.619 3825Communist Bloc 0.052 0.222 3825French Community 0.179 0.383 3825NATO Base 0.124 0.33 3825Dem. 5 years before Ind. 0.158 0.124 3125Guerrillas inherit state 0.092 0.289 3825Colonizer Polity 8.202 3.1 3825Colonizer Anti-Colonial Manifesto 0.973 0.419 3506
All non-European countriesVariable Mean Std. Dev. Npolity2 -1.225 6.586 11088British colony 0.246 0.431 11088Ethnic frac. 0.481 0.247 11071Muslim % 25.619 38.316 11071ln(European settlers) -0.866 3.513 11088State antiquity in 1500 0.309 0.342 10122Protestant missionaries 0.484 0.796 10395ln(Settler mortality) 4.513 1.038 7810ln(Pop. density in 1500) 0.65 1.743 10593Years since Neolithic transition 4.485 2.504 10849Colonial onset year 1718.66 163.038 8647Island 0.157 0.363 11088Landlocked 0.189 0.392 11088Latitude 19.196 14.209 11088Precipitation 1025.876 688.001 11022(Precipitation)2 1525724.483 1635237.11 11022Communist Bloc 0.078 0.268 11088French Community 0.031 0.174 11088NATO Base 0.136 0.343 11088
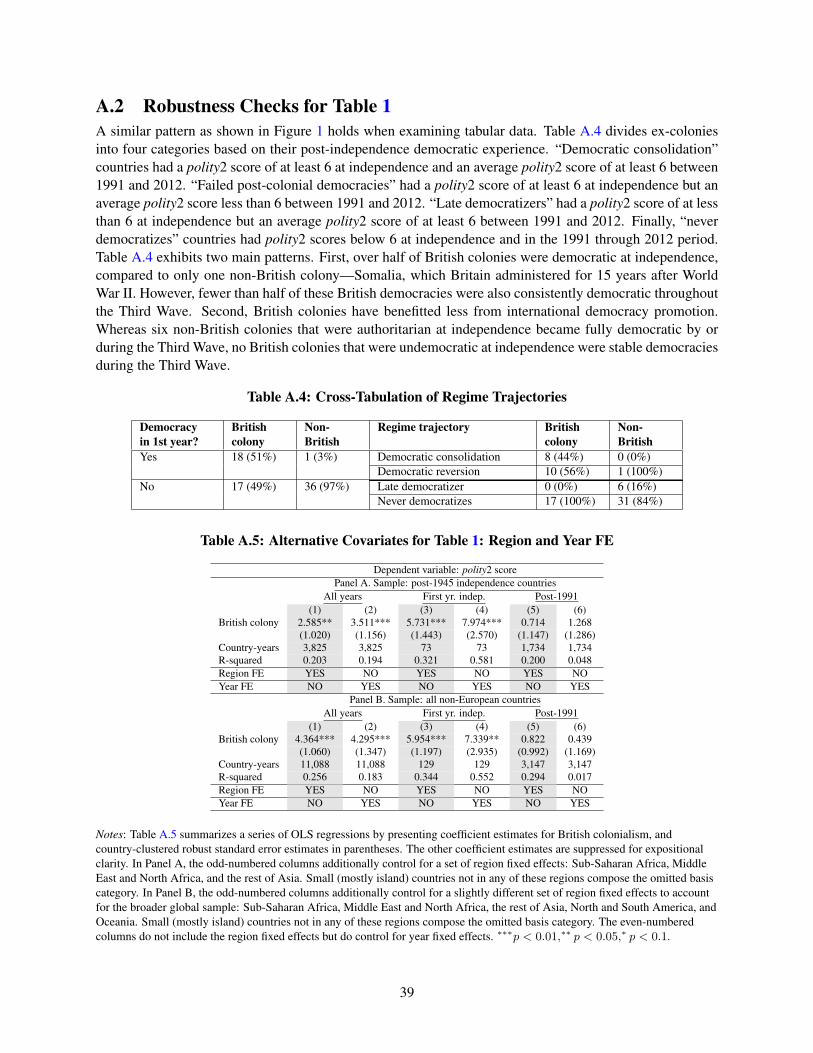
A.2 Robustness Checks for Table 1A similar pattern as shown in Figure 1 holds when examining tabular data. Table A.4 divides ex-coloniesinto four categories based on their post-independence democratic experience. “Democratic consolidation”countries had a polity2 score of at least 6 at independence and an average polity2 score of at least 6 between1991 and 2012. “Failed post-colonial democracies” had a polity2 score of at least 6 at independence but anaverage polity2 score less than 6 between 1991 and 2012. “Late democratizers” had a polity2 score of at lessthan 6 at independence but an average polity2 score of at least 6 between 1991 and 2012. Finally, “neverdemocratizes” countries had polity2 scores below 6 at independence and in the 1991 through 2012 period.Table A.4 exhibits two main patterns. First, over half of British colonies were democratic at independence,compared to only one non-British colony—Somalia, which Britain administered for 15 years after WorldWar II. However, fewer than half of these British democracies were also consistently democratic throughoutthe Third Wave. Second, British colonies have benefitted less from international democracy promotion.Whereas six non-British colonies that were authoritarian at independence became fully democratic by orduring the Third Wave, no British colonies that were undemocratic at independence were stable democraciesduring the Third Wave.
Table A.4: Cross-Tabulation of Regime Trajectories
Democracyin 1st year?
Britishcolony
Non-British
Regime trajectory Britishcolony
Non-British
Yes 18 (51%) 1 (3%) Democratic consolidation 8 (44%) 0 (0%)Democratic reversion 10 (56%) 1 (100%)
No 17 (49%) 36 (97%) Late democratizer 0 (0%) 6 (16%)Never democratizes 17 (100%) 31 (84%)
Table A.5: Alternative Covariates for Table 1: Region and Year FE
Dependent variable: polity2 scorePanel A. Sample: post-1945 independence countries
All years First yr. indep. Post-1991(1) (2) (3) (4) (5) (6)
British colony 2.585** 3.511*** 5.731*** 7.974*** 0.714 1.268(1.020) (1.156) (1.443) (2.570) (1.147) (1.286)
Country-years 3,825 3,825 73 73 1,734 1,734R-squared 0.203 0.194 0.321 0.581 0.200 0.048Region FE YES NO YES NO YES NOYear FE NO YES NO YES NO YES
Panel B. Sample: all non-European countriesAll years First yr. indep. Post-1991
(1) (2) (3) (4) (5) (6)British colony 4.364*** 4.295*** 5.954*** 7.339** 0.822 0.439
(1.060) (1.347) (1.197) (2.935) (0.992) (1.169)Country-years 11,088 11,088 129 129 3,147 3,147R-squared 0.256 0.183 0.344 0.552 0.294 0.017Region FE YES NO YES NO YES NOYear FE NO YES NO YES NO YES
Notes: Table A.5 summarizes a series of OLS regressions by presenting coefficient estimates for British colonialism, andcountry-clustered robust standard error estimates in parentheses. The other coefficient estimates are suppressed for expositionalclarity. In Panel A, the odd-numbered columns additionally control for a set of region fixed effects: Sub-Saharan Africa, MiddleEast and North Africa, and the rest of Asia. Small (mostly island) countries not in any of these regions compose the omitted basiscategory. In Panel B, the odd-numbered columns additionally control for a slightly different set of region fixed effects to accountfor the broader global sample: Sub-Saharan Africa, Middle East and North Africa, the rest of Asia, North and South America, andOceania. Small (mostly island) countries not in any of these regions compose the omitted basis category. The even-numberedcolumns do not include the region fixed effects but do control for year fixed effects. ∗∗∗p < 0.01,∗∗ p < 0.05,∗ p < 0.1.
39

Table A.6 alters the measurement of the dependent variable, democracy. Because of the limited timesamples of Cheibub et al.’s (2013) and V-Dem’s democracy measures relative to Polity IV, we only presentresults for the post-1945 decolonization sample (democracy at independence is unavailable for most earlycolonizers in V-Dem and Cheibub et al.). One consideration for interpreting Table A.6 is that Cheibub etal.’s (2013) binary democracy measure biases against finding a positive Britain effect immediately afterindependence. To be coded as a democracy, they require a country to have at least one democratic turnoverin government. Therefore, countries such as Uganda and Sudan that had free and fair elections atindependence—and, correspondingly, a high polity2 score—are not coded as democracies at independenceby Cheibub et al. because in each country the military overthrew the first post-independence regime beforea democratic turnover occurred. Also, note that the coefficient estimates in Panel A are logged odds ratios.
Table A.6: Alternative Democracy Measures
Panel A. DV: Cheibub et al. democracy, post-1945 independence countriesAll years First yr. indep. Post-1991
(1) (2) (3) (4) (5) (6)British colony 1.079*** 0.761* 1.148** 1.081* 0.576 0.190
(0.407) (0.394) (0.570) (0.651) (0.446) (0.527)Country-years 3,390 3,264 73 69 1,299 1,246Covariates NO YES NO YES NO YES
Panel B. DV: V-Dem polyarchy, post-1945 independence countriesAll years First yr. indep. Post-1991
(1) (2) (3) (4) (5) (6)British colony 0.106** 0.0508 0.112*** 0.0869** 0.0586 -0.0187
(0.0420) (0.0367) (0.0415) (0.0378) (0.0482) (0.0479)Country-years 3,523 3,379 68 64 1,550 1,479R-squared 0.061 0.161 0.105 0.308 0.018 0.100Covariates NO YES NO YES NO YES
Notes: Table A.6 summarizes a series of logit regressions (Panel A) and OLS regressions (Panel B) by presenting coefficientestimates for British colonialism, and country-clustered robust standard error estimates in parentheses. The other coefficientestimates are suppressed for expositional clarity. The odd-numbered columns only control for British colonialism and theeven-numbered columns additionally control for the standard democracy covariates used in Table 1, Panel A: logged annual GDPper capita, logged annual population, logged annual oil and gas production per capita, Muslim percentage of the population, andethnic fractionalization. ∗∗∗p < 0.01,∗∗ p < 0.05,∗ p < 0.1.
Most of the results in this paper follow the existing literature by focusing on aggregate democracy scores.However, there are many hybrid regimes that combine certain features commonly associated withdemocracy—such as elections—without others, such as checks and balances or widespread politicalparticipation. It is possible that British colonialism more strongly affected some aspects of democracy thanothers, although we do not have strong theoretical views for which. Table A.7 examines the relationshipbetween British colonialism and four theoretical concepts considered integral to democracy: constraints onthe executive, electoral competition, liberal democratic freedoms, and political participation. Despite thevariety of differing concepts used, the results are mostly similar to those in Table 1. British colonialism isstrongly associated with higher levels of the democratic components immediately after independence, butweaker in the post-1991 period. Intriguingly, many of the correlations for contestation components ofdemocracy remain somewhat strong even post-1991, whereas there is no systematic relationship forpolitical participation (Panel F). This could perhaps capture stronger British effects on norms ofrepresentation and parliamentary constraints on the executive, as argued by Emerson (1960, 232) andAbernethy (2000, 367), or perhaps reflect shifting international norms over time toward full representationin all countries (Miller 2015). This could potentially be useful to analyze further in future research.
40
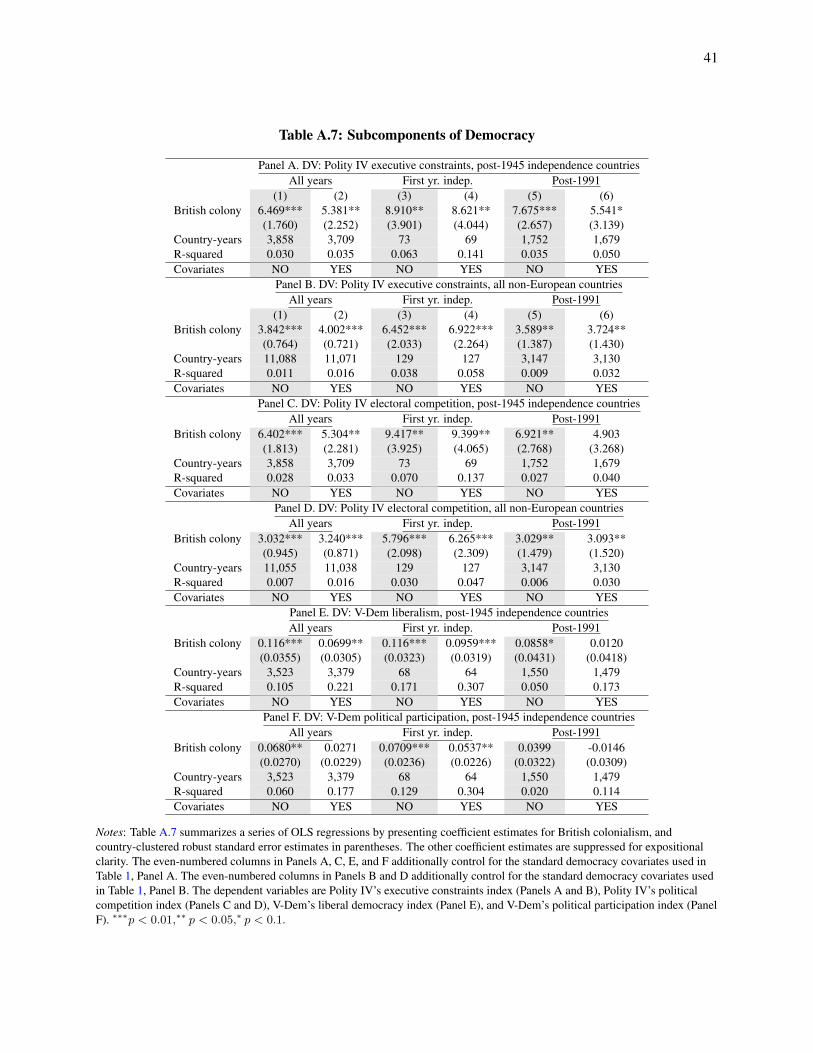
41
Table A.7: Subcomponents of Democracy
Panel A. DV: Polity IV executive constraints, post-1945 independence countriesAll years First yr. indep. Post-1991
(1) (2) (3) (4) (5) (6)British colony 6.469*** 5.381** 8.910** 8.621** 7.675*** 5.541*
(1.760) (2.252) (3.901) (4.044) (2.657) (3.139)Country-years 3,858 3,709 73 69 1,752 1,679R-squared 0.030 0.035 0.063 0.141 0.035 0.050Covariates NO YES NO YES NO YES
Panel B. DV: Polity IV executive constraints, all non-European countriesAll years First yr. indep. Post-1991
(1) (2) (3) (4) (5) (6)British colony 3.842*** 4.002*** 6.452*** 6.922*** 3.589** 3.724**
(0.764) (0.721) (2.033) (2.264) (1.387) (1.430)Country-years 11,088 11,071 129 127 3,147 3,130R-squared 0.011 0.016 0.038 0.058 0.009 0.032Covariates NO YES NO YES NO YES
Panel C. DV: Polity IV electoral competition, post-1945 independence countriesAll years First yr. indep. Post-1991
British colony 6.402*** 5.304** 9.417** 9.399** 6.921** 4.903(1.813) (2.281) (3.925) (4.065) (2.768) (3.268)
Country-years 3,858 3,709 73 69 1,752 1,679R-squared 0.028 0.033 0.070 0.137 0.027 0.040Covariates NO YES NO YES NO YES
Panel D. DV: Polity IV electoral competition, all non-European countriesAll years First yr. indep. Post-1991
British colony 3.032*** 3.240*** 5.796*** 6.265*** 3.029** 3.093**(0.945) (0.871) (2.098) (2.309) (1.479) (1.520)
Country-years 11,055 11,038 129 127 3,147 3,130R-squared 0.007 0.016 0.030 0.047 0.006 0.030Covariates NO YES NO YES NO YES
Panel E. DV: V-Dem liberalism, post-1945 independence countriesAll years First yr. indep. Post-1991
British colony 0.116*** 0.0699** 0.116*** 0.0959*** 0.0858* 0.0120(0.0355) (0.0305) (0.0323) (0.0319) (0.0431) (0.0418)
Country-years 3,523 3,379 68 64 1,550 1,479R-squared 0.105 0.221 0.171 0.307 0.050 0.173Covariates NO YES NO YES NO YES
Panel F. DV: V-Dem political participation, post-1945 independence countriesAll years First yr. indep. Post-1991
British colony 0.0680** 0.0271 0.0709*** 0.0537** 0.0399 -0.0146(0.0270) (0.0229) (0.0236) (0.0226) (0.0322) (0.0309)
Country-years 3,523 3,379 68 64 1,550 1,479R-squared 0.060 0.177 0.129 0.304 0.020 0.114Covariates NO YES NO YES NO YES
Notes: Table A.7 summarizes a series of OLS regressions by presenting coefficient estimates for British colonialism, andcountry-clustered robust standard error estimates in parentheses. The other coefficient estimates are suppressed for expositionalclarity. The even-numbered columns in Panels A, C, E, and F additionally control for the standard democracy covariates used inTable 1, Panel A. The even-numbered columns in Panels B and D additionally control for the standard democracy covariates usedin Table 1, Panel B. The dependent variables are Polity IV’s executive constraints index (Panels A and B), Polity IV’s politicalcompetition index (Panels C and D), V-Dem’s liberal democracy index (Panel E), and V-Dem’s political participation index (PanelF). ∗∗∗p < 0.01,∗∗ p < 0.05,∗ p < 0.1.
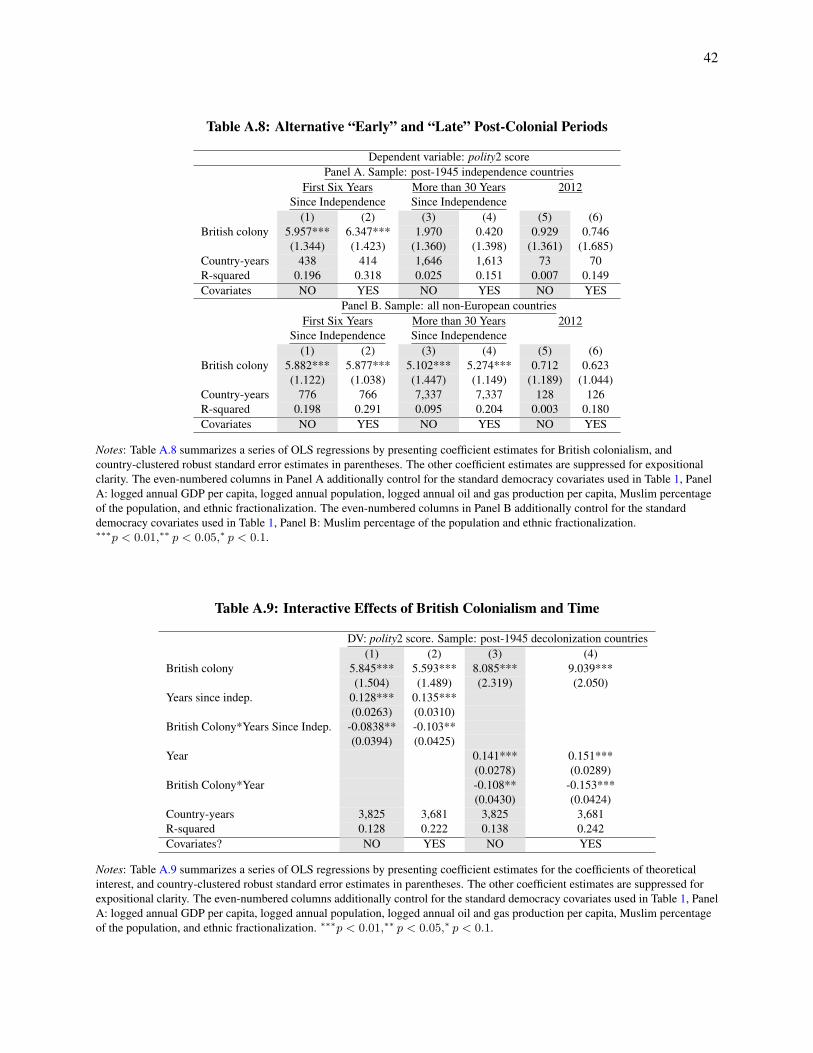
42
Table A.8: Alternative “Early” and “Late” Post-Colonial Periods
Dependent variable: polity2 scorePanel A. Sample: post-1945 independence countries
First Six Years More than 30 Years 2012Since Independence Since Independence
(1) (2) (3) (4) (5) (6)British colony 5.957*** 6.347*** 1.970 0.420 0.929 0.746
(1.344) (1.423) (1.360) (1.398) (1.361) (1.685)Country-years 438 414 1,646 1,613 73 70R-squared 0.196 0.318 0.025 0.151 0.007 0.149Covariates NO YES NO YES NO YES
Panel B. Sample: all non-European countriesFirst Six Years More than 30 Years 2012
Since Independence Since Independence(1) (2) (3) (4) (5) (6)
British colony 5.882*** 5.877*** 5.102*** 5.274*** 0.712 0.623(1.122) (1.038) (1.447) (1.149) (1.189) (1.044)
Country-years 776 766 7,337 7,337 128 126R-squared 0.198 0.291 0.095 0.204 0.003 0.180Covariates NO YES NO YES NO YES
Notes: Table A.8 summarizes a series of OLS regressions by presenting coefficient estimates for British colonialism, andcountry-clustered robust standard error estimates in parentheses. The other coefficient estimates are suppressed for expositionalclarity. The even-numbered columns in Panel A additionally control for the standard democracy covariates used in Table 1, PanelA: logged annual GDP per capita, logged annual population, logged annual oil and gas production per capita, Muslim percentageof the population, and ethnic fractionalization. The even-numbered columns in Panel B additionally control for the standarddemocracy covariates used in Table 1, Panel B: Muslim percentage of the population and ethnic fractionalization.∗∗∗p < 0.01,∗∗ p < 0.05,∗ p < 0.1.
Table A.9: Interactive Effects of British Colonialism and Time
DV: polity2 score. Sample: post-1945 decolonization countries(1) (2) (3) (4)
British colony 5.845*** 5.593*** 8.085*** 9.039***(1.504) (1.489) (2.319) (2.050)
Years since indep. 0.128*** 0.135***(0.0263) (0.0310)
British Colony*Years Since Indep. -0.0838** -0.103**(0.0394) (0.0425)
Year 0.141*** 0.151***(0.0278) (0.0289)
British Colony*Year -0.108** -0.153***(0.0430) (0.0424)
Country-years 3,825 3,681 3,825 3,681R-squared 0.128 0.222 0.138 0.242Covariates? NO YES NO YES
Notes: Table A.9 summarizes a series of OLS regressions by presenting coefficient estimates for the coefficients of theoreticalinterest, and country-clustered robust standard error estimates in parentheses. The other coefficient estimates are suppressed forexpositional clarity. The even-numbered columns additionally control for the standard democracy covariates used in Table 1, PanelA: logged annual GDP per capita, logged annual population, logged annual oil and gas production per capita, Muslim percentageof the population, and ethnic fractionalization. ∗∗∗p < 0.01,∗∗ p < 0.05,∗ p < 0.1.

A.3 Robustness Checks for Table 2
Table A.10: Additional Pre-Colonial and Early Colonial Alternative Explanations
Dependent variable: polity2 scorePanel A: Settler mortality, post-1945 independence countries
All years First yr. indep. Post-1991(1) (2) (3) (4) (5) (6)
British colony 6.014*** 6.226*** 10.01*** 10.52*** 3.331** 3.187*(1.256) (1.336) (1.884) (1.679) (1.528) (1.745)
ln(Settler mortality) -0.297 0.0705 0.0236 -1.368 0.0724 0.422(0.440) (0.678) (0.781) (1.394) (0.631) (0.916)
Country-years 1,687 1,641 30 29 725 703R-squared 0.242 0.280 0.566 0.657 0.088 0.098Covariates NO YES NO YES NO YES
Panel B: Settler mortality, all non-European countriesAll years First yr. indep. Post-1991
(1) (2) (3) (4) (5) (6)British colony 3.827*** 4.321*** 6.022*** 6.062*** -0.377 -0.159
(1.053) (0.922) (1.248) (1.142) (1.165) (0.990)ln(Pop. density in 1500) -0.836*** -0.458* -0.163 0.184 -0.914** -0.361
(0.300) (0.232) (0.317) (0.345) (0.359) (0.308)Country-years 10,593 10,593 118 118 2,906 2,906R-squared 0.129 0.216 0.216 0.289 0.050 0.258Covariates NO YES NO YES NO YES
Panel C: 1500 Population density, post-1945 independence countriesAll years First yr. indep. Post-1991
(1) (2) (3) (4) (5) (6)British colony 4.430*** 3.957*** 8.282*** 8.052*** 2.025 1.607
(1.160) (1.218) (1.437) (1.738) (1.356) (1.596)ln(Pop. density in 1500) 0.0233 0.0290 0.0557 0.147 -0.0703 -0.0431
(0.0865) (0.0894) (0.0739) (0.118) (0.0990) (0.119)Country-years 2,742 2,694 52 51 1,246 1,222R-squared 0.118 0.143 0.424 0.455 0.036 0.040Covariates NO YES NO YES NO YES
Panel D: 1500 Population density, all non-European countriesAll years First yr. indep. Post-1991
(1) (2) (3) (4) (5) (6)British colony 3.827*** 4.321*** 6.022*** 6.062*** -0.377 -0.159
(1.053) (0.922) (1.248) (1.142) (1.165) (0.990)ln(Pop. density in 1500) -0.836*** -0.458* -0.163 0.184 -0.914** -0.361
(0.300) (0.232) (0.317) (0.345) (0.359) (0.308)Country-years 10,593 10,593 118 118 2,906 2,906R-squared 0.129 0.216 0.216 0.289 0.050 0.258Covariates NO YES NO YES NO YES
43
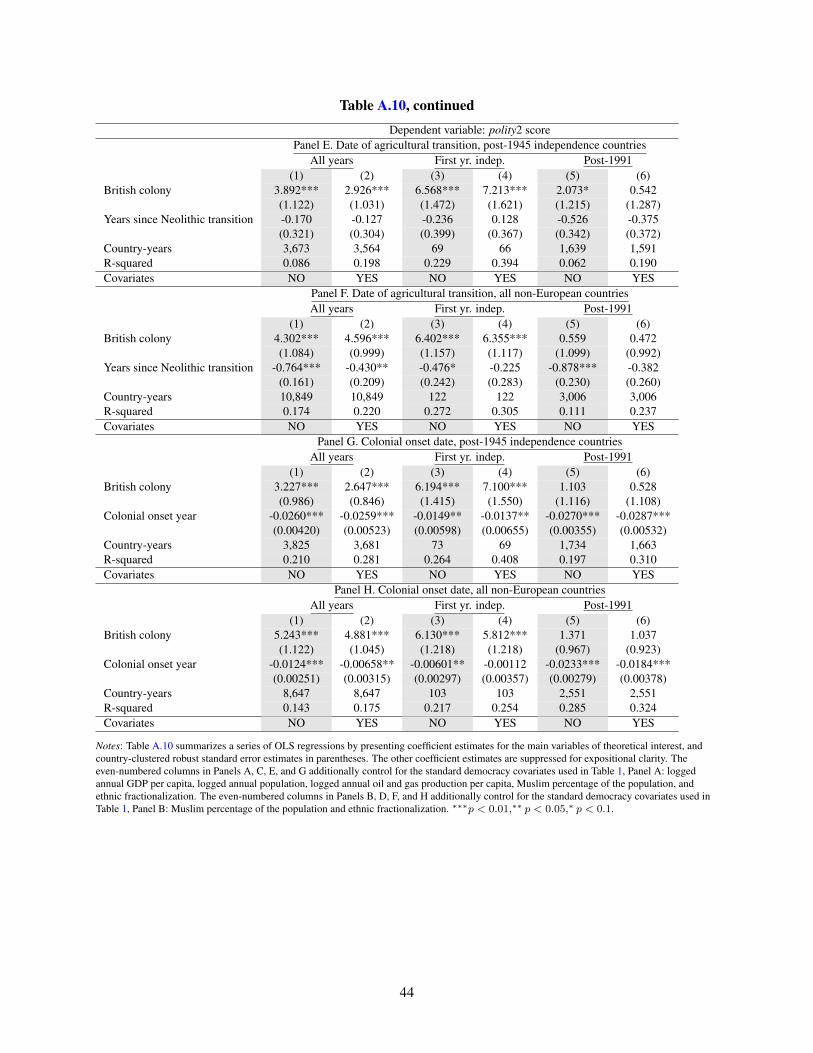
Table A.10, continued
Dependent variable: polity2 scorePanel E. Date of agricultural transition, post-1945 independence countries
All years First yr. indep. Post-1991(1) (2) (3) (4) (5) (6)
British colony 3.892*** 2.926*** 6.568*** 7.213*** 2.073* 0.542(1.122) (1.031) (1.472) (1.621) (1.215) (1.287)
Years since Neolithic transition -0.170 -0.127 -0.236 0.128 -0.526 -0.375(0.321) (0.304) (0.399) (0.367) (0.342) (0.372)
Country-years 3,673 3,564 69 66 1,639 1,591R-squared 0.086 0.198 0.229 0.394 0.062 0.190Covariates NO YES NO YES NO YES
Panel F. Date of agricultural transition, all non-European countriesAll years First yr. indep. Post-1991
(1) (2) (3) (4) (5) (6)British colony 4.302*** 4.596*** 6.402*** 6.355*** 0.559 0.472
(1.084) (0.999) (1.157) (1.117) (1.099) (0.992)Years since Neolithic transition -0.764*** -0.430** -0.476* -0.225 -0.878*** -0.382
(0.161) (0.209) (0.242) (0.283) (0.230) (0.260)Country-years 10,849 10,849 122 122 3,006 3,006R-squared 0.174 0.220 0.272 0.305 0.111 0.237Covariates NO YES NO YES NO YES
Panel G. Colonial onset date, post-1945 independence countriesAll years First yr. indep. Post-1991
(1) (2) (3) (4) (5) (6)British colony 3.227*** 2.647*** 6.194*** 7.100*** 1.103 0.528
(0.986) (0.846) (1.415) (1.550) (1.116) (1.108)Colonial onset year -0.0260*** -0.0259*** -0.0149** -0.0137** -0.0270*** -0.0287***
(0.00420) (0.00523) (0.00598) (0.00655) (0.00355) (0.00532)Country-years 3,825 3,681 73 69 1,734 1,663R-squared 0.210 0.281 0.264 0.408 0.197 0.310Covariates NO YES NO YES NO YES
Panel H. Colonial onset date, all non-European countriesAll years First yr. indep. Post-1991
(1) (2) (3) (4) (5) (6)British colony 5.243*** 4.881*** 6.130*** 5.812*** 1.371 1.037
(1.122) (1.045) (1.218) (1.218) (0.967) (0.923)Colonial onset year -0.0124*** -0.00658** -0.00601** -0.00112 -0.0233*** -0.0184***
(0.00251) (0.00315) (0.00297) (0.00357) (0.00279) (0.00378)Country-years 8,647 8,647 103 103 2,551 2,551R-squared 0.143 0.175 0.217 0.254 0.285 0.324Covariates NO YES NO YES NO YES
Notes: Table A.10 summarizes a series of OLS regressions by presenting coefficient estimates for the main variables of theoretical interest, andcountry-clustered robust standard error estimates in parentheses. The other coefficient estimates are suppressed for expositional clarity. Theeven-numbered columns in Panels A, C, E, and G additionally control for the standard democracy covariates used in Table 1, Panel A: loggedannual GDP per capita, logged annual population, logged annual oil and gas production per capita, Muslim percentage of the population, andethnic fractionalization. The even-numbered columns in Panels B, D, F, and H additionally control for the standard democracy covariates used inTable 1, Panel B: Muslim percentage of the population and ethnic fractionalization. ∗∗∗p < 0.01,∗∗ p < 0.05,∗ p < 0.1.
44

Table A.11 only uses the post-1945 independence sample because the secondary education variable thatWoodberry uses is averaged between 1960 and 1985 and therefore is measured well after independence forearly decolonizers. Similarly, the literacy variable (following that used in Owolabi 2015) is measured in the1960s.
Table A.11: Human Capital
Dependent variable: polity2 scorePanel A. Secondary education, post-1945 independence countries
All years First yr. indep. Post-1991(1) (2) (3) (4) (5) (6)
British colony 2.780** 1.903 6.020*** 5.516** 0.440 -1.285(1.271) (1.240) (1.817) (2.073) (1.610) (1.659)
Secondary Education 0.127 0.162 0.0233 0.111 0.0301 0.0382(0.0949) (0.112) (0.111) (0.130) (0.0972) (0.133)
Country-years 2,535 2,413 48 45 1,149 1,078R-squared 0.090 0.197 0.192 0.362 0.004 0.167Covariates NO YES NO YES NO YES
Panel B. Literacy, post-1945 independence countriesAll years First yr. indep. Post-1991
(1) (2) (3) (4) (5) (6)British colony 2.070* 1.581 5.255*** 5.381*** -0.273 -0.779
(1.150) (1.138) (1.699) (1.775) (1.447) (1.382)Literacy in 1960 0.0938*** 0.110*** 0.0817*** 0.127*** 0.0847*** 0.110***
(0.0229) (0.0323) (0.0291) (0.0288) (0.0266) (0.0387)Country-years 3,504 3,417 66 64 1,581 1,533R-squared 0.203 0.254 0.359 0.478 0.117 0.222Covariates NO YES NO YES NO YES
Notes: Table A.11 summarizes a series of OLS regressions by presenting coefficient estimates for the main variables of theoreticalinterest, and country-clustered robust standard error estimates in parentheses. The other coefficient estimates are suppressed forexpositional clarity. The even-numbered columns additionally control for the standard democracy covariates used in Table 1, PanelA: logged annual GDP per capita, logged annual population, logged annual oil and gas production per capita, Muslim percentageof the population, and ethnic fractionalization. ∗∗∗p < 0.01,∗∗ p < 0.05,∗ p < 0.1.
45
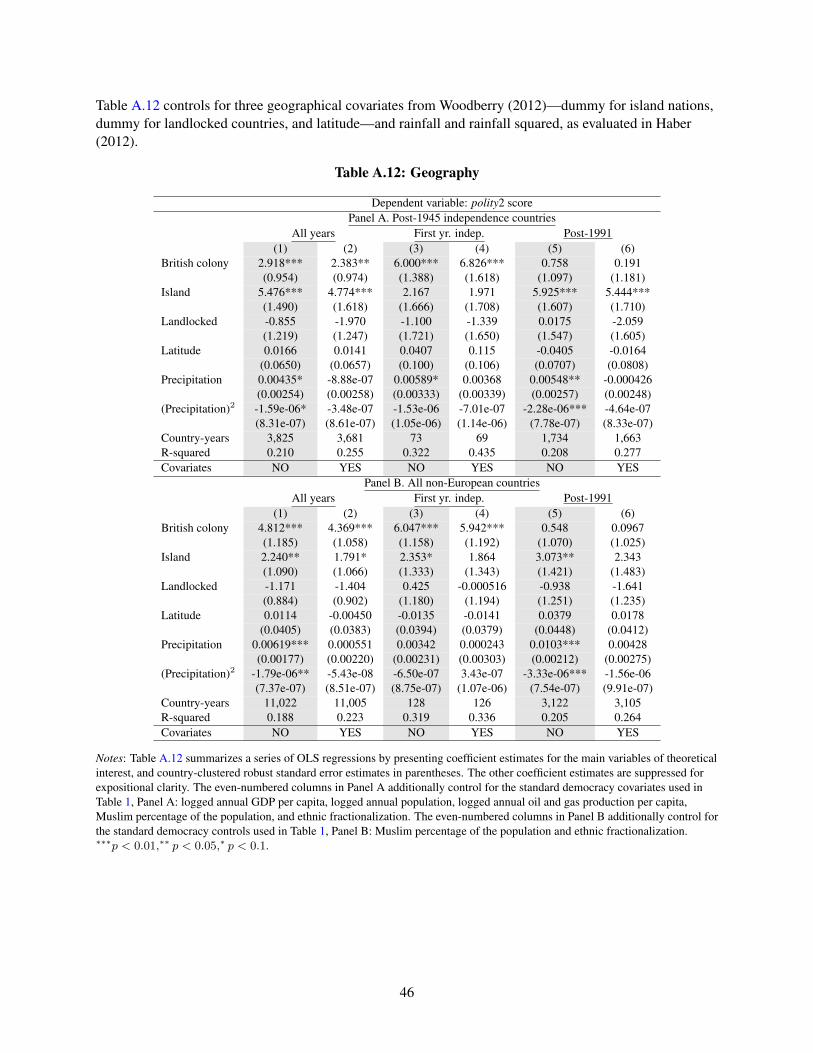
Table A.12 controls for three geographical covariates from Woodberry (2012)—dummy for island nations,dummy for landlocked countries, and latitude—and rainfall and rainfall squared, as evaluated in Haber(2012).
Table A.12: Geography
Dependent variable: polity2 scorePanel A. Post-1945 independence countries
All years First yr. indep. Post-1991(1) (2) (3) (4) (5) (6)
British colony 2.918*** 2.383** 6.000*** 6.826*** 0.758 0.191(0.954) (0.974) (1.388) (1.618) (1.097) (1.181)
Island 5.476*** 4.774*** 2.167 1.971 5.925*** 5.444***(1.490) (1.618) (1.666) (1.708) (1.607) (1.710)
Landlocked -0.855 -1.970 -1.100 -1.339 0.0175 -2.059(1.219) (1.247) (1.721) (1.650) (1.547) (1.605)
Latitude 0.0166 0.0141 0.0407 0.115 -0.0405 -0.0164(0.0650) (0.0657) (0.100) (0.106) (0.0707) (0.0808)
Precipitation 0.00435* -8.88e-07 0.00589* 0.00368 0.00548** -0.000426(0.00254) (0.00258) (0.00333) (0.00339) (0.00257) (0.00248)
(Precipitation)2 -1.59e-06* -3.48e-07 -1.53e-06 -7.01e-07 -2.28e-06*** -4.64e-07(8.31e-07) (8.61e-07) (1.05e-06) (1.14e-06) (7.78e-07) (8.33e-07)
Country-years 3,825 3,681 73 69 1,734 1,663R-squared 0.210 0.255 0.322 0.435 0.208 0.277Covariates NO YES NO YES NO YES
Panel B. All non-European countriesAll years First yr. indep. Post-1991
(1) (2) (3) (4) (5) (6)British colony 4.812*** 4.369*** 6.047*** 5.942*** 0.548 0.0967
(1.185) (1.058) (1.158) (1.192) (1.070) (1.025)Island 2.240** 1.791* 2.353* 1.864 3.073** 2.343
(1.090) (1.066) (1.333) (1.343) (1.421) (1.483)Landlocked -1.171 -1.404 0.425 -0.000516 -0.938 -1.641
(0.884) (0.902) (1.180) (1.194) (1.251) (1.235)Latitude 0.0114 -0.00450 -0.0135 -0.0141 0.0379 0.0178
(0.0405) (0.0383) (0.0394) (0.0379) (0.0448) (0.0412)Precipitation 0.00619*** 0.000551 0.00342 0.000243 0.0103*** 0.00428
(0.00177) (0.00220) (0.00231) (0.00303) (0.00212) (0.00275)(Precipitation)2 -1.79e-06** -5.43e-08 -6.50e-07 3.43e-07 -3.33e-06*** -1.56e-06
(7.37e-07) (8.51e-07) (8.75e-07) (1.07e-06) (7.54e-07) (9.91e-07)Country-years 11,022 11,005 128 126 3,122 3,105R-squared 0.188 0.223 0.319 0.336 0.205 0.264Covariates NO YES NO YES NO YES
Notes: Table A.12 summarizes a series of OLS regressions by presenting coefficient estimates for the main variables of theoreticalinterest, and country-clustered robust standard error estimates in parentheses. The other coefficient estimates are suppressed forexpositional clarity. The even-numbered columns in Panel A additionally control for the standard democracy covariates used inTable 1, Panel A: logged annual GDP per capita, logged annual population, logged annual oil and gas production per capita,Muslim percentage of the population, and ethnic fractionalization. The even-numbered columns in Panel B additionally control forthe standard democracy controls used in Table 1, Panel B: Muslim percentage of the population and ethnic fractionalization.∗∗∗p < 0.01,∗∗ p < 0.05,∗ p < 0.1.
46

A.4 Robustness Checks for Table 3
Table A.13: Table 3 Specifications with all non-European Countries
Dependent variable: polity2 score. Sample: all non-European countriesPanel A: Direct vs. indirect British rule
All years First yr. indep. Post-1991(1) (2) (3) (4) (5) (6)
British direct rule 8.747*** 8.108*** 10.20*** 9.769*** 4.164** 2.845*(1.444) (1.241) (1.081) (1.105) (1.644) (1.490)
British indirect rule 1.294 1.986* 4.418*** 4.641*** -1.465 -1.074(1.160) (1.013) (1.478) (1.392) (1.263) (1.061)
Country-years 11,088 11,071 129 127 3,147 3,130R-squared 0.164 0.249 0.288 0.349 0.056 0.248Covariates NO YES NO YES NO YES
Panel B: Metropolitan British rights vs. notAll years First yr. indep. Post-1991
(1) (2) (3) (4) (5) (6)Br w/ metropolitan rights 10.15*** 9.238*** 10.02*** 9.250*** 6.016*** 4.136***
(0.886) (0.851) (1.134) (1.168) (1.124) (1.133)Br w/o metropolitan rights 0.625 1.485 4.701*** 5.079*** -2.105* -1.492
(1.054) (0.968) (1.460) (1.390) (1.237) (1.103)Country-years 11,088 11,071 129 127 3,147 3,130R-squared 0.211 0.276 0.277 0.331 0.111 0.272Covariates NO YES NO YES NO YES
Panel C: Long vs. short British ruleAll years First yr. indep. Post-1991
(1) (2) (3) (4) (5) (6)Long British rule 8.235*** 7.721*** 8.332*** 7.900*** 4.145*** 3.054***
(1.121) (0.959) (1.360) (1.325) (1.201) (1.032)Short British rule 0.511 1.374 4.541*** 4.964*** -3.005** -2.333*
(1.453) (1.300) (1.666) (1.586) (1.388) (1.262)Country-years 11,088 11,071 129 127 3,147 3,130R-squared 0.171 0.254 0.256 0.319 0.100 0.277Covariates NO YES NO YES NO YES
Panel D: Exclude Middle EastAll years First yr. indep. Post-1991
(1) (2) (3) (4) (5) (6)British colony 5.297*** 5.489*** 7.566*** 7.747*** 1.090 0.813
(1.212) (1.135) (1.117) (1.115) (1.152) (1.094)Country-years 9,362 9,345 109 107 2,668 2,651R-squared 0.119 0.150 0.334 0.352 0.007 0.105Covariates NO YES NO YES NO YES
Panel E: Only AfricaAll years First yr. indep. Post-1991
(1) (2) (3) (4) (5) (6)British colony 2.402** 2.554** 6.320*** 6.632*** 0.894 1.047
(1.142) (1.056) (1.788) (1.859) (1.483) (1.369)Country-years 2,451 2,447 44 43 1,075 1,071R-squared 0.040 0.047 0.249 0.262 0.007 0.045Covariates NO YES NO YES NO YES
Notes: Table A.13 summarizes a series of OLS regressions by presenting coefficient estimates for the main variables of theoretical interest, andcountry-clustered robust standard error estimates in parentheses. The other coefficient estimates are suppressed for expositional clarity. Theeven-numbered columns additionally control for the standard democracy covariates used in Table 1, Panel B: Muslim percentage of the populationand ethnic fractionalization. ∗∗∗p < 0.01,∗∗ p < 0.05,∗ p < 0.1.
47
A.5 Additional Robustness Checks: Postcolonial Influence and Disaggre-gating European Colonizers
Superpower rivalry strongly impacted regime dynamics during the Cold War, the time period during whichnearly every country in the post-1945 decolonization sample gained independence. It is possible, althoughunlikely, that Britain colonized territories that would have formed international alliances favorable fordemocracy promotion at independence regardless of their European colonizer. Although this considerationis probably more appropriately theorized as a mechanism rather than as an alternative explanation, weprovide statistical evidence that it does not drive any of the results.
Three major differences, both highly correlated with colonizer origin, stand out as being both testable andpotentially important. First, British colonies appear less likely than other countries to be ruled bycommunist or Soviet-backed regimes, which in turn appear to be less likely to be democratic than othercountries. Second, compared to other colonial powers, France conducted a highly interventionist policy inits former African colonies. France often supported dictators sympathetic to French strategic and economicinterests, for example, sending in soldiers to reverse a successful coup in Gabon in 1964 to restore apreferred dictator. Third, countries in which colonizers retained military bases may have faced lesspressure to democratize than other nations.
Table A.14 shows that the effects of all these post-colonial factors are relatively small, and that none ofthem qualitatively change the estimated effect of British colonialism. Panel A includes dummies forcountries under Soviet influence (operationalized as countries that were at any time full or observermembers of COMECON) and countries with a strong French influence (operationalized as countries thatjoined de Gaulle’s French Community at independence). Since both factors are potentially endogenous todemocracy levels (since dictators might find either of these clubs more attractive) this represents a veryfavorable test for finding evidence of post-colonial influence. However, neither factor has a statisticallysignificant relationship with democracy, although the estimated effect of communist influence is negativeand moderately large at independence—and, perhaps surprisingly, more negative after the Cold War endedthan before. The estimated effects of British colonialism on post-independence democracy are smaller thanthe Table 1 estimates, but remain strongly statistically significant.
Panel B of Table A.14 tests another version of the post-independence influence hypothesis: some colonialpowers retained military bases in their former colonies, which both increased their interest in thesecountries and increased their ability to influence their politics, although it is not necessarily clear if thiswould positively or negatively affect democracy. We constructed a dummy variable for whether a foreignmilitary power had base facilities (as distinct from a training mission) in the countries at independence.These countries appear to be little different than the rest of the sample, and their inclusion does not alter theestimated effects of British colonialism from Table 1.
Another plausible hypothesis about colonialism is that British-colonized countries are more democraticbecause of the influence of the Commonwealth of Nations, though many dictatorships were also membersof this organization. Because nearly all British colonies in the sample joined the Commonwealth ofNations (and those that did not, chiefly in the Middle East, were not randomly selected), it is impossible toseparate the influence of this organization from the overall influence of British colonialism. However, thereis no clear reason why the influence of the Commonwealth would change so dramatically over time.
48

Table A.14: Post-Independence Colonizer Influence
Dependent variable: polity2 scorePanel A. Cold War Alliances, post-1945 independence countries
All years First yr. indep. Post-1991(1) (2) (3) (4) (5) (6)
British colony 3.360** 2.565** 5.438*** 5.980*** 1.242 0.0752(1.291) (1.189) (1.642) (1.753) (1.476) (1.563)
Communist Bloc -1.408 -3.118 -2.905 -4.188 -3.151 -4.954*(1.379) (2.057) (2.110) (2.680) (2.440) (2.881)
French Community -0.0618 1.093 -1.597 -1.240 0.938 1.475(0.979) (1.178) (1.594) (1.947) (1.470) (1.602)
Country-years 3,825 3,681 73 69 1,734 1,663R-squared 0.073 0.184 0.230 0.394 0.030 0.187Covariates NO YES NO YES NO YES
Panel B. Cold War alliances, all non-European countriesAll years First yr. indep. Post-1991
(1) (2) (3) (4) (5) (6)British colony 4.388*** 4.667*** 6.271*** 6.290*** 0.156 -0.0848
(1.207) (1.001) (1.181) (1.104) (1.156) (0.956)Communist Bloc -1.678 -0.0811 1.143 1.806 0.207 0.410
(1.381) (1.152) (2.692) (2.658) (2.978) (1.764)French Community -2.712 -4.538*** -4.545 -5.698* -6.680* -8.461***
(1.804) (1.699) (2.974) (2.907) (3.468) (2.933)Country-years 11,088 11,071 129 127 3,147 3,130R-squared 0.103 0.214 0.241 0.321 0.043 0.288Covariates NO YES NO YES NO YES
Panel C. Military bases, post-1945 independence countriesAll years First yr. indep. Post-1991
British colony 3.609*** 2.646** 6.167*** 6.846*** 1.320 0.302(1.155) (1.058) (1.476) (1.628) (1.305) (1.364)
NATO Base 1.136 1.328 -1.712 -0.694 0.901 1.880(1.783) (1.308) (2.290) (2.002) (1.975) (1.454)
Country-years 3,825 3,681 73 69 1,734 1,663R-squared 0.074 0.173 0.225 0.377 0.013 0.155Covariates NO YES NO YES NO YES
Panel D. Military bases, all non-European countriesAll years First yr. indep. Post-1991
British colony 4.154*** 4.356*** 6.307*** 6.316*** 0.364 0.204(1.206) (1.025) (1.190) (1.119) (1.156) (0.984)
NATO Base 1.711 1.531 0.451 0.509 0.739 0.567(1.362) (1.148) (1.399) (1.252) (1.601) (1.455)
Country-years 11,088 11,071 129 127 3,147 3,130R-squared 0.094 0.205 0.227 0.302 0.003 0.223Covariates NO YES NO YES NO YES
Notes: Table A.14 summarizes a series of OLS regressions by presenting coefficient estimates for the main variables of theoreticalinterest, and country-clustered robust standard error estimates in parentheses. The other coefficient estimates are suppressed forexpositional clarity. The even-numbered columns in Panels A and C additionally control for the standard democracy covariatesused in Table 1, Panel A: logged annual GDP per capita, logged annual population, logged annual oil and gas production percapita, Muslim percentage of the population, and ethnic fractionalization. The even-numbered columns in Panels B and Dadditionally control for the standard democracy covariates used in Table 1, Panel B: Muslim percentage of the population andethnic fractionalization. ∗∗∗p < 0.01,∗∗ p < 0.05,∗ p < 0.1.
49

Table 1 contrasted British colonies with the quite heterogenous excluded category of “non-Britishcolonies.” Perhaps very low levels of post-colonial democracy among a single non-British power drives theresult, in which case we would be estimating a “not French” or “not Portuguese” effect rather than a trulypro-British effect. Table A.15 examines this possibility more closely by presenting results from models thatinclude a full set of other European colonizer dummies (French, Portuguese, Spanish, U.S., Dutch, Belgian,Italian) with British colonies composing the excluded category. The differences in average democracy levelrelative to British colonies in the year after independence are consistently significantly lower for most ofthe rival empires: French, Portuguese, Spanish, and Belgian. These differences weaken somewhat in thefull temporal sample, and have mostly dissipated after 1991—reinforcing the Table 1 pattern.
Table A.15: Disaggregating European Powers
Dependent variable: polity2 scorePanel A. Post-1945 independence countries
All years First yr. indep. Post-1991(1) (2) (3) (4) (5) (6)
French colony -4.105*** -3.008*** -6.983*** -7.144*** -1.985 -0.992(1.165) (1.085) (1.570) (1.862) (1.359) (1.356)
Portuguese colony -0.762 0.0604 -8.843*** -9.669*** 2.107 2.258(1.820) (1.658) (1.509) (1.813) (2.269) (2.033)
Spanish colony -6.379*** -5.988*** -9.343*** -11.57*** -6.445*** -4.376(1.040) (2.082) (1.283) (1.738) (1.046) (2.921)
U.S. colony 2.870*** -0.762 -0.343 -3.992** 6.722*** 4.823**(1.040) (1.761) (1.283) (1.773) (1.046) (2.030)
Dutch colony -0.711 0.673 0.157 -0.537 2.576* 4.550***(1.965) (2.383) (2.271) (2.015) (1.328) (1.696)
Belgian colony -4.260*** -4.971*** -5.010*** -7.727*** -1.501 -2.764(1.234) (1.576) (1.796) (1.999) (2.049) (2.835)
Italian colony -4.611** -0.0733 -2.343 -0.151 -3.938 -0.0453(2.048) (1.731) (5.400) (5.984) (2.538) (1.790)
Country-years 3,825 3,681 73 69 1,734 1,663R-squared 0.106 0.197 0.279 0.445 0.082 0.198Covariates NO YES NO YES NO YES
Panel B. All non-European countriesAll years First yr. indep. Post-1991
(1) (2) (3) (4) (5) (6)French colony -2.557** -2.149** -4.688*** -4.010*** -1.761 -0.733
(1.004) (0.979) (1.215) (1.247) (1.145) (1.212)Portuguese colony -0.251 -2.000 -6.511*** -8.126*** 3.135 1.739
(1.223) (1.448) (1.071) (1.133) (1.967) (1.817)Spanish colony 0.681 -1.577 -3.333*** -5.317*** 4.899*** 2.449*
(1.110) (1.302) (1.071) (1.200) (1.300) (1.381)U.S. colony 4.288*** 2.128* 1.889** 0.328 6.783*** 4.302***
(0.885) (1.183) (0.869) (1.174) (0.784) (1.117)Dutch colony 0.777 0.740 2.389 1.774 2.763** 2.740***
(1.852) (1.319) (2.021) (1.497) (1.068) (0.679)Belgian colony -2.832** -4.812*** -2.778* -4.642*** -1.417 -3.518*
(1.107) (1.218) (1.502) (1.386) (1.908) (1.927)Italian colony -3.148 1.004 -0.111 3.490 -3.666 1.290
(1.975) (1.982) (5.184) (5.378) (2.416) (2.618)Country-years 11,088 11,071 129 127 3,147 3,130R-squared 0.031 0.131 0.131 0.242 0.121 0.258Covariates NO YES NO YES NO YES
Notes: Table A.15 summarizes a series of OLS regressions by presenting coefficient estimates for the main variables of theoreticalinterest, and country-clustered robust standard error estimates in parentheses. The other coefficient estimates are suppressed forexpositional clarity. The even-numbered columns in Panel A additionally control for the standard democracy covariates used inTable 1, Panel A: logged annual GDP per capita, logged annual population, logged annual oil and gas production per capita,Muslim percentage of the population, and ethnic fractionalization. The even-numbered columns in Panel B additionally control forthe standard democracy covariates used in Table 1, Panel B: Muslim percentage of the population and ethnic fractionalization.∗∗∗p < 0.01,∗∗ p < 0.05,∗ p < 0.1.
50
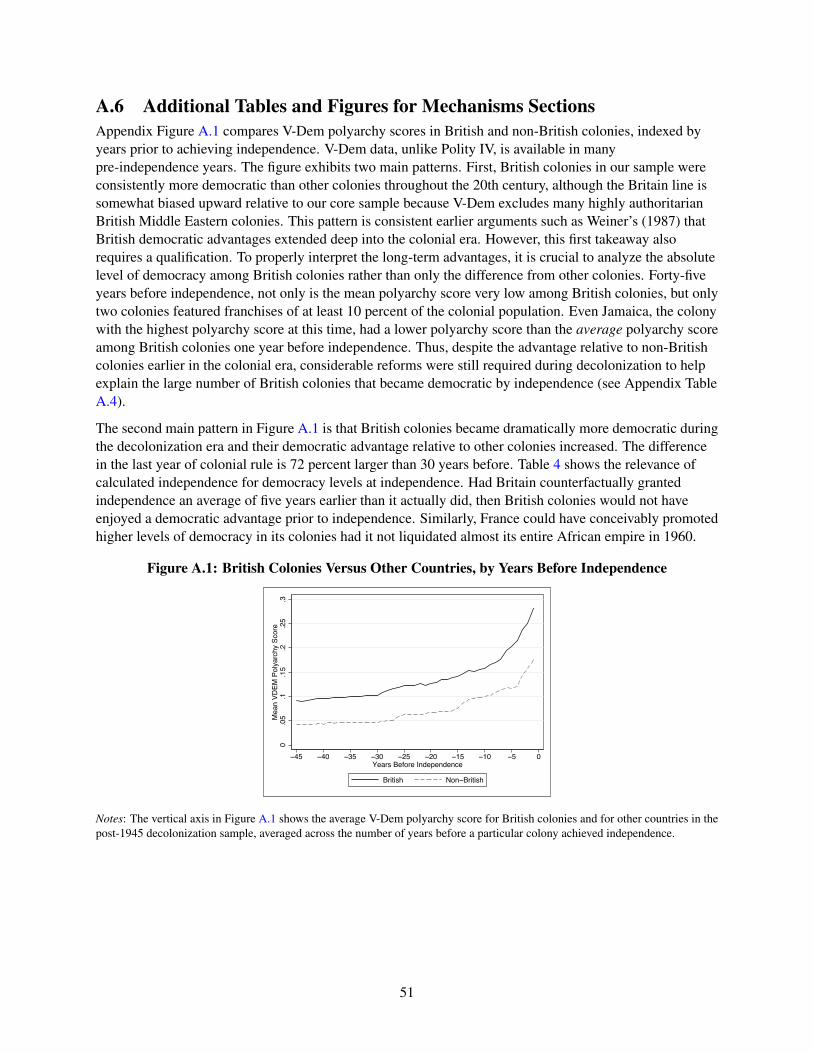
A.6 Additional Tables and Figures for Mechanisms SectionsAppendix Figure A.1 compares V-Dem polyarchy scores in British and non-British colonies, indexed byyears prior to achieving independence. V-Dem data, unlike Polity IV, is available in manypre-independence years. The figure exhibits two main patterns. First, British colonies in our sample wereconsistently more democratic than other colonies throughout the 20th century, although the Britain line issomewhat biased upward relative to our core sample because V-Dem excludes many highly authoritarianBritish Middle Eastern colonies. This pattern is consistent earlier arguments such as Weiner’s (1987) thatBritish democratic advantages extended deep into the colonial era. However, this first takeaway alsorequires a qualification. To properly interpret the long-term advantages, it is crucial to analyze the absolutelevel of democracy among British colonies rather than only the difference from other colonies. Forty-fiveyears before independence, not only is the mean polyarchy score very low among British colonies, but onlytwo colonies featured franchises of at least 10 percent of the colonial population. Even Jamaica, the colonywith the highest polyarchy score at this time, had a lower polyarchy score than the average polyarchy scoreamong British colonies one year before independence. Thus, despite the advantage relative to non-Britishcolonies earlier in the colonial era, considerable reforms were still required during decolonization to helpexplain the large number of British colonies that became democratic by independence (see Appendix TableA.4).
The second main pattern in Figure A.1 is that British colonies became dramatically more democratic duringthe decolonization era and their democratic advantage relative to other colonies increased. The differencein the last year of colonial rule is 72 percent larger than 30 years before. Table 4 shows the relevance ofcalculated independence for democracy levels at independence. Had Britain counterfactually grantedindependence an average of five years earlier than it actually did, then British colonies would not haveenjoyed a democratic advantage prior to independence. Similarly, France could have conceivably promotedhigher levels of democracy in its colonies had it not liquidated almost its entire African empire in 1960.
Figure A.1: British Colonies Versus Other Countries, by Years Before Independence
0.0
5.1
.15
.2.2
5.3
Mea
n VD
EM P
olya
rchy
Sco
re
−45 −40 −35 −30 −25 −20 −15 −10 −5 0Years Before Independence
British Non−British
Notes: The vertical axis in Figure A.1 shows the average V-Dem polyarchy score for British colonies and for other countries in thepost-1945 decolonization sample, averaged across the number of years before a particular colony achieved independence.
51
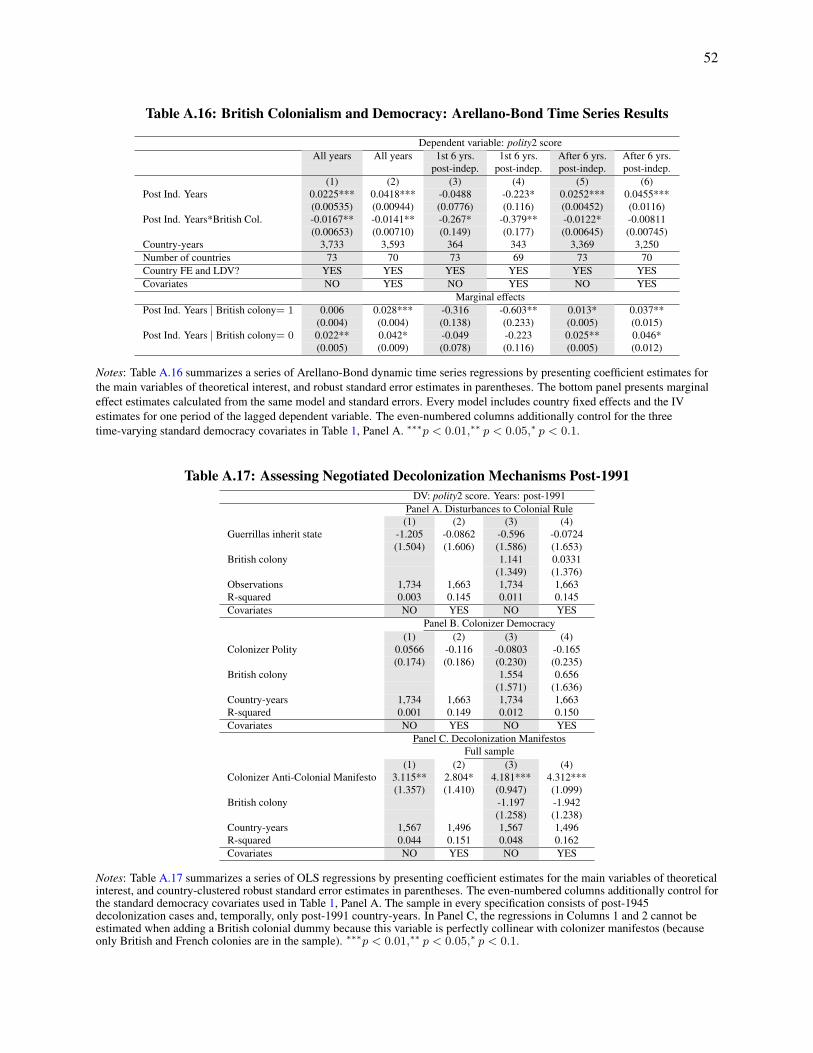
52
Table A.16: British Colonialism and Democracy: Arellano-Bond Time Series Results
Dependent variable: polity2 scoreAll years All years 1st 6 yrs. 1st 6 yrs. After 6 yrs. After 6 yrs.
post-indep. post-indep. post-indep. post-indep.(1) (2) (3) (4) (5) (6)
Post Ind. Years 0.0225*** 0.0418*** -0.0488 -0.223* 0.0252*** 0.0455***(0.00535) (0.00944) (0.0776) (0.116) (0.00452) (0.0116)
Post Ind. Years*British Col. -0.0167** -0.0141** -0.267* -0.379** -0.0122* -0.00811(0.00653) (0.00710) (0.149) (0.177) (0.00645) (0.00745)
Country-years 3,733 3,593 364 343 3,369 3,250Number of countries 73 70 73 69 73 70Country FE and LDV? YES YES YES YES YES YESCovariates NO YES NO YES NO YES
Marginal effectsPost Ind. Years | British colony= 1 0.006 0.028*** -0.316 -0.603** 0.013* 0.037**
(0.004) (0.004) (0.138) (0.233) (0.005) (0.015)Post Ind. Years | British colony= 0 0.022** 0.042* -0.049 -0.223 0.025** 0.046*
(0.005) (0.009) (0.078) (0.116) (0.005) (0.012)
Notes: Table A.16 summarizes a series of Arellano-Bond dynamic time series regressions by presenting coefficient estimates forthe main variables of theoretical interest, and robust standard error estimates in parentheses. The bottom panel presents marginaleffect estimates calculated from the same model and standard errors. Every model includes country fixed effects and the IVestimates for one period of the lagged dependent variable. The even-numbered columns additionally control for the threetime-varying standard democracy covariates in Table 1, Panel A. ∗∗∗p < 0.01,∗∗ p < 0.05,∗ p < 0.1.
Table A.17: Assessing Negotiated Decolonization Mechanisms Post-1991DV: polity2 score. Years: post-1991
Panel A. Disturbances to Colonial Rule(1) (2) (3) (4)
Guerrillas inherit state -1.205 -0.0862 -0.596 -0.0724(1.504) (1.606) (1.586) (1.653)
British colony 1.141 0.0331(1.349) (1.376)
Observations 1,734 1,663 1,734 1,663R-squared 0.003 0.145 0.011 0.145Covariates NO YES NO YES
Panel B. Colonizer Democracy(1) (2) (3) (4)
Colonizer Polity 0.0566 -0.116 -0.0803 -0.165(0.174) (0.186) (0.230) (0.235)
British colony 1.554 0.656(1.571) (1.636)
Country-years 1,734 1,663 1,734 1,663R-squared 0.001 0.149 0.012 0.150Covariates NO YES NO YES
Panel C. Decolonization ManifestosFull sample
(1) (2) (3) (4)Colonizer Anti-Colonial Manifesto 3.115** 2.804* 4.181*** 4.312***
(1.357) (1.410) (0.947) (1.099)British colony -1.197 -1.942
(1.258) (1.238)Country-years 1,567 1,496 1,567 1,496R-squared 0.044 0.151 0.048 0.162Covariates NO YES NO YES
Notes: Table A.17 summarizes a series of OLS regressions by presenting coefficient estimates for the main variables of theoreticalinterest, and country-clustered robust standard error estimates in parentheses. The even-numbered columns additionally control forthe standard democracy covariates used in Table 1, Panel A. The sample in every specification consists of post-1945decolonization cases and, temporally, only post-1991 country-years. In Panel C, the regressions in Columns 1 and 2 cannot beestimated when adding a British colonial dummy because this variable is perfectly collinear with colonizer manifestos (becauseonly British and French colonies are in the sample). ∗∗∗p < 0.01,∗∗ p < 0.05,∗ p < 0.1.

Additional ReferencesAlesina, Alberto, Arnaud Devleeschauwer, William Easterly, Sergio Kurlat, and Romain Wacziarg. 2003.“Fractionalization.” Journal of Economic Growth, 8: 155–94.
Easterly, William and Ross Levine. 2016. “The European Origins of Economic Development.” Journal ofEconomic Growth, forthcoming.
Ertan, Arhan, Martin Fiszbein, and Louis Putterman. 2016. “Who was colonized and when? Across-country analysis of determinants.” European Economic Review, 83: 165–184.
Fearon, James D. and David D. Laitin. 2003. Ethnicity, Insurgency, and Civil War. American PoliticalScience Review 97(1): 75-90.
Feenstra, Robert C., Robert Inklaar, and Marcel Timmer. 2013. “The Next Generation of the Penn WorldTable.” NBER Working Paper no. 19255. Data accessed from http://www.rug.nl/research/ggdc/data/pwt on5/31/16.
Haber, Stephen. 2012. “Where Does Democracy Thrive? Climate, Technology, and the Evolution ofEconomic and Political Institutions.” Stanford, CA: Working paper, Department of Political Science.Available athttp://stephen-haber.com/wp-content/uploads/2014/02/Haber-Where-Does-Democracy-Thrive.pdf.Accessed 6/7/16.
Hensel, Paul R. 2014. “ICOW Colonial History Data Set, version 1.0.” Available athttp://www.paulhensel.org/icowcol.html. Accessed 4/10/16.
La Porta, Rafael, Florencio Lopez-de-Silanes, Andrei Shleifer, and Robert W. Vishny. 1999. “The Qualityof Government.” Journal of Law, Economics, and Organization. 15: 222- 279.
Maddison, Angus. 2008. “Statistics on World Population, GDP and Per Capita GDP, 1-2008 AD.”Available at http://www.ggdc.net/maddison/oriindex.htm. Accessed 4/10/16.
Miller, Michael K. 2015. “Democratic Pieces.” British Journal of Political Science.
Ross, Michael L. 2013. “Oil and Gas Data, 1932-2011.” Available at http://hdl.handle.net/1902.1/20369.Accessed 4/10/16.
United Nations. 1980. Compendium for Social Statistics, 1977. New York: United Nations.
World Bank. 2016. “Average precipitation in depth.” Available athttp://data.worldbank.org/indicator/AG.LND.PRCP.MM. Accessed 6/7/16.
53