did mandatory csr compliance impact accounting
TRANSCRIPT

DID MANDATORY CSR COMPLIANCE IMPACT ACCOUNTING CONSERVATISM? EVIDENCE FROM A NATURAL EXPERIMENT
Tara Shaw Department of Humanities and Social Sciences
Indian Institute of Technology Bombay Powai, Mumbai 400 076, India
Phone: +91 022 2576 7390 Email: [email protected]
Mehul Raithatha
Finance and Accounting Area Indian Institute of Management Indore
Prabandh Shikhar, Rau-Pithampur Road Indore 453556, India
Phone: +91 731 2439 588 Email: [email protected]
Gopal V. Krishnan
Department of Accountancy Bentley University
Waltham, MA 02452 Phone: 781-891-2477
Email: [email protected]
James J. Cordeiro Department of Accounting, Economics, and Finance
The College at Brockport, State University of New York 350 New Campus Drive Brockport, NY 14420 Phone: 585-395-5793
Email: [email protected]
September 14, 2019

1
DID MANDATORY CSR COMPLIANCE IMPACT ACCOUNTING CONSERVATISM? EVIDENCE FROM A NATURAL EXPERIMENT
Abstract
In 2013, India became the first country in the world to require firms to spend two percent of their average profit on corporate social responsibility (CSR) activities. Taking advantage of this unique event, we examine the link between accounting conservatism and CSR compliance. We find a positive relation between conditional conservatism and CSR and this relation is stronger for firms that have stronger governance and weaker for family firms. Further, we find that current period accounting conservatism is negatively related to next period CSR spending. Our results are robust to a battery of tests. While policy makers may have intended to increase CSR activities by Indian firms, our results suggest that firms use accounting policies and negative accruals strategically to mitigate the costs of CSR compliance as well as contracting costs arising from concerns of capital providers. Keywords: CSR, conservatism, Board of directors, Family firms, India

2
I. INTRODUCTION
In 2013, India implemented new Corporate Social Responsibility (CSR) regulation, the
Companies Act 2013, requiring companies whose net worth exceeds INR 5 billion, or whose
annual turnover exceeds INR 10 billion, or whose profit exceeds INR 5 million in any financial
year, to spend two percent of their profits, averaged over the past three years, on CSR.1,2
The objectives of this study are two-fold. Our first research objective is to examine the
financial reporting implications of CSR compliance under the new regulation by Indian firms.
Though financial reporting is not the focus of the regulation, mandatory CSR compliance is likely
to influence firms’ financial reporting decisions because the new regulation is analogous to a
corporate tax of two percent on profits and firms have to spend the amount on government
mandated local-community focused CSR activities without any direct quid pro quo (Dharmapala
and Khanna 2018).3 Specifically, we focus on accounting conservatism and predict a positive
relation between accounting conservatism and CSR compliance for two reasons. First, concurrent
research finds that the mandatory CSR spending by Indian firms resulted in a decline in firms’
profitability as well as stock market valuation (Manchiraju and Rajgopal 2017 and Mukherjee et
al. 2018). Thus, Indian firms are motivated to mitigate the financial burden imposed by the
mandatory CSR compliance by strategically enhancing accounting conservatism to decrease
1The exchange rate between Indian rupee and the U.S. dollar is approximately INR 70 = $1. It is estimated about 8,000 Indian firms meet these requirements and collectively will spend about $2 billion annually on CSR (Chhabra 2014). 2 The Companies Act 2013 does not specify penalties for non-compliance. If a firm fails to spend the prescribed amount, it is required to disclose the reasons for non-compliance in the annual report (Kapoor and Dhamija 2017). However, recently, the Indian government passed a Bill specifying that unspent CSR funds should be transferred into an escrow account and should be used within three years of transfer. Further, any unspent annual CSR fund must be transferred to one of the funds designated by the Companies Act. Executives of firms that fail to comply face monetary penalty or jail time of up to three years or both (BusinessLine 2019). 3Examples of activities that are considered CSR include, eradicating hunger, poverty, and malnutrition, promoting preventive health care and sanitation, promoting education, gender equality, and environmental sustainability. Examples of activities that are not considered as CSR spending include, activities undertaken outside India, expenditures incurred exclusively for the benefits of the employees or their families, and contributions to political parties (Kapoor and Dhamija 2017).

3
earnings used to determine the extent of mandatory CSR spending. We refer to this as the burden
containment explanation. Second, firms are incentivized to enhance accounting conservatism to
minimize contracting costs by allaying concerns of capital providers who may not favourably view
the mandated CSR activities undertaken by firms. Assuring capital providers via conservative
reporting is an important issue especially in India, which suffers from weak investor protection as
well as corruption and inefficiency (Allen et al. 2012). We refer to this as the signalling to capital
providers explanation.
Our second research objective is to examine two mechanisms that are likely to enhance or
exacerbate the positive relation between accounting conservatism and CSR compliance: the board
of directors and family-controlled firms. Prior research finds that conditional conservatism is
positively associated with governance quality (Lara et al. 2009). Thus, we conjecture that a strong
and diligent board of directors, who are more likely to enhance accounting conservatism are also
likely to ensure CSR compliance. Next, we examine family firms because in India, a sizable
fraction of firms is comprised of family-controlled businesses. Prior research finds that family
firms are incentivized to mitigate legal liability and agency conflicts with other stakeholders and
thus are more conservative than non-family firms (Chen et al. 2014; Raithatha and Shaw 2019).
However, prior research also finds a negative relation between family control and CSR (El Ghoul
et al. 2016). Thus, it is an empirical question whether family control enhances or exacerbates the
positive relation between accounting conservatism and CSR compliance.
Our study is motivated by the following reasons. First, to the best of our knowledge, India
is the first country in the world to mandate CSR compliance and thus presents a unique opportunity
to study the link between financial reporting and CSR compliance. The issue of whether CSR
should be mandated remains controversial and empirical evidence on the potential relation

4
between CSR compliance and financial reporting would be of interest to regulators not only in
India but also in other jurisdictions. Second, while prior research has examined the relation
between CSR and financial reporting, in general, the focus has been on settings where CSR
compliance is voluntary (Gelb and Strawser 2001; Hong and Andersen 2011; Kim et al. 2012;
Scholtens and Kang 2013; and Litt et al., 2013). Also, prior research reports mixed findings on the
relation between CSR and conservatism. For example, while Francis et al. (2013), Martinez-
Ferroro et al. (2015), and Cheng and Kung (2016) find a positive relationship between CSR and
accounting conservatism, Radhakrishnan et al. (2018) find a negative relation between CSR and
accounting conservatism. One reason for the mixed findings could be the challenge in establishing
the causal link between CSR and financial reporting, especially in settings where CSR is voluntary.
We exploit the exogeneous shock provided by the Indian Companies Act 2013 and the staggered
implementation of the mandatory CSR spending as a quasi-natural experiment to better attribute
causality from increased CSR spending to changes in conditional accounting conservatism.
We test our hypotheses on a sample of 1,159 non-financial firms (3,303 firm-year
observations) listed on the Bombay Stock Exchange (BSE) that were required to comply with the
CSR regulation in any year between 2015 to 2017. Since firms have an option not to comply with
CSR and provide an explanation for the non-compliance instead, there is a potential self-selection
bias associated with firms that chose to comply. To address this issue, we use a two-stage approach.
In the first stage we estimate a regression of the determinants of the decision to comply and obtain
the Inverse Mills Ratio (IMR). We next estimate a regression of conservatism on CSR compliance,
controls, and the IMR. We use the firm-specific conditional conservatism measure based on Khan
and Watts (2009) as our primary measure of conservatism.

5
We document several key findings. First, consistent with our conjecture, we find a positive
relation between conditional conservatism and CSR compliance (significant at the 0.01 level). This
finding holds for both an indicator variable that represents CSR compliance as well as a continuous
measure of CSR spending. Also, our results hold when we use an alternate conditional
conservatism measure based on Ball and Shivakumar (2005) as well as other robustness tests
involving first-difference and difference-in-difference models. Second, consistent with our
conjecture, we find that the positive relation between conditional conservatism and CSR
compliance is stronger for firms with stronger governance. Third, we find that the positive relation
between conditional conservatism and CSR compliance is weaker for family firms. Fourth, we
estimate a regression of CSR spending in year t+1 on current period CSR spending and our
measures of conditional conservatism and find that the coefficient on conservatism is negative and
significant, indicating that enhancing conservatism in the current period appear to reduce the CSR
burden in the next period. Finally, we examine whether firms recognize income-decreasing
(negative) discretionary accruals as opposed to income-increasing (positive) discretionary accruals
to reduce the CSR burden. We estimate a regression of the absolute value of negative discretionary
accruals on CSR compliance and find that the coefficient on CSR compliance is positive and
significant. However, when we estimate a regression of positive discretionary accruals, the
coefficient on CSR compliance is not significant. Overall, our findings support the notion that
firms appear to use accounting policies strategically to mitigate the costs of mandatory CSR
compliance as well as to minimize contracting costs arising from the potential concerns of capital
providers who may not favourably view the mandated CSR activities undertaken by firms.

6
The next section summarizes related research and develops our hypotheses. Section III
describes the research design, measures of conservatism, and the empirical models. Section IV
describes or sample followed by results and discussion. Section VI concludes.
II. RELATED RESEARCH AND HYPOTHESES
CSR and Accounting Conservatism
Conditional accounting conservatism is a key aspect of a firm’s earnings quality by
reflecting bad news more quickly than good news (Basu 1997).4 One of the primary reasons for a
firm to follow conditional conservative accounting practices is to reduce the information
asymmetry arising from managerial incentives for behaving opportunistically and undertaking
suboptimal projects. Rational contracting parties anticipating the opportunistic behaviour of the
managers protect themselves by increasing the cost of capital both for debts and equity (LaFond
and Watts 2008; Zhang 2008). Consequently, firms would seek to signal the legitimacy of their
accounting and business practices through conditional accounting conservatism, which acts as an
effective governance mechanism by emphasizing timely loss recognition and verified recognition
of gains (Watts 2003; Callen et al. 2016). Ball and Shivakumar (2005) state that firms with
conditional accounting conservatism would tend to identify poorly performing projects early to
avoid precipitating debt covenant violations. Such identification would result in timely corrective
actions, such as abandonment of loss-making projects or replacement of poor performing
managers. This would reduce the cost of capital both from debt and equity (Li 2015).
In India, even though, corporate dependence on equity capital is low, dependence on bank
debt has increased in the last decade (Raithatha and Shaw 2019). The regulatory reforms in the
banking sector including Corporate Debt Restructuring (CDR) in 2001, The Securitization and
4 On the other hand, unconditional conservatism utilizes information known at the inception of assets and liabilities (Basu 2005).

7
Reconstruction of Financial Assets and Enforcement of Securities Interest (SARFESI) Act 2002,
have strengthened creditors’ rights to access the collateral of defaulting firms without recourse to
judicial process (Vig 2013), and have empowered creditors to scrutinize loans and to demand more
transparent financial statements from debtors. Consequently, there has been an increased demand
for conditional conservative accounting in reporting practices of Indian firm (Gormley et al. 2011
Raithatha and Shaw, 2019). The Companies Act 2013 is a unique political, economic, and social
development in India which predicts a relationship between CSR and accounting conservatism, as
discussed below.
We expect a positive relation between accounting conservatism and CSR and offer two
explanations for this prediction. Mandated CSR compliance in India is mostly in the area of
societal development with little to no relationship with the firm’s core operations. It thus
increasingly exposes firms to the demands of multiple stakeholders which are often conflicting
and inconsistent (Luo et al. 2017). For example, an organization’s CSR spending on local
community development can restrict spending on employee welfare or on environmentally
sustainable production. In addition, given the limited scope for strategic CSR activities that may
benefit the bottom line financially, managers may adopt CSR policies symbolically (Luo et al.
2013 and Afsharipour and Rana 2013) and remain unaccountable for the usage of firm’s resources
(Jensen 2002). In the absence of clear criteria to judge managerial actions objectively, managers
are often incentivized to divert firm resources to pursue their own interests (such as enhancing
their own reputation for social consciousness while sacrificing the interests of financial claimants
and society at large (Jensen 2002; Chih et al. 2008)).5 This creates distrust and intensifies internal
5 In Indian case there are evidences that that the firm’s promoters have deliberately diverted funds spend in CSR to their personal benefit through investing in trust and other NGOs (Narayanan 2015). With respect to mandatory CSR expenditure in India industrialist and philanthropist Ratan Tata stated that: “You will have a registered NGO, you will have the money, the money goes to the NGO and it may be three or four years before the whole thing explodes in a

8
agency problems leading financial stakeholders to increase the cost of capital for the firms with
higher CSR expenditures, ultimately leading to the decline of firm performance. Studies on the
causal effect of firm’s mandatory CSR expenditure on its performance in India have found that it
has generally resulted in the decline in the stock valuation of the firms (Manchiraju and Rajgopal
2017) and also in the decline in firm’s profitability measured in terms of return on equity
(Mukherjee et al. 2018). Consequently, firms choosing to undertake CSR expenditures are
incentivized to enhance conditional conservatism to signal the reliability and relevance of their
financial statements to reduce the cost of capital (Zhang 2008; LaFond and Watts 2005) and also
provide an incentive for ex ante efficient investment decisions. The protections to capital providers
are especially valuable in India, which suffers institutionally from weak investor protection as well
as corruption and inefficiency (Allen et al. 2012). Thus, Indian firms are incentivized to enhance
accounting conservatism to minimize contracting costs and allay concerns of capital providers who
may not favourably view the mandated CSR activities undertaken by firms. We refer to this as the
signalling to capital providers explanation.
In addition to mitigating contracting costs, Indian firms are also incentivized to mitigate
CSR compliance costs. This is because CSR compliance is analogous to corporate tax of 2 percent
on profits, whereby the firms have to spend the amount on government mandated local-community
focused CSR activities without any direct quid pro quo (Dharampala and Khanna 2018). However,
unlike taxes, the compliance of CSR spending is weak as the Companies Act 2013 does not specify
any enforcement mechanism or punishment for non-compliance though recently, the Indian
government has proposed monetary penalty and jail time for non-compliance. Among the 100
companies surveyed by KPMG on CSR spending in 2017, 37 companies spent less than the
series of fraudulent operations, money being given to people that don’t exist, or causes that are subterfuge for something else” White (2014).

9
mandated amount, and the majority of these companies stated that they were still “exploring
opportunities” (KPMG 2017). Moreover, firms undertaking CSR expenditures are also motivated
to shift income by being more conditionally conservative and by reporting economic losses more
proactively than economic gains. This would reduce both current and future period CSR
obligations.6 Overall, as the CSR burden of a firm increases, it is motivated to reduce the CSR
burden by enhancing conditional conservatism. We refer to this as the burden containment
explanation. Together, the above two explanations lead to our first hypothesis:
Hypothesis 1: Conditional accounting conservatism is positively associated with mandatory CSR compliance.
Corporate Governance and the Conservatism-CSR Relation
The board plays a key role in terms of the firm’s strategic decision-making processes
(Hillman et al. 2000), serving as advisors for key investment, financing, mergers and acquisitions,
and other impactful decisions (Andres and Vallelado 2008), including accounting policies. Among
emerging economies, Sarkar et. al (2008) and Shaw et al. (2016) showed that in India, a strong
board helps curb opportunist earnings management and increases firm performance respectively.
Liu and Lu (2007) and Chen et al. (2007) find similar evidence for Chinese and Taiwanese firms
respectively. The board is also involved in the design of contracts between the firm and debt issuers
(Lara et al. 2009; Bakar et al. 2018) and the firm’s financial statements, ratified by the board, play
an important role in debt contracting. In this respect, financial statements that are conservative
reduce information asymmetry between insiders and the other stakeholders. This helps the board
to mitigate agency conflicts and to conduct its monitoring and supervisory role more effectively
6Anecdotal evidence suggests that the practice of profit underreporting is prevalent in India after the enactment of CSR regulation in India. The Registrar of Companies a body under the Ministry of Corporate Affairs of India has questioned more than 200 companies for leaving out dividend income earned during the three preceding years while calculating the profits for the purpose of CSR spending (Arora and Sikarwar 2016).

10
improving the contracting efficiency (Ball and Shivakumar 2005). The above line of arguments
suggests that a strong board would demand conditionally conservative financial statements to
reduce agency problems by more effectively monitoring management and the contracts they enter
into especially those with providers of capital (Beekes and Brown 2006; Lara et al. 2009).
Separately, corporate governance has been viewed as facilitating the pursuit of both CSR
initiatives (Harjoto and Jo 2011) and voluntary CSR disclosure (Chan et al. 2014). Mason and
Simmons (2014) argued that CSR contributes to organization’s objectives to deliver ethical
performance and to satisfy stakeholders’ demand for fair treatment. Li and Zhang (2010) examined
CSR in the emerging markets (Brazil, Russia, India, and China) and found that governance (as
reflected in a stronger board) is an important force behind CSR intensity. In the Indian context,
Clause 49 of the listing agreement to the Indian stock markets and the Companies Act specifically
assigns responsibility to the board of directors in terms of ensuring the firm’s compliance with
legal requirements and norms7 including mandated spending on CSR in accordance with the Indian
law. Diligence in ensuring compliance with this CSR spending requirement not only advances
stakeholder interests but also helps directors’ personal reputation by providing a signal that they
are performing their monitoring and advisory role with due diligence. The above line of reasoning
leads to our second hypothesis:
Hypothesis 2: The positive relation between accounting conservatism and CSR is greater for firms with stronger corporate governance than for firms with weaker corporate governance.
Family Control and the Conservatism-CSR Relation
Ownership type can impact CSR (Dyer and Whetten 2006; Berrone et al. 2010; 2012;
Cennamo et al. 2012; Cruz et al. 2014; Calza et al. 2016). In the case of family firms, since the
7 See http://www.mca.gov.in/Ministry/reportonexpertcommitte/chapter4.html and http://indianboards.com/files/clause_49.pdf

11
families in question often have a longer strategic horizon and are more concerned about their
personal and familial reputation (Berrone et al. 2010; 2012;Cruz et al. 2014) they may well care
more about the community and external natural environment, in which they are embedded (Sharma
and Irving 2005) and thus have a strong preference for CSR. Families view their image and
reputation based on CSR efforts as being connected to the firms they own, and therefore are
concerned about not damaging their reputation through irresponsible actions and may additionally
strive to advance it through positive CSR efforts. Supporting this notion, Berrone et al. (2010)
found that family firms in the U.S. strove to protect their image and reputation through superior
environmental performance relative to their nonfamily counterparts. Similarly, in the Indian
context, Cordeiro et al. (2018) found that family firms commit to higher level of CSR engagement
to protect their image and reputation.
If family firms are subjected to mandatory CSR expenditures, they have a higher propensity
to comply with these regulations in order to enhance family legitimacy and reputation in the market
and to maintain a stable relationship with the government (Gul and Ng 2017). However, this could
lead to lower accounting conservatism for two reasons. First, family firms design their voluntary
disclosure norms to preserving family wealth (Gomez-Mejia et al. 2011; Pattnaik et al. 2013) and
as a result tend to favour opacity with a reluctance to divulge strategic information to outsiders
(Witt and Redding 2013). They are also likely to provide fewer earnings forecasts and conference
calls (Chen et al. 2018), report low-quality accounting numbers (Yang 2010), disclose less on
corporate governance practices (Ali et al. 2007) and have fewer disclosures in the annual reports
(Vural 2018). Further, family firms are more prone to fraud and hence auditors perceive them to
be having more severe agency conflicts (Krishnan and Peytcheva 2019). In the Indian context,
family firms are less reluctant to venture for outward FDI because of their aversion to scrutiny by

12
regulators, investors, and credit rating agencies (Bhaumik et al. 2010). Second, for family firms
the reputation of the firm is closely tied with the family itself any decrease in profit resulting from
CSR activities would adversely affect their perceived reputation and this is likely to reduce
propensity towards bad news recognition.
As discussed earlier, family firms that have higher levels of CSR spending are subject to
higher agency costs and prior research finds that family firms are incentivized to mitigate legal
liability and agency conflicts with other stakeholders and thus are more conservative than non-
family firms (Chen et al. 2014; Raithatha and Shaw 2019). Thus, it is an empirical question
whether family control enhances or exacerbates the positive relation between accounting
conservatism and CSR compliance. Thus, we propose the following non-directional hypothesis to
test the role of family firms in moderating the relation between accounting conservatism and CSR:
Hypothesis 3: Family firms moderate the relation between accounting conservatism and CSR.
III. RESEARCH DESIGN
Measures of Accounting Conservatism
Our primary measure of the dependent variable is Khan and Watts (2009)’s CSCORE
measure. They model accounting conservatism as a function of a firm’s size, market-to-book ratio,
and leverage. We use a three-year average of CSCORE (calculated over years !, ! − 1 and ! − 2)
to rule out the year-to-year fluctuations in the firm-level variables. We refer to this measure as
CONKW. We use the conservatism measure based on Ball and Shivakumar (2005) as an alternate
measure of conservatism and refer to this as CONBS. Once again, we use a three-year average to
calculate CONBS.
13
Measures of CSR Compliance
We measure CSR in two ways. We use an indicator variable, CSRD which equals 1 if the
firm’s CSR expenditure is more than or equal to the amount mandated under the regulation and 0
otherwise. As part of sensitivity analyses, we use CSREXP, the natural logarithm of (1 + actual
CSR spending) as an alternative, continuous measure of CSR compliance.
We utilize a number of controls. We construct a composite index of corporate governance
from five board characteristics: board size, board independence, board attendance, outside
directorship, and CEO duality. In India, these attributes of the board are found to be associated
with effective governance. The use of a composite governance index has an advantage in that the
measure does not rely on a single dimension of the board, but on multiple dimensions of the board
(Bozec and Bozec 2012). Following Hawas and Tse (2016), we first determine the industry-year
median for board size, board independence, board attendance, and outside directorship to capture
the varying effect of industry and year on the effectiveness of governance (Donker and Zahir
2008). We include the entire population of listed firms in the BSE for the year in question when
calculating the industry-year median. Next, we code these variables as 1 if the value pertaining to
a firm in a given year is higher than the industry-year median, and 0 otherwise. For CEO duality,
we code the variable as 1 if the CEO and the Chairman of the board are different and 0 otherwise.
Finally, we construct the governance index, CGINDEX as the average of the five binary variables
constructed in the previous step. Thus, CGINDEX takes the value between 0 to1 and higher the
value of CGINDEX, stronger is the firm’s governance in the industry for the given year.
We define a firm as family controlled and family managed if the controlling family of the
firm besides having substantial shareholding has representation on the board and in the
management of the firm. Following Singh et al. (2014), we code a firm to be family controlled if

14
two of the following three conditions are satisfied: (1) the promoters8 had a stake of 20 percent or
greater in the firm; (2) a member of the promoter family was on the board of the firm; and/or (3)
a member of the promoter family was the chairperson of the board; otherwise it is coded 0. Next,
we code a firm to be family managed if they satisfy any two of the following conditions: (1) a
promoter or promoter’s family member was the CEO of the firm; (2) a promoter or promoter family
was an executive director; and/or (3) more than one member of the promoter family were executive
directors. Thereafter, a firm is coded as FAMILY if it is both family-controlled and family-managed
simultaneously; otherwise it is coded as 0. We interact CGINDEX and FAMILY with CSR
compliance variables.
Other control variables that are used in the model are as follows: We first control for firm’s
availability of cash and its ability to pay for its short-term obligation by free cash flow (FCLOW)
and financial slack of the firm measured as the ratio of current asset by current liability (CRATIO)
(Kim et al. 2008). Since firms can undertake accounting conservatism for tax avoidance, we
control for downward management of taxable income by incorporating book-tax difference (BTD)
following Desai and Dharampala (2006). Following McWilliams et al. (2006) we control for
various firm level attributes, such as size (LN(SALES)), profitability (ROA), advertisement
intensity (ADVINT) and R&D intensity (RDINT). We also control for other ownership structure of
the firm beside family ownership by including a business group (BUSGROUP) dummy variable
which takes the value of 1 if the firm belongs to a business group, and 0 otherwise. We include an
indicator if the firm is affiliated with a foreign multinational corporation (MNC) and also include
8Under India’s Companies Act 2013, promoters are the person who is identified by the company to have control over its affairs either through direct or indirect shareholding or otherwise. Following Ashwin et al. (2015) the total promoter holding is the sum of the family promoter holding and the corporate holding which addresses the indirect holding of the promoters.

15
institutional holdings (INSTHOLDG). Finally, our model also includes firm and year fixed effects
to capture time-variant confounds and macroeconomic shocks respectively.
Empirical Model
Our objective is to study the causal effect of CSR on the conditional accounting
conservatism of the firm. A sample selection issue arises when the firms that chose to comply with
the CSR regulation and undertake CSR activities are inherently different from the firms that do
not choose to comply. To correct for this selection bias, we estimate a two-stage Heckman model
(Heckman 1979) as suggested by Lennox et al. (2011) to determine the causal effect of meeting
the CSR expenditure on accounting conservatism. We first estimate a probit regression on the
binary choice variable CSRD on factors that affect firm’s choice of undertaking CSR activities and
calculate the inverse Mills ratio (IMR). In the second-stage, we include the IMR from the first-
stage, as an additional variable to account for the sample selection bias in estimating the causal
effect of CSR on accounting conservatism. As recommended by Lennox et al. (2011) and Fang et
al. (2018), we impose an exclusion restriction in the first stage model to mitigate the problems of
misspecification and multicollinearity which may result in misidentification of the IMR. We
include variables in the first-stage that are correlated with the firm’s decision to comply with CSR
but do not affect the dependent variable of interest, i.e., accounting conservatism, and are therefore
excluded in the second-stage of the selection model. The choice of excluded variables should also
have a theoretical underpinning in explaining the variation in the first-stage, i.e., CSR choice but
not in the second-stage. We identify two variables that satisfy the exclusion restrictions: the
average sales in an industry for a given year (INDSALES) and average assets in an industry for a
given year (INDASSETS). In issues related to CSR, industry context has received substantial
attention as a relevant unit of analysis (Delmas and Toffel 2008). Because a firm’s reluctance to

16
divulge strategic information, consumers and other stakeholder groups may rely on industry-level
behavior to infer about firm’s behavior (King and Santor 2008). We surmise that firms that belong
to an industry with high average sales (INDSALES) are likely to have higher CSR expenditure.
First, these firms on average have higher inflow of revenue capital that increases unabsorbed slack
in their operation resulting in higher CSR spending (Xu et al. 2015). Second, prior research finds
that firms undertake CSR to satisfy the demands of stakeholders (Donaldson and Preston 1995;
Freeman 2010) who contribute to the firm’s wealth creating capacity (Cordeiro and Tewari 2015)
and are bearers of risk (Post et al. 2002). Among the group of diverse stakeholders’ customers
constitute an important group since they are the important source of revenue for the firm
(McWilliams and Siegel 2001). Therefore, firms belonging to industries with higher average sales
are more dependent on their customers and are likely to undertake higher CSR expenditure as a
product differentiation strategy to maintain their competitiveness (McWilliams and Seigel 2001;
Boehe and Cruz 2010). However, firms belonging to industries with high average assets
(INDASSETS) would undertake CSR expenditures differently. Industries with higher average
assets are more likely to have generic resources already committed to specific uses and these are
difficult to redeploy for alternative uses (Voss et al. 2008).. Thus, ceteris paribus, firms in these
industries have fewer resources available to invest in CSR and consequently have lower CSR
expenditures (Xu et al. 2015). These firms also have weaker incentives to invest in CSR activities
since firms with higher asset levels have more resources making them more resistant to
stakeholder’s demands (Arora and Dharwadkar 2011). Thus, we predict that firms in industries
with high average sales (assets) are more (less) likely to have higher CSR expenditure and
consequently are more likely to comply with the CSR regulation. Importantly these variables are

17
unlikely to be directly associated with the firm’s accounting conservatism, and thus satisfy the
exclusion restriction. Thus, our first-stage model is as follows:
CSRD = π0 + π1INDSALES +π2INDASSETS + πX + ν (1) where CSRD is an indicator variable which takes the value 1 if the firm’s CSR spending is equal
to or more than the mandated amount under the regulation and 0 otherwise. INDSALES and
INDASSETS are, respectively, the average sales and assets in the industry of the focal firm in a
given year. Xs are all the other control variables used in the second-stage of the estimation.
Appendix A provides definitions for all variables used in this study. To capitalize the longitudinal
nature of our data, we applied the method suggested by Wooldridge (1995), Dustmann and
Rochinna-Barrachina (2007), and Fang et al. (2018) to calculate the IMR using annual probit
estimation, which provides a separate estimate of IMR for each sample year instead of an IMR
calculated from pooling all the years together.
Next, we estimate the following model to test our hypotheses by including the IMR to
account for the selection bias:
CONKWit = ß0 + ß1CSRDit+ß2IMRt+ γXit+ μi + δt + ɛit (2)
where, CONKW is the firm-specific measure of conditional accounting conservatism based on
Khan and Watts (2009). We also use an alternate measure of conditional conservatism, CONBS
based on Ball and Shivakumar (2005). Our variable of interest is CSRD as explained above. We
also use a continuous measure of CSR compliance (CSREXP) as an alternate measure. X is matrix
of control variables. To control for time-invariant confounds as well as time-specific effects, we
estimate the model using fixed effect panel estimation where we have controlled for both firm-
level and year-level fixed effects, %!and &" respectively. ß1 captures the causal effect of CSR on
accounting conservatism and ß2 estimates the direction of the selection bias. Hypothesis 1 predicts
18
ß1 > 0. To test hypothesis 2 and 3 we include interaction variables, which are, respectively, CSRD
× CGINDEX and CSRD × FAMILY. Hypothesis 2 predicts a positive coefficient on CSRD ×
CGINDEX. Hypothesis 3 does not offer a prediction on the coefficient sign on CSRD × FAMILY.
IV. SAMPLE
We use the PROWESS database to identify our sample firms. This database provides
comprehensive firm-level financial information data drawn from the annual reports of the firms.
The first year for which CSR data are available under the new regulation is 2015. We collect the
necessary data for years 2015 through 2017 for firms listed on the BSE. We exclude all firm-year
observations with negative net worth and firms that were delisted from the BSE. Our final sample
consists of 1,159 unique firms representing 3,303 firm-year observations.
Univariate Analyses
Descriptive statistics for our sample are provided in Table 1. The mean (median) value of
CONKW is 1.966 (1.521), indicating that firms in our sample exhibit conditional accounting
conservatism. We find that about 42.40 percent of the sample firms have complied with the CSR
regulation; thus, more than half of the sample firms were not in compliance with the regulation.
The yearly distribution of compliance with the CSR statute shows that only 28 percent, 47 percent
and 53 percent of the firms complied with the regulations in 2015, 2016 and 2017 respectively.
The average value of the logarithmic transformation of the CSR expenditure is 1.739 which is
equivalent to about Rs.56.61 million. The average (median) value of CGINDEX is 0.636 (0.60)
which implies that the average firm in our sample has more than three (0.636 X 5) out of the five
board attributes that are higher than the industry median. About 59.20 percent of the sample are
controlled and managed by families, 32.8 percent are affiliated with business groups and 5.90
percent of the sample are MNCs. On average, 10.71 percent is the average holding of institutional

19
investors. The mean (median) value of ROA is of 11.30 percent (10 percent). The mean values of
ADVINT and RDINT are, as a percentage of sales, respectively, 0.9 percent and 0.3 percent. The
CRATIO has a mean (median) value of 2.432 (1.432) and 23.2 percent of the sample firms are
audited by Big4 auditors.
[Insert Table 1 About Here]
Pearson/Spearman correlations among the variables are provided in Table 2. We find that
the variable of interest, CONKW is negatively correlated with CSRD (significant at the 0.05 level),
inconsistent with hypothesis 1. However, this correlation is not a measure of causal effect as it
may be subject to both sample selection bias and omitted variable bias which are addressed in our
multivariate analysis. Among the other variables, we observe a statistically significant correlation
between several variables. We test for multicollinearity using variance inflation factor (VIF) and
found it to be less than 5 in all the cases, suggesting that multicollinearity is not a serious concern
for our data (Myers and Myers 1990).
[Insert Table 2 About Here]
V. RESULTS
Before we discuss the results of hypothesis 1 on the relation between accounting
conservatism and CSR compliance, we first discuss the results of our first-stage model tabulated
in Appendix B. We report the results for each year separately, with column 4 reporting the results
for all years combined. As expected, the coefficients on the two exogenous variables, INDASSETS
and INDSALES are negative and positive, respectively and both are significant at the 0.05 level
across all columns except INDSALES is not significant in 2017. This shows that firms belonging
to industries with high average asset are less likely to comply with the CSR regulation whereas
firms in industries with high average sales are more likely to comply with the CSR regulation. The

20
results also indicate that FAMILY firms and firms affiliated with a BUSGROUP are more likely to
comply with the CSR expenditure requirement, whereas large firms, firms with high ADVINT,
RDINT, CRATIO, and ROA are less likely to comply with the CSR regulation. We next perform
an exclusion test to verify whether INDASSETS and INDSALES verify the exclusion criteria. Since
we have two exogenous variables for a single endogenous variable CSRD, we perform the Sargan
over-identification test by regressing the residuals from the second-stage estimation on the
exogenous variables and then performing a Wald test.9 The value of the test-statistic is 1.37 with
a p-value of 0.48, indicating that we cannot reject the null hypothesis that INDASSETS and
INDSALES are indeed exogenous to the second-stage model.
[Insert Appendix B About Here]
We report the results from the our second-stage model to study the effect of CSR
compliance on accounting conservatism in Table 3. In column 1 we report the base line estimation
where we have not controlled for the IMR. In columns 2-4 we include the IMR to correct for the
selection-bias. The specification in column 2 is used to test Hypothesis 1 on the causal effect of
CSR compliance on accounting conservatism. In columns 3 and 4 we include the interaction of
CSRD with CGINDEX and, separately, with FAMILY to test Hypotheses 2 and 3, respectively.
Finally, in column 5 we include both interaction variables together. We include fixed effects for
firm and year and standard errors are clustered at the firm-level.10
The results in column 1 indicate that when the selection bias is not corrected, the coefficient
on CSRD is not significant. In column 2, when the IMR is included, the coefficient on CSRD is
9 We perform the Sargan test to test the null hypothesis of validity of the over-identifying restriction by regressing (fixed effect regression) the error from the second stage model, which includes the IMR, on INDASSETS and INDSALES. The test statistics is #$% from the regression which follows a Chi square distribution with the degrees of freedom equal to the number of excluded variables minus the number of endogenous variables. 10 We obtain consistent results with bootstrap standard error.

21
0.9875 and significant at the 0.01 level, indicating that firms that comply with the mandatory CSR
regulation have higher conditional accounting conservatism. Specifically, firms that comply with
the CSR regulation have on average, 0.54 standard deviation higher conditional accounting
conservatism compared to firms that did not comply with the CSR regulation. Also, the coefficient
on the IMR is -0.690 and is significant at the 0.01 level, indicating a negative selection bias in the
effect of CSR on accounting conservatism. This finding is consistent with the notion that firms
with limited resources would restrain CSR spending but are incentivized to mitigate contracting
costs and adopt conservative reporting to appeal to capital providers.11 In summary, once we
control the negative selection effect, we find the causal effect of CSR to be positive on accounting
conservatism. Overall, the results are consistent with Hypothesis 1.
Turning to the results in column 3, we find that the effect of CSR compliance on accounting
conservatism is stronger for firms that have stronger governance as predicted in Hypothesis 2. The
coefficient on CSRD × CGINDEX is 0.3455 and significant at the 0.10 level. This finding is
consistent with the prior research that finds better governed firms have higher accounting
conservatism (Krishnan and Visvanathan 2008; Lara et al. 2009). In column 4, we find that the
coefficient on CSRD × FAMILY is -0.3483 and significant at the 0.01 level and supporting the
moderating role of family firms (Hypothesis 3). Prior research finds that family firms are more
conservative than non-family firms (Chen et al. 2014; Raithatha and Shaw 2019) and family firms
are less likely to engage in CSR (El Ghoul et al. 2016). Thus, the negative coefficient on CSRD ×
FAMILY is consistent with prior research. Specifically, we find that the effect of CSR on
accounting conservatism for FAMILY firm is 0.8617 (1.210 – 0.3483) which is smaller than the
11Note decreasing current year earnings by increasing conditional conservatism not only minimizes current year CSR burden but also future CSR burdens because the mandated CSR spending is based on average earnings over a three-year period.

22
effect on non-family firms (1.21). Results in column 5 indicate that when we include both the
interaction terms simultaneously, the interaction results continue to hold. Overall, the results
suggest that firms complying with the mandated CSR regulation have higher accounting
conservatism however this relation varies with the firm’s governance quality and the dominance
of the family through their board and management representation.
[Insert Table 3 About Here]
Robustness Analyses
The results in Table 3 indicate that our results are robust to controlling for sample selection
bias as well as firm fixed effects, mitigating the concern that our results may be driven by omitted
variables representing some time-invariant firm characteristics. In this section, we present the
results of additional robustness tests to address concerns about conservatism and CSR measures
and model specifications.
Alternate Measure of CSR Compliance
We re-estimate the models in Table 3 after replacing the CSRD dummy with a continuous
measure of CSR compliance, CSREXP, the logarithmic transformation of one plus the actual CSR
expenditure. Untabulated results indicate that the coefficient on CSREXP is positive and significant
at the 0.01 level when the IMR is not included. When the IMR is included, the coefficient on
CSREXP continues to be positive and significant (ß = 0.1825, p-value < 0.01) and the coefficient
on IMR is negative and significant. In terms of economic significance, one percentage increase in
CSR expenditure in log scale would increase conditional accounting conservatism by 0.1 standard
deviation. We also find that the coefficients on CSRD × CGINDEX and CSRD × FAMILY are,
respectively, positive and negative (both are significant at the 0.01 level). Overall, these findings

23
are consistent with the results in Table 3 and indicate that our results are robust to using a
continuous measure of CSR compliance.
Alternate Measure of Conditional Conservatism
We re-estimate the models in Table 3 using an alternate measure of conditional
conservatism based on Ball and Shivakumar (2005). Following, Khan and Watts (2009), Lee et
al. (2015), and Raithatha and Shaw (2019), we estimate conditional conservatism as a function of
firm-level variables, firm size (i.e., log of the market value of equity), market-to-book ratio, and
leverage and the results are in Table 4.12 We use both CSRD and CSREXP to measure CSR
compliance. Results indicate that after controlling for sample selection bias, the coefficient on CSR
is positive and significant at the 0.05 level for both measures of CSR compliance, consistent with
Hypothesis 1. In columns 3 and 8, the coefficients on CSR × CGINDEX are positive and significant
at the 0.01 level, consistent with Hypothesis 2. Similarly, the results in column 4 and 9 indicate
that the coefficients on CSR × FAMILY are negative and significant at the 0.01 level, consistent
with Hypothesis 3. The coefficients on the interaction variables continue to be significant in
columns 5 and 10. Overall, these results are consistent with the results in Table 3 and indicate that
our results are robust to an alternate measure of conditional conservatism.
[Insert Table 4 About Here]
Changes in CSR Compliance Analyses
To provide further evidence on the causal relationship between CSR compliance on
accounting conservatism, we measure the annual change in accounting conservatism following the
switch in the firm’s CSR compliance status from not meeting the CSR mandate in the previous
year to meeting the mandate in the present year or vice versa. In our sample period there were 365
12 The mean and median values of CONBS are, respectively, 0.32 and 0.30.

24
firms that switched their CSR expenditure from non-compliance in the previous year to compliance
in the present year and 100 firms from compliance to non-compliance. We perform two sets of
analyses.
First, we execute the first difference test where we compare the change in accounting
conservatism from year t-1 to t using the subsample of firms that changed their CSR compliance
(∆CSR) between the above two years, the results are provided in Table 5. We report the results of
the change in the CSR from non-compliance to compliance in columns 1 and 2 and the result for
firms changing their CSR status from compliance to non-compliance in columns 3 and 4. In
columns 1 and 3 the dependent variable is ∆CONKW and in columns 2 and 4 the dependent
variable is ∆CONBS. In all the estimations the control variables are also in terms of first difference
specifications. However, in all estimations we expect that the CSR compliance sub-samples are
not random, so to account for sample selection bias we include the IMR in all estimations. We find
that as firms change from non-compliance to CSR compliance, there is an increase in accounting
conservatism when conservatism is measured by CONKW (significant at the 0.05 level). However,
the coefficient on ∆CSR is not significant when conservatism is measured by CONBS. In contrast,
we find that as firms switch from compliance to non-compliance, there is a sharp fall in accounting
conservatism for both CONKW and CONBS (both are significant at the 0.05 level). Untabulated
results indicate that the coefficient on ∆CSR × CGINDEX is positive while the coefficient on ∆CSR
× FAMILY is negative and significant for firms switching from non-compliance to compliance and
conservatism and these findings hold for both measures of conservatism. However, the coefficients
on the interaction variables are not significant when CSR change is captured by firms switching
CSR regime from compliance to non-compliance. Overall, the above findings support the causal
relation between CSR compliance and accounting conservatism.

25
We next apply the difference-in-difference (D-i-D) method to compare the changes in
accounting conservatism between firms with changes in their CSR compliance status (treatment
firms) and firms that did not change their compliance status (control firms). We match firms that
switched their CSR compliance status either from non-compliance to compliance or vice versa
with firms that did not undergo any change in their CSR compliance status by industry and year.
The matching is performed using Mahalanobis distance matching (MDM) based on four firm-level
variables: LN(SALES), ROA, CRATIO and FCFLOW. We do one-to-one nearest neighbor match
without replacement. Out of the 365 firms that changed their CSR compliance status from non-
compliance to compliance, we are able to find 245 control firms that meet the above criteria
resulting in a total sample of 980 observations. Similarly, we are able to match 87 firms that
changed their CSR compliance status from compliance to non-compliance, resulting in a total
sample of 348 observations. The results of these analyses are provided in columns 5 through 8. In
columns 5 and 7 the dependent variable is CONKW while in columns 6 and 8 it is CONBS.
TREATMENT is an indicator variable that equals 1 if the firm has a change in CSR compliance
and 0 otherwise. CHANGE is an indicator variable that equals 1 for the period when there is a
change in CSR compliance and 0 otherwise. The coefficient on the variable of interest
TREATMENT × CHANGE represents the DiD effect of CSR compliance status on accounting
conservatism. We find that the coefficient on TREATMENT × CHANGE is positive and significant
for both measures of accounting conservatism for firms changing from non-compliance to
compliance (see columns 5 and 6). On the other hand, the coefficient is not significant in columns
7 and 8 for firms changing from compliance to non-compliance. Overall, results of the change
analyses in Table 5 indicate that accounting conservatism has increased for firms changing their

26
CSR status from non-compliance to compliance; there is also some support that accounting
conservatism has decreased for firms changing their status from compliance to non-compliance.
[Insert Table 5 About Here]
Impact of voluntary CSR spending on Accounting Conservatism
Our final robustness analysis is to exclude firms that engaged in CSR even before CSR
compliance was mandated. We perform two tests. First, we re-estimate our main analysis after
excluding firms that voluntarily engaged in CSR prior to the regulation. Untabulated results show
a significant positive relation between accounting conservatism and CSR compliance and this
relationship is stronger for firms with stronger corporate governance and weaker for family-
controlled firms. Second, we conduct a falsification test by estimating our models using data from
the period prior to the mandate. If our results are driven by the mandatory CSR compliance, then
results using pre-regulation data should be weaker or insignificant. To test this conjecture, we use
data from 2005 to 2013 and re-estimate our models. We use both an indicator variable for CSR
compliance as well as a continuous measure (CSR spending). Untabulated results indicate that
none of our variables of interest, including the interaction variables are significant. These findings
are a stark contrast to our findings based on data from the post-regulation period and support the
notion that our results are likely driven by the regulation mandating CSR compliance. Collectively,
the results from the above robustness analyses provide assurance that our results are robust to
alternate measures of CSR compliance, accounting conservatism and model specifications.
Cross-Sectional Analyses
Next, we discuss the results of several cross-sectional analyses that further explore the
relation between accounting conservatism and CSR compliance.

27
Positive vs. Negative CSR Compliance Motivated by McWilliams and Siegel (2001)’s argument that firms that voluntarily spend
on CSR over and above what is required by the law represents the conscious CSR effort, we re-
estimate our model to examine the effect of positive (spending more than the required amount) vs.
negative (spending less than the required amount) CSR compliance on accounting conservatism.
We segregate our total CSR expenditure into two variables. POSCSREXP is the log transformation
of one plus the excess of actual CSR spending over the mandated amount and NEGCSREXP is the
log transformation of the absolute deficit of the CSR spending over the mandated amount. We also
include interactions of these two variables with CGINDEX and FAMILY. We expect a positive
coefficient on POSCSREXP, i.e., the excess spending should have positive effect on the accounting
conservatism and a negative coefficient on NEGCSREXP. We estimate the models with the IMR.
Untabulated results indicate that consistent with our expectation, the coefficient on POSCSREXP
is positive and significant, suggesting that accounting conservatism is increasing in CSR spending
over and above the mandated requirement. On the other hand, the coefficient on NEGCSREXP is
not significant. We also find that the effect of voluntary CSR expenditure on accounting
conservatism is stronger for firms with stronger governance and this finding holds for both
measures of accounting conservatism. However, this finding does not hold when CSR spending
falls short of the mandated amount. In general, we did not find family firms to have any significant
effect on how CSR deviation from the mandated amount affect conditional conservatism except
when accounting conservatism is measured by CONBS. In short, these results show that the effect
of CSR compliance on accounting conservatism is primarily driven by firms voluntarily spending
on CSR over and above the legally mandated amount.

28
Effect of Industry Characteristics on the CSR-Conservatism Relationship
Prior research finds that industry characteristics influence firms’ CSR spending. We
examine whether our findings vary across industry characteristics. We classify industries into four
contextual categories based on pollution, competition, munificence, and dynamism. For each
category, we further partition the sample into two sub-categories (polluting vs. non-polluting,
competitive vs. non-competitive, high vs. low munificence, and high vs. low dynamism).13
Untabulated results indicate that in almost all the estimations the coefficient on CSRD is positive
and significant at the 0.05 level. In particular, the positive relation between CSR compliance and
accounting conservatism holds for non-polluting industries as well.
Relation Between Accounting Conservatism and Future CSR Spending
To provide further support for the burden containment explanation, we examine whether
there is a relation between accounting conservatism in the current period and next period CSR
spending. This analysis is motivated by the notion that if firms enhance accounting conservatism
in the current period in order to minimize future CSR spending, then we should observe a negative
13 Following the government of India classification, firms in metallurgy, chemical, petrochemical, coal, thermal power, building material, paper, brewing, pharmaceuticals, fermentation, textile, leather and mining are classified as polluting industries and firms in other industries are classified as non-polluting industry. We use the Herfindahl-Hirshman index (HHI) to calculate the industry level competition based on all the listed firms on BSE for each year separately and calculate the average HHI across years. We code industries whose HHI is below (above) the 25th (75th) percentile of the HHI distribution in a given year as a non-competitive (competitive) industry. Industry characterization based on availability of external resources and its volatility is an important contextual determinant of CSR expenditure of the firm (Chen et al. 2017). Managers of the firms operating in a high munificence environment have more discretion and power to undertake strategic decision and thus have more incentive to undertake CSR related activities (Lee et al. 2016). This is likely to result in higher accounting conservatism. On the other hand, the industry dynamism reflects high volatility and unpredictability in the external resource availability to the industry. Firms belonging to industry with high dynamism are likely to face lower likelihood of survival and higher variability of performance and are less likely to undertake CSR activities. Following Keats and Hitt (1988) and Palmer and Wiseman (1999) we measure industry munificence as five-year average industry sales growth. The sales growth was calculated in two steps. In the first step we estimated a five-year rolling regression of the logarithmic transformation of total industry sales on the index variable of year. In the second step we measure the industry munificence as the antilog of the regression coefficient. The industry dynamism is measured by the antilog of the standard error of the regression.

29
relation between accounting conservatism in year t and CSR spending in year t+1. The results of
this analysis are provided in Table 6. In columns 1 and 2, we do not include other control variables
but include them in columns 3 and 4. The dependent variable is CSREXPt+1 and as expected, the
coefficient on CSREXPt is positive and significant at the 0.01 level. Turning to the variable of
interest, the coefficient on CONKW is negative and significant at the 0.01 level in columns 1 and
3. Similarly, the coefficient on CONBS is also negative and significant at the 0.01 level in columns
2 and 4. Overall, these findings are consistent with the burden containment explanation, i.e.,
current period accounting conservatism appears to decrease CSR spending in the next period.
[Insert Table 6About Here]
High vs. Low Leverage Firms
We also perform a cross-sectional test to provide further support for the signalling to
capital providers explanation. We conjecture that the positive relation between accounting
conservatism and CSR compliance should be stronger (weaker) for the high (low) leverage firms
since these firms are likely to face higher (lower) contracting costs and hence, are motivated to
enhance accounting conservatism to allay concerns of capital providers who may not favourably
view the mandated CSR activities undertaken by these firms. We code HIGHLEV as 1 (0) for firms
that have leverage equal to or above (below) the median values of all firms listed on the BSE. We
reestimate our models with HIGHLEV, CSRD/CSREXP, and HIGHLEV × CSRD/CSREXP. If the
incentive to enhance accounting conservatism is primarily driven by debt contracting costs, the
coefficient on the interaction variable should be positive and significant. Untabulated results
indicate that, consistent with the results in Table 3, the coefficients on the CSR compliance
variables continue to be positive and significant at the 0.01 level. The coefficient on HIGHLEV is
positive and significant at the 0.01 level, indicating that accounting conservatism is higher for

30
firms with high leverage relative to firms with low leverage, consistent with prior research.
However, the coefficient on the interaction variable is negative and significant at the 0.01 level,
indicating that the relation between CSR compliance and accounting conservatism is lower for
high leverage firms than low leverage firms. These findings hold for both measures of CSR
compliance and accounting conservatism. These findings are inconsistent with the notion that the
increase in accounting conservatism due to CSR compliance is driven by debt contracting costs.
Thus, the results in Table 6 suggest that our results are primarily driven by the burden containment
explanation rather than the signal to capital providers explanation.
Relation between Negative Discretionary Accruals and CSR Spending
Similar to adopting conservative accounting policies, firms could also recognize income-
decreasing discretionary (abnormal) accruals to contain the costs of CSR compliance. If this is the
case, we predict a positive relation between CSRD compliance and the magnitude of income-
decreasing discretionary accruals but not income-increasing discretionary accruals. We use the
modified Jones model to estimate the discretionary accruals and the results are in Table 7. The
dependent variables are NEGDACC (the absolute value of income-decreasing discretionary
accruals) and POSADCC (income-increasing discretionary accruals). We find that the coefficients
on CSRD and CSREXP, the variables of interest are positive (see columns 1 and 3) and significant
at the 0.05 level, consistent with our prediction. However, the coefficients on the variables of
interest are not significant in columns 2 and 4 where the dependent variable is POSADCC. In short,
these results are consistent with the notion that firms that are complying with CSR have higher
income-decreasing discretionary accruals but not income-increasing discretionary accruals. These
findings are consistent with the burden containment explanation. These findings are also consistent

31
with Rajgopal and Tantri (2018) that the Companies Act 2013 reduced firms’ intrinsic motivation
to spend on CSR, especially for those that voluntarily engaged in CSR before the mandate.
[Insert Table 7 About Here]
VI. CONCLUSIONS
Taking advantage of India’s Companies Act of 2013 which mandates certain firms to
comply with CSR spending, we examine the link between accounting conservatism and CSR
compliance. We find that conditional conservatism is increasing in CSR compliance and this
relation is stronger for firms that have stronger governance and weaker for family firms. We also
find that CSR compliance is associated with higher income-decreasing discretionary accruals but
not income-increasing discretionary accruals. Overall, the findings are consistent with firms
strategically enhancing accounting conservatism to decrease earnings used to minimize CSR
compliance costs. Our findings are robust to controlling for sample selection bias and other
sensitivity checks.
We make two contributions to the literatures on CSR and accounting conservatism. First,
while there is some prior research on the relation between CSR and financial reporting, including
accounting conservatism, much of this research examines voluntary CSR compliance. By
examining a setting where CSR compliance is mandated, our study provides empirical evidence
on the causal relation between CSR compliance and conditional accounting conservatism.
Second, our findings highlight the roles of the strong corporate governance and family
ownership in determining the relationship between CSR and accounting policy. We provide
evidence that stronger boards enhance the positive relation between CSR compliance and
accounting conservatism. On the other hand, we find that CSR compliance increased conditional
accounting conservatism less for family firms relative to non-family firms. These findings are

32
potentially important in a growing economy like India where, traditionally, the corporate sector is
dominated by family firms which are more opaque and less inclined to divulge proprietary
information to the market.
Our findings have important implications for regulators and policy makers in India and
elsewhere as well as investors and others. The finding that current period accounting conservatism
is negatively related to next period CSR spending should be a concern to regulators and policy
makers who may have intended to increase CSR activities by Indian firms. On the contrary, our
results suggest that firms use accounting policies and negative accruals strategically to mitigate
the costs of mandatory CSR compliance. These findings are also relevant to regulators in other
jurisdictions that are considering legislation on CSR.14 Overly conservative financial reporting
policies could also mask a firm’s actual underlying economic performance and thus, have
important implications for creditors, investors, and financial analysts. Similarly, auditors should
be concerned about attempts by firms to minimize CSR spending by engaging in income-
decreasing earnings management. Future research could examine whether firms engage in real
earnings management activities in addition to conservative financial reporting to mitigate CSR
compliance costs. Also, future research could examine whether the mandatory CSR spending
affects creditors’ perceptions and cost of debt.
14In the last decade, a number of countries, such as Indonesia, Denmark, France, Philippines, Spain, Argentina, Brazil, Norway, European Union, and India have introduced regulation on CSR (Gatti et al. 2018).

33
REFERENCES
Afsharipour, A. and S. Rana. 2014. The emergence of new corporate social responsibility regimes in China and India. UC Davis Business Law Journal 14:175. Ali, A., T.Y. Chen, and S. Radhakrishnan. 2007. Corporate disclosures by family firms. Journal of Accounting and Economics 44 (1-2): 238-286. Allen, F., R. Chakrabarti, S. De., J. Qian, and M. Qian. 2012. Financing firms in India. Journal of Financial Intermediation. 21 (3): 409–445. Andres, P. D. and E. Vallelado. 2008. Corporate governance in banking: The role of the board of directors. Journal of Banking and Finance. 32 (12): 2570–2580. Arora, P. and R. Dharwadkar. 2011. Corporate governance and corporate social responsibility (CSR): The moderating roles of attainment discrepancy and organization slack. Corporate Governance: An International Review 19 (2):136–152. Arora, R. and D. Sikarwar. 2016. 100 companies get government notice on CSR spend. The Economic Times, 16. Ashwin, A.S., R.T. Krishnan, and George, R. 2015. Family firms in India: Family involvement, innovation and agency and stewardship behaviors. Asia Pacific Journal of Management 32 (4): 869-900. Bakar, I. S. A., A. Khan, P. Mather, and G. Tanewski. 2018. Corporate boards and performance pricing in private debt contracts. Pacific-Basin Finance Journal 50: 144–162. Ball, R. and L. Shivakumar. 2005. Earnings quality in UK private firms: comparative loss recognition timeliness. Journal of Accounting and Economics 39 (1): 83–128. Basu, S. 1997. The conservatism principle and the asymmetric timeliness of earnings. Journal of Accounting and Economics. 24 (1): 3–37. Basu, S. 2005. Discussion of “Conditional and unconditional conservatism: Concepts and modeling.” Review of Accounting Studies 10: 311-321. Beekes, W. and P. Brown. 2006. Do better-governed Australian firms make more informative disclosures? Journal of Business Finance and Accounting 33 (3): 422–450. Berrone, P., C., Cruz, L. R. G. Mejia, and M. Larraza-Kintana. 2010. Socioemotional wealth and corporate responses to institutional pressures: Do family-controlled firms pollute less? Administrative Science Quarterly 55: 82–113.

34
Berrone, P., C. Cruz, and L. R. Gomez-Mejia. 2012. Socio emotional wealth in family firms: Theoretical dimensions, assessment approaches, and agenda for future research. Family Business Review. 25 (3): 258–279. Bhaumik, S. K., N. Driffield, and S. Pal. 2010. Does ownership structure of emerging-market firms affect their outward FDI? The case of the Indian automotive and pharmaceutical sectors. Journal of International Business Studies. 41 (3): 437–450. Boehe, D. M., and L. B. Cruz. 2010. Corporate social responsibility, product differentiation strategy and export performance. Journal of Business Ethics. 91 (2): 325–346. Bozec, R. and Y. Bozec. 2012. The use of governance indexes in the governance-performance relationship literature: International evidence. Canadian Journal of Administrative Sciences. 29 (1): 79–98. BusinessLine. 2019. Govt introduces bill to amend companies law in LS. Available at https://www.thehindubusinessline.com/companies/govt-introduces-bill-to-amend-companies-law-in-ls/article28709900.ece. Callen, J. L., Y. Dou, and B. Xin. 2016. Accounting conservatism and performance covenants: A signaling approach. Contemporary Accounting Research. 33 (3): 961–988. Calza, F., G. Profumo, and I. Tutore. 2016. Corporate ownership and environmental proactivity. Business Strategy and the Environment, 25 (6): 369–389. Cennamo, C., C. Cruz, P. Berrone, and L. Gomez-Mejia. 2012. Socioemotional Wealth and Proactive Stakeholder Engagement: Why Family-Controlled Firms Care More About Their Stakeholders. Entrepreneurship Theory and Practice. 36: 1153–1173. Chan, M.C., J. Watson, and D. Woodliff. 2014. Corporate governance quality and CSR disclosures. Journal of Business Ethics. 125: 59–73. Chen, K. Y., R. J. Elder, and Y. M. Hsieh. 2007. Corporate governance and earnings management: The implications of corporate governance best-practice principles for Taiwanese listed companies. Journal of Contemporary Accounting and Economics. 3(2): 73–105. Chen, Zeng, Lin, and Ma. 2017. Chen, S., X. Chen, and Q. Cheng. 2014. Conservatism and equity ownership of the founding family. European Accounting Review. 23 (3): 403-430. Chen, Y.C., M. Hung, and Y. Wang. 2018. The effect of mandatory CSR disclosure on firm profitability and social externalities: Evidence from China. Journal of Accounting and Economics. 65 (1): 169–190.

35
Cheng, C. L. and F. H. Kung. 2016. The effects of mandatory corporate social responsibility policy on accounting conservatism. Review of Accounting and Finance. 15 (1): 2–20. Chhabra, E. 2014. Corporate social responsibility: should it be a law? Available at https://www.forbes.com/sites/eshachhabra/2014/04/18/corporate-social-responsibility-should-it-be-a-law/ Chih, H.L., C.H. Shen, and F.C., Kang. 2008. Corporate social responsibility, investor protection, and earnings management: Some international evidence. Journal of Business Ethics, 79 (1-2): 179-198. Cordeiro, J. J. and M. Tewari. 2015. Firm characteristics, industry context, and investor re- actions to environmental CSR: A stakeholder theory approach. Journal of Business Ethics. 130 (4): 833–849. Cordeiro, J. J., A. Galeazzo, T. S. Shaw, R. Veliyath, and M. K. Nandakumar. 2018.Ownership influences on corporate social responsibility in the Indian context. Asia Pacific Journal of Management. 35 (4): 1107–1136. Cruz, C., M. Lazarra-Kintana, L. Garces-Galdeano, and P. Berrone. 2014. Are Family Firms Really More Socially Responsible? Entrepreneurship Theory and Practice. 38: 1295–1316. Delmas and Toffel. 2008. Desai, M. A., and D. Dharmapala. 2006. Corporate tax avoidance and high-powered incentives. Journal of Financial Economics 79 (1): 145–179. Dharmapala, D. and V. Khanna. 2018. The impact of mandated corporate social responsibility: Evidence from India’s Companies Act of 2013. International Review of Law and Economics 56: 92-104. Donaldson, T. and L. E. Preston. 1995. The stakeholder theory of the corporation: Concepts, evidence, and implications. Academy of Management Review 20: 65–91. Donker, H. and S. Zahir. 2008. Towards an impartial and effective corporate governance rating system. Corporate Governance: The International Journal of Business in Society 8 (1): 83–93. Dustmann, C. and M.E. Rochina-Barrachina, 2007. Selection correction in panel data models: An application to the estimation of females' wage equations. The Econometrics Journal 10 (2): 263-293. Dyer, W. G. and D. A. Whetten. 2006. Family Firms and Social Responsibility: Preliminary Evidence from the S&P 500. Entrepreneurship Theory and Practice 30 (6): 785–802. El Ghoul, S., O. Guedhami, H. Wang, and C. C. Y. Kwok. 2016. Family control and corporate social responsibility. Journal of Banking and Finance 73: 131-146.

36
Fang, J., L. He, and T. S. Shaw. 2018. The effect of external auditors on managerial slack. Accounting Horizons 32 (4): 85–115. Francis, R., J. Mattingly, S. Harrast, and L. Olsen. 2013. The Relation between accounting conservatism and corporate social performance: An empirical investigation. Business and Society Review 118 (2): 193–222. Freeman, R.E., 2010. Strategic Management: A Stakeholder Approach. Cambridge University Press. Gatti, L., B. Vishwanath, P. Seele, and B. Cottier. 2018. Are we moving beyond voluntary CSR? Exploring theoretical and managerial implications of mandatory CSR resulting from the New Indian Companies Act. Journal of Business Ethics.: 1–12. Gelb, D.S. and J.A. Strawser. 2001.Corporate social responsibility and financial disclosures: An alternative explanation for increased disclosure. Journal of Business Ethics 33 (1): 1–13. Gomez-Mejia. 2011. Gormley, T. A., B. H. Kim, and X. Martin. 2011. Do firms adjust their timely loss recognition in response to changes in the banking industry? Journal of Accounting Research 50 (1): 159–196. Gul, F.A. and A.C. Ng. 2017. Agency Costs of free cash flow and investments in business sustainability. Available at SSRN: https://ssrn.com/abstract=3003629 or http://dx.doi.org/10.2139/ssr n.3003629. Harjoto, M. and H. Jo. 2011. Corporate governance and CSR nexus. Journal of Business Ethics 100: 45–67. Hawas, A. and C.B. Tse. 2016. How corporate governance affects investment decisions of major shareholders in UK listed companies: has the recent credit crunch changed the game? Journal of Accounting, Auditing and Finance 31 (1): 100–133. Heckman, J. J. 1979. Sample selection bias as a specification error. Econometrica: Journal of the Econometric Society 47 (1): 153–161. Hillman, A.J., A.A. Cannella, and R.L. Paetzold, 2000. The resource dependence role of corporate directors: Strategic adaptation of board composition in response to environmental change. Journal of Management studies, 37 (2): 235-256. Hong, Y. and M. L. Andersen. 2011. The relationship between corporate social responsibility and earnings management: An exploratory study. Journal of Business Ethics 104 (4): 461–471. Jensen, M.C. 2002. Value maximization, stakeholder theory and the corporate objective function. Sheffield, UK. Greenleaf Publishing.

37
Kapoor, G.K., and S. Dhamija. 2017. Mandatory CSR spending—Indian experience. Emerging Economy Studies 3 (1): 98-112. Keats, B. W. and M. A. Hitt. 1988. A causal model of linkages among environmental dimensions, macro organizational characteristics, and performance. Academy of Management Journal 31 (3): 570-598. Khan, M. and R. L. Watts. 2009. Estimation and empirical properties of a firm-year measure of accounting conservatism. Journal of Accounting and Economics. 48 (2-3): 132–150. Kim, H., H. Kim, and P.M. Lee. 2008. Ownership structure and the relationship between financial slack and R&D investments: Evidence from Korean firms. Organization Science 19 (3): 404– 418. Kim, Y., M. S. Park, and B. Wier. 2012. Is earnings quality associated with corporate social responsibility? The Accounting Review. 87 (3): 761–796. King, M. R. and E. Santor. 2008. Family values: Ownership structure, performance and capital structure of Canadian firms. Journal of Banking & Finance 32 (11): 2423-2432. KPMG 2017. India’s CSR reporting survey 2017 Available at: https://home.kpmg/in/en/home/insights/2018/01/csr-companies-act-2013-corporate-affairs-sebi.html (accessed on August 13, 2019) Krishnan, G.V., and G. Visvanathan. 2008. Does the SOX definition of an accounting expert matter? The association between audit committee directors' accounting expertise and accounting conservatism. Contemporary Accounting Research 25 (3): 827-858. Krishnan, G. and M. Peytcheva. 2019. The risk of fraud in family firms: Assessments of external auditors. Journal of Business Ethics 157 (1): 261-278. LaFond, R. and R.L. Watts. 2008. The information role of conservatism. The Accounting Review. 83 (2): 447–478. Lara, J. M. G., B. G. Osma, and F. Penalva. 2009. Accounting conservatism and corporate governance. Review of Accounting Studies. 14(1): 161–201. Lee, H. S., X., and H. Sami. 2015. Conditional conservatism and audit fees. Accounting Horizons. 29 (1): 83–113. Lee, K. H., B. C. Cin, and E. Y. Lee. 2016. Environmental responsibility and firm performance: the application of an environmental, social and governance model. Business Strategy and the Environment 25 (1): 40-53. Lennox, C. S., J. R. Francis, and Z. Wang. 2011. Selection models in accounting research. The Accounting Review. 87 (2): 589–616.

38
Li, W., and R. Zhang. 2010. Corporate social responsibility, ownership structure, and political interference: Evidence from China. Journal of Business Ethics 96 (4): 631–645. Li, X. 2015. Accounting conservatism and the cost of capital: An international analysis. Journal of Business Finance and Accounting 42(5-6): 555–582. Litt, B., D. Sharma, and V. Sharma. 2013. Environmental initiatives and earnings management. Managerial Auditing Journal 29 (1): 76–106. Liu, Q. and Lu, Z. J. 2007. Corporate governance and earnings management in the Chinese listed companies: A tunneling perspective. Journal of Corporate Finance 13 (5): 881–906. Luo, X. R., D. Wang, and J. Zhang. 2017. Whose call to answer: Institutional complexity and firms’ CSR reporting. Academy of Management Journal 60(1): 321–344. Mason, C. and, J. Simmons. 2011. Forward looking or looking unaffordable? Utilising academic perspectives on corporate social responsibility to assess the factors influencing its adoption by business. Business Ethics: A European Review 20 (2): 159-176. Manchiraju, H. and S. Rajgopal. 2017. Does corporate social responsibility (CSR) create share- holder value? Evidence from the Indian Companies Act 2013. Journal of Accounting Research 55 (5): 1257-1300. Martinez-Ferrero, J., I. Garcia-Sanchez, and B. Cuadrado-Ballesteros. 2015. Effect of financial reporting quality on sustainability information disclosure. Corporate Social Responsibility and Environmental Management 22 (1): 45–64. McWilliams, A. and D. Siegel. 2001. Corporate social responsibility: A theory of the firm perspective. Academy of Management Review 26 (1): 117–127. McWilliams, A., D. S. Siegel, and P. M. Wright. 2006. Corporate social responsibility: Strategic implications. Journal of Management Studies 43 (1): 1–18. Mukherjee, A., R. Bird, and G. Duppati. 2018. Mandatory corporate social responsibility: The Indian experience. Journal of Contemporary Accounting and Economics 14 (3): 254–265. Myers, R.H. and R.H. Myers. 1990. Classical and Modern Regression with Applications (Vol. 2). Belmont, CA: Duxbury press. Narayanan, V. 2015. Export barriers for small and medium-sized enterprises: A literature review based on Leonidou’s model. Entrepreneurial Business and Economics Review 3 (2): 105–123. Palmer, T. B. and R. M. Wiseman. 1999. Decoupling risk taking from income stream uncertainty: A holistic model of risk. Strategic Management Journal 20 (11): 1037-1062.

39
Pattnaik, C., J. J. Chang, and H. H. Shin. 2013. Business groups and corporate transparency in emerging markets: Empirical evidence from India. Asia Pacific Journal of Management 30 (4): 987–1004. Post, J.E., L.E. Preston, and S. Sauter-Sachs. 2002. Redefining The Corporation: Stakeholder Management and Organizational Wealth. Stanford University Press. Radhakrishnan, S., K. Wang, and Z. Wang. 2018. Stakeholder orientation and accounting conservatism: evidence from a natural experiment. Working paper, University of Texas at Dallas. Rajgopal, S., and P. Tantri. 2018. Does mandated corporate social responsibility reduce intrinsic motivation? Evidence from India. Working paper, Columbia University. Raithatha, M. and T. S. Shaw. 2019. Do family firms choose conservative accounting practices? The International Journal of Accounting, forthcoming. Sarkar, J., S. Sarkar, and K. Sen. 2008. Board of directors and opportunistic earnings management: evidence from India. Journal of Accounting, Auditing and Finance 23 (4): 517–551. Scholtens, B. and F. C. Kang. 2013. Corporate social responsibility and earnings management: Evidence from Asian economies. Corporate Social Responsibility and Environmental Management. 20 (2): 95–112. Sharma, P. and P. G. Irving. 2005. Four bases of family business successor commitment: antecedents and consequences. Entrepreneurship Theory and Practice 29 (1): 13–33. Shaw, T. S., J. J. Cordeiro, and P. Saravanan. 2016. Director network resources and firm performance: evidence from Indian corporate governance reforms. Asian Business and Management 15 (3): 165–200. Singh, N., S. Jain, and P. Sharma. 2014. Determinants of proactive environmental management practices in Indian firms: an empirical study. Journal of Cleaner Production 66: 469–478. Vig, V. 2013. Access to collateral and corporate debt structure: Evidence from a natural experiment. Journal of Finance 68 (3): 881–928. Voss et al. 2008. Vural, D., 2018. Disclosure practices by family firms: Evidence from Swedish publicly listed firms. Accounting in Europe 15 (3): 347-373. Watts, R. L. 2003. Conservatism in accounting part I: Explanations and implications. Accounting Horizons. 17 (3): 207–221.

40
Witt, M.A. and G. Redding. 2013. Asian business systems: Institutional comparison, clusters and implications for varieties of capitalism and business systems theory. Socio-Economic Review 11 (2): 265-300. White Andrew. 2014.India CSR law could open door to fraud, says Ratan Tata, Philanthropy Age (02 February2014) Available at: http://www.philanthropyage.org/society/india-csr-law-could-open-door-fraud-says-ratan-tata Wooldridge, J. M. 1995. Selection corrections for panel data models under conditional mean independence assumptions. Journal of Econometrics 68 (1): 115–132. Xu, E., H. Yang, J. M. Quan, and Y. Lu. 2015. Organizational slack and corporate social performance: Empirical evidence from China’s public firms. Asia Pacific Journal of Management 32 (1): 181–198. Yang, M. L. 2010. The impact of controlling families and family CEOs on earnings management. Family Business Review 23: 266-279. Zhang, J. 2008. The contracting benefits of accounting conservatism to lenders and borrowers. Journal of Accounting and Economics 45 (1): 27–54.

41
Appendix A Variable Definitions
ADVINT Advertising expenses divided by total sales; BIG4 An indicator variable that equals 1 if firm is audited by one of the big4 auditor, 0
otherwise; BODATTEND The natural logarithm of average attendance by board members; BODINDEP The proportion of independent directors on the board of directors; BODSIZE The natural logarithm of board size; BTD Book-tax difference based on Desai and Dharmapala (2006); BUSGROUP An indicator variable that equals 1 if firm is affiliated to business group, 0 otherwise; CAPEX Capital expenditure during the year divided by total assets; CEODUAL An indicator variable that equals 1if the CEO act as a chairperson, 0 otherwise; CFO Cash from operations scaled by total assets; CHANGE An indicator variable that equals 1 for the period when there is a change in CSR
compliance, 0 otherwise; CGINDEX A composite governance index based on five board attributes, board size, board
independence, board attendance, outside directorship, and CEO duality. We first determine the industry-year median for the above variables and code these variables as 1 if the value pertaining to a firm in a given year is higher than the industry-year median, 0 otherwise. For CEO duality, we code 1 if the CEO and the Chairman of the board are different and 0 otherwise. Next, we construct CGINDEX as the average of the five binary variables constructed in the previous step. CGINDEX takes the value between 0 to 1 and higher the value of CGINDEX, stronger is the firm’s governance in the industry for the given year.
CONKW 3-year average of conditional conservatism based on Khan and Watts (2009); CONBS 3-year average of conditional conservatism based on Ball and Shivakumar (2005); CRATIO Current assets divided by current liabilities; CSRD An indicator variable that equals 1 if a firm’s CSR spending is equal to or more than the
mandatory requirement, 0 otherwise; CSREXP The natural logarithm of (1+ actual CSR spending); ∆CSR An indicator variable that equals 1 if there is a change in the firm’s CSR compliance
status (from compliance to non-compliance or vice-versa), 0 otherwise; FAMILY An indicator variable that equals 1 for firms that are family controlled and family
managed. We code a firm to be family controlled if two of the following three conditions are satisfied: (1) the promoters had a stake of 20 percent or greater in the firm; (2) a member of the promoter family was on the board of the firm; and/or (3) a member of the promoter family was the chairperson of the board; otherwise it was coded 0. We code a firm to be family managed if they satisfy any two of the following conditions: (1) a promoter or promoter’s family member was the CEO of the firm; (2) a promoter or promoter family was an executive director; and/or (3) more than one member of the promoter family were executive directors (Singh et al. 2014);
FCFLOW Earnings before interest and tax minus change in capital expenditure; INDASSETS The average assets of the industry of the focal firm in a given year;

42
INDSALES The average sales of the industry of the focal firm in a given year; INSTHOLDG The percentage of shareholdings by institutional investors; LN(AGE) The natural logarithm of firm age since incorporation; LN(SALES) The natural logarithm of total sales; MNC An indicator variable that equals 1 if firm is affiliated to multinational corporations, 0
otherwise; NEGDACC The absolute value of income-decreasing discretionary accruals estimated from the
modified Jones model; NEGCSREXP The natural logarithm of (1+ the deficit of the actual CSR spending less the mandated
amount); OUTDIRECT The natural logarithm of average outside directorship; POSCSREXP The natural logarithm of (1+ the excess of the actual CSR spending over the mandated
amount); POSDACC Income-increasing discretionary accruals estimated from the modified Jones model; RDINT The proportion of research and development expenses scaled by total sales; ROA Return on assets calculated as earnings before interest and tax scaled by total assets; and TREATMENT An indicator variable that equals 1 if the firm has made a change in CSR compliance.

43
Appendix B Predicting CSR Spending
CSRD
2015 2016 2017 All Years VARIABLES (1) (2) (3) (4) INDASSETS -0.3061*** -0.2603*** -0.1858** -0.2224***
(0.102) (0.100) (0.094) (0.057) INDSALES 0.2199** 0.2536** 0.0464 0.1436**
(0.100) (0.104) (0.101) (0.057) CGINDEX 0.1303 -0.1351 -0.0232 -0.0174
(0.200) (0.195) (0.187) (0.110) FAMILY 0.1611* 0.1652* 0.0001 0.0999**
(0.093) (0.086) (0.084) (0.050) FCFLOW 1.4876* 0.9646 -0.5427 0.1504
(0.768) (0.655) (0.492) (0.339) MNC 0.1868 -0.1016 -0.1158 -0.0501
(0.201) (0.193) (0.194) (0.112) BIG4 -0.1472 -0.0443 0.0488 -0.0436
(0.119) (0.105) (0.107) (0.063) BUSGROUP 0.2801*** 0.1695* 0.0783 0.1748***
(0.099) (0.091) (0.090) (0.054) CRATIO -0.0751*** -0.0464*** -0.0052 -0.0250***
(0.020) (0.014) (0.010) (0.006) ADVINT -2.4746** -3.7778*** 0.0931 -2.1975***
(1.167) (1.230) (2.064) (0.675) LN(SALES) -0.3508*** -0.4521*** -0.2872*** -0.3388***
(0.047) (0.047) (0.043) (0.025) ROA -2.2973** -1.9352** 0.1648 -0.7780*
(0.999) (0.850) (0.636) (0.439) LN(AGE) 0.0030 0.0030 0.0023 0.0024**
(0.003) (0.002) (0.002) (0.001) RDINT -4.8930 -11.8743** -4.0239 -7.2789***
(5.379) (4.717) (4.696) (2.802) INSTHOLDG -0.0181*** -0.0219*** -0.0244*** -0.0220***
(0.005) (0.004) (0.004) (0.002) BTD -0.9899 0.6637 -2.3348* -0.6655
(1.410) (0.994) (1.292) (0.656) 2016 0.2912***

44
(0.062) 2017 0.3573***
(0.063) Constant 2.5666*** 3.0612*** 2.9138*** 2.3956***
(0.727) (0.680) (0.661) (0.389)
Observations 1,092 1,109 1,102 3303 This table presents the results of a regression of CSR compliance on the determinants of CSR compliance for a sample of Indian firms representing years 2015 through 2017. CSRD equals 1 if a firm’s CSR spending is equal to or more than the mandatory requirement, 0 otherwise. See Appendix B for variable definitions. Robust standard errors are in parentheses clustered at the level of firms. ***, **, and * indicate, respectively, statistical significance at the 0.01, 0.05, and 0.10 levels. An indicator variable that equals 1 if a

45
Table 1 Descriptive Statistics
N Mean P25 Median P75 Min Max S. D.
CONKW 3303 1.966 0.409 1.521 3.134 -3.575 7.597 1.836 CSRD 3303 0.424 0 0 1 0 1 0.494 CSREXP 3303 1.739 0.095 1.361 2.681 0 8.937 1.703 CGINDEX 3303 0.636 0.4 0.6 0.8 0 1 0.23 FCFLOW 3303 0.094 0.049 0.091 0.138 -0.522 0.581 0.099 FAMILY 3303 0.592 0 1 1 0 1 0.492 MNC 3303 0.059 0 0 0 0 1 0.235 BIG4 3303 0.232 0 0 0 0 1 0.422 BUSGROUP 3303 0.328 0 0 1 0 1 0.47 CRATIO 3303 2.432 1.045 1.432 2.329 0.028 90 4.482 ADVINT 3303 0.009 0 0 0.004 0 1 0.036 LN(SALES) 3303 8.707 7.669 8.697 9.783 -2.303 12.262 1.627 ROA 3303 0.113 0.064 0.1 0.146 -0.311 0.571 0.079 LN(AGE) 3303 17.709 3.401 4.19 29 1.946 96 20.686 RDINT 3303 0.003 0 0 0.002 0 0.059 0.009 INSTHOLDG 3303 10.711 0.12 5.08 17.3 0 93.47 13.353 BTD 3303 0.02 0.002 0.015 0.033 -0.323 0.298 0.036
This table presents the descriptive statistics for a sample of Indian firms representing years 2015 through 2017. See Appendix B for variable definitions.

46
Table 2 Correlations
Variables 1 2 3 4 5 6 7 8 9 10 11 12 13 14 15 16 CSRD [1] 1 CONKW [2] -0.11* 1 CSREXP [3] 0.37* -0.16* 1 CGINDEX [4] 0.07* -0.05* 0.27* 1 FCFLOW [5] 0.03* -0.11* 0.13* -0.04* 1 FAMILY [6] 0.00 0.05* -0.11* 0.05* -0.01 1 MNC [7] -0.02 -0.08* 0.03 -0.10* 0.08* -0.19* 1 BIG4 [8] 0.05* -0.12* 0.27* 0.09* 0.09* -0.16* 0.24* 1 BUSGROUP [9] 0.09* 0.01 0.14* 0.16* -0.08* -0.02 -0.17* 0.11* 1 CRATIO [10] 0.00 -0.18* -0.02 -0.06* 0.05* -0.07* 0.06* 0 -0.06* 1 ADVINT [11] 0.03 -0.06* 0.05* 0.03 0.10* 0.02 0.02 0.07* 0.01 -0.02 1 LN(SALES) [12] 0.04* 0.10* 0.61* 0.28* 0.03 -0.05* 0.03 0.22* 0.18* -0.25* -0.13* 1 ROA [13] 0.04* -0.13* 0.22* -0.01 0.75* -0.02 0.09* 0.12* -0.07* 0.08* 0.14* 0.11* 1 LN(AGE) [14] 0.10* -0.22* 0.12* 0.03 0.03 -0.02 0.10* 0.09* 0.08* 0.07* 0 0.06* 0.03 1 RDINT [15] 0.01 -0.05* 0.17* 0.08* 0.07* -0.01 0.02 0.09* 0.01 -0.01 -0.01 0.12* 0.12* 0 1 INSTHOLDG [16] 0.01 -0.11* 0.52* 0.25* 0.05* -0.08* 0.02 0.28* 0.13* -0.05* 0.06* 0.54* 0.11* 0.03 0.16* 1 BTD [17] 0.03* -0.07* 0.19* 0.04* 0.24* -0.01 0.02 0.09* 0.07* 0.02 0.03 0.12* 0.34* 0.07* 0.21* 0.13* This table presents the Pearson correlations among the variables used in the study.

47
Table 3 The Relation Between Accounting Conservatism and CSR Compliance
(1) (2) (3) (4) (5) VARIABLES CONKW CONKW CONKW CONKW CONKW
CSRD 0.0801 0.9875*** 0.7694*** 1.2100*** 0.9679***
(0.063) (0.132) (0.182) (0.202) (0.216) CSRD × CGINDEX 0.3455* 0.3680*
(0.208) (0.222) CSRD × FAMILY -0.3483*** -0.3503**
(0.130) (0.136) CGINDEX -0.1822 -0.1791 -0.3281 -0.1671 -0.3322*
(0.157) (0.190) (0.216) (0.179) (0.172) FAMILY -0.0422 -0.0510 -0.0465 0.0736 0.0822
(0.127) (0.152) (0.167) (0.166) (0.205) FCFLOW 0.3873 0.1918 0.1879 0.1991 0.1913
(0.468) (0.553) (0.533) (0.670) (0.538) MNC -1.1029** -1.0194*** -1.0530*** -0.9865** -1.2588***
(0.489) (0.349) (0.364) (0.383) (0.346) BIG4 -0.0044 -0.0037 -0.0006 -0.0198 -0.0173
(0.220) (0.265) (0.258) (0.259) (0.227) BUSGROUP -0.0158 -0.0573 -0.0513 -0.0627 -0.0584
(0.133) (0.089) (0.120) (0.115) (0.089) CRATIO 0.0424*** 0.0496*** 0.0491*** 0.0491*** 0.0485***
(0.013) (0.013) (0.014) (0.013) (0.013) ADVINT -7.9026* -7.6872 -7.9091 -8.3480 -8.5369
(4.583) (5.220) (5.114) (5.130) (7.800) LN(SALES) 0.2654*** 0.3338*** 0.3341*** 0.3361*** 0.3363**
(0.074) (0.107) (0.092) (0.100) (0.128) ROA -4.0298*** -3.5798*** -3.5655*** -3.6268*** -3.6620***
(0.738) (0.710) (0.666) (1.011) (0.723) LN(AGE) -0.0020 -0.0024* -0.0025 -0.0023 -0.0024
(0.002) (0.001) (0.002) (0.002) (0.002) RDINT -9.2447 -8.8513 -8.5010 -9.2662 -8.9761
(12.903) (13.157) (14.445) (13.919) (10.304) INSTHOLDG 0.0014 0.0076 0.0074 0.0082 0.0079
(0.007) (0.008) (0.010) (0.009) (0.010) BTD 4.8933*** 4.9594*** 4.9280*** 4.8586*** 4.8609***
(1.105) (0.892) (0.919) (1.180) (1.233)

48
IMR - -0.6900*** -0.6922*** -0.6997*** -0.6947***
- (0.092) (0.105) (0.118) (0.110) Constant 1.5965** 0.6404 0.7297 0.5488 0.6684
(0.654) (0.869) (0.800) (0.850) (1.108)
Firm FE Yes Yes Yes Yes Yes Year FE Yes Yes Yes Yes Yes Observations 3,303 3,303 3,303 3,303 3303 R-squared 0.658 0.666 0.666 0.667 0.668 Number of firms 1,159 1,159 1,159 1,159 1,159
This table presents the results of a regression of conditional conservatism (CONKW) on CSR compliance (CSRD), strength of corporate governance (CGINDIEX), family firms (FAMILY), and controls for a sample of Indian firms representing years 2015 through 2017. CSRD equals 1 if a firm’s CSR spending is equal to or more than the mandatory requirement, 0 otherwise. IMR is the Inverse Mills Ratio obtained from model (1). See Appendix B for variable definitions. Bootstrap standard errors are in parentheses. clustered at the level of firms. ***, **, and * indicate, respectively, statistical significance at the 0.01, 0.05, and 0.10 levels.

49
Table 4 Alternative measure of conservatism
CSR=CSRD CSR=CSREXP
(1) (2) (3) (4) (5) (6) (7) (8) (9) (10) VARIABLES CONBS CONBS CONBS CONBS CONBS CONBS CONBS CONBS CONBS CONBS
CSR -0.0015 0.0183** -0.0115 0.0411*** 0.0108 0.0082*** 0.0085*** -0.0203*** 0.0139*** -0.0149***
(0.004) (0.009) (0.012) (0.010) (0.016) (0.002) (0.002) (0.004) (0.002) (0.004)
CSR × CGINDEX 0.0473*** 0.0486*** 0.0415*** 0.0415***
(0.014) (0.014) (0.005) (0.005)
CSR × FAMILY -0.0357*** -0.0361*** -0.0102*** -0.0102***
(0.007) (0.008) (0.003) (0.003)
CGINDEX 0.0101 0.0102 -0.0102 0.0114 -0.0095 0.0085 0.0089 -0.0601*** 0.0107 -0.0583***
(0.009) (0.009) (0.011) (0.009) (0.012) (0.010) (0.009) (0.012) (0.009) (0.012) FAMILY -0.0086 -0.0088 -0.0082 0.0039 0.0047 -0.0077 -0.0075 -0.0068 0.0053 0.0060
(0.008) (0.008) (0.008) (0.008) (0.009) (0.007) (0.008) (0.007) (0.008) (0.008)
Controls Yes Yes Yes Yes Yes Yes Yes Yes Yes Yes IMR No Yes Yes Yes Yes No Yes Yes Yes Yes Firm FE Yes Yes Yes Yes Yes Yes Yes Yes Yes Yes Observations 3,303 3,303 3,303 3,303 3,303 3,303 3,303 3,303 3,303 3,303 R-squared 0.279 0.281 0.285 0.289 0.293 0.287 0.288 0.311 0.292 0.315 Number of firms 1,159 1,159 1,159 1,159 1,159 1,159 1,159 1,159 1,159 1,159
This table presents the results of a regression of conditional conservatism (CONBS) on CSR compliance (CSRD), strength of corporate governance (CGNDIEX), family firms (FAMILY), and controls for a sample of Indian firms representing years 2015 through 2017. CSRD equals 1 if a firm meets mandatory CSR compliance and 0 otherwise. CSREXP is the natural logarithm of (1+ actual CSR spending). IMR is the Inverse Mills Ratio obtained from model (1). See Appendix B for variable definitions. Bootstrap standard errors are in parentheses. clustered at the level of firms. ***, **, and * indicate, respectively, statistical significance at the 0.01, 0.05, and 0.10 levels.
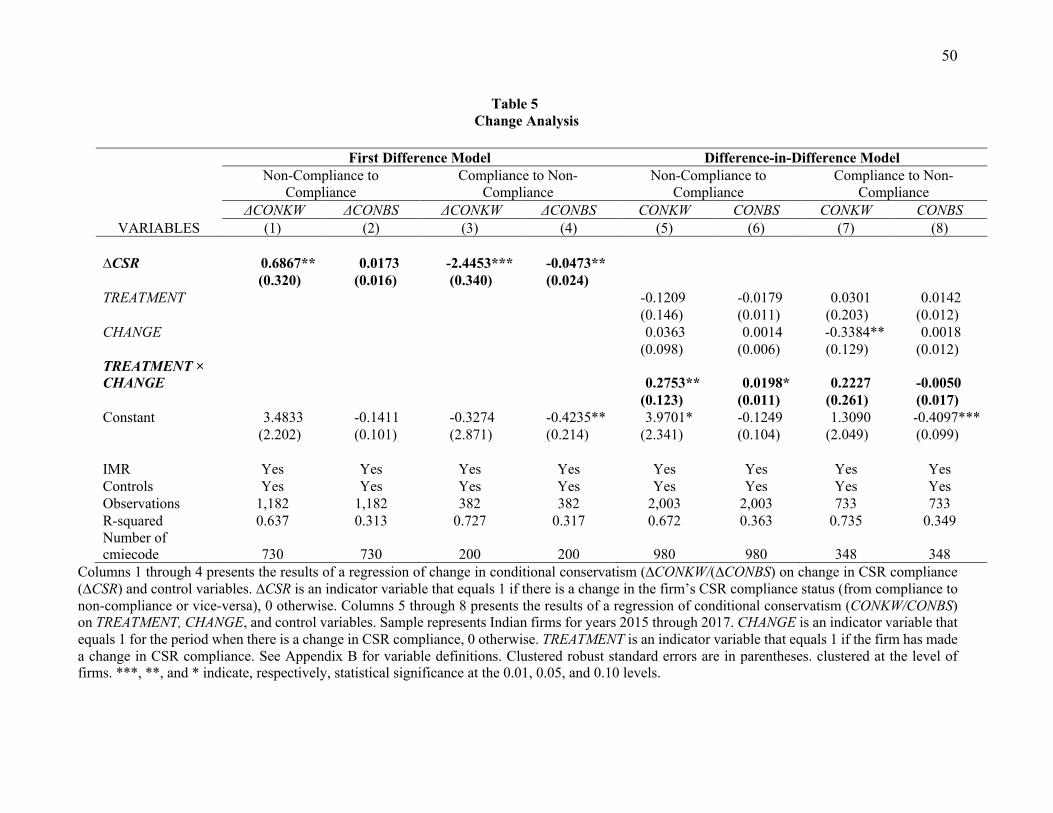
50
Table 5 Change Analysis
First Difference Model Difference-in-Difference Model
Non-Compliance to
Compliance Compliance to Non-
Compliance Non-Compliance to
Compliance Compliance to Non-
Compliance
VARIABLES ΔCONKW ΔCONBS ΔCONKW ΔCONBS CONKW CONBS CONKW CONBS
(1) (2) (3) (4) (5) (6) (7) (8) ∆CSR 0.6867** 0.0173 -2.4453*** -0.0473**
(0.320) (0.016) (0.340) (0.024) TREATMENT -0.1209 -0.0179 0.0301 0.0142
(0.146) (0.011) (0.203) (0.012) CHANGE 0.0363 0.0014 -0.3384** 0.0018
(0.098) (0.006) (0.129) (0.012) TREATMENT × CHANGE 0.2753** 0.0198* 0.2227 -0.0050
(0.123) (0.011) (0.261) (0.017) Constant 3.4833 -0.1411 -0.3274 -0.4235** 3.9701* -0.1249 1.3090 -0.4097***
(2.202) (0.101) (2.871) (0.214) (2.341) (0.104) (2.049) (0.099)
IMR Yes Yes Yes Yes Yes Yes Yes Yes Controls Yes Yes Yes Yes Yes Yes Yes Yes Observations 1,182 1,182 382 382 2,003 2,003 733 733 R-squared 0.637 0.313 0.727 0.317 0.672 0.363 0.735 0.349 Number of cmiecode 730 730 200 200 980 980 348 348
Columns 1 through 4 presents the results of a regression of change in conditional conservatism (∆CONKW/(∆CONBS) on change in CSR compliance (∆CSR) and control variables. ∆CSR is an indicator variable that equals 1 if there is a change in the firm’s CSR compliance status (from compliance to non-compliance or vice-versa), 0 otherwise. Columns 5 through 8 presents the results of a regression of conditional conservatism (CONKW/CONBS) on TREATMENT, CHANGE, and control variables. Sample represents Indian firms for years 2015 through 2017. CHANGE is an indicator variable that equals 1 for the period when there is a change in CSR compliance, 0 otherwise. TREATMENT is an indicator variable that equals 1 if the firm has made a change in CSR compliance. See Appendix B for variable definitions. Clustered robust standard errors are in parentheses. clustered at the level of firms. ***, **, and * indicate, respectively, statistical significance at the 0.01, 0.05, and 0.10 levels.

51
Table 6 The Relation Between Future CSR Spending and Current Year Conservatism
(1) (2) (3) (4)
VARIABLES CSREXPt+1 CSREXPt+1 CSREXPt+1 CSREXPt+1
CONKWt -0.1476*** -0.1119*** (0.024) (0.024)
CONBSt -1.8782*** -1.6130*** (0.165) (0.180)
CSREXPt 0.5258*** 0.4568*** 0.4763*** 0.4383***
(0.037) (0.029) (0.029) (0.028)
LN(SALES)t 0.3661*** 0.1829*** 0.3390*** 0.2056***
(0.059) (0.035) (0.048) (0.031)
ROAt 2.6051*** 2.9607*** 2.6462*** 3.0710***
(0.375) (0.329) (0.452) (0.368)
Constant -2.0069*** -1.2769*** -2.1381*** -1.5420***
(0.432) (0.284) (0.322) (0.244)
Other controls No No Yes Yes
Industry FE Yes Yes Yes Yes
Year FE Yes Yes Yes Yes
Observations 2,202 2,202 2,202 2,202
R-squared 0.710 0.729 0.725 0.736 This table presents the results of a regression of CSREXPt+1 on conditional conservatism
(CONKW/CONBS), CSREXPt and controls for a sample of Indian firms representing years 2015 through 2017. CSREXP is the natural logarithm of (1+ actual CSR spending). See Appendix B for variable
definitions. Bootstrap standard errors are in parentheses. ***, **, and * indicate, respectively, statistical
significance at the 0.01, 0.05, and 0.10 levels.

52
Table 7 The Relation Between CSR Spending and Discretionary Accruals
(1) (2) (3) (4)
VARIABLES NEGDACC POSDACC NEGDACC POSDACC
CSRD 1.9460** -0.0058 (0.979) (0.029)
CSREXP 0.4334*** -0.0000 (0.164) (0.004)
Constant 87.2771* 0.6962 93.2918* 0.6690
(50.387) (1.284) (49.813) (1.268)
Controls Yes Yes Yes Yes
Firm FE Yes Yes Yes Yes
Year FE Yes Yes Yes Yes
Observations 794 1,037 794 1,037
R-squared 0.370 0.117 0.379 0.116
Number of Firms 613 718 613 718 This table presents the results of a regression of conditional conservatism (CONKW) on CSR compliance
(CSRD), strength of corporate governance (CGINDEX), family firms (FAMILY), and controls for a sample
of Indian firms representing years 2015 through 2017. CSRD equals 1 if a firm meets mandatory CSR
compliance and 0 otherwise. Robust standard errors are in parentheses. See Appendix B for variable definitions. Bootstrap standard errors are in parentheses. clustered at the level of firms. ***, **, and *
indicate, respectively, statistical significance at the 0.01, 0.05, and 0.10 levels. POSDACC is income-
increasing discretionary accruals and NEGDACC is the absolute value of income-decreasing discretionary accruals estimated from the modified Jones model.