did the basel accord cause a credit slowdown in latin america? · imf working paper imf institute...
TRANSCRIPT

WP/05/38
Did the Basel Accord Cause a Credit Slowdown in Latin America?
Adolfo Barajas, Ralph Chami, and
Thomas Cosimano

© 2005 International Monetary Fund WP/05/38
IMF Working Paper
IMF Institute
Did the Basel Accord Cause a Credit Slowdown in Latin America?
Prepared by Adolfo Barajas, Ralph Chami, and Thomas Cosimano1
Authorized for distribution by Enzo Croce and Samir El-Khouri
February 2005
Abstract
This Working Paper should not be reported as representing the views of the IMF. The views expressed in this Working Paper are those of the author(s) and do not necessarily represent those of the IMF or IMF policy. Working Papers describe research in progress by the author(s) and are published to elicit comments and to further debate.
Drawing from a unique data set comprising 2,893 banks and 152 countries over the period 1987 to 2000, we test whether the adoption of the Basel Accord by Latin American and Caribbean countries was responsible for the serious slowdowns in credit growth experienced by these countries. We find that, on average, both bank capitalization and lending activities in Latin America increased after Basel. Consequently, Basel did not seem to lead to an overall credit decline. However, we do find evidence that loan growth became more sensitiveto some risk factors. Our study suggests that the upcoming adoption of Basel II might cause greater procyclicality of credit. JEL Classification Numbers: E5, G2 Keywords: Capital Requirements, Basel Accord, Capital Channel Author(s) E-Mail Address: [email protected]; [email protected]; [email protected]
1 Adolfo Barajas is Senior Economist in the IMF Institute. Ralph Chami is Deputy Division Chief at the IMF Institute. Thomas Cosimano is Professor of Finance at the University of Notre Dame. We would like to thank Tala Khartabil, Wolfgang Harten, Chi Nguyen, and Arthur Ribeiro for their invaluable research assistance. We are indebted to Edward Kane, Soledad Martinez-Pería, Miguel Messmacher, Roberto Steiner, and Andrés Velasco, for their insightful comments and suggestions. We also benefited from the discussion at the 9th
Economia panel meeting at Harvard University, and from the seminar in the Monetary and Financial Systems Department of the IMF.

- 2 -
Contents Page I. Introduction....................................................................................................................3 II. Brief Review of the Theoretical Link Between Risk-Based Capital Requirements And Allocation...........................................................................................................8 III. Empirical Estimaion of the Impact of the Basel Accord on Credit Growth ................11 A. Descriptive Analysis of Pre- and Post-Basel Accord Banking Performance ....11 B. Estimation of the Effects of the Basel Accord on Bank Behavior— Full Sample ....................................................................................................14 C. Estimation of the Effects of the Basel Accord on Bank Behavior— Latin America ....................................................................................................19 IV. Summary and Policy Implications ...............................................................................21 Tables 1. Credit Slowdowns in Latin America............................................................................28 2. Adoption of the Basel Accord......................................................................................29 3. Selected Banking Indicators by Region, 1987–2000...................................................30 4. Selected Banking Indicators by Region, Pre- and Post-Basel .....................................31 5. Means Test for the Ratio of Equity to Assets ..............................................................32 6. Means Test for Bank Total Capital Ratio ....................................................................33 7. Means Test for Bank Net Loans as a Percentage of Assets.........................................34 8. Means Test for Real Loan Growth...............................................................................35 9. Effects of the Basel Accord on Bank Loans ................................................................36 10. Effects of the Basel Accord on Bank Loans ................................................................37 11. Effects of the Basel Accord on Bank Loans ................................................................38 12. Means Tests for Capitalization and Lending—Latin America and Other Regions .....39 13. Effects of the Basel Accord on Bank Loans in Latin America....................................40 14. Effects of the Basel Accord on Bank Loans in Latin America....................................41 15. Effects of the Basel Accord on Bank Loans in Latin America....................................42 Appendix Table A.1.................................................................................................................23 References................................................................................................................................24

- 3 -
I. INTRODUCTION
Many countries have experienced significant credit slowdowns in recent years, and researchers have set out to determine their possible causes. In one strand of this literature, researchers examined post-crisis cases of marked declines in credit in Scandinavia and East Asia. Among some of the more dramatic cases covered, the banking system credit-to-GDP ratio shrank by over 44 percentage in Finland during 1992–97, and by some 36 percentage points in Thailand during 1998–2000.2 Thus, concern arose over whether these declines were merely a reflection of depressed economic activity, or whether they resulted from a diminished capacity or increased unwillingness of banks to lend. In the latter case, supply-driven credit declines would be termed “credit crunches.” The studies by Pazarbasioglu (1997) on Finland, Ghosh and Ghosh (1999) on East Asia, and Woo (1999) on Japan, set out to test whether credit crunches had occurred, by estimating a system of supply and demand functions for bank credit and allowing the observed quantity to be determined by the short end of the market. In most of the above cases, the findings were more in line with a credit demand contraction than with a credit crunch. A second strand of the credit crunch literature focused on the experience of the United States. in the early 1990s, where credit growth not only declined but was suspected to be a contributing factor in the economy’s slow recovery. Using the same aggregate measure as above, the U.S. banking system reduced credit by an amount equal to 13 percentage points of GDP between 1990 and 1993. To the extent that bank credit was not easily substitutable with other sources of finance, it was reasonable to believe that such a credit contraction could in turn contribute to a decline in economic activity. Several studies addressed these issues and explored whether the credit tightness could be linked to the adoption of the Basel Accord’s risk-based minimum capital requirements toward the end of the 1980s. Bernanke and Lown (1991), in analyzing the reasons for credit tightness in the early 1990s, in fact found evidence that a “capital crunch” had occurred, and that it had a procyclical role in the subsequent recession. They concluded, however, that perhaps the deteriorating financial condition of firms (the “balance sheet channel”), more than the depressed supply of credit from capital-constrained banks (the “bank-lending channel”), was the major contributor to the ensuing recession. Berger and Udell (1994), looking at the impact of lagged fundamentals on loan growth, found evidence of a negative impact of Basel on loan growth overall. However, they argued that there was no clear evidence of increased sensitivity of loan expansion to different measures of risk. Peek and Rosengren (1995, 1997, 2000) found evidence of a credit crunch; a bank’s initial capital ratio at the time of adoption of risk-based capital requirements played a key role in determining its subsequent lending activity. In Latin America, a variety of countries have also experienced notable credit slowdowns during the past 20 years. As Table 1 illustrates, appreciable declines in bank credit were observed throughout the region, many occurring during the 1990s. In many cases there were 2 See Barajas and Steiner (2002), Table 3.

- 4 -
double-digit reductions in the bank credit-GDP ratio, approaching 16 and 20 percentage points in Bolivia and Mexico, respectively. On an average annual basis, most declines tended to be in the range of 1–3 percentage points, with the notable exception of Panama, which suffered a 16 percentage point decline over the last two years. Furthermore, the final column of Table 1 shows that even in cases where the declines ended before 2003, more recent credit growth has tended to be sluggish as well.3 The study by Barajas and Steiner (2002) looked at eight of these Latin American cases (Argentina, Bolivia, Brazil, Chile, Colombia, Mexico, Peru, and Venezuela) and examined in greater detail three of the more recent episodes (Colombia, Mexico, and Peru), estimating separate supply demand functions to determine the most probable causes for credit stagnation. While the study revealed a diversity of experiences, three major common elements emerged across countries. First, when examining the composition of bank balance sheets, both reductions in sources of funds and increases in alternative uses of funds occurred during the credit decline. Second, with regard to the more recent declines analyzed in greater detail, the study showed that all three cases contained some degree of contraction in credit supply. However, in Mexico this effect was swamped by the demand-side contraction, and in Colombia demand and supply contractions were of roughly similar magnitude. Third, in all three cases the study found certain regulatory and risk-related variables4 to be significant in explaining the credit supply contraction. It is possible that one regulatory factor not included in the above studies may be related to the recent credit slowdowns in Latin America, namely, the adoption of the Basel Accord. Originally negotiated among the developed countries in 1988, the Basel Accord, or Basel I, established uniform rules for regulating the amount of capital a bank must hold. It defined risk-based minimum capital requirements, which became a major component of banking regulation throughout the world. Weights on various categories of assets were put in place, with more capital required to be held for categories of assets deemed to be more risky. Moreover, the Basel I also defined the various forms of capital that could be used to meet these requirements. Many Latin American countries have adopted the Basel Accord, imposing risk-based minimum capital requirements on their banks. Until recently, data on the timing of adoption throughout the world were relatively scarce, limited to the original G10 signers of the Accord. However, we have now constructed a cross-country database on Basel adoption, based primarily on a mid-2003 survey conducted with IMF desk economists, and which we supplemented with data from a variety of sources: the World Bank database on bank 3 In the case of Argentina, we sought to differentiate the credit slowdown period (1999–2000) from the subsequent crisis-related decline (2001–03) in overall intermediation activities, brought about in large measure by a substantial deposit outflow in the system.
4 The ratio of loan loss provisions to nonperforming loans is included as a proxy for the severity of regulations on bank risk-taking, and credit risk was measured as the ratio of nonperforming to total loans.

- 5 -
regulation and supervision5, various central bank websites, the IMF Monetary and Financial Systems Department (MFD) regulatory database, and several research papers that have dated Basel adoption across individual or groups of countries, most notably Chiuri, Ferri and Majnoni (2002). Table 2 summarizes the adoption information we compiled for countries in the Latin American and Caribbean (LAC) region, and compares them to the rest of the world. As the table shows, there is evidence of Basel adoption in LAC beginning in 1991 and continuing throughout the decade, with most countries adopting Basel between 1993 and 1997. In our sample, we obtained a total of 24 countries in the region, 22 of which have adopted Basel and 2 that have not. Regarding the adopting countries, we have specific adoption dates for 20 of them. This compares with a total of 103 adopting countries in the rest of the world, and 9 nonadopting countries. Finally, in the rest of the world we have adoption dates for 71 countries. To date, it is not clear what impact Basel I has had on bank behavior throughout the world. For example, although enhancing bank stability is one of the principal objectives of imposing risk-based capital requirements, there has not been strong empirical evidence bearing this out. In perhaps the most comprehensive (worldwide) study on regulation and bank performance, Barth, Caprio and Levine (2004) relate the stringency of capital requirements— of which adherence to Basel I is a key component—to the probability that a country will experience a banking crisis. Using cross-section regressions on a sample of close to 50 countries, they find only weak results; although minimum capital requirements are positively related to stability (they are associated with a lower probability of crisis), this result is not robust to various specifications in which other regulatory variables are also included. To the extent that Basel I regulations are binding, one would expect banks to increase their regulatory or risk-weighted capital ratio. It is apparent that such an increase could be achieved in three ways: (1) By increasing capital, the numerator, (2) by decreasing total assets, or (3) by shifting the composition of assets toward those with a lower risk weight and away from those with a higher risk weight, so as to lower the denominator. One example might be to reduce commercial loans (100% risk weight) in favor of securities (zero risk weight). Furthermore, regardless of whether there is substantial empirical evidence, many policymakers appear to behave as if a direct link exists between regulatory capital ratios, credit supply, and ultimately, economic activity. One noteworthy case is Singapore’s recent decision to lower the regulatory capital ratio from 12 to 10 percent, in part to encourage lending and thus provide stimulus to the economic recovery (Ahmad, Hadhi, and Lin, 2004). Many studies have therefore addressed different aspects of the question of how Basel I has affected bank behavior and its effectiveness in raising capital ratios, as well as the components (numerator and denominator) through which these increases are brought about. In one prominent cross-country study, the Basel Committee on Banking and Supervision (Bank for International Settlements, 1999) surveyed the main empirical evidence available 5 This dataset provided a yes/no answer to the question of whether a country had adopted the Basel Accord, but not the date of adoption.

- 6 -
for the early adopters, the G-10 countries. It showed how capital ratios increased, generally by means of a combination of banks raising new capital and reducing risk-weighted assets; yet it also showed evidence of significant and growing regulatory arbitrage in which banks resorted to securitization to boost their capital ratios. This was particularly true in the United States, where capital markets are more developed and liquid. The relationship between securitization, regulatory capital ratios, and risk in Canada was further studied by Dionne and Harchaoui (2003). Focusing on bank risk-taking, Konishi and Yasuda (2004) used risk measures based on bank stock prices in Japan to test the impact of Basel I adoption, and found that risk was reduced. A similar result was obtained by the Van Roy (2003) study of credit risk-taking among the G-10 countries. Finally, Chiuri et al. (2002), used the Peek and Rosengren framework to look at the impact of Basel I on credit growth in 16 emerging markets. They argue that the Capital Adequacy Ratio may have contributed to a credit crunch in countries that have experienced a financial crisis, and that this effect is greatest for those banks that are initially not well capitalized. Their results also support the procyclicality of the risk-based capital requirements. Understanding whether the minimum capital requirements put in place by Basel I contributed to credit slowdowns is important in and of itself but has particular relevance looking toward the future, as virtually all adopting countries are contemplating a move toward a second round of regulations, or Basel II. Recently, the Bank for International Settlements (BIS) promulgated regulations to enhance the effectiveness of the original Basel Accord, with the new regulations scheduled to be implemented in 2006. Countries are now scrambling to understand how the new accord will affect their banking and financial sectors, as well as what it will mean for their economies.6 It is important to note that the Basel II proposal, while containing several innovations over Basel I, still retains a heavy reliance on risk-based capital requirements. For instance, as Von Thadden (2004) points out, of the 163 pages of the Basel Committee’s 2003 Consultative Paper on the new regulations, 132 pages are devoted to minimum capital requirements, or “Pillar 1.” One particular aspect of Basel II, its possible role in exacerbating business cycles, has been examined by several studies. The internal ratings-based (IRB) approach advocated by the new Basel relies on banks to assign default probabilities for their borrowers. However, these probabilities depend on current information on the borrower’s equity price and book liabilities, which are surely affected by the business cycle. Ayuso, Perez and Saurina (2004), Caterineu-Rabell et. al. (2003), Kashyap and Stein (2004), and Estrella (2004) show that banks may be induced to implement a procyclical loan rating scheme, so as to shift the cost of recessions to the rest of the economy, thus exacerbating the business cycle effect. Our study uses the new dataset on Basel I adoption in addition to a bank dataset spanning 2,893 banks drawn from over 150 countries to examine whether Basel I caused banks to reduce their lending activities. We test this hypothesis for the world overall, and for the LAC region in particular. Methodologically, our data set allows us to examine the impact of Basel I over time as well as across countries, as opposed to Barth et al. (2004), who use a single 6 See, for example, Majnoni et al. (2004).

- 7 -
time observation for capital regulations and test only for differences across countries.7 In contrast with Chiuri et al. (2002), who also examine the time dimension of risk-based capital requirements, we use the Berger and Udell (1994) framework, which allows us to test for a structural change regarding banks’ overall loan supply as well as their sensitivity to risk. As Berger and Udell point out correctly, a true test for structural change requires a sufficient number of both pre- and post-Basel observations. In particular, it requires a sufficiently long control period before Basel I adoption against which to test for a change in behavior. However, the Peek and Rosengren (1995) framework used by Chiuri et al relies on only one or two pre- and post-Basel observations and is thus a test of the short-run impact of Basel I. To summarize, in contrast to Berger and Udell, our study uses an extensive cross-country panel rather than a single-country experience to test for possible common effects across countries, and in contrast to the cross-country analysis of Chiuri et al, our study undertakes a structural change test, focusing on the long-run or permanent impact of the adoption of risk-based capital requirements on bank lending behavior.8 Our results show that the Basel Accord was associated with an average increase in capital and lending activities in Latin America as well as throughout the world. With regard to the credit crunch hypothesis, we find little evidence that either the loan-asset ratio or the average growth rate of loans declines after Basel I adoption, but we do find some evidence of greater sensitivity of loan growth to certain risk factors, as one might expect from a “risk retrenchment” behavior of banks subjected to greater regulatory scrutiny. In Latin America, we observe this effect primarily through a greater sensitivity of loan growth to past shortfalls in equity. Finally, we find that the more financially developed economies tend to have a contraction in loan growth after Basel. However, this result is driven mainly by the more advanced countries in Europe since it weakens considerably when the earlier adopters of Basel are excluded from the sample, or when we focus only on countries in Latin America and the Caribbean. In the next section we summarize the existing theoretical work on the impact of capital constraints on the optimal behavior of banks. Section III presents first a description of the banking dataset and then our main empirical results. Finally, in Section IV we conclude and provide some policy implications.
7 Their very extensive regulatory database contains various aspects of the stringency of capital regulations, as well as a multitude of characteristics of the regulatory and supervisory framework in each country. Moreover, the authors state that most of the data correspond to 1999.
8 Estrella (2004) provides an analysis of both the short- and the long-term impact of capital constraints.

- 8 -
II. BRIEF REVIEW OF THE THEORETICAL LINK BETWEEN RISK-BASED CAPITAL REQUIREMENTS AND ASSET ALLOCATION
There is now a large literature analyzing the impact of the Basel Accord on bank behavior, as well as on the economy as a whole.9 This section highlights the key elements important for understanding the asset portfolio allocation decisions of banks facing risk-based capital constraints. It is important to note at the outset that regulators place capital restrictions on banks in order to enhance bank safety, with two types of factors in mind. One key factor is the presence of deposit insurance, and another is the possible contagion effect arising from bank panics. The existence of deposit insurance creates a moral hazard for the bank’s owner relative to the taxpayer, since depositors have less incentive to monitor the asset portfolio decisions of bank managers.10 As a result, there is an increased probability of default by banks, which leads to losses by taxpayers. By requiring banks to hold more capital, the owners’ stake becomes greater and therefore the incentive to take excessive risks declines. A second key factor is the possibility of cascading bank failures in a liquidity crisis, as described in Diamond and Dybvig (1983). Concerns about this led regulators to adopt capital adequacy requirements in order to create a larger cushion against losses to the taxpayer.11 Initially, capital regulations varied from country to country based on political and economic forces. Banks that competed across countries were concerned about unfair advantages when the capital regulations were less restrictive in another country. As a result, the Basel Accord negotiated in 1988 among the G10 countries, attempted to unify the capital constraints across countries, rather than introduce new capital requirements. The risk-based regulation of bank capital can be analyzed in light of what Kane (2000) calls the “regulatory dialectic,” whereby regulation leads to evasion, which, in turn, leads to a new round of regulation. Here, the Bank for International Settlements (BIS), in conjunction with regulators from G-10 countries, identified a need for uniform regulations so that banks from a specific country did not receive an advantage from lax regulations relative to other countries. As noted above, the initial purpose of the Capital Adequacy Ratio was to minimize the possibility of bank failures without undo restrictions on positive that net-present-value investment projects.12 However, this leads to a level of equity that exceeds the level the
9 Chami and Cosimano (2001), and Barth, Caprio and Levine (2004) provide recent comprehensive reviews. See also the conference volume on capital regulations in the Journal of Banking and Finance (Berger, Herring and Szego, 1995), and another conference volume by von Thadden (2004) in the Journal of Financial Intermediation.
10 Kane (1985) documents the role of moral hazard in the S&L crisis in the United States.
11 Kane (2002) discusses the moral hazard associated with a regulator who is acting as an agent for the taxpayer.
12 See Kashyap and Stein (2004), Berger, Herring, and Szego (1995), and Dewatripont and Tirole (1994).

- 9 -
market finds acceptable.13 Generally speaking, the increase in capital imposes higher operating costs on banks, which engenders incentives for them to develop ways to evade or circumvent the regulations. This behavior is now referred to as “regulatory capital arbitrage” (RCA), an example of which is a bank reshuffling its asset portfolio or using securitization to decrease risk-weighted assets without raising costly capital.14 In the case of securitization of loans, the banks would move safe loans off the balance sheet and leave riskier loans on.15 Once these arbitrage behaviors are widespread and observed by regulators, a new round of regulations ensues to circumvent the banks’ attempts to avoid the initial regulations. Basel II in particular follows this pattern, requiring the use of internal or external measures of asset riskiness to establish the percentage of capital required by regulators. Recent work by Chami and Cosimano (2001) shows how capital regulations affect bank behavior. Their model treats bank capital as an endogenous variable. This reveals how the changes in regulations, as well as changes in other exogenous variables, such as market structure and economic activity, affect a bank’s choice of the level of capital. The level of capital, in turn, will affect a bank’s future ability to extend credit. The Chami and Cosimano model has banks operating in an imperfectly competitive market.16 In such a setting, banks find it optimal to behave in a collusive manner, more like a monopolist, setting one loan rate and sharing the profits equally.17 Chami and Cosimano 13 See Barrios and Blanco (2003) for a recent microeconomic example of how regulatory capital is distinct from market capital. Holmstrom and Tirole (1997), and Marshall and Prescott (2000) provide general equilibrium examinations of the impact of regulatory capital relative to the market capital.
14 See, for example, Jones (2000).
15 Both Koehn and Santomero (1980) and Froot and Stein (1998) argue that banks would be less risk averse if they were forced to hold more capital, and the loan portfolios would become riskier. See Thakor (1996) for an opposing result.
16 This assumption is a reasonable one, based on the existing evidence that banks continue to have some degree of market power in many countries. For example, Claessens and Laeven (2004) use the Panzar and Rosse (1987) test of contestability to identify the degree of competition in the banking systems of 50 countries, including 11 in Latin America. They find evidence of a monopolistic competitive industry in all of these countries. Also, De Bandt and Davis (2000) use a similar methodology and find evidence of noncompetitive behavior in the EU. See Chami and Cosimano (2001) for a more comprehensive discussion of the evidence of monopoly power in the banking industry.
17 Following Abreu, Pearce and Stacchetti (1986, 1990) and Rotemberg and Saloner (1986), Chami and Cosimano assume that the industry is represented as a super game, in which each bank follows a strategy of monopolistic behavior in the loan market, as long as every other bank follows this strategy. They identify an equilibrium to the super game, in which it is in the best interest of all banks to engage in monopolistic behavior in the loan market.

- 10 -
show that, in the presence of Basel-like risk-based capital constraints, banks are more likely to cooperate because an individual bank may be less likely to expand its leading to meet pent-up demand for credit and risk punishment from other banks.18 Interestingly, risk-based capital requirements give value to the bank’s holding of capital. The value of holding capital—which they model as a call option—is affected, among other things, by the current level of required risk-based capital, the uncertainty and elasticity of demand for loans, level of economic activity, and interest rates. For example, Chami and Cosimano show that a higher level of required capital will increase the value to a bank of holding capital. By holding excess capital, the bank can avoid being capital constrained and thus is able to extend loans in the future. Chami and Cosimano show that banks anticipate the possibility of higher capital requirements in the future and hold more capital in the current period, so as to avoid being capital constrained. On the other hand, as the elasticity of demand increases, indicating a more competitive banking sector or a more contestable market for loans, the value to the bank of holding capital falls, and as a result, the bank will hold less capital. This implies that fewer loans will be available in the succeeding period. This last result also relates to banks’ incentives to arbitrage regulation. The less the contestable a market, the higher the benefit to a bank in that market from holding more capital. Conversely, the more contestable the market, the lower the value of capital, and thus the greater the incentive for banks to engage in regulatory arbitrage rather than raise capital in order to comply with the regulation. The ability of banks to circumvent the regulation, however, would depend, among other things, on the level of financial market development, and on the strength of the legal and institutional framework in place. In an economy with a well-developed financial market, banks can arbitrage regulation through securitization and other off-balance sheet activities, so as to raise the capital-to-asset ratio.19 Moving from costly credit risk activities—because of stricter risk-based capital regulation—to other activities that do not involve credit risk could lead to a credit crunch. However, these new activities expose a bank to new types of risks, such as market risk, interest rate risk, and operational risk.20 On the other hand, raising more capital, although costly, would allow banks to extend credit. In a recessionary environment, however, banks would resist raising capital, which implies that bank capital becomes more procyclical. 18 A panel member pointed out that this strategy would work only if all the other banks in the industry have sufficient capital to service this higher level of loans. This raises the issue of capacity precommitment addressed by Kreps and Scheinkman (1983), and Davidson and Deneckere (1986). This issue, however, does not arise here, since, as we show below, banks tend to hold substantially more capital then required by regulators.
19 Another example would be lending to the government, which receives zero risk factor (at least in OECD countries). What this effectively means is that banks are raising their capital-to-asset ratio by reducing the denominator, rather than by raising more capital. (See Jones (2000)
20 See Chami, Khan and Sharma (2003).

- 11 -
The level of financial development should affect how the Basel Accord has influenced bank behavior in different countries, although it is not entirely clear in which direction. On the one hand, it might be expected that banks in emerging markets or developing economies—where capital markets and securitization possibilities may not be well developed—may have a harder time arbitraging the new risk-based capital regulation. This implies that such banks are obliged to raise new and costly capital, or reduce their supply of credit. However, the opposite may occur, since such markets may also have weak legal and regulatory frameworks, and thus monitoring of bank activities and enforcement of regulations may be deficient. Banks in such markets may exploit the presence of such loopholes to give lip service the new regulation. Thus, banks may be able to show that their regulatory capital-to-asset ratio has increased—and use that to increase credit—while their true economic capital has not really changed.
III. EMPIRICAL ESTIMATION OF THE IMPACT OF THE BASEL ACCORD ON CREDIT GROWTH
A. Descriptive Analysis of Pre- and Post-Basel Accord Banking Performance
In order to estimate the impact of the Basel Accord on lending, we used a panel derived from Bankscope annual individual bank information for up to 50 of the largest banks in each of 152 countries.21 This gave us a total of 2,893 banks, or 19 banks on average per country. For each bank, the maximum number of potential time observations was 14, spanning from 1987 to 2000, thus producing a total of 20,102 potential observations,22 132.3 on average for each country. Summary statistics for several banking performance variables during the entire sample period are shown in Table 3. One can immediately see that, depending on the specific variable being analyzed, the number of usable observations declines substantially from the totals above. For example, there were considerably more observations for the Equity-Total Asset ratio (20,102) than for the Total Capital Ratio (6,718) and the Tier 1 Ratio (4,157). 21 Many previous studies have used Bankscope data for cross-country analysis. For instance, Cetorelli and Gambera (2001) examine the relation between bank concentration and economic growth in 42 countries during 1989–1996. Demirguc-Kunt, Laeven and Levine (2004) focus on the 1995–1999 period for 72 countries to study the impact of bank concentration on the net interest margin. Finally, the Claessens and Laeven (2004) test for contestability during 1994–2001 across 50 countries. For our study, it was necessary to combine information from various 8-year Bankscope CD’s to build the 1987–2000 time period. We are currently in the process of expanding the database to include more recent time observations and a greater number of banks for each country.
22 As Table 3 shows, this corresponds to the number of observations for the most widely reported variable that we used, the ratio of equity to total assets. Due to differences in reporting across banks, time, and variables, the number of observations varied for each type of analysis we undertook. Also, the number of observations fell once we limited the sample to the countries for which we had dated information on Basel adoption/implementation.

- 12 -
Table 3 presents four types of banking indicators–capitalization, profitability and operational costs, asset composition and liquidity, and loan loss provisioning–and compares their means and standard deviations across regions for the full sample period. Capitalization is measured in terms of the traditional average ratio of equity to assets, as well as the Basel-related Total Capital and Tier 1 Capital ratios, where the denominator is equal to risk-weighted assets. Profitability and operational costs are represented by the return on assets, the net interest margin, and the ratio of overhead to assets. Asset composition is measured by the ratio of net loans to total assets; intermediation activity is measured by the ratio of net loans to deposits; and liquidity is measured by the degree to which short-term liabilities–deposits–are covered by short-term assets.23 Finally, loan loss provisioning is measured by the provisioning cost in each period as a percentage of interest revenue, as well as the stock of accumulated reserves as a percentage of nonperforming and gross loans. Compared with world averages, LAC banks appear to have similar or even slightly higher capitalization and profitability, but decidedly higher interest margins and overhead costs, and they tend to concentrate more of their activities in lending and, consequently, less in liquid assets. Thus, at first glance LAC would appear to have less competitive and less efficient banking systems than the rest of the world. In fact, interest margins and overhead costs are not only above the world average but also the highest of any region. This is consistent with the findings of recent studies analyzing the persistently high levels of interest spreads and intermediation costs in Latin America, even after reforms were enacted throughout the region during the 1990s, which liberalized interest rates and eased entry into the system, particularly by foreign banks (Brock and Rojas-Suárez, 2000). Moreover, in LAC banks’ loan loss provisioning tends to be smaller as a fraction of net interest income (20.6% vs. the world average of 24.5%), and loan loss reserves tend to be smaller in relation to total loans (5.3% vs. the world average of 5.8%). This might reflect some degree of moral hazard and excessive risk-taking in the banking system, caused in part by the existence of implicit or explicit deposit insurance schemes. Moral hazard and weak regulation/supervision are also cited by Brock and Rojas Suárez (2000) as major sources of weakness in Latin American banks. However, other studies have shown that even in Latin American countries with explicit deposit insurance systems, market discipline exists to a measurable extent and therefore moral hazard is not as widespread as one might think (for example, Martínez-Pería and Schmukler, 2001; Barajas and Steiner, 2000). However, the two provisioning ratios are also affected by the denominators, namely the higher interest spreads and greater size of lending activities in the LAC region. Loan loss reserves in LAC banks are well above 100% of nonperforming loans (117.5%), and indeed above the levels in most other regions, although not close to those observed in the United States and Canada (269%). The figures also show that high interest revenues essentially allow provisioning to be less of a financial burden on banks in the LAC region. 23 It should be noted that liquid assets are not necessarily riskless, as they often include corporate and government securities that are not exempt from default risk.

- 13 -
In our Basel Accord database we also made an attempt, whenever possible, to distinguish full-fledged implementation of Basel with its mere legal adoption. Implementation would entail the completion of a transition period for banks to comply and/or an effective enforcement of the capital standards through improvements in the capacity of supervisory authorities to carry out their functions. Thus, we constructed two separate dummy variables: BASELYR, indicating the year of adoption, and BASELYR1, indicating the implementation year for those countries where it was possible to make this distinction. The details of these two measures are shown in Appendix Table A.1. Table 4 revisits the major banking performance indicators and compares them across the pre- and post-Basel periods, using BASELYR1 to separate the two periods. In particular, we find that capitalization increased, as measured by both the regulatory measures and the average equity-asset ratio, and that profitability, interest spreads, and average overhead declined. The former movements suggest that, at least on average, the Basel Accord succeeded in raising capitalization rates, although the ratio of equity to total assets increased appreciably less than the two regulatory measures. As for the profitability and cost-efficiency of banking systems in LAC, the aggregate statistics seem to suggest that other banking system reforms leading to greater competition–liberalization and/or entry of foreign banks–might have been carried out simultaneously with the adoption of the Basel Accord’s risk-based capital requirements. Turning to bank lending, our preliminary examination of the data finds no indication of a Basel-induced credit contraction. Whether scaled by total assets or short-term liabilities, net loans increased while liquid assets declined. Thus, the post-Basel period coincided with an increase in bank intermediation activities, and perhaps a greater vulnerability to deposit outflows, although overall bank default risk presumably declined as a result of the increased capitalization. Comparing changes in capitalization and lending across regions, the LAC region increased capital by more than the world average while also increasing the share of loans in assets by much more (5 percentage points vs. 1 for the world average). At the other extreme is Europe, where banks registered the highest average capitalization rates before Basel. We see that Europe was the only region where both capitalization and lending ratios declined between periods. In section IV we will examine more closely the statistical significance of these average changes both at an aggregate and a regional level. As for changes in other indicators, LAC banks registered declines in the profitability and cost-efficiency measures similar to those for the world average. Thus, in the post-Basel period they continued to have the highest interest spreads and overheads of any region. Finally, provisioning intensified in the post-Basel period in some regions (Asia, Latin America, and most notably, the United States and Canada), with the coverage of nonperforming loans with loan loss reserves increasing substantially, while in others, the opposite occurred (Europe and the Middle East). Although provisioning declined relative to interest revenue in Africa, banks in this region were still able to increase the ratio of loan loss reserves to nonperforming loans.

- 14 -
In summary, the adoption of Basel I around the world is associated with an expansion of equity capital along with increased lending. On average, the return on equity declined, with the decrease in the net interest margin being greater than that in overhead expenses. The exception to this general pattern is Europe, which is characterized by a relatively high level of banking development.24
B. Estimation of the Effects of the Basel Accord on Bank Behavior—Full Sample Our estimation approach is similar to that followed by Berger and Udell (1994) in their study of the impact of the Basel Accord on credit growth in the United States. We modify their analysis in that we compare a significant time period both before and after Basel I. As a result, our analysis places more of an emphasis on the long-term impact of Basel I. In addition, we examine both the composition of bank assets and the real growth rate of loans.
We first estimated a regression to assess whether a significant change in means between the pre and post-Basel periods was experienced by bank capital and lending. Thus, our initial test regressed each of four bank capitalization or loan variables on an intercept variable and a Basel-related dummy variable, as shown below:
jtijt BASELYRV 10 αα += (1)
Vijt represents each of the dependent variables: the ratio of equity to total assets (EQTA), total capital ratio (TOTCAPRAT), the ratio of net loans to total assets (NLOANTA), and the real annual growth rate of loans (RLOANGROWTH).25 The sub indices i, j, and t denote bank, country, and year, respectively. We tested whether adoption of Basel was associated with a change in bank behavior, by regressing the bank variables on a dummy variable for the adoption year in each country, BASELYR. Note that BASELYR varies by time and country, but not by bank. We conducted this test for the full sample, and for one which excluded the early adopters (the 14 countries that adopted the Basel Accord in 1988).26
24 As we will show in the next section, our measure of financial development is centered on the size of private sector credit by the banking system relative to GDP. Thus, many European economies appear more financially developed than the United States, by virtue of being more reliant on the banking system than on capital markets.
25 We also ran regressions for the Tier 1 Ratio (T1RAT), the ratio of loans to deposits and total borrowing (LOANDEP), the ratio of gross loans to assets, and the growth rate of real loans scaled by the previous period’s assets. In all cases the results were similar to those obtained for TOTCAPRAT, NLOANTA, and RLOANGROWTH, respectively. However, in the case of T1RAT the number of observations declined considerably, as many banks did not report this indicator.
26 We also tested whether the 1988 signing of the Basel Accord itself was associated with a change in means across all countries, regardless of whether or when they adopted it. We found no evidence of such an announcement effect either on capital ratios or on lending
(continued…)

- 15 -
We ran four basic versions of this test: (i) an OLS regression across countries and time; (ii) a Fixed Effects regression, where bank-specific intercepts were included; (iii) a regression that included country dummies; and (iv) a regression including a relative measure of financial development, FINDEV,27 as well as its interaction with BASELYR. We ran each of these regressions for the full sample and for a sample excluding early adopters.28 Finally, in order to assess the effect of implementation vis-à-vis adoption, we also used BASELYR1 in place of BASELYR. The results of the means tests for capitalization ratios are shown in Tables 5 and 6.29 Overall, a significant increase in the average equity-asset ratio was captured in all but the fixed effects regressions, There is also evidence of the regulatory capital ratio increasing significantly after Basel.30 Finally, the results show that banks in more financially developed countries had lower capitalization rates on average prior to Basel, but they tended to increase capitalization by a greater amount after Basel. Tables 7 and 8 show the means test results for bank lending activities. Looking first at the ratio of net loans to total assets (NLOANTA), the simple OLS and fixed effects estimates show that, contrary to the credit/capital crunch hypothesis, Basel adoption did not coincide with a shift in bank assets away from loans. In fact, in the simple OLS and the specification that controlled for the level of financial development there is a significant increase in the loan-asset ratio after Basel. However, the results also show that this increase tended to be smaller as countries were more financially developed. In fact, a country with a sufficiently developed financial sector would experience a reduction in the loan-asset ratio. Based on the point estimate of the final column of Table 7, the cutoff point would be 30% of the maximum
behavior, as none of the above variables exhibited a significant change in means between subperiods. 27 We calculated FINDEV as the ratio of banking system credit to GDP in 1995 relative to the worldwide maximum, registered by Switzerland (168%). Thus, FINDEV takes the value of unity for Switzerland, and is less than unity for all other countries, for example, 0.15 in Mexico, and 0.32 in Korea. The United States has a value of only 0.41 since stock and bond markets are a larger percentage of the economy. 28 As the tables show, this excludes the United States and Canada. 29 We expanded the dataset with respect to previous drafts of this paper, roughly doubling the number of banks included. Since we had limited the dataset to the largest banks in each country, the expansion brought in smaller banks in virtually every country. While most of the general results of the statistical analysis continued to hold, some small changes did occur. 30 In this section , when we use the phrase “after Basel” or “following Basel,” we are referring to the country-specific adoption and/or implementation of Basel. Otherwise we refer specifically to adoption or implementation.

- 16 -
level of banking development,31 equivalent to a 1995 ratio of private sector credit to GDP of 50% or greater. Thus, countries such as Australia (73%), Korea (53%), and the United Kingdom (115%) would experience a contraction in loans following Basel, while Chile (49%), for example, would experience virtually no change. As the loan-asset ratio may mask the behavior of loans when asset growth is also changing between periods, we also examined the real growth rate of loans directly. The results of these means tests, after removing outliers,32 are shown in Table 8. We see that, contrary to the behavior of the loan-asset ratio, these estimations point to a decline in loan growth after Basel. However, when controlling for relative financial development, we see that this effect takes place after a certain level of financial development. Based again on the point estimate of the final column of the table, the cutoff point is somewhat higher than in the case of the loan-asset ratio: a country with a credit-GDP ratio of over 64% would tend to experience a decline in lending growth. In order to test whether loan supply contracted as a result of the Basel Accord, we used a specification similar to that of the Berger and Udell (1994) study of the U.S. banking system. In general, bank loans were assumed to respond to lagged risk factors; when risk increases, banks subsequently contract their lending activities either voluntarily or through regulatory pressure. This also operates in a cross-section sense, where banks with higher levels of risk (for example, lower capital) would also tend to adjust by having a smaller loan portfolio on average than safer banks. Thus, one aspect of the test is to examine whether the Basel Accord made banks more sensitive to risk, to the extent that increases in risk might have been associated with a greater danger of falling below the regulatory minimum level of capital. This corresponds to the “risk retrenchment hypothesis” discussed by Berger and Udell,33 whereby the contraction in loan supply is associated with bank risk. We also examine whether non-risk related factors may have come into play to reduce loan supply, through an intercept shift. Finally, we include a vector of macroeconomic controls X to proxy for loan demand factors and other non-Basel related loan supply factors. Our specification is shown below: 31 This is obtained as the overall intercept shift from BASELYR1 (5.794) divided by the coefficient of the interaction between BASELYR1 and FINDEV (-19.140).
32 We removed observations in which the annual real growth rate of loans was greater than 100% or less than -50%. This made an enormous difference in terms of predictability and significance of the coefficients, but still preserved a large number of observations for each country.
33 Berger and Udell also make a distinction between “voluntary” and “regulatory” risk-retrenchment, depending on whether banks became more sensitive to risk on their own or, alternatively, as a result of more rigorous action by regulators. For now, we focus on whether any change in banks’ attitude toward risk can be observed, be it voluntary or regulatory in nature.

- 17 -
jtijtjtijtjtijt XRISKBASELYRRISKBASELYRV 4131210 ααααα +⋅+++= −− (2)
The dependent variable V is the loan-asset ratio (NLOANTA) and the real growth rate of loans (RLOANGROWTH), and we use two risk measures, the capital ratio (EQTA) and the ratio of nonperforming loans to total loans (NPFRAT). Our two macroeconomic controls are the real growth rate of GDP(RGDPG) to capture changes in loan demand, and the annual change in the inverse money velocity (DM3GDP)34 to capture shifts in the public’s demand for bank deposits.35 For a given level of risk, an increase in money demand would shift banks’ loan supply through an exogenous increase in their loanable resources. Note that one would expect DM3GDP to capture many large structural changes in the financial system as well; for example, financial liberalization that removes controls on deposit interest rates would increase the public’s demand for bank deposits, thus lowering income velocity. Likewise, the introduction of a deposit insurance scheme, which makes bank deposits safer in the eyes of the public, would have a similar effect.36 If bank loans respond negatively to a prior increase in risk, we expect the coefficient on the lagged capital ratio to be positive, and that on the lagged nonperforming loan ratio to be negative. Furthermore, loan supply should be positively related to the economic growth rate and to increases in money demand. The impact of the Basel Accord on risk sensitivity will be measured by the coefficient α3 on the interaction term between BASELYR and the respective risk variable. If banks experienced risk retrenchment after Basel, then α3 should be positive for the equity ratio (banks decrease loans even more in response to a drop in capital) and negative for the nonperforming loan ratio (banks contract loans even more in response to a rise in credit risk). Finally, a negative α1 coefficient would indicate that all banks, regardless of their risk characteristics, experienced a loan contraction following Basel. The results of this test are shown in Table 9. We present estimations for NLOANTA (upper portion) and for RLOANGROWTH (lower portion), where we include each of the risk factors individually or together. Three types of estimations are presented: OLS, Fixed Effects, and Instrumental Variables with Fixed Effects. In the last procedure we account for the possible
34 Defined as the absolute annual change in the ratio of money and quasi-money to GDP, as reported in the IMF’s International Financial Statistics.
35 It might also be argued that fiscal variables, such as government debt, or government financing needs, should be included as a macroeconomic control, that directly affects banks’ willingness to lend to the private sector. However, in a previous study examining Latin American credit slowdowns, Barajas and Steiner (2002) found that fiscal variables were not significant determinants of credit growth over the past decade.
36 As we discuss in the conclusions, future work will combine our Basel database with information on different aspects of financial sector reforms to incorporate these types of policy changes more explicitly. However, given the results of our estimations in this paper, DM3GDP appears to be a reasonable proxy.

- 18 -
endogeneity of the bank risk variable (capital or nonperforming loan ratio), using its lagged values as well as the macroeconomic controls as instruments. Note that, because fewer banks report the nonperforming loan ratio, the sample size is reduced appreciably when this variable is included. Overall, we find that banks respond to risk in the expected direction, contracting loan supply following a drop in capital (EQTA) or an increase in the nonperforming loan ratio (NPFRAT), and that the real GDP growth rate tends to be positively associated with a greater proportion of bank assets being devoted to loans. The results also show that instrumenting tends to strengthen the estimated response of banks to risk factors, particularly of the loan-asset ratio to changes in nonperforming loans, and of loan growth to changes in equity. The impact of the Basel Accord on the loan-asset ratio is not clear. In OLS regressions, Basel adoption is associated with a direct increase in loans across all banks—a constant term shift—but this result is weakened once bank-specific determinants of loans (unrelated to the risk factors included) are accounted for. Regarding risk factors, the Basel Accord did not appear to increase banks’ sensitivity to either EQTA or NPFRAT; in most cases the coefficient on the interaction term was not of the expected sign and was not statistically significant. In fact, in every regression there was at least one coefficient that signaled a decline in the sensitivity toward risk after Basel, thus reducing banks’ prudent response. In contrast, the results for RLOANGROWTH were generally stronger and slightly more consistent with a Basel-induced credit contraction. The response of loan growth to bank fundamentals and macro controls was consistently of the expected sign and generally statistically significant. Although the direct impact of Basel through the intercept shift was usually positive, there is some indication of risk retrenchment, with greater sensitivity of lending to nonperforming loans (with a negative interaction coefficient), albeit not statistically significant, and occasionally, with greater sensitivity to equity. While the fixed-effects specifications above allowed for bank-specific intercept heterogeneity, we were also interested in assessing whether there were systematic and measurable sources of cross-country heterogeneity, both on the intercepts and on the effect of Basel on lending behavior. Thus, we reintroduced the degree of financial development as a further control variable. As shown in Table 10, we ran OLS regressions which included FINDEV and its interaction with BASELYR1, both for the full sample and for the sub-sample excluding the early adopters. As in the previous set of regressions, lending activity tended to shrink in response to greater risk. One main result of including greater country heterogeneity was that the signs of the direct as well as the risk-related impacts of Basel adoption were more robust across specifications and samples; in particular, adoption appeared to increase loan supply directly in virtually all regressions. However, in three key respects, the results were markedly different between the NLOANTA and the RLOANGROWTH estimations. First, sensitivity of the loan-asset ratio to risk tended to decline after Basel throughout all specifications, while it generally increased in the case of loan growth. This can be seen from the signs of the interaction coefficients in the last three columns of Table 10: after Basel adoption, loan growth declined further in response to declines in equity or increases in nonperforming loans than it had in the previous period.

- 19 -
Although not all of these estimated effects are significant, they do indicate that, whatever credit slowdown effects Basel might have, they become more visible through the growth rate of loans rather than their relative size within banks’ balance sheets. Second, as before, loan growth appears to respond more reasonably to the macro controls, increasing both with the rate of economic growth and with the change in money demand, as proxied by inverse velocity of M3. Third, the level of banking development, while highly correlated with the loan-asset ratio,37 is not a significant explanatory variable for loan growth. Even after controlling for bank-specific fundamentals, the estimations still show that the direct positive impact of Basel on lending is smaller the more financially developed the country is, and that there is a threshold beyond which Basel may have led to a credit slowdown.38 This is particularly true of RLOANGROWTH, where this effect remained even after excluding the early adopters. For NLOANTA, on the other hand, this effect actually becomes positive once the early adopters are excluded. Finally, we ran regressions in which we included country dummy variables in place of the financial development variable. Their results are shown in Table 11, with overwhelming joint significance of the country dummy variables and a substantial increase in the R2. In this specification, the direct increase of loan growth after Basel becomes less clear, but there is still some evidence of increased sensitivity of loans to risk variables after Basel. In particular, the final column of Table 11 suggests that loan growth may have become more sensitive to past equity. Thus, the empirical analysis, while not conclusive, seems to weigh in against the hypothesis of a widespread credit crunch induced by the adoption of the Basel Accord. There is limited evidence so far that the responsiveness of bank loan growth to risk became greater following Basel. On the other hand, there is some evidence that the loan-asset ratio became less responsive to risk factors. Also, there is still little evidence of a direct Basel-induced tightening of credit conditions across all banks and countries—that is, an intercept shift—although it may have occurred in some early adopting countries with sufficiently developed financial systems.
C. Estimation of the Effects of the Basel Accord on Bank Behavior–Latin America
In order to examine the impact of Basel specifically in Latin America, we first ran the means tests for capitalization and lending variables by including five region dummy variables (AFRICA, ASIA, EUROPE, USCANADA, MIDEAST) as well as their interactions with BASELYR and BASELYR1, and using LAC as a base region. Thus, the coefficient on 37 This should not be surprising, as the financial development indicator is derived from a measure of aggregate bank credit as a percentage of GDP, which should be positively correlated with the loan-asset ratio of individual banks.
38 Depending on the regression, the threshold in the financial development index generally lies in the 40–50% range.

- 20 -
BASELYR and BASELYR1 gave us directly the estimated impact of Basel on bank behavior in the LAC region, and all other dummies and interaction terms allowed us to test for differences between LAC and each of the other regions. The results of these means tests are shown in Table 12. The regressions show that after Basel, on average, banks in the LAC region increased capitalization rates, the proportion of assets devoted to loans, and the growth rate of loans. Furthermore, it should not be surprising that there is little difference between the results obtained using BASELYR and BASELYR1, since we could identify a distinct implementation date in only a handful of Latin American countries. Comparing with other regions, the coefficients on the region dummies show that, prior to Basel, Latin America’s capitalization rates were about average (Asia, the United States and Canada had lower levels, while those for Europe were higher), whereas its loan growth rates were the lowest, along with Africa. After Basel, Asian banks increased their capital by less than Latin America, and Europe appear to have reduced capitalization levels in absolute terms. Finally, the United States and Canada increased their regulatory capital by more than LAC, but their average equity by less. The impact of Basel on loan growth was greater in the United States and Canada than in LAC, and less in both Asia and Europe. In fact, European banks may have lowered their growth rate on average after Basel. Finally, Africa and the Middle East tended to have capitalization and lending growth rates similar to LAC’s before and after Basel. We also ran the loan equations for the subsample of LAC countries, and we report the results in Tables 13 (simple specification), 14 (including financial development indicators), and 15 (including country dummies). Several of the results are similar to those obtained for the full sample of countries. First, there is very little evidence of a negative intercept shift indicating an overall decline in either the loan-asset ratio or the growth rate of loans after Basel, with the lone exception being one regression for loan growth in Table 15. Second, loan growth tends to fit the empirical model better than the loan-asset ratio. It responds positively and significantly to the demand for money, while the loan-asset ratio does not, and seems to be more supportive of a credit slowdown after Basel. Third, the level of financial development is positively related to the loan-asset ratio, but negatively related to the loan growth rate. Finally, country-specific characteristics, including the level of financial development, prove to be significant and contribute to an appreciable increase in the R2 of the regressions. Some results for Latin America are different. Regarding the risk retrenchment hypothesis, there is stronger evidence that loan growth becomes more sensitive to past equity after Basel; the coefficient of the interaction term between BASELYR1 and EQTA(-1) is positive and significant across all specifications. However, there appears to be no significant change in the sensitivity of loan growth to the nonperforming loan ratio. Also, within the sample of Latin American countries, the effect of Basel on loans does not seem to depend on the level of financial development. An estimated threshold after which Basel leads to a credit decline

- 21 -
arises only in a single specification for the loan-asset ratio, the first column of Table 14.39 In the case of only loan growth, financial development even appears to have the opposite effect; after Basel, more developed LAC countries tended to expand credit by more than the less financially developed countries in the region.
IV. SUMMARY AND POLICY IMPLICATIONS
In this paper, we showed that numerous Latin American countries have experienced notable declines in credit growth in recent years, and that many studies have sought to test whether a credit crunch, or supply-induced restriction of credit, occurred. While some regulatory factors were found to be significant explanatory variables in these declines, one aspect that has not been explored empirically in Latin America until now is whether the adoption of risk-weighted minimum capital requirements, Basel I, has played a contributing role. The evidence for the United States suggests that Basel may have been at least partially responsible for the credit decline of the early 1990s and the ensuing slow recovery. We also showed that adoption of Basel I took place in Latin America and the rest of the world throughout the 1990s, eventually covering a total of 125 countries. We then used a cross-country bank dataset to test whether or not the Basel Accord had a significant effect on bank activities. Our means tests showed that, after Basel, Latin American banks increased capital to meet the Basel I requirements, and increased the size of their loan portfolios. As a result, since Basel implementation they have tended to hold a capital-asset ratio that is 4% more than the world average, and a loan to asset ratio about 1% over the world average. Comparing pre- and post-Basel I periods, return on equity decreased quite substantially in LAC, by about 7%, while the world average decreased by 3½ %. Although financial development in LAC between the pre- and post-Basel periods reduced interest spreads and overhead costs, these remain stubbornly high by world standards. Compared with other regions, Latin America’s behavior was about average; some regions increased capital and lending by more, some by less. Europe, in particular, appears to have increased capital and lending the least. In fact, it may even have reduced lending after Basel. Finally, in the full sample of countries we found that the increase in loans after Basel was smaller as countries became more financially developed and that credit might decline past a certain threshold of financial development. However, this effect was noticeably weaker once we focused on the Latin American countries or excluded the early adopting countries from the sample. Our results give only weak evidence of a Basel-induced credit crunch in Latin America. Overall, we do not find evidence that the loan supply curve shifted on average after Basel, 39 Here, the point estimate suggests a threshold of 34% for the financial development indicator, or a private sector credit-GDP ratio of 58%. This level is achieved by only one country in the LAC region, Panama (74%).

- 22 -
but we do find some evidence of risk retrenchment, as loan growth became more sensitive to the lagged equity-asset ratio. The same message tends to hold for the full country sample, although risk retrenchment appears somewhat weaker than in Latin America. Furthermore, our analysis of loan growth rather than loan-asset ratios tended to be more in line with the credit crunch hypothesis and with our macro controls, although the results are still far from conclusive. From our empirical results, the role played by financial development in the process of adoption appears to be consistent with the regulatory arbitrage hypothesis, whereby banks have an incentive to develop ways to circumvent the costly regulations put in place. Although the measure we used referred to the size of banking activities—and was thus only an imperfect indicator of capital market development—our estimated negative effect of financial development on lending is consistent with the idea that banks may artificially reduce their risk-weighted assets more easily to the extent that there are instruments available that permit them to do so. Emerging markets, on the other hand, either found other, non-market ways to arbitrage—shifting among types of loans so as to decrease risk-weighted assets, or taking advantage of lax enforcement of the regulations—or were effectively forced to raise costly capital in order to comply with the regulations. Our estimations suggest that the latter did in fact occur, although some partial non-market arbitrage may have occurred as well. The verdict so far is that, given the environment under which Basel I adoption has taken place, risk-based capital requirements have not been responsible for widespread reductions in the credit supply in Latin America. Basel I has had the intended consequence of making banks more sensitive to changes in their capital ratios, although it has not appeared to influence banks’ sensitivity to other risk factors, such as credit risk. This may be because credit risk does not affect the regulatory capital ratio directly, but rather through its impact on the value of bank assets. However, given that Basel II is expected to incorporate a wider range of weights applied to different risk types of risk, as well as a more accurate approximation of credit risk, we would expect loan sensitivity to risk to increase as well. Although our results do not give cause for concern of additional and permanent credit declines as Latin America adopts Basel II, our results do suggest that Basel II might cause credit to become more procyclical as loan supply becomes more sensitive to risk factors that vary with the business cycle. Further work in this area is warranted. One could exploit more disaggregated data to explore whether different types of banks (small vs. large, for example) faced different constraints and thus reacted differently to the changes imposed by Basel, and whether changes in the composition of loans took place, even if overall lending might not have declined. Finally, the role of other reforms, most notably liberalizations that might have stimulated increased bank competition and lending during this period, or the introduction of explicit deposit insurance systems, which may have provided incentives to banks to expand credit, could be addressed explicitly and systematically.

- 23 -
Country Adoption Date
Implementation Date Comments on Implementation 1
Countries where both Adoption and ImplementationDates are Available
Chad 2001 2003 Implementation phased in.Croatia 1993 1998, 2002 Deficient supervision before 2002, implementation phased in until 1998.India 1995 1996 CFM2 enforcement year is 1996.Indonesia 2001 ongoing Full implementation still not achieved.Hungary 1992 1994 Full implementation, CFM2 (2002)Italy 1988 1992 Implementation date.Japan 1988 1993 Implementation date, from Konishi & Yasuda (2004)Korea 1995 1997 Full implementation, CFM2 (2002)Mauritius 1993 1994 Effective implementation date.Norway 1991 1992 Transitional period, 1991-1992 to reach 8%.Sweden 1988 1994 Implementation date.Togo 2000 2002 Transitional period, 2000-2002.Uruguay 1991 1995 Contingent liabilities included, greater Central Bank powers.USA 1988 1990, 1992 Partially, fully into effect, from Berger & Udell (1994).Venezuela 1996 1994 CFM2 enforcement year is 1994.European G10 Countries 1988 1992 Full implementation in all countries by 1992,as in Ford and Weston
(2001).
Countries where only full enforcement date is available 3
Poland 1993Slovenia 1994Turkey 19941 Unless indicated otherwise, information is from survey response.2 Chiuri, Ferri, and Majnoni (2002).3 Belgium, Denmark, Germany, Ireland, Italy, the Netherlands, Scandinavia, Switzerland, and the United Kingdom.
Appendix Table A.1. Adoption and Implementation Dates—Various Countries
APPENDIX

- 24 -
REFERENCES
Abreu, Dilip, David Pearce, and Ennio Stacchetti, 1986, “Optimal Cartel Equilibria with Imperfect Monitoring,” Journal of Economic Theory, Vol. 39, pp. 251–269.
———, 1990, “Toward a Theory of Discounted Repeated Games with Imperfect Monitoring,” Econometrica, Vol. 58, pp. 1041–1064.
Ahmad, Izham, Abdul Hadhi, and Pang Ai Lin, 2004, “Singapore to Relax Bank Rules,” Asian Wall Street Journal, May 28–30, 2004.
Ayuso, Juan, Daniel Perez, and Jesus Saurina, 2004, “Are Capital Buffers Pro-Cyclical? Evidence from Spanish Panel Data,” Journal of Financial Intermediation Vol. 13, pp. 249–264.
Bank for International Settlements, 1999, “Capital Requirements and Bank Behaviour: The Impact of the Basle Accord,” Working Paper No. 1 (Basle, Switzerland: Basle Committee on Banking Supervision).
Barajas, Adolfo, and Roberto Steiner, 2002, “Why Don’t They Lend? Credit Stagnation in Latin America,” IMF Staff Papers, Vol. 49, pp. 156–184.
———, 2000, “Depositor Behavior and Market Discipline in Colombia,” Working Paper No. 00/214 (Washington: International Monetary Fund).
Barth, James, R. Gerard Caprio, Jr., and Ross Levine (2004), “Bank Regulation and Supervision: What Works Best?” Journal of Financial Intermediation, Vol. 13, pp. 205–248.
———, 2004, “Bank Regulation and Supervision: What Works Best?” Journal of Financial Intermediation, 13, pp. 205–248.
Barrios, Victor E., and Juan M. Blanco, 2003, “The Effectiveness of Bank Capital Adequacy Regulation: A Theoretical and Empirical Approach,” Journal of Banking and Finance, Vol. 27, pp. 1935–1958.
Berger, Allen N., and Gregory F. Udell, 1994, “Did Risk-Based Capital Allocate Bank Credit and Cause a ‘Credit Crunch’ in the United States?” Journal of Money, Credit and Banking, Vol. 26, pp. 585–628.
Berger, Allen N., Richard J. Herring, and Girogio Szego, 1995, “The Role of Capital in Financial Institutions”, introduction to special issue of Journal of Banking and Finance, Vol. 19, 3 & 4, 393–741.
Bernanke, Ben S., and Cara S. Lown, 1991, “The Credit Crunch,” Brookings Papers on Economic Activity, Vol. 2, pp. 205–233.

- 25 -
Brock, Philip, and Liliana Rojas-Suárez, 2000, “Interest Spreads in Latin America: Facts, Theories, and Policy Recommendations,” in Why So High? Understanding Interest Rate Spreads in Latin America, Philip Brock and Liliana Rojas-Suárez (eds), (Washington: Inter-American Development Bank).
Catarineu-Rabell E., Patricia Jackson, and D. Tsomocos, 2003, “Procyclicality and the New Basel Accord-Banks’ Choice of Loan Rating System,” Bank of England Working Paper No. 181.
Cetorelli, N., and M. Gambera, 2001, “Banking Market Structure, Financial Dependence and Growth: International Evidence from Industry Data,” The Journal of Finance, Vol. 56, pp. 617–648.
Chami, Ralph, and Thomas F. Cosimano, 2001, “Monetary Policy with a Touch of Basel” IMF WP/01/150 (Washington: International Monetary Fund).
Chami, Ralph, Mohsin S. Khan, and Sunil Sharma, 2003, “Emerging Issues in Banking
Regulation,” IMF WP/03/101 (Washington: International Monetary Fund). Chiuri, Maria Concetta, Giovanni Ferri, and Giovanni Majnoni, 2002, “The Macroeconomic
Impact of Bank Capital Requirements in Emerging Economies: Past Evidence to Assess the Future,” Journal of Banking and Finance, Vol. 26, pp. 881–904.
Claessens, Stijn, and Luc Laeven, 2004, “What Drives Bank Competition? Some
International Evidence,” forthcoming Journal of Money, Credit and Banking. Davidson, Carl, and Raymond Deneckere, 1986, “Long-Run Competition in Capacity Short-
Run Competition in Price and the Cournot Model,” Rand Journal of Economics, Vol. 17, pp. 404–415.
De Bandt, Olivier, and E. Philip Davis, 2000, “Competition, Contestability and Market
Structure in European Banking Sectors on the Eve of the EMU,” Journal of Banking and Finance, Vol. 24, pp. 1045–1066.
Demirguc-Kunt, Asli, Luc Laeven, and Ross Levine, 2004, “Regulations, Market Structure,
Institutions, and the Cost of Financial Institutions, forthcoming Journal of Money, Credit and Banking.
Dewatripont, M., and Tirole, Jean, 1994, The Prudential Regulation of Banks, (Cambridge,
Massachusetts: MIT Press). Diamond, Douglas W. and Philip V. Dybvig, 1983, “Bank Runs, Deposit Insurance, and
Liquidity,” Journal of Political Economy, Vol. 91, pp. 401–419. Dionne, Georges, and Tarek M. Harchaoui (2003), “Banks’ Capital, Securitization and Credit
Risk: an Empirical Evidence for Canada,” CIRPÉE Working Paper 03-11 (Montreal: Centre Interuniversitaire sur le Risque, les Politiques Économiques et l’Emploi).

- 26 -
Estrella, Arturo, 2004, “The Cyclical Behavior of Optimal Bank Capital,” Journal of Banking
and Finance, Vol. 28, pp. 1469–1498. Ford, Guy, and Rae Weston, 2002, “Risk-Adjusted Performance of European Banks Under
the Basle Accord” (unpublished).
Froot, Kenneth A., and Jeremy C. Stein, 1998, “Risk Management, Capital Budgeting, and Capital Structure Policy for Financial Institutions: An Integrated Approach,” Journal of Financial Economics, Vol. 47, pp. 55–82.
Ghosh, Swati R., and Atish Gosh R, 1999, “East Asia in the Aftermath: Was there a Crunch?” IMF WP/99/38.
Holmstrom, Bengt, and Jean Tirole (1997), “Financial Intermediation, Loanable Funds, and the Real Sector,” Quarterly Journal of Economics, Vol. 113, pp. 663–691.
Jones, David, 2000, “Emerging Problems with the Basel Capital Accord: Regulatory Capital Arbitrage and Related Issues,” Journal of Banking and Finance, Vol. 24, pp. 35–58.
Kane, Edward J., 1985, The Gathering Crisis in Federal Deposit Insurance, (Cambridge, Massachusetts: MIT Press).
Kane, Edward J., 2000, “The Dialectical Role of Information and Disinformation in
Regulation-Induced Banking Crisis,” Pacific Basin Finance Journal Vol. 8, pp. 285–308.
Kane, Edward J., 2002, “Using Deferred Compensation to Strengthen the Ethics of Financial Regulation,” Journal of Banking and Finance, Vol. 26, pp. 439–463.
Kashyap, A. K., and J. C. Stein, 2004, “Cyclical Implications of the Basel II Capital Standards,” Economic Perspectives, 1st Quarter, pp. 18–31.
Koehn, Michael, and Anthony M. Santomero, 1980, “Regulation of Bank Capital and Portfolio Risk,” The Journal of Finance, Vol. 35, pp. 1235–1244.
Konishi, Masaru, and Yukihiro Yasuda, 2004, “Factors affecting risk taking: Evidence from Japan,” Journal of Banking and Finance, Vol. 28, pp. 215–232.
Kreps, David M., and Jose A. Scheinkman, 1983, “Quantity Precommitment and Bertrand Competition Yield Cournot Outcomes,” Rand Journal of Economics, Vol. 14, pp. 326–337.
Majnoni, Giovanni, Margaret Miller, and Andrew Powell, 2004, “Bank Capital and Loan Loss Reserves Under Basel II: Implications for Latin America and Caribbean Countries,” (unpublished; Washington: World Bank).

- 27 -
Marshall, David A., and Edward S. Prescott, 2000, “Bank Capital Regulation With and Without State-Contingent Penalties” (working paper; Chicago: Federal Reserve Bank).
Martínez-Pería, María Soledad, and Sergio Schmukler, 2001, “Do Depositors Punish Banks for Bad Behavior? Market Discipline, Deposit Insurance, and Banking Crises,” Journal of Finance, Vol. 56, No. 3.
Panzar, John C., and James N. Rosse, 1987, “Testing For “Monopoly’ Equilibrium,” Journal of Industrial Economics, Vol. 35, pp 443–456.
Pazarbasioglu, Ceyla, 1997, “A Credit Crunch? A Case Study of Finland in the Aftermath of the Banking Crisis,” IMF WP/96/135.
Peek, Joe, and Eric Rosengren, 1995, “The Capital Crunch: Neither a Borrower nor a Lender Be,” Journal of Money, Credit and Banking, Vol. 27, pp. 625–638.
———, 1997, “The International Transmission of Financial Shocks: The Case of Japan,” The American Economic Review, Vol. 87, 495–505.
———, 2000, “Collateral Damage: Effects of the Japanese Bank Crisis on Real Activity in the United States, The American Economic Review Vol. 90, pp. 30–45.
Rotemberg, Julio J., and Garth Saloner, 1986, “A Supergame–Theoretic Model of Price Wars During Booms,” The American Economic Review, Vol. 76, No.3, pp. 390–407.
Thakor, Anjan, 1996, “Capital Requirements, Monetary Policy, and Aggregate Bank Lending: Theory and Evidence,” Journal of Finance, Vol. 51, pp. 279–324.
Van Roy, Patrick, 2003, “The Impact of the 1988 Basel Accord on Banks’ Capital Ratios and Credit Risk-Taking: An International Study,” (Unpublished: European Center for Advanced Research in Economics and Statistics, RCARES, Brussels, Belgium).
Von Thadden, Ernst-Ludwig, 2004, “Bank Capital Adequacy Regulation under the New Basel Accord,” introduction to special issue of Journal of Financial Intermediation Vol. 13, pp. 90–95.
Woo, David, 1999, “In Search of a ‘Capital Crunch’: Factors Behind the Credit Slowdown in Japan,” IMF Working Paper No. WP/99/3.

- 28 -
Slowdown period
Credit/GDP at end of
slowdown
Change in credit/GDP
relative to peak level
Average yearly fall from peak
level
Recent performance:
average annual change through
2003
(percent) (percent)
Recent CasesArgentina 1999-2000 23.8 -0.4 -0.2 -4.4Bolivia 1999-2003 39.4 -15.6 -3.9Brazil 1995-2002 27.1 -9.7 -1.2 1.8Colombia 1999-2000 17.9 -4.8 -2.4 0.4Ecuador 1999-2003 20.0 -11.1 -2.2El Salvador 2001-2003 4.7 -0.3 -0.1Guyana 1999-2003 34.0 -10.9 -2.2Mexico 1995-2001 14.1 -19.9 -2.8 1.1Panama 2002-2003 82.5 -16.1 -8.1Paraguay 1998-2003 13.5 -10.1 -1.7Peru 2000-2003 20.3 -7.1 -1.8
Previous casesChile 1985-1991 37.0 -20.2 -3.4Venezuela 1983-1995 5.9 -23.4 -1.8 0.3
Sources: IMF,International Financial Statistics; authors' calculations.
1 Geometric average of GDP in years t and t +1, except for 2003, where that year's GDP is taken.
Credit to the Private Sector by Deposit Money Banks, scaled by GDP 1Table 1. Credit Slowdowns in Latin America
(percentage points)

- 29 -
Table 2. Adoption of the Basel Accord
(number of countries)
Latin America & Caribbean
Rest of the
World
Total Adoption Year
1988 0 16 16 1989 0 0 0 1990 0 1 1 1991 1 2 3 1992 0 3 3 1993 4 8 12 1994 3 5 8 1995 3 6 9 1996 1 4 5 1997 4 7 11 1998 2 3 5 1999 1 6 7 2000 1 6 7 2001 0 4 4 2002 0 0 0
Total dated 20 71 91
Total undated 2 32 34 Total adopting countries 22 103 125 Total nonadopting countries 2 9 11
Source: Survey of IMF desk economists; various country publications and websites;
Chiuri et al. (2002); IMF Monetary and Financial Systems Department regulatory
database; and World Bank online database on bank regulation and supervision.

- 30 -
Mean Standard Deviation Mean Standard
Deviation Mean Standard Deviation
Africa 20.24 30.31 12.10 14.26 13.04 9.50Asia 13.98 14.73 9.12 14.33 9.22 8.04Europe 16.84 14.62 10.22 11.68 12.08 10.56Middle East 20.38 28.52 10.02 12.97 14.46 10.43US and Canada 11.63 10.43 8.29 5.49 9.33 10.42Latin America & Caribbean 17.06 16.35 12.72 17.58 12.61 12.77
World average 15.82 17.07 10.50 13.61 10.80 10.09Number of observations 6,718 20,102 4,157
Mean Standard Deviation Mean Standard
Deviation Mean Standard Deviation
Africa 20.06 43.16 7.28 5.06 5.24 3.63Asia 5.04 49.91 3.00 3.09 2.35 3.28Europe 10.84 35.71 4.18 6.31 3.55 4.93Middle East 14.22 23.14 3.46 2.52 2.66 5.80US and Canada 12.41 14.49 3.75 2.23 3.80 5.03Latin America & Caribbean 10.89 39.22 7.60 8.05 6.46 5.70
World average 10.84 38.31 4.74 5.99 3.95 5.05Number of observations 19,546 19,305 19,337
Mean Standard Deviation Mean Standard
Deviation Mean Standard Deviation
Africa 48.77 22.57 58.72 30.18 64.17 48.43Asia 58.41 16.85 69.37 30.28 38.43 36.67Europe 45.86 23.71 57.69 35.93 34.60 32.00Middle East 45.15 17.12 55.04 25.92 51.79 31.33US and Canada 64.56 16.64 83.23 23.58 25.87 31.09Latin America & Caribbean 51.39 20.89 65.84 36.00 35.18 35.21
World average 50.57 21.85 61.48 34.29 37.60 34.94Number of observations 19,860 9,835 8,536
Mean Standard Deviation Mean Standard
Deviation Mean Standard Deviation
Africa 25.83 54.20 82.57 85.17 8.83 13.48Asia 30.22 88.12 89.12 116.81 3.87 7.41Europe 23.37 64.90 110.69 112.35 6.10 8.12Middle East 26.41 78.25 104.09 97.81 10.35 11.80US and Canada 24.01 59.58 268.92 197.73 2.15 1.85Latin America & Caribbean 20.61 63.89 117.52 118.90 5.30 15.15
World average 24.54 69.57 128.70 140.19 5.75 10.92Number of observations 15,770 6,797 13,854
Source: Bankscope and authors' calculations.
Net Loans/Total Assets Net Loans/Total Deposits & Borrowing
Liquid Assets/Total Deposits & Borrowing
Overhead/Total Assets
Total Capital Ratio Equity/Total Assets
Asset Composition and Liquidity
Table 3. Selected Banking Indicators by Region, 1987–2000
CapitalizationTier 1 Ratio
Profitability and Operational Costs
(Average percentages)
Return on Average Equity Net Interest Margin
Net Interest Income Nonperforming Loans Gross Loans
Loan Loss ProvisioningLoan Loss Provision/ Loan Loss Reserves/ Loan Loss Reserves/

- 31 -
Pre-Basel Post-Basel Pre-Basel Post-Basel Pre-Basel Post-Basel
Africa 15.35 22.36 11.64 14.85 11.93 12.48Asia 11.59 12.01 8.55 6.31 7.72 8.89Europe 16.14 16.38 11.61 9.75 9.78 11.76Middle East 20.56 17.30 7.97 9.45 13.05 15.47US and Canada 3.21 12.45 5.95 8.50 2.42 10.01Latin America & Caribbean 13.67 18.03 10.24 14.30 11.27 12.50
World average 14.52 15.20 9.62 10.24 8.14 10.74Number of observations 1,221 4,582 4,909 11,774 520 3,269
Pre-Basel Post-Basel Pre-Basel Post-Basel Pre-Basel Post-Basel
Africa 18.95 18.86 6.17 6.43 3.82 4.55Asia 6.59 -0.89 3.68 2.32 2.89 1.99Europe 13.85 10.26 6.95 3.79 4.33 3.28Middle East 14.86 12.53 3.85 2.65 3.26 2.22US and Canada 9.15 12.71 3.35 3.79 3.08 3.87Latin America & Caribbean 14.62 7.39 8.49 7.50 6.94 6.38
World average 12.32 9.12 5.71 4.36 4.35 3.77Number of observations 4,635 11,625 4,540 11,603 4,572 11,593
Pre-Basel Post-Basel Pre-Basel Post-Basel Pre-Basel Post-Basel
Africa 54.02 61.18 75.11 63.76 52.92 37.75Asia 57.38 61.76 70.76 68.54 39.26 28.18Europe 46.73 46.04 61.62 57.61 33.67 33.93Middle East 39.78 51.58 47.43 67.65 58.18 37.48US and Canada 59.54 65.02 63.72 84.40 38.16 25.14Latin America & Caribbean 50.63 51.48 61.67 67.25 37.79 30.31
World average 50.58 51.24 62.66 61.46 42.23 32.67Number of observations 4,748 11,714 2,178 5,934 1,817 5,373
Pre-Basel Post-Basel Pre-Basel Post-Basel Pre-Basel Post-Basel
Africa 36.17 20.86 70.24 105.76 6.13 6.28Asia 20.17 44.22 75.71 85.81 4.86 3.42Europe 33.10 21.63 142.83 105.88 7.96 5.66Middle East 24.79 34.93 119.84 79.05 11.20 9.02US and Canada 27.10 23.72 135.03 282.56 2.75 2.09Latin America & Caribbean 16.84 24.17 112.54 118.81 5.09 5.70
World average 23.55 25.42 111.07 140.83 6.39 5.09Number of observations 3,597 9,760 1,368 4,258 3,451 7,955
Note: For the subset of countries for which Basel adoption and/or implementation dates are available, this table shows the means of the above variables in each region before (BASELYR1 =0) and after (BASELYR1 =1) Basel Accord implementatio or adoption. Because of missing values, values between the two periods are not strictly comparable.
Source: Bankscope and authors' calculations.
Net Loans/Total Assets Net Loans/Total Deposits & Borrowing
Liquid Assets/Total Deposits & Borrowing
Overhead/Total Assets
Total Capital Ratio Equity/Total Assets
Asset Composition and Liquidity
Table 4. Selected Banking Indicators by Region, Pre and Post Basel
CapitalizationTier 1 Ratio
Profitability and Operational Costs
(Sample Means)
Return on Average Equity Net Interest Margin
Net Interest Income Nonperforming Loans Gross Loans
Loan Loss ProvisioningLoan Loss Provision/ Loan Loss Reserves/ Loan Loss Reserves/

- 32 -
Dep
ende
nt v
aria
ble
Equi
ty/T
otal
Ass
ets,
EQTA
OLS
Fixe
d ef
fect
s
OLS
with
C
ount
ry
Dum
mie
sO
LSFi
xed
effe
cts
OLS
with
C
ount
ry
Dum
mie
sO
LSFi
xed
effe
cts
OLS
with
C
ount
ry
Dum
mie
s
Base
l-rel
ated
Dum
my
Var
iabl
es
BASE
LYR:
Ado
ptio
n da
te0.
489
-0.1
821.
927
2.03
1
(1.6
5)*
(0.6
3)(6
.92)
***
(3.2
4)**
*
BASE
LYR1
: Im
plem
enta
tion
date
3.21
8-0
.526
1.69
22.
456
0.61
5-0
.386
1.53
41.
784
(9.4
3)**
*(1
.50)
(5.6
2)**
*(4
.16)
***
(2.2
8)**
*(1
.60)
(6.0
0)**
*(3
.31)
***
Fina
ncia
l dev
elop
men
t var
iabl
es
FIN
DEV
6.68
8-1
0.20
5-6
.756
(3.9
6)**
*(6
.57)
***
(5.1
2)**
*
BASE
LYR
FIN
DEV
-1.4
361.
400
-1.2
09
(0.8
2)(0
.73)
(0.8
6)
Num
ber o
f obs
erva
tions
16,6
8316
,683
16,7
9316
,793
9,09
89,
098
9,09
89,
098
16,6
8316
,683
16,7
9316
,793
R2
0.00
00.
000
0.11
20.
018
0.01
00.
000
0.09
70.
017
0.00
00.
000
0.11
20.
017
F-Te
sts f
or jo
int s
igni
fican
ce (p
-val
ue in
par
enth
eses
)
Fix
ed e
ffec
ts7.
20
(0.0
0)5.
96
(0.0
0)7.
20
(0.0
0)
Cou
ntry
dum
mie
s96
.79
(0.0
0)65
.47
(0.0
0)10
1.20
(0
.00)
Not
e: t-
ratio
s sho
wn
in p
aren
thes
es. I
n O
LS re
gres
sion
s, th
ey a
re c
alcu
late
d fr
om ro
bust
stan
dard
err
ors.
Sign
ifica
nce
at th
e 10
per
cent
(*),
5 pe
rcen
t (**
), an
d 1p
erce
nt (*
**) l
evel
s ind
icat
ed.
Tabl
e 5.
Mea
ns T
est f
or th
e R
atio
of E
quity
to A
sset
s
OLS
OLS
OLS
Full
Sam
ple
Excl
udin
g Ea
rly A
dopt
ers o
f Bas
elU
sing
Impl
emen
tatio
n D
ate

- 33 -
Dep
ende
nt v
aria
ble
Tota
l Cap
ital R
atio
, TO
TCAP
RAT
OLS
Fixe
d ef
fect
s
OLS
with
C
ount
ry
Dum
mie
sO
LSFi
xed
effe
cts
OLS
with
C
ount
ry
Dum
mie
sO
LSFi
xed
effe
cts
OLS
with
C
ount
ry
Dum
mie
s
Bas
el-r
elat
ed D
umm
y V
aria
bles
BASE
LYR:
Ado
ptio
n da
te-1
.593
0.05
12.
080
2.30
7
(1.6
4)(0
.05)
(2.5
8)**
*(1
.66)
BASE
LYR1
: Im
plem
enta
tion
date
1.51
3-0
.568
0.98
43.
025
0.68
21.
658
2.78
30.
381
(1.4
5)(0
.39)
(1.1
1)(1
.90)
*(0
.93)
(2.4
0)**
(5.9
0)**
*(0
.29)
Fina
ncia
l dev
elop
men
t var
iabl
es
FIN
DEV
-1.9
67-5
.356
-13.
223
(0.3
6)(0
.98)
(6.0
2)**
*
BASE
LYR
FIN
DEV
-10.
201
-9.8
49*
1.59
1
(1.8
2)*
(1.6
8)(0
.65)
Num
ber o
f obs
erva
tions
5,80
35,
803
5,80
35,
803
2,48
52,
485
2,48
52,
485
5,80
35,
803
5,80
35,
803
R2
0.00
10.
001
0.10
60.
018
0.00
10.
001
0.09
60.
008
0.00
00.
000
0.10
80.
018
F-Te
sts f
or jo
int s
igni
fican
ce (p
-val
ue in
par
enth
eses
)
Fi
xed
effe
cts
3.84
(0
.00)
2.58
(0
.00)
3.86
(0
.00)
C
ount
ry d
umm
ies
4,35
0.9
(0.0
0)7,
039.
0 (0
.00)
7,72
8.0
(0.0
0)
Not
e: t-
ratio
s sho
wn
in p
aren
thes
es. I
n O
LS re
gres
sion
s, th
ey a
re c
alcu
late
d fr
om ro
bust
stan
dard
err
ors.
Sign
ifica
nce
at th
e 10
per
cent
(*),
5 pe
rcen
t (**
), an
d 1
perc
ent (
***)
leve
ls in
dica
ted.
Tabl
e 6.
Mea
ns T
est f
or B
ank
Tota
l Cap
ital R
atio
OLS
OLS
OLS
Full
Sam
ple
Excl
udin
g Ea
rly A
dopt
ers o
f Bas
elU
sing
Impl
emen
tatio
n D
ate

- 34 -
Dep
ende
nt v
aria
ble
Net
Loa
ns/A
sset
s, N
LOAN
TA
OLS
Fixe
d ef
fect
s
OLS
with
C
ount
ry
Dum
mie
sO
LSFi
xed
effe
cts
OLS
with
C
ount
ry
Dum
mie
sO
LSFi
xed
effe
cts
OLS
with
C
ount
ry
Dum
mie
s
Bas
el-re
late
d D
umm
y V
aria
bles
BASE
LYR:
Ado
ptio
n da
te0.
850
-0.0
63-0
.475
8.07
5
(2.2
1)**
*(0
.21)
(1.0
8)(1
1.64
)***
BASE
LYR1
: Im
plem
enta
tion
date
1.02
20.
318
-0.3
202.
466
0.66
8-0
.085
-0.2
215.
794
(2.3
8)**
(0.9
3)(0
.72)
(3.8
4)**
*(1
.85)
*(0
.34)
(0.5
9)(9
.18)
***
Fina
ncia
l dev
elop
men
t var
iabl
es
FIN
DEV
35.5
0437
.138
21.8
42
(16.
28) *
**(1
8.38
)***
(13.
33)*
**
BASE
LYR
FIN
DEV
-31.
959
2.28
3-1
9.14
0
(13.
70) *
**(0
.88)
(10.
29)*
**
Num
ber o
f obs
erva
tions
16,4
6216
,462
16,4
6216
,462
8,89
48,
894
8,89
48,
894
16,4
6216
,462
16,4
6216
,462
R2
0.00
00.
000
0.27
30.
013
0.00
10.
001
0.07
60.
069
0.00
00.
000
0.27
30.
011
F-Te
sts f
or jo
int s
igni
fican
ce (p
-val
ue in
par
enth
eses
)
Fi
xed
effe
cts
27.9
7 (0
.00)
14.4
5 (0
.00)
27.9
7 (0
.00)
C
ount
ry d
umm
ies
239.
96
(0.0
0)22
3.12
(0
.00)
257.
37
(0.0
0)
Not
e: t-
ratio
s sho
wn
in p
aren
thes
es. I
n O
LS re
gres
sion
s, th
ey a
re c
alcu
late
d fr
om ro
bust
stan
dard
err
ors.
Sign
ifica
nce
at th
e 10
per
cent
(*),
5 pe
rcen
t (**
), an
d 1
perc
ent (
***)
leve
ls in
dica
ted.
Tabl
e 7.
Mea
ns T
est f
or B
ank
Net
Loa
ns a
s a P
erce
ntag
e of
Ass
ets
OLS
OLS
OLS
Full
Sam
ple
Excl
udin
g Ea
rly A
dopt
ers o
f Bas
elU
sing
Impl
emen
tatio
n D
ate
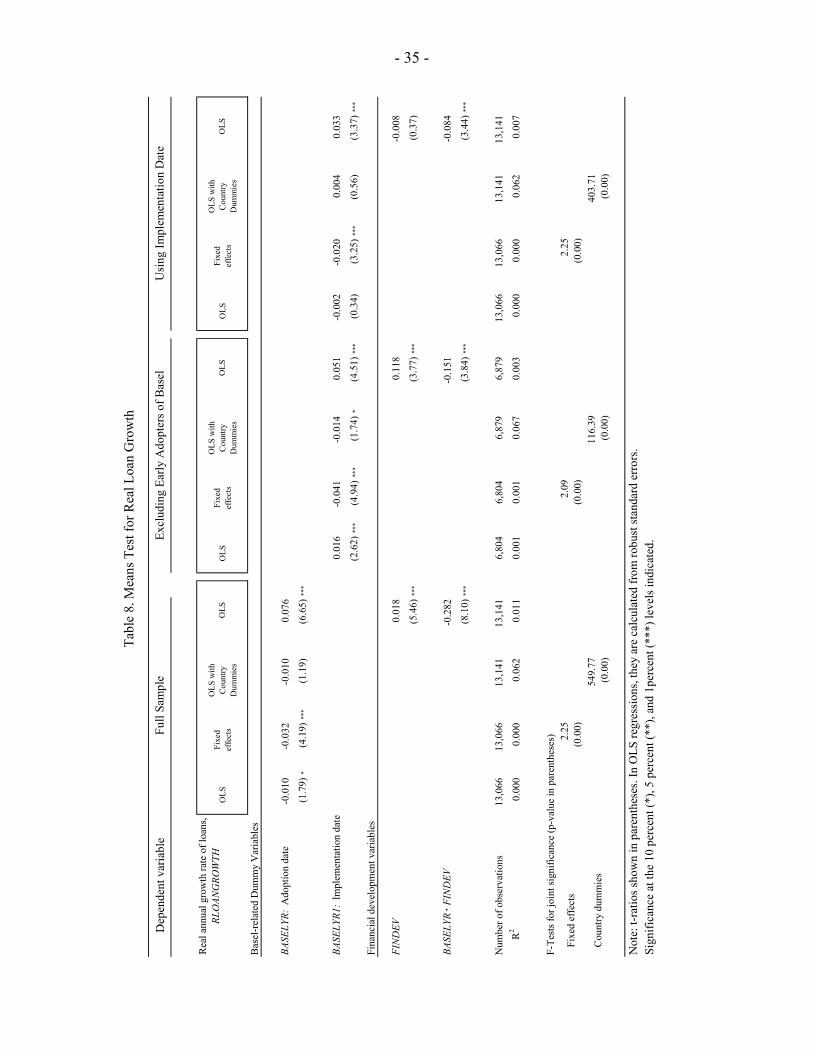
- 35 -
Dep
ende
nt v
aria
ble
OLS
Fixe
d ef
fect
s
OLS
with
C
ount
ry
Dum
mie
sO
LSFi
xed
effe
cts
OLS
with
C
ount
ry
Dum
mie
sO
LSFi
xed
effe
cts
OLS
with
C
ount
ry
Dum
mie
s
Bas
el-r
elat
ed D
umm
y V
aria
bles
BASE
LYR:
Ado
ptio
n da
te-0
.010
-0.0
32-0
.010
0.07
6
(1.7
9)*
(4.1
9)**
*(1
.19)
(6.6
5)**
*
BASE
LYR1
: Im
plem
enta
tion
date
0.01
6-0
.041
-0.0
140.
051
-0.0
02-0
.020
0.00
40.
033
(2.6
2)**
*(4
.94)
***
(1.7
4)*
(4.5
1)**
*(0
.34)
(3.2
5)**
*(0
.56)
(3.3
7)**
*
Fina
ncia
l dev
elop
men
t var
iabl
es
FIN
DEV
0.01
80.
118
-0.0
08
(5.4
6)**
*(3
.77)
***
(0.3
7)
BASE
LYR
FIN
DEV
-0.2
82-0
.151
-0.0
84
(8.1
0)**
*(3
.84)
***
(3.4
4)**
*
Num
ber o
f obs
erva
tions
13,0
6613
,066
13,1
4113
,141
6,80
46,
804
6,87
96,
879
13,0
6613
,066
13,1
4113
,141
R2
0.00
00.
000
0.06
20.
011
0.00
10.
001
0.06
70.
003
0.00
00.
000
0.06
20.
007
F-Te
sts f
or jo
int s
igni
fican
ce (p
-val
ue in
par
enth
eses
)
Fi
xed
effe
cts
2.25
(0
.00)
2.09
(0
.00)
2.25
(0
.00)
C
ount
ry d
umm
ies
549.
77
(0.0
0)11
6.39
(0
.00)
403.
71
(0.0
0)
Not
e: t-
ratio
s sho
wn
in p
aren
thes
es. I
n O
LS re
gres
sion
s, th
ey a
re c
alcu
late
d fr
om ro
bust
stan
dard
err
ors.
Sign
ifica
nce
at th
e 10
per
cent
(*),
5 pe
rcen
t (**
), an
d 1p
erce
nt (*
**) l
evel
s ind
icat
ed.
Tabl
e 8.
Mea
ns T
est f
or R
eal L
oan
Gro
wth
Rea
l ann
ual g
row
th ra
te o
f loa
ns,
RLO
ANG
ROW
TH
Full
Sam
ple
Excl
udin
g Ea
rly A
dopt
ers o
f Bas
elU
sing
Impl
emen
tatio
n D
ate
OLS
OLS
OLS

- 36 -
BASELYR1 2.244 6.905 8.323 0.572 -0.396 1.822 4.517 1.719 -6.420(3.59) *** (6.57) *** (6.94) *** (1.73) * (0.61) (2.04) ** (1.74) * (0.53) (1.08)
Bank risk variablesEQTA(-1) 0.010 -0.034 0.085 0.104 -0.172 -0.575
(0.29) (0.48) (6.24) *** (2.23) *** (0.99) (2.01) **
NPFRAT(-1) -0.41298 -0.427 -0.570 -0.515 -0.577 -0.881(2.57) *** (2.86) *** (14.04) *** (10.95) *** (2.97) *** (3.54) ***
Interaction risk and BASELYR1EQTA(-1) BASELYR1 -0.154 -0.154 -0.085 -0.188 -0.046 0.432
(3.53) *** (1.90) * (4.29) *** (3.66) *** (0.24) (1.39)
NPFRAT(-1) · BASELYR1 0.036 0.032 0.332 0.268 0.362 0.664(0.22) (0.20) (6.59) *** (4.90) *** (1.73) * (2.53) **
Macro controlsReal GDP growth, DRGDP 0.014 0.365 0.360 0.225 0.042 0.027 -0.317 1.164 1.170
(0.26) (4.47) *** (4.46) *** (7.18) *** (0.72) (0.46) (1.40) (4.26) *** (4.27) ***
Change in inverse velocity, DM2GDP 0.179 -0.163 -0.160 0.003 -0.079 -0.018 0.617 -0.419 -0.414(5.67) *** (2.65) *** (2.63) *** (0.26) (1.96) ** (2.02) ** (4.95) *** (2.84) *** (2.79) ***
Number of observations 14,041 4,882 4,882 14,041 4,850 4,850 11,760 3,551 3,551R 2 0.007 0.070 0.076 0.000 0.050 0.052 0.003 0.060 0.049F-test for fixed effects (p-value)
BASELYR1 0.015 0.034 0.000 -0.021 -0.002 -0.013 0.109 -0.016 0.113(2.17) ** (3.01) *** (0.03) (2.63) *** (0.18) (0.67) (4.76) *** (0.50) (1.88) *
Bank risk variablesEQTA(-1) 0.002 -0.001 0.004 0.007 0.006 0.009
(4.28) *** (0.60) (9.49) *** (5.32) *** (3.69) *** (2.98) ***
NPFRAT(-1) -0.002 -0.002 -0.004 -0.003 -0.004 0.000(1.93) * (2.58) *** (3.22) *** (2.24) ** (1.90) * (0.05)
Interaction risk and BASELYR1EQTA(-1) BASELYR1 0.001 0.003 0.001 0.001 -0.004 -0.007
(0.96) (2.58) *** (2.02) ** (0.65) (2.47) ** (2.20) **
NPFRAT(-1) · BASELYR1 -0.001 -0.001 0.000 0.000 0.002 -0.002(1.16) (0.85) (0.18) (0.31) (0.92) (0.68)
Macro controlsReal GDP growth, RGDPG 0.017 0.019 0.019 0.017 0.017 0.018 0.016 0.002 0.020
(23.41) *** (16.73) *** (16.87) *** (22.66) *** (13.54) *** (13.81) *** (8.73) *** (7.91) *** (7.26) ***
Change in inverse velocity, DM3GDP 0.003 0.004 0.004 0.003 0.036 0.003 0.007 0.003 0.003(9.49) *** (5.06) *** (5.07) *** (8.90) *** (4.14) *** (3.79) *** (6.50) *** (2.28) ** (2.18) **
Number of observations 13,063 4,593 4,593 13,063 4,563 4,563 11,110 3,368 959R 2 0.065 0.079 0.086 0.057 0.076 0.058 0.047 0.063 0.049F-test for fixed effects (p-value)
Note: t-ratios shown in parentheses, except in the case of IV regressions, where z-statistics are shown. For OLS regressions, t-ratios areare calculated from robust standard errors. Significance at the 10%(*), 5% (**) and 1% (***) levels is indicated.
1 Instruments are included for the two bank risk variables:EQTA and NPFRAT .The instruments used are their lagged values and contemporaneousvalues of the macro controls.
28.20 (0.00) 11.25 (0.00) 11.20 (0.00)
2.23 (0.00) 1.85 (0.00) 1.90 (0.00)
Table 9. Effects of the Basel Accord on Bank Loans
IV - Fixed Effects1
IV - Fixed Effects1Dependent variable: Real growth rate of loans, RLOANGROWTH
Dependent variable: Net Loans/Assets, NLOANTAOLS Fixed Effects
OLS Fixed Effects

- 37 -
Dependent variable:
BASELYR1 8.564 3.443 4.380 0.037 0.086 0.050(9.22) *** (2.70) *** (2.60) ** (3.36) *** (3.85) *** (1.66) *
Bank risk variablesEQTA(-1) 0.039 0.015 0.002 -0.001
(1.16) (0.20) (4.25) *** (0.61)
NPFRAT(-1) -0.408 -0.402 -0.002 -0.002(2.58) *** (2.78) *** (1.93) *** (2.02) **
Interaction risk and BASELYR1EQTA(-1) BASELYR1 -0.180 -0.059 0.000 0.002
(4.25) *** (0.71) (0.60) (1.76) *
NPFRAT(-1) · BASELYR1 0.070 0.058 -0.001 -0.001(0.42) (0.39) (1.37) (1.06)
Macro controlsRGDPG -0.006 0.401 0.399 0.017 0.019 0.019
(0.11) (5.26) *** (5.24) *** (22.49) *** (16.28) *** (16.43) ***
DM3GDP 0.171 -0.274 -0.273 0.003 0.004 0.004(5.40) *** (4.26) *** (4.23) *** (9.65) *** (5.66) *** (5.59) ***
FINDEV 23.059 21.265 21.475 0.000 -0.006 -0.015(9.97) *** (4.26) *** (4.04) *** (0.02) (0.09) (0.22)
FINDEV BASELYR1 -21.998 2.890 1.973 -0.051 -0.153 -0.119(9.97) *** (0.55) (0.36) (2.21) ** (2.26) ** (1.67) *
Number of observations 14,041 4,850 4,850 13,063 4,563 4,563R 2 0.016 0.112 0.112 0.067 0.092 0.094
BASELYR1 3.447 -0.325 2.199 0.053 0.077 0.028(3.14) *** (0.24) (1.24) (3.89) *** (3.24) *** (0.88)
Bank risk variablesEQTA(-1) 0.081 0.041 0.002 -0.001
(2.10) ** (0561) (4.19) *** (0.97)
NPFRAT(-1) -0.408 -0.391 -0.002 -0.002(2.52) ** (2.62) *** (1.91) * (2.12) **
Interaction risk and BASELYR1EQTA(-1) BASELYR1 -0.159 -0.158 0.001 0.003
(3.37) *** (1.89) * (1.14) (2.32) ***
NPFRAT(-1) · BASELYR1 0.116 0.078 -0.002 -0.001(0.69) (0.49) (1.42) (0.87)
Macro controlsRGDPG 0.129 0.255 0.247 0.018 0.020 0.020
(2.29) *** (3.16) *** (3.07) *** (21.25) *** (15.42) *** (15.60) ***
DM3GDP -0.161 -0.581 -0.587 0.009 0.010 0.010(3.01) *** (5.95) *** (6.04) *** (11.82) *** (9.10) *** (9.28) ***
FINDEV 36.132 21.545 22.027 0.000 -0.099 -0.111(13.38) *** (3.16) *** (3.16) *** (0.00) (1.23) (1.35)
FINDEV BASELYR1 6.024 24.868 23.241 -0.142 -0.118 -0.085(1.79) * (3.51) *** (3.21) *** (3.33) *** (1.36) (0.96)
Number of observations 7,392 2,687 3,687 6,801 2,469 2,469R 2 0.079 0.146 0.150 0.092 0.119 0.124
Note: t-ratios shown in parentheses, are calculated from robust standard errors. Significance at the10 percent (*), 5 percent (**), and 1 percent (***) levels is indicated.
RLOANGROWTH
Table 10. Effects of the Basel Accord on Bank Loans
OLS Regressions, Sample Excluding the Early Adopting Countries
OLS Regressions, Full sampleNLOANTA

- 38 -
BASELYR1 1.684 1.233 1.814 0.014 0.014 -0.011(3.06) *** (1.00) (1.51) (1.83) * (1.08) (0.62)
Bank risk variablesEQTA(-1) 0.023 -0.007 0.002 0.000
(0.71) (0.09) (4.47) *** (0.45)
NPFRAT(-1) -0.405 -0.408 -0.003 -0.003(2.16) ** (2.36) *** (2.61) *** (2.61) ***
Interaction risk and BASELYR1EQTA(-1) BASELYR1 -0.188 -0.046 0.000 0.002
(4.67) *** (0.57) (0.62) (1.74) *
NPFRAT(-1) · BASELYR1 0.132 0.126 -0.001 -0.001(0.70) (0.71) (0.99) (0.78)
Macro controlsReal GDP growth, RGDPG 0.269 0.023 0.024 0.017 0.018 0.018
(5.29) *** (0.29) (0.30) (19.69) *** (13.17) *** (13.21) ***
Change in inverse velocity, DM3GDP 0.017 -0.019 -0.019 0.003 0.004 0.004(0.60) (0.30) (0.29) (8.16) *** (4.75) *** (4.79) ***
Number of observations 14,120 4,882 4,882 13,138 4,593 4,593R 2 0.291 0.290 0.291 0.106 0.162 0.164F-test for joint significance of country dummies (p-value in parentheses)
234.58 (0.00)
210.94 (0.00)
214.76 (0.00)
56.04 (0.00)
184.51 (0.00)
105.24 (0.00)
Note: t-ratios shown in parentheses, are calculated from robust standard errors. Significance at the 10 percent (*), 5 percent (**), and 1 percent (***) levels are indicated.
Table 11. Effects of the Basel Accord on Bank Loans
NLOANTAOLS Regressions, including country-specific dummy variables
RLOANGRWTH

- 39 -
Basel-related Dummy Variables
BASELYR: Adoption date 3.647 2.681 1.833 0.035(5.28) *** (2.48) ** (2.49) ** (3.07) ***
BASELYR1: Implementation date 3.683 2.681 1.557 0.037(5.39) *** (2.48) *** (2.12) ** (3.25) ***
Region Dummy Variables
AFRICA 1.303 1.307 1.986 1.802 3.243 3.084 -0.009 -0.002(1.42) (1.44) (0.58) (0.54) (2.17) ** (2.09) ** (0.52) (0.14)
EUROPE 1.888 1.124 3.861 2.607 -5.234 -4.313 0.054 0.023(2.01) ** (1.53) (2.29) ** (1.86) * (4.41) ** (4.89) *** (2.18) ** (1.49)
ASIA -1.450 -1.783 -1.449 -1.957 6.544 6.450 0.055 0.046(1.93) * (2.34) ** (0.94) (1.68) * (8.33) *** (8.68) *** (4.30) *** (3.83) ***
USCANADA -2.463 -4.387 -4.599 -10.333 6.592 8.611 0.123 -0.080(2.89) *** (6.82) *** (5.30) *** (11.96) *** (1.36) (5.28) *** (0.80) (3.28) ***
MIDEAST -2.371 -2.368 7.016 7.016 -10.975 -11.156 0.046 0.047(2.87) *** (2.89) *** (3.52) *** (3.52) *** (12.73) *** (13.00) *** (3.38) *** (3.47) ***
BASELYR·AFRICA -0.473 -0.476 4.065 4.333 5.280 5.602 0.002 -0.010(0.36) (0.36) (0.90) (0.97) (2.64) *** (2.81) *** (0.08) (0.45)
BASELYR·EUROPE -5.920 -5.280 -3.517 -2.209 -1.239 -2.167 -0.070 -0.040(5.98) *** (6.57) *** (1.86) * (1.34) (0.96) (2.11) ** (2.75) *** (2.35) **
BASELYR·ASIA -6.173 -5.928 -3.002 -2.259 2.058 2.821 -0.105 -0.098(7.18) *** (7.10) *** (1.71) * (1.58) (2.10) ** (2.92) *** (7.04) *** (6.80) ***
BASELYR·USCANADA -3.228 -1.125 6.562 5.486 3.921 -0.118 0.092(3.54) *** (1.56) (5.34) *** (1.12) (2.23) ** (0.77) (3.53) ***
BASELYR·MIDEAST -2.164 -2.201 -5.942 -5.942 9.969 10.245 -0.019 -0.020(2.24) ** (2.29) ** (2.31) ** (2.31) ** (8.16) *** (8.40) *** (1.03) (1.13)
Number of observations 16,793 16,793 5,803 5,803 16,572 16,572 13,141 13,141R2 0.025 0.025 0.031 0.036 0.092 0.092 0.008 0.008
Note: t-ratios shown in parentheses, calculated from robust standard errors.Significance at the 10 percent (*), 5 percent (**), and 1 percent (***) levels also shown.
Total Capital RatioEquity/Total Assets RLOANGRWTH
Real Loan GrowthNLOANTA
Net Loans/Assets
Capitalization Lending Behavior
Table 12. Means Tests for Capitalization and Lending—Latin America and Other Regions
EQTA TOTCAPRAT

- 40 -
BASELYR1 3.958 3.938 7.079 0.005 0.08297 0.005(1.96) * (1.71) * (2.50) ** (0.23) (4.01) *** (0.14)
Bank risk variablesEQTA(-1) 0.084 0.037 -0.00233 -0.0052
(0.68) (0.41) (1.51) (2.80) ***
NPFRAT(-1) -0.87905 -0.8571 -0.00415 -0.0052(2.00) ** (1.92) * (1.76) * (2.15) **
Interaction risk and BASELYR1EQTA(-1) BASELYR1 -0.200 -0.220 0.004 0.006
(1.50) (2.02) ** (2.31) ** (2.70) ***
NPFRAT(-1) · BASELYR1 0.498 0.464 0.002 0.003(1.11) (1.03) (0.67) (1.05)
Macro controlsRGDPG 0.682 0.65304 0.660 0.018 0.021 0.021
(7.24) *** (5.50) *** (5.54) *** (11.54) *** (10.80) *** (10.90) ***
DM3GDP 0.401 -0.022 -0.030 0.014 0.019 0.018(5.37) *** (0.12) (0.17) (8.15) *** (7.51) *** (7.52) ***
Number of observations 2,908 1,439 1,439 2,591 1,308 1,308R 2 0.025 0.121 0.128 0.086 0.131 0.142
Note: t-ratios shown in parentheses, are calculated from robust standard errors. Significance at the 10 percent (*), 5 percent (**), and 1 percent (***) levels is indicated.
NLOANTA RLOANGROWTH
Table 13. Effects of the Basel Accord on Bank Loans in Latin America
OLS Regressions

- 41 -
BASELYR1 11.800 0.894 4.083 0.016 0.022 -0.047(4.38) *** (0.22) (0.92) (0.54) (0.60) (1.07)
Bank risk variablesEQTA(-1) 0.144 0.038 -0.002 -0.005
(1.15) (0.43) (1.53) (2.82) ***
NPFRAT(-1) -0.860 -0.837 -0.006 -0.007(1.87) * (1.79) * (2.17) ** (2.43) **
Interaction risk and BASELYR1EQTA(-1) BASELYR1 -0.258 -0.229 0.004 0.006
(1.93) * (2.08) ** (2.28) ** (2.70) ***
NPFRAT(-1) · BASELYR1 0.513 0.478 0.003 0.004(1.09) (1.01) (1.16) (1.42)
Macro controlsRGDPG 0.613 0.595 0.601 0.018 0.022 0.022
(6.59) *** (5.34) *** (5.38) *** (11.65) *** (11.30) *** (11.30) ***
DM3GDP 0.257 -0.111 -0.121 0.015 0.020 0.019(3.47) *** (0.66) (0.72) (8.25) *** (7.82) *** (7.30) ***
FINDEV 43.951 11.240 11.441 -0.055 -0.398 -0.363(8.26) *** (0.91) (0.92) (0.87) (2.93) *** (2.75) ***
FINDEV BASELYR1 -34.183 21.513 22.056 -0.090 0.318 0.283(4.89) *** (1.56) (1.60) (1.04) (2.02) ** (1.83) *
Number of observations 2,908 1,439 1,439 2,591 1,308 1,308R 2 0.051 0.135 0.142 0.088 0.137 0.147
Note: t-ratios shown in parentheses, are calculated from robust standard errors. Significance at the 10 percent (*), 5 percent (**), and 1 percent (***) levels is indicated.
NLOANTA RLOANGROWTH
Table 14. Effects of the Basel Accord on Bank Loans in Latin America OLS Regressions

- 42 -
BASELYR1 3.012 0.462 2.343 -0.038 0.002 -0.048(1.75) * (0.17) (0.73) (1.82) * (0.10) (1.45)
Bank risk variablesEQTA(-1) 0.141 -0.035 -0.001 -0.003
(1.11) (0.37) (0.54) (1.78) *
NPFRAT(-1) -0.969 -0.990 -0.004 -0.004(2.12) ** (2.14) ** (1.58) (1.82) *
Interaction risk and BASELYR1EQTA(-1) BASELYR1 -0.285 -0.123 0.003 0.004
(2.12) ** (1.07) (1.76) * (2.03) **
NPFRAT(-1) · BASELYR1 0.704 0.712 0.000 0.001(1.53) (1.53) (0.05) (0.30)
Macro controlsRGDPG 0.274 0.168 0.184 0.015 0.019 0.019
(2.78) *** (1.18) (1.30) (8.87) *** (8.21) *** (8.14) ***
DM3GDP -0.116 0.218 0.227 0.015 0.021 0.021(2.01) ** (1.36) (1.41) (7.83) *** (7.58) *** (7.42) ***
F-Test for joint significance of country dummies (p-value in parentheses)
50.78 (0.00)
91.13 (0.00)
81.64 (0.00)
5.99 (0.00)
28.50 (0.00)
20.20 (0.00)
Number of observations 2,908 1,439 1,439 2,591 1,308 1,308R 2 0.226 0.249 0.255 0.128 0.202 0.147
Note: t-ratios shown in parentheses, are calculated from robust standard errors. Significance at the 10 percent (*), 5 percent (**), and 1percent (***) levels is indicated.
NLOANTA RLOANGROWTH
Table 15. Effects of the Basel Accord on Bank Loans in Latin America OLS Regressions with Country-Specific Dummy Variables