dielectric properties of colon polyps, cancer, and normal
TRANSCRIPT

Dielectric properties of colon polyps, cancer, and normal mucosa: Ex vivomeasurements from 0.5 to 20 GHz
Marta Guardiolaa)BCN-MedTech, Department of Information and Communication Technologies, Universitat Pompeu Fabra, Barcelona 08018, Spain
Santiago BuitragoCommSensLab, Department of Signal Theory and Communications, Universitat Polit�ecnica de Catalunya, Barcelona 08034, Spain
Gl�oria Fern�andez-EsparrachEndoscopy Unit, Institut de Malalties Digestives i Metab�oliques, IDIBAPS, CIBERehd, Hospital Cl�ınic, Universitat de Barcelona,Barcelona 08036, Spain
Joan M. O’Callaghan and Jordi RomeuCommSensLab, Department of Signal Theory and Communications, Universitat Polit�ecnica de Catalunya, Barcelona 08034, Spain
Miriam CuatrecasasPathology Department, CDB, Hospital Cl�ınic, IDIBAPS, Universitat de Barcelona Banc de Tumors Biobanc Clinic-IDIBAPS,Barcelona 08036, Spain
Henry C�ordovaEndoscopy Unit, Institut de Malalties Digestives i Metab�oliques, IDIBAPS, CIBERehd, Hospital Cl�ınic, Universitat de Barcelona,Barcelona 08036, Spain
Miguel �Angel Gonz�alez BallesterBCN-MedTech, Department of Information and Communication Technologies, Universitat Pompeu Fabra, Barcelona 08018, SpainICREA, Barcelona 08010, Spain
Oscar CamaraBCN-MedTech, Department of Information and Communication Technologies, Universitat Pompeu Fabra, Barcelona 08018, Spain
(Received 11 October 2017; revised 9 May 2018; accepted for publication 18 May 2018;published 15 June 2018)
Purpose: Colorectal cancer is highly preventable by detecting and removing polyps, which are theprecursors. Currently, the most accurate test is colonoscopy, but still misses 22% of polyps due tovisualization limitations. In this paper, we preliminary assess the potential of microwave imaging anddielectric properties (e.g., complex permittivity) as a complementary method for detecting polypsand cancer tissue in the colon. The dielectric properties of biological tissues have been used in a widevariety of applications, including safety assessment of wireless technologies and design of medicaldiagnostic or therapeutic techniques (microwave imaging, hyperthermia, and ablation). The main pur-pose of this work is to measure the complex permittivity of different types of colon polyps, cancer,and normal mucosa in ex vivo human samples to study if the dielectric properties are appropriate forclassification purposes.Methods: The complex permittivity of freshly excised healthy colon tissue, cancer, and histologicalsamples of different types of polyps from 23 patients was characterized using an open-ended coaxialprobe between 0.5 and 20 GHz. The obtained measurements were classified into five tissue groupsbefore applying a data reduction step with a frequency dispersive single-pole Debye model. The clas-sification was finally compared with pathological analysis of tissue samples, which is the gold stan-dard.Results: The complex permittivity progressively increases as the tissue degenerates from normal tocancer. When comparing to the gold-standard histological tissue analysis, the sensitivity and speci-ficity of the proposed method is the following: 100% and 95% for cancer diagnosis; 91% and 62%for adenomas with high-grade dysplasia; 100% and 61% for adenomas with low-grade dysplasia; and100% and 74% for hyperplastic polyps, respectively. In addition, complex permittivity measurementswere independent of the lesion shape and size, which is also an interesting property comparing tocurrent colonoscopy techniques.Conclusions: The contrast in complex permittivities between normal and abnormal colon tissuespresented here for the first time demonstrate the potential of these measurements for tissue classifica-tion. It also opens the door to the development of a microwave endoscopic device to complement theoutcomes of colonoscopy with functional tissue information. © 2018 American Association of Physi-cists in Medicine [https://doi.org/10.1002/mp.13016]
3768 Med. Phys. 45 (8), August 2018 0094-2405/2018/45(8)/3768/15 © 2018 American Association of Physicists in Medicine 3768

Key words: colorectal cancer, Debye model, dielectric characterization, ex vivo tissues, microwaveimaging
1. INTRODUCTION
Colorectal cancer (CRC) is a serious and increasing healthproblem in countries with a Westernized lifestyle where, inaverage, affects 1 in 20 men and 1 in 30 women over 50 yrold.1 Worldwide CRC is the third most common cancer andthe fourth most deadly one just behind lung, liver, and stom-ach cancer.2 In average, the 5-yr survival rate is 65%, how-ever, it is highly dependent on the stage of diagnosis.Fortunately, CRC is a disease that can be cured in more than90% of patients if detected at an early stage.3 The develop-ment of CRC is characterized by an ordered series of eventsthat are referred to as adenoma–carcinoma sequence: healthymucosa develops dysplasia and forms small polyps, calledadenomas, which may grow and eventually become adenocar-cinomas4 unless resected.5 Several systematic reviews of theliterature have shown that CRC screening is cost-effectiveand prospective studies with a large number of cases demon-strate a reduction in CRC risk during follow-up patientsundergoing colonoscopy screening,6 which is the standard inclinical routine. Besides colonoscopy, there are other meth-ods for CRC screening such as stool-based tests, double-con-trast barium edema, and CT colonography.7 If there issuspicion of polyps in these tests, a colonoscopy will beneeded.7
To date, colonoscopy is the most effective diagnostic andtherapeutic technique for the prevention of CRC, since itallows the identification of polyps with a relatively goodaccuracy. It is also the only method able to remove tissuesamples (e.g., polyps) in the entire colon for subsequent his-tological analysis. Several prospective studies demonstratethat colonoscopy with polypectomy (removal of polyps)reduces the incidence of CRC by 40–90%.8,9 Nevertheless,colonoscopy is far from being perfect: 22% of polyps are notdetected10 and the risk of cancer after a negative colonoscopyis still 7.9%.11 The main cause of this lack of efficacy is thevisualization limitation12 of the optical camera placed at thetip of the endoscope. Studies indicate that 13.4% of the colonsurface area might not be visualized during a standard colo-noscopy13 due to reduced field of vision (<180°), inhomoge-neous illumination, colon angulations and folds, and poorcleaning. Another limitation of colonoscopy is the subjectiv-ity in the assessment of several characteristics of the lesionssuch as size, position, and tissue classification, which highlydepends on the experience of the endoscopist. The final diag-nosis is subsequently based on the results of the histologicalanalysis of the resected tissues, which is considered the goldstandard. As a security measure, current clinical guidelines3
therefore recommend removing all lesions found in a colono-scopy study, including small lesions (<5 mm) that are oftenbenign polyps. A pathologist then analyses all lesions andemits a histology report. This clinical workflow is labor- and
time-intensive, making the processing of these patient datainefficient and significantly increasing the burden for thehealthcare system.
In recent years, several devices and technologies havebeen developed to improve the detection rate of polyps suchas high-definition endoscopes, endoscopes with multiplelenses (retrovision capability), and mucosal flattening acces-sories.14 Advances in computer vision may also help in thedetection of morphological changes in colon images, such asshape, color, or texture,15 which may indicate the presence ofan abnormality. The current trend in colonoscopy is to pro-vide additional information during the exploration (oftencalled in situ diagnosis) to help doctors in their decision-mak-ing. For example, magnification14 of the image may help todetect morphological changes; electronic chromoendoscopynarrow band imaging may also enhance the visualization ofthe vascularization abnormalities related to cancer.16 How-ever, all these techniques exploit the same contrast mecha-nism based on the optical image, thus being restricted toinformation visualized with the camera at the tip of the endo-scope. To overcome this limitation a different contrast mecha-nism is needed. Some methods such as near infraredRaman17 or terahertz spectroscopy18 have also been proposedfor cancer diagnosis purposes. However, there is not a tech-nique yet that can distinguish between benign and malignantlesions during the study.
Microwave imaging has the potential to complement con-ventional colonoscopy to improve both polyp detection rateand in situ tissue classification. Microwaves can generateimages without restriction of the field of view (360°) andoffer a fair trade-off between resolution and light opaque tis-sue penetration,19 therefore, potentially reducing visualizationproblems of conventional colonoscopy. In addition, micro-waves can provide a quantitative differentiation of normaland abnormal tissues based in their dielectric properties.20
Finally, the technology is safe (low power and nonionizingradiation) and portable. For these reasons microwave imagingis a promising method for population screening, diagnosisand monitoring of cancer patients.
Microwave imaging tries to evaluate objects hidden orembedded in a structure (or medium) using electromagnetic(EM) waves in the regime of the microwaves. In the field ofmedicine, microwaves have been established as a good solu-tion for treatment of cancer (hyperthermia and ablation)21
and for monitoring of vital signs.22 Furthermore, there isongoing research studying microwave imaging for image-based diagnosis in an extensive number of applications: acuteischemia or cerebral hemorrhage,23 pulmonary edema, uri-nary incontinence, osteoporosis,24 and breast cancer detec-tion25,26; some of these studies are already in clinicalphases.27 As far as we know, microwave imaging has neverbeen proposed before for endoscopic applications.
Medical Physics, 45 (8), August 2018
3769 Guardiola et al.: Dielectric properties of colon tissues 3769

To assess the feasibility of microwave imaging for CRCdiagnosis it is crucial to have good dielectric contrast betweenhealthy colon, different types of polyps, and cancer tissuesover the frequency band of interest. It has previously beendemonstrated that the complex permittivity of some cancerand healthy tissues change noticeably.20 However, to the bestof our knowledge, there is no available data for normal andabnormal colon tissues in humans over 900 MHz. Done-Siket al.28,29 measured the complex permittivity of colon cancerand healthy colon of nude mice over 0.2–5 GHz band, whileJoines et al.30 reported the complex permittivity of healthyand malignant colon human samples between 50 and900 MHz band. Gabriel et al. extended the healthy colonmeasurements to the 0.5–20 GHz band using ovinemodels.31–33
In this paper, we present data from dielectric propertiesmeasured on ex vivo human samples of different types ofcolon polyps and healthy colon tissues, which was not avail-able in the literature. Measurements on dielectric propertieswere acquired using the open-ended coaxial probe methodacross the frequency range 0.5 to 20 GHz. With these datawe formed five groups of tissues based on the similarities intheir dielectric properties. Subsequently, we reduced the datausing a Debye model. The remainder of this paper is orga-nized as follows. Section 2 describes the methodology forobtaining tissue samples, conducting dielectric spectroscopyand data analysis. Section 3 presents the results obtainedfrom the human tissue study. Section 4 discusses the applica-bility of dielectric property data to colonoscopy tests. Finally,Section 5 summarizes the main conclusions of this study.
2. MATERIALS AND METHODS
This work was performed at the Endoscopy Unit of Hospi-tal Cl�ınic of Barcelona (HCB), after being approved by theEthical Committee of Clinical Investigation at HCB. Allpatients signed an informed consent permitting colorectalexaminations and use of their data for research purposes. Atotal of 23 patients undergoing screening colonoscopies,polypectomies, and surgical colectomies were enrolled in thestudy. Between one and seven specimens per patient werecollected, leading to a total of 59 freshly excised samples ofdifferent histological types of polyps, healthy colon, andCRC tissue (Table I), thus providing a complete overview ofthe colon pathology. The measurement protocol was nonde-structive for subsequent pathological analysis of the samesample and was designed to reduce the manipulation of thesample and the time between excision and measurement.
In the remaining of this section, we first present colon can-cer disease and the existing tissue classification methods usedin daily clinical routine. We then describe the protocol fol-lowed to measure the complex permittivity of freshly excisedcolon samples using a precision open-ended coaxial probe. Astatistical analysis was carried out to assess the quality of theobtained measurements and the corresponding tissue classifi-cation based on dielectric data. We finally explain the fittingof the measured data to a single-pole Debye model.
2.A. Classification of samples
Colon polyps are slow-growing overgrowths of the colonicmucosa originating from superficial glandular epithelial celllining in the colon and rectum, and generally protruding intothe lumen. When a polyp degenerates into cancer it may infil-trate into the wall (invasive). Colon polyps can be classifiedaccording to their histological and shape characteristics, asfollowing. Histology defines tissue and cell anatomy basedon its appearance under the microscope and sets the grade ofdysplasia (i.e., abnormality of development or cell anomalyof growth and differentiation). Depending on the grade ofdysplasia, polyps can be diagnosed as either neoplastic ornon-neoplastic, if they have lost its normal differentiation ornot, respectively. Hyperplastic polyps are the most commontype of non-neoplastic or benign proliferations of cells. Neo-plastic lesions or adenomas can be categorized according totheir histological appearance into: tubular, villous, ortubulovillous,34 and according to their grade of dysplasia.Adenomas with low-grade dysplasia (LGD) are more similarto healthy mucosa, while malignant adenomas can presenthigh-grade dysplasia (HGD) or have already degenerated toadenocarcinoma.35 Recently, serrated variants of polyps havebeen considered as a new category of neoplastic polypsbecause of their malignant potential.36,37 Figures 1 and 2 pre-sent pictures of five different colon tissue samples and theircorresponding histology images, respectively. Histologyimages show the tissue composition and shape characteristicsof the cells under study. Normal mucosa [see Fig. 2(a)] is theinnermost layer of colon wall, which is composed by epithelialcells that form glandular crypts, and connective tissue (calledlamina propria) filling the empty spaces. Polyps are also com-posed by epithelial cells but with certain modifications: forexample, hyperplastic polyps [Fig. 2(b)] present a serratedand dilated contour of the glandular crypts; tubular adenomas[Fig. 2(c)] show elongated glandular crypts and cellular pro-liferation. Figure 2(d) shows the adenoma–carcinomasequence in the same sample. An infiltrating adenocarcinomais originated on a tubular adenoma that presents an in situadenocarcinoma in the middle. Finally, Fig. 2(e) shows aninvasive adenocarcinoma infiltrating the muscular layer.
The shape of polyps is usually categorized during a colo-noscopy exploration using the standard Paris classification,38
as can be seen in Fig. 3. This classification method dividesthe polyps into protruded (e.g., pedunculated, Ip; sessile, Is),
TABLE I. Morphology, size, and number of polyps by malignant potential(LGD, HGD, are low- and high-grade dysplasia, respectively) and total.
Morphology Size (mm) LGD HGD N
Tubular adenoma 6–25 16 6 22
Villous adenoma 7 0 1 1
Tubulovillous adenoma 25–60 2 0 2
Hyperplastic 3–12 – – 8
Sessile serrated 18 – – 5
Medical Physics, 45 (8), August 2018
3770 Guardiola et al.: Dielectric properties of colon tissues 3770

and nonprotruded (e.g., slightly elevated, IIa; flat, IIb;slightly depressed, IIc; excavated, III). We measured 9 pedun-culated, 11 sessile, and 18 slightly elevated polyps. In general,small size and nonprotruded polyps are the ones that reporthigher polyp miss rates.39
For this study, we used freshly excised colon samplesfrom 23 patients, from which we analyzed 38 polypswith different characteristics, as summarized in Table I;11 samples of cancer and 10 samples of normal colonmucosa.
(a) (b) (c) (d) (e)
FIG. 1. Pictures of five tissue specimens including: (a) healthy mucosa; (b) hyperplastic polyp of 8 mm; (c) tubular adenoma with low-grade dysplasia of12 mm; (d) tubular adenoma with high-grade dysplasia of 25 mm; and (e) colon mucosa with an adenocarcinoma of 15 mm marked with a circle. [Color figurecan be viewed at wileyonlinelibrary.com]
(a) (b)
(d) (e)
(c)
FIG. 2. (a) Normal mucosa composed of surface epithelium, glandular crypts, and lamina propria. (b) Hyperplastic polyp showing a serrated and dilated contourof the glandular crypts. (c) Tubular adenoma with low-grade dysplasia is similar to normal mucosa but presents increased proliferation of nuclei in the elongatedcrypts. (d) Adenoma–carcinoma sequence shown in the same lesion: residual tubular adenoma (left-short arrow) evolving into an in situ adenocarcinoma in themiddle (center-long arrow), and to an infiltrating adenocarcinoma (right arrowheads). (e) Infiltrating adenocarcinoma with epithelial glands (arrowheads) invad-ing the muscular layer of the colon wall. [Color figure can be viewed at wileyonlinelibrary.com]
FIG. 3. Morphological categories of polyps based on the standard Paris classification. The dotted line represents twice the thickness of the mucosa layer.38 [Colorfigure can be viewed at wileyonlinelibrary.com]
Medical Physics, 45 (8), August 2018
3771 Guardiola et al.: Dielectric properties of colon tissues 3771

2.B. Measurement setup and calibrationexperiments
The complex permittivity of polyps and cancer was mea-sured using a Keysight 85070E dielectric probe kit with anopen-ended high temperature coaxial probe40 connected toan Agilent E8362B vector network analyzer (VNA), as canbe seen in Fig. 4. The complex permittivity measurements ofthe samples were recorded at room temperature using a linearfrequency range between 0.5 and 20 GHz. The number ofmeasured frequency points was 101. The samples were placedon a stand with a scissor lift controlled manually using a lead-screw. The probe was fixed on the axis of a manual positionerand connected to the VNA with a cable. The cable wasattached to the same axis with a zip tie to reduce sagging andremained untouched during the entire measurement. Thestand was manually lifted until the entire probe aperture madefirm contact with the sample. In this way, the coaxial probewas perfectly firm, being easier to avoid air gaps and controlthe pressure. The VNA was calibrated before each measure-ment using the common three standard loads (open, short,and load). Deionized water was used as the load in the cali-bration process. The dimensions of the probe head imposedsize and homogeneity restrictions to the sample. As a refer-ence, Table II shows the probe range of usability provided bythe manufacturer.
Before starting measurements on human samples, theappropriateness of the coaxial probe method for colon tissuemeasurement was verified. We performed several experi-ments with different materials with known complex permit-tivity to determine the accuracy, minimum size of the sample(lateral dimensions and thickness), and repeatability.
2.B.1. Accuracy
We measured the complex permittivity of several materialssuch as 0.051 M aqueous NaCl solution41 and methanol42
(liquids with high and low relative permittivity and conduc-tivity values, respectively). Subsequently, the measured com-plex permittivity was compared with the theoretical values.
2.B.2. Minimum sample size
The minimum thickness of the sample required to obtainreliable measurements was evaluated using a mixture ofdeionized water and methanol in a certain proportion toobtain a similar complex permittivity as the average of colontissues. We poured the mixture in a beaker placed on a metalsurface and we measured the complex permittivity for differ-ent levels of mixture to assess the minimum thickness of thesample. The minimum lateral size of the sample was assesseddirectly with the measured complex permittivity data of theexcised tissues (between 5 and 30 mm in diameter). The min-imum lateral size is largely dictated by the probe’s geometry.Since the interrogating field is mostly confined between theouter and the inner conductor of the probe, the sample mustcover completely this area to provide accurate measurements.The effects of different sample sizes at 10 GHz were statisti-cally analyzed using the tissues classified as adenoma withLGD because it was the most populated group.
2.B.3. Repeatability
We took three measurements of each sample in differentspots to track the effects, if any, of the sample orientation,homogeneity, and exerted pressure.
2.C. Clinical protocol and human sampleexperiments
In human sample experiments, we registered details onsample preparation, measurement times, and the temperature,to analyze if they had any impact on the measured complexpermittivity. The clinical protocol, shown in Fig. 5, wasdefined in close collaboration with the medical staff to opti-mize the integration of the electromagnetic measurementsinto the daily clinical practice and reduce the time betweenexcision and measurement. The time between excision andmeasurement was between 2 min and 2 h depending on thetype of tissue and how the samples were obtained, as follows.
� Polyps: Nearly all polyps and superficial cancerscould be resected endoscopically by routine polypec-tomy methods, including cautery or cold snareremoval.43 Cold snare technique involves capturingthe lesion with a snare wire and then closing it to cutthe lesion. Cautery can also be used to destroy resid-ual polyp tissue. In these procedures, a liquid solution
FIG. 4. Setup for dielectric spectroscopy. The open-ended coaxial probe wasfixed on a manual positioner and connected to a vector network analyzer(VNA). [Color figure can be viewed at wileyonlinelibrary.com]
TABLE II. Main features and requirements of the Keysight 85070E high-tem-perature probe.
Frequency range 200 MHz–20 GHz
Maximum relative permittivity of the sample �0 < 1000
Minimum loss tangent of the sample tan d > 0.05
Minimum sample diameter 20 mm
Minimum sample thicknessffiffiffiffi�0
pmm
Maximum granule size 0.3 mm
Medical Physics, 45 (8), August 2018
3772 Guardiola et al.: Dielectric properties of colon tissues 3772

was commonly injected under the polyp to verticallyseparate the lesion from the deeper colon layers andreduce the chances of perforation. Endoscopists tradi-tionally use saline, often with a blue dye, succinylatedgelatin, or adrenaline. In our measurements, the distri-bution of different solutions in the studied sampleswas: adrenaline in 32% of samples, succinylated gela-tin in 34% of samples, indigo carmine dye in 44% ofsamples (some samples contained more than one addi-tive). Measurements took place at the Endoscopy Unitof HCB, in an adjoining room to the colonoscopyboxes where the screening colonoscopies andpolypectomies were performed. Immediately after theexcision from the patient, the sample was transportedto the room where we measured the complex permit-tivity. Just after the measurement, the samples wereintroduced in a formalin solution and were sent to thePathology Department for histological analysis. Char-acteristics of the polyps (size, Paris classification,location into the colon, resection technique, and addi-tives injected) were described in a written report.Measurements were quickly obtained for these sam-ples after the excision, around 2 min later. For thisreason, we did not take any action to prevent tissuedehydration.
� Nonpolyp tissues: in clinical routine, when it is notpossible to fully remove a polyp, the patient is referredto colectomy (surgical procedure to remove all orparts of the colon). For our study, healthy mucosa andinvasive cancer tissues were obtained from colec-tomies performed in an operation room. Cancer tissueproperties were measured from the available largepieces (e.g., entire colon of 1.5 m long, 10 cm width,and 1 cm of thickness; or half a colon). Healthymucosa properties were also measured from the samecolon pieces. The samples were not available till theend of the operation, with a delay between 30 minand 2 h. The specimen was kept as long as possibleinside the patient to prevent tissue dehydration. Justafter the surgery, the resected colon was transported tothe Pathology Department where we measured thecomplex permittivity of tissues before being handledby the pathologist. We relied on the pathologist indi-cations to select the most meaningful area for ourmeasurements. For all the examined tissues wereceived a histology report of the lesion that wasadded to the colonoscopy report.
Another important issue was the sample homogeneity.Since the measured complex permittivity represents the
average value of all tissues present in the sensing area,44 anhomogeneous sample is desirable. Usually, when surgery isconducted to remove abnormal tissues, a margin of safety(e.g., healthy tissue) is also excised in order to ensure allabnormal tissue is fully removed. Polyps with high-gradedysplasia were removed with a safety margin of 1 mm. Sincedysplastic lesions are generally large, it was easy to select ameasurement area avoiding the margins of healthy tissue withthe help of the clinicians. Contrarily, non-neoplastic polypswere removed without leaving a margin of healthy tissue, asrecommended in colonoscopy guidelines.
2.D. Complex permittivity data fitting
The complex permittivity, ��ðxÞ ¼ �0ðxÞ � j�00ðxÞ, iscomposed by a real part, �0, referred to as relative permittiv-ity, and an imaginary part, �00, often expressed in terms ofconductivity, r = �0�
00x (S/m), or loss tangent, tan d = �00/�0,which accounts for the losses (�0 = 8.85 � 10�12 F/m is thefree space permittivity and x = 2pf, where f is the frequencyin Hz).
Single and multipole Debye45,46 and Cole–Colemodels20,31,32,47,48 have been proposed in the literature toparameterize the measured values of the complex widebandpermittivity of biological tissues at microwave frequencies.Debye models have recently gained interest because theyrequire less computational overhead46 than Cole–Cole meth-ods in the largely utilized Finite-Difference Time-Domain(FDTD) numerical methods.48 For an optimal representationof the data, the number of poles in both models should corre-spond to the number of dielectric relaxations of the tissueover the investigated frequency range.31,32 Within our fre-quency range (from 0.5 to 20 GHz), two relaxations can beidentified as follows: gamma dispersion occurs with a centerfrequency near 25 GHz at body temperature due to the dipo-lar relaxation of water; and a small dispersion, often calleddelta or UHF (Ultra High Frequency) dispersion, occursbetween 0.1 and 3 GHz26,49,50 in biological tissues. In somestudies,32 a higher order model is used because it providesmore flexibility to achieve a better fit to the data. However, ifthe number of poles is too large, model parameters may befitted to noise variations and not to the data itself. Anotheraspect that influences the parametric model fitting quality isthe frequency spacing of the measured data. Accordingly,having a sufficient number of data points around the relax-ation contributes to a more accurate modeling of the mea-sured data, especially at low frequencies.51 Ourmeasurements content fewer samples in the lower frequencyrange than in the higher range. Therefore, we decided toaccommodate our data above 2.5 GHz to a single-pole Debye
FIG. 5. Clinical protocol for the acquisition of electromagnetic measurements within daily medical routine. [Color figure can be viewed at wileyonlinelibrary.com]
Medical Physics, 45 (8), August 2018
3773 Guardiola et al.: Dielectric properties of colon tissues 3773
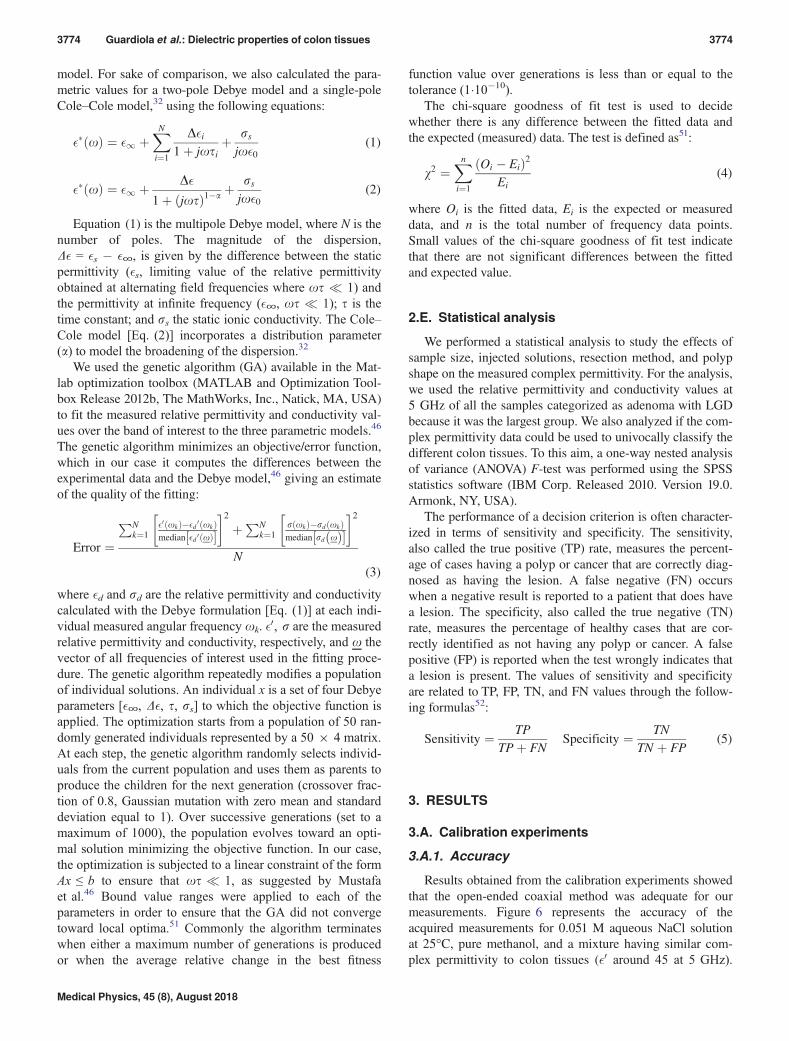
model. For sake of comparison, we also calculated the para-metric values for a two-pole Debye model and a single-poleCole–Cole model,32 using the following equations:
��ðxÞ ¼ �1 þXNi¼1
D�i1þ jxsi
þ rsjx�0
(1)
��ðxÞ ¼ �1 þ D�
1þ ðjxsÞ1�a þrsjx�0
(2)
Equation (1) is the multipole Debye model, where N is thenumber of poles. The magnitude of the dispersion,D� = �s � �∞, is given by the difference between the staticpermittivity (�s, limiting value of the relative permittivityobtained at alternating field frequencies where xs � 1) andthe permittivity at infinite frequency (�∞, xs � 1); s is thetime constant; and rs the static ionic conductivity. The Cole–Cole model [Eq. (2)] incorporates a distribution parameter(a) to model the broadening of the dispersion.32
We used the genetic algorithm (GA) available in the Mat-lab optimization toolbox (MATLAB and Optimization Tool-box Release 2012b, The MathWorks, Inc., Natick, MA, USA)to fit the measured relative permittivity and conductivity val-ues over the band of interest to the three parametric models.46
The genetic algorithm minimizes an objective/error function,which in our case it computes the differences between theexperimental data and the Debye model,46 giving an estimateof the quality of the fitting:
Error ¼PN
k¼1�0ðxkÞ��d
0ðxkÞmedian �d 0ðxÞ½ �
� �2þPN
k¼1r xkð Þ�rd xkð Þmedian rd xð Þ½ �
� �2
N(3)
where �d and rd are the relative permittivity and conductivitycalculated with the Debye formulation [Eq. (1)] at each indi-vidual measured angular frequency xk. �0, r are the measuredrelative permittivity and conductivity, respectively, and x thevector of all frequencies of interest used in the fitting proce-dure. The genetic algorithm repeatedly modifies a populationof individual solutions. An individual x is a set of four Debyeparameters [�∞, D�, s, rs] to which the objective function isapplied. The optimization starts from a population of 50 ran-domly generated individuals represented by a 50 9 4 matrix.At each step, the genetic algorithm randomly selects individ-uals from the current population and uses them as parents toproduce the children for the next generation (crossover frac-tion of 0.8, Gaussian mutation with zero mean and standarddeviation equal to 1). Over successive generations (set to amaximum of 1000), the population evolves toward an opti-mal solution minimizing the objective function. In our case,the optimization is subjected to a linear constraint of the formAx ≤ b to ensure that xs � 1, as suggested by Mustafaet al.46 Bound value ranges were applied to each of theparameters in order to ensure that the GA did not convergetoward local optima.51 Commonly the algorithm terminateswhen either a maximum number of generations is producedor when the average relative change in the best fitness
function value over generations is less than or equal to thetolerance (1�10�10).
The chi-square goodness of fit test is used to decidewhether there is any difference between the fitted data andthe expected (measured) data. The test is defined as51:
v2 ¼Xni¼1
Oi � Eið Þ2Ei
(4)
where Oi is the fitted data, Ei is the expected or measureddata, and n is the total number of frequency data points.Small values of the chi-square goodness of fit test indicatethat there are not significant differences between the fittedand expected value.
2.E. Statistical analysis
We performed a statistical analysis to study the effects ofsample size, injected solutions, resection method, and polypshape on the measured complex permittivity. For the analysis,we used the relative permittivity and conductivity values at5 GHz of all the samples categorized as adenoma with LGDbecause it was the largest group. We also analyzed if the com-plex permittivity data could be used to univocally classify thedifferent colon tissues. To this aim, a one-way nested analysisof variance (ANOVA) F-test was performed using the SPSSstatistics software (IBM Corp. Released 2010. Version 19.0.Armonk, NY, USA).
The performance of a decision criterion is often character-ized in terms of sensitivity and specificity. The sensitivity,also called the true positive (TP) rate, measures the percent-age of cases having a polyp or cancer that are correctly diag-nosed as having the lesion. A false negative (FN) occurswhen a negative result is reported to a patient that does havea lesion. The specificity, also called the true negative (TN)rate, measures the percentage of healthy cases that are cor-rectly identified as not having any polyp or cancer. A falsepositive (FP) is reported when the test wrongly indicates thata lesion is present. The values of sensitivity and specificityare related to TP, FP, TN, and FN values through the follow-ing formulas52:
Sensitivity ¼ TPTPþ FN
Specificity ¼ TNTN þ FP
(5)
3. RESULTS
3.A. Calibration experiments
3.A.1. Accuracy
Results obtained from the calibration experiments showedthat the open-ended coaxial method was adequate for ourmeasurements. Figure 6 represents the accuracy of theacquired measurements for 0.051 M aqueous NaCl solutionat 25°C, pure methanol, and a mixture having similar com-plex permittivity to colon tissues (�0 around 45 at 5 GHz).
Medical Physics, 45 (8), August 2018
3774 Guardiola et al.: Dielectric properties of colon tissues 3774

Both relative permittivity and conductivity values of theseliquids show an excellent agreement with the correspondingtheoretical values41,42 with an error lower than 5% in allcases.
3.A.2. Minimum sample size
We used a mixture of liquids (�0 = 45 at 5 GHz) to experi-mentally confirm the minimum measurable thickness of thesample. According to the manufacturer, the thickness of thesample must be greater than
ffiffiffiffiffi45
p ¼ 6:7 mm. Figure 6 showsthe complex permittivity measured for different amounts ofmixture in a beaker (4, 6, 15, and 20 mm). The complex per-mittivity does not vary for quantities of mixture greater than15 mm. Below this level, the complex permittivity begins tochange slightly. An error lower than a 5% for both the rela-tive permittivity and the conductivity is obtained for mixturelevels greater than 6 mm. The effect of the sample size wasanalyzed with an ANOVA F-test. We compared the P-valuesof adenomas with LGD of all sizes with adenomas with LGDlarger than 10 mm. We found statistical differences(P ≤ 0.05) due to the size when we considered all the sam-ples (P = 0.003 for the relative permittivity and P = 0.0001for the conductivity), while there were no significant differ-ences when considering samples larger or equal to 10 mm(P = 0.425 for the relative permittivity and P = 0.441 for theconductivity). Therefore, only samples larger than 10 mm indiameter accomplished the size requirements. After thisselection we obtained 51 valid measurements (32 polyps, 10adenocarcinomas, 9 normal colon mucosa).
3.A.3. Repeatability
The orientation of the sample did not produce differencesin the measured complex permittivity within the same tissue.Pressure over the tissue during the experiments was con-trolled to avoid any effect on the obtained measurements.
3.B. Human sample experiments
We also analyzed the effect of the resection technique andthe injected solutions within the adenoma with LDG group.None of the solutions produced a statistically significanteffect neither in the relative permittivity nor the conductivity,with P-values above the significance threshold (the followingcouple of values per solution correspond to the relative per-mittivity and the conductivity): indigo carmine dye,P = 0.596 and 0.407; succinylated gelatin, P = 0.802 andP = 0.133; adrenaline, P = 0.650 and P = 0.336. We did notexpect any influence of the chosen solution on the measure-ments since they were injected underneath the lesion beforeits removal; for this reason, traces of substances should notremain inside the sample. The resection method (cautery andcold snare) did not cause significant changes in complex per-mittivity either (P = 0.8267 and P = 0.2587 for the relativepermittivity and conductivity, respectively). It was expectedthat the resection method would not influence the measure-ments since the snare is closed at the base of the polyp, whilethe polyp itself remains intact. Cautery is only applied toremove large polyps and mainly affects the surrounding colonmucosa. To ensure that cautery is not influencing our mea-sure, we selected the measurement area as far as possiblefrom the cauterization zone.
Using the data provided in the histology report, we identi-fied and labeled the valid measured samples. We obtained 9samples of healthy colon mucosa, 32 samples of different his-tological types of polyps, and 10 adenocarcinomas. Themajority of measured samples (52%) were adenomas sincetheir size was adequate for the probe. Contrarily, hyperplasticpolyps were scarce (12%) because they were generally small(less than 5 mm) and had to be excluded due to the probe sizerequirements. Healthy mucosa (17%) and large adenocarcino-mas (19%) were only obtained from surgical colectomies.Moreover, we could only measure healthy mucosa from leftcolon colectomies as the right colon wall was too thin (only
FIG. 6. Accuracy of dielectric property measurements (relative permittivity, left; conductivity, right) for 10 mm of saline solution at 25°C poured in a beaker,10 mm of methanol and a mixture poured in different levels (4, 6, 15, and 20 mm). A comparison between measured and theoretical values for the saline solutionand methanol is provided. [Color figure can be viewed at wileyonlinelibrary.com]
Medical Physics, 45 (8), August 2018
3775 Guardiola et al.: Dielectric properties of colon tissues 3775

2 mm thick) to fulfill coaxial probe thickness requirements,especially at lower frequencies.
3.C. Complex permittivity of polyps, healthymucosa, and adenocarcinomas
Using the data provided in the pathology report, we identi-fied and labeled the valid measurements as: adenocarcino-mas, healthy mucosa, hyperplastic polyps, tubular adenomaswith LGD, tubular adenoma with HGD, villous adenomaswith HGD, and tubulovillous adenomas with HGD. Figure 7shows the plots of resulting relative permittivity and conduc-tivity. Visual observation of this figure allows identifyingthree groups of curves that present differentiated dielectricproperties: benign tissues (healthy mucosa and hyperplasticpolyps) and polyps with LGD occupy the lowest cold-coloredpart; adenomas with HGD, the intermediate magenta part;and adenocarcinomas, the upper red part. This suggests arelationship between the complex permittivity of the samplesand the grade of dysplasia, for example, higher values of boththe relative permittivity and conductivity for adenocarcino-mas and polyps with HGD. Based on these observations, wefinally classified the samples into five groups: adenocarcino-mas, adenomas with HGD, adenomas with LGD, hyperplas-tic polyps, and healthy colon mucosa, respectively. Statisticalanalysis confirmed that this classification produces signifi-cant differences between groups (P = 0.017 for the relativepermittivity and P = 0.050 for the conductivity) and non-significant differences within groups. Polyp shape or texturedid not produce changes on relative permittivity values(P = 0.582). Figure 8 shows the median values (solid lines)and the standard deviation (shaded bands, 95% confidenceinterval) of the relative permittivity and conductivity of thefive tissue groups. It can be observed that the relative permit-tivity and conductivity of adenocarcinomas and benign tis-sues are clearly differentiated between 3 and 10 GHz.Likewise, adenocarcinomas and adenomas with HGD can be
clearly distinguished, while adenomas with LGD overlapwith benign tissues. Therefore, the complex permittivity rep-resents clearly the dysplasia grade of the adenomas: thehigher the complex permittivity the higher the probability ofmalignancy.
To examine the detection capacity of adenocarcinomas,the percentage differences between the relative permittivityand conductivity of adenocarcinomas and the rest of the ana-lyzed tissues (adenoma with HGD, adenoma with LGD,hyperplastic polyps, and healthy mucosa) were calculated atmultiple frequencies, as shown in Figs. 9(a) and 9(b). Therewas an average difference of 20–30% in relative permittivitybetween cancer and benign tissues for frequencies between 2and 8 GHz, which tended to decrease as the frequencyincreased. The larger differences in conductivity values werefound between 5 and 8 GHz (around 30–60%). Between can-cer and adenomas with HGD, the differences were morestable over the frequency range (15% and 25% for the relativepermittivity and conductivity, respectively, at 7 GHz). Fig-ures 9(c) and 9(d) show the percentage differences betweenthe relative permittivity and conductivity of healthy mucosavs all lesions for the sake of comparison with conventionalcolonoscopy. The contrast between healthy mucosa and can-cer is 30–100%, and between healthy mucosa and adenomawith HGD is 10–57%, which confirms the capacity of thecomplex permittivity, especially the conductivity, to identifydysplastic tissues.
A complementary analysis of the accuracy of dielectricproperties for tissue classification can be done from sensitiv-ity and specificity values. Table III shows the sensitivity andspecificity to detect the different histological types of polypsand adenocarcinomas from the rest of the colon tissues. Thesensitivity and specificity were calculated for both the relativepermittivity and the conductivity at different frequencies.Note that the performance depends on the frequency as antic-ipated in Fig. 9. It can be observed that the sensitivity todetect adenocarcinomas is 100% for all the frequencies
FIG. 7. Measured relative permittivity and conductivity of the different types of colon tissues. HGD and LGD stand for high-grade dysplasia and low-grade dys-plasia, respectively. [Color figure can be viewed at wileyonlinelibrary.com]
Medical Physics, 45 (8), August 2018
3776 Guardiola et al.: Dielectric properties of colon tissues 3776

analyzed, while the specificity is maximum (95.12%)between 5 and 8 GHz using the relative permittivity data. Forthe adenomas with HGD, the maximum sensitivity (90.91%)is reached using the conductivity data at 7 and 8 GHz andthe specificity using both the relative permittivity and con-ductivity data is 61.76% at 9 GHz. For the adenomas withLGD a perfect sensitivity is obtained at 5 GHz using the rela-tive permittivity data and the specificity using the relativepermittivity data is 60.61% at 5 and 7 GHz. Finally, for thehyperplastic polyps a perfect sensitivity is obtained at all thefrequencies analyzed and the maximum specificity using therelative permittivity data is 73.68% at 9 GHz. For all thelesions, the highest values of sensitivity and specificity usingthe conductivity are achieved using higher frequencies
(9 GHz), while the highest performance using the relativepermittivity is obtained at 5 GHz. In general, the frequencythat offers a better trade-off between sensitivity and speci-ficity is 5 GHz.
3.D. Data fitting and reduction
We calculated the parameters of Cole–Cole, single-, andtwo-pole Debye models of the five colon tissue groups fromthe median measured complex permittivity over 2.5–20 GHz.To quantify the quality of the parametric models, the fittingerror [Eq. (3)] and the chi-squared values51 were estimated,as presented in Table IV. It can be observed from the resultsthat the single-pole Debye model provides the smallest fitting
FIG. 8. Measured relative permittivity and conductivity of colon tissues. The lines represent the median values and the colored areas around the median show the95% confidence interval. HGD and LGD stand for high-grade dysplasia and low-grade dysplasia, respectively. [Color figure can be viewed at wileyonlinelibrary.com]
(a) (b)
(c) (d)
FIG. 9. Percentage differences on complex permittivity of adenocarcinoma (top) and healthy mucosa (bottom) vs the remaining types of tissues for different fre-quencies. HGD and LGD stand for high-grade dysplasia and low-grade dysplasia, respectively. [Color figure can be viewed at wileyonlinelibrary.com]
Medical Physics, 45 (8), August 2018
3777 Guardiola et al.: Dielectric properties of colon tissues 3777

errors. The chi-squared values are in the range 1–5 and 1–14for the relative permittivity and conductivity, respectively.For single-pole Cole–Cole model, the chi-squared values areslightly higher, indicating poorer data fitting to the model.The Cole–Cole fitting of our measurements provided verysmall values of a ranging from 1.5�10�7 to 0.05. Table V pre-sents the single-pole Debye parameters of the five benign andmalignant colon tissue groups derived from the median mea-sured complex permittivity. Figure 10 depicts the resultantfits for the complex permittivity over 2.5–20 GHz frequencyband. The healthy colon mucosa has been compared to thedata provided by Gabriel et al.33,53 showing better agreementfor the conductivity rather than the relative permittivity.
4. DISCUSSION
We performed complex permittivity measurements onfreshly excised colon samples of different types of polyps,cancer, and healthy mucosa tissues obtained from 23 patientsfrom 0.5 to 20 GHz. After a sample selection process, weobtained 51 valid measurements. We discarded diminutivepolyps and big ones resected in piecemeal fashion becausethey were too small to be measured reliably with our probe.
A thinner probe would be more adequate for these samples.Although our measurements were performed ex vivo, we puta lot of effort in reducing the time between excision and mea-surement to get closer to the in vivo conditions. All measure-ments were acquired around 2 min after excision, exceptfrom cancer and healthy mucosa samples that were delayedup to 2 h (typically 30 min). With the scarcity of data avail-able in the literature,44,54–57 it is difficult to quantify howpost-excision conditions can affect our measurements. Thereis a consensus in the literature56 that differences between
TABLE III. Sensitivity (Sn) and specificity (Sp) for the relative permittivity (�0) and the conductivity (r) in the diagnosis of each lesion: adenocarcinoma (ACA),
adenoma with high-grade dysplasia (A-HGD), adenoma with low-grade dysplasia (A-LGD), and hyperplastic polyps (HP) vs the rest of tissues for different fre-quencies. The largest values among all frequencies are marked in bold.
Tissue
4 GHz 5 GHz 6 GHz
�0 Sn �0 Sp r Sn r Sp �0 Sn �0 Sp r Sn r Sp �0 Sn �0 Sp r Sn r Sp
ACA 100 92.68 100 80.49 100 95.12 100 78.05 100 92.68 100 75.61
A-HGD 81.28 61.76 72.73 58.82 90.91 55.88 72.73 58.82 81.82 55.88 90.91 58.82
A-LGD 90.76 60.61 75.00 39.39 100 60.61 83.33 42.42 91.67 60.61 75.00 39.39
HP 71.43 52.63 100 10.53 100 13.16 100 10.53 100 7.89 100 10.53
7 GHz 8 GHz 9 GHz
Tissue �0 Sn �0 Sp r Sn r Sp �0 Sn �0 Sp r Sn r Sp �0 Sn �0 Sp r Sn r Sp
ACA 100 95.12 100 85.37 100 95.12 100 85.37 100 92.68 100 90.24
A-HGD 72.73 61.76 90.91 58.82 81.82 58.82 90.91 58.82 81.81 53.87 90.91 61.76
A-LGD 66.67 60.61 66.67 42.42 91.67 39.39 75.00 45.45 91.67 39.39 66.67 51.52
HP 42.86 26.32 100 10.53 57.14 21.05 100 15.03 57.14 73.68 100 15.03
TABLE IV. Comparison of the fitting error and chi-squared values (v2) for the relative permittivity (�0) and conductivity (r) of the single-pole Debye model, sin-gle-pole Cole–Cole model, and two-pole Debye model, respectively.
Tissue
Single-pole Debye Two-pole Debye Single-pole Cole–Cole
Error (�10�5) v2(�0) v2(r) Error (�10�5) v2(�0) v2(r) Error (�10�5) v2(ε0) v2(r)
Adenocarcinoma 2.35 5.15 1.49 0.36 5.81 7.06 0.36 5.81
Adenoma HGD 3.64 3.03 6.59 1.17 5.45 26.55 1.17 5.45 26.55
Adenoma LGD 1.23 2.79 13.97 1.73 4.09 38.03 1.73 4.09 38.03
Hyperplastic 38.91 1.57 4.32 37.86 1.73 5.25 37.86 1.73 5.25
Healthy mucosa 33.52 4.95 10.09 30.44 6.64 13.93 30.44 6.64 13.93
TABLE V. Single-pole Debye model parameters of benign and malignantcolon tissues (2.5–20 GHz). �∞ is the infinite frequency permittivity, �s is thestatic permittivity, s the relaxation time constant, and rs the static ionic con-ductivity.
Tissue �∞ �s s (ps) rs (S/m)
Adenocarcinoma 6.03 60.80 8.93 0.71
Adenoma HGD 6.49 50.14 7.36 1.04
Adenoma LGD 2.47 42.43 5.19 1.14
Hyperplastic 5.90 46.33 6.81 1.05
Healthy mucosa 5.05 44.79 5.62 1.23
Medical Physics, 45 (8), August 2018
3778 Guardiola et al.: Dielectric properties of colon tissues 3778

in vivo and ex vivo properties are more important at low fre-quencies (<100 MHz), also being quite dependent on thetype of tissue. Haemmerich et al.54 measured swine liverresistivity (inverse of the conductivity) in vivo and after exci-sion for 12 h and concluded that during the first 2 h post-mortem (when temperature changes exist), resistivityincreases by 32% at 1 MHz. In contrast, at high RF andmicrowave frequencies, the dielectric properties dependmainly on the water content and state (including temperaturechanges). Therefore, at higher frequencies, changes betweenin vivo and ex vivo properties of biological tissues can beminimized as long as the measurements are performed withina few hours after excision so that minimal liquid loss takesplace.57 Nonetheless, a fair amount of controversy exists onthe quantitation of this effect. O’Rourke et al.55 reported thatthe in vivo conductivity for normal tissue was 16% higher at2.45 GHz than the ex vivo conductivity, and that thesechanges were almost immediate. However, statistically signif-icant differences were not found between the dielectric prop-erties of in vivo and ex vivo malignant tissue. Another study44
reported no statistically significant changes into the complexpermittivity of breast cancer tissues for times between exci-sion and measurement smaller than 3 h and 29 min. We alsocontrolled the sample temperature, which due to the smallsize of the samples, rapidly arrived at room temperature (be-tween 20 and 22°C) and remained stable. Since no effect isexpected due to a variation in temperature,44 this effect hasnot been studied further in this work.
The obtained measurements demonstrated that complexpermittivity is well correlated with the dysplasia grade ofpolyps; higher values of the relative permittivity and conduc-tivity in the examined tissue are linked to larger likelihood tobe cancerous tissue. From a biophysical point of view, thepredominant effect in the complex permittivity of human tis-sues between 0.5 and 20 GHz is due to the orientation mech-anism of water molecules (polarization). Therefore, theobserved differences in complex permittivity reflect the
difference in water content between cancer and normal colontissues. In general, literature reports higher values of relativepermittivity and conductivity for cancerous tissues than fornormal tissues, due to the higher water content in the formerones.30 Thus, higher complex permittivity indicates highertissue density, higher water content, and increasing cancerprobability.26,57 In our case, two main mechanisms may beinvolved in elevating the water content of cancer and adeno-mas with HGD. First, increased mucus production in thetumor region may augment the extracellular water content.Tumor cells secrete mucus that invades the interstitial spaceproducing large pools of liquid.58 Secondly, dysplasia isaccompanied by angiogenesis and, therefore, greater vascularwater content. This is consistent with the recent findingaccording to which the angiogenic switch occurs at the onsetof the adenoma–carcinoma sequence in CRC.59,60 Asreported by Kristensen et al.,61 the greatest increase in angio-genesis occurs at the earliest stage of dysplastic transforma-tion. Another characteristic of the complex permittivity ofadenocarcinomas is that the relative permittivity has a steeperslope, and the peak in the conductivity (possibly produced bythe relaxation30) is shifted with respect to the other tissues.Recent studies relate complex permittivity with the grade ofbinding of water molecules present in tissues.26 The randommolecular motion of water molecules can be quantitativelymeasured in vivo with diffusion-weighted magnetic reso-nance61–64 through the apparent diffusion coefficient (ADC).A low ADC value means more proportion of bound waterand increased tissue density. Higher tissue density is relatedto more aggressiveness or metastatic capacity of tumors.Conversely, healthy tissues or benign pathological processespresent high ADC values, indicating large extracellular space,less tissue density, and more water mobility. Studies in watersolutions reflect that the complex permittivity of bound waterresemble more to that of solid water that implies a shift of therelaxation to lower frequencies65 (the decay of the relativepermittivity and the peak of the conductivity occurs at lower
FIG. 10. Single-pole Debye fits to the five categories of colorectal tissues. The healthy mucosa is compared to the available data in the literature (Gabriel et al.33).HGD and LGD stand for high-grade dysplasia and low-grade dysplasia, respectively. [Color figure can be viewed at wileyonlinelibrary.com]
Medical Physics, 45 (8), August 2018
3779 Guardiola et al.: Dielectric properties of colon tissues 3779

frequencies). Our results seem to be quite consistent with theprevious reasoning: since malignant tissue has more boundwater proportion than healthy colon tissue66,67 the relaxationof adenocarcinomas is shifted to lower frequencies withrespect to benign tissue one.
Concerning the fitting results, we can observe a correlationbetween the static permittivity (�s) and tissue water content,32
and consequently, between �s and malignancy. The Cole–Colemodel did not improve the results of the Debye model due tothe negligible a values obtained. This may be due to the highwater content of colon tissues, and would be consistent withGabriel’s results,32 in which body fluids reported negligible avalues. Figure 10 shows that there is not very good agree-ment between our fitting of healthy mucosa and Gabriel’sone. Our results indicate quite lower values of complex per-mittivity, which can be partly explained by the different tem-peratures and the different species between the two sets ofmeasurements. Gabriel’s data are from ovine colon samplesacquired at 30�, while our data are from human colon samplesat 20–22�. Joines et al.30 reported the complex permittivity inconditions more similar to ours (human colon samples at 23–25°) but in a lower frequency range (50–900 MHz). The val-ues obtained by Joines et al. are also lower than Gabriel’sdata. Since most literature finds minimal differences betweenspecies, the different measurement temperatures could largelyexplain the discrepancies observed in Fig. 10. Another causeof fitting inaccuracy may be caused by the linear frequencyspacing of the complex permittivity measurements. Somestudies31,32,51 show that linear spacing provided insufficientdata points at lower frequencies in the Cole–Cole plots com-pared to measurements in the logarithmic scale, leading toless accurate fitting at frequencies <1 GHz.
We reported the sensitivity and specificity to detect adeno-carcinomas and different types of polyps with our methodbased on their complex permittivity values. The sensitivity at5 GHz is 100% for all lesions except for the adenoma withHGD that is 91%. The specificity is 95% for the adenocarci-nomas, 62% for the adenomas with HGD, 61% for the adeno-mas with LGD, and 74% for the hyperplastic polyps. Bychanging the threshold, it is possible to obtain a 100% valueof sensitivity for the adenomas with HGD at the expense ofreducing the specificity to 41%. As a reference, conventionalcolonoscopy reports a sensitivity and specificity of 74–94%and 88–94%, respectively, to detect adenomas larger than6 mm.6 These values cannot be directly compared to the oneswe obtain on ex vivo tissues since colonoscopy data areacquired in vivo.6 For having a fair benchmark, we shouldfirst have a complete microwave-based system operated by aphysician in vivo such as a conventional colonoscopy. Colonangulations and folds, poor cleaning, and movements of thecolon, among others, are some of the main challenges ofcolon imaging when performed in vivo.
We did not find statistical significant differences in dielec-tric properties due to the shape of the polyps. This may sug-gest that the complex permittivity could help to detect subtle(slightly elevated, sessile, or flat) polyps, which are the mostdifficult lesions to detect endoscopically. A study that tracked
the performance of endoscopists in the detection of flatpolyps reported low detection rates (1.5–3.5%) during first200 colonoscopies and 7.4% after 1000 colonoscopies.68 Flatlesions are also more likely to harbor advanced histology(HGD or early cancer) compared to pedunculated or sessilelesions irrespective of the size. Therefore, detection and sub-sequent removal of these lesions is of paramount importancefor improving the efficacy of colonoscopy in preventing thedevelopment of CRC.
Aside from the detection itself, the proposed method addsin situ diagnosis capacity. With conventional colonoscopy,when a polyp is found, clinicians have to make decisionsabout resecting or not depending on the type of polyp and itsrisk to degenerate. This information is not available duringcolonoscopy and endoscopists only rely on subjective obser-vations based on different surface or vascular patterns. Theaccurate diagnosis is only confirmed after excision with thepathology analysis. For this reason, the current protocolestablishes to resect and analyze all lesions found during theexploration, which is time consuming and costly. The mea-surements presented in this paper, show the possibility to dis-tinguish malignant tissues from healthy mucosa and benigncolon tissues, since there is not overlapping between theircomplex permittivity below 10 GHz. Moreover, the grade ofdysplasia can be inferred from the complex permittivity as itincreases with dysplasia. Accordingly, polyps with LGD pre-sent a complex permittivity very close to that of the benigntissues and polyps with HGD occupy the intermediate regionbetween healthy tissues and cancer.
5. CONCLUSION
In summary, we measured the complex permittivity offreshly excised healthy colon, different types of polyps, andcolon cancerous tissues of human ex vivo samples between0.5 and 20 GHz from 23 patients. The obtained measure-ments, validated through pathological analysis, showed thatthe complex permittivity correlates with the grade of dys-plasia of colon epithelium and thus can be used to quantifythe grade of dysplasia or malignancy of the colon lesions.Our initial results reported a sensitivity of 100–91% and aspecificity of 61–95% to detect adenocarcinomas, adenomas,and hyperplastic polyps from healthy mucosa. This study isthe first demonstration of the feasibility of using complex per-mittivity data to provide complementary functional informa-tion to conventional colonoscopy. The development of a fullyintegrated multimodal (optical and microwave) colon imag-ing platform has the potential of making a positive impact ofthe management of CRC patients.
ACKNOWLEDGMENTS
This work was supported by the Department of Universi-tats, Recerca i Societat de la Informaci�o of the CatalanGovernment through Llavor 2014LLAV00016 and producte2016PROD00068 projects, La Caixa through Caixaimpulseprogram CI16-00058, the Spanish Comisi�on Interministerial
Medical Physics, 45 (8), August 2018
3780 Guardiola et al.: Dielectric properties of colon tissues 3780
de Ciencia y Tecnolog�ıa (CICYT) under projects TEC2016-78028-C3-1-P, TEC2014-58582-R, the Spanish Agencia Esta-tal de Investigaci�on Unidad de Excelencia Maria de Maeztu(MDM-2016-0600), the Spanish Ministerio de Econom�ıa,Industria y Competitividad, DTS17/00090 and CERCA Pro-gramme/Generalitat de Catalunya. The authors thank the Fun-damental Physics Department of Universitat de Barcelona fortheir contribution to the complex permittivity measurements.
CONFLICT OF INTEREST
The authors have no conflicts to disclose.
a)Author to whom correspondence should be addressed. Electronic mail:[email protected].
REFERENCES
1. Parkin DM, Forman D, Bray F, et al. GLOBOCAN 2012 v1.0 CancerIncidence and Mortality Worldwide. IARC CancerBase; 2013, 11.http://globocan.iarc.fr Acessed July 30, 2017.
2. GlobalData. PharmaPoint: Colorectal Cancer – Global Drug Forecastand Market Analysis to 2025; 2017.
3. Morillas JD, Castells A, Oriol I, et al. Alianza para la Prevenci�on delC�ancer de Colon en Espa~na: un compromiso c�ıvico con la sociedad.Gastroenterol Hepatol. 2012;35:109–128.
4. Fleming M, Ravula S, Tatishchev SF, Wang HL. Colorectal carcinoma:pathologic aspects. J Gastrointest Oncol. 2012;3:153–173.
5. Gonzalez-Pons M, Cruz-Correa M. Colorectal cancer biomarkers: whereare we now? Biomed Res Int. 2015;2015:149014.
6. Lin JS, Piper MA, Perdue LA, et al. Screening for colorectal cancer:updated evidence report and systematic review for the us preventive ser-vices task force. JAMA. 2016;315:2576–2594.
7. Pox CP. Controversies in colorectal cancer screening. Digestion.2014;89:274–281.
8. M€uller AD, Sonnenberg A. Prevention of colorectal cancer by flexibleendoscopy and polypectomy. A case-control study of 32,702 veterans.Ann Intern Med. 1995;123:904–910.
9. Winawer SJ, Zauber AG, Ho MN, et al. Prevention of colorectal cancerby colonoscopic polypectomy. N Engl J Med. 1993;329:1977–1981.
10. van Rijn JC, Reitsma JB, Stoker J, Bossuyt PM, van Deventer SJ, Dek-ker E. Polyp miss rate determined by tandem colonoscopy: a systematicreview. Am J Gastroenterol. 2006;101:343–350.
11. Samadder NJ, Curtin K, Tuohy TM, et al. Characteristics of missed orinterval colorectal cancer and patient survival: a population-based study.Gastroenterology. 2014;146:950–960.
12. Lee T, Rees C, Blanks R, et al. Colonoscopic factors associated withadenoma detection in a national colorectal cancer screening program.Endoscopy. 2014;46:203–211.
13. East JE, Saunders BP, Burling D, Boone D, Halligan S, Taylor SA. Sur-face visualization at CT colonography simulated colonoscopy: effect ofvarying field of view and retrograde view. Am J Gastroenterol.2007;102:2529–2535.
14. Konda V, Chauhan SS, Abu Dayyeh BK, et al. Endoscopes and devicesto improve colon polyp detection. Gastrointest Endosc. 2015;81:1122–1129.
15. Bernal J, S�anchez FJ, de Miguel CR, Fern�andez-Esparrach G. Buildingup the future of colonoscopy – a synergy between clinicians and com-puter scientists. In: Screening for Colorectal Cancer with Colonoscopy.London: InTech; 2015.
16. Manfredi MA, Abu-Dayyeh BK, Bhat YM, et al. Electronic chromoen-doscopy. Gastrointest Endosc. 2015;81:249–261.
17. Mads SB, Wei Z, Kan L, et al. Characterizing variability of in vivoRaman spectroscopic properties of different anatomical sites of normalcolorectal tissue towards cancer diagnosis at colonoscopy. Anal Chem.2015;87:960–966.
18. Yu C, Fan S, Sun Y, Pickwell-MacPherson E. The potential of terahertzimaging for cancer diagnosis: a review of investigations to date. QuantImaging Med Surg. 2012;2:33–45.
19. Bolomey JC, Jofre L. Three Decades of Active Microwave ImagingAchievements, Difficulties and Future Challenges. Honolulu, HI: IEEEICWITS. 2010;2010:1–4.
20. Lazebnik M, Popovic D, McCartney L, et al. A large-scale study of theultrawideband microwave dielectric properties of normal, benign andmalignant breast tissues obtained from cancer surgeries. Phys Med Biol.2007;52:6093–6115.
21. Winter A, Laing J, Paglione R, Sterzer F. Microwave hyperthermia forbrain tumors. Neurosurgery. 1985;17:387–399.
22. Nagae D, Mase A. Measurement of heart rate variability and stress eval-uation by using microwave reflectometric vital signal sensing. Rev SciInstrum. 2010;81:94301.
23. Semenov SY, Corfield DR. Microwave tomography for brain imaging:feasibility assessment for stroke detection. Int J Antennas Propag.2008;2008:1–8.
24. Meaney PM, Goodwin D, Golnabi AH, et al. Clinical microwave tomo-graphic imaging of the calcaneus: a first-in-human case study of twosubjects. IEEE Trans Biomed Eng. 2012;59:3304–3313.
25. Grzegorczyk TM, Meaney PM, Kaufman PA, di Florio-AlexanderRM, Paulsen KD. Fast 3-D tomographic microwave imaging forbreast cancer detection. IEEE Trans Med Imaging. 2012;31:1584–1592.
26. Meaney PM, Golnabi AH, Epstein NR, et al. Integration of microwavetomography with magnetic resonance for improved breast imaging. MedPhys. 2013;40:103101.
27. Preece AW, Craddock I, Shere M, Jones L, Winton HL. MARIA M4:clinical evaluation of a prototype ultrawideband radar scanner for breastcancer detection. J Med Imaging. 2016;3:33502.
28. Done-Sik Y, Bong-Seok K, Hyung-Do C, Ae-Kyoung L, Jong-Ki P. Thedielectric properties of carcinomas. In: Proceedings of the XXVIIthURSI General Assembly; 2002.
29. Done-Sik Y. The dielectric properties of cancerous tissues in a nudemouse xenograft model. Bioelectromagnetics. 2004;25:492–497.
30. Joines WT, Zhang Y, Li C, Jirtle RL. The measured electrical propertiesof normal and malignant human tissues from 50 to 900 MHz.Med Phys.1994;21:547–550.
31. Gabriel S, Lau RW, Gabriel C. The dielectric properties of biological tis-sues: II. Measurements in the frequency range 10 Hz to 20 GHz. PhysMed Biol. 1996;41:2271–2269.
32. Gabriel S, Lau RW, Gabriel C. The dielectric properties of biological tis-sues: III. Parametric models for the dielectric spectrum of tissues. PhysMed Biol. 1996;41:2271–2293.
33. Andreuccetti D, Fossi D, Petrucci C. An Internet resource for thecalculation of the dielectric properties of body tissues in the fre-quency range 10 Hz–100 GHz. IFAC-CNR. http://niremf.ifac.cnr.it/tissprop/.
34. Kumar V, Stanley L. Robbins Basic Pathology, 8th ed. Philadelphia, PA:Saunders/Elsevier; 2007.
35. Morson B. The polyp-cancer sequence in the large bowel. Proc R SocMed. 1974;67:451–457.
36. Rex DK, Ahnen DJ, Baron JA. Serrated lesions of the colorectum:review and recommendations from an expert panel. Am J Gastroenterol.2012;107:1315–1330.
37. Bauer VP, Papaconstantinou HT. Management of serrated adenomas andhyperplastic polyps. Clin Colon Rectal Surg. 2008;21:273–279.
38. The Paris endoscopic classification of superficial neoplastic lesions:esophagus, stomach, and colon. Gastrointest Endosc. 2003;58:23–43.
39. Kim NH, Jung YS, Jeong WS, et al. Miss rate of colorectal neoplasticpolyps and risk factors for missed polyps in consecutive colonoscopies.Intest Res. 2017;15:411–418.
40. Keysight 85070E Dielectric Probe Kit 200 MHz to 50 GHz TechnicalOverview. Keysight Technologies, United States; 2017. http://literature.cdn.keysight.com/litweb/pdf/5989-0222EN.pdf.
41. No K, Hilland J, Kaatze U. Dielectric properties of aqueous NaCl solu-tions at microwave frequencies. 1997;101:6864–6869.
42. Gregory AP, Clarke RN. Tables of the complex permittivity of dielectricreference liquids at frequencies up to 5 GHz. NPL Report, United King-dom; 2012.
Medical Physics, 45 (8), August 2018
3781 Guardiola et al.: Dielectric properties of colon tissues 3781

43. Riley SA. Colonoscopic Polypectomy and Endoscopic Mucosal Resec-tion: a Practical Guide. United Kingdom: British Society of Gastroen-terology; 2008.
44. Martellosio A, Pasian M, Bozzi M, et al. Dielectric properties character-ization from 0.5 to 50 GHz of breast cancer tissues. IEEE Trans MicrowTheory Tech. 2017;65:998–1011.
45. Von Hippel A. Dielectric Materials and Applications. Norwood, MA:A. House; 1954.
46. Mustafa S, Abbosh AM, Nguyen PT. Modeling human head tissuesusing fourth-order Debye model in convolution-based three-dimensionalfinite-difference time-domain. IEEE Trans Antennas Propag.2014;62:1354–1361.
47. Lazebnik M, McCartney L, Popovic D, et al. A large-scale study ofthe ultrawideband microwave dielectric properties of normal breasttissue obtained from reduction surgeries. Phys Med Biol. 2007;52:2637–2656.
48. O’Halloran M, Conceicao RC, Byrne D, Glavin M, Jones E. FDTDmodeling of the breast: a review. Prog Electromagn Res B. 2009;18:1–24.
49. Foster KR, Schepps JL, Schwan HP. Microwave dielectric relaxation inmuscle. A second look. Biophys J . 1980;29:271–281.
50. Schepps JL, Foster KR. The UHF and microwave dielectric propertiesof normal and tumour tissues: variation in dielectric properties with tis-sue water content. Phys Med Biol. 1980;25:1149–1159.
51. Salahuddin S, Porter E, Meaney PM, O’Halloran M. Effect of logarith-mic and linear frequency scales on parametric modelling of tissue dielec-tric data. Biomed Phys Eng Express. 2017;3:1–22.
52. Florkowski CM. Sensitivity, specificity, receiver-operating characteristic(ROC) curves and likelihood ratios: communicating the performance ofdiagnostic tests. Clin Biochem Rev. 2008;29:S83–S87.
53. Gabriel C, Gabriel S. Compilation of the Dielectric Properties of BodyTissues at RF and Microwave Frequencies Internet document. Retrievedfrom: http://www.dtic.mil/dtic/tr/fulltext/u2/a305826.pdf.
54. Rossmann C, Haemmerich D. Review of temperature dependence ofthermal properties, dielectric properties, and perfusion of biological tis-sues at hyperthermic and ablation temperatures. Crit Rev Biomed Eng.2014;42:467–492.
55. O’Rourke AP, Lazebnik M, Bertram JM, et al. Dielectric properties ofhuman normal, malignant and cirrhotic liver tissue: in vivo and ex vivomeasurements from 0.5 to 20 GHz using a precision open-ended coaxialprobe. Phys Med Biol. 2007;52:4707–4719.
56. Allen TH, Krzywicki HJ, Roberts JE. Density, fat, water and solids infreshly isolated tissues. J Appl Physiol. 1959;14:1005–1008.
57. Foster KR, Schwan HP. Dielectric properties of tissues and biologicalmaterials: a critical review. Crit Rev Biomed. 1989;17:197–211.
58. Kufe DW. Mucins in cancer: function, prognosis and therapy. Nat RevCancer. 2009;9:874–885.
59. Staton CA, Chetwood ASA, Cameron IC, Cross SS, Brown NJ, ReedMWR. The angiogenic switch occurs at the adenoma stage of the ade-noma carcinoma sequence in colorectal cancer. Gut. 2007;56:1426–1432.
60. Raica M, Cimpean AM, Ribatti D. Angiogenesis in pre-malignant con-ditions. Eur J Cancer. 2009;45:1924–1934.
61. Kristensen CA, Askenasy N, Jain RK, Koretsky AP. Creatine andcyclocreatine treatment of human colon adenocarcinoma xenografts: 31Pand 1H magnetic resonance spectroscopic studies. Br J Cancer.1999;79:278–285.
62. Kilickesmez O, Atilla S, Soylu A, et al. Diffusion-weighted imaging ofthe rectosigmoid colon. J Comput Assist Tomogr. 2009;33:863–866.
63. Tomoaki I, Sukru ME, Motosugi U, et al. High-B-value diffusion-weighted MRI in colorectal cancer. Am J Roentgenol. 2006;187:181–184.
64. Jianfeng W, Kan L, Wei Z, et al. Fiber-optic Raman spectroscopy forin vivo diagnosis of gastric dysplasia. Faraday Discuss. 2016;187:377–392.
65. Kaatze U. Bound water: evidence from and implications for the dielec-tric properties of aqueous solutions. J Mol Liq. 2011;162:105–112.
66. Pivarnik JM, Palmer RA. Water and Electrolytes During Exercise.(Hickson JF, Wolinski I, eds.). Boca Raton; CRC Press; 1994.
67. Milo R, Jorgensen P, Moran U, Weber G, Springer M. BioNumbers—the database of key numbers in molecular and cell biology. Nucl AcidsRes. 2010;38:750–753.
68. Rastogi A. Clinical review: how to recognize subtle lesions in the colon.ASGE Lead Edge. 2015;5:1–12.
Medical Physics, 45 (8), August 2018
3782 Guardiola et al.: Dielectric properties of colon tissues 3782