diet and cancer: the role of clinical trials
TRANSCRIPT

Diet and Cancer: The Role of Clinical Trials
AICR Annual Research Conference Washington, DC
November 3, 2011
JoAnn E. Manson, MD, DrPH Chief, Division of Preventive Medicine Brigham and Women's Hospital Professor of Medicine and the Michael and Lee Bell Professor of Women’s Health Harvard Medical School

Dr. JoAnn Manson has no real or apparent conflicts of interest related to this presentation.
Dr. Manson has received funding from the NIH to conduct large-scale randomized trials of vitamin D and other dietary interventions to prevent cancer and CVD.
Disclosure

Objectives
• To review strengths and limitations of dietary randomized clinical trials for prevention of cancer.
• RCTs for discussion include:
• Antioxidant vitamin trials
• Women’s Health Initiative (WHI) Diet Modification Trial
• Vitamin D trials

All forms of research (basic, observational, randomized controlled trials, translational) contribute to the totality of the evidence - -no single study gives a definitive answer in isolation.
Key Principle

“things should be as simple as possible, but not any simpler.”
LESSONS Learned from WHI Accept (and embrace) Complexity

Intervention Studies
Strengths
• Randomization helps to control major sources of bias: confounding, selection, indication, and adherence.
• Better control of exposure than in observational studies.
Limitations
• Compliance with intervention may be suboptimal. • Usually only one dose (or intensity) of an intervention can
be tested. • Latency periods. • Expensive design, resources can be costly.

Placebo Adherence and Clinical Outcomes in the Women’s Health Initiative HT Trials
(n=13,444; 106,066 pys)
Source: Curtis, Jeffrey, et al. Medical Care 2011.
* HR adjusted for age, ethnicity, education, smoking, BMI, physical activity, multiple dietary and lifestyle factors, other medication use.
Adherence Hazard Ratio* Clinical Outcome Category (%) (95% CI)
Total Mortality <80 1.0 (Referent) >80 0.64 (0.51-0.80)
Cancer Mortality <80 1.0 (Referent) >80 0.60 (0.43-0.82)
Total Cancer <80 1.0 (Referent) >80 0.91 (0.76-1.10)
Clinical MI <80 1.0 (Referent) >80 0.69 (0.50-0.95)

Potential Interrelationships among Serum 25 (OH) Vitamin D Levels, Obesity, Physical Activity, Sun Exposure, Diet,
Cancer, CVD, and Diabetes.
Poor Nutrition: Low Dietary Intake of Vitamin D Low Sun Exposure
Obesity
Low 25(OH)D ↑ PTH
Low Physical Activity
Cancer, CVD and type 2 diabetes
?

Antioxidants and Breast Cancer Risk: A Population-Based Case-Control Study in Canada
(n=2362 cases, 2462 controls)
Beta-carotene Supplements OR* (95% CI) P-value
Low or No Intake† 1.00 (Referent) High Intake 0.47 (0.20-1.08) 0.07
Vitamin E Supplements OR* (95% CI)
Low or No Intake 1.00 (Referent) High Intake 0.64 (0.42-0.99) 0.04
Postmenopausal Women
* Adjusted for age, province, education, smoking, alcohol, no. of live births, BMI, physical activity, age at menarche, total energy intake.
† Lower than median intake.
Source: Pan SY, et al. BMC Cancer 2011.

Women’s Health Study Randomization Scheme
Aspirin (N=19,934)
Placebo (N=19,942)
Female Health Professionals Randomized (N=39,876)
Vitamin E (N=9,966)
Placebo (N=9,968)
Vitamin E (N=9,971)
E Placebo (N=9,971)
Outcomes: CVD, cancer, total mortality, others

No. of Events Outcome Total invasive cancer
Vitamin E (n=19,937)
1437
Placebo (n=19,939)
1428
RR (95% CI)
1.01 (0.94-1.08)
P Value
.87
Breast 616 614 1.00 (0.90-1.12) .95
Colon 107 107 1.00 (0.77-1.31) .99
Cancer deaths 308 275 1.12 (0.95-1.32) .17
Total mortality 636 615 1.04 (0.93-1.16) .53
Vitamin E (600 IU on Alternate Days) and Relative Risks of Cancer and Total Mortality over 10 Years
The Women’s Health Study (Randomized Trial)
Source: Lee I-M, et al. JAMA 2001.

Total or Site-Specific Cancer Incidence and Cancer Mortality in the Women’s Antioxidant Cardiovascular Study (F/U = 9.4 yrs)*
Beta-Carotene Vitamin C Vitamin E
Incidence or Mortality RR (95% CI)† RR (95% CI)† RR (95% CI)†
Total cancer 1.00 (0.85-1.17) 1.11 (0.95-1.30) 0.93 (0.79-1.09)
Breast 1.01 (0.79-1.30) 1.11 (0.87-1.41) 0.98 (0.77-1.25)
Lung 1.26 (0.80-1.99) 1.84 (1.14-2.97) 1.25 (0.79-1.97)
Colorectum 1.32 (0.73-2.39) 0.76 (0.42-1.38) 0.63 (0.34-1.15)
Cancer death 0.84 (0.62-1.13) 1.28 (0.95-1.73) 0.87 (0.65-1.17)
* Hazard ratios are presented as relative risk (RRs) and 95% confidence intervals (CIs). † RR is the rate in the treatment group compared with the rate in the placebo group for each agent.
Source: Lin J, Cook NR, Albert C . . . Manson JE. JNCI 2009.

No. of Men Cases Cases Adjusted HR Outcome in Analysis (Active) (Placebo) (95% CI)
Total Cancer 14,641 Vitamin E 984 959 1.04 (0.95-1.13) Vitamin C 973 970 1.01 (0.92-1.10)
Prostate Cancer 13,983 Vitamin E 493 515 0.97 (0.85-1.09) Vitamin C 508 500 1.02 (0.90-1.15)
Total Mortality 14,641 Vitamin E 841 820 1.08 (0.98-1.19) Vitamin C 857 804 1.07 (0.97-1.18)
Cancer Mortality 14,641 Vitamin E 273 250 1.13 (0.95-1.34) Vitamin C 268 255 1.06 (0.89-1.25)
Randomized Vitamin E and Vitamin C and the Risk of Total Cancer, Prostate Cancer, and Mortality in the Physicians’ Health Study II
Gaziano JM, et al. JAMA 2009.

Gaziano JM, et al. JAMA 2009.
Physician’s Health Study II: Individual and Joint Effects of Vitamins E and C on Cancer

Source: ATBC Cancer Group, NEJM 1994; 330:1029.
Alpha-Tocopherol and Beta-Carotene Supplementation and Incidence of Cancer (per 10,000 pys):
the ATBC Trial in Finnish Smokers
No. of Cases (Incidence) No. of Cases (Incidence)
Alpha-Tocopherol Beta-Carotene

Source: Klein EA, et al. JAMA 2011.
SELECT Trial Risk of Prostate Cancers with Trial Interventions
Vitamin E Selenium Vitamin E + Placebo Alone Alone Selenium (n=8,696) (n=8,737) (n=8,752) (n=8,702)
Hazard Ratio (95% CI)
as of 10/2008 1.13 (0.95-1.35) 1.05 (0.88-1.25) 1.04 (0.87-1.24)
as of 7/2011 1.17 (1.004-1.36) 1.09 (0.93-1.27) 1.05 (0.89-1.22)
Absolute Risk* 93 109 101 97
*Prostate cancers per 10,000 person years

LINXIAN, China: Nutrition Intervention Trial
Supplementation with beta carotene, vitamin E, and selenium:
Cause of Death N RR (95% CI)
Total mortality 2127 0.91 (0.84-0.99)
Cerebrovascular 523 0.90 (0.76-1.07)
Cancer 792 0.87 (0.75-1.00)
Source: Blot WJ, et al. JNCI 1993.
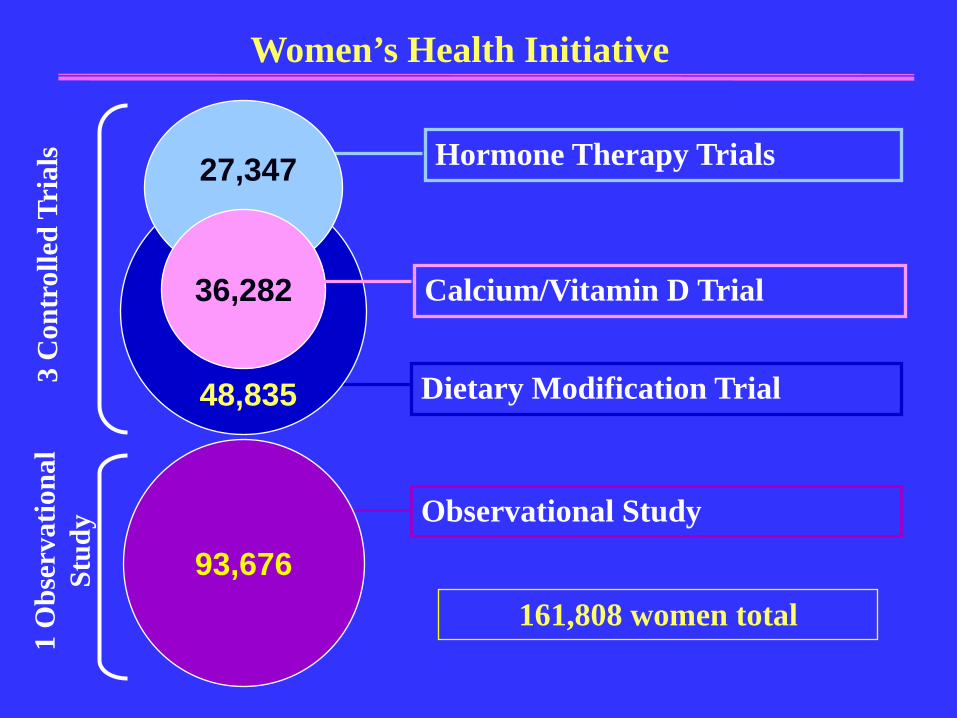
Women’s Health Initiative
Observational Study
93,676
1 O
bser
vatio
nal
Stud
y
161,808 women total
Hormone Therapy Trials
Calcium/Vitamin D Trial
Dietary Modification Trial 48,835
36,282
3 C
ontr
olle
d Tr
ials
27,347

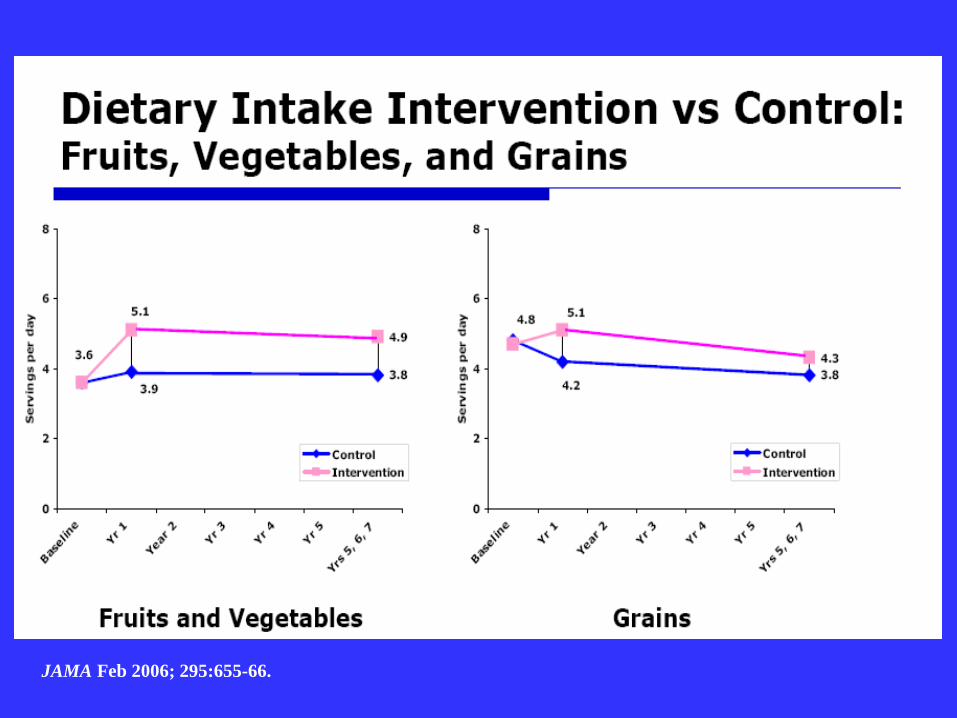
Dietary Change Goals: Intervention Group
Photos courtesy of USDA Agricultural Research Service
• 20% energy from fat
• 5 or more fruit and vegetable servings daily
• 6 or more grain servings daily

WHI Dietary Modification Trial: Design Goals and Rationale
• Primary goal was to test the theory that reducing total fat intake to 20% of calories would decrease the risk of breast cancer and colorectal cancer (cancer was primary outcome: both saturated and polyunsaturated fats had been implicated).
• CHD was secondary outcome: expectation that restricting fat to 20% calories would reduce saturated and trans fats sufficiently to impact risk of CHD.

Breast Cancer Incidence Age-Adjusted
Women of ages 45-69 1973-1977 versus per capita fat consumption 1975 -1977

Dietary Fat and Postmenopausal Breast Cancer
Ability to adequately characterize and adjust for measurement error?
Case-control Studies Howe et al (1990, JNCI) 1 1.20 1.24 1.24 1.46 (p<.0001) Cohort Studies Hunter et al (1996, NEJM) 1 1.01 1.12 1.07 1.05 (p=0.21)
Fat Consumption Quintile


WHI DM Trial Adherence: Percent Energy from Fat
37.8 37
28.8
35.1
24.3
20
22
24
26
28
30
32
34
36
38
40
Perc
ent E
nerg
y fr
om F
at
Control
Intervention
JAMA 2006; 295:629-42.

JAMA Feb 2006; 295:655-66.
JAMA Feb 2006; 295:655-66.

Source: Prentice RL et al. JAMA 2006;295(6):629-42.
1,727 total diagnoses
3.5% of all DM participants
Study Year
Cum
ulat
ive
Haz
ard
Rat
io
Breast Cancer Risk in the Dietary Modification Trial: Cumulative Hazard Ratios

Intervention vs Control Breast Cancer by Baseline % Energy from Fat
Intervention Cases
Control Cases
HR (95% CI) P interaction
<27.9 144 222 0.97 (0.79-1.20)
0.04
27.9-<32.3 186 259 1.08 (0.89-1.30)
32.3-<36.8 160 283 0.85 (0.70-1.03)
>36.8 151 291 0.78 (0.64-0.95)
Source: Prentice RL et al. JAMA 2006;295(6):629-42.

Low-Fat Dietary Pattern and Cancer Incidence in the WHI Dietary Modification Trial
Incidence per 1000 person-years (No. of cases)
Intervention Comparison P HR (95% CI)
Ovary 0.36 (57) 0.43 (103) .03 0.83 (0.60- 1.14) Endometrium 0.79 (125) 0.71 (170) .18 1.11 (0.88-1.40) Breast 4.15 (655) 4.52 (1072) .09 0.91 (0.83-1.01) Colorectal 1.27 (201) 1.18 (279) .29 1.08 (0.90-1.29) All other sites 4.56 (720) 4.81 (1140) .30 0.95 (0.86-1.04) Total cancer 10.69 (1687) 11.22 (2661) .10 0.95 (0.89-1.01) *Trial included 19,541 women in the intervention group and 29,294 women in the comparison group.
Source: Prentice RL, et al. JNCI 2007; 99:1534-1543.

Low-Fat Dietary Pattern and Ovarian Cancer in the WHI Dietary Modification Trial
Source: Prentice RL, et al. JNCI 2007; 99:1534-1543.

The VITamin D and OmegA-3 TriaL (VITAL): Design
Mean Treatment Period = 5.0 years Blood collection in ~16,000, follow-up bloods in ~6000 Primary Outcomes: Cancer (total) and CVD (MI, stroke, CVD death)
Vitamin D3 (2000 IU/d); N=10,000
Placebo N=10,000
20,000 Initially Healthy Men and Women (Men >50 yrs; Women >55 yrs)
Placebo N=5000
EPA+DHA (1 gm/d); N=5000
Placebo N=5000
EPA+DHA (1 gm/d); N=5000

Institute of Medicine (IOM) Committee’s Conclusion on Vitamin D and Cancer and CVD
• Evidence for an association is inconsistent.
• Evidence for an association is inconclusive as to causality.
• Evidence for an association with nonskeletal outcomes is not yet sufficient to inform dietary recommendations.
Source: IOM: DRIs for Calcium and Vitamin D, National Academies Press, 2011.

Vitamin D and Cancer: Summary of Findings from Observational Studies
Colorectal Cancer
Prostate Cancer
Breast Cancer
Total Cancer
Ecologic (UV-B) ↓↓ ↓ ↓ ↓
Vitamin D intake ↓↓ 0 ↓ ↓
Circulating 25 (OH)D
↓↓ ↓ ↓ ↓
↓↓=strong protection; ↓=suggestive protection; 0=sparse or inconclusive data

Women’s Health Initiative: 25(OH)D Levels and Risk of Breast Cancer
(895 cases and 898 controls)
Source: Chlebowski, et al. JNCI 2007.
* Adjusted for age, race/ethnicity, HT use, FMH of breast cancer, history of breast biopsy, BMI, physical activity.
† Model without adjustment for BMI and physical activity: p, trend = 0.04.
25(OH)D Quintile (nmol/L) OR* (95% CI) P, trend
>67.6 1.00 (Referent) 0.20 56.4-<67.6 1.15 (0.86-1.55) 43.9 - <56.4 1.35 (0.99-1.82) 32.4-<43.9 1.17 (0.86-1.60) <32.4 1.22 (0.89-1.67)

Trial,
Location
Population
Intervention
Dose
Cancer Cases Treatment/
Control
RR (95%CI)
Oxford, UK 2,686 M + F ages 65-85
Vitamin D3 100,000 IU/4 mo (~833 IU/d) vs placebo
188/173 1.09 (0.86-1.36)
Nebraska, U.S. 1,179 post- menopausal F mean age 67
Vitamin D3 1100 IU/d + cal vs cal alone
13/17 0.76 (0.38-1.55)
WHI, U.S. 36,282 post- menopausal F ages 50-79
Vitamin D3 400 IU/d + cal vs placebo
1634/1655
Vitamin D Supplementation and Total Cancer Incidence: Secondary Analyses from Randomized Clinical Trials
Source: Adapted from Manson JE, Mayne ST, and Clinton SK. NEJM 2011; 364.
Total cancer=0.98 (0.91-1.05) Breast cancer=0.96 (0.85-1.09) Colorectal cancer=1.08 (0.86-1.34)

Source: Chlebowski, et al. JNCI 2007.
Calcium + Vitamin D Supplementation and Risk of Breast Cancer: The WHI Ca/D Trial
Case Pts/No. of Women CaD Placebo Hazard Ratio (95% CI) Baseline Total Vit D (supplement+diet; IU/d)
<200 168/6827 205/6671
200-<400 109/3379 116/3423
400-<600 129/4188 135/4295
>600 113/3427 83/3364
1 0.1
•
•
•
•
0.79 (0.65-0.97)
0.97 (0.74-1.26)
0.98 (0.77-1.24)
1.34 (1.01-1.78)
P for Interaction = 0.003

Justification of Doses Selected for VITAL Vitamin D3: 2000 IU/d (50 µg/d)
EPA+DHA: 1 gm/d (840 mg EPA+DHA) • Proposed doses represent the best balance of efficacy
and safety.
• Vitamin D dose will provide average serum 25(OH)D level of ~90 nmol/L (optimal range 75-100 nmol/L) and a delta of 35-50 nmol/L compared to the placebo group.
• 1 gm/d EPA+DHA: health recommendations 0.4-1 gm/d for cardioprotection; threshold effect at 1 gm/d (average intake in U.S. is 100-200 mg/d; dose is 5-10 x higher).

Planned Ancillary Studies in VITAL
Funded • Cognitive Function • Diabetes/Glucose Tolerance • Hypertension • Autoimmune Disorders • Asthma/Respiratory Diseases • Diabetic Nephropathy • Fractures • Mood Disorders/Depression • Infections
Pending Macular Degeneration Colorectal Adenomas Non-invasive Vascular Imaging Bone Microarchitecture

The VITamin D and OmegA-3 TriaL (VITAL) Working Group
Consultants
Walter Willett Edward Giovannucci John Baron Michael Holick Bruce Hollis
JoAnn Manson (PI) Julie Buring I-Min Lee Nancy Cook Michelle Albert Christine Albert David Gordon Jean MacFadyen Elaine Zaharris Ellie Danielson Shari Bassuk Harriet Samuelson

Conclusions
• Dietary interventions for cancer prevention provide important information but have many challenges (logistics, costs, latency periods, etc.).
• All forms of research (basic, observational, RCTs) contribute to the totality of evidence and no single study gives a definitive answer in isolation.
• Basic and observational studies generate hypotheses to test in RCTs, but even RCTs can generate hypotheses to test in more focused future trials.