dieting and the self-control of eating in everyday environments: an experience sampling study
TRANSCRIPT

British Journal of Health Psychology (2014), 19, 523–539
© 2013 The British Psychological Society
www.wileyonlinelibrary.com
Dieting and the self-control of eating in everydayenvironments: An experience sampling study
Wilhelm Hofmann1*, Marieke Adriaanse2, Kathleen D. Vohs3 andRoy F. Baumeister4
1Booth School of Busines, University of Chicago, USA2Department of Clinical & Health Psychology, Utrecht University, The Netherlands3Carson School of Business, University of Minnesota, St Paul, USA4Department of Psychology, Florida State University, Tallahassee, USA
Objective. The literature on dieting has sparked several debates over how restrained
eaters differ from unrestrained eaters in their self-regulation of healthy and unhealthy
food desires and what distinguishes successful from unsuccessful dieters. We addressed
these debates using a four-component model of self-control that was tested using
ecological momentary assessment, long-termweight change, and a laboratorymeasure of
inhibitory control.
Design. A large sample of adults varying in dietary restraint and inhibitory control (as
measured by a Stroop task) were equipped with smartphones for a week. They were
beeped on random occasions and provided information on their experience and control
of healthy and unhealthy food desires in everyday environments.
Main outcome measures. The main outcome measures were desire strength,
experienced conflict, resistance, enactment of desire, and weight change after a 4-month
follow-up.
Results and conclusions. Dietary restraint was unrelated to desire frequency and
strength, but associated with higher conflict experiences and motivation to use self-
control with regard to food desires. Most importantly, relationships between dietary
restraint and resistance, enactment of desire, and long-term weight change were
moderated by inhibitory control: Compared with dieters low in response inhibition,
dieters high in response inhibition were more likely to attempt to resist food desires, not
consume desired food (especially unhealthy food), and objectively lost more weight over
the ensuing 4 months. These results highlight the combinatory effects of aspects of the
self-control process in dieters and highlight the value in linking theoretical process
frameworks, experience sampling, and laboratory-based assessment in health science.
Statement of contributionWhat is already knownon this subject?Dieting is amultifaceted process that can be viewed from the
lens of self-control. Dietary restraint measures can be used to capture dieting status, but it is relatively
unclear what differentiates successful from unsuccessful dieters (e.g., differences in desire frequency,
desire strength, motivation, executive functions).
*Correspondence should be addressed to Wilhelm Hofmann, 5807 S Woodlawn Ave, Chicago, IL 60637, USA (email: [email protected]).
DOI:10.1111/bjhp.12053
523

What does this study add?
� A novel four-step conceptual model of self-control is applied to eating behaviour in everyday life.
This model allows a fine-grained look at the self-control process in restrained eaters (dieters) as
compared to non-dieters.
� Dieters and non-dieters do not differ in desire frequency and strength (they are not simply more
tempted).
� Dieters high (as compared to low) in inhibitory control are more likely to engage in self-control.
� Dieters high (as compared to low) in inhibitory control are more likely to resist unhealthy food
desires.
� Dieters high (as compared to low) in inhibitory control are more likely to loose weight over a 4-
month period.
� Together, the study shows clear differences among successful and unsuccessful dieters that can be
linked to differences in executive functioning (inhibitory control).
� The present article is one of the first studies combining a conceptual model with smartphone
experience sampling to study weight control and thus paradigmatic from a methodological
perspective.
The Western ‘obesogenic environment’ is characterized by the abundant availability of
palatable but unhealthy food (French, Story, & Jeffery, 2001; Hill & Peters, 1998;Wardle, 2007). The obesogenic environment has resulted in an increasing number
of people who attempt to control their weight. A study in Nature reported that
over 70% of US adults reported attempting to curb calories, reduce quantity of food
intake, reduce fat, or raise exercise levels at least once across a 4-year period (French,
Jeffery, & Murray, 1999). People who frequently or regularly try to control their
weight by limiting their caloric intake are referred to as chronic dieters or restrained
eaters.
Unfortunately, restrained eaters are often unsuccessful in controlling their weight(Mann et al., 2007). For instance, whereas restrained eaters’ eating behaviour is
characterized by periods of restriction, these efforts at restraint are often undermined
by lapses and periods of overeating (Gorman & Allison, 1995). Accordingly, researchers
have found that people scoring high on dietary restraint often do not consume fewer
calories, on average, compared to individuals with low scores on dietary restraint despite
being motivated to do so (Stice, Cooper, Schoeller, Tappe, & Lowe, 2007; Stice, Fisher, &
Lowe, 2004).
Many explanations have been proposed for problems regulating food intake. Forinstance, it could be that restrained eaters are more vulnerable to the hedonic appeal of
unhealthy foods than non-dieters and therefore experience stronger desires for unhealthy
foods (Lowe & Butryn, 2007; Stroebe, Papies, & Aarts, 2008). Some evidence for this
notion comes from research showing that compared with unrestrained eaters, restrained
eaters experience more spontaneously activated hedonic thoughts when exposed to
tempting food (Papies, Stroebe, & Aarts, 2007) and appear to have problems in down-
regulating hedonic affective reactions to tempting food (Hofmann, Koningsbruggen,
Stroebe, Ramanathan, & Aarts, 2010).Moreover, dieters’ frequent failuresmight be linked to ineffective inhibitory control or
executive functioning (Nederkoorn, Houben, Hofmann, Roefs, & Jansen, 2010).
According to this account, the inability to inhibit pre-potent impulses and desires is
central to self-regulation failure (Allan, Johnston, & Campbell, 2010; Guerrieri, Neder-
koorn, & Jansen, 2007; Hofmann, Friese, &Wiers, 2008; Nederkoorn, Van Eijs, & Jansen,
2004; Nederkoorn et al., 2010). For example, recent laboratory research demonstrated
524 Wilhelm Hofmann et al.
that dieters who are poor in inhibitory control consumed more chocolate during a taste
test than those with strong inhibitory control (Allan et al., 2010). Accordingly, improving
inhibitory control through training has been shown to predict decreased sweet
consumption among restrained eaters (Houben & Jansen, 2011). This research pointsto the idea that whereas dietary restraint measures per se have been found to be poor
predictors of weight change (Stice et al., 2004, 2007; Tiggemann, 1994), they may be
better predictors in combinationwith individual differences in inhibitory control of who
gains versus loses weight.
The research on why dieters often fail to adhere to their intentions thus points to
several possibilities as to where self-control failures might occur during the process of
managing food desires. In most studies, however, researchers have looked at food
consumption or weight loss in isolation, that is, at the ultimate outcome variables of theself-control process, but not at the underlying process mechanisms that give rise to these
outcomes. For instance, a number of scholars have argued that most approaches do not
distinguish clearly between the strength of a given desire and the capacity to control a
desire (Herman & Polivy, 2004; Hofmann, Friese, & Strack, 2009; Hofmann et al., 2008;
Rawn & Vohs, 2011). Moreover, studies that have investigated underlying mechanisms
for overeating among dieters are generally conducted in controlled (and somewhat
artificial) laboratory settings (Fedoroff, Polivy, & Herman, 1997; Herman & Mack, 1975;
Hofmann & Friese, 2008; Hofmann, Rauch, & Gawronski, 2007; Papies et al., 2007;Ward & Mann, 2000). While studying eating in laboratory settings has many benefits
(e.g., Schachter, Goldman, & Gordon, 1968), research situated in people’s natural eating
environments is a neglected approach that may help to cross-validate findings obtained
in more controlled settings as well as offer its own unique insights (Tomiyama, Mann, &
Comer, 2009).
A four-component framework of the self-control of eating behaviourHere, we apply a general theoretical framework for the study of desire and self-control
in everyday life that was recently proposed (Hofmann, Baumeister, F€orster, & Vohs,
2012) to the case of dieting. We suggest four components that, considered jointly,
allow for a fine-grained analysis of where in the self-control process dieters fail or
succeed: Desire strength, conflict, resistance (i.e., use of self-control), and the
enactment of behaviour. The first component, desire, deals with the strength of the
urges that a person experiences. In this study, we tested the hypotheses that restrained
eaters experience more frequent food desires and/or suffer from stronger desires andthus are in a disadvantageous position ‘from the start’ as compared to unrestrained
eaters.
The second component, conflict, reflects the degree to which people perceive that a
desire stands in opposition with their long-term goals, thereby turning the desire into a
temptation (Hofmann, Baumeister, et al., 2012). The identification of a conflict between
what one desires to do and what one should be doing is an important trigger for self-
control efforts (Carver & Scheier, 1981; Hofmann, Baumeister, et al., 2012; Myrseth &
Fishbach, 2009). Yet despite knowing that conflicts are important instigators of self-control processes, little research has been devoted to measuring the degree to which
dieters versus non-dieters feel conflicted about their food desires.
The third component, resistance, describes the degree to which a person attempts to
override the desire for food through self-control. The degree to which dieters attempt to
resist a given food desire should be strongly related to the degree to which they feel
Dieting and self-control 525
conflicted about that desire. However, distinguishing between conflict and resistance is
important, because dieters may not always decide to resist a given food craving when
experiencing conflict. For instance, some dieters may believe that their chances of being
able to resist successfully are so low that they do not even attempt to do so.The fourth component, enactment, reflects the behavioural outcome of the
motivational processes from desire to possible conflict to possible resistance. In the
case of a non-conflicting desire, enactment of the desirewould inmost cases be the natural
endpoint of that process. In the case of an active resistance attempt, however, enactment
signifies self-control failure because the person behaved in a way that was contrary to his
or her intentions (Hofmann, Baumeister, et al., 2012; Stroud & Tappolet, 2003).
Research objective and hypotheses
The purpose of this work was to gain a fine-grained understanding of how and why
chronic dieters (restrained eaters) differ in their self-regulation of everyday food intakefrom non-dieters (unrestrained eaters) using smartphone experience sampling technol-
ogy. To do so, we decomposed the self-control process into the four conceptual
components just described (desire, conflict, resistance, enactment). In addition, we
collected follow-up data on self-reported weight change over 4 months as a long-term
behavioural outcome. We expected dieters to experience more frequent and stronger
food desires than others on average, in accordance with hedonic theories of overeating.
We also assumed that dieterswould feelmore conflicted about their food desires given the
structural conflicts between many food desires and dieting goals. Consequently, weexpected chronic dieters to use self-control more often than non-dieters. However, based
on the abovefindings on the difficulties of dieting,we expected that dieterswould do little
better on average than non-dieters with regard to their enactment of food desires (Stice
et al., 2004, 2007), especially on self-control occasions. These difficulties were expected
to result in a non-significant overall relationship between dietary restraint andweight loss,
as other work has found (Mann et al., 2007; Tiggemann, 1994).
Because it is plausible that healthy and unhealthy foods take on different meanings for
chronic dieters as opposed to non-dieters, we also distinguished between healthy andunhealthy foods in conducting these analyses. From a nutritional perspective, both
healthy and unhealthy foods can lead to weight gain if consumed in abundance. Yet,
chronic dietersmay not perceive food intake in thisway. A recent study has suggested that
people – especially those high in dietary restraint – can harbour erroneous beliefs about
the relationship between a meal’s healthiness and its (limited or null) effects on weight
gain (Chernev, 2011). This research showed that weight-conscious individuals often
behave as though eating healthy foods in addition to unhealthy oneswill actually decrease
(not increase) a meal’s calorie count. Thus, chronic dieters may feel reduced levels ofconflict towards healthy foods as compared to unhealthy foods that may result in lower
rates of resisting these foods.
To get at a better understanding of self-control failures in dieting, we also
investigated the role of inhibitory control (Hofmann et al., 2008; Miyake, Friedman,
Emerson, Witzki, & Howerter, 2000). Because the capacity to inhibit pre-potent
impulses has been implied as a major determinant of effective self-regulation, we
expected inhibitory control to help distinguish between successful and unsuccessful
dieters. Specifically, we hypothesized that dieters low in inhibitory control shouldshow more self-control failures and less weight loss over time than dieters high in
inhibitory control. Because inhibitory control may also affect the motivation to resist
526 Wilhelm Hofmann et al.

problematic food desires or even further ‘upstream’ components such as desire
strength and conflict, we explored its possible moderator role with regard to these
components from our conceptual framework as well.
The present method, experience sampling, allows researchers to learn what peopleare thinking, feeling, and doing at specificmoments in their lives (e.g., Csikszentmihalyi &
Larsen, 1987; Hektner, Schmidt, & Csikszentmihalyi, 2006). Some previous research has
adopted this method to study specific eating disorders such as bulimia (Johnson & Larson,
1982; Steiger, Lehoux, & Gauvin, 1999; Vansteelandt et al., 2004), eating behaviour
among adolescents (Richards, Casper, & Larson, 1990; Swarr & Richards, 1996), and
situational triggers of overeating such as emotional states and stress (Kubiak, Vogele,
Siering, Schiel, & Weber, 2008; Macht & Simons, 2000; Tomiyama et al., 2009). To the
best of our knowledge, however, noprior researchhas combined thismethod to cover thewhole self-control process from desire to behaviour enactment and long-term weight
change in order to understand how restrained and unrestrained eaters self-regulate their
everyday eating behaviour.
Method
Overview
We analysed food data from the recent Everyday Temptation Study (Hofmann,Baumeister, et al., 2012), which is a large experience sampling database on more than
7,000 desires from 15 different domains. The by far most often mentioned type of desire
(28.1%) was food relatedwith the 2,203 food desires forming the database for the present
set of analyses. The experience sampling phase of the project was complemented by a
laboratory assessment of dietary restraint and inhibitory control and by a follow-up
assessment of self-reported weight change 4 months after the experience sampling was
finished.
Participants
The initial sample included 208 participants (66% women) from the city of W€urzburg,Germany, and its surroundings. Participants were aged 18–55 (M = 25.24, SD = 6.32),
and 73% were university students. The student part of the sample was heterogeneous,
involving 49different fields of study. The remaining 27%of participantswere either full- or
part-time employed (13.9%), currently doing an apprenticeship (3.4%), high-school
students (1.9%), unemployed (1.4%), retirees (1%), or other (5.3%). Experience samplingdata from three participants were lost due to technical problems. One participant did not
report any food desires. Hence, the final sample consisted of 204 participants. BMI of
participants averaged 22.83 (SD = 3.19) and ranged from 16.02 to 35.57.
Experience sampling procedure
During an orientation meeting, participants were provided with Blackberry smartphones
that were disabled for placing or receiving calls. They were informed about the generalpurpose of the study, received both oral and written instructions, and provided informed
consent. Participants carried the smartphones wherever they went for a duration of
1 week. A Java ME programmed smartphone application controlled the signalling
schedule, questionnaire presentation, and data saving on the device. On each experience
sampling day, seven signals were distributed throughout a time-window of 14 hr
Dieting and self-control 527
(participants could customize the starting time for each day to either 8, 9, or 10 am).
Within each 2-hr block of this time-window, one signal was randomly chosen so as to
spread out signals equally throughout the day. If the smartphonewas turned off at the time
of the signal, the program rescheduled the signal at a later point in the present or next timeblock; however, if the smartphone was off until the next time block ended, the response
was recorded as missing.
Experience sampling protocol
At the onset of each signal, participants first indicated whether they were currently
experiencing a desire or had been experiencing a desire within the last 30 min. If they
indicated no desire, the assessment period was over. If they indicated a desire, they nextindicated the content of the desire. Participants were provided with a list of 15 domains
(food, non-alcoholic drinks, alcohol, coffee, tobacco, other substances, sex, media,
spending, work, social, leisure, sleep, hygiene-related, other). These were further
branched into a total of 79 subdomains, drawn from the self-regulation literature and
based on pre-testing. For the category of food desires, the subdomains were as follows:
‘primarily healthy dish’, ‘primarily hearty dish’, ‘fast food main dish’, ‘sweet main dish’,
‘healthy snack’, ‘fast food as snack’, ‘sweet snack (chocolate, ice cream, etc.)’, and
‘nibbles (chips, etc.)’. Under the response option ‘other’, participants could also provide aself-generated response using the keyboard on the smartphone.
Next participants indicated the peak strength of the desire on a scale from 0 (no desire
at all) to 7 (irresistible) and whether they had attempted to resist the desire (yes vs. no).
They then indicated (yes vs.no)whether they had enacted the behaviour suggested by the
desire (even to some extent, e.g., eating some of a chocolate bar without eating the entire
bar would count as enactment). Finally, participants rated the degree to which the given
desire conflictedwith one ormore personal goal(s) on a scale from 0 (no conflict at all) to
4 (very high conflict). On a random subset of occasions (60%), participants also indicatedtheir location, level of stress, arousal, and to what degree they were currently under the
influence of alcohol. As these variables had many missing occasions and are not in the
focus of the present investigation, we will not discuss them further.
Two to 4 days after the experience sampling phase, participants completed a variety
of measures including demographic indicators (e.g., sex, age, occupation, weight), a
measure of dietary restraint, and an experimental assessment of inhibitory control
(described below). Theywere then debriefed and paid for their participation. Participants
were reimbursed with a base compensation of €20 (approximately $28) and receivedadditional incentives (movie passes, music player raffle tickets) if they completed more
than 80% of signals. Participants completed 92.2% of signals on average.
Dietary restraint scale
Dietary restraint was assessed with the Concern for Dieting subscale of the Revised
Restraint Scale (Herman & Polivy, 1980). The mean score across the six items with a
response scale from 1 to 4 was 2.03 (SD = .56; a = .75). Following Stein (1988) whoargued against arbitrary cut-offs and unnecessary loss of information due to dichotomi-
zation, dietary restraint was treated as a continuous variable (see also Papies, Stroebe, &
Aarts, 2009; Tomarken&Kirschenbaum, 1984). For the sake of succinctness,wewill refer
to people above average (+1 SD) on the scale as ‘dieters’ or ‘restrained eaters’ and to
people below average (�1 SD) on the scale as ‘non-dieters’ or ‘unrestrained eaters’.
528 Wilhelm Hofmann et al.

Measure of inhibitory control
Inhibitory control was assessedwith the Stroop (1935) task, a task commonly classified as
a measure of pre-potent response inhibition (Friedman & Miyake, 2004; Miyake et al.,
2000). Participants responded to the colour of aword presented on awhite background asquickly as possible using four response keys (red, green, blue, and black). The test block
consisted of 84 trials, including 28 congruent trials, 28 incongruent trials, and 28 non-
word filler trials (simple rectangles that varied in colour), drawn in random order. During
congruent trials, the meaning of the words and the colour in which they were presented
were compatible (e.g., ‘red’ presented in red ink). During the incongruent trials, the
meaning of the words was incompatible with the colour in which they were presented
(e.g., ‘red’ in green ink), and hence, the pre-potent response to react in accordance with
the word meaning has to be inhibited. To compute a measure of Stroop interference, wesubtracted the mean log-transformed response latencies for congruent trials from the
mean log-transformed response latencies on incongruent trials for each participant (non-
word trials were not included). The average Stroop effect was significant, Mlog = .19
(untransformed M = 189.86 ms), SD = .12, t(203) = 22.91, p < .001, indicating the
expected interference on incongruent trials. We then reversed this difference score such
that higher scores indicate better inhibition (i.e., smaller Stroop effect).
Weight change over 4 months
Self-reportedweight in kilogramwas assessed at the endof the experience samplingphase
and again through an online survey distributed 4 months later. Response rate to the
follow-up survey was satisfactory (78%; N = 160). The difference in weight from the
testing phase to the follow-up served as ourmeasure ofmedium-termweight change,with
positive scores representing weight gain and negative scores representing weight loss.
The mean self-reported weight difference was M = 0.46 kg (SD = 2.80), which differed
from zero, t(159) = 2.06, p = .041, indicating that the average participant gained someweight over time.
Coding of healthy and unhealthy food desires
Participant experience sampling responses in the subdomain category ‘other’ (n = 100)
were screened by two independent raters. Themajority of these responses (n = 63) could
be reassigned to the remaining subdomains, leaving 37 responses in the category ‘other’,
which were excluded from further analyses (inter-rater agreement j = .95). Wecategorized participants’ remaining desire responses to food (N = 2,166) into healthy
and unhealthy food desires based on the answers on the subdomain level. Desires for
‘primarily healthy dish’ and ‘healthy snack’ were assigned to the healthy food craving
category, and desires for ‘primarily hearty dish’, ‘fast food main dish’, ‘sweet main dish’,
‘fast food as snack’, ‘sweet snack (chocolate, ice cream, etc.)’, and ‘nibbles (chips, etc.)’
were assigned to the unhealthy food craving category.
Experience sampling data aggregation
To address whether participants high in dietary may bemore pre-occupied with food, we
calculated, for each participant, the relative percentage of healthy (M = 11%, SD = .09)
and unhealthy food desires (M = 18%, SD = .11) with regard to the overall number of
desires mentioned during the experience sampling period. All remaining measures were
Dieting and self-control 529
computed from the subset of food-related desires in the database. Specifically, we
computed, for each participant, the following measures both across all food desires
(overall score) and separately for healthy and unhealthy food desires: (1) average desire
strength, (2) average rating of conflict, (3) average probability that the participantattempted to resist the food desire, (4) average probability that the participant enacted a
food desire (implying consumption of the food), and (5) average probability that the
participant enacted a food desire that he or she had attempted to resist (self-control failure
rate).
Results
What kind of food desires do people have?
We categorized the types of food desires that people reported having into healthy versus
unhealthy (see Method section). Participants indicated a total of 836 desires for healthy
food and 1,330 desires for unhealthy food, thereby reporting on average almost 60%more
desires for unhealthy foods than healthy foods.
Is dietary restraint associated with the frequency of food desires?
We first assessed whether dietary restraint was related to the frequency of food desires. It
was not. Dietary restraint was uncorrelated with both the absolute reported frequencies
of desires for food overall, r = �.01, p = .84, for healthy food, r = .05, p = .51, or for
unhealthy food, r = �.05, p = .47, as well as with percentage scores that reflected the
percentage of food desires among the overall number of desires reported (roverall = .02,
p = .31; rhealthy = .07, p = .31; unhealthy food, runhealthy = �.01, p = .93). Hence,
chronic dieters experienced food desires just as often as non-dieters.
How does dietary restraint affect desire strength, conflict, resistance, behaviour
enactment, and weight change?
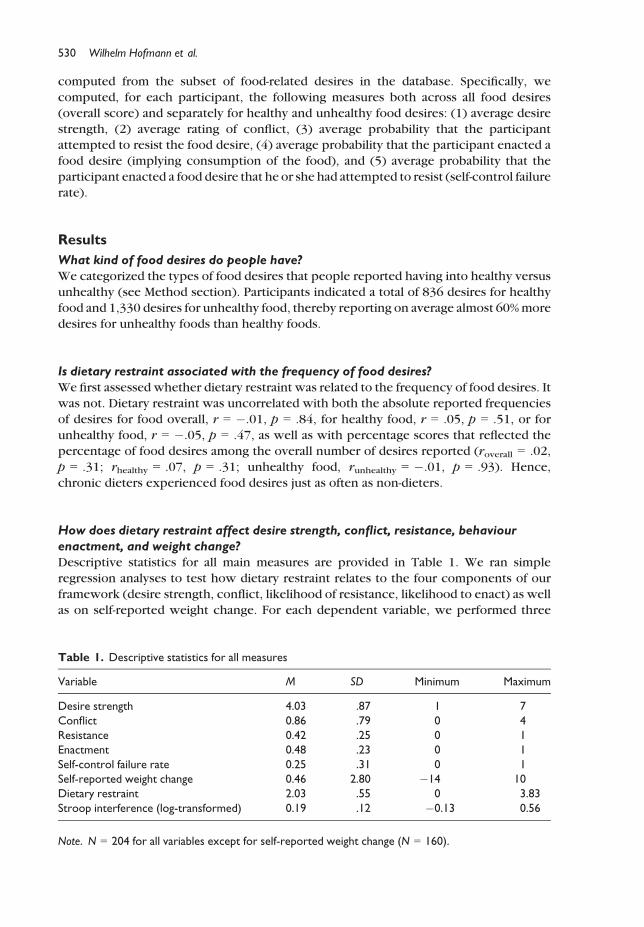
Descriptive statistics for all main measures are provided in Table 1. We ran simple
regression analyses to test how dietary restraint relates to the four components of our
framework (desire strength, conflict, likelihood of resistance, likelihood to enact) as well
as on self-reported weight change. For each dependent variable, we performed three
Table 1. Descriptive statistics for all measures
Variable M SD Minimum Maximum
Desire strength 4.03 .87 1 7
Conflict 0.86 .79 0 4
Resistance 0.42 .25 0 1
Enactment 0.48 .23 0 1
Self-control failure rate 0.25 .31 0 1
Self-reported weight change 0.46 2.80 �14 10
Dietary restraint 2.03 .55 0 3.83
Stroop interference (log-transformed) 0.19 .12 �0.13 0.56
Note. N = 204 for all variables except for self-reported weight change (N = 160).
530 Wilhelm Hofmann et al.

regression analyses: one overall model and two ancillary analyses that used healthy and
unhealthy food desires as dependent variables separately. We estimated predicted values
based on regression equations for people 1 SD above and below the dietary restraint score
mean (Table 2). Controlling for gender in additional supplementary analyses didnot affectany of the statistical conclusions drawn.
Strength of food desires was not reliably related to dietary restraint scores in any of the
three analyses, indicating that dieters did not experience stronger food desires than non-
dieters. (An analysis showed that this null finding was unqualified by whether the desire
was enacted.) Regarding feelings of conflict, dietary restraint was positively related to
conflict for the overall analysis, such that people high (+1 SD) in dietary restraint
experienced higher levels of conflict than those low (�1 SD) in dietary restraint. This
effect was driven entirely by the association between dietary restraint and conflicttowards unhealthy food.
Moreover, people high indietary restraint reported using self-controlmore often (48%)
than those low in restraint (35%) to resist their desires for food. This effect was most
pronounced for unhealthy foods but the pattern remained for healthy foods as well. Self-
control failure rates (enactment given resistance) also differed (marginally) as a function of
dietary restraint, such that people high in dietary restraint had a higher self-control failure
rate overall and in particular with regard to unhealthy foods (Table 2). Finally, in linewith
the notion that dietary restraint does not discriminate between successful andunsuccessful dieters, dietary restraint scores did not predict self-reported weight change
over time, b = �.07, p = .405.
The moderating role of inhibitory control
To investigate whether the relation between dietary restraint and the four components of
everyday self-regulation hinges on people’s inhibitory control capacity, we conducted
separate moderated regression analyses for each of these dependent variables. For eachanalysis, we entered dietary restraint and inhibitory control as mean-centred predictor
variables and the product from these mean-centred predictors to estimate the interaction
Table 2. Desire strength, conflict, resistance, and enactment as a function of dietary restraint
Desire
strength p Conflict p Resistance p Enactment p
Self-control
failure rate p
Foods overall
DR b coefficient �0.09 .191 0.40 <.001 .27 <.001 .07 .343 .13 .075
Low (�1 SD) DR 4.11 0.55 .35 .46 .21
High (+1 SD) DR 3.95 1.17 .48 .50 .29
Healthy foods
DR b coefficient �0.03 .720 0.06 .426 .15 .047 .01 .881 .10 .262
Low (�1 SD) DR 4.03 0.54 .31 .50 .16
High (+1 SD) DR 3.97 0.63 .41 .51 .23
Unhealthy foods
DR b coefficient �0.09 .225 0.43 <.001 .27 <.001 .04 .272 .13 .090
Low (�1 SD) DR 4.16 0.59 .36 .46 .23
High (+1 SD) DR 3.98 1.40 .51 .51 .32
Note. DR, dietary restraint (treated as continuous variable).
Dieting and self-control 531

term (Aiken & West, 1991) using the macro by Hofmann (2010). The predicted simple
slopes for those high (+1 SD), average (sample mean), and low (�1 SD) on inhibitory
control are displayed in Figure 1 (a–d) across the range of the dietary restraint scale. A
preliminary correlational analysis showed that the two predictors, dietary restraint and
inhibitory control, were fully independent from each other, r = .04, p = .610.
Did inhibitory control ability change the experience of desire strength or conflict for
people who vary in dietary restraint tendencies? No. Inhibitory control scores did not
moderate the (non-significant) relationship between dietary restraint and desire strength,b = �.02, p = .776, nor the positive relationship between dietary restraint and conflict,
b = .03, p = .654 (Figure 1a,b). However, whether restrained eaters were high rather
than low in inhibitory control had a significant impact on the likelihood of resisting food
desires, b = �.15, p = .034 (see Figure 1c). Simple slope tests revealed that the
regression slope of dietary restraint on resistance was significantly positive for those
high (+1 SD) in inhibitory control, b = .42, p < .001, but it was not different from zero for
those low in inhibitory control, b = .13, p = .154. A second simple slope test (conducted
at 1 SD above the dietary restraint mean) indicated that those high in inhibitory controlattempted to resist food desires more often than those low in inhibitory control, b = .32,
p = .004 (the difference was not significant at 1 SD below the mean, b = .03, p = .749).
3.0
3.5
4.0
4.5
5.0
1 2 3 4
Des
ire S
tren
gth
Dietary Restraint
(a)
0.0
0.5
1.0
1.5
2.0
2.5
1.0 2.0 3.0 4.0
Con
flict
Dietary Restraint
(b)
0.0
0.2
0.4
0.6
0.8
1.0
1.0 2.0 3.0 4.0
Prob
abili
ty o
f Res
ista
nce
Dietary Restraint
(c)
0.0
0.2
0.4
0.6
0.8
1.0
1.0 2.0 3.0 4.0
Prob
abili
ty o
f Ena
ctm
ent
Dietary Restraint
(d)
Low Inhibitory Control (–1 SD)
High Inhibitory Control (+1 SD)Average Inhibitory Control
Figure 1. Effects of dietary restraint and inhibitory control on the first four components of the
conceptual framework, desire strength (a), conflict (b), resistance (c), and behaviour enactment (d).
532 Wilhelm Hofmann et al.
Ancillary analyses revealed that the interaction was driven by attempts to resist healthy
food, b = �.12, p = .093, rather than unhealthy food, b = �.08, p = .251.
Inhibitory control also moderated the relationship between dietary restraint and the
overall likelihood with which food desires were enacted (irrespective of resistance),b = .14, p = .05: Restrained eaters low in inhibitory control were considerably more
likely to enact food desires than those high in inhibitory control (see Figure 1d), as
confirmed by a simple slope test, b = .24, p = .035 (the simple slope for those below
average in dietary restraint was not significant, b = �.04, p = .650). Ancillary analyses
confirmed that the interaction effect was driven by unhealthy foods, b = .21, p = .004,
rather than healthy foods, b = �.04, p = .589.
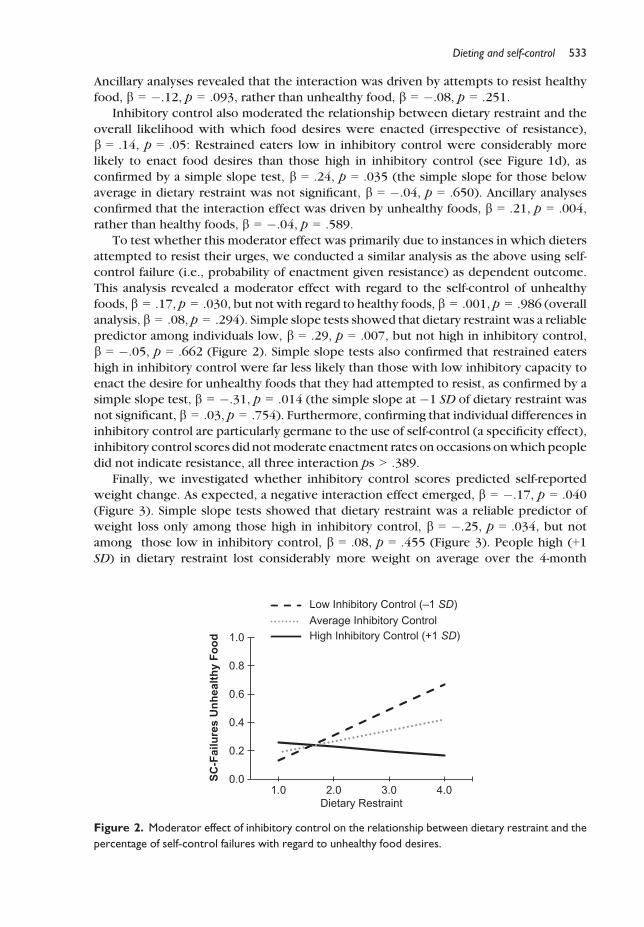
To test whether this moderator effect was primarily due to instances in which dieters
attempted to resist their urges, we conducted a similar analysis as the above using self-control failure (i.e., probability of enactment given resistance) as dependent outcome.
This analysis revealed a moderator effect with regard to the self-control of unhealthy
foods, b = .17, p = .030, but not with regard to healthy foods, b = .001, p = .986 (overall
analysis, b = .08, p = .294). Simple slope tests showed that dietary restraint was a reliable
predictor among individuals low, b = .29, p = .007, but not high in inhibitory control,
b = �.05, p = .662 (Figure 2). Simple slope tests also confirmed that restrained eaters
high in inhibitory control were far less likely than those with low inhibitory capacity to
enact the desire for unhealthy foods that they had attempted to resist, as confirmed by asimple slope test, b = �.31, p = .014 (the simple slope at �1 SD of dietary restraint was
not significant, b = .03, p = .754). Furthermore, confirming that individual differences in
inhibitory control are particularly germane to the use of self-control (a specificity effect),
inhibitory control scores did notmoderate enactment rates on occasions onwhich people
did not indicate resistance, all three interaction ps > .389.
Finally, we investigated whether inhibitory control scores predicted self-reported
weight change. As expected, a negative interaction effect emerged, b = �.17, p = .040
(Figure 3). Simple slope tests showed that dietary restraint was a reliable predictor ofweight loss only among those high in inhibitory control, b = �.25, p = .034, but not
among those low in inhibitory control, b = .08, p = .455 (Figure 3). People high (+1SD) in dietary restraint lost considerably more weight on average over the 4-month
0.0
0.2
0.4
0.6
0.8
1.0
1.0 2.0 3.0 4.0
SC-F
ailu
res
Unh
ealth
y Fo
od
Dietary Restraint
Low Inhibitory Control (–1 SD)
High Inhibitory Control (+1 SD)Average Inhibitory Control
Figure 2. Moderator effect of inhibitory control on the relationship between dietary restraint and the
percentage of self-control failures with regard to unhealthy food desires.
Dieting and self-control 533
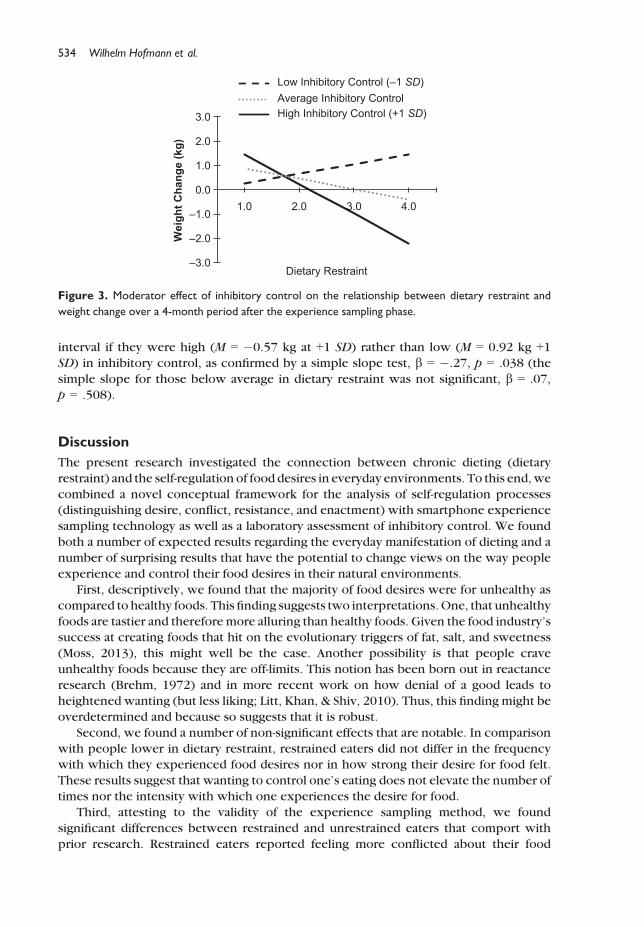
interval if they were high (M = �0.57 kg at +1 SD) rather than low (M = 0.92 kg +1SD) in inhibitory control, as confirmed by a simple slope test, b = �.27, p = .038 (the
simple slope for those below average in dietary restraint was not significant, b = .07,
p = .508).
Discussion
The present research investigated the connection between chronic dieting (dietary
restraint) and the self-regulation of food desires in everyday environments. To this end,we
combined a novel conceptual framework for the analysis of self-regulation processes(distinguishing desire, conflict, resistance, and enactment) with smartphone experience
sampling technology as well as a laboratory assessment of inhibitory control. We found
both a number of expected results regarding the everyday manifestation of dieting and a
number of surprising results that have the potential to change views on the way people
experience and control their food desires in their natural environments.
First, descriptively, we found that the majority of food desires were for unhealthy as
compared to healthy foods. This finding suggests two interpretations.One, that unhealthy
foods are tastier and therefore more alluring than healthy foods. Given the food industry’ssuccess at creating foods that hit on the evolutionary triggers of fat, salt, and sweetness
(Moss, 2013), this might well be the case. Another possibility is that people crave
unhealthy foods because they are off-limits. This notion has been born out in reactance
research (Brehm, 1972) and in more recent work on how denial of a good leads to
heightened wanting (but less liking; Litt, Khan, & Shiv, 2010). Thus, this finding might be
overdetermined and because so suggests that it is robust.
Second, we found a number of non-significant effects that are notable. In comparison
with people lower in dietary restraint, restrained eaters did not differ in the frequencywith which they experienced food desires nor in how strong their desire for food felt.
These results suggest that wanting to control one’s eating does not elevate the number of
times nor the intensity with which one experiences the desire for food.
Third, attesting to the validity of the experience sampling method, we found
significant differences between restrained and unrestrained eaters that comport with
prior research. Restrained eaters reported feeling more conflicted about their food
–3.0
–2.0
–1.0
0.0
1.0
2.0
3.0
1.0 2.0 3.0 4.0
Wei
ght C
hang
e (k
g)
Dietary Restraint
Low Inhibitory Control (–1 SD)
High Inhibitory Control (+1 SD)Average Inhibitory Control
Figure 3. Moderator effect of inhibitory control on the relationship between dietary restraint and
weight change over a 4-month period after the experience sampling phase.
534 Wilhelm Hofmann et al.

desires, especially with regard to unhealthy food and a greater use of self-control to resist
both healthy and unhealthy food desires. As forwhether theyweremore or less successful
than the unrestrained eaters at resisting the urge to give into a food desire, practice does
not help in this domain as restrained eaters, on average, showed a trend for more self-control failure with regard to unhealthy foods.
Last, and most notably, our findings point to the importance of behavioural
inhibition as a key variable that distinguishes successful from unsuccessful dieters.
Specifically, dieters who possessed high rather than low inhibitory control abilities as
measured with a Stroop task were (1) more likely to attempt to resist food desires and
(2) when they did so, more successful at inhibiting those (unwanted) desires. A 4-month
follow-up measurement demonstrated tangible outcomes associated with inhibitory
control skills in finding that only dieters high in inhibitory control reported weight lossover 4 months.
Perhaps surprisingly, the effect of individual differences in inhibitory control with
regard to the resistance component was strongest for healthy foods. This finding might
suggest that dieters low in response inhibitionmay not recruit enoughmotivation to resist
healthy food desires – those food desires identified in recent research as being particularlyprone to biases in motivated reasoning (Chernev, 2011).
Despite higher average attempts to resist food desires, restrained eaters did not act on
their desires regarding food any more than did unrestrained eaters, consistent withprevious findings (Stice et al., 2004, 2007). Once more, this pattern was strongly
qualified, however, by individual differences in inhibitory control: Dieters low in
inhibitory control had the worst self-control failure rates (i.e., they indulged a food desire
even though they tried not to), especially when they were confronted with unhealthy
food desires.
Limitations and future directionsWe found that dieters with high inhibitory control did not differ in their average desire
strength from those identified as less successful. This pattern suggests that chronically
stronger food desires may not be the primary reason why restrained eaters often fail to
restrict their food intake as planned. However, this finding may be a function of the
specific restraint scale used, so replication involving alternative measures is warranted
(Laessle, Tuschl, Kotthaus, & Pirke, 1989). Moreover, it is possible that the processes by
which hedonic reward value translates into eating behaviour may not always bemediated
by conscious subjective experience (Winkielman, Berridge, & Wilbarger, 2005) andhence may not have been fully captured by our self-report measures in this study. Future
field research in this direction should therefore attempt to include indirect indicators (i.e.,
implicit, physiological) of desire as well.
We noted that restrained eaters who had low inhibitory control were less motivated to
resist healthy foods in particular. It could be that dieters low in inhibitory control may
allocate their limited inhibitory capacity towards attempting to resist unhealthy food
desireswhile keeping their defences downwith regard to healthy foods. The fact that they
failed to loseweight may be partially due to the fact that the latter food group nonethelesscontains unaccounted for calories. Future research on this fascinating notion would be
welcome.
Given that only dieters with strong inhibitory control reported weight loss, it seems
that one cannot predict whether a dieter is likely to be successful at achieving weight loss
unless one also knows how well the person can inhibit pre-potent impulses. This finding
Dieting and self-control 535

complements recent research on the role of inhibition in buffering the effects of implicit
snack food preferences on long-term weight gain (Nederkoorn et al., 2010). Bringing
these two lines of work together, we would expect future research to find a two-way
interaction among dietary restraint, inhibitory control, and implicit food preferences suchthat the role of inhibitory control may become most decisive in determining dietary
success when individuals are both high in their commitment to a dieting goal and
frequently tempted by strong (automatic) hedonic responses towards unhealthy foods.
Conclusion
To understand the complex process of dieting, it is not only important to probe how
dieters react to tempting food cues in controlled laboratory settings but also to gather fine-grained information about how dieters and non-dieters experience and regulate food
desires in their everyday environments. Implementing a four-component model of self-
control, we found that chronic dieters do not report to experiencemore frequent ormore
intense food desires on average than non-dieters, feel much more conflicted about their
food desires, resist their food desires more often than non-dieters, and show a trend for
more self-control failureswith regard to unhealthy foods.Most important,whether dieters
were successful at resisting problematic desires and whether they actually lost weight
over time depended strongly on their inhibitory control capacity, in line with recentinsights into the intricate connection between executive functions and self-regulation
(Hofmann, Schmeichel, & Baddeley, 2012). Taken together, the current study demon-
strates that the psychology’s understanding of eating behaviourmay be advanced through
the integration of conceptual theoretical frameworks and ecologically valid assessment
tools that go beyond one-time assessments of attitudes, intentions, or behaviour in the
field. As new smartphone technology evolves, allowing health scientists to follow
participants deeper and deeper into the ‘trenches’ of their everyday regulatory struggles
and successes (Berkman, Falk, & Lieberman, 2011; Miller, 2012), the field of healthpsychology may arrive at a more complete picture of why it is so hard for some people to
stay on top of their health goals and to devise more customized interventions to change
that state of affairs.
Acknowledgements
We thank Silke Hauck, Lydia-Katharina Jakob, Linda €Ohrlein, Alice Ranger, Isabel Richter,
Charlotte Schwab, Judith St€utzer, Katharina Vahrenhorst, and UweWaldmann for their help in
data collection, JoachimKr€uger andMartinaWalter for providing uswith technical equipment,
and Hagen Schwaß and Florian Schmitz for technical support. This research was supported by
grants HO 4175/3-1 and HO 4175/4-1 from the German Science Foundation to Wilhelm
Hofmann, by NIH grant 1RL1AA017541 to Roy Baumeister, and by McKnight Land-Grant and
Presidential funds to Kathleen Vohs.
References
Aiken, L. S., &West, S. G. (Eds.) (1991).Multiple regression: Testing and interpreting interactions.
Newbury Park, CA: Sage.
Allan, J. L., Johnston, M., & Campbell, N. (2010). Unintentional eating. What determines goal-
incongruent chocolate consumption? Appetite, 54, 422–425. doi:10.1016/j.appet.2010.01.009
536 Wilhelm Hofmann et al.

Berkman, E. T., Falk, E. B., & Lieberman, M. D. (2011). In the trenches of real-world self-control:
Neural correlates of breaking the link between craving and smoking. Psychological Science, 22,
498–506. doi:10.1177/0956797611400918Brehm, J. W. (1972). Responses to loss of freedom: A theory of psychological reactance.
Morristown, NJ: General Learning Press.
Carver, C. S., & Scheier, M. F. (1981). Attention and self-regulation: A control-theory approach to
human behavior. New York, NY: Springer. doi:10.1007/978-1-4612-5887-2
Chernev, A. (2011). The dieter’s paradox. Journal of Consumer Psychology, 21, 178–183. doi:10.1016/j.jcps.2010.08.002
Csikszentmihalyi, M., & Larsen, R. E. (1987). Validity and reliability of the experience-sampling
method. The Journal of Nervous and Mental Disease, 175, 529–536. doi:10.1097/00005053-198709000-00004
Fedoroff, I. C., Polivy, J., & Herman, C. P. (1997). The effect of pre-exposure to food cues on the
eating behavior of restrained and unrestrained eaters. Appetite, 28, 33–47. doi:10.1006/appe.1996.0057
French, S. A., Jeffery, R. W., & Murray, D. (1999). Is dieting good for you?: Prevalence, duration and
associatedweight and behaviour changes for specificweight loss strategies over four years in US
adults. International Journal of Obesity, 23, 320–327. doi:10.1038/sj.ijo.0800822French, S. A., Story, M., & Jeffery, R. W. (2001). Environmental influences on eating and physical
activity. Annual Review of Public Health, 22, 309–335. doi:10.1146/annurev.publhealth.22.1.309
Friedman, N. P., & Miyake, A. (2004). The relations among inhibition and interference control
functions: A latent-variable analysis. Journal of Experimental Psychology. General, 133, 101–135. doi:10.1037/0096-3445.133.1.101
Gorman, B. S., & Allison, D. B. (1995). Measures of restrained eating. In D. B. Allison (Ed.),
Handbook of assessment for eating behaviors and weight-related problems (pp. 149–184).Thousand Oaks, CA: Sage.
Guerrieri, R., Nederkoorn, C., & Jansen, A. (2007). How impulsiveness and variety influence food
intake in a sample of healthy women. Appetite, 48, 119–122. doi:10.1016/j.appet.
2006.06.004
Hektner, J. M., Schmidt, J. A., & Csikszentmihalyi, M. (2006). Experience sampling method:
Measuring the quality of everyday life. Thousand Oaks, CA: Sage.
Herman, C. P., & Mack, D. (1975). Restrained and unrestrained eating. Journal of Personality, 43,
647–660. doi:10.1111/j.1467-6494.1975.tb00727.xHerman, C. P., & Polivy, J. (1980). Restrained eating. In A. J. Stunkard (Ed.),Obesity (pp. 208–225).
Philadelphia, PA: Saunders.
Herman, C. P., & Polivy, J. (2004). The self-regulation of eating. In R. F. Baumeister & K. D. Vohs
(Eds.), The handbook of self-regulation: Research, theory, and applications (pp. 492–508).New York, NY: Guilford.
Hill, J. O., & Peters, J. C. (1998). Environmental contributions to the obesity epidemic. Science, 280,
1371–1374. doi:10.1126/science.280.5368.1371Hofmann, W. (2010). Extension of MODPROBE Macro by Andrew Hayes (2009) [Computer
Software] (Version 2.5.). W€urzburg, Germany.
Hofmann, W., Baumeister, R. F., F€orster, G., & Vohs, K. D. (2012). Everyday temptations: An
experience sampling study on desire, conflict, and self-control. Journal of Personality and
Social Psychology, 102, 1318–1335. doi:10.1037/a0026545Hofmann,W., & Friese,M. (2008). Impulses got the better ofme: Alcoholmoderates the influence of
implicit attitudes toward food cues on eating behavior. Journal of Abnormal Psychology, 117,
420–427. doi:10.1037/0021-843X.117.2.420Hofmann, W., Friese, M., & Strack, F. (2009). Impulse and self-control from a dual-systems
perspective. Perspectives on Psychological Science, 4, 162–176. doi:10.1111/j.1745-6924.2009.01116.x
Dieting and self-control 537
Hofmann, W., Friese, M., & Wiers, R. W. (2008). Impulsive versus reflective influences on health
behavior: A theoretical framework and empirical review. Health Psychology Review, 2, 111–137. doi:10.1080/17437190802617668
Hofmann, W., Koningsbruggen, G. M., Stroebe, W., Ramanathan, S., & Aarts, H. (2010). As pleasure
unfolds: Hedonic responses to tempting food. Psychological Science, 21, 1863–1870. doi:10.1177/0956797610389186
Hofmann, W., Rauch, W., & Gawronski, B. (2007). And deplete us not into temptation: Automatic
attitudes, dietary restraint, and self-regulatory resources as determinants of eating behavior.
Journal of Experimental Social Psychology, 43, 497–504. doi:10.1016/j.jesp.2006.05.004Hofmann, W., Schmeichel, B. J., & Baddeley, A. D. (2012). Executive functions and self-regulation.
Trends in Cognitive Sciences, 3, 174–180. doi:10.1016/j.tics.2012.01.006Houben, K., & Jansen, A. (2011). Training inhibitory control. A recipe for resisting sweet
temptations. Appetite, 56, 345–349. doi:10.1016/j.appet.2010.12.017Johnson, C., & Larson, R. (1982). Bulimia: An analysis of moods and behavior. Psychosomatic
Medicine, 44, 341–351.Kubiak, T., Vogele, C., Siering, M., Schiel, R., &Weber, H. (2008). Daily hassles and emotional eating
in obese adolescents under restricted dietary conditions – The role of ruminative thinking.
Appetite, 51, 206–209. doi:10.1016/j.appet.2008.01.008Laessle, R. G., Tuschl, R. J., Kotthaus, B. C., & Pirke, K. M. (1989). A comparison of the validity of 3
scales for the assessment of dietary restraint. Journal of Abnormal Psychology, 98, 504–507.doi:10.1037/0021-843X.98.4.504
Litt, A., Khan, U., & Shiv, B. (2010). Lusting while loathing: Parallel counterdriving of wanting and
liking. Psychological Science, 21, 118–125. doi:10.1177/0956797609355633Lowe, M. R., & Butryn, M. L. (2007). Hedonic hunger: A new dimension of appetite? Physiology &
Behavior, 91, 432–439. doi:10.1016/j.physbeh.2007.04.006Macht, M., & Simons, G. (2000). Emotions and eating in everyday life. Appetite, 35, 65–71. doi:10.
1006/appe.2000.0325
Mann, T., Tomiyama, A. J., Westling, E., Lew, A. M., Samuels, B., & Chatman, J. (2007). Medicare’s
search for effective obesity treatments: Diets are not the answer. American Psychologist, 62,
220–233. doi:10.1037/0003-066X.62.3.220Miller, G. (2012). The Smartphone PsychologyManifesto. Perspectives on Psychological Science, 7,
221–237. doi:10.1177/1745691612441215Miyake, A., Friedman, N. P., Emerson, M. J., Witzki, A. H., & Howerter, A. (2000). The unity and
diversity of executive functions and their contributions to complex “frontal lobe” tasks: A latent
variable analysis. Cognitive Psychology, 41, 49–100. doi:10.1006/cogp.1999.0734Moss, M. (2013). Salt sugar fat: How the food giants hooked us. New York: Random House.
Myrseth, K. O. R., & Fishbach, A. (2009). Self-control: A function of knowing when and how to
exercise restraint. Current Directions in Psychological Science, 18, 247–252. doi:10.1111/j.1467-8721.2009.01645.x
Nederkoorn, C., Houben,K.,Hofmann,W., Roefs, A.,& Jansen, A. (2010). Control yourself or just eat
what you like?Weight gain over a year is predicted by an interactive effect of response inhibition
and a preference for high fat foods. Health Psychology, 29, 389–393. doi:10.1037/a0019921Nederkoorn, C., Van Eijs, Y., & Jansen, A. (2004). Restrained eaters act on impulse. Personality and
Individual Differences, 37, 1651–1658. doi:10.1016/j.paid.2004.02.020Papies, E., Stroebe, W., & Aarts, H. (2007). Pleasure in the mind: Restrained eating and spontaneous
hedonic thoughts about food. Journal of Experimental Social Psychology, 43, 810–817. doi:10.1016/j.jesp.2006.08.001
Papies, E. K., Stroebe,W., & Aarts, H. (2009).Who likes it more? Restrained eaters’ implicit attitudes
towards food. Appetite, 53, 279–287. doi:10.1016/j.appet.2009.07.001Rawn, C. D., & Vohs, K. D. (2011). People use self-control to risk personal harm: An intra-
interpersonal dilemma. Personality and Social Psychology Review, 15, 267–289. doi:10.1177/1088868310381084
538 Wilhelm Hofmann et al.

Richards, M. H., Casper, R. C., & Larson, R. (1990). Weight and eating concerns among
preadolescent and young adolescent boys and girls. Journal of Adolescent Health, 11, 203–209. doi:10.1016/0197-0070(90)90349-7
Schachter, S., Goldman, R., & Gordon, A. (1968). Effects of fear food deprivation and obesity on
eating. Journal of Personality and Social Psychology, 10, 91–96. doi:10.1037/h0026284Steiger, H., Lehoux, P. M., & Gauvin, L. (1999). Impulsivity, dietary control and the urge to binge in
bulimic syndromes. International Journal of Eating Disorders, 26, 261–274. doi:10.1002/(SICI)1098-108X(199911)26:3<261::AID-EAT3>3.0.CO;2-Y
Stein, D. M. (1988). The scaling of restraint and the prediction of eating. International Journal of
Eating Disorders, 7, 713–717. doi:10.1002/1098-108X(198809)7:5<713::AID-EAT2260070519>3.0.CO;2-K
Stice, E., Cooper, J. A., Schoeller, D. A., Tappe, K., & Lowe, M. R. (2007). Are dietary restraint scales
validmeasures of moderate- to long-term dietary restriction? Objective biological and behavioral
data suggest not. Psychological Assessment, 19, 449–458. doi:10.1037/1040-3590.19.4.449Stice, E., Fisher, M., & Lowe, M. R. (2004). Are dietary restraint scales validmeasures of acute dietary
restriction? Unobtrusive observational data suggest not. Psychological Assessment, 16, 51–59.doi:10.1037/1040-3590.16.1.51
Stroebe, W., Papies, E., & Aarts, H. (2008). From homeostatic to hedonic theories of eating: Self-
regulatory failure in food-rich environments. Applied Psychology, 57, 172–193. doi:10.1111/j.1464-0597.2008.00360.x
Stroop, C. D. (1935). Studies of interference in serial verbal reactions. Journal of Experimental
Psychology, 18, 643–662. doi:10.1037/h0054651Stroud, S., & Tappolet, C. (Eds.) (2003).Weakness of will and practical irrationality. Oxford, UK:
Oxford University Press. doi:10.1093/0199257361.001.0001
Swarr, A. E., & Richards, M. H. (1996). Longitudinal effects of adolescent girls’ pubertal
development, perceptions of pubertal timing, and parental relations on eating problems.
Developmental Psychology, 32, 636–646. doi:10.1037/0012-1649.32.4.636Tiggemann, M. (1994). Dietary restraint as a predictor of reported weight-loss and affect.
Psychological Reports, 75, 1679–1682. doi:10.2466/pr0.1994.75.3f.1679Tomarken, A. J., & Kirschenbaum, D. S. (1984). Effects of plans for future meals on
counterregulatory eating by restrained and unrestrained eaters. Journal of Abnormal
Psychology, 93, 458–472. doi:10.1037/0021-843X.93.4.458Tomiyama, A. J., Mann, T., & Comer, L. (2009). Triggers of eating in everyday life. Appetite, 52, 72–
82. doi:10.1016/j.appet.2008.08.002
Vansteelandt, K., Pieters, G., Vandereycken, W., Claes, L., Probst, M., & Van Mechelen, I. (2004).
Hyperactivity in anorexia nervosa: A case study using experience samplingmethodology.Eating
Behaviors, 5, 67–74. doi:10.1016/S1471-0153(03)00062-XWard, A., &Mann, T. (2000). Don’t mind if I do: Disinhibited eating under cognitive load. Journal of
Personality and Social Psychology, 78, 753–763. doi:10.1037/0022-3514.78.4.753Wardle, J. (2007). Eating behaviour and obesity. Obesity Reviews, 8, 73–75. doi:10.1111/j.1467-
789X.2007.00322.x
Winkielman, P., Berridge, K. C., &Wilbarger, J. L. (2005). Unconscious affective reactions tomasked
happy versus angry faces influence consumption behavior and judgments of value. Personality
and Social Psychology Bulletin, 31, 121–135. doi:10.1177/0146167204271309
Received 22 December 2012; revised version received 29 April 2013
Dieting and self-control 539