differences in achilles tendon stiffness in people with
TRANSCRIPT

RESEARCH ARTICLE Open Access
Differences in Achilles tendon stiffness inpeople with gout: a pilot studySimon Otter1,2* , Catherine Payne3, Anna-Marie Jones4, Nick Webborn2 and Peter Watt2,3
Abstract
Background: Gout has been associated with weaker foot/leg muscles and altered gait patterns. There is alsoevidence of on-going foot pain and an increased risk of tendinopathy, with the Achilles and patella tendons mostfrequently affected in gout. Additionally, the inflammation associated with gout may change tissue elasticity.Ultrasound imaging utilising shear wave elastography (SWE) offers a non-invasive method of quantifying changes intendon stiffness. SWE findings have not previously been reported in individuals with gout. We sought to determinedifferences in Achilles tendon stiffness in people with gout compared to controls (non-gout).
Methods: A cross sectional study comparing 24 people with gout and 26 age/sex-matched controls. Clinical anddemographic data were collated, and US imaging used to determine tendon thickness, presence of gouty tophiand/or aggregates and levels of angiogenesis. Ten shear wave elastography (SWE) measures were taken along thecentre of a longitudinal section of the mid-portion of each Achilles tendon. Prior to data collection, intra-observererror was good (>0.69). Data were summarised using descriptive statistics and a repeated measures ANCOVA wasused to compare SWE measures between the two groups for the left and right foot separately after accounting forBody Mass Index (BMI).
Results: A small proportion of those with gout presented with intra-tendon aggregates and/or intra-tendon tophiin one or both tendons. There was no statistically significant difference in tendon thickness between groups. Neo-vascularity was present in a third of gout participants. SWE findings demonstrated significantly reduced tendonstiffness in those with gout compared to controls: right Achilles mdiff =1.04 m/s (95% CI (0.38 to 1.7) p = 0.003 andleft Achilles mdiff = 0.7 m/s (95% CI 0.09 to 1.32) p = 0.025. No relationship between the presence of tophi and SWEvalues were detected.
Conclusion: Subjects with chronic gout show significantly reduced Achilles tendon stiffness compared to non-goutcontrols. From a clinical standpoint, our findings were similar to SWE measurements in subjects with Achillestendinopathy and who did not have gout.
Keywords: Gout, Achilles tendon, Shear wave elastography
© The Author(s). 2020 Open Access This article is licensed under a Creative Commons Attribution 4.0 International License,which permits use, sharing, adaptation, distribution and reproduction in any medium or format, as long as you giveappropriate credit to the original author(s) and the source, provide a link to the Creative Commons licence, and indicate ifchanges were made. The images or other third party material in this article are included in the article's Creative Commonslicence, unless indicated otherwise in a credit line to the material. If material is not included in the article's Creative Commonslicence and your intended use is not permitted by statutory regulation or exceeds the permitted use, you will need to obtainpermission directly from the copyright holder. To view a copy of this licence, visit http://creativecommons.org/licenses/by/4.0/.The Creative Commons Public Domain Dedication waiver (http://creativecommons.org/publicdomain/zero/1.0/) applies to thedata made available in this article, unless otherwise stated in a credit line to the data.
* Correspondence: [email protected] of Health Sciences, University of Brighton, 49 Darley Rd, EastbourneBN20 7UR, UK2Centre for Regenerative Medicine and Devices, University of Brighton,Lewes Road, Brighton BN2 4AT, UKFull list of author information is available at the end of the article
Otter et al. BMC Musculoskeletal Disorders (2020) 21:658 https://doi.org/10.1186/s12891-020-03598-3

BackgroundGout occurs as a result of a metabolic inefficiency tofully metabolise purines and is considered to be the mostcommon inflammatory arthritis [1, 2]. The resultant pro-duction of highly insoluble monosodium urate crystalslocated in joints and tendons causes a range of symp-toms [1, 2]. Gout has an increasing prevalence both inthe UK and worldwide [1–4]. While estimates vary, upto 6.8% of some populations are affected [3]. Gout is as-sociated with acute attacks of severe joint pain andswelling, particularly affecting the foot [4]. Pain and im-pairment often do not entirely normalise after a goutflare-up has subsided [5], leading to general and foot-specific pain and disability, reduced ankle joint angularvelocity and resulting in altered walking patterns [6–8].Taken together, pain, time off work, limitations in ones’ability to move or undertake exercise and subsequentloss of participation in social activities all reduce qualityof life for those with gout [6, 9, 10].The Achilles tendon (AT) is a common location for
the deposit of monosodium urate crystals, forming sub-cutaneous palpable bodies known as tophi [11]. Thesestructures are located within the tendon and will affectthe structural arrangement of the tendon fibres impact-ing on the mechanical properties and function of the AT[12]. In gout, there are also measurable signs of inflam-mation in the AT (e.g. intra tendinous power Dopplersignals) [13]. Inflammatory markers are generally consid-ered to be a hallmark of rheumatic disorders such asgout. Inflammatory processes alter the tissue compos-ition, increasing water content, and can result in changesto tissue structure and tissue stiffness (or elasticity).While the AT is the strongest tendon in the body, it isfrequently injured, and the pathology of those injuries isheterogeneous [14, 15]. The mechanical properties oftendons are key to the transmission of muscle tension tothe skeleton, elastic energy storage and to limiting loadstress on muscles [16]. Consequently, measurement ofthe structural properties of the tendon is an importantpart of understanding the changes that may occur andaffect the background pathogenesis [17]. Clinicians com-monly use ultrasound imaging (US) to visualise tendonstructure in AT disorders, since the technique is minim-ally invasive, quick and often easily available for use [18].Shear wave elastography (SWE) is a non-invasive anddynamic method of quantifying changes in tendon elasti-city, involving application of a focused ultrasound pulseto the tissue being imaged [19–21]. SWE is a type of USelastography that uses shear waves generated by a re-mote radiation force of focused ultrasonic beams to as-sess tissue elasticity. It measures the velocity of shearwaves (in metres per second) moving through tissue,and displays these in a quantitative manner via a real-time elastogram, in which elasticity is portrayed as a
colour-coded representation over a B-mode image. InSWE images stiffer tissues are red, while softer tissuesare blue [22–24]. Importantly in ultrasonography, previ-ous work indicates SWE is more independent of userskill than other modes of US imaging [25]. A systematicreview of SWE as a diagnostic tool indicated good cor-relation with conventional ultrasound results, MRI andclinical examination [26]. More recently, SWE per se hasreceived attention with regard to conditions involvingtendons. Compared to other methods commonly used, ithas been shown to be a simple way to measure tendonstiffness and identify pathology with good precision andincreased diagnostic accuracy [27]. A review of imagingmodalities in gout has highlighted the value of ultra-sound for monitoring monosodium urate deposition anddamage associated with inflammation, but SWE was notreported upon [28]. We aimed to utilise SWE to identifydifferences in Achilles tendon stiffness in people withgout compared to controls (non-gout). We hypothesisedthat stiffness of the AT would be reduced by the inflam-matory processes and the consequences of monosodiumurate crystal deposits affecting the structure and func-tion of the AT.
MethodsParticipants and settingThe terminology used for gout used in the paper followsthe G-CAN consensus statements [29]. In this cross sec-tional, case-controlled study, participants with gout wererecruited from an out patient podiatry clinic in East Sus-sex. Ethical approval was granted by the University ofBrighton (17–009) and Office for Research Ethics Com-mittees Northern Ireland (ORECNI) (232339). The in-clusion criteria (Table 1) were those diagnosed withgout (aged 25–80) by their GP with no self-reportedAchilles tendinosis. Most patients with gout are man-aged in the primary care setting and the diagnosis forgout is usually clinical with identification of monoso-dium urate crystals and/or serum urate measurementsnot generally undertaken [3]. Consequently, the clinicalpresentation of gout was checked according to the 2015ACR/EULAR classification criteria [30], ensuring theclinical presentation met the clinical criteria. Non-goutparticipants were simultaneously recruited from thesame patient population, typically with the same co-morbidities as those with gout, and met the same exclu-sion criteria. Inclusion/exclusion criteria for both groupsare detailed in Table 1.A clinician identified potential participants over an 18-
month period (July 2018–December 2019) during theirnormal podiatry appointment, based on presenting com-plaint and/or medical history. If agreeable, potential par-ticipants were provided with an information pack andcontacted after 48 h by the chief investigator (SO) to
Otter et al. BMC Musculoskeletal Disorders (2020) 21:658 Page 2 of 9

answer questions and arrange an appointment if theywished to opt in to the study. Data were collected duringa single session outside of participants’ normal appoint-ment time. Informed, written consent was obtained priorto data collection. We sought to recruit 25 people ineach group. As SWE has not been carried out in thosewith gout previously, a formal power calculation was notpossible. However, research focusing on ultrasound im-aging of the AT alone in those with gout used a similarnumber of participants and found significant differencesbetween populations [13].
Data collectionBaseline demographic details were captured together withcomorbidities and key potential confounding factors in-cluding BMI and self-reported levels of exercise using thevalidated relative physical activity question [31].
Ultrasound scanning techniquesAll measurements were taken with a Siemens ACUSONS2000™ Helix Evolution Ultrasound system (SiemensMedical Solutions, Malvern, PA, USA) ultrasound im-aging system, utilising a pre-programmed AT setting.The AT is a favoured site for assessment as it meets theparameters required for SWE, while avoiding commonvariables that lead to limitations with US imaging [32].The AT was selected as it offers:
� Close proximity target tissue (AT) to the transducer(within 3 cm)
� Largely homogeneous tissue� No structures present to dampen shear stress
measurement (e.g. large vessels)� Distance between tissue boundaries� Ease of identifying anatomical location
Previously compression elastography ultrasound mea-surements have been limited by poor reproducibility
[33]. Therefore a standardised protocol for SWE ultra-sound assessment was adopted, based on validated stud-ies where Inter-observer reliability varied betweenκ0.87–1 [13] and ICC between operators was 0.80 [34].
Conventional ultrasound techniqueAll US images were captured by an experienced operator(SO) with 7 years ultrasound imaging experience. A 40mm14 L5 linear probe was used to visualise the AT length fromthe insertion of the AT over the calcaneus to the lowest fi-bres of the gastrocnemius. Scanning for pathological fea-tures of gout were undertaken in transverse andlongitudinal axis. All SWE measures were taken in a longi-tudinal axis between 40mm and 80mm proximal to the in-sertion of the AT, capturing the mid-portion of the tendonwhere tendon pathology is most frequently encountered[35, 36]. For SWE measures a 40mm 9LT linear probe wasutilised. To maintain standardisation, the following uniformUS settings to optimise imaging were used:
� Greyscale US settings 15MHz probe, 15 dB, DR60� Elastography US settings 9Mhz probe, 6 dB, DR65
(where: MHz = probe frequency, dB = decibels, DR =dynamic range (gain))Throughout, participants were invited to lie prone with
their feet relaxed freely overhanging an examinationcouch in line with previous validated protocols [34].
Intra-observer reliability US image interpretationTo assess intra-observer agreement of US characteristics,reliability was determined using (ICC (2)) with measurescaptured from three control subjects using 10 images ontwo separate occasions. The anonymous images were usedto calculate reliability. Greyscale US measurements (tendonthickness) varied between 3.25–3.63mm and SWE mea-sures 9.27–10. Intra-observer error (ICC (2)) values wereconsistently between 0.69 and 0.707. Intra-observer error
Table 1 Inclusion/Exclusion criteria
Gout participants Non-gout (control) participants
Inclusion criteria Inclusion criteria
Current diagnosis goutNo Current or recent (last 6 months) Achilles tendonosis
No diagnosis of goutNo Current or recent (last 6 months) Achilles tendonosis
Exclusion criteria Exclusion criteria
Current acute gout flarePrevious Achilles tendon ruptureSelf-reported current or recent (last 6 months) Achilles tendinosisSurgery to the Achilles tendonConcomitant inflammatory arthritis e.g. rheumatoid arthritisConcomitant neuromuscular diseaseSignificant foot deformity (e.g. Charcot foot)Participants taking fluoroquinolone antibioticsThose unable to lie on an examination couchActive foot ulceration
Previous Achilles tendon ruptureSelf-reported current or recent (last 6 months) Achilles tendinosisSurgery to the Achilles tendonConcomitant inflammatory arthritis e.g. rheumatoid arthritisConcomitant neuromuscular diseaseSignificant foot deformity (e.g. Charcot foot)Participants taking fluoroquinolone antibioticsThose unable to lie on an examination couchActive foot ulceration
Otter et al. BMC Musculoskeletal Disorders (2020) 21:658 Page 3 of 9

values of 0 to 0.2 are considered poor, 0.2 to 0.4 fair, 0.4 to0.6 moderate, 0.6 to 0.8 good and 0.8 to 1.0 excellent [37].We determined the mean of three measurements couldused to determine tendon thickness without loss of reliabil-ity. Previously validated protocols [13] demonstrated almostperfect inter-rater reliability for those pathologies unique togout (e.g. tophi) together with good intra-observer reliabil-ity. Therefore, subsequent US images and SWE measureswere assessed by a single operator (SO) in real time.
Tendon structure & damageAT thickness was measured at the thickest part of themid-portion in a longitudinal axis. A partial tendon tearwas defined as a focal discontinuity [38], whilst acomplete tendon rupture was defined as a complete lossof tendon substance [39]. Tendon grading was based ona semi-quantitative system proposed by Archambaultet al. [40] detailed in Table 2 and recorded bilaterally.
Features of urate depositionDeposits of monosodium urate (MSU) or ‘tophi’; are fre-quently seen in gout and strongly reflect US waves. As aconsequence, the presence of tophi can easily be con-firmed [41]. US characteristics for tophi and aggregateswere pre-determined in accordance with standardizeddefinitions; the Outcome Measures in Rheumatology(OMERACT) group [42]. Tophus are circumscribed, in-homogeneous, hyperechoic accumulations, whereas ‘ag-gregates’ are heterogeneous and hyperechoic foci of uricacid deposits that maintain a high degree of reflectivity.
The number of gouty tophi and/or aggregates in the ATwas recorded bilaterally.
Features of inflammationTendon vascularity was assessed over the length of thetendon and defined as the presence of the power Dop-pler signal. A semi-quantitative scale (0–4) previously re-ported by Ohberg et al. [43] was used to quantify thelevel of neo angiogenesis present bilaterally.
Shear wave elastography (SWE)Following conventional ultrasound, the system wasplaced in the virtual touch IQ (VTIQ) mode. Ten real-time SWE measures between 0.5–10m/s were takenalong the centre of a longitudinal section of the mid-portion of the AT bilaterally (Fig. 1). If SWE readings >10m/s are present the machine reads ‘HIGH’ and thehighest value of 10 m/s was recorded.
Data analysisData were entered into SPSS and checked for accuracy,adherence to normal distribution and assumptions forinferential analysis (Fig. 2) [44]. Baseline clinical anddemographic characteristics were summarised using de-scriptive statistics: count (n), mean, standard deviation(sd), range and percentages (%). Between-group (gout vsnon-gout) comparisons were made for each characteris-tic, using Chi square and Student’s t-tests for categoricaland continuous variables respectively. Given the within-subjects repeated-measures design used, an ANCOVAwas used to compare SWE measures between the twogroups for the left and right AT separately, while adjust-ing for covariates (Body Mass Index (BMI)). BivariatePearson correlation was used to determine any relation-ship between the number of tophi and SWE values. Stat-istical tests were significant for p < 0.05. SPSS v25 (IBMSPSS Statistics Version 25.0. Armonk, NY: IBM Corp.)used for all analyses.
Table 2 Tendon grading definitions
Grade Definition
1 normal-appearing tendon with homogeneousfibrillar echotexture
2 a focal fusiform swelling and/or diffuse enlarged tendon
3 a hypoechoic area within the tendon with/or withouttendon enlargement
Fig. 1 Illustration of SWE measures being undertaken
Otter et al. BMC Musculoskeletal Disorders (2020) 21:658 Page 4 of 9

ResultsIn total, 40 people with gout were recruited with 24 sub-sequently participating (60%). Of those not taking part, 8declined and 5 subsequently excluded, two were subse-quently not contactable and one did not attend their ap-pointment. A population of 26 age/sex matched non-gout subjects were simultaneously recruited from thesame clinical population.
Demographic and clinical dataBaseline demographic and clinical data are displayed inTable 3. Only 3 (13%) participants had experienced agout attack within the last 3 months and 4 (17%) partici-pants had clinically palpable gouty tophi over the foot/ankle region. Palpable subcutaneous tophi were locatedaround the Achilles tendon for 3 subjects and on lesserdigits for 1 subject. Chi square and Student’s t-testsshowed that those with gout had significantly higherBMI (mdiff = 3.56 (95% CI 0.79 to 6.33; p = 0.013) andhad a slightly higher proportion of comorbidities; but
Fig. 2 Boxplot of mean SWE values by group (gout vs non-gout)
Table 3 Clinical and Demographic characteristics
Gout (n = 24) Non-gout (n = 26)
Male/Female (n) 19/5 21/5
Mean age (SD) 70.63 (11) 72.73 (10)
Mean BMI (SD)* 30.53 (4.97) 26.98 (4.77)
Ethnicity
Caucasian 23 (96%) 25 (96%)
Non-Caucasian 1 (4%) 1 (4%)
Mean self-reported relativephysical activity (range 1–3)
1.86 1.88
Comorbidities N (%)
Diabetes 12 (50) 11 (42)
Hypertension 18 (75) 15 (58)
Dyslipidaemia 15 (63) 13 (50)
Cardiac disease 10 (42) 6 (23)
Chronic kidney disease 8 (33) 2 (6)
Mean duration gout (SD) 9.39 (8.49) years –
Pharmacological management gout –
None 7 (29)
NSAIDs 2 (8)
Prednisolone 2 (8)
Allopurinol 10 (42)
Colchine 3 (13)
Table 4 Ultrasound characteristics of the AT
Gout (n = 24) Non-gout (n = 26)
Right Left Right Left
Tendon grade n (%)
Grade 1 19 (80) 17 (71) 18 (50) 19 (54)
Grade 2 5 (21) 7 (30) 8 (31) 7 (27)
Grade 3 0 0 0 0
Midpoint tendonthickness mmmean (SD)
5.66 (1.51) 5.86 (1.58) 5.87 (1.46) 5.54 (0.88)
Mean number intra-tendon aggregates(range)
0.25 (0–2) 1.17 (0–7) 0 0
Mean number intra-tendinoustophi (range)
0.54 (0–5) 1.08 (0–17) 0 0
Tendon neo-vascularity n (%)
Grade 0 19 (80) 17 (71) 23 (88) 24 (92)
Grade 1 2 (8) 4 (17) 3 (12) 1 (4)
Grade 2 2 (8) 2 (8) 0 1 (4)
Grade 3 1 (4) 1 (4) 0 0
Grade 4 0 (0) 0 (0) 0 0
Otter et al. BMC Musculoskeletal Disorders (2020) 21:658 Page 5 of 9
did not differ in respect of data concerning gender, eth-nicity nor self-reported levels of activity.
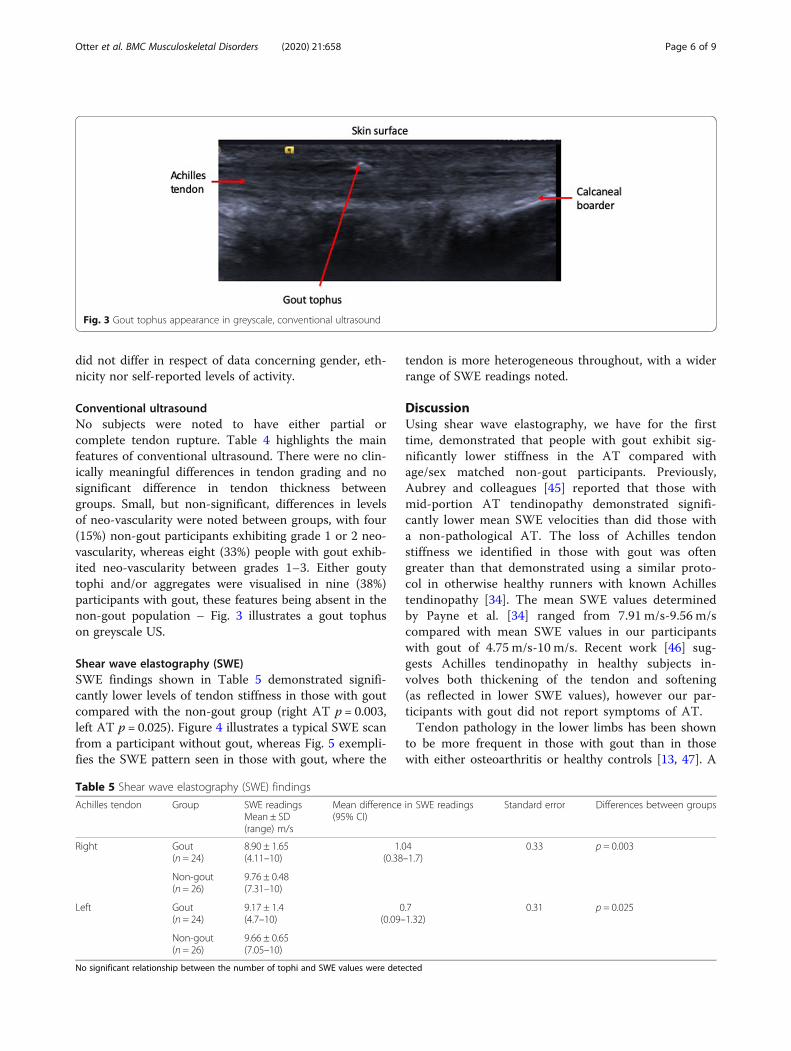
Conventional ultrasoundNo subjects were noted to have either partial orcomplete tendon rupture. Table 4 highlights the mainfeatures of conventional ultrasound. There were no clin-ically meaningful differences in tendon grading and nosignificant difference in tendon thickness betweengroups. Small, but non-significant, differences in levelsof neo-vascularity were noted between groups, with four(15%) non-gout participants exhibiting grade 1 or 2 neo-vascularity, whereas eight (33%) people with gout exhib-ited neo-vascularity between grades 1–3. Either goutytophi and/or aggregates were visualised in nine (38%)participants with gout, these features being absent in thenon-gout population – Fig. 3 illustrates a gout tophuson greyscale US.
Shear wave elastography (SWE)SWE findings shown in Table 5 demonstrated signifi-cantly lower levels of tendon stiffness in those with goutcompared with the non-gout group (right AT p = 0.003,left AT p = 0.025). Figure 4 illustrates a typical SWE scanfrom a participant without gout, whereas Fig. 5 exempli-fies the SWE pattern seen in those with gout, where the
tendon is more heterogeneous throughout, with a widerrange of SWE readings noted.
DiscussionUsing shear wave elastography, we have for the firsttime, demonstrated that people with gout exhibit sig-nificantly lower stiffness in the AT compared withage/sex matched non-gout participants. Previously,Aubrey and colleagues [45] reported that those withmid-portion AT tendinopathy demonstrated signifi-cantly lower mean SWE velocities than did those witha non-pathological AT. The loss of Achilles tendonstiffness we identified in those with gout was oftengreater than that demonstrated using a similar proto-col in otherwise healthy runners with known Achillestendinopathy [34]. The mean SWE values determinedby Payne et al. [34] ranged from 7.91 m/s-9.56 m/scompared with mean SWE values in our participantswith gout of 4.75 m/s-10 m/s. Recent work [46] sug-gests Achilles tendinopathy in healthy subjects in-volves both thickening of the tendon and softening(as reflected in lower SWE values), however our par-ticipants with gout did not report symptoms of AT.Tendon pathology in the lower limbs has been shown
to be more frequent in those with gout than in thosewith either osteoarthritis or healthy controls [13, 47]. A
Fig. 3 Gout tophus appearance in greyscale, conventional ultrasound
Table 5 Shear wave elastography (SWE) findings
Achilles tendon Group SWE readingsMean ± SD(range) m/s
Mean difference in SWE readings(95% CI)
Standard error Differences between groups
Right Gout(n = 24)
8.90 ± 1.65(4.11–10)
1.04(0.38–1.7)
0.33 p = 0.003
Non-gout(n = 26)
9.76 ± 0.48(7.31–10)
Left Gout(n = 24)
9.17 ± 1.4(4.7–10)
0.7(0.09–1.32)
0.31 p = 0.025
Non-gout(n = 26)
9.66 ± 0.65(7.05–10)
No significant relationship between the number of tophi and SWE values were detected
Otter et al. BMC Musculoskeletal Disorders (2020) 21:658 Page 6 of 9

systematic review and meta-analysis revealed that abnor-mal ultrasound findings (i.e. tendon thickening, in-creased vascularity, hypoechogenicity) in the AT werepredictive of tendinopathy [48]. However in our findingsfrom those with gout, tendon thickening did not appearto be present, nor were considerably higher intra-tendonpower Doppler readings noted, possibly suggesting a dif-ferent pathological model from standard tendinopathy.A previous US study [13] demonstrated a much higherprevalence of intra-tendinous tophi (73%) than in non-gout participants. MSU deposition has been reported in15–48% of the AT using dual energy CT scanning tech-niques [18, 49]. Our conventional ultrasound findingswere toward the upper end of these results, but not ashigh as Carroll et al. [13], which may reflect differentpopulation sampling strategies. Previously, Chhana et al.[12] reported that MSU crystals directly interact withtenocytes to reduce cell viability and function, whichmay contribute to tendon damage. We did not identifyany correlation between the number of tophi and SWEmeasures, which may further support a different patho-logical model. None of the studies reviewed above havereported SWE measurements. However currently, thelack of agreed and validated SWE values for tendinopa-thy may limit its use in the formal assessment of tendondamage [50].Previous clinical and laboratory-based studies have re-
ported weaker foot/leg muscles in those with gout thanin non-gout participants [51, 52]. This muscle weakness
was also associated with greater levels of foot pain [53].Those with gout also exhibited slower walking speedsthan control participants [53]. Current international rec-ommendations for gout management [54] highlight theimportance of diet together with lifestyle changes suchas increased levels of physical activity. In 2008 the UKNational Institute for Health and Care Excellence(NICE) [55] produced management recommendationsfor osteoarthritis that focused on the lower limb andemphasized that muscle strengthening should be under-taken before increasing aerobic activity. While we did notmeasure muscle strength, our contention here is thatthose participants with considerable loss of tendon stiff-ness might find that some types of increased load-bearingexercise have the potential to hasten the end stages of thecontinuum model of tendon pathology [56].A key strength of our work is that we recruited people
from a community-based outpatient clinic, and as suchour participants were broadly representative of patientswith gout treated in primary care. None were experien-cing symptoms of an acute gout flare, nor Achilles tendi-nosis, yet significant loss of tendon stiffness wasdemonstrated. The primary limitation of our study wasthat the researcher (SO) undertaking US scans and SWEreadings was not blinded to participant diagnosis, whichmay have led to inadvertent bias. Pathologies consistentwith gout when seen on ultrasound are highly character-istic, typically with excellent inter-rater reliability [13].Consequently, it is difficult to completely blind
Fig. 4 SWE scan control (non-gout) participant
Fig. 5 SWE scan gout participant
Otter et al. BMC Musculoskeletal Disorders (2020) 21:658 Page 7 of 9

sonographers to the underlying diagnosis, but theaddition of a second sonographer may add to the reli-ability of SWE measures in future work. The US ma-chine we used for SWE readings also has a limitationwhere a maximum SWE value of 10 m/s can be re-corded, after which a value of HIGH is given. Conse-quently, there may be a ceiling effect to some of themeasurements leading to a possible underestimation ofthe differences in AT stiffness. Moreover, there has beenlimited use of SWE to assess soft tissue stiffness in otherinflammatory arthropathies, making direct comparisonsdifficult. For example, in Ankylosing Spondylitis signifi-cant structural impairment of the Achilles tendon wasnoted using sonoelastography [57]. However, rather thanreporting SWE values, areas of the AT were simplycolour coded into normal or pathological, making directcomparison impossible.
ConclusionsSubjects with gout demonstrated significantly reducedAchilles tendon stiffness compared to non-gout controls.From a clinical standpoint, our SWE findings for the ATin those with gout were similar to SWE measurementsin subjects with Achilles tendinopathy who did not havegout. This finding suggests the AT in people with goutmay be less effective at transmitting muscle force andpotentially more susceptible to further pathology andinjury.
AbbreviationsAT: Achilles tendon; MSU: Monosodium urate; OMERACT: Outcome measuresin rheumatology; SWE: Shear Wave Elastography; US: Ultrasongraphy
AcknowledgementsWe wish to thank our participants for their time, clinical co-workers for help-ing with recruitment together with our reception colleagues for clinicbookings.
Authors’ contributionsSO and PW designed the study. SO, CP and PW developed themethodology. SO performed ultrasound examinations, and was a majorcontributor in writing the manuscript. SO and A-M J analyzed and inter-preted the patient data. NW oversaw the study. All authors read and ap-proved the final manuscript.
FundingNone.
Availability of data and materialsThe datasets generated and/or analysed during the current study are notpublicly available as some identifying information is present to enablepatient re-referral if required, but are available from the corresponding au-thor on reasonable request.
Ethics approval and consent to participateEthical approval was granted by the University of Brighton (17–009) andOffice for Research Ethics Committees Northern Ireland (ORECNI) (232339).All participants provided informed, written consent.
Consent for publicationNo applicable – no identifying data are presented.
Competing interestsNone.
Author details1School of Health Sciences, University of Brighton, 49 Darley Rd, EastbourneBN20 7UR, UK. 2Centre for Regenerative Medicine and Devices, University ofBrighton, Lewes Road, Brighton BN2 4AT, UK. 3School of Sport and ServiceManagement, University of Brighton, Hillbrow, Denton Road, EastbourneBN20 7SR, UK. 4Research and Development, Sussex Partnership NHSFoundation Trust, Swandean, Arundel Road, Worthing BN13 3EP, UK.
Received: 21 February 2020 Accepted: 18 August 2020
References1. Kuo CF, Grainge MJ, Mallen C, Zhang W, Doherty M. Rising burden of gout
in the UK but continuing suboptimal management: a nationwidepopulation study. Ann Rheum Dis. 2015;74:661–7.
2. Kuo C-F, Grainge MJ, Zhang W, Doherty M. Global epidemiology of gout:prevalence, incidence and risk factors. Nat Rev Rheumatol. 2015;11:649–62.
3. Dehlin M, Jacobsson L, Roddy E. Global epidemiology of gout: prevalence,incidence, treatment patterns and risk factors. Nat Rev Rheumatol. 16(7):380–90.
4. Smith E, Hoy D, Cross M. The global burden of gout: estimates from theGlobal Burden of Disease 2010 study. Ann Rheum Dis. 2014;73:1470–6.
5. Rome K, Frecklington M, McNair P, Gow P, Dalbeth N. Foot pain,impairment, and disability in patients with acute gout flares: a prospectiveobservational study. Arthritis Care Res (Hoboken). 2012;64(3):384–8.
6. Carroll M, Boocock M, Dalbeth N, Stewart S, Frampton C, Rome K. Anklejoint function during walking in tophaceous gout: A biomechanical gaitanalysis study. Gait Posture. 2018;63:150–3.
7. Roddy E, Muller S, Rome K, Chandratre P, Hider SL, Richardson J, Blagojevic-Bucknall M, Mallen CD. Foot problems in people with gout in primary care:baseline findings from a prospective cohort study. J Foot Ankle Res. 2015;8:31.
8. Rome K, Survepalli D, Sanders A, Lobo M, McQueen FM, McNair P, DalbethN. Functional and biomechanical characteristics of foot disease in chronicgout: a case-control study. Clin Biomech. 2011;26(1):90–4.
9. Lindsay K, Gow P, Vanderpyl J, Logo P. Dalbeth N the experience andimpact of living with gout: a study of men with chronic gout using aqualitative grounded theory approach. J Clin Rheumatol. 2011;17(1):1–6.
10. Chandratre P, Mallen CD, Roddy E, Liddle J, Richardson J. You want to geton with the rest of your life: a qualitative study of health-related quality oflife in gout. Clin Rheumatol. 2016;35(5):1197–205.
11. Mallinson PI, Reagan AC, Coupal T, Munk PL, Ouellette H, Nicolaou S. Thedistribution of urate deposition within the extremities in gout: a review of148 dual-energy CT cases. Skelet Radiol. 2014;43(3):277–81.
12. Chhana A, Callon KE, Dray M, Pool B, Naot D, Gamble GD, et al. Interactionsbetween tenocytes and monosodium urate monohydrate crystals:implications for tendon involvement in gout. Ann Rheum Dis. 2014;73(9):1737–41.
13. Carroll M, Dalbeth N, Allen B, et al. Ultrasound characteristics of the Achillestendon in Tophaceous gout: a comparison with age- and sex-matchedcontrols. J Rheumatol. 2017;44(10):1487–92.
14. Magnan B, Bondi M, Pierantoni S, Samaila E. The pathogenesis of Achillestendinopathy: A systematic review. Foot and Ankle Surgery. 2014;20:154–9.
15. Jarvinen TA, Kannus P, Maffulii N, Khan KM. Achilles tendon disorders:etiology and epidemiology. Foot & Ankle Clinics. 2005;10(2):255–66.
16. Foure A New Imaging Methods for Non-invasive Assessment of Mechanical,Structural, and Biochemical Properties of Human Achilles Tendon: A MiniReview Frontiers in Physiology 2016 7 Article 324.
17. Cortes DH, Suydam SM, Silbernagel KG, Buchanan TS, Elliott DM. ContinuousShear Wave Elastography: a New Method to Measure in-vivo ViscoelasticProperties of Tendons Biomedical. Ultrasound Med Biol. 2015;41(6):1518–29.
18. McAuliffe S, McCreesh K, Culloty F, et al. Can ultrasound imaging predictthe development of Achilles and patellar tendinopathy? A systematicreview and meta-analysis. Br J Sports Med. 2016;50:1516–23.
19. Arda K, Ciledag N, Aktas E, Aribas BK, Köse K. Quantitative assessment ofnormal soft-tissue elasticity using shear-wave ultrasound elastography. Am JRoentgenol. 2011;197(3):532–6.
Otter et al. BMC Musculoskeletal Disorders (2020) 21:658 Page 8 of 9
20. Winn N, Lalam R, Cassar-Pullicino V. Sonoelastography in themusculoskeletal system: Current role and future directions. World J Radiol.2016;8(11):868–79.
21. Martins-Rocha T, Azzolin I, Serban T, Massazza G, Iagnocco A. Newapplications of sonoelastography in rheumatology: where are we now?Rheumatology (Oxford). 2019;58(5):765–9.
22. Taljanovic MS, Gimber LH, Becker GW, Daniel Latt D, Klauser AS, MelvilleDM, et al. Shear-Wave Elastography: Basic Physics and MusculoskeletalApplications RadioGraphics. 2017;37:855–70.
23. Klauser AS, Miyamoto H, Bellmann-Weiler R, Feuchtner GM, Wick MC,Jaschke WR. Sonoelastography: Musculoskeletal. Radiology. 2014;272(3):622–33.
24. Schneider A, Feussner H, 2017 Biomedical engineering in gastrointestinalsurgery (1st Ed) Elsevier Amsterdam p87-220.
25. Chen X, Cui L, He P, Shen W, Qian Y, Wang J. Shear wave elastographiccharacterization of normal and torn Achilles tendons a pilot study. JUltrasound Med. 2013;32:449–55.
26. Pedersen M, Fredberg U, Langberg H. Sonoelastography as a diagnostictool in the assessment of musculoskeletal alterations: a systematic review.Ultraschall Med. 2012;33(5):441–6.
27. Dirrichs T, Quack V, Gatz M, Tingart M, Kuhl CK, Schrading S. Shear WaveElastography (SWE) for the Evaluation of Patients With Tendinopathies AcadRadiol. 2016 Oct;23(10):1204–13.
28. Dalbeth N, Doyle AJ. Imaging tools to measure treatment response in gout.Rheumatology (Oxford). 2018;57:i27–34.
29. Bursill D, Taylor WJ, Terkeltaub R, et al. Gout, Hyperuricaemia and Crystal-Associated Disease Network (G-CAN) consensus statement regarding labelsand definitions of disease states of gout. Ann Rheum Dis. 2019;78:1592–600.
30. Neogi T, Jansen TLTA, Dalbeth N, et al. 2015 Gout classification criteria: anAmerican College of Rheumatology/European league against rheumatismcollaborative initiative. Ann Rheum Dis. 2015;74(10):1789–98.
31. Gill D, Jones GR, Zou G, Speechley M. Using a single question to assessphysical activity in older adults: a reliability and validity study. BMC Med ResMethodol. 2012:12–20.
32. Bamber J, Cosgrove D, Dietrich CF, Fromageau J, Bojunga J, Calliadas F.EFSUMB Guidelines and Recommendations on the Clinical Use ofUltrasound Elastography. Part 1: Basic Principles and Technology. UltraschallMed. 2013;34:169–84.
33. Payne C, Watt P, Cercignani M, Webborn N. Poor reproducibility ofcompression elastography in the Achilles tendon: same day andconsecutive day measurements. Skeletal Radiol. 2017;46(7):889–95.
34. Payne C, Watt P, Cercignani M, Webborn N. Reproducibility of shear waveelastography measures of the Achilles tendon. Skelet Radiol. 2018;47:779–84.
35. De Zordo T, Chhem R, Smekal V, Feuchtner G, Reindl M, Fink C, et al. Real-time sonoelastography: findings in patients with symptomatic Achillestendons and comparison to healthy volunteers. Ultraschall Med. 2010;31:394–400.
36. Domenichini R, Pialat J-B, Podda A, Aubry A. Ultrasound elastography intendon pathology: state of the art. Skeletal Radiol. 2017;46:1643–55.
37. Landis JR, Koch GG. The measurement of observer agreement forcategorical data. Biometrics. 1977;33:159–74.
38. Grassi W, Filippucci E, Farina A, Cervini C. Sonographic imaging of tendons.Arthritis Rheum. 2000;43:969–76.
39. Schmidt WA. Value of sonography in diagnosis of rheumatoid arthritis.Lancet. 2001;357:1056–7.
40. Archambault JM, Wiley JP, Bray RC, Verhoef M, Wiseman DA, Elliott PD. Cansonography predict the outcome in patients with achillodynia? J ClinUltrasound. 1998;26(7):335–9.
41. Agudelo CA, Wise CM. Gout: diagnosis, pathogenesis, and clinicalmanifestations. Curr Opin Rheumatol. 2001;13:234–9.
42. Gutierrez M, Schmidt WA, Ralf G, Thiele RG, et al. International Consensusfor ultrasound lesions in gout: results of Delphi process and web-reliabilityexercise. Rheumatology. 2015;54:1797–805.
43. Öhberg L, Alfredson H. Ultrasound guided sclerosis of neo-vessels in painfulchronic Achilles tendinosis: pilot study of a new treatment. Br J Sports Med.2002;36:173–7.
44. Tabachnick BG, Fidell LS. Using multivariate statistics (6th Ed). London:Pearson; 2013. p. 235–355.
45. Aubry S, Nueffer J-P, Tanter M, Becce F, Vidal C, Michel F. Viscoelasticity inAchilles Tendonopathy: Quantitative Assessment by Using Real-time Shear-Wave Elastography1. Radiology. 2015;274(3):821–9.
46. Payne C, Baker P, Louw M, Watt P, Webborn N, A 12 week eccentricexercise programme: clinical outcome measures and tendon stiffnessmeasured by shear wave elastography in Achilles tendinopathy Journal ofOrthopaedic Research (in review).
47. Ventura-Ríos L, Sánchez-Bringas G, Pineda C, Hernández-Díaz C, et al.Tendon involvement in patients with gout: an ultrasound study ofprevalence. Clin Rheumatol. 2016;35(8):2039–44.
48. Dalbeth N, House ME, Aati O, Tan P, Franklin C, Horne A, McQueen FM.Urate crystal deposition in asymptomatic hyperuricaemia and symptomaticgout: a dual energy CT study. Ann Rheum Dis. 2015;74(5):908–11.
49. Yokose C, Dalbeth N, Wei J, Nicolaou S, Simeone FJ, Baumgartner S, ChoiHK. Radiologic evidence of symmetric and polyarticular monosodium uratecrystal deposition in gout - a cluster pattern analysis of dual-energy CT.Semin Arthritis Rheum. 2019;S0049-0172(19):30120–9.
50. Prado-Costa R, Rebelo J, Monteiro-Barroso J, Preto AS. Ultrasoundelastography: compression elastography and shear-wave elastography inthe assessment of tendon injury. Insights into Imaging. 2018;9:791–814.
51. Stewart S, Dalbeth N, Otter S, et al. Clinically-evident tophi are associatedwith reduced muscle force in the foot and ankle in people with gout: across-sectional study. J Foot Ankle Res. 2017;10:25.
52. Stewart S, Mawston G, Davidtz L, et al. Foot and ankle muscle strength inpeople with gout: a two-arm cross-sectional study. Clin Biomech. 2016;32:207–11.
53. Stewart S, Morpeth T, Dalbeth N, et al. Foot-related pain and disability andspatiotemporal parameters of gait during self-selected and fast walkingspeeds in people with gout: a two-arm cross sectional study. Gait Posture.2016;44:18–22.
54. Richette P, Doherty M, Pascal E, Barskova V, Becce F, Nastaneda-Sanabria J,et al. 2016 updated EULAR evidence-based recommendations for themanagement of gout. Ann Rheum Dis. 2017;76:29–42.
55. National Institute for Health & Clinical Excellence. NICE clinical guideline[CG59] osteoarthritis: the care and management of osteoarthritis in adults.London: National Institute for Health & Clinical Excellence 2008. Availablefrom: https://www.nice.org.uk/guidance/cg59 (last accessed 26 July 2020).
56. Cook JL, Rio E, Purdam CR, Docking SI. Revisiting the continuum model oftendon pathology: what is its merit in clinical practice and research? Br JSports Med. 2016;50:1187–91.
57. Turan A, Tufan A, Rıdvan Mercan R, et al. Real-time sonoelastography ofAchilles tendon in patients with ankylosing spondylitis. Skeletal Radiol. 2013;42:1113–8.
Publisher’s NoteSpringer Nature remains neutral with regard to jurisdictional claims inpublished maps and institutional affiliations.
Otter et al. BMC Musculoskeletal Disorders (2020) 21:658 Page 9 of 9