differences in transcriptional effects of 1α,25 ... · in circular slides (Ø13mm, glasscyto,...
TRANSCRIPT

Da
LMMa
b
c
d
a
ARRA
KFBG1
1
isifisccaio
e4f
0h
Journal of Steroid Biochemistry & Molecular Biology 133 (2013) 12–24
Contents lists available at SciVerse ScienceDirect
Journal of Steroid Biochemistry and Molecular Biology
journa l homepage: www.e lsev ier .com/ locate / j sbmb
ifferences in transcriptional effects of 1�,25 dihydroxyvitamin D3 on fibroblastsssociated to breast carcinomas and from paired normal breast tissues
aura Tojeiro Camposa,1, Helena Brentanib,1, Rosimeire Aparecida Roelaa,1,aria Lucia Hirata Katayamaa,1, Leandro Limac, Cíntia Flores Rolimd, Cíntia Milania,aria Aparecida Azevedo Koike Folgueiraa, Maria Mitzi Brentania,∗
Departamento de Radiologia e Oncologia, Faculdade de Medicina da Universidade de São Paulo, Av. Dr. Arnaldo, 455, Sala 4112, CEP 01246-903, São Paulo, SP, BrazilDepartamento de Psiquiatria, Faculdade de Medicina, Universidade de São Paulo, Rua Dr. Ovídio Pires de Campos, 785, 1◦ andar do IPq, Ala Sul, CEP 05403-010, São Paulo, BrazilLaboratório de Bioinformática e Bioestatística, Centro Internacional de Pesquisa e Ensino (CIPE) – Hospital AC Camargo, Rua Taguá, 440, CEP 01508-010, São Paulo, BrazilInstituto Brasileiro de Controle do Câncer, Av. Alcântara Machado 2576, CEP 03102-002, São Paulo, SP, Brazil
r t i c l e i n f o
rticle history:eceived 1 February 2012eceived in revised form 3 August 2012ccepted 9 August 2012
eywords:ibroblastsreast carcinomaene expression
a b s t r a c t
The effects of 1�,25 dihydroxyvitamin D3 (1,25D) on breast carcinoma associated fibroblasts (CAFs) arestill unknown. This study aimed to identify genes whose expression was altered after 1,25D treatmentin CAFs and matched adjacent normal mammary associated fibroblasts (NAFs). CAFs and NAFs (from 5patients) were cultured with or without (control) 1,25D 100 nM. Both CAF and NAF expressed vitaminD receptor (VDR) and 1,25D induction of the genomic pathway was detected through up-regulation ofthe target gene CYP24A1. Microarray analysis showed that despite presenting 50% of overlapping genes,CAFs and NAFs exhibited distinct transcriptional profiles after 1,25D treatment (FDR < 0.05). Functionalanalysis revealed that in CAFs, genes associated with proliferation (NRG1, WNT5A, PDGFC) were down
�,25 dihydroxyvitamin D3 regulated and those involved in immune modulation (NFKBIA, TREM-1) were up regulated, consistentwith anti tumor activities of 1,25D in breast cancer. In NAFs, a distinct subset of genes was inducedby 1,25D, involved in anti apoptosis, detoxification, antibacterial defense system and protection againstoxidative stress, which may limit carcinogenesis. Co-expression network and interactome analysis ofgenes commonly regulated by 1,25D in NAFs and CAFs revealed differences in their co-expression values,
ects i
suggesting that 1,25D eff
. Introduction
Breast carcinomas are complex tissues in which epithelial cellsnteract with their surrounding stromal compartment, which con-ists of extracellular matrix (ECM) molecules, resident fibroblasts,nflammatory, immune and endothelial cells [1]. Cancer associatedbroblasts (CAFs) are the most abundant cell type in breast tumortroma. CAFs possess an activated phenotype and �-smooth mus-le actin (�SMA) is the most commonly used marker for identifyingancer-associated fibroblasts but the tumor microenvironment
lso contains �SMA negative fibroblasts. CAFs are also character-zed by increased expression of S100A4, that marks a populationf fibroblasts distinct from those �SMA positive [2]. CAFs secrete∗ Corresponding author at: Disciplina de Oncologia, Departamento de RadiologiaOncologia, Faculdade de Medicina da Universidade de São Paulo, Av. Dr. Arnaldo,55, Sala 4115, CEP 01246-903, São Paulo, SP, Brazil. Tel.: +55 11 30617161;ax: +55 11 3082 6580.
E-mail address: [email protected] (M.M. Brentani).1 These authors contributed equally to this work.
960-0760 © 2012 Elsevier Ltd.ttp://dx.doi.org/10.1016/j.jsbmb.2012.08.002
Open access under the Elsevier OA license.
n NAFs are distinct from those triggered in CAFs.© 2012 Elsevier Ltd.
growth and angiogenic factors as well as a range of chemokinesand ECM proteins [3]. They differ from normal fibroblasts by dis-playing a distinct gene expression pattern [4]. Importantly, tumorpromoting properties of CAFs appear to be partially independent ofthe presence of tumor cells and are maintained in vitro even in theabsence of the epithelial cells [5]. In addition, interactions betweenbreast cancer associated fibroblasts and mammary epithelialcells result in alterations in the transcriptional profiles of bothcell types [6].
Numerous studies have established that 1�,25 dihydroxyvita-min D3 (1,25D) modulates cell cycle, progression, differentiationand apoptosis in breast carcinomas via interaction with the vitaminD receptor (VDR), but the major focus has been the epithe-lial compartment (reviewed in [7]). Although various studies ofgene profiling have been conducted to elucidate the molecularmechanisms underlying vitamin D3 effects in breast carcinomaepithelial cells [8], there are few studies addressing the effects
Open access under the Elsevier OA license.
of 1,25D in stromal cells. Response of fibroblasts to the hormonehas been carried out in mesenchymal multipotent cells in culture[9–11], lung fibroblasts [12] and human primary prostatic stromalcells [13,14].

emist
tnme1b1
2
2
upwhfirITwf
2
omnhcAp2dowgshrarticowfiu
2
nrinVaAD(t
L.T. Campos et al. / Journal of Steroid Bioch
In the current study we have established primary fibroblast cul-ures isolated from breast carcinomas (CAFs) and paired adjacentormal tissue (normal tissue associated fibroblasts, NAFs) and usedicroarrays to investigate the differential effects of 1,25D on gene
xpression profiles of each group of fibroblasts. Identification of,25D target genes in these cells may provide a starting point for aetter understanding of the molecular mechanisms involved in the,25D effects on breast cancer microenvironment.
. Patients, materials and methods
.1. Patients
Breast tissue specimens were obtained from five patientsndergoing surgery for breast carcinoma. Mean age of theatients was 53.3 ± 10.7 years, all were post-menopausal. Patientsere diagnosed with invasive ductal carcinoma (IDC) confirmedistopathologically, clinically staged as II or III. Tumors were classi-ed as ER and PR negative, HER-2 positive. None of the patients hadeceived preoperative chemotherapy. All patients were operated onnstituto Brasileiro de Controle do Câncer, IBCC, São Paulo, Brazil.his study was approved by the Institutional Ethics Committee andritten informed consent was obtained from all participants, after
ull explanation of the purpose and nature of all procedures used.
.2. Tissue samples and primary cell culture
Fibroblasts associated to human breast carcinoma werebtained from tissue samples from patients diagnosed with pri-ary ductal invasive breast cancer tumors (CAF) or isolated from
ormal areas of the same carcinomas (NAF). H&E-stained, frozenistological sections were prepared from each tissue sample toonfirm malignancy or morphologically normal epithelial tissue.fter adipose tissue removal, tissue was minced (1–4 mm3) intoieces in PBS (Na2HPO4 10 mM, NaCl 1.37 mM, KCl 27 mM, KH2PO4mM; Life Technologies, Grand Island, NY, USA), under sterile con-itions. A total of 10–15 fragments were obtained for each groupf fibroblasts and transferred to 25 cm2 culture flasks and coveredith Dulbecco’s Modified Eagle Medium (DMEM; Life Technolo-
ies), 20% FBS (Life Technologies), 100 �g/ml ampicillin, 100 �g/mltreptomycin, 2.5 �g/ml Fungizone and maintained at 37 ◦C in aumidified atmosphere containing 5% CO2. Outgrowth of cells wasecorded after 10–20 days and medium was renewed once or twiceweek thereafter. After fibroblast migration, tissue fragments were
emoved and cells were passaged by mild trypsinization withrypsin 0.5% (Life Technologies), and fibroblastoid cells were seedednto new culture flasks containing the same medium. After threeell passages, morphologically homogeneous cultures containingnly fibroblastoid cells were obtained. At this stage no macrophagesere left. Absence of macrophages and endothelial cells was con-rmed using human anti-CD31 and CD163 [6,15]. All CAFs and NAFssed were from passages 4 to 6.
.3. Characterization of fibroblasts
Primary cultures of breast cancer associated fibroblasts andormal adjacent fibroblasts were characterized by immunofluo-escence. Briefly, cells in early passages (passage 3) were platedn circular slides (Ø13 mm, Glasscyto, Bioslide Technology, Wal-ut, CA, USA) and incubated with human anti-vimentin (cloneim 3b4), human anti-smooth muscle actin (clone M0635), humannti-S100A4 (clone A5114), human anti-pancytokeratin (clones
E1/AE3) and human anti-CD31 (clone JC70A), all antibodies fromako Corporation (Carpinteria, CA, USA) and human anti-CD163clone 10D6) from Vector Laboratories (Burlingame, CA, USA). Afterhat, cells were incubated with the secondary antibody (Alexa
ry & Molecular Biology 133 (2013) 12–24 13
Fluor 488 anti-rabbit or mouse IgG (Life Technologies) dilutedin PBS. Immunofluorescence was also performed to verify thepresence of vitamin D receptors. Anti-VDR (clone 9A7, AffinityBioreagents, Rockford, IL, USA) was used as primary antibody andFITC-conjugated anti-mouse IgG (Sigma–Aldrich, St. Louis, MO,USA) as second antibody. The cell analysis was performed using aZeiss Axioplan microscope (Carl Zeiss; Jena, Thüringen, Germany).
2.4. Cell treatment
CAFs and NAFs were plated in 75 cm2 culture flasks (5 × 10⁴
cells per flask, TPP – Techno Plastic Products AG, Trasadigen,Switzerland) and grown until cells reached 70% confluence. At thispoint, cells were treated with DMEM containing 0.5 or 100 nM1,25D (cat. no. 679101, Merck, Darmstadt, Germany) or vehicle(0.1% ethanol) for 24 h.
2.5. Microarray analysis
Total RNA was isolated and purified using TRIzol® reagent(Life Technologies) and RNeasy Mini Kit (Qiagen, Valencia, CA,USA), respectively, according to the manufacturers’ protocols. RNAintegrity was verified in a Bioanalyzer 2100 (Agilent Technologies,Santa Clara, CA, USA) and only samples with RNA integrity number>7 were considered. Beginning with 5 �g total RNA, a one-roundlinear amplification was carried out according to an Affymetrix pro-tocol (One Cycle Target Labeling Kit, Affymetrix, Santa Clara, USA).Afterwards, biotin-labeled cRNA was reverse transcribed using IVTlabeling kit (Affymetrix) and 15 �g of biotinylated fragmentedaRNA was hybridized onto the Human Genome U133 Plus 2.0GeneChip. The transcript levels in each sample were determined byusing the Affymetrix HU133 plus 2.0 GeneChip (Affymetrix, 54,210probe sets covering over 47,000 transcripts and splice variants).Hybridized GeneChips were scanned using Affymetrix GeneChipScanner 3000 and after visual inspection, raw data were saved intoCEL files.
The quality of microarray images from individual GeneChipsand the expression distribution at the probe set level betweenGeneChips were inspected using Affymetrix GeneChip OperatingSoftware (GCOS). All of the GeneChips presented high quality andwere used for subsequent analysis.
Background correction, normalization and summarizationof raw data (CEL files) were performed using the RobustMulti-Array Average (RMA) method available on R package(http://www.R-project.org), with the “Affy” library of BioconductorPackage (http://www.bioconductor.org).
2.6. Statistical analysis of microarray data
First of all, filtering was set to select 30% of genes with thehighest standard deviation. Comparisons of expression levels wereperformed using MeV (MultiExperiment Viewer, version 4.5.1)software. Differentially expressed transcripts after 1,25D treatment(control vs 1,25D treated) were identified using the SignificanceAnalysis of Microarray program (SAM, version 3.02). Data for eachcomparison were analyzed using a two class, paired analysis with1000 permutations. For each transcript SAM uses permutation ofthe data to identify a False Discovery Rate (FDR) that balances type Iand type II statistical error rates. Significance for differential expres-sion due to 1,25D treatment was determined at the 5% FDR. To
identify and visualize biological processes that were enriched dueto 1,25(OH)2D treatment, differentially expressed genes were sub-jected to subsequent Gene Ontology (GO) analysis using ToppGenesoftware (http://toppgene.cchmc.org/).
1 emist
2
RtessU
7S1apiwoebsetS
2
cc1wbfstaw
2
cbdeatpvhtgomgoW
agmof
4 L.T. Campos et al. / Journal of Steroid Bioch
.7. Quantitative real time RT-PCR
Reverse transcription was performed using 3 �g of totalNA, Oligo dT(12–18) and SuperscriptTM III Reverse Transcrip-ase (Life Technologies). Primers were designed for differentxons to avoid amplification of genomic DNA using Primer-Blastoftware (http://www.ncbi.nlm.nih.gov/tools/primer-blast/), andynthesized by IDT (Integrated DNA Technologies, Coralville, IA,SA).
Quantitative RT-PCRs were performed using the ABI PrismTM
500 Sequence Detection System. RT-PCRs were carried out usingYBR® Green PCR Power MasterMix using the following program:0 min at 95 ◦C for the initial denaturing, followed by 40 cyclest 95 ◦C for 15 s and 60 ◦C for 1 min. The efficiency of each pair ofrimers was calculated using standard curve dilutions (as described
n the Life Technologies protocols). The duplicate average valuesere used for quantification and the relative expression of genes
f interest was normalized to that of GAPDH. Gene expression inach treated sample was then compared with expression in fibro-lasts from control samples. Relative gene expression betweenample groups was calculated employing the efficiency-correctedquation. We generated changes in gene expression values of eachreated sample by comparing it with the respective control sample.tatistical analyses were carried out using t-test.
.8. Co-expression network
We searched for pairs of genes whose co-expression hadhanged and the network was constructed based on all possibleombinations starting from the 69 commonly altered genes by,25D. Pearson correlation coefficient (PCC) between pairs of genesas calculated independently for CAF and NAF [16]. Differences
etween the correlations in the CAF and NAF groups were rankedor gene pairs. Pairs with absolute differences greater than 1.5 wereelected. The idea was to select pairs of genes that have changedheir co-expression between CAFs and NAFs. Data analysis and visu-lization were conducted by Cytoscape software (version 2.8.0;ww.cytoscape.org).
.9. Network construction
Interaction network analysis was carried out for the 69 genesommonly altered in both normal and tumor associated fibro-lasts after 1,25D treatment by querying three human interactomeatabases (HPRD, MINT and IntAct) [17–19]. We overlaid thexpression values of each gene on its corresponding proteinnd we constructed a protein–protein interaction network withhose genes that were mapped in the databases and their directartners. To identify broker and bridge genes in network, a pre-iously published algorithm [20] was implemented using the sitettp://bioinfo.lbhc.hcancer.org.br/interactomegraph/, a free webool to improve the interactome database analysis. Brokers areenes that connect many proteins that would not be connectedtherwise. Bridges are nodes that have few links but connect com-unities, i.e., very connected groups. We considered as bridge
enes the 2% ones with higher bridging centrality values and the 2%nes with higher brokering values were considered broker genes.e used the top 2% more connected genes to select the hubs.After construction of the interactome using as our “seed” the
forementioned 69 genes, we searched for pairs of connected
enes present in the microarray. Using the expression values of theicroarray, the Pearson correlation coefficient (PCC) between pairsf genes was calculated independently for CAFs and NAFs [16]. Dif-erences between the correlations in the CAF and NAF groups were
ry & Molecular Biology 133 (2013) 12–24
ranked for gene pairs. We selected ranked pairs with differencegreater then 1.5.
3. Results
At first, to characterize the primary culture cell population,immunofluorescence assays to recognize specific cell antigens wereperformed using cell culture at passage 4. Cell monolayers werenegative for pan-cytokeratin, CD31 (Fig. 1A) and CD163 (data notshown) and stained uniformly for vimentin (Fig. 1B) confirming thestromal origin of cells and absence of contaminating endothelial,epithelial or macrophage cells. Expression of �-SMA was detectedin both CAFs and NAFs, however, with some variability among indi-vidual donors and the percentage of positive cells was generallyhigher in CAFs, which often take on the appearance of an activatedor myofibroblastic phenotype (Fig. 1A). The �-SMA expression byNAFs may arise during cell culture conditions as previously sug-gested [21 and references therein]. S100A4, which marks a distinctpopulation of fibroblasts than �-SMA positive fibroblasts [2], wasdetected in CAFs as well as in NAFs, but with a higher proportionof positive cells in CAFs (Fig. 1A).
We next determined the presence of vitamin D receptor inCAFs and NAFs. Immunofluorescence analysis through confocalmicroscopy revealed the presence of VDR in all five CAF popula-tion, with predominant localization in the nucleus rather than inthe cytoplasm. Similar results were found in NAFs (Fig. 1C).
The starting point of this work was the comparison ofgene expression patterns from CAF-untreated controls and NAF-untreated controls, as there are reports indicating differencesbetween them [22]. Supplementary Table 1 summarizes theexpression differences, assuming a 1.4-fold difference cutoffbetween CAFs and matched NAFs (CAF/NAF ratio). Gene ontologycategories (biological process) enriched in genes more expressedin CAFs were cell cycle, protein transport, apoptosis, cell prolif-eration and carbohydrate metabolic processes and in NAFs wereimmune response, lipid metabolic processes, cell differentiation,cell adhesion and cell proliferation (Supplementary Fig. 1).
We next investigated the ability of 1,25D to differentially reg-ulate gene expression of CAFs and NAFs, and for this analysis twohormone concentrations were used, 0.5 nM, which can be safelyattained in vivo [23] and 100 nM, a supra physiological concen-tration, commonly utilized in experiments in vitro, to investigateglobal gene expression in cancer epithelial or mesenchymal celllines [7,11].
In CAFs, 1,25D 0.5 nM responsiveness was modest, but it wasdetected as an induction of the hormone target CYP24A1, whoseexpression increased 6.7-fold at 24 h as compared to counterpartcontrols in the absence of 1,25D. Another 274 genes were induced,with fold changes ranging from 1.13 to 2.46, including 11 genes,whose expression was further analyzed by RT-PCR, in a techni-cal validation assay. In general there was qualitative agreementbetween the two techniques with all genes showing similar trends,including two (TGF�2 and CYP24) which were confirmed as moreexpressed in 1,25D treated fibroblasts. A possible explanation forthe lack of statistical significance for the other PCR determina-tions might be the small fold changes in gene expression (data notshown).
We then decided to use a pharmacological concentration(100 nM), commonly used to investigate 1,25D effects in cell cultureassays. Adopting a 5% FDR cut-off we identified 126 and 123 genesdifferentially expressed in NAFs and CAFs 1,25D treated, respec-
tively, as compared with their untreated controls. A Venn diagramdetected 69 overlapped genes regulated by 1,25D 100 nM in bothCAFs and NAFs, among which, only 3 were down regulated (Fig. 2,Supplementary Tables 2–4). Fifty four genes were exclusively
L.T. Campos et al. / Journal of Steroid Biochemistry & Molecular Biology 133 (2013) 12–24 15
Fig. 1. Characterization of fibroblast primary culture isolated from breast carcinoma tissue sample (CAF) and from paired normal adjacent breast tissue (NAF). Immunofluo-rescence analysis followed by confocal microscopy in representative cases (A) showed uniformly positive staining for �-SMA and negative staining for pan-cytokeratin andC Fs. (B)c e in onn
mru
ttwNwar((
ii
D31, while S100A4 positive stained cell frequency was higher in CAFs than in NAells was more concentrated in the nucleus than in the cytoplasm (arrows indicatuclear marker (blue fluorescence) in all experiments. Scale bar: 50 �m.
odulated in CAFs (but not in NAFs): 27 up- and 27 down-egulated. Specifically in NAFs (but not in CAFs) 1,25D3 treatmentp regulated 55 and down regulated other two genes.
Among genes specifically regulated in CAFs, prolifera-ion/apoptosis related processes were over represented. Inhese fibroblasts, out of 27 genes down regulated by 1,25D, severalere related to this particular function (ADK, SOX9, WNT5A, PDGFC,RG1, F2R) except for NFKappaBIA (an inhibitor of NF-KappaB),hich was up-regulated. Another functional categories enriched
fter 1,25D treatment included genes associated either withesponse to wounding, like TREM1, WNT5A, F2RL2 (PAR-3), F2RPAR-1), or with extracellular matrix and intracellular transport
Table 1).In NAFs, genes exclusively modulated by 1,25D were involvedn multiple cellular processes. Several up-regulated genes werenvolved in negative regulation of proliferation or in anti-apoptosis
Vimentin expression was restricted to cytoplasm and (C) VDR expression in bothe representative cell VDR expression in nuclei and cytoplasm): DAPI was used as
(out of 11 genes, 7 were anti-apoptotic) such as VEGFA, TCF7L2,GCLC, IL7R1, NCAM1, SERPINB9 and CNKSR2. A number of up regu-lated genes fall in the category of immune response (TLR4, PRDM1,IL7R, PEL12, LRIG1, BMP6). However, genes associated with otherbiologic processes such as transmembrane transport and regu-lation of transport (KCNK3, SLC4A7, RAB8B1, ATP2B1), xenobioticmetabolic process (GLYAT, GCLC and CYP3A5), and ATP catabolicprocess (ABCB4, ABCA6, ABCA8) were also up regulated by 1,25Din NAFs (Table 2).
Among overlapping genes altered by 1,25D in CAFs as well inNAFs (n = 69), several functional groups were identified: genes withroles in proliferation and apoptosis, immune response and inflam-
mation, lipid metabolism, ras family, cell adhesion and regulationof cell transduction were the most represented. The range of foldregulation of gene expression varied from 1.71 to 5.54, with smalldifferences in fold change values between NAFs and CAFs, exception
16 L.T. Campos et al. / Journal of Steroid Biochemistry & Molecular Biology 133 (2013) 12–24
F AFs and Amon
mo
cstntw1
awrl
dmdHwMC11CN2biwmCtp(iOlatCda
1
ig. 2. Venn diagram showing the number of genes differentially expressed in Cifferentially expressed in CAFs and NAFs modulated by 1,25D 100 nM vs controls.
ade for CYP24A1, which exhibited by far the highest up-regulationf all (516-fold in CAFs and 299-fold in NAFs) (Table 3).
Although the gene expression profiles varied considerably whenomparing control CAFs and NAFs (Supplementary Table 1), thiset of genes did not overlap significantly with the set of differen-ially expressed genes following 1,25D treatment, except for a smallumber of genes. However, comparing the functional categories ofhese two gene sets we could observe that some similar functionsere present in both of them (Supplementary Fig. 1 and Tables
–3).Comparing 1,25D transcriptional effects specifically in NAFs
nd genes differentially expressed in NAFs vs CAFs, only 5 genesere found, most of them (n = 4) more expressed in NAFs and up-
egulated by the hormone: ACSL3, ATP2B1, FHOD3, VEGFA, and one,ess expressed in NAFs (vs CAFs) and up-regulated by 1,25D.
Among overlapping genes regulated by1,25D in CAFs and genesifferentially expressed between CAFs vs NAFs the scenario wasore complex: 7 genes more expressed in CAFs (than NAFs) were
own-regulated by 1,25D in CAFs (ADK, AMIGO2, CCDC99, E2F7,AS2, MYBL1, PDGFC); 5 genes less expressed in CAFs (vs NAF)ere up-regulated by 1,25D in CAFs (CCDC85B, CSF1, MAN1C1,TSS1, SULF2). Another two genes were regulated by 1,25D in
AFs: GALNT12 (less expressed in CAFs and down regulated by,25D) and SOD2 (more expressed in CAFs and up-regulated by,25D). In addition, six genes were up-regulated by 1,25D in bothAFs and NAFs, all of them considered less expressed in CAFs (vsAFs): MALL, NLRP1, OSR1, OSR2, TGFB2, TMEM119. Hence, from0 genes differentially expressed in CAFs (vs NAFs) and modulatedy 1,25D, 18 were regulated by the hormone toward a closer sim-
larity with NAFs. An example is HAS2 (hyaluronan synthase 2)hich plays a critical role in the development of a pro metastaticicroenvironment [24]. HAS2 expression was 6.97-fold higher in
AFs (vs NAFs) and was reduced in CAFs after 1,25D treatment. Onhe other hand, IL8 which was more expressed in CAFs than in NAFsresenting a fold of 37.4 as compared to the values found in NAFsSupplementary Table 1) did not appear as differentially expressedn the list of CAFs treated with 1,25D vs respective in treated control.ur interpretation of the above comparison is that the expression
evels of the genes differentially expressed between control CAFsnd NAFs may be differentially affected after 1,25D treatment buthe resulting expression levels did not reach significant differences.ontrariwise, other genes whose basal levels did not significantly
iffer between the two control cell types have been changed greatlyfter 1,25D treatment.Nineteen genes (with the highest fold changes induced by,25D) were selected for technical validation assays through
d NAFs after 1,25D treatment. Using microarray analysis we determinate genesg these genes, 69 were commonly regulated by 1,25D in both CAFs and NAFs.
quantitative real time RT-PCR. These experiments confirmed 84%of the gene expression changes were induced in CAFs or NAFs by1,25D. The results are visualized in Supplementary Table 5 andindicate that 1,25D modulates the expression of genes involved indiverse biological processes, such as metabolism (CYP24A1, CYP3A5,IDH2, GJA1), steroidal metabolism (SULT1C2), cell proliferation, cellcycle and transduction signals (G0S2, IGF1, MAPK13, FGF9, NRG1,TGFB2) as well as inflammatory and immune responses (CD14,CSF2RB, IL7R, TLR4) and ATP catabolic process (ABCB4).
As a biological validation procedure we compared 1,25D effectsshared by fibroblasts (CAFs and NAFs) with breast cancer freshtissue slices exposed in vitro to the hormone. All samples werefrom post-menopausal patients with invasive ductal carcinoma (2of them ER positive and 2 HER-2 positive) and tumor slices were cul-tured in the presence or absence of 1,25D 100 nM for 24 h. We haveused this tissue model before and shown that VDR is present andthat the genomic pathway is active, detected as CYP24A1 induc-tion [25]. Comparing 1,25D effects in CAFs and NAFs with breastcancer slices we identified 24 genes commonly regulated, 22 ofthem up-regulated by 1,25D. Genes up-regulated in both CAFsand NAFs and breast cancer tissue slices included: APBB1IP, CD14,CILP, CLMN, CYP24A1, DPP4, EFTUD1, FAM20C, FOXF1, G0S2, GRK5,IL1RL1, RGNEF, SERPINB1, SLC1A1, THBD [26].
To better investigate findings related to the genes commonlyaltered by 1,25D in both NAFs and CAFs, we decided to use twoapproaches.
We first constructed a gene–gene network (co-expression net-work) using the values of Pearson correlation between pairs ofgenes, based on all possible combinations of the 69 commonlyaltered (in both CAFs and NAFs) genes by 1,25D. Differencesbetween the correlations in either NAF or CAF groups were rankedfor gene pairs. Pairs with high absolute differences indicated thatthe two correlations were in opposite sides of zero and closer to 1and −1 or vice versa respectively. By restricting the analysis to thosewith absolute differences greater than 1.5 we selected a group of 38pairs of genes (Supplementary Table 6). It is important to note wefound changes in the correlations of the expression levels of genesbetween NAF and CAF groups.
Using the dynamic structure of the human protein interactionnetwork (interactome) it has recently been shown that genes thatare not differently expressed may indicate relevant differencesbetween tumor samples and controls [27].
Using the set of genes commonly differentially expressed in1,25D treated CAFs and NAFs as compared with respective controls(n = 69) we next searched for interactions among those genes andtheir neighbors in the human interactome [28] (Fig. 3). To explore

L.T. Campos et al. / Journal of Steroid Biochemistry & Molecular Biology 133 (2013) 12–24 17
Table 1Genes with expression exclusively regulated in CAFs by 1,25D.
Gene symbol Gene description Fold change
Cell proliferationSOD2a Superoxide dismutase 2, mitochondrial 9.52FGF9 Fibroblast growth factor 9 (glia-activating factor) 2.77EGFR Epidermal growth factor receptor 1.96CSF1 Colony stimulating factor 1 (macrophage) 1.84NFKBIA Nuclear factor of kappa light polypeptide gene enhancer in B-cells inhibitor, alpha 1.82PTCH1 Patched 1 1.61PDGFCa Platelet derived growth factor C −1.91WNT5Aa Wingless-type MMTV integration site family, member 5A −2.22SOX9 SRY (sex determining region Y)-box 9 −2.23E2F7 E2F transcription factor 7 −2.33ADK Adenosine kinase −2.35F2R Coagulation factor II (thrombin) receptor −2.80NRG1 Neuregulin 1 −3.23MAPK cascadeFGF9 Fibroblast growth factor 9 (glia-activating factor) 2.77EGFR Epidermal growth factor receptor 1.96WNT5A Wingless-type MMTV integration site family, member 5A −2.22OXTR Oxytocin receptor −2.36RGS4 Regulator of G-protein signaling 4 −2.38F2R Coagulation factor II (thrombin) receptor −2.80NRG1 Neuregulin 1 −3.23ApoptosisSOD2b Superoxide dismutase 2, mitochondrial 9.52EGFR Epidermal growth factor receptor 1.96DUSP1b Dual specificity phosphatase 1 1.84NFKBIAb Nuclear factor of kappa light polypeptide gene enhancer in B-cells inhibitor, alpha 1.82TWIST2b Twist homolog 2 (Drosophila) 1.75AMIGO2b Adhesion molecule with Ig-like domain 2 −1.88PHF17 PHD finger protein 17 −2.05SERPINB2b Serpin peptidase inhibitor, clade B (ovalbumin), member 2 −2.06FAM176A Family with sequence similarity 176, member A −2.12WNT5A Wingless-type MMTV integration site family, member 5A −2.22SOX9 SRY (sex determining region Y)-box 9 −2.23F2R Coagulation factor II (thrombin) receptor −2.80NRG1b Neuregulin 1 −3.23Response to vitaminDUSP1 Dual specificity phosphatase 1 1.84PTCH1 Patched 1 1.61WNT5A Wingless-type MMTV integration site family, member 5A −2.22SOX9 SRY (sex determining region Y)-box 9 −2.23Extracellular structure organizationOXTR Oxytocin receptor 2.36LOX Lysyl oxidase 1.85WNT5A Wingless-type MMTV integration site family, member 5A −2.22F2R Coagulation factor II (thrombin) receptor −2.80NRG1 Neuregulin 1 −3.23Regulation of cell communicationFGF9 Fibroblast growth factor 9 (glia-activating factor) 2.77OXTR Oxytocin receptor 2.36EGFR Epidermal growth factor receptor 1.96CSF1 Colony stimulating factor 1 (macrophage) 1.84NFKBIA Nuclear factor of kappa light polypeptide gene enhancer in B-cells inhibitor, alpha 1.82RGS4 Regulator of G-protein signaling 4 −2.06WNT5A Wingless-type MMTV integration site family, member 5A −2.22RIMS1 Regulating synaptic membrane exocytosis 1 −2.45F2R Coagulation factor II (thrombin) receptor −2.80NRG1 Neuregulin 1 −3.23Intracellular transportFGF9 Fibroblast growth factor 9 (glia-activating factor) 2.77EGFR Epidermal growth factor receptor 1.96NFKBIA Nuclear factor of kappa light polypeptide gene enhancer in B-cells inhibitor, alpha 1.82PPP1R3C Protein phosphatase 1, regulatory (inhibitor) subunit 3C −2.19RIMS1 Regulating synaptic membrane exocytosis 1 −2.45F2R Coagulation factor II (thrombin) receptor −2.80Response to woundingSOD2 Superoxide dismutase 2, mitochondrial 9.52TREM1 Triggering receptor expressed on myeloid cells 1 4.11LOX Lysyl oxidase 1.85SERPINB2 Serpin peptidase inhibitor, clade B (ovalbumin), member 2 −2.06WNT5A Wingless-type MMTV integration site family, member 5A −2.22F2RL2 Coagulation factor II (thrombin) receptor-like 2 −2.34F2R Coagulation factor II (thrombin) receptor −2.80NRG1 Neuregulin 1 −3.23
a Genes involved with regulation of fibroblast proliferation.b Genes involved with anti-apoptosis.

18 L.T. Campos et al. / Journal of Steroid Biochemistry & Molecular Biology 133 (2013) 12–24
Table 2Genes with expression exclusively regulated in NAFs by 1,25D.
Gene symbol Gene description Fold change
Cell proliferationAKR1B1a ATPase, Ca2+ transporting, plasma membrane 1 1.60ATP2B1b Aldo–keto reductase family 1, member B1 (aldose reductase) 1.94BCAT1 Branched chain amino-acid transaminase 1, cytosolic 2.50CRIP1 Cysteine-rich protein 1 (intestinal) 3.44FIGFa c-fos induced growth factor (vascular endothelial growth factor D) 1.90GJA1b Gap junction protein, alpha 1, 43 kDa 1.71LRRC17 Leucine rich repeat containing 17 1.53NFIBb Nuclear factor I/B 2.93PRDM1b PR domain containing 1, with ZNF domain 2.00ApoptosisABCB1b ATP-binding cassette, sub-family B (MDR/TAP), member 1 1.90CNKSR2b Connector enhancer of kinase suppressor of Ras 2 1.94FEM1Ba fem-1 homolog b (C. elegans) 2.30GCLCb Glutamate-cysteine ligase, catalytic subunit 2.20IL7Ra Interleukin 7 receptor 2.60NCAM1b Neural cell adhesion molecule 1 1.85SEMA3B Semaphorin 3B 1.82SERPINB9b Serpin peptidase inhibitor, clade B (ovalbumin), member 9 1.80TCF7L2b Toll-like receptor 4 2.20TLR4a Transcription factor 7-like 2 (T-cell specific, HMG-box) 2.90VEGFAb Vascular endothelial growth factor A 1.92Immune system processBMP6 Bone morphogenetic protein 6 1.70FZD8 Frizzled homolog 8 (Drosophila) 1.60IL7R Interleukin 7 receptor 2.60LRIG1 Leucine rich repeat containing 17 2.22LRRC17 Leucine-rich repeats and immunoglobulin-like domains 1 1.58PELI2 Pellino homolog 2 (Drosophila) 1.80PODXL Podocalyxin-like 2.94PRDM1 PR domain containing 1, with ZNF domain 1.99TLR4 Toll-like receptor 4 1.70Cellular transportTransmembrane transportABCB1 ATP-binding cassette, sub-family B (MDR/TAP), member 1 1.90ABCB4 ATP-binding cassette, sub-family B (MDR/TAP), member 4 2.20ATP2B1 ATPase, Ca2+ transporting, plasma membrane 1 2.00KCNK3 Potassium channel, subfamily K, member 3 5.60SLC4A7 Solute carrier family 4, sodium bicarbonate cotransporter, member 7 1.65STEAP1 Six transmembrane epithelial antigen of the prostate 1 1.70TMEM16D Anoctamin 4 1.90Regulation of transportGJA1 Gap junction protein, alpha 1, 43 kDa 1.70KCNK3 Potassium channel, subfamily K, member 3 5.60RAB8B RAB8B, member RAS oncogene family 2.06TCF7L2 Transcription factor 7-like 2 (T-cell specific, HMG-box) 1.60TLR4 Toll-like receptor 4 1.70Cell–cell adhesionCDH6 Cadherin 6, type 2, K-cadherin (fetal kidney) 1.70NCAM1 Neural cell adhesion molecule 1 1.85PLEKHA7 Pleckstrin homology domain containing, family A member 7 3.35PODXL Podocalyxin-like 2.94Regulation of metabolic processBMP6 Bone morphogenetic protein 6 1.70FZD8 Frizzled homolog 8 (Drosophila) 1.60GCLC Gap junction protein, alpha 1, 43 kDa 2.20GJA1 Glutamate-cysteine ligase, catalytic subunit 1.70NFIB Nuclear factor I/B 2.98PRDM1 PR domain containing 1, with ZNF domain 3.00TCF7L2 Transcription factor 7-like 2 (T-cell specific, HMG-box) 2.20TLR4 Toll-like receptor 4 2.90VEGFA Vascular endothelial growth factor A 1.92ATP catabolic processABCB4 ATP-binding cassette, sub-family B (MDR/TAP), member 4 2.20ABCA6 ATP-binding cassette, sub-family A (ABC1), member 6 1.94ABCA8 ATP-binding cassette, sub-family A (ABC1), member 8 2.40Xenobiotic metabolic processCYP3A5 Cytochrome P450, family 3, subfamily A, polypeptide 5 4.20GCLC Glutamate-cysteine ligase, catalytic subunit 2.20GLYAT Glycine-N-acyltransferase 2.15
a Genes involved with positive regulation of cell proliferation.b Genes involved with negative regulation of cell proliferation.

L.T. Campos et al. / Journal of Steroid Biochemistry & Molecular Biology 133 (2013) 12–24 19
Table 3Gene expression commonly regulated in CAFs and NAFs by 1,25D.
Gene symbol Gene description Fold changeNAF
Fold changeCAF
Cell proliferationBCL2 B-cell CLL/lymphoma 2 1.91 2.34DPP4 Dipeptidyl-peptidase 4 1.77 1.74EDNRB Endothelin receptor type B 1.97 5.34FOXF1 Forkhead box F1 3.02 2.33IGF1 Insulin-like growth factor 1 (somatomedin C) 3.10 3.81NAMPT Nicotinamide phosphoribosyltransferase 3.15 1.79OSR1 Odd-skipped related 1 (Drosophila) 3.91 3.63PDPN Podoplanin 2.72 2.86TACSTD2 Tumor-associated calcium signal transducer 2 2.37 1.69TGFB2 Transforming growth factor, beta 2 4.74 5.38ApoptosisBCL2 B-cell CLL/lymphoma 2 1.91 2.34CD14 CD14 molecule 5.54 3.02DDIT4 DNA-damage-inducible transcript 4 1.77 1.70EDNRB Endothelin receptor type B 1.97 5.34IER3 Immediate early response 3 −2.42 −2.36IGF1 Insulin-like growth factor 1 (somatomedin C) 3.10 3.81NLRP1 NLR family, pyrin domain containing 1 2.80 2.62OSR1 Odd-skipped related 1 (Drosophila) 3.91 3.63RASSF5 Ras association (RalGDS/AF-6) domain family member 5 2.59 2.04SIX1 SIX homeobox 1 2.02 1.99SPP1 Secreted phosphoprotein 1 2.26 2.21TGFB2 Transforming growth factor, beta 2 4.74 5.38Immune system processBCL2 B-cell CLL/lymphoma 2 1.91 2.34CD14 CD14 molecule 5.54 3.02CD97 CD97 molecule 1.93 1.98DPP4 Dipeptidyl-peptidase 4 1.77 1.71DUSP10 Dual specificity phosphatase 10 2.91 1.71EDNRB Endothelin receptor type B 1.97 5.34FOXF1 Forkhead box F1 3.02 2.33GEM GTP binding protein overexpressed in skeletal muscle 1.92 2.25IL1RL1 Interleukin 1 receptor-like 1 3.48 3.85PAG1 Phosphoprotein associated with glycosphingolipid microdomains 1 1.55 3.83SIX1 SIX homeobox 1 2.02 1.99TGFB2 Transforming growth factor, beta 2 4.74 5.38THBD Thrombomodulin 4.74 5.38ZFP36 Zinc finger protein 36, C3H type, homolog (mouse) 2.60 2.05Response to woundingAPBB1IP Amyloid beta (A4) precursor protein-binding, family B, member 1 interacting protein 1.95 2.01BCL2 B-cell CLL/lymphoma 2 1.91 2.34CD14 CD14 molecule 5.54 3.02CD97 CD97 molecule 1.93 1.98DUSP10 Dual specificity phosphatase 10 2.91 1.71FOXF1 Forkhead box F1 3.02 2.33IGF1 Insulin-like growth factor 1 (somatomedin C) 3.10 3.81IL1RL1 Interleukin 1 receptor-like 1 3.48 3.85NINJ1 Ninjurin 1 2.05 2.02PDPN Podoplanin 2.72 2.86SPP1 Secreted phosphoprotein 1 2.26 2.21TGFB2 Transforming growth factor, beta 2 4.74 5.38THBD Thrombomodulin 5.61 3.41ZFP36 Zinc finger protein 36, C3H type, homolog (mouse) 2.6 2.05Actin cytoskeleton organizationAVIL Advillin 3.82 2.78BCL2 B-cell CLL/lymphoma 2 1.91 2.34RHOJ Ras homolog gene family, member J 1.95 1.96RHOU Ras homolog gene family, member U 3.02 4.80Cell adhesionBCL2 B-cell CLL/lymphoma 2 1.91 2.34CD97 CD97 molecule 1.93 1.98DPP4 Dipeptidyl-peptidase 4 1.77 1.71FOXF1 Forkhead box F1 3.02 2.33LGALS9 Lectin, galactoside-binding, soluble, 9 2.72 1.98NID2 Nidogen 2 (osteonidogen) 3.29 3.13NINJ1 Ninjurin 1 2.05 2.02PDPN Podoplanin 2.72 2.86SPP1 Secreted phosphoprotein 1 2.26 2.21TGFB2 Transforming growth factor, beta 2 4.74 5.38Ras protein signal transductionIGF1 Insulin-like growth factor 1 (somatomedin C) 3.10 3.81MAPK13 MITOGEN-activated protein kinase 13 4.53 3.52PLD1 phospholipase D1, phosphatidylcholine-specific 1.61 2.66RGNEF 190 kDa guanine nucleotide exchange factor 2.25 2.16RHOJ Ras homolog gene family, member J 1.95 1.96

20 L.T. Campos et al. / Journal of Steroid Biochemistry & Molecular Biology 133 (2013) 12–24
Table 3 (Continued)
Gene symbol Gene description Fold changeNAF
Fold changeCAF
RHOU Ras homolog gene family, member U 3.02 4.80Regulation of cell transductionCILP Cartilage intermediate layer protein, nucleotide pyrophosphohydrolase 5.51 5.39CYP26B1 Cytochrome P450, family 26, subfamily B, polypeptide 1 4.21 2.41DDIT4 DNA-damage-inducible transcript 4 1.77 1.70DUSP10 Dual specificity phosphatase 10 2.91 1.71GRK5 G protein-coupled receptor kinase 5 1.95 2.14IGF1 Insulin-like growth factor 1 (somatomedin C) 3.10 3.81IL1RL1 Interleukin 1 receptor-like 1 3.48 3.85LGALS9 Lectin, galactoside-binding, soluble, 9 2.72 1.98RGNEF 190 kDa guanine nucleotide exchange factor 2.25 2.16RHOJ Ras homolog gene family, member J 1.95 1.96RHOU Ras homolog gene family, member U 3.02 4.8TGFB2 Transforming growth factor, beta 2 4.74 5.38Lipid metabolic processAKR1C1 Aldo–keto reductase family 1, member C1 (dihydrodiol dehydrogenase 1; 20-alpha
(3-alpha)-hydroxysteroid dehydrogenase)1.84 2.00
AKR1C2 Aldo–keto reductase family 1, member C2 (dihydrodiol dehydrogenase 2; bile acidbinding protein; 3-alpha hydroxysteroid dehydrogenase, type III)
1.98 1.79
AKR1C3 Aldo–keto reductase family 1, member C3 (3-alpha hydroxysteroid dehydrogenase,type II)
1.39 1.66
CYP24A1 Cytochrome P450, family 24, subfamily A, polypeptide 1 512.61 298.69CYP26B1 Cytochrome P450, family 26, subfamily B, polypeptide 1 4.21 2.41GDPD5 Glycerophosphodiester phosphodiesterase domain containing 5 1.88 2.12NPC1 Niemann–Pick disease, type C1 3.27 2.21
tgwwnGRafcetpf(cet
4
ittiis1
crsdecg3
PDPN PodoplaninPLD1 Phospholipase D1, phosphatidylcholine-specificSERINC2 Serine incorporator 2
he most important genes we searched for hubs, broker and bridgeenes in the network. We have considered bridge genes the 2% onesith high bridging centrality values and broker genes the 2% onesith high brokering values. Hubs were the 2% nodes more con-ected with ≥54 partners. The best 2% broker genes were MAPK13,RB2 and BCL2 which were also hubs. The breast bridge genes wereSEA, ADA, GLGC. We also searched for genes connected by the inter-ctome (presented in Fig. 3) in the microarray platform and weound 381 genes. We finally constructed the interactions using theonnection values as the Pearson correlation between gene pairs inach NAF and CAF groups treated with 1,25D. Differences betweenhe correlations in the CAF and NAF groups were ranked for geneairs. By restricting gene pairs in which the absolute correlation dif-erences were greater than 1.5 we selected a group of 73 gene pairsSupplementary Table 7) (0.3% of all pairs selected). Fig. 4 shows thehanges in the correlation (positive or negative vice versa) of thexpression level of genes coding for interacting proteins betweenhe NAF and CAF groups.
. Discussion
Our microarray data revealed that the genomic pathway is activen CAFs as well as in NAFs, as VDR protein was detected in both ofhem and the target gene CYP24A1 was highly induced upon 1,25Dreatment. In accordance, VDR expression was previously reportedn prostate carcinoma associated fibroblasts [14]. CYP24A1 foldnduction was higher in CAFs than in NAFs, suggesting a less inten-ive response to the hormone in the tumor microenvironment as,25D may be metabolized to a less active form [29].
Although mammary fibroblasts (CAFs and NAFs) may share aommon transcriptional response to 1,25D treatment, an individualesponse was also characterized. The 1,25D responsive signaturepecific to CAFs reflected an antiproliferative effect of 1,25D byown regulation of several genes with proliferative functions. One
xample is neuregulin (NRG1) that represents the largest sub-lass of ligands of the EGF family that activates HER-2 [30]. Otherenes down regulated included WNT5A, SOX9, PDGFC, F2RL2 (PAR-) and F2R (PAR-1). Results in pulmonary fibroblasts supported2.72 2.861.61 2.662.80 2.93
a role for Wnt5a in regulating fibroblast proliferation and sur-vival [31]. SOX9, a high mobility group box transcription factordrives growth factor signal transduction [32] and the two genesassociated to cellular effects of thrombin (a multifunctional serineprotease), F2RL2 and F2R may mediate thrombin induced prolifer-ation, migration and matrix biosynthesis [33], suggesting that theantiproliferative actions of 1,25D are modulated through severaldifferent pathways. We also observed modulation of several genesassociated with response to wounding, in accordance with the pro-posed role of 1,25D in wound healing [34], and reinforcing theidea that CAFs may exhibit molecular characteristics similar to thatof activated stromal fibroblasts normally associated with woundhealing [5].
On the other hand the hormone induced the up-regulation ofboth DUSP1 and NF-KappaBIA. The former encodes a phosphatasethat specifically inactivates MAPKs and WNT5A while NF-KappaBIA,an interferon related gene codes for an inhibitor of NF-KappaBIA. Inour comparison of control CAFs vs NAFs we found several genesregulated by NF-KappaBIA such as IL-8, COX2 and IL-1ˇ, consistentwith data showing that fibroblasts may play a major role in inflam-matory processes by secretion of pro-inflammatory cytokines in anNF-kappaB-dependent manner [35]. 1,25D may exert anti inflam-matory effects by decreasing NF-kappaBIA activation, an effectpreviously reported in fibroblasts [9,10].
Addition of 1,25D to NAFs, in contrast with CAFs, induced up reg-ulation of several anti-apoptotic genes that may represent effectorsof survival. Our results are in agreement with Artaza et al. [11], whodescribed an anti-apoptotic effect of 1,25D in a multipotent mes-enchymal cell model. We also observed in NAFs an up regulationof a number of transcripts for proteins controlling immune func-tions including toll-like receptor 4 (TLR4) and of Pellino-2, one ofthe essential components in the TLR4 pathway activations consis-tent with the anti microbial activity of 1,25D [36]. Some other upregulated genes appear to be involved in ATP catabolic process
including ATP binding cassette members and enzymes involved indetoxification (GLYAT, CYP3A5, GCLC). GCLC (� glutamylcysteinesynthesis) is a rate limit enzyme, important for glutathione syn-thesis, a potent antioxidant protein. The protective role of 1,25D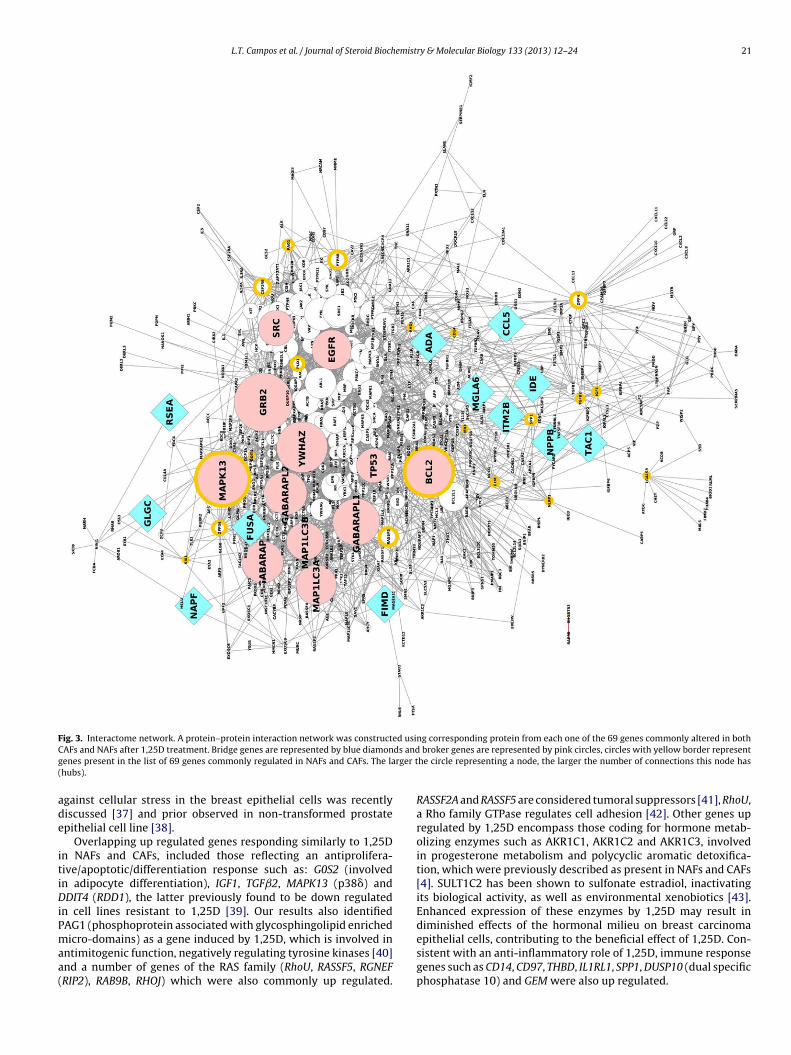
L.T. Campos et al. / Journal of Steroid Biochemistry & Molecular Biology 133 (2013) 12–24 21
Fig. 3. Interactome network. A protein–protein interaction network was constructed using corresponding protein from each one of the 69 genes commonly altered in bothC ds andg rger t(
ade
itiDiPmaa(
AFs and NAFs after 1,25D treatment. Bridge genes are represented by blue diamonenes present in the list of 69 genes commonly regulated in NAFs and CAFs. The lahubs).
gainst cellular stress in the breast epithelial cells was recentlyiscussed [37] and prior observed in non-transformed prostatepithelial cell line [38].
Overlapping up regulated genes responding similarly to 1,25Dn NAFs and CAFs, included those reflecting an antiprolifera-ive/apoptotic/differentiation response such as: G0S2 (involvedn adipocyte differentiation), IGF1, TGFˇ2, MAPK13 (p38�) andDIT4 (RDD1), the latter previously found to be down regulated
n cell lines resistant to 1,25D [39]. Our results also identifiedAG1 (phosphoprotein associated with glycosphingolipid enriched
icro-domains) as a gene induced by 1,25D, which is involved inntimitogenic function, negatively regulating tyrosine kinases [40]nd a number of genes of the RAS family (RhoU, RASSF5, RGNEFRIP2), RAB9B, RHOJ) which were also commonly up regulated.
broker genes are represented by pink circles, circles with yellow border representhe circle representing a node, the larger the number of connections this node has
RASSF2A and RASSF5 are considered tumoral suppressors [41], RhoU,a Rho family GTPase regulates cell adhesion [42]. Other genes upregulated by 1,25D encompass those coding for hormone metab-olizing enzymes such as AKR1C1, AKR1C2 and AKR1C3, involvedin progesterone metabolism and polycyclic aromatic detoxifica-tion, which were previously described as present in NAFs and CAFs[4]. SULT1C2 has been shown to sulfonate estradiol, inactivatingits biological activity, as well as environmental xenobiotics [43].Enhanced expression of these enzymes by 1,25D may result indiminished effects of the hormonal milieu on breast carcinoma
epithelial cells, contributing to the beneficial effect of 1,25D. Con-sistent with an anti-inflammatory role of 1,25D, immune responsegenes such as CD14, CD97, THBD, IL1RL1, SPP1, DUSP10 (dual specificphosphatase 10) and GEM were also up regulated.
22 L.T. Campos et al. / Journal of Steroid Biochemistry & Molecular Biology 133 (2013) 12–24
Fig. 4. Genes whose concerted expression levels distinguish CAF and NAF diagrams. Connections between two genes presented in our microarray were established based ont Herem
vtpmcCD
eweFaPiPc
mitseadcfkiGcati
il
he human interactome. Pearson correlation values were calculated for gene pairs.ore than 1.5-fold comparing NAFs and CAFs treated with 1,25D.
In accordance with other studies investigating 1,25D actions inarious cellular models, in CAFs and NAFs our data show modula-ion of several 1,25D targets already described, suggesting commonathways, irrespective of cellular types [38,39,44–47]. In agree-ent, we verified that many genes were also modulated in breast
ancer tissue slices, containing a mixture of fibroblasts (NAFs andAFs) and malignant epithelial cells, including CYP24A1, CD14,PP4, EFTUD1, G0S2, IL1RL1, and THBD.
Although some genes have been commonly differentiallyxpressed in NAFs and CAFs treated with 1,25D we could observeith the analyses of gene–gene co-expression that the co-
xpression of some of those genes was different in NAFs and CAFs.or instance the gene hNANOS1 repressed by E-cadherin encodesprotein involved in migration and invasive abilities and its pair
LD1 (phospholipase D1) encodes a protein, which is also involvedn invasion of breast cancer cells [48,49]. The gene pair NANOS1 andLD1 was positively expressed in CAFs and presented a negativeorrelation in NAFs.
To further explore the relevance of our set of 69 genes weapped them into the human interactome and we searched for
nteractions among these genes. It is important to note that usinghis network approach, we have observed alterations of coexpres-ion that would not be apparent, looking only to differentiallyxpressed genes, once these connections based on the human inter-ctome, means real interactions by protein–protein. Genes notifferentially expressed by the microarray also presented differento-expression in this network. This analysis permitted searchingor the most important genes in the network referred as hubs, bro-ers or bridges genes (Fig. 3). These groups of genes may play anmportant role in the information flow through the network [50].enes from this network that were described as brokers in that theyonnected many proteins may be important genes that are associ-ted with 1,25D effects on CAFs and NAFs. MAPK13 (p38�) is one ofhe p38MAPK isoforms which is involved in response to stress [51]
s an example of broker gene.We finally constructed the interactions based on the humannteractome, and we searched pairs present in the microarray. Ana-yzing the connection values as the Pearson correlation between
we can observe the diagrams of gene pairs that changed their co-expression value
expressed gene pairs in the CAF and NAF groups, we have identi-fied gene sets whose concerted expression could distinguish 1,25Deffects on NAFs and CAFs. One example is BCL2 that codes for ananti apoptotic protein which was differentially expressed at lowlevels in the array but was interconnected with other proteins asso-ciated to apoptosis such as: TP53, PPP2CA (protein phosphatase 2,implicated in negative control of growth), BCLAF1 (BCL2L associatedtranscription factor that induces apoptosis), BLK (protects cell fromvirally induced cell death). Correlation of the expression of BCL2with the expression of these partners was different in NAFs andCAFs (Fig. 4). These results revealed that measuring the networkmodularity that indicated altered organization and informationflow may improve the response to 1,25D.
In conclusion, CAFs and NAFs displayed differences in their pat-tern of gene expression in response to 1,25D. Even in the groupof overlapped genes we identified gene pairs displaying differen-tial expression between CAFs and NAFs suggesting that the effectsof 1,25D on normal fibroblasts are distinct from those triggered inbreast cancer associated fibroblasts.
Competing interest
The authors declare that they have no competing interests.
Acknowledgments
This study was supported by Fundacão de Amparo a PesquisaProcesso 09/10088-7, 07/04799-2 and CNPq.
The authors thank Mrs. Maria Jose Goncalves Benevides for sec-retarial help and Mrs. Cristina Pineiro Grandal for figure edition.
Appendix A. Supplementary data
Supplementary data associated with this article can befound, in the online version, at http://dx.doi.org/10.1016/j.jsbmb.2012.08.002.
emist
R
[
[
[
[
[
[
[
[
[
[
[
[
[
[
[
[
[
[
[
[
[
[
[
[
[
[
[
[
[
[
[
[
[
[
[
[
[
L.T. Campos et al. / Journal of Steroid Bioch
eferences
[1] K. Polyak, R. Kalluri, The role of the microenvironment in mammary glanddevelopment and cancer, Cold Spring Harbor Perspectives in Biology 2 (2010)a003244.
[2] H. Sugimoto, T.M. Mundel, M.W. Kieran, R. Kalluri, Identification of fibroblastheterogeneity in the tumor microenvironment, Cancer Biology and Therapy 5(2006) 1640–1646.
[3] R. Kalluri, M. Zeisberg, Fibroblasts in cancer, Nature Reviews. Cancer 6 (2006)392–401.
[4] M. Bauer, G. Su, C. Casper, R. He, W. Rehrauer, A. Friedl, Heterogeneity ofgene expression in stromal fibroblasts of human breast carcinomas and normalbreast, Oncogene 29 (2010) 1732–1740.
[5] A. Orimo, P.B. Gupta, D.C. Sgroi, F. Arenzana-Seisdedos, T. Delaunay, R.Naeem, V.J. Carey, A.L. Richardson, R.A. Weinberg, Stromal fibroblastspresent in invasive human breast carcinomas promote tumor growth andangiogenesis through elevated SDF-1/CXCL12 secretion, Cell 121 (2005)335–348.
[6] P.B. Rozenchan, D.M. Carraro, H. Brentani, L.D. de Carvalho Mota, E.P. Bastos,E.N. e Ferreira, C.H. Torres, M.L. Katayama, R.A. Roela, E.C. Lyra, F.A. Soares, M.A.Folgueira, J.C. Goes, M.M. Brentani, Reciprocal changes in gene expression pro-files of cocultured breast epithelial cells and primary fibroblasts, InternationalJournal of Cancer 125 (2009) 2767–2777.
[7] J. Welsh, Vitamin D metabolism in mammary gland and breast cancer, Molec-ular and Cellular Endocrinology 347 (2011) 55–60.
[8] D. Matthews, E. LaPorta, G.M. Zinser, C.J. Narvaez, J. Welsh, Genomic vita-min D signaling in breast cancer: insights from animal models and humancells, Journal of Steroid Biochemistry and Molecular Biology 121 (2010)362–367.
[9] H. Harant, B. Wolff, I.J. Lindley, 1Alpha,25-dihydroxyvitamin D3 decreases DNAbinding of nuclear factor-kappaB in human fibroblasts, FEBS Letters 436 (1998)329–334.
10] F.L. Szeto, J. Sun, J. Kong, Y. Duan, A. Liao, J.L. Madara, Y.C. Li, Involvementof the vitamin D receptor in the regulation of NF-kappaB activity in fibro-blasts, Journal of Steroid Biochemistry and Molecular Biology 103 (2007)563–566.
11] J.N. Artaza, F. Sirad, M.G. Ferrini, K.C. Norris, 1,25(OH)2vitamin D3 inhibits cellproliferation by promoting cell cycle arrest without inducing apoptosis andmodifies cell morphology of mesenchymal multipotent cells, Journal of SteroidBiochemistry and Molecular Biology 119 (2010) 73–83.
12] A.M. Ramirez, C. Wongtrakool, T. Welch, A. Steinmeyer, U. Zugel, J. Roman, Vita-min D inhibition of pro-fibrotic effects of transforming growth factor beta1in lung fibroblasts and epithelial cells, Journal of Steroid Biochemistry andMolecular Biology 118 (2010) 142–150.
13] Y.R. Lou, I. Laaksi, H. Syvala, M. Blauer, T.L. Tammela, T. Ylikomi, P. Tuohi-maa, 25-Hydroxyvitamin D3 is an active hormone in human primary prostaticstromal cells, FASEB Journal 18 (2004) 332–334.
14] A.A. Hidalgo, V.P. Montecinos, R. Paredes, A.S. Godoy, E.M. McNerney, H. Tovar,D. Pantoja, C. Johnson, D. Trump, S.A. Onate, Biochemical characterization ofnuclear receptors for vitamin D3 and glucocorticoids in prostate stroma cellmicroenvironment, Biochemical and Biophysical Research Communications412 (2011) 13–19.
15] D. Pilling, T. Fan, D. Huang, B. Kaul, R.H. Gomer, Identification of markers thatdistinguish monocyte-derived fibrocytes from monocytes, macrophages, andfibroblasts, PLoS One 4 (2009) e7475.
16] R.D.C. Team, R: A Language and Environment for Statistical Computing, R Foun-dation for Statistical Computing, Vienna, Austria, 2009.
17] T.S. Prasad, K. Kandasamy, A. Pandey, Human Protein Reference Database andHuman Proteinpedia as discovery tools for systems biology, Methods in Molec-ular Biology 577 (2009) 67–79.
18] A. Chatr-aryamontri, A. Ceol, L.M. Palazzi, G. Nardelli, M.V. Schneider, L. Castag-noli, G. Cesareni, MINT: the Molecular INTeraction database, Nucleic AcidsResearch 35 (2007) D572–D574.
19] B. Aranda, P. Achuthan, Y. Alam-Faruque, I. Armean, A. Bridge, C. Derow, M.Feuermann, A.T. Ghanbarian, S. Kerrien, J. Khadake, J. Kerssemakers, C. Leroy,M. Menden, M. Michaut, L. Montecchi-Palazzi, S.N. Neuhauser, S. Orchard, V.Perreau, B. Roechert, K. van Eijk, H. Hermjakob, The IntAct molecular interactiondatabase in 2010, Nucleic Acids Research 38 (2010) D525–D531.
20] W. Hwang, Y. Cho, A. Zhang, M. Ramanathan, Bridging centrality: identify-ing bridging nodes in scale-free networks, in: Proceedings of the 12th ACMSIGKDD International Conference on Knowledge Discovery and Data Mining,KDD, Philadelphia, PA, 2006, pp. 20–23.
21] S.C. Lebret, D.F. Newgreen, E.W. Thompson, M.L. Ackland, Induction of epithe-lial to mesenchymal transition in PMC42-LA human breast carcinoma cellsby carcinoma-associated fibroblast secreted factors, Breast Cancer Research9 (2007) R19.
22] A. Sadlonova, D.B. Bowe, Z. Novak, S. Mukherjee, V.E. Duncan, G.P. Page, A.R.Fros, Identification of molecular distinctions between normal breast-associatedfibroblasts and breast cancer-associated fibroblasts, Cancer Microenvironment2 (2009) 9–21.
23] D.C. Smith, C.S. Johnson, C.C. Freeman, J. Muindi, J.W. Wilson, D.L. Trump,
A Phase I trial of calcitriol (1,25-dihydroxycholecalciferol) in patients withadvanced malignancy, Clinical Cancer Research 5 (1999) 1339–1345.24] H. Okuda, A. Kobayashi, B. Xia, M. Watabe, S.K. Pai, S. Hirota, F. Xing, W. Liu,P.R. Pandey, K. Fukuda, V. Modur, A. Ghosh, A. Wilber, K. Watabe, Hyaluro-nan synthase HAS2 promotes tumor progression in bone by stimulating the
[
ry & Molecular Biology 133 (2013) 12–24 23
interaction of breast cancer stem-like cells with macrophages and stromal cells,Cancer Research 72 (2012) 537–547.
25] C. Milani, J. Welsh, M.L. Katayama, E.C. Lyra, M.S. Maciel, M.M. Brentani, M.A.Folgueira, Human breast tumor slices: a model for identification of vitamin Dregulated genes in the tumor microenvironment, Journal of Steroid Biochem-istry and Molecular Biology 121 (2010) 151–155.
26] C. Milani, Efeito da Vitamina D no perfil transcricional de culturaorganotípica de câncer de mama, PhD Tesis, Universidade de São Paulo Fac-uldade de Medicina, 2011. www.teses.usp.br/teses/disponiveis/5/5155/tde-19032010-115152/
27] I.W. Taylor, R. Linding, D. Warde-Farley, Y. Liu, C. Pesquita, D. Faria, S. Bull,T. Pawson, Q. Morris, J.L. Wrana, Dynamic modularity in protein interactionnetworks predicts breast cancer outcome, Nature Biotechnology 27 (2009)199–204.
28] A.L. Barabasi, Z.N. Oltvai, Network biology: understanding the cell’s functionalorganization, Nature Reviews. Genetics 5 (2004) 101–113.
29] K. Townsend, C.M. Banwell, M. Guy, K.W. Colston, J.L. Mansi, P.M. Ste-wart, M.J. Campbell, M. Hewison, Autocrine metabolism of vitamin D innormal and malignant breast tissue, Clinical Cancer Research 11 (2005)3579–3586.
30] J.C. Montero, R. Rodriguez-Barrueco, A. Ocana, E. Diaz-Rodriguez, A.Esparis-Ogando, A. Pandiella, Neuregulins and cancer, Clinical Cancer Research14 (2008) 3237–3241.
31] L.J. Vuga, A. Ben-Yehudah, E. Kovkarova-Naumovski, T. Oriss, K.F. Gibson, C.Feghali-Bostwick, N. Kaminski, WNT5A is a regulator of fibroblast proliferationand resistance to apoptosis, American Journal of Respiratory Cell and MolecularBiology 41 (2009) 583–589.
32] G. Chakravarty, K. Moroz, N.M. Makridakis, S.A. Lloyd, S.E. Galvez, P.R. Canavello,M.R. Lacey, K. Agrawal, D. Mondal, Prognostic significance of cytoplasmic SOX9in invasive ductal carcinoma and metastatic breast cancer, Experimental Biol-ogy and Medicine (Maywood, NJ) 236 (2011) 145–155.
33] K. Schror, E. Bretschneider, K. Fischer, J.W. Fischer, R. Pape, B.H. Rauch, A.C.Rosenkranz, A.A. Weber, Thrombin receptors in vascular smooth muscle cells– function and regulation by vasodilatory prostaglandins, Thrombosis andHaemostasis 103 (2010) 884–890.
34] X.Q. Tian, T.C. Chen, M.F. Holick, 1,25-Dihydroxyvitamin D3: a novel agentfor enhancing wound healing, Journal of Cellular Biochemistry 59 (1995)53–56.
35] N. Erez, M. Truitt, P. Olson, S.T. Arron, D. Hanahan, Cancer-associated fibro-blasts are activated in incipient neoplasia to orchestrate tumor-promotinginflammation in an NF-kappaB-dependent manner, Cancer Cell 17 (2010)135–147.
36] Y. Liu, W. Dong, L. Chen, R. Xiang, H. Xiao, G. De, Z. Wang, Y. Qi,BCL10 mediates lipopolysaccharide/toll-like receptor-4 signaling throughinteraction with Pellino2, Journal of Biological Chemistry 279 (2004)37436–37444.
37] X. Peng, A. Vaishnav, G. Murillo, F. Alimirah, K.E. Torres, R.G. Mehta, Protec-tion against cellular stress by 25-hydroxyvitamin D3 in breast epithelial cells,Journal of Cellular Biochemistry 110 (2010) 1324–1333.
38] P.L. Kovalenko, Z. Zhang, M. Cui, S.K. Clinton, J.C. Fleet, 1,25 dihydroxyvitaminD-mediated orchestration of anticancer, transcript-level effects in the immor-talized, non-transformed prostate epithelial cell line, RWPE1, BMC Genomics11 (2010) 26.
39] J.L. Costa, P.P. Eijk, M.A. van de Wiel, D. ten Berge, F. Schmitt, C.J. Nar-vaez, J. Welsh, B. Ylstra, Anti-proliferative action of vitamin D in MCF7is still active after siRNA-VDR knock-down, BMC Genomics 10 (2009)499.
40] K. Suzuki, C. Oneyama, H. Kimura, S. Tajima, M. Okada, Down-regulation of thetumor suppressor C-terminal Src kinase (Csk)-binding protein (Cbp)/PAG1 ismediated by epigenetic histone modifications via the mitogen-activated pro-tein kinase (MAPK)/phosphatidylinositol 3-kinase (PI3K) pathway, Journal ofBiological Chemistry 286 (2011) 15698–15706.
41] M.D. Vos, A. Martinez, C. Elam, A. Dallol, B.J. Taylor, F. Latif, G.J. Clark, A role forthe RASSF1A tumor suppressor in the regulation of tubulin polymerization andgenomic stability, Cancer Research 64 (2004) 4244–4250.
42] S. Ory, H. Brazier, A. Blangy, Identification of a bipartite focal adhesion localiza-tion signal in RhoU/Wrch-1, a Rho family GTPase that regulates cell adhesionand migration, Biology of the Cell 99 (2007) 701–716.
43] S. Aust, P. Obrist, M. Klimpfinger, G. Tucek, W. Jager, T. Thalhammer, Alteredexpression of the hormone- and xenobiotic-metabolizing sulfotransferaseenzymes 1A2 and 1C1 in malignant breast tissue, International Journal of Oncol-ogy 26 (2005) 1079–1085.
44] S. Swami, N. Raghavachari, U.R. Muller, Y.P. Bao, D. Feldman, Vitamin Dgrowth inhibition of breast cancer cells: gene expression patterns assessedby cDNA microarray, Breast Cancer Research and Treatment 80 (2003)49–62.
45] K. Townsend, V. Trevino, F. Falciani, P.M. Stewart, M. Hewison, M.J. Camp-bell, Identification of VDR-responsive gene signatures in breast cancer cells,Oncology 71 (2006) 111–123.
46] H.J. Lee, H. Liu, C. Goodman, Y. Ji, H. Maehr, M. Uskokovic, D. Notterman, M. Reiss,N. Suh, Gene expression profiling changes induced by a novel Gemini Vitamin D
derivative during the progression of breast cancer, Biochemical Pharmacology72 (2006) 332–343.47] B. Byrne, J. Welsh, Identification of novel mediators of Vitamin D signaling and1,25(OH)2D3 resistance in mammary cells, Journal of Steroid Biochemistry andMolecular Biology 103 (2007) 703–707.

2 emist
[
[
4 L.T. Campos et al. / Journal of Steroid Bioch
48] K. Strumane, A. Bonnomet, C. Stove, R. Vandenbroucke, B. Nawrocki-Raby, E.
Bruyneel, M. Mareel, P. Birembaut, G. Berx, F. van Roy, E-cadherin regulateshuman Nanos1, which interacts with p120ctn and induces tumor cell migrationand invasion, Cancer Research 66 (2006) 10007–10015.49] D.W. Kang, M.H. Park, Y.J. Lee, H.S. Kim, C.W. Lindsley, H. Alex Brown, S. Min do,Autoregulation of phospholipase D activity is coupled to selective induction
[
[
ry & Molecular Biology 133 (2013) 12–24
of phospholipase D1 expression to promote invasion of breast cancer cells,
International Journal of Cancer 128 (2011) 805–816.50] J.J. Cai, E. Borenstein, D.A. Petrov, Broker genes in human disease, GenomeBiology and Evolution 2 (2010) 815–825.
51] A. Risco, A. Cuenda, New insights into the p38� and p38� MAPK pathways,Journal of Signal Transduction 2012 (2012) 520289.