differences in vertical and horizontal distribution of...
TRANSCRIPT

General rights Copyright and moral rights for the publications made accessible in the public portal are retained by the authors and/or other copyright owners and it is a condition of accessing publications that users recognise and abide by the legal requirements associated with these rights.
• Users may download and print one copy of any publication from the public portal for the purpose of private study or research. • You may not further distribute the material or use it for any profit-making activity or commercial gain • You may freely distribute the URL identifying the publication in the public portal
If you believe that this document breaches copyright please contact us providing details, and we will remove access to the work immediately and investigate your claim.
Downloaded from orbit.dtu.dk on: Jun 11, 2018
Differences in vertical and horizontal distribution of fish larvae and zooplankton,related to hydrography
Höffle, Hannes; Nash, Richard D.M.; Falkenhaug, Tone; Munk, Peter
Published in:Marine Biology Research
Link to article, DOI:10.1080/17451000.2013.765576
Publication date:2013
Link back to DTU Orbit
Citation (APA):Höffle, H., Nash, R. D. M., Falkenhaug, T., & Munk, P. (2013). Differences in vertical and horizontal distributionof fish larvae and zooplankton, related to hydrography. Marine Biology Research, 9(7), 629-644. DOI:10.1080/17451000.2013.765576

1
1
Differences in vertical and horizontal distribution of fish larvae 2
and zooplankton, related to hydrography 3
4
HANNES HÖFFLE1*, RICHARD D. M. NASH2, TONE FALKENHAUG3, & PETER 5
MUNK1 6
7
8
1DTU Aqua, National Institute of Aquatic Resources, Technical University of Denmark, 9
Charlottenlund, Denmark 10
2Institute of Marine Research Bergen, Norway 11
3Institute of Marine Research, Flødevigen, His, Norway 12
13
*Correspondence. Institute of Marine Research, PO Box 1870 Nordnes, 5817 Bergen, 14
Norway. [email protected] 15
16
Running head: Vertical distribution of fish larvae in the North Sea. 17
18
19
20
21

2
Abstract 22
Planktonic fish larvae have little influence on their horizontal distribution, while they are able 23
to control their vertical position in the water column. While prey and light are among the 24
factors with an apparent influence on the vertical distribution, the effects of other factors are 25
less clear. Notably, distributional differences between larvae of different fish species are 26
poorly understood. Information on the horizontal distribution of larvae of 27 species and the 27
vertical distribution of seven species of Gadidae, two Pleuronectidae and one Scopthalmidae, 28
was compiled from one survey in the northern North Sea. Horizontally, fish larvae 29
aggregated near frontal structures, correlating with high densities of zooplankton. Increasing 30
length and decreasing numbers indicated an origin in the western North Sea, followed by an 31
eastward drift. Vertically, the different species exhibited similarities but also notable 32
differences in their vertical distribution. Most gadoid species aggregated in the upper (<40 m) 33
or middle water column (>40 m) during the day with an increase in abundance at shallower 34
depths during the night, while all flatfish were distributed at greater depths under all light 35
conditions. Hence, larvae differed in their distributional patterns, but the relative depth 36
distributions among the species in the larval community generally remained constant. 37
38
Keywords: Fish larvae, Gadidae, Flatfish, Vertical distribution, North Sea 39
40

3
Introduction 41
Compared to current speeds the swimming ability of fish larvae is of minor importance, 42
limiting their capability to influence their location by horizontal swimming. However, larvae 43
can migrate vertically in the water column and so influence their horizontal transport, as 44
current speed and direction often changes with depth (Fortier & Leggett 1983; Sclafani et al. 45
1993).Vertical migration patterns of fish larvae can be broadly classified into three 46
categories: i) type I migrations as upward movement at the beginning of night and downward 47
movement at the beginning of day; ii) type II as the opposite (Neilson & Perry 1990) and iii) 48
a pattern of aggregation during the day and dispersal throughout the night (Gray 1998; Leis 49
1991; Olivar & Sabatés 1997). Exogenous factors that influence the observed patterns are, for 50
example, light, prey and predator distribution, as well as effects of temperature and salinity. 51
Individuals of given species and congeners often exhibit similar distribution patterns, 52
regardless of the prevailing environmental conditions and form distinct assemblages in 53
different depth strata (Gray & Kingsford 2003; Olivar & Sabatés 1997; Röpke 1993; 54
Southward & Barrett 1983). Size and consequently swimming ability, important for 55
determining vertical distribution, changes throughout development and many species exhibit 56
different vertical behaviours as the larvae develop (c. f. Table 1; Neilson & Perry 1990). 57
Lough and Potter (1993) observed the initiation of vertical migration in cod (Gadus morhua 58
Linnaeus, 1758) and haddock (Melanogrammus aeglefinus Linnaeus, 1758) at standard 59
lengths (SL) of 6-8 mm, and a firmly established type I migration at lengths greater than 9 60
mm SL. Smaller larvae and particularly those in poor condition may be more strongly 61
influenced by buoyancy (Sclafani et al. 1993). However, even in their earliest stages, larvae 62
will migrate if unfavourable conditions make it necessary (Grønkjær & Wieland 1997). The 63
influence of hydrography, in particular the position of the thermocline, is less clear. Some 64
studies indicate a connection between larval distributions and the thermocline for certain taxa 65

4
(Olivar & Sabatés 1997) and/or size classes (Lough et al. 1996; Lough & Potter 1993), while 66
others show the same distributional patterns, both of single taxa and larval assemblages, 67
irrespective of water column stratification (Gray 1998; Gray & Kingsford 2003). Gray and 68
Kingsford (2003) attributed their failure to find a relationship between distributions and the 69
thermocline, to a combination of the gradual and ephemeral character of thermoclines in their 70
study region and the lag-phase between the occurrence of hydrographic cues and the reaction 71
of the larvae. 72
73
The influence of prey and predator distributions was pointed out by Pearre (1973) who, based 74
on his studies of an arrow worm Sagitta elegans (Verrill, 1873), introduced the hunger-75
satiation hypothesis. In this case vertical movements were related to the concurrent needs of 76
feeding in the upper water column and hiding from visual predators at greater depths. The 77
hypothesis was later applied to other planktonic organisms, including fish larvae (Pearre 78
2003). Visually hunting fish larvae can follow different strategies to satisfy these needs. They 79
may rise in the water column at night, together with their zooplankton prey or may stay 80
deeper and feed on vertically migrating prey (Lovetskaya 1953). Neilson and Perry (1990) 81
suggested a feeding/avoidance window at dusk and dawn, when light conditions are sufficient 82
for feeding but predators may still be at greater depths. The influence of light differs among 83
species. Some species appear to select a specific isolume, which primarily governs their 84
vertical distribution (Woodhead 1966). This has been suggested as the cause of aggregations 85
during the day and diffuse distribution during the night when the primary cue is missing (Leis 86
1991). However, the effect of light is species specific as has been shown in concurrent 87
laboratory studies (Catalán et al. 2011; Vollset et al. , in press), for example some species are 88
shown to be adapted to low illumination (e.g. Downing & Litvak 2001; Huse 1994; Yoon et 89
al. 2010). 90

5
Statistical models of the vertical distribution of different taxa have high predictive power 91
with several interacting factors (Hernandez et al. 2009) and even when only using a single 92
factor (Huebert et al. 2010). Control by a single factor is, however, rare. While prey 93
abundance was one controlling factor for mesopelagic larvae in the Arabian Sea (Röpke 94
1993) and for Sardinella aurita (Valenciennes, 1847) in the northwestern Mediterranean Sea 95
(Sabatés et al. 2008), the fish species were also limited by physical factors. The mesopelagic 96
species were limited by a warm mixed layer above, and S. aurita most likely by the cool (ca. 97
15°C) water below the pycnocline. The vertical distribution of larvae will influence 98
horizontal transport, as different currents at different depths might lead to retention within or 99
a displacement out of an area (Fortier & Leggett 1982; Fortier & Leggett 1983; Govoni & 100
Pietrafesa 1994) and several studies have shown aggregations of fish larvae in or near fronts 101
(Kiørboe et al. 1988; Munk et al. 2002; Sabatés 1990). Likewise, food availability, the 102
relationship between illumination and prey abundance, is correlated with the distribution of 103
Baltic cod larvae (Grønkjær & Wieland 1997). 104
Considering the apparent species differences in vertical distributions and migrations, a 105
comparative approach might elucidate the factors that are of prime importance. Few studies 106
have analysed the distributional patterns of a wide range of species in a comparative way 107
(Frank et al. 1992; Gray 1996; Gray & Kingsford 2003). Such an opportunity was available 108
in the northern North Sea in 2010. The area east of the Shetland Isles is particularly species 109
rich (Economou 1987) with an assemblage primarily consisting of Gadidae, Lotidae, 110
Pleuronectidae and Scophthalmidae. In regard to abundance, the dominant species were 111
whiting, ling (Molva molva, Linnaeus, 1758), Norway redfish (Sebastes viviparus, Krøyer, 112
1845) and Norway pout. It is an important spawning ground for several fish species which 113
spawn in spring and we were able to describe both the major horizontal distributional patterns 114
from transects of stations, and the vertical patterns by vertical stratified sampling over an 18 115

6
hour period. In this contribution we focus on the distributional patterns of larval fish in 116
relation to hydrography and in relation to the distribution of zooplankton 180 - 1000 µm. We 117
hypothesize that relative to each other larvae of different species would retain their position 118
in the water column. 119
120
Materials and Methods 121
Field sampling 122
Sampling was undertaken on the RV G.O. Sars (IMR, Bergen, Norway), between 25th April 123
and 5th of May 2010, covering transects between 59.3 and 60.75oN (Figure 1). Five additional 124
stations were sampled over the course of 18 hours in a 5 x 5 nautical miles (NM) sized area 125
(designated 18h-station) east of the Shetland Islands. 126
Depth integrated samples were taken in double oblique hauls with a 76 cm diameter GULF 127
VII high speed sampler (Nash et al. 1998), down to about 100 m depth. The sampler was 128
equipped with a mechanical flow meter (General Oceanics, USA) in the mouth of the nose 129
cone. A SCANMAR depth sensor was attached to the sampler and provided both depth and 130
temperature measurements. For discrete depth sampling, a MOCNESS (Wiebe et al. 1985) 131
with a 1 m2 opening and 4 nets (180 µm mesh) was deployed to ca. 100 m and then hauled 132
obliquely to the surface, sampling the water column in strata with nets opening at about 100, 133
75, 40 and 20 m. Flow meters and a CTD were attached to the MOCNESS and the filtered 134
volume (m3) estimated for each stratum. Larvae were sorted on board and were preserved in 135
borax buffered 4% formaldehyde. Zooplankton was split in two fractions before preservation, 136
using a Motoda splitting device. One half was preserved for identification and enumeration 137
whilst the other half was size fractioned into <1000 µm, 1000-2000 µm and >2000 µm 138

7
samples. Each size fraction was dried at 60°C to constant weight in order to obtain dry 139
weights, which were converted to milligrams dry weight per m3 (mg DW m-3) based on the 140
volume of water filtered and to g DW m-2 based on filtered volume and sampled depth. 141
142
Laboratory procedures 143
The preserved larvae were cleaned of formalin under running water for 10-15 minutes. All 144
larvae were then identified to the lowest taxonomic level, using either Russell (1976), 145
Schmidt (1906) or Munk and Nielsen (2005). Standard length (SL; tip of the snout to the end 146
of the notochord) was measured to the nearest 0.1 mm with an ocular micrometer. To correct 147
for shrinking, live SL was calculated using the equation from Bolz and Lough (1984), after 148
correcting for formalin shrinkage (Theilacker 1980). 149
150
Data treatment and analysis 151
Density anomaly (σt) was calculated according to UN standards (Millero & Poisson 1981) 152
from temperature and salinity measured by CTD casts during the transects. The vertical 153
profiles of calculated densities were interpolated on a regular grid (0.5° x 5 m) with kriging in 154
Surfer 8 (Golden Software 2002), while contour plots were constructed in Sigmaplot 12 155
(Systat Software 2011). The vertical profiles for the five hauls at the 18h-station are given as 156
line graphs. 157
For each species in the depth integrated hauls, the catch was converted to nos. m-2 by dividing 158
by the filtered volume and multiplying by the maximum sampler depth. Catch of larvae in the 159
depth discrete hauls was converted to nos. m-3 by dividing by the filtered volume in a given 160
8
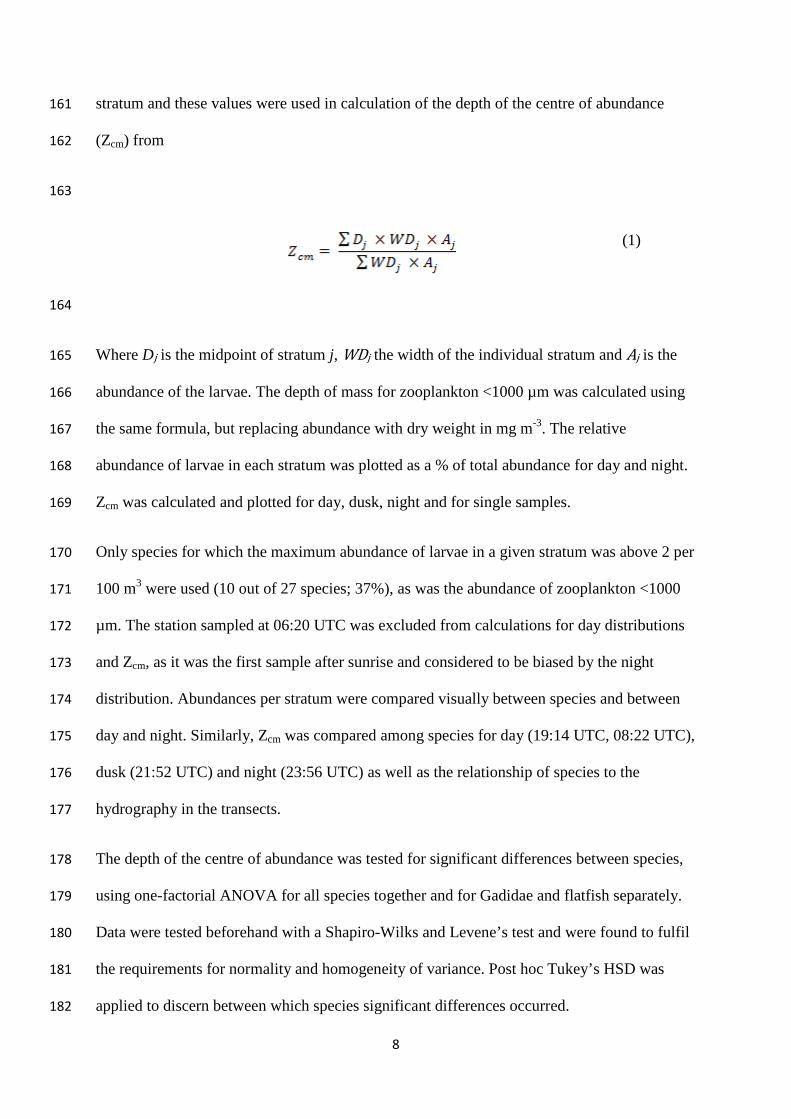
stratum and these values were used in calculation of the depth of the centre of abundance 161
(Zcm) from 162
163
(1)
164
Where Dj is the midpoint of stratum j, WDj the width of the individual stratum and Aj is the 165
abundance of the larvae. The depth of mass for zooplankton <1000 µm was calculated using 166
the same formula, but replacing abundance with dry weight in mg m-3. The relative 167
abundance of larvae in each stratum was plotted as a % of total abundance for day and night. 168
Zcm was calculated and plotted for day, dusk, night and for single samples. 169
Only species for which the maximum abundance of larvae in a given stratum was above 2 per 170
100 m3 were used (10 out of 27 species; 37%), as was the abundance of zooplankton <1000 171
µm. The station sampled at 06:20 UTC was excluded from calculations for day distributions 172
and Zcm, as it was the first sample after sunrise and considered to be biased by the night 173
distribution. Abundances per stratum were compared visually between species and between 174
day and night. Similarly, Zcm was compared among species for day (19:14 UTC, 08:22 UTC), 175
dusk (21:52 UTC) and night (23:56 UTC) as well as the relationship of species to the 176
hydrography in the transects. 177
The depth of the centre of abundance was tested for significant differences between species, 178
using one-factorial ANOVA for all species together and for Gadidae and flatfish separately. 179
Data were tested beforehand with a Shapiro-Wilks and Levene’s test and were found to fulfil 180
the requirements for normality and homogeneity of variance. Post hoc Tukey’s HSD was 181
applied to discern between which species significant differences occurred. 182

9
Results 183
Hydrography 184
Along both transects we observed a cool (<7oC), low saline (<34) surface layer over the 185
Norwegian trench, extending to ca. 50 m depth (Figure 2), representing the Norwegian 186
Coastal Current (NCC). Coldest temperatures occurred at ca. 30 m, while lowest salinities 187
and densities were at about 10 m depth (Figures 2a, b). Correspondingly, σt was increasing 188
with depth and ranged from 25.5 kg m-3 to 27 kg m-3. Beneath the NCC water, the 189
temperature increased down to 200-300 m, while at greater depths temperatures fell below 190
7oC and σt rose to 27.6 in the deepest parts of the Norwegian trench. On the shallow plateau, 191
between 1oW and 3oE, temperature changed markedly with depth, while salinity was almost 192
homogenous throughout the water column, except for the eastern margins. In the southern 193
transect a thermocline at about 50 m was separating water of >7°C and σt of 27.5 kg m-3 from 194
cooler and denser water below. In the northern transect the warmer water reached down to a 195
depth of 100 m and the thermocline was less strong. On the western margins of the southern 196
transect water temperature increased rapidly between 0.5°W and 1°W, while salinity 197
decreased from about 1.7°W westwards. Together this led to the formation of a frontal 198
structure. In the North, temperature increased more gradually, while salinity did not change. 199
Overall the highest temperatures were measured at >8°C on the western margins. Throughout 200
the northern transect the surface water exhibited a σt of <27.5 kg m-3 while on the western 201
margin these lower densities reached down to a hundred metres. 202
The hydrography at the 18h-station exhibited little variability in time or depth (Figure 3). 203
Salinity was relatively high and stable, only changing from 35.32 to 35.33 in the sampled 204
water column of 120 m. The temperature likewise varied little; it was about 8oC to 50 m and 205

10
then declined continuously to 7.6°C. Fluorescence peaked at 0.12 µg L-1, but estimates varied 206
during the period of investigation. 207
208
Horizontal distribution - zooplankton 209
At the stations closest to the Norwegian trench the total zooplankton concentration in both 210
transects ranged between 3.7 g DW m-2 and 5.0 g DW m-2. Peak zooplankton concentrations 211
were found at the stations near 1°E, 30.5 g DW m-2 in the South and 38.7 g DW m-2 in the 212
North. However, at these stations the distribution between size fractions differed. While at the 213
northern station, the zooplankton biomass was nearly equally distributed between the three 214
different size fractions (Table 1), at the southern station the bulk of the zooplankton (20.1 g 215
DW m-2) was in the 1000 – 2000 µm size fraction, while the zooplankton <1000 µm was at 216
7.1 g DW m-2 and the >2000 µm size fraction was at 3.2 g DW m-2. At the westernmost 217
stations zooplankton concentrations were again lower, with 19.9 g DW m-2 in the southern 218
and 11.7 g DW m-2 in the northern transect for all size fractions combined. 219
220
Horizontal distribution – fish larvae 221
During the survey, a total of 2030 fish larvae of 27 species in 9 families were identified 222
(Table 2). Species richness and abundance of fish larvae increased from east to west. In the 223
area of the Norwegian trench, abundances were mostly <30 m-2 (Figures 2a, b). In this area 224
there were no flatfish and there were only gadoid larvae close to the western slope of the 225
trench. Over the shallow plateau abundances were mostly low ( <10 m-2), however long 226
rough dab (Hippoglossoides platessoides Fabricius, 1780) and Norway pout (Trisopterus 227
esmarkii Nilsson, 1855) occurred at abundances of ca. 200 m-2 and 300 m-2, respectively. 228

11
Both the stations with these high abundances were at the boundary of salinities between 35 229
and 35.2, where also sharp changes in σt and high concentrations of zooplankton <1000 µm 230
(7.1 g DW m-2 and 5.1 g DW m-2) were observed. Along the northern transect larval 231
abundance and species diversity increased from the western slope of the Norwegian trench 232
westward to ca. 1oE, up to a maximum abundance of 500 m-2 (Figure 2b), coinciding with 233
peak zooplankton densities. Along both transects the dominant species was Norway pout, 234
followed by whiting (Merlangius merlangus Linnaeus, 1758). Flatfish of the families 235
Pleuronectidae and Scophthalmidae were more abundant and species rich at the northern 236
transect than at the southern. Notably, Ammodytidae of 3 species were limited to the southern 237
transect with only lesser sandeel (Ammodytes marinus Raitt, 1934) at >10 m-2. Ling (Molva 238
molva Linnaeus, 1758) was found in high abundance, (33.3 m-2), at one station of the 239
northern transect, but did not occur elsewhere (Table 2a). 240
At the single location between the two transects whiting was almost twice as abundant as 241
Norway pout, while other gadoids were much less abundant (<20 m-2) than either of these 242
(Table 2c). Blue ling (Molva dipterygia Pennant, 1784) and northern rockling (Ciliata 243
septentrionalis Collett, 1875) were found in abundances over 20 m-2. Flatfish were similarly 244
species rich and abundant as in the northern transect. Long rough dab and brill 245
(Scolphthalmus rhombus Linnaeus, 1758) were most abundant, with 25.2 m-2 and 18.6 m-2, 246
respectively. Clupeidae, Argentinidae and Gobiidae occurred sporadically along the transects 247
as well as at the 18h-station, in some hauls and in high numbers (Table 2). 248
249
Vertical distribution – 18 hours station 250
Changes in zooplankton distribution between day and night varied between the size fractions. 251
While the distribution of zooplankton <1000 µm varied only little (Figures 3b, c and 4) and 252

12
being most abundant in the two topmost strata (>30% each), coincided positively with the 253
level of fluorescence. The larger size fractions exhibited stronger differences (Figures 3b, c), 254
particularly the 1000 – 2000 µm fraction which was proportionally most abundant in the 0 – 255
20 m stratum during the day and almost homogenously distributed during the night. The trend 256
towards a larger proportion in the deep strata during the night was common for all size 257
fractions and was reflected in the depth of the mass of the small zooplankton which was 258
relatively stable at around 40 m with noticeable but small deviations at night (Fig. 6) and 259
when incorporating the station at 06:20 UTC (Fig. 7). 260
Seven gadoids and three flatfish species occurred in sufficient numbers to examine their 261
vertical distribution. Cod was absent from the sample taken at dusk, otherwise all species 262
occurred in all hauls. One group of gadoid larvae, consisting of cod (Gadus morhua), 263
haddock (Melanogrammus aeglefinus), whiting and pollock (Pollachius pollachius Linnaeus, 264
1758), was distributed in the upper water column (0 – 40 m) during day and night. Cod (62%) 265
and haddock (52%) were most abundant at 0 – 20 m during the day and at 20 – 40 m at night, 266
with 100% and 69% respectively (Figures 4a, b). For whiting (Figure 4c) and pollock (Figure 267
4d) the change between these strata was reversed, as their abundance increased by 32 and 38 268
percent at 0 – 20 m during the night. While cod was never found below 40 m depth, the other 269
species occurred in the deeper strata and ascended to shallower depths at night, Zcm decreased 270
accordingly (Figures 6a, 7a). 271
Saithe (Pollachius virens Linnaeus, 1758) and the two Trisopterus species (Figures 4e, g) 272
were distributed in the strata below 40 m during the day. During the night saithe and poor cod 273
(Trisopterus minutus Linnaeus, 1758) were most common in the upper water column, while 274
53% of Norway pout larvae remained at 75 – 100 m depth. 275

13
In daylight all three flatfish species, witch (Glyptocephalus cynoglossus Linnaeus, 1758), 276
brill and long rough dab were most abundant at 40 – 75 m depth (Figure 5), varying between 277
45% for witch and 57% for brill. During the night, witch and long rough dab were most 278
abundant in the upper water column, peaking with 47% at 0 – 20 m and 77% at 20 – 40 m, 279
respectively. Brill remained most abundant at 40 – 75 m depth. 280
Except for brill, most larvae fell into a size range between 3 and 9 mm (Figs 8 - 10), with 281
larger larvae occurring at low numbers. Brill was much more common at standard lengths of 282
2 - 3 mm than other species, while no brill larvae were longer than 5 mm. Even such small 283
larvae exhibited substantial changes in their distribution across depth strata (Figure 10), 284
indicating that they were capable of controlling their position in the water column. With 285
increasing standard length, whiting exhibited a tendency to be proportionally more common 286
in the 0 – 20 m stratum, which was particularly noticeable at night (Figure 8). Norway pout, 287
the other gadoids found over a wide size range, did not exhibit such a trend and between 4 288
and 7 mm length exhibited a reversed trend of a larger proportion in the 20 – 40 m stratum at 289
a small size, while the larger larvae were in the deepest stratum at night (Figure 9). Larvae 290
above 9 mm appeared to aggregate in one or the other strata, depending on species and 291
prevailing light conditions. 292
When testing the depth of the centre of mass for difference between species, results were only 293
significant within a single family, Gadidae (F6=2.5; p=0.047), but not for the group of flatfish 294
(F2=0.2; p=0.82) or in an analysis of all species together (F9=1.8; p=0.1). The pattern in 295
change of Zcm, between different light conditions was similar for most species (Figures 6, 7). 296
Zcm decreased at night, except for cod, Norway pout and brill. While cod was found at greater 297
depth during the night, Norway pout and brill had already ascended between day and dusk. 298
299

14
Discussion 300
Our study provides evidence for type I vertical migrations in the species examined, except for 301
cod (Gadus morhua). However, in regard to timing, the migration patterns were not identical, 302
as Norway pout (Trisopterus esmarkii) and Brill (Scophthalmus rhombus) ascended earlier 303
and pollock (Pollachius pollachius) continued to rise until the early morning. With the 304
exception of the two Trisopterus species the centre of abundance of all species was within the 305
20 - 40 m stratum either at dusk or during the night. In contrast to previous studies (Gray 306
1996; Olivar & Sabatés 1997) we observed distinct assemblages in the upper and lower parts 307
of the water column only during the day. 308
Our hydrographic observations are in accordance with findings described for the Feie-309
Shetland transect, reported by Hackett (1981). Hydrographic fronts were apparent at the 310
western and eastern margins of the transects. Larval abundances and zooplankton 311
concentrations were highest in the vicinity of these fronts which might imply that the frontal 312
processes aggregate the zoo- and ichthyoplankton (Olson et al. 1994; Olson & Backus 1985). 313
Larval drift and dispersion from spawning grounds around the Shetland Isles is indicated by 314
the general decline in larval abundance and diversity in parallel with an increase in larval 315
mean lengths from these areas towards the East. Similar patterns have been suggested for 316
Norway pout in other studies (Lambert et al. 2009; Nash et al. 2012). 317
In accordance with an east-west size gradient, the smallest average standard lengths were 318
measured at the westerly positioned 18h-station. Cod and haddock (Melanogrammus 319
aeglefinus) larvae were in the 6 – 8 mm size range in which Lough and Potter (1993) have 320
observed the first appearance of vertical migrations. While our observations of cod larvae 321
contain a high level of uncertainty, due to the low number of cod larvae in the samples, the 322
distribution appears similar to earlier studies. The lack of cod larvae below 40 m is in 323

15
accordance with other observation of early cod larvae confined to the waters above the 324
thermocline (Grønkjær et al. 1997; Grønkjær & Wieland 1997; Huwer et al. 2011; Lough & 325
Potter 1993). Our observations of Type II distributions in cod larvae were described earlier 326
for both the Atlantic and the Pacific cod (Gadus macrocephalus Tilesius, 1810) (Boehlert et 327
al. 1985; Munk , in press). The depth distributions found for haddock, whiting, pollock, 328
Norway pout, witch (Glyptocephalus cynoglossus) and long rough dab (Hippoglossoides 329
platessoides) were similar to the findings of Economou (1987). The propensity for large 330
whiting larvae to occur shallower at night may be explained by their greater ability to rise 331
quickly. This is supported by the increasing proportion of smaller larvae in the 20 – 40 m 332
stratum. Apparently all whiting larvae were rising through the water column but the larger 333
larvae were rising more rapidly. In comparison, Norway pout showed a different trend and 334
generally less distinct differences between day and night. Saithe exhibited less variation in 335
Zcm in earlier studies (Munk , in press). Poor cod (Trisopterus minutus) was found shallower 336
than in the present study (Olivar & Sabatés 1997). During the day Frank et al. (1992) found a 337
shallower distribution of witch and long rough dab than in this study. However the bottom 338
depth in their study was at 45 m, which may have restricted the depth distribution. The 339
distribution of brill appears not to be described in the literature. In many ways it resembled 340
the distribution of Norway pout, concerning the particularly deep Zcm and the timing of the 341
ascent. However the extent of the vertical migration was greater, covering 43 m. Notably, 342
brill larvae, which were on average smaller than those of other species, exhibited the largest 343
difference in Zcm between day and night, suggesting that already at this small size brill larvae 344
were capable of controlling their position in the water column. The overall tendency of large 345
larvae to aggregate may reflect the developing patchiness in the distribution of older larvae 346
(Hewitt 1981; Matsuura & Hewitt 1995). However, the low number of larvae above 9 mm SL 347
resulted in a great deal of uncertainty concerning diel shifts in distribution. 348

16
Thermoclines have been described to lead either to larval aggregation (Lough & Potter 1993; 349
Sabatés et al. 2008) or serve as a boundary for their migrations (Olivar & Sabatés 1997; 350
Röpke 1993). Other studies found no apparent influence of thermoclines on larval vertical 351
distribution and migration patterns (Conway et al. 1997; Gray & Kingsford 2003). The weak 352
stratification resulting in a weak thermocline observed at the 18-hours station is similar to 353
conditions in the studies of Gray and Kingsford (2003) and this might be the cause of the 354
apparent weak influence of the thermocline in both studies. 355
The aggregation in the 20 - 40 m stratum during the night suggests a support for the 356
hypothesis that a hungry population would ascend just far enough to find sufficient food 357
(Pearre 2003). The zooplankton that could be quantitatively sampled with the available 358
equipment was generally too large to be potential prey for all but the largest fish larvae. Even 359
though the small-sized copepods and nauplii are under-sampled by the 180 µm mesh, we 360
consider the distribution of the <1000 µm size fraction to reflect the distribution of smaller 361
zooplankton. The smallest size fraction was concentrated in the upper water column which 362
would be consistent with the aggregation of nauplii of most copepod species above the 363
thermocline, which was observed in an earlier study (Krause & Trahms 1982). 364
Gadoid larvae in the observed size range primarily feed on Calanus finmarchicus (Gunnerus, 365
1770) eggs and copepod nauplii (Economou 1991) and require about 36% d-1 of their own 366
body mass (Jones 1973). For a larva of 6 mm standard length this would mean a requirement 367
between 68 µg for saithe and 125 µg for cod (calculated following Economou 1987). 368
Assuming a swimming speed and a reaction distance of one body length as well as 369
proportions between C. finmarchicus eggs and nauplii and between nauplii stages as in 370
Economou (1987) and Fransz et al. (1998) the corresponding number of food particles would 371
be 3260 m-3 and 5973 m-3, respectively. In May such numbers are not unrealistic in the area 372
(Economou 1987) and would be well within the 27.6% loss of biomass due to the mesh size 373

17
used (interpolated from table III in Gallienne & Robins 2001) However, zooplankton 374
concentration in deeper strata should still have been sufficient to fulfil food requirements, 375
which may explain why Zcm of Norway pout were not found any shallower than 51 m 376
(equation from Economou 1987; based on: Jones 1973; Laurence 1985). The deepest Zcm 377
observed after the apparent feeding period, could be due to larvae resting in deeper, cooler 378
water to save energy and avoid visual predators (Brett 1971) or less buoyancy due to a full 379
stomach (Sclafani et al. 1993). 380
In conclusion, whilst the general observation that most of the larvae occur at depths with high 381
concentrations of zooplankton suggests a strong influence from the distribution of potential 382
prey, the general vertical displacement of the mean depth indicates that other environmental 383
factors might set a species-specific ‘background-depth’ of distribution. Therefore the physical 384
water column structure might be the key factor determining the distribution of fish larvae, 385
rather than the prey distributions. As suggested by Sclafani (1993), the neutral buoyancy of 386
fish larvae is influenced by their condition. Further developed or better fed larvae, may be 387
deeper in the water column, due to higher specific weight. As the species differ in the 388
proportion of tissue types, the depth of neutral buoyancy may be different even when the 389
larvae are in the same condition. We find that the comparative approach used in the present 390
study has the potential for a new insight into the drivers behind vertical distribution patterns, 391
and we suggest that further comparative community studies are undertaken. 392
393
Acknowledgements 394
The authors are grateful to the crew of the RV G.O. Sars (IMR, Norway) for undertaking the 395
sampling and members of the IMR Plankton group for assistance with all aspects of the 396
sampling at sea. The authors acknowledge Laura Rey at IMR, Bergen for her expertise in 397

18
identifying fish larvae and all the other staff in the institute, for the support they provide to 398
guest scientists. We also thank the subject editor and two anonymous reviewers for their 399
constructive comments to the earlier submitted drafts of this work. The basic support for this 400
sampling programme was provided by the IMR North Sea programme. Hannes Höffle was 401
partially financed by the Danish national project SUNFISH (=SUstaiNable FISHeries, 402
climate change and the North Sea ecosystem). 403
404
405

19
References 406
Boehlert GW, Gadomski DM, Mundy BC. 1985. Vertical distribution of ichthyoplankton off 407
the Oregon coast in Spring and Summer months. Fishery Bulletin (Washington D C) 408
83:611-621. 409
Bolz GR, Lough RG. 1984. Growth of Larval Atlantic Cod, Gadus morhua, and Haddock, 410
Melanogrammus aeglefinus, on Georges Bank Spring, 1981. Fishery Bulletin (Washington 411
D C) 81:827-836. 412
Brett JR. 1971. Energetic Responses of Salmon to Temperature - Study of Some Thermal 413
Relations in Physiology and Freshwater Ecology of Sockeye Salmon (Oncorhynchus 414
nerka). American Zoologist 11:99-113. 415
Catalán I, Vollset K, Morales-Nin B, Folkvord A. 2011. The effect of temperature gradients 416
and stomach fullness on the vertical distribution of larval herring in experimental columns. 417
Journal of Experimental Marine Biology and Ecology 404:26-32. 418
Conway DVP, Coombs SH, Smith C. 1997. Vertical distribution of fish eggs and larvae in 419
the Irish Sea and southern North Sea. Ices Journal of Marine Science 54:136-147. 420
Downing G, Litvak MK. 2001. The effect of light intensity and spectrum on the incidence of 421
first feeding by larval haddock. Journal of Fish Biology 59:1566-1578. 422
Economou AN. 1991. Food and feeding ecology of five gadoid larvae in the northern North 423
Sea. Journal du Conseil 47:339-351. 424

20
Economou AN. 1987. Ecology of survival in some gadoid Larvae of the Northern North Sea. 425
Environmental Biology of Fishes 19:241-260. 426
Fortier L, Leggett WC. 1982. Fickian Transport and the Dispersal of Fish Larvae in Estuaries. 427
Canadian Journal of Fisheries and Aquatic Sciences 39:1150-1163. 428
Fortier L, Leggett WC. 1983. Vertical Migrations and Transport of Larval Fish in a Partially 429
Mixed Estuary. Canadian Journal of Fisheries and Aquatic Sciences 40:1543-1555. 430
Frank KT, Loder JW, Carscadden JE, Leggett WC, Taggart CT. 1992. Larval Flatfish 431
Distributions and Drift on the Southern Grand Bank. Canadian Journal of Fisheries and 432
Aquatic Sciences 49:467-483. 433
Fransz HG, Gonzalez SR, Steeneken SF. 1998. Metazoan plankton and the structure of the 434
plankton community in the stratified North Sea. Marine Ecology Progress Series 175:191-435
200. 436
Gallienne CP, Robins DB. 2001. Is Oithona the most important copepod in the world's 437
oceans? Journal of Plankton Research 23:1421-1432. 438
Golden Software. 2002. Surfer. Version 8.00. Golden, CO: Golden Software, Inc. Computer 439
Program. 440
Govoni JJ, Pietrafesa LJ. 1994. Eulerian views of layered water currents, vertical distribution 441
of some larval fishes, and inferred advective transport over the continental shelf off North 442
Carolina, USA, in winter. Fisheries Oceanography 3:120-132. 443

21
Gray CA. 1996. Do thermoclines explain the vertical distributions of larval fishes in the 444
dynamic coastal waters of south-eastern Australia? Marine and Freshwater Research 445
47:183-190. 446
Gray CA. 1998. Diel changes in vertical distributions of larval fishes in unstratified coastal 447
waters off southeastern Australia. Journal of Plankton Research 20:1539-1552. 448
Gray CA, Kingsford MJ. 2003. Variability in thermocline depth and strength, and 449
relationships with vertical distributions of fish larvae and mesozooplankton in dynamic 450
coastal waters. Marine Ecology Progress Series 247:211-224. 451
Grønkjær P, Clemmesen C, St.John M. 1997. Nutritional condition and vertical distribution 452
of Baltic cod larvae. Journal of Fish Biology 51:91-352. 453
Grønkjær P, Wieland K. 1997. Ontogenetic and environmental effects on vertical distribution 454
of cod larvae in the Bornholm Basin, Baltic Sea. Marine Ecology Progress Series 154:91-455
105. 456
Hackett B. 1981. The Feie-Shetland section: a hydrographic atlas. Report No. 3/81. 20 pages 457
and figures. 458
Hernandez FJ, Hare JA, Fey DP. 2009. Evaluating diel, ontogenetic and environmental 459
effects on larval fish vertical distribution using Generalized Additive Models for Location, 460
Scale and Shape. Fisheries Oceanography 18:224-236. 461

22
Hewitt R. 1981. The value of pattern in the distribution of young fish. Rapports et Proces-462
Verbaux des Reunions Conseil International pour l'Exploration de la Mer 178:229-236. 463
Huebert KB, Sponaugle S, Cowen RK. 2010. Predicting the vertical distributions of reef fish 464
larvae in the Straits of Florida from environmental factors. Canadian Journal of Fisheries 465
and Aquatic Sciences 67:1755-1767. 466
Huse I. 1994. Feeding at different illumination levels in larvae of three marine teleost species: 467
Cod, Gadus morhua L., plaice, Pleuronectes platessa L., and turbot, Scophthalmus 468
maximus (L.). Aquaculture and Fisheries Management 25:687-695. 469
Huwer B, Clemmesen C, Gronkjaer P, Koster FW. 2011. Vertical distribution and growth 470
performance of Baltic cod larvae - Field evidence for starvation-induced recruitment 471
regulation during the larval stage? Progress in Oceanography 91:382-396. 472
Jones R. 1973. Density dependent regulation of the numbers of cod and haddock. Rapports et 473
Proces-Verbaux des Reunions Conseil International pour l'Exploration de la Mer 164:156-474
173. 475
Kiørboe T, Munk P, Richardson K, Christensen V, Paulsen H. 1988. Plankton Dynamics and 476
Larval Herring Growth, Drift and Survival in A Frontal Area. Marine Ecology Progress 477
Series 44:205-219. 478
Krause M, Trahms J. 1982. Vertical-Distribution of Copepods (All Developmental Stages) 479
and Other Zooplankton During Spring Bloom in the Fladen Ground Area of the North-Sea. 480
Netherlands Journal of Sea Research 16:217-230. 481

23
Lambert G, Nielsen J, Larsen LI, Sparholt H. 2009. Maturity and growth population 482
dynamics of Norway pout (Trisopterus esmarkii) in the North Sea, Skagerrak, and 483
Kattegat. Ices Journal of Marine Science 66:1899-1914. 484
Laurence GC. 1985. A report on the development of stochastic models of food limited growth 485
and survival of cod and haddock larvae on Georges Bank. NOAA Technical 486
Memorandum, Report No. NMFS-F/NEC-36, p 83-150. 487
Leis JM. 1991. Vertical distribution of Fish Larvae in the Great Barrier Reef Lagoon, 488
Australia. Marine Biology 109:157-166. 489
Lough RG, Caldarone EM, Rotunno TK, Broughton EA, Burns BR, Buckley LJ. 1996. 490
Vertical distribution of cod and haddock eggs and larvae, feeding and condition in 491
stratified and mixed waters on southern Georges Bank, May 1992. Deep-Sea Research 492
Part Ii-Topical Studies in Oceanography 43:1875-1904. 493
Lough RG, Potter DC. 1993. Vertical distribution patterns and diel migrations of larval and 494
juvenile haddock Melanogrammus aeglefinus and Atlantic cod Gadus morhua on Georges 495
Bank. Fishery Bulletin 91:281-303. 496
Lovetskaya AA. 1953. Distribution and behavior of the Caspian Sea sprat. Fisheries Industry 497
12:29-35. 498
Matsuura Y, Hewitt R. 1995. Changes in the Spatial Patchiness of Pacific Mackerel, 499
Scomber-Japonicus, Larvae with Increasing Age and Size. Fishery Bulletin 93:172-178. 500

24
Millero FJ, Poisson A. 1981. International One-Atmosphere Equation of State of Seawater. 501
Deep-Sea Research Part A-Oceanographic Research Papers 28:625-629. 502
Munk P. in press. Fish larvae at fronts: horizontal and vertical distributions of gadoid fish 503
larvae across a frontal zone at the Norwegian Trench. Deep-Sea Research Part Ii-Topical 504
Studies in Oceanography 505
Munk P, Nielsen J. 2005. Eggs and Larvae of North Sea Fishes. Frederiksberg: Biofolia. 506
224pages. 507
Munk P, Wright PJ, Pihl NJ. 2002. Distribution of the early larval stages of cod, plaice and 508
lesser sandeel across haline fronts in the North Sea. Estuarine Coastal and Shelf Science 509
55:139-149. 510
Nash RDM, Dickey-Collas M, Milligan SP. 1998. Descriptions of the Gulf VII/PRO-NET 511
and MAFF/Guildline unencased high-speed plankton samplers. Journal of Plankton 512
Research 20:1915-1926. 513
Nash RDM, Wright P, Matejusova I, Dimetrov S, O'Sullivan M, Augley J, Höffle H. 2012. 514
Spawning location of Norway pout (Trisopterus esmarkii Nilsson) in the North Sea. Ices 515
Journal of Marine Science 69:1338-1346. 516
Neilson JD, Perry RI. 1990. Diel Vertical Migrations of Marine Fishes - An Obligate Or 517
Facultative Process. Advances in Marine Biology 26:115-168. 518

25
Olivar MP, Sabatés A. 1997. Vertical distribution of fish larvae in the north-west 519
Mediterranean Sea in spring. Marine Biology 129:289-300. 520
Olson DB, Backus RH. 1985. The Concentrating of Organisms at Fronts: A cold-water Fish 521
and a warm-core Gulf Stream ring. Journal of Marine Research 43:113-137. 522
Olson DB, Hitchcock GL, Manano A, Ashjian CJ, Peng G, Nero RW, Podesta GP. 1994. Life 523
on the edge: marine life and fronts. Oceanography 7:52-60. 524
Pearre S. 1973. Vertical Migration and Feeding in Sagitta elegans Verrill. Ecology 54:300-525
314. 526
Pearre S. 2003. Eat and run? The hunger/satiation hypothesis in vertical migration: history, 527
evidence and consequences. Biological Reviews 78:1-79. 528
Röpke A. 1993. Do larvae of mesopelagic fishes in the Arabian Sea adjust their vertical 529
distribution to physical and biological gradients? Marine Ecology Progress Series 530
101:223-235. 531
Russell FS. 1976. The Eggs and Planktonic Stages of British Marine Fishes. London: 532
Academic Press. 524 pages. 533
Sabatés A. 1990. Changes in the Heterogeneity of Mesoscale Distribution Patterns of Larval 534
Fish Associated with A Shallow Coastal Haline Front. Estuarine, Coastal and Shelf 535
Science 30:131-140. 536

26
Sabatés A, Zaragoza N, Grau C, Salat J. 2008. Vertical distribution of early developmental 537
stages in two coexisting clupeoid species, Sardinella aurita and Engraulis encrasicolus. 538
Marine Ecology Progress Series 364:169-180. 539
Schmidt J. 1906. The pelagic post-larval stages of the Atlantic species of Gadus Part I. 540
Bianco Lunos Bogtrykkeri, Report No. Bind I Nr. 4. 77 pages. 541
Sclafani M, Taggart CT, Thompson KR. 1993. Condition, Buoyancy and the Distribution of 542
Larval Fish - Implications for Vertical Migration and Retention. Journal of Plankton 543
Research 15:413-435. 544
Southward AJ, Barrett RL. 1983. Observations on the Vertical distribution of zooplankton, 545
Including post-larval teleosts, off Plymouth in the presence of a thermocline and a 546
chlorophyll dense layer. Journal of Plankton Research 5:599-618. 547
Systat Software I. 2011. SigmaPlot for Windows. Version 12.0. Computer program. 548
Theilacker GH. 1980. Changes in Body Measurements of Larval Northern Anchovy, 549
Engraulis mordax, and Other Fishes Due to Handling and Preservation. Fishery Bulletin 550
78:685-692. 551
Vollset KW, Catalán I, Fiksen O, Folkvord A. in press. Effect of food deprivation on the 552
distribution of larval and early juvenile cod in experimental vertical temperature and light 553
gradients. Marine Ecology Progress Series 554

27
Wiebe PH, Morton AW, Bradley AM, Backus RH, Craddock JE, Barber V, Cowles TJ, Flierl 555
GR. 1985. New developments in the MOCNESS, an apparatus for sampling zooplankton 556
and micronekton. Marine Biology 87:313-323. 557
Woodhead PMJ. 1966. The behaviour of fish in relation to light in the sea. Oceanography and 558
Marine Biology Annual Review 4:337-403. 559
Yoon HS, Hwang JH, Choi SD. 2010. Effect of light intensity on first feeding of the chub 560
mackerel Scomber japonicus larvae. Animal Cells and Systems 14:125-128. 561
562
563

28
Table 1: Zooplankton densities (g DW m-2), per size fraction for all sampled stations, based on GULF VII hauls. The highest abundances along 564
transects were found at the stations at ca. 1°E. Proportions differed between transects. While the biomass in the southern transect was dominated 565
by the 1000-2000 µm size fraction, proportions in the northern transect and at the 18h-station were more even between the two smaller size 566
fractions. Large zooplankton (>2000 µm) was generally scarce with the exception of a few stations, where it contributed to a large proportion of 567
the biomass. 568
Density per size fraction (g DW m-2) Transect Station No. Longitude 180-1000 µm 1000-2000 µm >2000 µm Total
60.75°N 423 0.47°W 7.0 4.6 0.1 11.7 429 0.91°E 19.5 17.3 1.9 38.7 433 2.60°E 2.1 11.6 0.2 13.9 437 3.28°E 0.9 2.7 0.2 3.7 444 4.45°E 1.7 2.0 0.0 3.7 59.3°N 388 4.83°E 3.1 1.3 0.6 5.0 402 2.52°E 0.7 2.8 0.4 3.9 406 1.32°E 7.2 20.1 3.2 30.5 410 0.00°E 0.7 5.8 0.1 6.6 414 1.32°W 5.1 10.1 4.7 19.9 18h-St. 418 0.61°W 5.0 4.6 0.9 10.5 419 0.65°W 4.6 8.0 0.4 12.9 420 0.68°W 4.8 5.8 0.2 10.8 421 0.61°W 25.0 11.5 19.5 56.0 422 0.68°W 16.0 10.4 3.2 29.6
569

29
Table 2: Average abundances and standard lengths (±1 SD) for all species identified in the northern transect (a), the southern transect (b) and at 570
the 18h-station (c). Numbers are based on depth integrated GULF VII, except for species which were only found in MOCNESS hauls. These 571
species are denoted with asterisks. 572
a
Taxon Abundance nos. % Std. Length Transect Family Species (nos. m-2) caught measured (mm)
60.75°N Clupeidae Clupea harengus 6.9 ± 5.8 30 93.3 17.8 ± 2.7 Gadidae Melanogrammus aeglefinus 2.7 ± 4.8 4 100.0 8.9 ± 3.1 Merlangius merlangus 22.4 ± 40.4 27 100.0 7.4 ± 1.4 Pollachius pollachius 2.3 ± 2.4 7 100.0 8.5 ± 1.9 Pollachius virens 8.5 ± 11.6 14 100.0 9.7 ± 2.9 Trisopterus esmarkii 51.3 ± 71.9 100 100.0 9.2 ± 2.5 Trisopterus minutus 7.0 ± 14.7 8 100.0 8.4 ± 1.0 Unidentified 3.0 ± 4.3 8 62.5 6.6 ± 4.1 Gobiidae Gobiusculus flavescens 3.3 ± 7.4 3 100.0 6.9 ± 1.6 Lotidae Ciliata septentrionalis 2.4 ± 4.9 3 100.0 5.4 ± 1.0 Molva dipterygia 1.1 ± 2.5 1 100.0 6.5 ± - Molva molva 6.7 ± 14.9 6 100.0 5.2 ± 0.6 Pleuronectidae Glyptocephalus cynoglossus 2.5 ± 4.8 3 100.0 9.7 ± 1.0 Hippoglossoides platessoides 6.0 ± 9.7 10 100.0 8.6 ± 1.8 Limanda limanda 4.7 ± 6.9 6 100.0 8.0 ± 4.0 Pleuronectes platessa 2.2 ± 5.0 2 100.0 6.3 ± 0.4 Unidentified 0.7 ± 1.1 3 66.7 7.8 ± 1.1 Scophthalmidae Lepidorhombus whiffiagonis 1.1 ± 2.5 1 100.0 10.6 ± - Phrynorhombus norvegicus 0.4 ± 0.6 2 100.0 9.2 ± 2.0 Scophthalmus rhombus 3.6 ± 7.3 4 100.0 4.9 ± 1.5

30
573
b Taxon Abundance nos. % Std. Length
(mm) Transect Family Species (nos. m-2) caught measured 59.3°N Ammodytidae Ammodytes marinus 3.1 ± 6.9 7 100.0 16.2 ± - Hyperoplus lanceolatus 1.8 ± 2.8 10 100.0 18.8 ± 5.3 Unidentified 0.5 ± 1.0 2 100.0 17.5 ± 3.7 Argentinidae Argentina sphyraena 0.4 ± 1.0 1 100.0 10.0 ± - Clupeidae Clupea harengus 5.8 ± 12.6 117 94.9 17.1 ± 26.3 Gadidae Gadus morhua 4.4 ± 7.7 11 90.9 8.3 ± 3.5 Melanogrammus aeglefinus 7.6 ± 9.8 22 100.0 9.7 ± 5.0 Merlangius merlangus 5.2 ± 8.7 12 100.0 5.9 ± 8.2 Pollachius pollachius 3.1 ± 4.8 8 100.0 9.6 ± 6.7 Pollachius virens 2.6 ± 4.8 6 100.0 10.4 ± 10.5 Trisopterus esmarkii 60.9 ± 79.9 159 96.2 8.8 ± 5.0 Trisopterus minutus 4.4 ± 7.7 10 100.0 6.3 ± 7.9 Unidentified 2.2 ± 3.8 5 20.0 9.2 ± - Lotidae Ciliata mustela 0.9 ± 2.0 2 100.0 5.1 ± 0.2 Pleuronectidae Hippoglossoides platessoides 4.6 ± 5.6 14 100.0 11.2 ± 3.1 Limanda limanda 2.6 ± 4.8 6 83.3 7.8 ± 1.7 Scophthalmidae Scophthalmus rhombus 0.9 ± 2.0 2 100.0 3.8 ± 0.3
574
575

31
576
c Taxon Abundance nos. % Std. Length
Transect Family Species (nos. m-2) caught measured (mm) 18h-St. Ammodytidae Hyperoplus immaculatus* 0.2 ± 0.4 1 100.0 11.9 ± 0 Hyperoplus lanceolatus 0.8 ± 1.8 1 100.0 40 ± - Argentinidae Argentina sphyraena 20.0 ± 29.2 11 90.9 10.1 ± 2.4 Clupeidae Clupea harengus 0.5 ± 1.1 1 100.0 14.9 ± - Gadidae Gadus morhua 1.3 ± 2.8 1 100.0 5.8 ± - Melanogrammus aeglefinus 3.6 ± 2.4 4 100.0 6.3 ± 1.4 Merlangius merlangus 152.3 ± 138.5 113 99.1 6.3 ± 1.3 Pollachius pollachius 9.4 ± 15.0 5 100.0 7.1 ± 1.6 Pollachius virens 15.3 ± 8.5 13 100.0 7.0 ± 2.4 Trisopterus esmarkii 81.2 ± 77.6 57 98.2 7.2 ± 1.6 Trisopterus minutus 7.4 ± 7.6 5 80.0 6.2 ± 1.4 Unidentified 14.4 ± 11.7 13 76.9 5.3 ± 1.0 Gobiidae Gobius niger 0.8 ± 1.8 1 100.0 5.5 ± - Gobiusculus flavescens 3.6 ± 8.0 1 100.0 6.8 ± - Unidentified* 0.2 ± 0.4 1 100.0 2.7 ± - Lotidae Ciliata septentrionalis 17.8 ± 22.0 14 100.0 5.7 ± 0.9 Molva dipterygia 7.2 ± 16.0 2 100.0 7.9 ± 0.2 Molva molva 2.5 ± 5.7 2 100.0 6.9 ± 0.8 Pleuronectidae Glyptocephalus cynoglossus 6.2 ± 6.9 4 100.0 6.9 ± 1.3 Hippoglossoides platessoides 20.2 ± 29.2 12 83.3 8.3 ± 3.3 Limanda limanda 2.5 ± 5.6 5 80.0 6.8 ± 1.6 Platichthys flesus* 0.4 ± 0.9 5 100.0 3.5 ± 0.5 Pleuronectes platessa 0.8 ± 1.8 1 100.0 10.4 ± - Unidentified 1.3 ± 1.9 2 100.0 5.3 ± 0.5 Scophthalmidae Scophthalmus rhombus 18.6 ± 20.2 12 100.0 4.5 ± 0.7

32
Figure captions: 577
Figure 1: CTD, GULF VII and MOCNESS stations sampled during the survey. The 578
aggregation of samples in the black rectangle represents the 18 hours station, containing 5 579
hauls with each gear in a 5 x 5 NM square. 580
581
Figure 2: Profiles of σt, contoured for 0.1 kg m-3 (thin grey lines) and 0.5 kg m-3 (bold grey 582
lines) and abundance of fish larvae along the transects at 59.3°N (panel a) and 60.75°N (panel 583
b). Only the most common species are given, while gadoids other than Norway pout and 584
whiting, and flatfish other than long rough dab and brill are combined. Miscellaneous species 585
comprised Clupeidae, Argentiniade, Ammodytidae, Lotidae and Gobidae which did not 586
commonly occur. 587
588
Figure 3: Temperature, salinity and fluorescence at the 18h-station (panel a), averaged over 589
all 5 hauls. The broken lines depict the boundaries between the sampled depth strata in depth 590
discrete hauls. Most changes in hydrography and fluorescence occurred between 50 and 80 591
m, mainly in the stratum between 40 and 75 m. Error bars are only shown for every ten 592
metres of depth. Panels b and c show the distribution of all size classes of zooplankton 593
(<1000 µm, 1000-2000 µm and >2000 µm) during daylight and night conditions in % of 594
total. 595
596
Figure 4: Vertical distribution of gadoid fish larvae and <1000 µm zooplankton by dry 597
weight, during day and night as a % of total abundance or biomass. N represents the number 598
33
of larvae caught under the respective light conditions (in subscript). The y-axis depicts the 599
boundaries between sampled strata. 600
601
Figure 5: Vertical distribution of flatfish larvae and <1000 µm zooplankton dry weight, 602
during day and night in % of total abundance or biomass. N represents the number of larvae 603
caught under the respective light conditions (in subscript). The y-axis depicts the boundaries 604
between sampled strata. 605
606
Figure 6: Depth of the centre of abundance for gadoid (a) and flatfish larvae (b) in three 607
different light environments. Due to the long days at this time of the year, there was only one 608
station at dusk (21:52 UTC) and night (23:56 UTC), while three stations were in daylight 609
(19:14 UTC, 06:20 UTC and 08:22 UTC). As it was shortly after sunrise the station at 06:20 610
UTC was not included into the calculation of Zcm. The number of larvae caught under each 611
light condition is given as N in the legend. The depth of mass for zooplankton (based on mg 612
m-3) is depicted in both panels. 613
614
Figure 7: Depth of the centre of abundance for gadoid (a) and flatfish larvae (b) for 615
individual samples taken at the 18h-station. Daylight stations were at 19:14 UTC, 06:20 UTC 616
and 08:22 UTC, the station at 21:52 UTC was during dusk and the station at 23:56 UTC in 617
the night. The number of larvae caught at each station is given as N, with the time of 618
sampling given in subscript. The depth of mass for zooplankton (based on mg m-3) is depicted 619
in both panels. 620
621

34
Figure 8: Rounded length distribution across strata and light conditions of cod, haddock and 622
whiting as % of total abundance. The majority of larvae ranged from 3 to 6 mm standard 623
length. Even for the larvae at the lower end of this range, changes in distribution across strata 624
could change substantially between the different light conditions. Empty panels indicate zero 625
findings for the respective species in this stratum, during the entire sampling period. 626
627
Figure 9: Rounded length distribution across strata and light conditions of saithe, pollock, 628
Norway pout and poor cod in % of total abundance. The majority of saithe and pollock were 629
in a relatively narrow size range from 4 to 8 mm SL. Smaller larvae tended to aggregate at 630
the 20 – 40 m stratum with increasing darkness. Larger larvae were distributed throughout the 631
water column, but this is again based on few individuals. Norway pout covered a large size 632
range (2 – 11 mm) and, similar to saithe larvae (4 – 6 mm), tended to aggregate in the 20 - 40 633
m stratum with increasing darkness. During day and dusk conditions poor cod of all sizes 634
were mostly found in the deeper strata. At night only a few large larvae in the 0 – 20 m 635
stratum were found. Empty panels indicate zero findings for the respective species in this 636
stratum, during the entire sampling period. 637
638
Figure 10: Rounded length distribution across strata and light conditions of witch, long 639
rough dab and brill in % of total abundance. Witch and long rough dab ranged mostly 640
between 3 and 9 mm in standard length but with a few larvae in the extreme upper range of 641
the size distribution which were found in the two strata between 20 and 75 m. The medium 642
sized larvae were relatively dispersed during day and dusk and for witch appeared to 643
aggregate in the uppermost stratum during the night. Brill was unique, as the majority of 644

35
larvae were found at the low extreme of the size range and exhibited strong fluctuations 645
across the depth range. 646
647

Figure 1:

Figure 2:

Figure 3:

Figure 4:
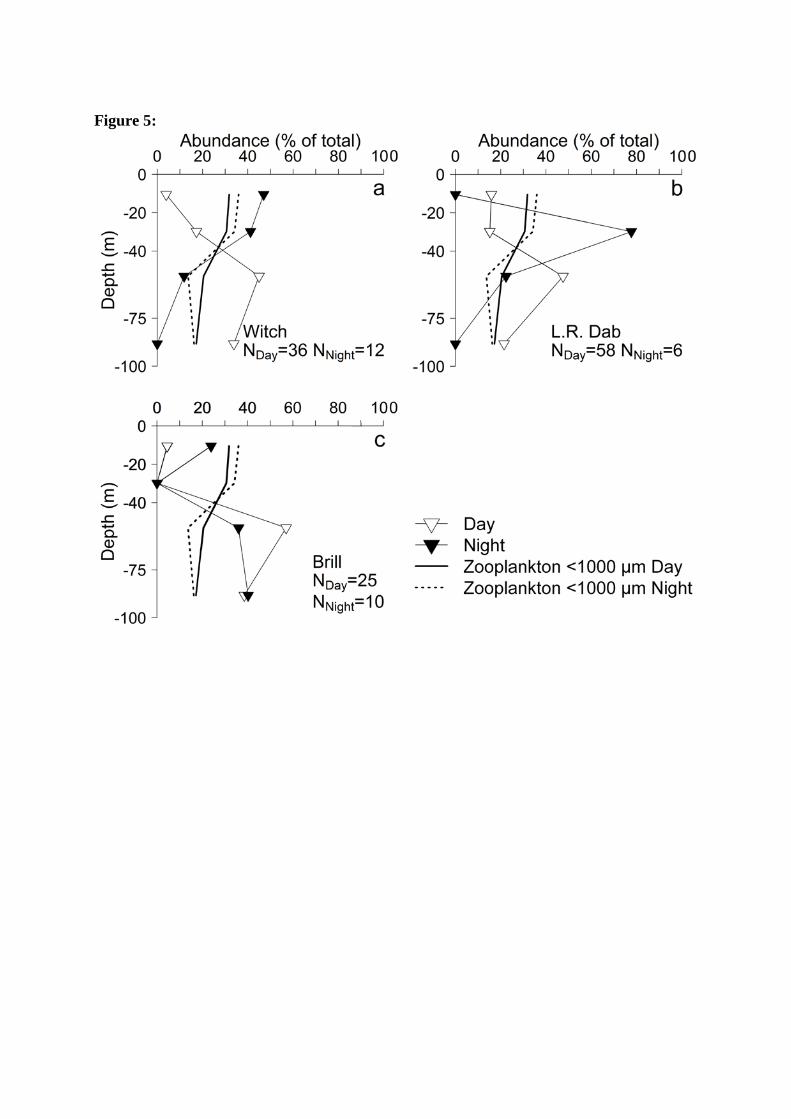
Figure 5:

Figure 6:

Figure 7:

Figure 8:
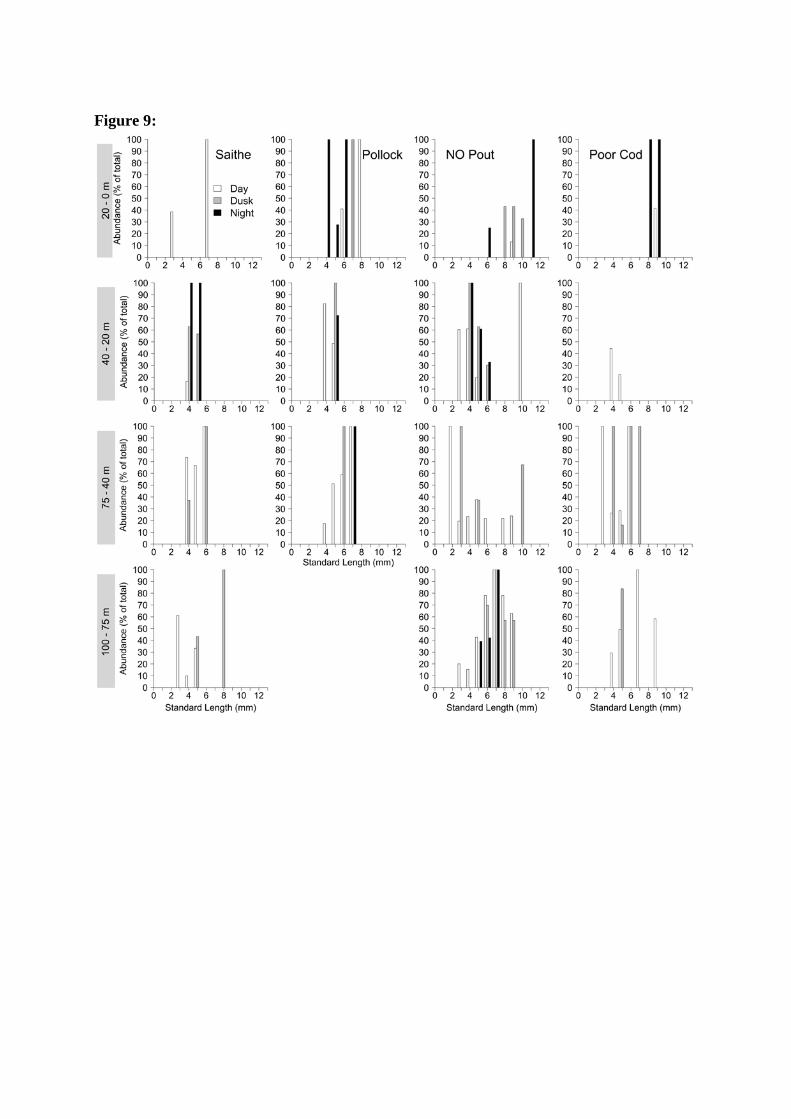
Figure 9:

Figure 10: