different skills: identifying differentially effective ... · different skills: identifying...
TRANSCRIPT
NATIONAL CENTER for ANALYSIS of LONGITUDINAL DATA in EDUCATION RESEARCH
A program of research by the American Institutes for Research with Duke University, Northwestern University, Stanford University, University of Missouri-Columbia, University of Texas at Dallas, and University of Washington
W O R K I N G P A P E R 6 8 • J A N U A R Y 2 0 1 2
Different Skills: Identifying
Differentially Effective Teachers of English Language Learners
B E N M A S T E R ,
S U S A N N A L O E B , C A M I L L E W H I T N E Y , A N D
J A M E S W Y C K O F F
TRACKING EVERY STUDENT’S LEARNING EVERY YEAR
Different Skills: Identifying Differentially Effective Teachers of English Language Learners
Ben Master Stanford University
Susanna Loeb
Stanford University
Camille Whitney Stanford University
James Wyckoff
University of Virginia
i
Contents
Notes .................................................................................................................................................................................................... ii
Abstract .............................................................................................................................................................................................. iii
Introduction ....................................................................................................................................................................................... 1
Data and Methods ........................................................................................................................................................................... 6
Results ............................................................................................................................................................................................... 19
Discussion and Conclusions ....................................................................................................................................................... 24
References ....................................................................................................................................................................................... 26
Tables ................................................................................................................................................................................................ 30
Appendix 1 - Control Covariates .............................................................................................................................................. 45
Appendix 2 - Specification Checks .......................................................................................................................................... 46
ii
CALDER working papers have not gone through final formal review and should be cited as working papers. They are intended to encourage discussion and suggestions for revision before final publication. The views expressed are those of the authors and should not be attributed to the American Institutes for Research, its trustees, or any of the funders or supporting organizations mentioned herein. Any errors are attributable to the authors. CALDER • American Institutes for Research 1000 Thomas Jefferson Street N.W., Washington, D.C. 20007 202-403-5796 • www.caldercenter.org
iii
Different Skills: Identifying Differentially Effective Teachers of English Language Learners Ben Master, Susanna Loeb, Camille Whitney, and James Wyckoff CALDER Working Paper No. 68 January 2012
Abstract
This study seeks to identify the characteristics and training experiences of teachers who are
differentially effective at promoting academic achievement among English language learners
(ELLs). Our analyses indicate that general skills such as those reflected by scores on teacher
certification exams and experience teaching non-ELL students are less predictive of achievement
for ELL students than for other students. However, specific experience teaching ELL students is
more important for predicting effectiveness with future ELL students than non-ELL students as is
both in-service and pre-service training focused on ELL-specific instructional strategies.
1
Introduction
Nationwide, students designated as English Language Learners (ELLs) face a substantial
academic achievement gap. More than three times as many (71 percent) score “below basic” on the 8th
grade National Assessment of Education Progress (NAEP) math and reading exams compared to their
white non-ELL peers (Fry, 2007). Some educators have suggested that developing teachers’ skills in
areas specific to ELL instruction is a critical lever for reducing this gap (Casteel & Ballantyne, 2010;
McGraner & Saenz, 2009; Garcia et. al, 2010; Vogt, 2009). However, the available evidence base to test
this assertion is sparse. Are effective teachers for non-ELL students also effective for ELL students or are
there skills that make some teachers differentially effective with ELLs? If there are skills specific to
teaching ELLs, are these skills learned or are they a function of underlying characteristics such as
teachers' language proficiency or familiarity with the community?
This study seeks to identify the characteristics and training experiences of teachers who are
differentially effective at promoting academic achievement among ELLs. We begin with a review of
prior research. We then describe our data, methods and results, concluding with a discussion of their
implications. As described below, our analyses indicate that general skills such as those reflected by
scores on teacher certification exams and experience teaching non-ELL students are less predictive of
achievement for English language learners. However, specific experience teaching ELL students is more
important for predicting effectiveness with future ELL students than non-ELL students as is both in-
service and pre-service training focused on ELL-specific instructional strategies.
ELLs and academic achievement. Nationwide, English Language Learners are a large and rapidly
growing student population in K-12 schools. More than 5 million, representing 10 percent (US
Department of Education, 2008), of all public school students are estimated to be currently designated
as ELLs, with a rapid growth rate of 57 percent between 1995 and 2005, compared to a 3.7 percent
growth rate for all other students (Ballantyne et. al, 2008). ELL students in schools typically take from
2
three to five years to attain oral English proficiency, and many still have significant challenges associated
with academic language fluency for much longer (Hakuta and Beatty, 2000; Howard et al., 2003). In line
with these patterns, an increasingly large proportion of general education teachers, across all K-12
grades and subject specialties, are or will likely at some point in their careers teach ELL students in their
classrooms.
To date, ELLs face a substantial and well documented academic achievement gap relative to
their non-ELL peers, even when compared to students of the same race and socio-economic status. For
instance, 71 percent of ELLs score “below basic” on 8th grade NAEP math and reading exams, compared
to 20 percent of white non-ELLs and 50 percent of Hispanic non-ELLs (Fry, 2007). They must overcome
deficiencies in English while simultaneously maintaining academic progress, and many do not succeed.
The consistently low performance of this student population has been highlighted in part by reporting
requirements of the federal No Child Left Behind (NCLB) law passed in 2001, and continues to be an area
of focus both for lawmakers considering its reauthorization and for educators challenged with serving
ELLs in their schools.
Research on instructional effectiveness for ELLs. In response to the challenges facing English
learners, there has been substantial and highly politicized debate around the ideal language of
instruction for helping ELLs to initially learn English and achieve academic proficiency. Of the large
volume of studies comparing student progress in bilingual programs versus English immersion programs,
many are not well identified – that is they typically confound program effects with the characteristics of
the students who enter the programs (Willig, 1985). Given a narrow focus on the few experimental or
quasi-experimental studies that assign comparable students across programs, the majority identify
positive effects for bilingual instructional programs (Slavin & Cheung, 2005). On the other hand, a
recent five-year randomized study found no significant differences in reading outcomes for students
who had completed transitional bilingual programs compared to students who participated in
3
structured English immersion by the end of fourth grade (Slavin et. al, 2010). Even high quality studies
in this vein face some key limitations. First, the evidence from these studies is focused on impacts on
reading comprehension and language acquisition in elementary grades, but it is not clear how important
language of instruction may be in other academic contexts or subject areas. Second, and more
fundamental, studies comparing bilingual and immersion programs – even those where students are
assigned randomly to classrooms – cannot separate the effects of the programmatic features (e.g.
bilingual) of the programs from the effects of the teachers who teach in them. It may be that the
language of instruction is important or it may be that programs that use a particular approach attract
more effective teachers. The focus of the national debate on programmatic responses to English
Language Learner needs has shed little light on the skills or background characteristics of teachers that
might contribute differentially to closing the ELL achievement gap (Tellez & Waxman, 2006; August &
Shanahan, 2006).
Teacher quality is an important, if not the most important, school-related factor in student
academic performance (Rockoff, 2004; Rivkin et al., 2005). Even though a large proportion of teachers
have or will have ELLs in their classrooms, relatively few teachers receive training on how best to help
these students achieve given their limitations with English comprehension. Moreover, studies have
shown ELLs in some urban districts are more likely to be taught by less skilled teachers, in large part due
to the schools that they attend (Lankford et al., 2002; Grunow, forthcoming). Better identification of
teacher characteristics predictive of success with ELLs could help districts improve the assignment of
teachers to schools and classrooms that serve ELL students.
Substantial research has assessed the characteristics of effective teachers for student
achievement overall. While many of the measured characteristics of teachers, such as whether they
have a master’s degree, do not predict greater effectiveness, a variety of identifying characteristics do.
For example, tests assessing overall ability - such as the SAT and the Liberal Arts and Science (LAST)
4
exam in New York – are associated with teachers’ performance in the classroom, though relatively
weakly (Boyd et. al., 2008b). Moreover, teachers’ content knowledge (Wenglinksy, 2002) and their
pedagogical content knowledge (Rockoff, Jacob, Kane, and Staiger, forthcoming) also predict higher
performance, at least in math (Hill et al., 2005). Studies repeatedly show that teachers tend to improve
over time with experience, especially during the first few years of teaching (Clotfelter et al., 2007; Harris
& Sass, 2010; Rice, 2003; Kane et al., 2006; Nye et al., 2004; Wayne & Youngs, 2003). Finally, while the
research on teacher preparation is sparse, a few studies have found benefits of particular teacher
preparation experiences, especially those associated with high quality field experiences and preparation
directly linked to the practice of teaching (Boyd et al., 2009; Ronfeldt, forthcoming).
Unfortunately, there is little corresponding evidence on what teacher characteristics or training
are differentially or specifically beneficial for English language learners. On the one hand, there is a
substantial body of theory generating hypotheses about what may constitute key instructional
approaches, pre-service training, or professional development for teachers of ELL students (August &
Shanahan, 2006). However, available research identifying teacher characteristics or experiences
predictive of differential effectiveness is sparse and offers only inconclusive findings. The few extant
studies in this vein tend to focus on associations between student learning and generic ESL certification
categories, providing little information about the quantity or quality of training teachers received as part
of such certification (Williams et al., 2005; Betts et al., 2003; Jepsen & Alth, 2005). Moreover, these
prior studies examine school-level aggregates of teacher characteristics, rather than teacher-level data,
compounding the likelihood of bias due to differential sorting of students, by ability, into schools and
into particular classrooms. Other research has examined how innate teacher characteristics, such as
race or gender, influence effectiveness differentially for certain students, for example through positive
“same-race” effects (Dee, 2005; Wayne & Youngs, 2003). However, there are no comparable studies
linking teacher characteristics such as cultural or race affiliation to ELL achievement gains, and in
5
addition those traits may not be as relevant for addressing an instructional challenge shared by an
ethnically diverse population of students.
Investigating differential teacher effectiveness with ELL students. The results of the prior
literature on teacher effectiveness generate three suppositions concerning the effectiveness of teachers
of English Language Learners. First, the research suggests that teachers who are effective with one
group of students are often effective with another group of students as well (Sanders & Rivers, 1996).
As a result, we would expect that teachers who are effective with non-ELL students would also be
effective with ELL students. Similarly, we might expect that some of the characteristics associated with
more effective teachers for non-ELL students - such as test performance, content knowledge and
teaching experience - would also be associated with more effective teachers for ELL students. Second,
as many have suggested, specific instructional skills and strategies that teachers can learn from training
or practice may support differential effectiveness with ELL students. Third and finally, in addition to
general aspects of teacher quality, some foundational teacher attributes - such as second language
proficiency, motivation to teach ELLs, and relevant cultural affinity - might matter differentially for ELL
instruction, just as having a black teacher appears to be differentially beneficial for black students (Dee,
2005).
In this study we use an unusually rich data set to examine these suppositions. We improve upon
existing studies with a greater range of teacher characteristics - including rich survey items that pinpoint
the quantity and quality of the ELL-related training that individual teachers received - with student and
teacher-level longitudinal data rather than school-level aggregates and cross-sectional data, and with
analytical methods that, while imperfect, more directly address concerns of omitted variables bias than
do prior studies.
6
Data and Methods
This study explores several research questions that bear on the teaching of English language
learners. In keeping with the discussion above, this study assesses the extent to which teacher
characteristics that predict achievement growth for non-ELL students - such as years of experience and
test performance - also predict achievement growth for ELL students. We also assess whether there are
other characteristics of teachers - including second language fluency and learning experiences focused
on ELL students - that differentially predict achievement growth for ELL students more than for non-ELL
students. We specifically consider the following questions of interest:
1. Do teacher characteristics that predict achievement growth for non-ELL students also predict
achievement growth for ELL students?
a. Does teachers' own test performance predict ELL and non-ELL achievement gains?
b. Does teachers' teaching experience predict ELL and non-ELL achievement gains?
2. Do teacher experiences that support learning to teach ELL students differentially predict
effectiveness with ELL students?
a. Does past teaching experience with ELL students predict differential efficacy in teaching
ELLs?
b. Does pre-service teacher preparation that addresses specific instructional skills for
teaching ELLs predict differential efficacy in teaching ELLs?
c. Does in-service teacher professional development that addresses specific instructional
skills for teaching ELLs predict differential efficacy in teaching ELLs?
d. Does certification to teach English as a Second Language or teacher preparation via an
alternative pathway predict differential efficacy in teaching ELLs?
3. Do teacher background characteristics predict differential effectiveness with ELL students?
7
a. Does a teacher’s ability to speak Spanish fluently, either native or learned, predict
differential efficacy in teaching Hispanic English Language Learner students?
b. Does a teacher’s reported pre-service preferences for teaching at sites with more ELLs
predict differential efficacy in teaching ELLs?
To answer these questions accurately, we need to address two concerns. First, teachers with
one characteristic that affects student learning may also have another set of characteristics that
independently affect student learning. For example, teachers who speak Spanish may also have greater
overall academic ability. If we do not adjust for this difference, we might attribute to Spanish fluency
what is really the effect of academic ability. Second, teachers with given characteristics may teach
students with different propensities to learn. For example, if teachers who speak Spanish are
differentially assigned to students with more learning difficulties, we might see lower gains in those
classrooms even if teachers who speak Spanish are more effective. Under an ideal scenario, we would
test effects of teacher characteristics using a randomized experiment. Specifically, we would randomly
assign relevant skills (or training) to teachers to ensure comparable underlying teacher ability across
treatment and control teachers, and we would randomly assign students to teachers to ensure
comparable student ability across teacher groups.
We are unable to conduct an ideal experiment but use both rich data and two empirical
techniques to reduce the likelihood of bias. First, we reduce the potential that we are attributing
effectiveness to one teacher characteristic when it is really a correlated teacher characteristic driving to
association by including theoretically appropriate controls in the models. Second, we reduce the bias
associated with the sorting of teachers to schools by comparing the achievement gains of students
within the same school but in classrooms with teachers who have different characteristics. Third, we
reduce the bias associated with students (both ELL and non-ELL) being assigned to teachers by
8
comparing the gains of ELL and non-ELL students taught by the same teacher. We describe the data and
methods in more detail below.
Data
New York City: The data for this study come from the New York City (NYC) public school system,
from 2001 to 2008. Examination across a district such as NYC is useful due not only to its size and its
large and diverse population of ELLs, but also to the instructional coherence a single district offers, with
centralized management and policies around ELL-related support services and teacher professional
development.
Administrative data on students, teachers, and schools. The New York City Department of
Education (NYCDOE) provided student demographic data files and a student exam data file for each year
from 2000-2001 through 2007-2008 for the study. Our primary student outcome measures consist of
annual student achievement exam scores given in third through eighth grades to most NYC students.
For each year, the data include scores for approximately 65,000 to 80,000 NYC students in each grade, in
both Math and English Language Arts. Using these data, we construct a set of records with a student’s
current exam score and his or her lagged exam score. We do not include cases where a student took a
test for the same grade two years in a row, or where a student skipped a grade.
We link students to teachers based on advice from the NYCDOE. Because their data systems
track the courses taken by each student and the courses taught by each teacher, students can be linked
to their courses, which can in turn be linked to the course teacher. For sixth through eighth grades, we
use a course-section identifier that indicates the teacher of the class. For third through fifth grades, we
used the homeroom identifier. We also use the homeroom identifier for sixth graders who were missing
a course section identifier and were located in an elementary school. Because some middle schools in
some years did not participate in the NYCDOE’s middle school performance assessment system (MSPA)
9
and therefore do not have the course-section identifier linked centrally to teachers, we have a lower
match rate for sixth through eighth grades than for third through fifth grades, but never less than two
thirds.
To further enrich our data on teachers, we match NYC teachers to data from New York State
Education Department (NYSED) databases, using a crosswalk file provided by the NYCDOE that links their
teacher file reference numbers to unique identifiers employed by the NYSED. This allowed us to draw
variables including teacher performance on mandatory tests, as well as characteristics of their initial
teacher preparation programs and pathways.
Data on ELL students and teachers of ELLs. In NYC, the vast majority (98 percent) of students are
initially designated as ELLs or non-ELLs based on a home survey that determines whether English is the
primary language spoken at home, followed by a Language Assessment Battery (LAB) exam administered
to students whose home language was not English, in order to determine their level of English
proficiency. A much smaller population of students is designated as ELL based on Individual Educational
Plans (IEPs). Our data include an indicator for ELL status in each year in which the student was present
in the data set.
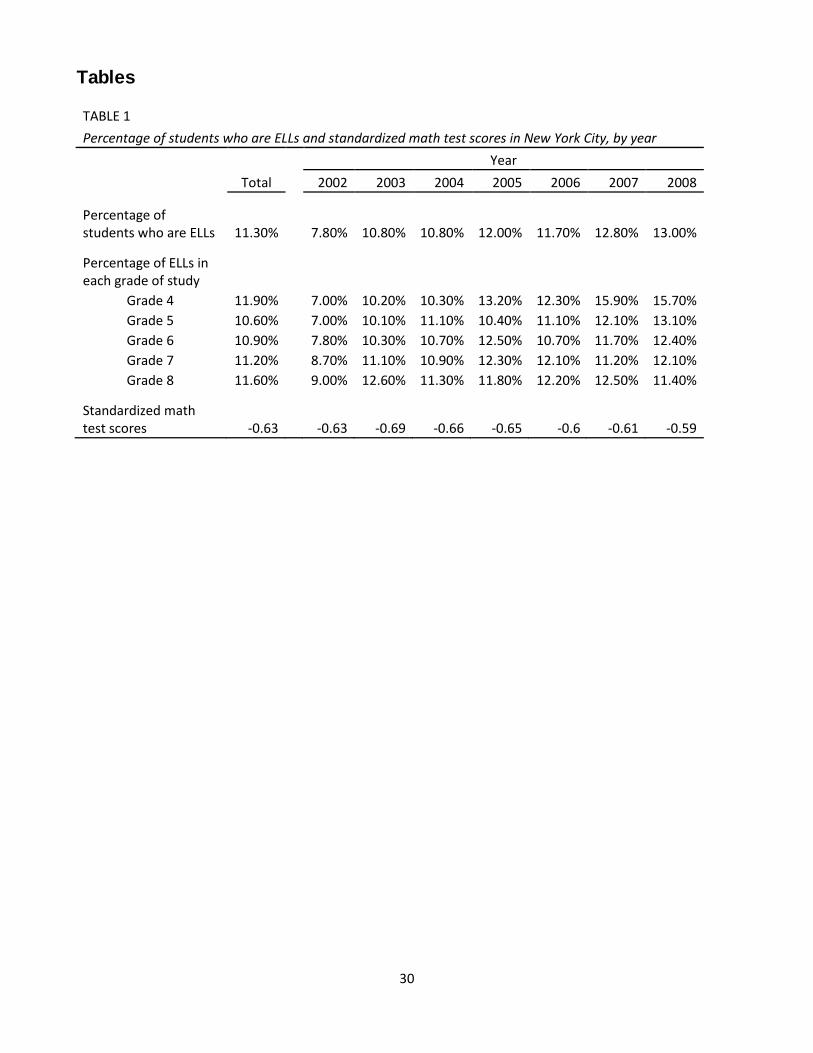
We describe the characteristics and distribution of ELL students across the district in Tables 1
and 2. The proportion of documented ELLs in NYC schools from this period increased over the period of
study (from 7.8 percent to 13 percent), and is marginally higher in grade 4 in more recent school years
than in other grades. In line with national trends in ELL performance, district-wide ELL academic
performance is substantially lower than that of non-ELLs in NYC. When interpreting apparent trends in
the descriptive data in Table 1, it is important to consider that variation in ELL classification policies as
implemented in schools may well have played a major role in addition to any true shifts in ELL make-up
or enrollment over time.
10
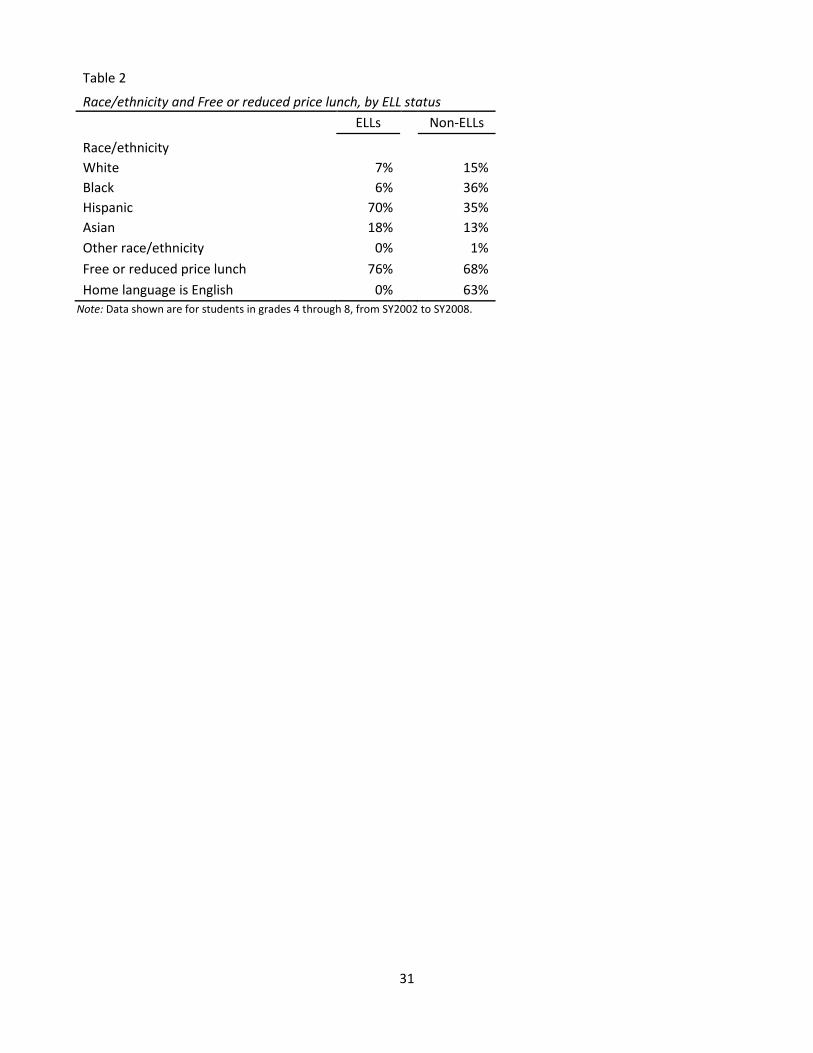
Table 2 provides the background characteristics of ELL and non-ELL students in NYC public
schools. The bulk of ELL students (70 percent) are classified as Hispanic, while the second largest
subgroup is those of Asian descent (18 percent). In comparison, 35 percent of non-ELLs are Hispanic and
13 percent are Asian. ELLs are more likely to receive free or reduced price lunch (76 percent) than non-
ELLs (68 percent).
Note that because we are examining ELL students and student outcomes in grades 4-8 and lack
data on student classifications prior to grade 3, we are primarily considering a population of NYC ELLs
who have been classified as such prior to entering our sample. Over time, many of these ELL students
are reclassified as non-ELLs, as they achieve sufficient language and academic proficiency. In our
sample, we observe an overall average reclassification rate of 17 percent per year, with some variation
across grade levels and years.
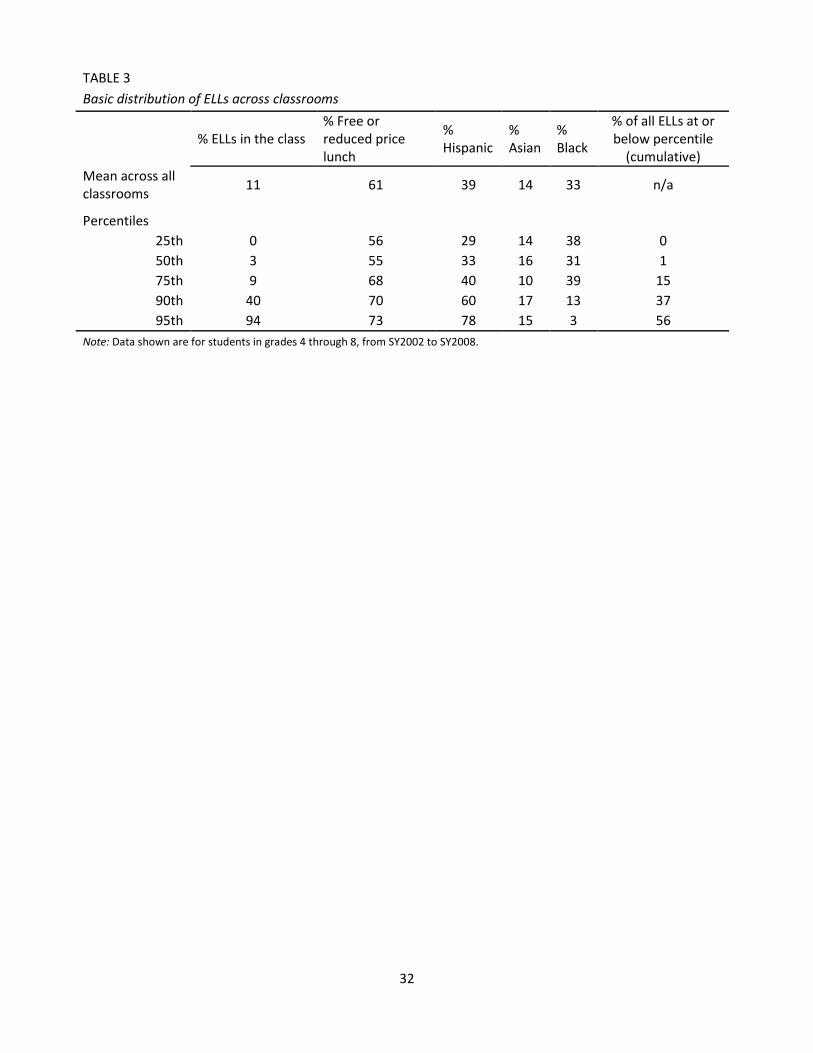
The majority of ELLs in NYC (80 percent) attend math classrooms composed of both ELL and
non-ELL peer students. Table 3 details the proportion of classrooms district-wide that contain none,
minority, and majority populations of ELL students, and the demographic composition of those
classrooms. Forty-four percent of all ELLs attend classrooms that are predominantly (94 percent or
more) ELL students. In these classrooms, students are on average 78 percent Hispanic and 73 percent
eligible for subsidized lunch.
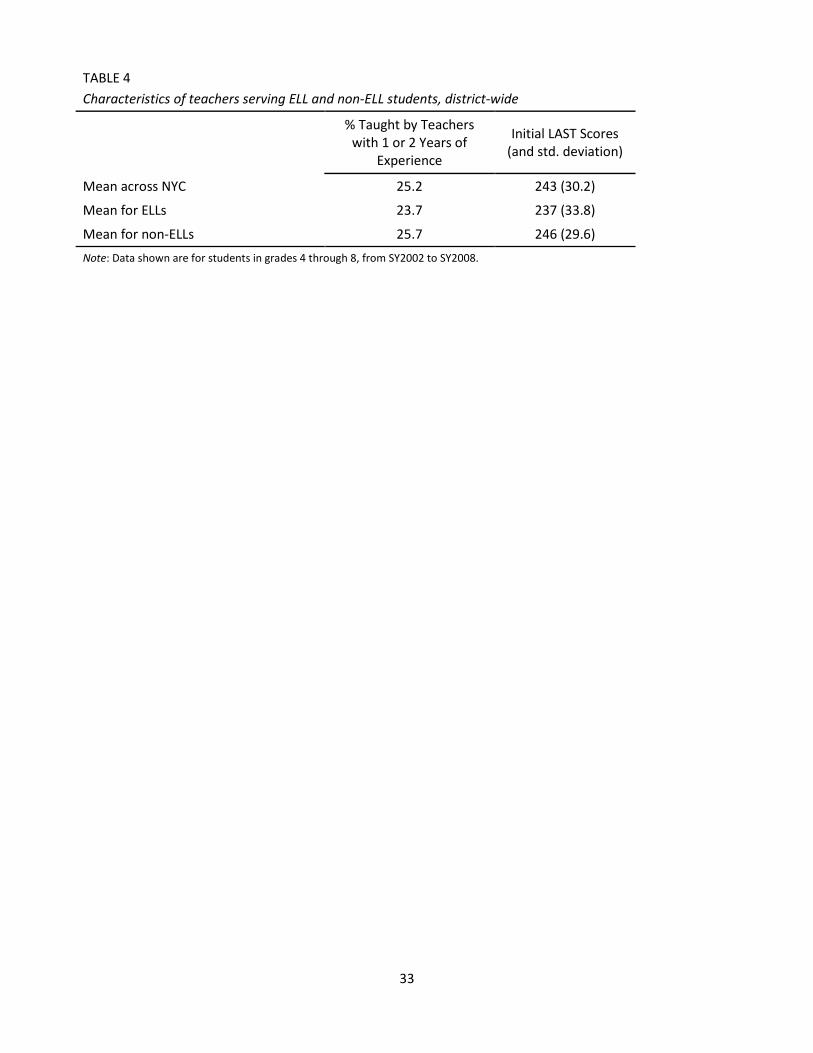
While other studies have found differences in the measureable characteristics of teachers
between ELL and non-ELL students (Grunow, 2011), these differences are not as evident in NYC during
this period. Table 4 shows that, on average, 25.7 percent of non-ELL students in grades 4-8 were taught
by a first or second year teacher, compared to 23.7 percent for ELL students. However, the Liberal Arts
and Sciences Test (LAST) scores, New York's general knowledge certification exam, were lower for the
teachers of ELL students, 237 on average, compared to 246 for non-ELL students. This difference is a
meaningful 30 percent of a standard deviation.
11
Survey of first-year teachers. In addition to utilizing administrative data from 2000-2001 to 2007-
2008, we also conducted a survey of all first year NYC teachers in the spring of 2005 which asked
detailed questions about teacher preparation experiences, in-service training in their first year of
teaching, teaching practices, and preferences. Of particular interest for this analysis, the survey
included questions related to the quantity and efficacy of teachers’ ELL-specific pre-service and in-
service training, as well as their reported preferences to teach at school sites with more ELL students. It
also asked teachers about their fluency in languages other than English, including Spanish. The overall
response rate for this survey was 71.5 percent, representing 4303 teachers across all grades and
subjects. Of these, 1221 were primary math teachers present in the administrative data detailed above.
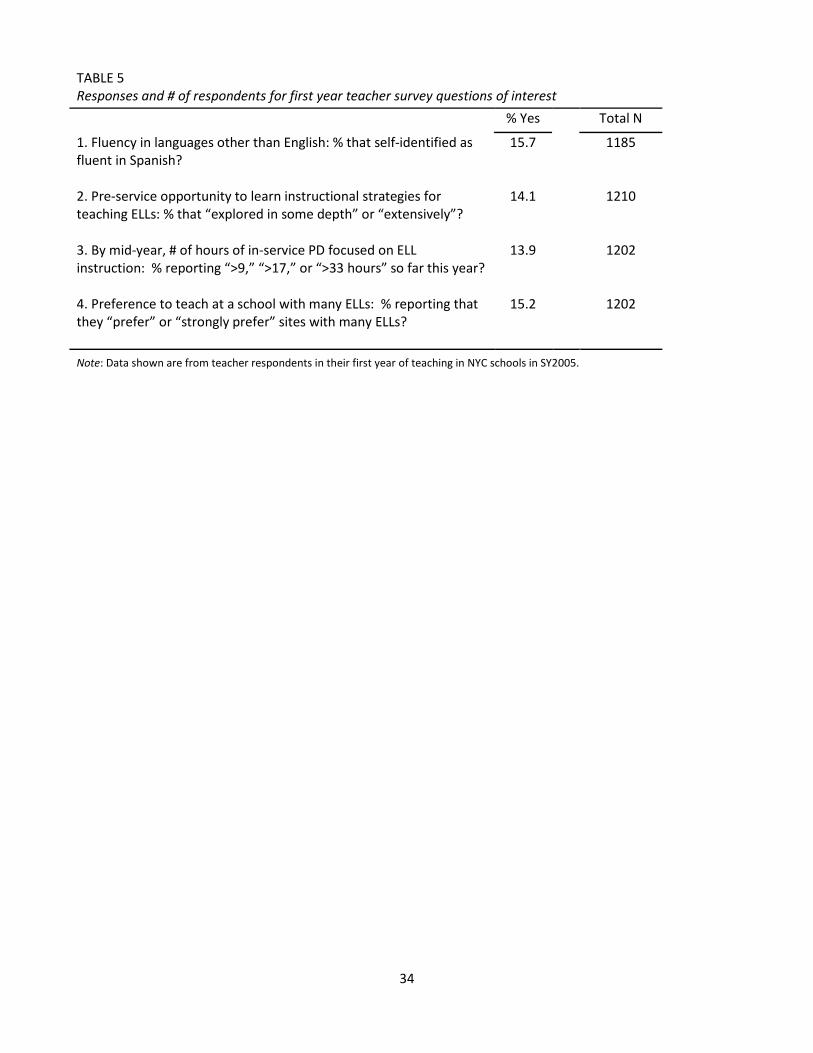
Table 5 describes our questions of interest from this survey that addressed ELLs and describes
the distribution of teacher responses across each question. Nearly 16 percent of math teachers
reported fluency in Spanish. In line with our previous research on teacher preparation to teach ELLs
(Boyd et. al., 2009), the proportion of teachers reporting training to teach ELLs is low relative to the
proportion likely to be supporting ELLs in their classrooms. For example, only 14.1 percent reported
meaningful pre-service opportunity to learn instructional strategies for teaching ELLs.
Limiting our analysis to math teachers and outcomes. Although we have access to some ELA
data, we ultimately chose to examine and report only on math outcomes in this study, due to limitations
in the available ELA data. First, ELL-designated students were not consistently tested in ELA in NYC
during much of this period (2001 to 2008). Towards the end of the period, under pressure from federal
mandates, testing requirements were reformed with more inclusive mandates for ELL student testing.
For example, starting in 2007, the ELA exam was required after one year in the district for ELL students,
rather than after three years as had been the practice. Thus, for much of the study period, ELLs that
were tested in ELA were likely quite dissimilar from those who were not. In addition, during this time
period, New York administered ELA exams, unlike math exams, at mid-year, rather than near the end of
12
the school year. Even with these limitations we do run similar analyses using ELA scores to those
presented below for math performance. The results are directionally similar, but markedly attenuated.
We would be happy to share these results or a summary of findings upon request, but recommend
caution in interpreting them due to the limitations of the ELA data.
Methods
Multiple potential sources of bias complicate the identification of teacher characteristics that
lead to greater instructional effectiveness with ELLs. First, because the teacher characteristics in
question are not themselves randomly assigned, there may be differences in the instructional quality of
teachers with a particular characteristic, e.g., ability to speak Spanish, that is unrelated to the
characteristic itself. Second, teachers possessing a particular characteristic may systematically vary with
regard to the type of schools at which they work, and this may bias the expected achievement outcomes
of their students relative to outcomes of other teachers’ students. Finally, within schools teachers
possessing particular characteristics may be assigned students in non-random ways that our data do not
measure, and so the characteristics and expected achievement outcomes of the students they teach
may vary in ways unrelated to teachers’ true instructional effectiveness.
In each of these cases, we are concerned about mistaking effects of non-random teacher and
student sorting associated with the teacher characteristic in question for true differences in teacher
instructional efficacy that would differentially improve academic outcomes for ELLs. As described
below, we employ modeling strategies that address these concerns far more directly than previous
research in this area.
A within-school achievement growth model. As a baseline, we consider how student
achievement outcomes in math vary across teachers with different characteristics by comparing the
achievement gains of students within the same school. Equation 1 describes this specification.
13
(1) 𝐴itjs = 𝐵0 + 𝐵1Aijs(t-1) + 𝐵2𝑋it + 𝐵3𝐶ijst + 𝐵4 𝑇jst + 𝜇s + 𝜏g + 𝛿t + 𝜀ijst
Here, the standardized achievement (A) of student i in year t with teacher j in school s is a
function of his or her prior achievement (A at t-1), time varying and fixed student characteristics (X),
characteristics of the classroom (C), characteristics of the teacher (T), a fixed-effect for the school (𝜇), a
fixed-effect for the grade level of the student (𝜏), a fixed effect for the year (𝛿), and a random error term
(𝜀). When controlling for prior achievement, we include both a linear and quadratic term to represent
the student’s standardized prior achievement result. Also at the student level, we include observable
characteristics that tend to predict differential achievement, including race and ethnicity, gender,
eligibility for free or reduced-price lunch, the number of school absences in the previous year, and the
number of suspensions in the previous year. At the classroom level, we control for potentially relevant
peer effects by including the average of all the student characteristics already mentioned, as well as the
percent of students in the classroom that are designated ELLs, and the mean and standard deviation of
student test scores in the prior year.
At the teacher level, we include observable teacher characteristics that tend to be associated
with instructional efficacy, including years of teaching experience in NYC (as a proxy for total years of
experience), teacher race/ethnicity, and teacher test scores on the Liberal Arts and Science Test (LAST)
general knowledge exam that teachers must pass to earn certification. In addition to these generic
teacher-level controls, we examine, in separate models detailed below, various teacher characteristics
relevant to our research questions.
Including fixed effects at the school level reduces the potential bias associated with teacher
assignment to schools, and our controls for student and classroom characteristics reduce potential bias
associated with student assignment to teachers within schools.
Differential effectiveness with ELLs. In order to assess whether the teacher characteristics in
question predict differential effectiveness for ELL students, we model, as specified in Equation 1, the
14
effects of ELL and non-ELL characteristics separately, across a sample of students of only those teachers
who teach mixed classes of ELLs and non-ELLs in a given year, grade, and school. We then conduct an F-
test on the coefficients of interest to see whether the effect size associated with ELL students is
significantly different from the effect associated with non-ELL students. Another option to this approach
would be to include an interaction between ELL and the teacher characteristics of interest. However,
other key variables on the right-hand-side of Equation 1 also differ in their effect for ELL and non-ELL
students. We could include an interaction with all variables but that is not substantively different than
the separate model approach.
Within-teacher differential effectiveness with ELLs. While the within-school model given by
Equation 1 adjusts for many of the differences in the context of teaching between teachers with
different measured characteristics, there are still limitations to this approach. The estimation is
identified by differences between the achievement growth of students in a classroom of a teacher with
that characteristic and the growth of students in a classroom within the same school taught by a teacher
with a different value for that characteristic. A second and more stringent approach to investigating
differential teacher effectiveness is to compare students within a classroom taught by the same teacher.
This approach allows us to explore whether a teacher with given attributes is more effective with ELL or
non-ELL students. We estimate these effects based on the following teacher-fixed-effect equation:
(2) 𝐴itjs = 𝛽0 + 𝛽1Aijs(t-1) + 𝑋it𝛽2 + 𝐸𝐿𝐿it + 𝐶ijst 𝛽3 + 𝜃jst𝛽4 + 𝑇jst𝛽5 ∗ 𝐸𝐿𝐿it
+𝜇s ∗ 𝐸𝐿𝐿it + 𝜏g + 𝛿t + 𝜔j + 𝜀ijst
This model is similar to Equation 1, however we also include a fixed effect for each teacher in
the sample (𝜔). In addition, in order to identify differential ELL effects associated with specific fixed
teacher characteristics of interest, we include an interaction of ELL student status with each teacher
characteristic (T), to measure how the relative performance of ELLs to their non-ELL peers varies for
teachers with those characteristics. In order to control for contextual differences in school-wide ELL
15
versus non-ELL achievement gaps where each teacher works, we also include an interaction of school
fixed effects with ELL student status as well.
Thus, we are interested in how characteristics that vary across different teachers predict relative
outcomes for the ELL versus non-ELL students within their classrooms. Moreover, because we believe
that ELL versus non-ELL achievement gaps will vary across different schools, we specifically control for
the school fixed effect on ELL achievement gaps, which represents the context in which each teacher is
assigned ELL and non-ELL students. The clear advantage of this approach is that bias related to
unobserved sorting of students to teachers associated with the teachers’ effectiveness is no longer of
concern. In this within-teacher model, we do not examine teachers’ overall ability with their students,
but rather their relative ability across their ELL and non-ELL students. However, because this approach
does not provide us any indication of the overall ability level of teachers with the characteristic in
question, we find it valuable to consider findings from both types of models.
Applying study methodology to questions of interest. For each teacher characteristic of interest,
we leverage both modeling approaches to test for differential effectiveness with ELLs. This requires us
to tailor each model to account for the specific characteristic and research question. A description of
model variants addressing each of our research questions is provided here. The covariates included in
each model are detailed in Appendix 1 Table 1.
Q1: Teachers' own test performance and teaching experience. For test performance, we include
an indicator variable for whether the teacher failed his or her certification test for the within-school
analysis and an interaction between this variable and being an ELL student for the within-teacher
analysis. We use this variable instead of a continuous variable because the test has significantly greater
reliability around the cut-score. For experience, we similarly enter indicator variables for each year of
experience up to nine and an indicator variable for ten or greater years.
16
Q2: Teachers’ prior experience teaching ELL students, preparation and certification. When
investigating how prior experience with ELLs might predict future effectiveness with ELLs, we consider a
variety of measures of experience. These include the total number of ELL students taught by the
teacher in the prior year as well as in multiple prior years, with separate model specifications to examine
effects for teachers in their second year of teaching and for more experienced teachers. For simplicity,
the models we present define experience with ELLs as the experience of teaching more than six ELL
students in a single school year. The results are not especially sensitive to this cutoff number, but the
relationship does not appear to be linear so we do not use the continuous measure of the number of ELL
students taught. We choose six because it is close to the estimated mean number of ELL students
taught by teachers across NYC in each year, and represents a sufficient quantity of ELL students to
reasonably be expected to challenge a teacher to modify his/her instruction in response. Finally, note
that the teacher fixed effect models examine the effects of ELL experience within each individual
teacher over time (rather than the ELL achievement gaps across fixed teacher characteristics). We do
not include interactions of school fixed effects in the within-teacher ELL experience analyses, as teachers
generally remain in the same school before and after acquiring this experience.
There are additional sources of bias to consider when investigating effects of teacher experience
with ELLs, particularly for the within-school estimates. First, teachers who are assigned more ELL
students may differ from other teachers in ways that predict greater ELL-specific instructional
effectiveness, and this may have led to their assignment to ELL-populated classrooms in the first place.
To reduce this potential bias, when examining experience effects, we control for the number of ELL
students taught in the current year; this control is in addition to the classroom level control for percent
of ELLs taught, which is present in all model runs. Second, teachers of ELL students could be different
from comparison teachers in their pattern of attrition away from teaching or from NYC. Our tests for
17
possible attrition bias, which does not appear to be a factor, are detailed in the specification checks in
Appendix 2. Neither of these issues is a problem for the within-teacher models.
Our measures of teachers’ ELL-specific pre-service preparation and in-service PD come from the
2005 survey. There are clear drawbacks to these measures. First, they have the flaws associated with all
self-reported measures. Moreover, teachers responded to the questions about pre-service training
experiences based on recollections from more than five months prior. There is potential for
respondents’ recollections to be colored by their actual success or challenges with ELL students over
their first several months of full time teaching. Nonetheless, measures of content-specific preparation
and experiences are difficult to come by and these analyses provide initial evidence of the relationships
in question. When considering survey reported experiences, we include other reported experiences as
controls only when the control experiences occurred prior to the characteristic of interest. We model
responses to each survey question as an indicator variable, and detail the indicator threshold for each
question in Table 5.
When investigating teachers’ certification for teaching English as a second language, ESL, we
first compare certified to non-certified teachers in the full population. We then test whether this
relationship differs for novice teachers, defined as those with three or fewer years of experience, to test
whether ESL certification might represent a temporary early advantage relative to other new teachers.
While achieving permanent certification to teach ELLs in NY is a multi-year process, for simplicity’s sake
we assess any teacher possessing any ESL certification – Initial, Professional, or other non-Emergency
certification – as a single identifying characteristic. In order to align with our estimates of the effects of
survey-reported pre-service training (as of 2005), we explore possible certification effects in the 2005 to
2008 period.
Q3: Math teachers’ Spanish fluency and pre-service preferences. When investigating possible
associations between Spanish language fluency and ELL student achievement, we narrow our focus from
18
all ELL students to Hispanic ELL students. By definition, these are students whose home language is not
English, who do not possess English fluency, and who overwhelmingly will be fluent in Spanish as their
primary language. Moreover, we consider two types of reported teacher fluency – those who report
native fluency in Spanish and those who report non-native fluency. As for all analyses related to the
2005 teacher survey sample, only teachers responding to the survey are considered in this analysis.
Their effectiveness is assessed in each of four school years for which we have data (2005-08).
The final teacher characteristic analyzed is teachers’ reported preferences to teach at sites with
more ELL students. This self-reported measure comes from the 2005 teacher survey, and is modeled as
an indicator variable as described in Table 5.
Possible limitations. The within-school and within-teacher modeling approaches described
above may not completely eliminate bias associated with non-random and unobserved student and
teacher sorting. First, we lack a precise definition of students’ English language proficiency and, instead,
rely on ELL status. Non-ELLs that have recently been reclassified may still have challenges related to
English mastery, and may be differentially assigned to classrooms. In order to assess the robustness of
our findings relative to this limitation, we replicate all of the analyses related to our questions of interest
using alternative definitions of ELL status: either including in the ELL category students who were
reclassified as non-ELLs in the prior year, or including in the ELL category students who were ever
classified as ELLs. Second, neither of our modeling approaches accounts for potential sorting to teachers
within schools that is different for ELL and non-ELL students. If teachers with characteristics of interest
are systematically assigned different ELL students but not different non-ELL students, the within-
classroom difference between ELLs and non-ELLs could be driven in part by differences in sorting instead
of differences in effectiveness, which is what we aim to measure. To better gauge this potential bias, we
examine each teacher characteristic of interest for evidence of whether teachers possessing that trait
are assigned ELL and non-ELL students that differ on “pre-treatment” observable characteristics. Our
19
specification section in Appendix 2 offers a more detailed investigation of our response to these issues
and related analytical results.
Results
Do teacher characteristics that predict achievement growth for non-ELL students also predict
achievement growth for ELL students?
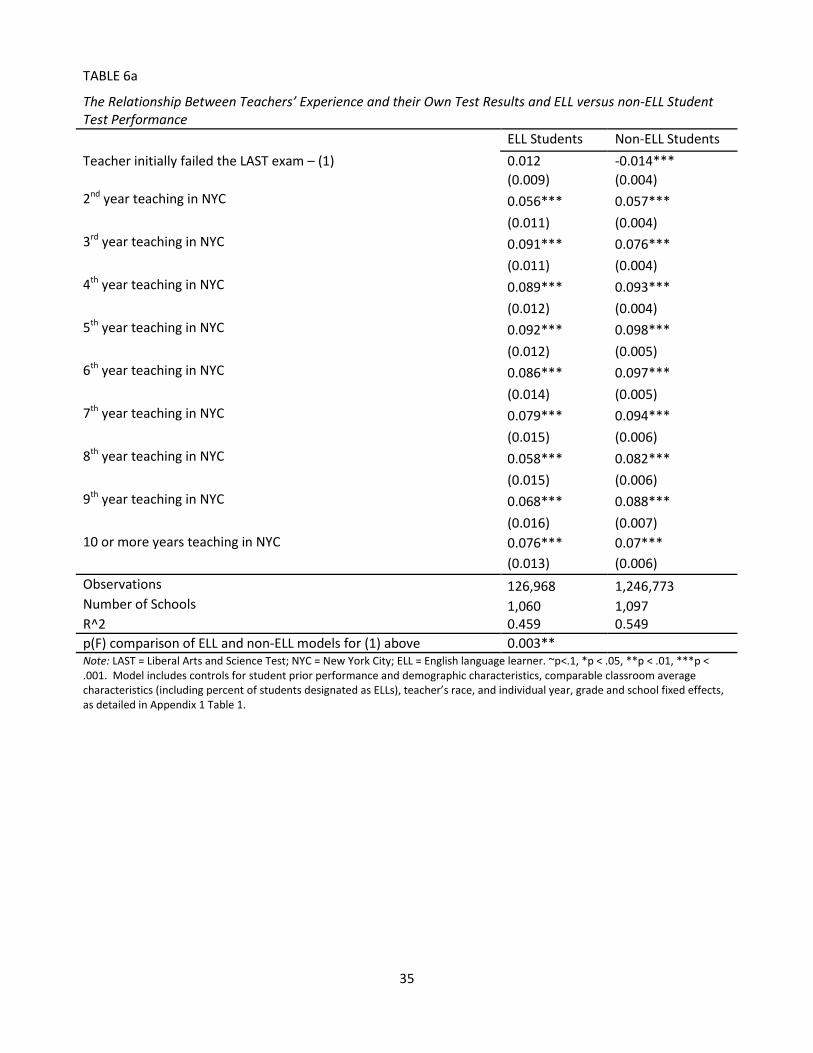
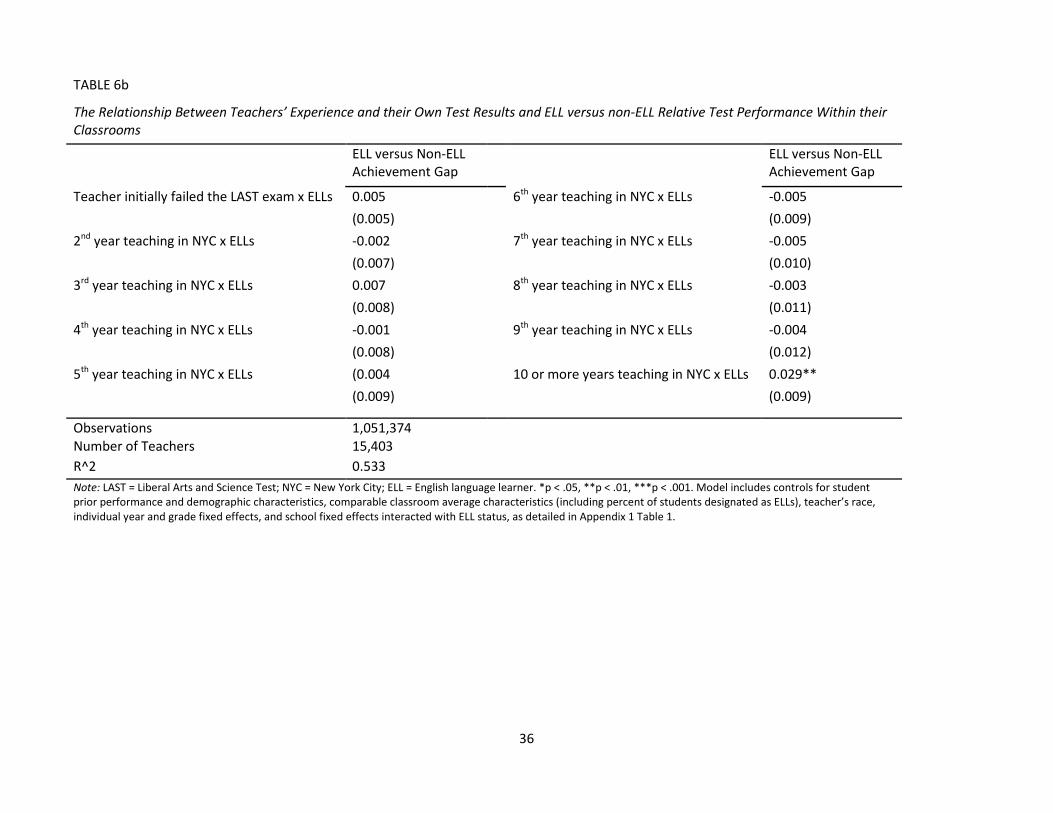
We find that the relationship between a teacher’s test scores and student learning is weaker for
English learners than for non-English learners but the effects of experience are similar. Tables 6a and 6b
show that low initial teacher scores on the LAST exam (failing the exam) predict worse achievement
outcomes for non-ELL students, but not for ELL students. This differential effect is statistically
significant, but modest in size, in the school fixed effect model specification, but smaller and not
significant in the within-teacher relative performance gaps. The knowledge and skills measured by the
LAST exam may not be as relevant for effective instruction for ELL students as they are for non-ELL
students.
Tables 6a and 6b also show that additional teacher experience yields similar math achievement
gains for ELL and non-ELL students. Second year teachers, for example, see learning gains that are 0.056
standard deviations higher than first year teachers teaching non-English learners, while the
corresponding coefficient is 0.057 for teaching English learners. The within-teacher model in Table 6b
that interacts years of experience with ELL student status similarly identifies little differential return for
ELL students associated with generic teacher experience.
20
Do teacher experiences that support learning to teach ELL students differentially predict effectiveness
with ELL students?
Next we look at teachers' experiences that might differentially benefit English language learners.
First we explore teachers' experience teaching ELL students, then, pre-service preparation, in-service
professional development, and ESL certifications.
Prior experience teaching ELL students. Generic returns to teaching experience are well
documented in both this and prior research. Less research has considered how teachers may benefit
from different kinds of teaching experience. Our investigation of the type of prior teaching experience
that teachers receive suggests that there are differential returns to experience teaching ELL students,
particularly among novice teachers. Table 7a provides an overview of school fixed effects analyses
related to our research question. First, across all teachers, having taught more than six ELL students in
the prior school year predicts significantly higher student learning gains in the current year. The
comparative advantage in current year performance for this group is more than twice as large for ELL
students (0.024 standard deviations higher) as for non-ELL students (0.010 standard deviations higher).
Digging deeper, we find that the bulk of this differential advantage is driven by differences in
performance among second year teachers. In this group, prior-year experience with ELL students
predicts much larger student achievement gains, particularly for ELL students, with 0.069 standard
deviations higher performance for ELL students, relative to just 0.012 standard deviations higher for
non-ELL students. These gains to experience for ELL students control for the typical gains of all second-
year teachers relative to their first-year colleagues. The difference in effect sizes for these two groups is
significant, and is comparable in magnitude to the average difference in learning gains of all teachers
between their first and second year of teaching, as reported in Table 6a.1
1 As detailed in the specification checks in Appendix 2, we investigate and find no evidence that second year experience effects are driven by teacher attrition patterns.
21
We find further corroboration of this differential return to prior experience teaching ELLs among
second year teachers in the teacher fixed effects model results shown in Table 7b. Here, we compare
teachers’ own performance between their first and second years, and investigate how the relative ELL
learning gap of their own students varies over this period. For teachers in their second year of teaching
who taught more than six ELL students in their first year, we see a significant 0.031 standard deviation
improvement in their ELL versus non-ELL learning gap, relative to an average ELL versus non-ELL learning
gap of -0.093 standard deviations for all teachers. Moreover, we observe that teachers in their second
year who did not teach more than six ELL students in their first year have 0.012 standard deviations
larger ELL/non-ELL gaps, though this effect is not significant at the .05 level (p=0.09). It may be that
teachers are challenged to learn different skills in their first year of teaching, depending on whether or
not they are exposed to ELL students, with implications for the academic success of future students.
We also consider whether frequent experience with ELL students over a five year period
predicts a differential advantage for teaching ELLs. Our within-teacher analysis of this effect in Table 7b
indicates a differential advantage with ELL students predicted by both the first and second years of
accumulated prior experience teaching ELL students, but no apparent returns for additional years of ELL
experience beyond that. However, our within-school analysis of the same effect (Table 7a) does not find
any significant differences in terms of effectiveness with ELLs.
Reported preparation to teach ELLs. While teacher learning experiences relevant to ELL
instruction may happen informally “on the job,” significant investment and attention has been focused
on formal teacher preparation to support ELL students, through both pre-service and in-service training
experiences. We find that reported training experiences that address specific instructional strategies for
teaching ELL students predict significant differential efficacy in teaching ELLs. As shown in Table 8a,
teachers who reported pre-service training experiences including opportunities to learn ELL-specific
instructional strategies “in some depth” or “extensively” were differentially more effective with their ELL
22
students (0.090 standard deviations higher learning gains) than their non-ELL students (0.035 standard
deviations lower – but not statistically different from zero) in within-school comparisons to other
teachers who did not report such preparation. This differential benefit to ELLs was somewhat smaller,
but still statistically significant in within-teacher analysis of relative ELL achievement gaps (see Table 8b),
with relative ELL learning gaps 0.091 standard deviations smaller for teachers who received this level of
reported pre-service training.
Table 8a also shows that teachers who reported receiving more than nine hours of in-service
professional development (PD) focused on ELL instructional strategies in the first half of their first year
of teaching, when compared to teachers who did not receive such PD, had greater differential efficacy
with ELLs. Following a similar pattern to pre-service results, effect sizes appear larger in the within-
school comparison (Table 8a), but directionally the same as in the within-teacher comparison (Table 8b)
of relative ELL achievement gaps. The observed in-service PD effect was most pronounced in the same
year in which the PD was received, with, for example, an advantage of 0.226 standard deviations in
relative ELL versus non-ELL learning gains in the within-teacher analysis. It is notable that, overall across
ELLs and non-ELLs in the within-school analysis, teachers who receive PD of this type appear less
effective than their peers, but this is not necessarily surprising given the non-random assignment of such
PD to teachers – either at their request or that of school or district leaders.
Certifications. Existing research on the effects of specialized certification to teach ELL students
has relied primarily on school-level aggregates of teacher certification rates, rather than teacher level
data, and has yielded mixed results. We find that ESL certification for teachers in NYC does not predict
differential effectiveness with ELL students among all teachers, but does predict significant differential
advantages when comparing novice teachers with three or fewer years of teaching experience, as
detailed in Tables 9a and 9b. For example, the within-teacher relative ELL learning gap is 0.080 standard
deviations smaller for ESL certified novice teachers than for other novice teachers. This pattern is also
23
apparent in the school fixed effect model specification. Moreover, the bulk of this effect appears to be
driven by differential effectiveness of novice ESL teachers in elementary school grades relative to their
peers, rather than middle school grades.2
Do teacher background characteristics predict effectiveness with ELL students?
Spanish fluency. Teacher fluency in ELL students’ primary language is a requirement for
teachers of bilingual education programs, which have usually been studied with regards to their effects
for reading comprehension or English language acquisition. However, few studies have examined
teacher fluency when it is not linked explicitly to a particular instructional program, or among teachers
of non-reading subjects. In our investigation, we do not find any association between math teachers’
reported fluency in Spanish and differential effectiveness with Hispanic ELL students, as shown in Tables
10a and 10b. Neither native nor non-native fluency predicts significantly different ELL learning gains,
under either the within-school or the within-teacher model specifications.
Preference to teach ELL students. We do, however, find teachers’ reported preferences to teach
at a school site with more ELL students to be a highly significant predictor of differential effectiveness
with ELL students. Tables 10a and 10b report these results which are similar across both within-school
and within-teacher model specifications, with effect sizes comparable to many of the teacher
preparation findings discussed previously. For example, the within-teacher analysis shows these
teachers’ relative ELL versus non-ELL learning gap to be 0.094 standard deviations smaller than that of
comparison teachers in the same school. Nevertheless, some caution is merited in interpreting these
2 We also investigated teachers who enter teaching via alternate pathways such as Teach for America (TFA) and New York City Teaching Fellows (NYCTF), but neither offers as much evidence of differential effectiveness with ELL students as teacher’s ESL certification status. TFA teachers appear to be more effective with ELL students than their peers, but primarily in middle school grades and only in school fixed effect model specifications. NYCTF teachers, on the other hand, display no absolute advantage with ELLs relative to their within school peers, but demonstrate a smaller ELL versus non-ELL learning gap within their own classrooms, in elementary grades.
24
results, as recalled site preferences were reported well after teachers’ first year of teaching was well
under-way, which may have colored teachers’ responses.
Discussion and Conclusions
In this investigation, we identify several teacher characteristics that predict differential
effectiveness with ELL students, particularly among novice teachers. Prior experience teaching ELL
students, specialized training and certification, and teacher preferences all hold promise as indicators of
differential ELL instructional impact. The effect sizes we identify are in most cases larger than generic
returns to teacher experience or other established indicators of general teacher ability. In some cases,
effect sizes predict differential ELL achievement gains that are as large or larger than the typical within-
teacher ELL achievement gain gap, which means that ELLs in these classrooms are not losing ground
relative to their non-ELL peers. We also find that some traditional indicators of effective teachers, such
as test scores or non-ELL teaching experience, may not be as relevant when it comes to ELL instruction.
Teachers’ own language fluency in ELLs’ home language also was not predictive of effectiveness.
These findings suggest that closing the ELL achievement gap may require not only a focus on
enlisting or training generically ‘better’ teachers for ELL classrooms, but also greater attention to those
instructional skills and characteristics most relevant to ELL instruction. In particular, the improvement in
ELL effectiveness among teachers who gain experience teaching ELL students provides credible evidence
that a distinct skill-set is valuable for teaching ELLs and that these skills can be learned through practice.
In the cases of specialized certification or pre-service and in-service training, we cannot definitively
distinguish between those preparation experiences that may have increased teachers’ instructional
expertise at ELL instruction from those that may simply help to sort teachers with differential ability,
motivation, or programmatic supports to teach ELL students. That said, in line with our findings about
on-the-job experience, it is certainly plausible that these types of ELL-specific training experiences also
25
directly support teacher learning in this vein. Separately, the observed association between differential
effectiveness and teachers’ preferences to teach ELL students suggests that teacher motivation or
affinity may also be important factors in the assignment and hiring of ELL teachers.
While these results suggest that ELL-specific instructional practice and training may be
worthwhile investments, more research is needed to better understand which specific skills are most
relevant for supporting academic achievement among English language learners. A significant body of
theory exists recommending elements of effective ELL instruction, but little evidence exists to test these
assertions. Which important teacher practices are developed through experience teaching ELLs? What,
if any, key skills can be reliably developed through training to improve instructional efficacy with ELLs?
How important are motivation and awareness of ELL students’ unique needs within heterogeneous
classroom settings? Research that attends to the learning gains of ELL students in particular and that
examines specific instructional interventions over time to directly assess improvement in teacher
effectiveness with ELL students could inform instructional decisions to reduce the gap in achievement
between English learners and other students. This study helps to lay the groundwork for additional
exploration of these topics, and our results indicate that such investigation may yield valuable insights
for closing the ELL achievement gap.
26
References:
August, D. and Shanahan, T., eds. (2006). Developing Literacy in Second-Language Learners: Report of the National Literacy Panel on Language-Minority Children and Youth. Mahwah, NJ: Lawrence Erlbaum. Ballantyne, K. G., Sanderman, A. R., & Levy, J. (2008). Educating English language learners: Building teacher
capacity. Washington, DC: National Clearinghouse for English Language Acquisition. Retrieved from http://www.ncela.gwu.edu/files/uploads/3/EducatingELLsBuildingTeacherCapacityVol1.pdf
Betts, J., Zau, A., & Rice, L. (2003). Determinants of Student Achievement: New Evidence from San Diego. San Francisco, CA: Public Policy Institute of California. Retrieved from http://epsl.asu.edu/epru/articles/EPRU-0309-39-OWI.pdf
Boyd, D., Grossman, P., Hammerness, K., Lankford, H., Loeb, S., McDonald, M., Reininger, M., Ronfeldt, M., & Wyckoff, J. (2008). Surveying the Landscape of Teacher Education in New York City: Constrained Variation and the Challenge of Innovation. Education Evaluation and Policy Analysis, 30(4), 319-343.
Boyd, D., Lankford, H., Loeb, S., Rockoff, J., & Wyckoff, J. (2008b). The Narrowing Gap in New York City Teacher Qualifications and its Implications for Student Achievement in High-Poverty Schools. Journal of Policy Analysis and Management, 27(4), 793-818.
Boyd, D., Grossman, P., Hammerness, K., Lankford, H., Loeb, S., & Wyckoff, J. (2009). Teacher Preparation and Student Achievement. Education Evaluation and Policy Analysis, 31(4), 416-440.
Buddin, R., & Zamarro, G. (2009). Teacher qualifications and student achievement in urban elementary schools. Journal of Urban Economics, 66(2), 103-115.
Callahan, R. (2005). Tracking and High School English Learners: Limiting Opportunity to Learn. American Educational Research Journal, 42(2), 305-328.
Casteel, C.J. & Ballantyne, K.G. (Eds.). (2010). Professional Development in Action: Improving Teaching for English Learners. Washington, DC: National Clearinghouse for English Language Acquisition. Available at http://www.ncela.gwu.edu/files/uploads/3/PD_in_Action.pdf
Clotfelter et al. (2007). Charles T. Clotfelter, Helen F. Ladd and Jacob L. Vigdor, “How and why do teacher credentials matter for student achievement?” CALDER Working Paper #2.
DeAngelis, K.J., Presley, J.B., & White, B.R. (2005). The Distribution of Teacher Quality in Illinois. (Policy Research Report: IERC 2005-1.) Edwardsville, IL: Illinois Education Research Council. Retrieved from http://ierc.siue.edu/documents/Teacher_Quality_IERC_%202005-1.pdf
Dee, T.S. (2005). A teacher like me: Does race, ethnicity, or gender matter? American Economic Review, 95(2), 158–165.
Dutro, S. & Kinsella, K. (2010). English Language Development: Issues and Implementation at Grades Six through Twelve. In Improving Education for English Learners: Research-Based Approaches. In Improving Education for English Learners: Research-Based Approaches. California Department of Education.
27
Faltis, C., Arias, M. B., & Ramirez-Marin, F. (2009). Building consensus: Critical competencies for secondary teachers of English learners. Paper presented at the annual meeting of the Language Minority Research Institute, Riverside, CA.
Frede, E. C. & García, E. E. (2010). A Policy and Research Agenda for Teaching Young English Language Learners. In E. E. García & E. C. Frede (Eds.), Young English Language Learners: Current Research and Emerging Directions for Practice and Policy (pp. 185–96). New York, NY: Teachers College Press.
Fry, Richard. (2007). How Far Behind in Math and Reading are English Language Learners? June. Washington, DC: Pew Hispanic Center.
Garcia, E. (2010). Education and Achievement: A Focus on Latino “Immigrant” Children. Washington, DC: The Urban Institute. Retrieved from http://www.urban.org/uploadedpdf/412262-Education-and-Achievement.pdf
Glazerman, S., Mayer, D., & Decker, P. (2006). Alternative routes to teaching: The impacts of Teach for America on student achievement and other outcomes. Journal of Policy Analysis and Management, 25(1), 75–96.
Goodman-Shah, A. (2009). The 2008-09 Demographics of New York City’s English Language Learners. New York City Department of Education: Chief Achievement Office, Students with Disabilities and English Language Learners. Retrieved from http://schools.nyc.gov/NR/rdonlyres/CB259AF4-6008-4170-BBC7-D31E283D999B/74495/NEWDRAFT_12_09_FINAL.pdf
Greene, J. P. (1998). A Meta-analysis of the Effectiveness of Bilingual Education. Claremont, CA: Thomas Rivera Policy Institute. Retrieved from http://www.hks.harvard.edu/pepg/PDF/Papers/biling.pdf
Hakuta, K., and Beatty, A., eds. (2000). Testing English language learners in U.S. schools: Report and workshop summary. National Research Council. Washington, DC: National Academy Press.
Hill, H. C., Rowan, B., & Ball, D. L. (2005). Effects of teachers’ mathematical knowledge for teaching on student achievement. American Education Research Journal, 42(2), 371-406.
Hollins, E. R., & Guzman, M. T. (2005). Research on preparing teachers for diverse populations. In M. Cochran-
Smith & K. M. Zeichner (Eds.), Studying teacher education: The report of the AERA panel on research and teacher education (pp. 477–548). Mahwah, NJ: Lawrence Erlbaum Associates.
Horwitz, A., Uro, G., Price-Baugh, R., Simon, C., Uzzell, R., Lewis, S., & Casserly, M. (2009). Succeeding with English Language Learners: Lessons Learned from the Great City Schools. Washington, DC: Council of the Great City Schools. Retrieved from http://www.cgcs.org/publications/ELL_Report09.pdf
Howard, E. R., Sugarman, J., & Christian, D. (2003). Trends in two-way immersion education: A review of the research. Washington, DC: Center for Applied Linguistics.
Jepsen, C., & Alth, S. (2005). English Learners in California Schools. San Francisco, CA: Public Policy Institute of California. Retrieved from http://www.ppic.org/content/pubs/report/R_405CJR.pdf
Kane et al. (2006). Kane, Thomas J., Jonah E. Rockoff and Douglas O. Staiger. “What Does Certification Tell Us About Teacher Effectiveness? Evidence from New York City.” Working Paper #12155.
Lankford, H., Loeb, S., & Wyckoff, J. (2002). Teacher Sorting and the Plight of Urban Schools: A Descriptive
28
Analysis. Educational Evaluation and Policy Analysis, 24(1), 37–62.
Lucas, T., & Grinberg, J. (2008). Responding to the linguistic reality of mainstream classrooms: Preparing all teachers to teach English language learners. In M. Cochran-Smith, S. Feiman-Nemser, & D. J. McIntyre (Eds.), Handbook of research on teacher education (3rd ed., pp. 606–636). New York: Routledge.
McGraner, K.L. & Saenz, L. (2009). Preparing teachers of English language learners. Washington, DC: National Comprehensive Center for Teacher Quality. Retrieved from http://www.tqsource.org/publications/issuepaper_preparingELLteachers.pdf
New York City Office of the Mayor (2003). Mayor Michael R. Bloomberg and schools chancellor Joel Klein announce reforms to improve instruction for English Language Learners in New York City Public Schools [Press release]. Retrieved from http://www.nyc.gov
Barbara Nye, Spyros Konstantopoulos and Larry V. Hedges. (2004). How large are teacher effects?. Educational Evaluation and Policy Analysis, 26(3), 237–257.
Peske, H., & Haycock, K. (2006). Teaching Inequality: How Poor and Minority Students are Shortchanged on Teacher Quality. A Report and Recommendations by the Education Trust. Washington, DC: The Education Trust. Retrieved from http://www.edtrust.org/sites/edtrust.org/files/publications/files/TQReportJune2006.pdf
Rice, J. K. (2003). Teacher Quality: Understanding the Effectiveness of Teacher Attributes. Washington, DC: Economic Policy Institute.
Rivkin, Steven G., Eric A. Hanushek, and John F. Kain. (2005). Teachers, schools, and academic achievement. Econometrica 73(2), 417–58.
Rockoff, J., Jacob, B., Kane, T.and Staiger, D, (Forthcoming). Can You Recognize an Effective Teacher When You
Recruit One? Education Finance and Policy (Earlier version available as NBER #14485)
Rolstad, K., Mahoney, K., & Glass, G. V. (2005). The Big Picture: A Meta-Analysis of Program Effectiveness Research on English Language Learners. Educational Policy, 19(4), 572–94.
Ronfeldt, M. (forthcoming). Where should student teachers learn to teach? Effects of field placement school characteristics on teacher retention and effectiveness, Education Evaluation and Policy Analysis.
Sass, T., Hannaway, J., Xu, Z., Figlio, D., & Feng, L. (2010). Value Added of Teachers in High-Poverty Schools and Lower-Poverty Schools (Working Paper 52). Washington, DC: National Center for Analysis of Longitudinal Data in Education Research.
Saunders, W. J. & O’Brien, G. (2006). Oral language. In F. Genesee, K. Lindholm-Leary, W.M. Saunders, & D. Christian (Eds.), Educating English language learners: A synthesis of research evidence (pp. 2–63). New York: Cambridge University Press.
Slavin, R., & Cheung, A. (2005). A Synthesis of Research on Language of Reading Instruction for English Language Learners. Review of Education Research, 75(2), 247–84.
Slavin, R., Madden, N., Calderon, M., Chamberlain, A., & Hennessy, M. (2010). Reading and language outcomes of a five-year randomized evaluation of transitional bilingual education. Baltimore, MD: Johns Hopkins University. Retrieved from http://www.bestevidence.org/word/bilingual_education_Apr_22_2010.pdf

29
U.S. Department of Education, National Center for Education Statistics (2002). Schools and Staffing Survey: 1999-2000. Overview of the data for public, private, public charter, and Bureau of Indian Affairs elementary and secondary schools (NCES 2002-313). Washington, DC: Author. Retrieved from http://nces.ed.gov/pubs2002/2002313.pdf
U.S. Department of Education, National Center for Education Statistics (2003). Overview of Public Elementary and Secondary Schools and Districts: School Year 2001–2002 (NCES 2003-411). Washington, DC: Author. Retrieved from http://nces.ed.gov/pubs2003/2003411.pdf
Vogt, M. (2009). Teachers of English Learners: Issues of Preparation and Professional Development. In F. Falk-Ross, S. Szabo, M. B. Sampson & M. M. Foot (Eds.), Literacy Issues During Changing Times: A Call to Action. (College Reading Association Yearbook, Volume 30: pp. 23–36). Retrieved from http://www.aleronline.org/PDF%20files/Yearbook%20Volume%2030.pdf
Waxman, H. C., Padrón, Y. N., & García, A. (2007). Educational issues and effective practices for Hispanic students. In S.J. Paik & H. J. Walberg (Eds.), Narrowing the Achievement Gap. Strategies for Educating Latino, Black, and Asian Students (pp. 131–151). New York, NY: Springer.
Wayne, Andrew J., & Youngs, Peter. (2003). Teacher characteristics and student achievement gains. Review of Educational Research, 73(1), 89–122.
Wenglinsky, H. (2002). How schools matter: The link between teacher classroom practices and student academic performance. Education Policy Analysis Archives, 10(12).
Williams, T., Kirst, M., Haertel, E., et al. (2005). Similar Students, Different Results: Why Do Some Schools Do Better? A large-scale survey of California elementary schools serving low-income students. Mountain View, CA: EdSource. Retrieved from http://www.edsource.org/iss_research_SimStu_initial.html
Willig, A. C. (1985). A meta-analysis of selected studies on the effectiveness of bilingual education. Review of Educational Research, 55(3), 269-317.
Xu, Z., Hannaway, J., & Taylor, C. (2009). Making a Difference? The Effects of Teach for America in High School. (Working Paper 17. Revised). Washington, DC: National Center for Analysis of Longitudinal Data in Education Research.
Zehler A., Fleischman H., Hopstock P., Stephenson T., Pendzick M., & Sapru S. (2003). Descriptive Study of Services to LEP Students and LEP Students with Disabilities (Volume 1, Research Report). Report prepared for the U.S. Department of Education, Office of English Language Acquisition, Language Enhancement, and Academic Achievement of Limited English Proficient Students (OELA). Washington, DC: Development Associates, Inc. Retrieved from http://www.ncela.gwu.edu/files/rcd/BE021192/volI_research_fulltxt.pdf
Zetlin, A., Beltran, D., Salcido, P., Gonzalez, T., & Reyes, T. (2010). Building a Pathway of Optimal SupportforEnglish Language Learners in Special Education. Journal of Teacher Education and Special Education, 34(1), 59–70.
30
Tables
TABLE 1 Percentage of students who are ELLs and standardized math test scores in New York City, by year
Year
Total
2002 2003 2004 2005 2006 2007 2008
Percentage of students who are ELLs 11.30%
7.80% 10.80% 10.80% 12.00% 11.70% 12.80% 13.00%
Percentage of ELLs in each grade of study
Grade 4 11.90%
7.00% 10.20% 10.30% 13.20% 12.30% 15.90% 15.70% Grade 5 10.60%
7.00% 10.10% 11.10% 10.40% 11.10% 12.10% 13.10%
Grade 6 10.90%
7.80% 10.30% 10.70% 12.50% 10.70% 11.70% 12.40% Grade 7 11.20%
8.70% 11.10% 10.90% 12.30% 12.10% 11.20% 12.10%
Grade 8 11.60%
9.00% 12.60% 11.30% 11.80% 12.20% 12.50% 11.40%
Standardized math test scores -0.63 -0.63 -0.69 -0.66 -0.65 -0.6 -0.61 -0.59
31
Table 2 Race/ethnicity and Free or reduced price lunch, by ELL status
ELLs Non-ELLs Race/ethnicity White 7% 15% Black 6% 36% Hispanic 70% 35% Asian 18% 13% Other race/ethnicity 0% 1% Free or reduced price lunch 76% 68% Home language is English 0% 63%
Note: Data shown are for students in grades 4 through 8, from SY2002 to SY2008.
32
TABLE 3 Basic distribution of ELLs across classrooms
% ELLs in the class % Free or reduced price lunch
% Hispanic
% Asian
% Black
% of all ELLs at or below percentile
(cumulative) Mean across all classrooms 11 61 39 14 33 n/a
Percentiles 25th 0 56 29 14 38 0 50th 3 55 33 16 31 1 75th 9 68 40 10 39 15 90th 40 70 60 17 13 37 95th 94 73 78 15 3 56
Note: Data shown are for students in grades 4 through 8, from SY2002 to SY2008.
33
TABLE 4 Characteristics of teachers serving ELL and non-ELL students, district-wide
% Taught by Teachers with 1 or 2 Years of
Experience
Initial LAST Scores (and std. deviation)
Mean across NYC 25.2 243 (30.2)
Mean for ELLs 23.7 237 (33.8)
Mean for non-ELLs 25.7 246 (29.6) Note: Data shown are for students in grades 4 through 8, from SY2002 to SY2008.
34
TABLE 5 Responses and # of respondents for first year teacher survey questions of interest
% Yes Total N
1. Fluency in languages other than English: % that self-identified as fluent in Spanish?
15.7 1185
2. Pre-service opportunity to learn instructional strategies for teaching ELLs: % that “explored in some depth” or “extensively”?
14.1 1210
3. By mid-year, # of hours of in-service PD focused on ELL instruction: % reporting “>9,” “>17,” or “>33 hours” so far this year?
13.9 1202
4. Preference to teach at a school with many ELLs: % reporting that they “prefer” or “strongly prefer” sites with many ELLs?
15.2 1202
Note: Data shown are from teacher respondents in their first year of teaching in NYC schools in SY2005.
35
TABLE 6a
The Relationship Between Teachers’ Experience and their Own Test Results and ELL versus non-ELL Student Test Performance ELL Students Non-ELL Students Teacher initially failed the LAST exam – (1) 0.012 -0.014*** (0.009) (0.004) 2nd year teaching in NYC 0.056*** 0.057*** (0.011) (0.004) 3rd year teaching in NYC 0.091*** 0.076*** (0.011) (0.004) 4th year teaching in NYC 0.089*** 0.093*** (0.012) (0.004) 5th year teaching in NYC 0.092*** 0.098*** (0.012) (0.005) 6th year teaching in NYC 0.086*** 0.097*** (0.014) (0.005) 7th year teaching in NYC 0.079*** 0.094*** (0.015) (0.006) 8th year teaching in NYC 0.058*** 0.082*** (0.015) (0.006) 9th year teaching in NYC 0.068*** 0.088*** (0.016) (0.007) 10 or more years teaching in NYC 0.076*** 0.07*** (0.013) (0.006) Observations 126,968 1,246,773 Number of Schools 1,060 1,097 R^2 0.459 0.549 p(F) comparison of ELL and non-ELL models for (1) above 0.003** Note: LAST = Liberal Arts and Science Test; NYC = New York City; ELL = English language learner. ~p<.1, *p < .05, **p < .01, ***p < .001. Model includes controls for student prior performance and demographic characteristics, comparable classroom average characteristics (including percent of students designated as ELLs), teacher’s race, and individual year, grade and school fixed effects, as detailed in Appendix 1 Table 1.
36
TABLE 6b
The Relationship Between Teachers’ Experience and their Own Test Results and ELL versus non-ELL Relative Test Performance Within their Classrooms
ELL versus Non-ELL Achievement Gap
ELL versus Non-ELL Achievement Gap
Teacher initially failed the LAST exam x ELLs 0.005 6th year teaching in NYC x ELLs -0.005 (0.005) (0.009) 2nd year teaching in NYC x ELLs -0.002 7th year teaching in NYC x ELLs -0.005 (0.007) (0.010) 3rd year teaching in NYC x ELLs 0.007 8th year teaching in NYC x ELLs -0.003 (0.008) (0.011) 4th year teaching in NYC x ELLs -0.001 9th year teaching in NYC x ELLs -0.004 (0.008) (0.012) 5th year teaching in NYC x ELLs (0.004 10 or more years teaching in NYC x ELLs 0.029** (0.009) (0.009)
Observations 1,051,374 Number of Teachers 15,403 R^2 0.533 Note: LAST = Liberal Arts and Science Test; NYC = New York City; ELL = English language learner. *p < .05, **p < .01, ***p < .001. Model includes controls for student prior performance and demographic characteristics, comparable classroom average characteristics (including percent of students designated as ELLs), teacher’s race, individual year and grade fixed effects, and school fixed effects interacted with ELL status, as detailed in Appendix 1 Table 1.
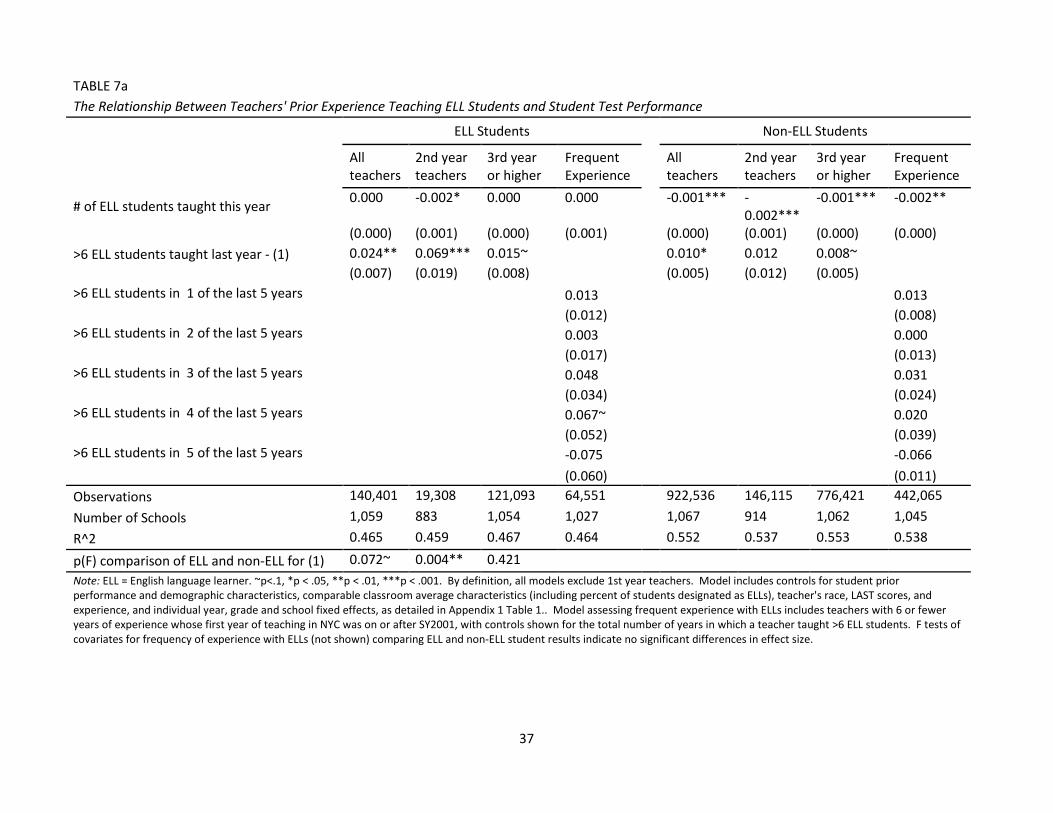
37
TABLE 7a The Relationship Between Teachers' Prior Experience Teaching ELL Students and Student Test Performance
ELL Students Non-ELL Students
All teachers
2nd year teachers
3rd year or higher
Frequent Experience
All teachers
2nd year teachers
3rd year or higher
Frequent Experience
# of ELL students taught this year 0.000 -0.002* 0.000 0.000 -0.001*** -0.002***
-0.001*** -0.002**
(0.000) (0.001) (0.000) (0.001) (0.000) (0.001) (0.000) (0.000)
>6 ELL students taught last year - (1) 0.024** 0.069*** 0.015~ 0.010* 0.012 0.008~
(0.007) (0.019) (0.008) (0.005) (0.012) (0.005)
>6 ELL students in 1 of the last 5 years 0.013
0.013 (0.012)
(0.008)
>6 ELL students in 2 of the last 5 years 0.003
0.000 (0.017)
(0.013)
>6 ELL students in 3 of the last 5 years 0.048
0.031 (0.034)
(0.024)
>6 ELL students in 4 of the last 5 years 0.067~
0.020 (0.052)
(0.039)
>6 ELL students in 5 of the last 5 years -0.075
-0.066 (0.060) (0.011)
Observations 140,401 19,308 121,093 64,551 922,536 146,115 776,421 442,065 Number of Schools 1,059 883 1,054 1,027 1,067 914 1,062 1,045 R^2 0.465 0.459 0.467 0.464 0.552 0.537 0.553 0.538
p(F) comparison of ELL and non-ELL for (1) 0.072~ 0.004** 0.421 Note: ELL = English language learner. ~p<.1, *p < .05, **p < .01, ***p < .001. By definition, all models exclude 1st year teachers. Model includes controls for student prior performance and demographic characteristics, comparable classroom average characteristics (including percent of students designated as ELLs), teacher's race, LAST scores, and experience, and individual year, grade and school fixed effects, as detailed in Appendix 1 Table 1.. Model assessing frequent experience with ELLs includes teachers with 6 or fewer years of experience whose first year of teaching in NYC was on or after SY2001, with controls shown for the total number of years in which a teacher taught >6 ELL students. F tests of covariates for frequency of experience with ELLs (not shown) comparing ELL and non-ELL student results indicate no significant differences in effect size.
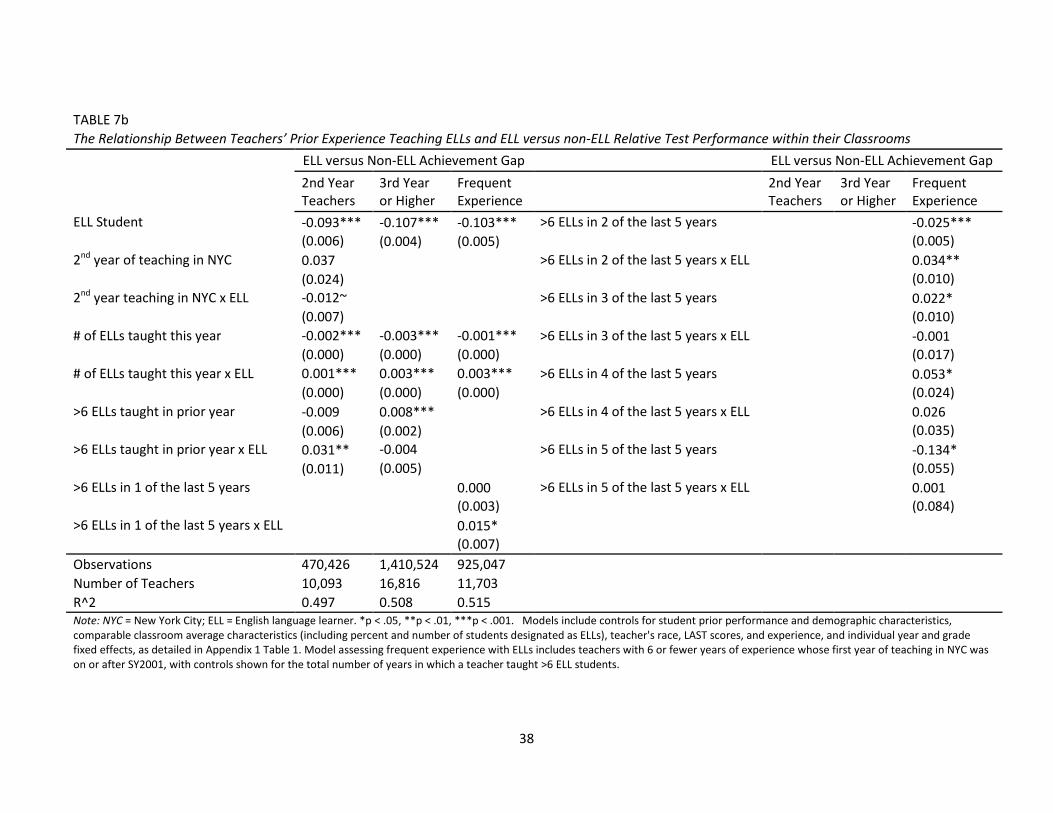
38
TABLE 7b The Relationship Between Teachers’ Prior Experience Teaching ELLs and ELL versus non-ELL Relative Test Performance within their Classrooms
ELL versus Non-ELL Achievement Gap ELL versus Non-ELL Achievement Gap
2nd Year Teachers
3rd Year or Higher
Frequent Experience 2nd Year
Teachers 3rd Year or Higher
Frequent Experience
ELL Student -0.093*** -0.107*** -0.103*** >6 ELLs in 2 of the last 5 years
-0.025***
(0.006) (0.004) (0.005)
(0.005) 2nd year of teaching in NYC 0.037 >6 ELLs in 2 of the last 5 years x ELL
0.034**
(0.024)
(0.010) 2nd year teaching in NYC x ELL -0.012~ >6 ELLs in 3 of the last 5 years
0.022*
(0.007)
(0.010) # of ELLs taught this year -0.002*** -0.003*** -0.001*** >6 ELLs in 3 of the last 5 years x ELL
-0.001
(0.000) (0.000) (0.000)
(0.017) # of ELLs taught this year x ELL 0.001*** 0.003*** 0.003*** >6 ELLs in 4 of the last 5 years
0.053*
(0.000) (0.000) (0.000)
(0.024) >6 ELLs taught in prior year -0.009 0.008*** >6 ELLs in 4 of the last 5 years x ELL
0.026
(0.006) (0.002)
(0.035) >6 ELLs taught in prior year x ELL 0.031** -0.004 >6 ELLs in 5 of the last 5 years
-0.134*
(0.011) (0.005)
(0.055) >6 ELLs in 1 of the last 5 years
0.000 >6 ELLs in 5 of the last 5 years x ELL
0.001
(0.003)
(0.084) >6 ELLs in 1 of the last 5 years x ELL
0.015*
(0.007) Observations 470,426 1,410,524 925,047 Number of Teachers 10,093 16,816 11,703 R^2 0.497 0.508 0.515 Note: NYC = New York City; ELL = English language learner. *p < .05, **p < .01, ***p < .001. Models include controls for student prior performance and demographic characteristics, comparable classroom average characteristics (including percent and number of students designated as ELLs), teacher's race, LAST scores, and experience, and individual year and grade fixed effects, as detailed in Appendix 1 Table 1. Model assessing frequent experience with ELLs includes teachers with 6 or fewer years of experience whose first year of teaching in NYC was on or after SY2001, with controls shown for the total number of years in which a teacher taught >6 ELL students.
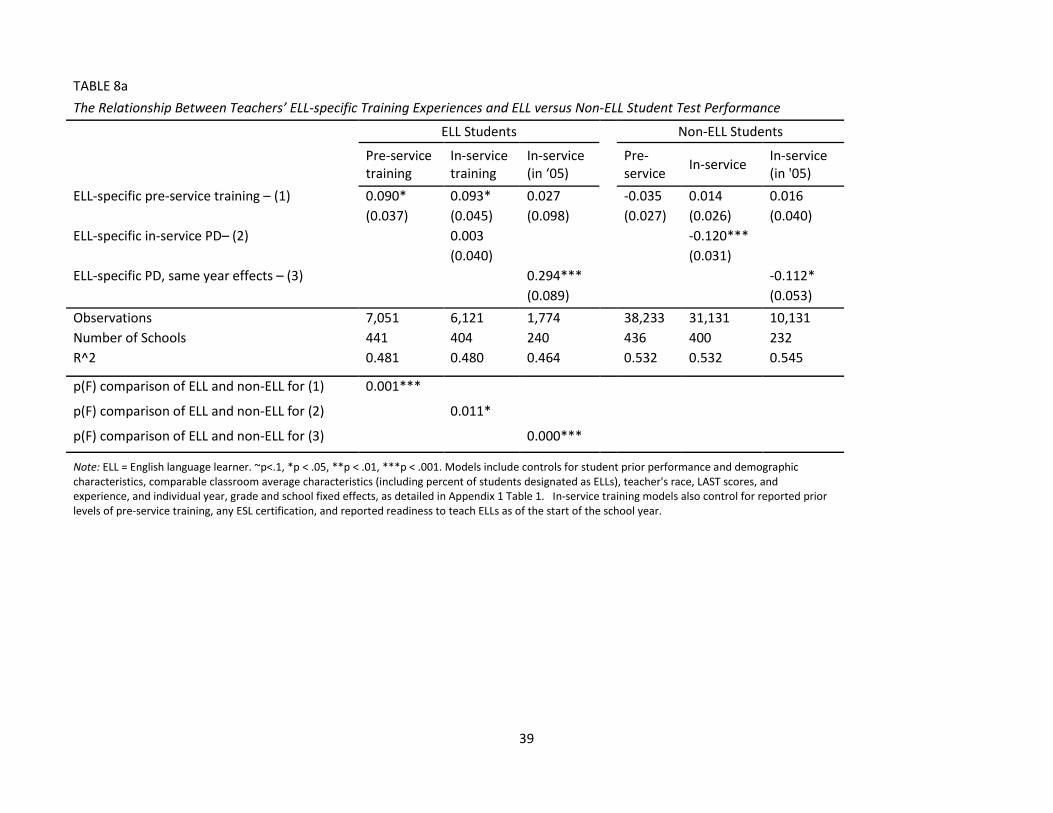
39
TABLE 8a The Relationship Between Teachers’ ELL-specific Training Experiences and ELL versus Non-ELL Student Test Performance
ELL Students Non-ELL Students
Pre-service training
In-service training
In-service (in ‘05)
Pre-service In-service In-service
(in '05)
ELL-specific pre-service training – (1) 0.090* 0.093* 0.027 -0.035 0.014 0.016 (0.037) (0.045) (0.098) (0.027) (0.026) (0.040) ELL-specific in-service PD– (2) 0.003 -0.120*** (0.040) (0.031) ELL-specific PD, same year effects – (3) 0.294*** -0.112* (0.089) (0.053) Observations 7,051 6,121 1,774 38,233 31,131 10,131 Number of Schools 441 404 240 436 400 232 R^2 0.481 0.480 0.464 0.532 0.532 0.545
p(F) comparison of ELL and non-ELL for (1) 0.001***
p(F) comparison of ELL and non-ELL for (2) 0.011*
p(F) comparison of ELL and non-ELL for (3) 0.000***
Note: ELL = English language learner. ~p<.1, *p < .05, **p < .01, ***p < .001. Models include controls for student prior performance and demographic characteristics, comparable classroom average characteristics (including percent of students designated as ELLs), teacher's race, LAST scores, and experience, and individual year, grade and school fixed effects, as detailed in Appendix 1 Table 1. In-service training models also control for reported prior levels of pre-service training, any ESL certification, and reported readiness to teach ELLs as of the start of the school year.
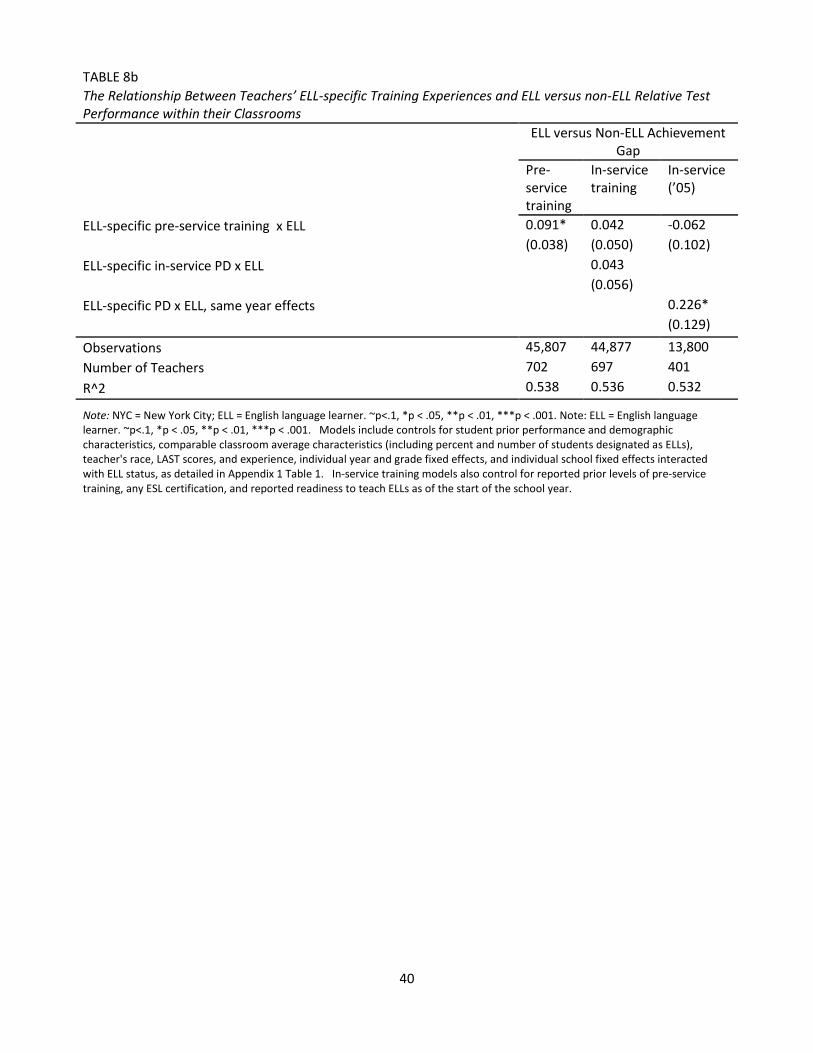
40
TABLE 8b The Relationship Between Teachers’ ELL-specific Training Experiences and ELL versus non-ELL Relative Test Performance within their Classrooms
ELL versus Non-ELL Achievement
Gap
Pre-service training
In-service training
In-service (’05)
ELL-specific pre-service training x ELL 0.091* 0.042 -0.062
(0.038) (0.050) (0.102)
ELL-specific in-service PD x ELL 0.043
(0.056)
ELL-specific PD x ELL, same year effects 0.226* (0.129)
Observations 45,807 44,877 13,800 Number of Teachers 702 697 401 R^2 0.538 0.536 0.532
Note: NYC = New York City; ELL = English language learner. ~p<.1, *p < .05, **p < .01, ***p < .001. Note: ELL = English language learner. ~p<.1, *p < .05, **p < .01, ***p < .001. Models include controls for student prior performance and demographic characteristics, comparable classroom average characteristics (including percent and number of students designated as ELLs), teacher's race, LAST scores, and experience, individual year and grade fixed effects, and individual school fixed effects interacted with ELL status, as detailed in Appendix 1 Table 1. In-service training models also control for reported prior levels of pre-service training, any ESL certification, and reported readiness to teach ELLs as of the start of the school year.
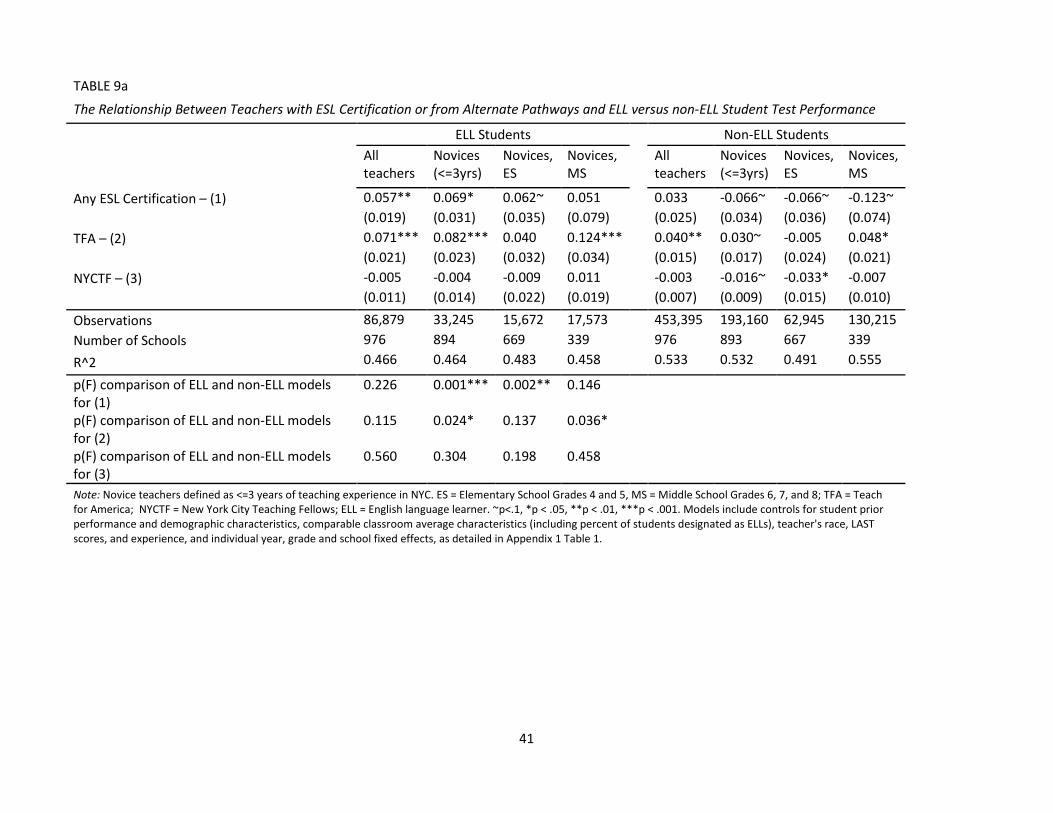
41
TABLE 9a
The Relationship Between Teachers with ESL Certification or from Alternate Pathways and ELL versus non-ELL Student Test Performance
ELL Students Non-ELL Students
All teachers
Novices (<=3yrs)
Novices, ES
Novices, MS
All teachers
Novices (<=3yrs)
Novices, ES
Novices, MS
Any ESL Certification – (1) 0.057** 0.069* 0.062~ 0.051 0.033 -0.066~ -0.066~ -0.123~
(0.019) (0.031) (0.035) (0.079) (0.025) (0.034) (0.036) (0.074)
TFA – (2) 0.071*** 0.082*** 0.040 0.124*** 0.040** 0.030~ -0.005 0.048*
(0.021) (0.023) (0.032) (0.034) (0.015) (0.017) (0.024) (0.021)
NYCTF – (3) -0.005 -0.004 -0.009 0.011 -0.003 -0.016~ -0.033* -0.007 (0.011) (0.014) (0.022) (0.019) (0.007) (0.009) (0.015) (0.010)
Observations 86,879 33,245 15,672 17,573 453,395 193,160 62,945 130,215 Number of Schools 976 894 669 339 976 893 667 339 R^2 0.466 0.464 0.483 0.458 0.533 0.532 0.491 0.555
p(F) comparison of ELL and non-ELL models for (1)
0.226 0.001*** 0.002** 0.146
p(F) comparison of ELL and non-ELL models for (2)
0.115 0.024* 0.137 0.036*
p(F) comparison of ELL and non-ELL models for (3)
0.560 0.304 0.198 0.458
Note: Novice teachers defined as <=3 years of teaching experience in NYC. ES = Elementary School Grades 4 and 5, MS = Middle School Grades 6, 7, and 8; TFA = Teach for America; NYCTF = New York City Teaching Fellows; ELL = English language learner. ~p<.1, *p < .05, **p < .01, ***p < .001. Models include controls for student prior performance and demographic characteristics, comparable classroom average characteristics (including percent of students designated as ELLs), teacher's race, LAST scores, and experience, and individual year, grade and school fixed effects, as detailed in Appendix 1 Table 1.
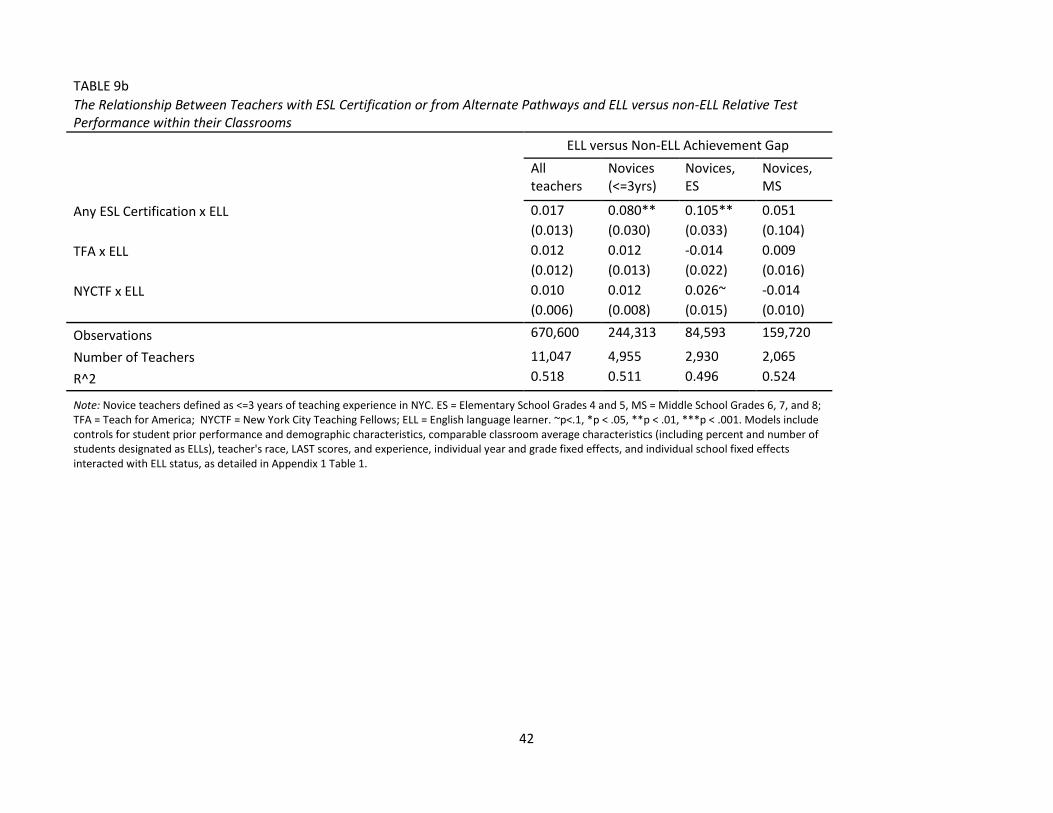
42
TABLE 9b The Relationship Between Teachers with ESL Certification or from Alternate Pathways and ELL versus non-ELL Relative Test Performance within their Classrooms
ELL versus Non-ELL Achievement Gap
All teachers
Novices (<=3yrs)
Novices, ES
Novices, MS
Any ESL Certification x ELL 0.017 0.080** 0.105** 0.051
(0.013) (0.030) (0.033) (0.104)
TFA x ELL 0.012 0.012 -0.014 0.009
(0.012) (0.013) (0.022) (0.016)
NYCTF x ELL 0.010 0.012 0.026~ -0.014 (0.006) (0.008) (0.015) (0.010)
Observations 670,600 244,313 84,593 159,720
Number of Teachers 11,047 4,955 2,930 2,065 R^2 0.518 0.511 0.496 0.524
Note: Novice teachers defined as <=3 years of teaching experience in NYC. ES = Elementary School Grades 4 and 5, MS = Middle School Grades 6, 7, and 8; TFA = Teach for America; NYCTF = New York City Teaching Fellows; ELL = English language learner. ~p<.1, *p < .05, **p < .01, ***p < .001. Models include controls for student prior performance and demographic characteristics, comparable classroom average characteristics (including percent and number of students designated as ELLs), teacher's race, LAST scores, and experience, individual year and grade fixed effects, and individual school fixed effects interacted with ELL status, as detailed in Appendix 1 Table 1.
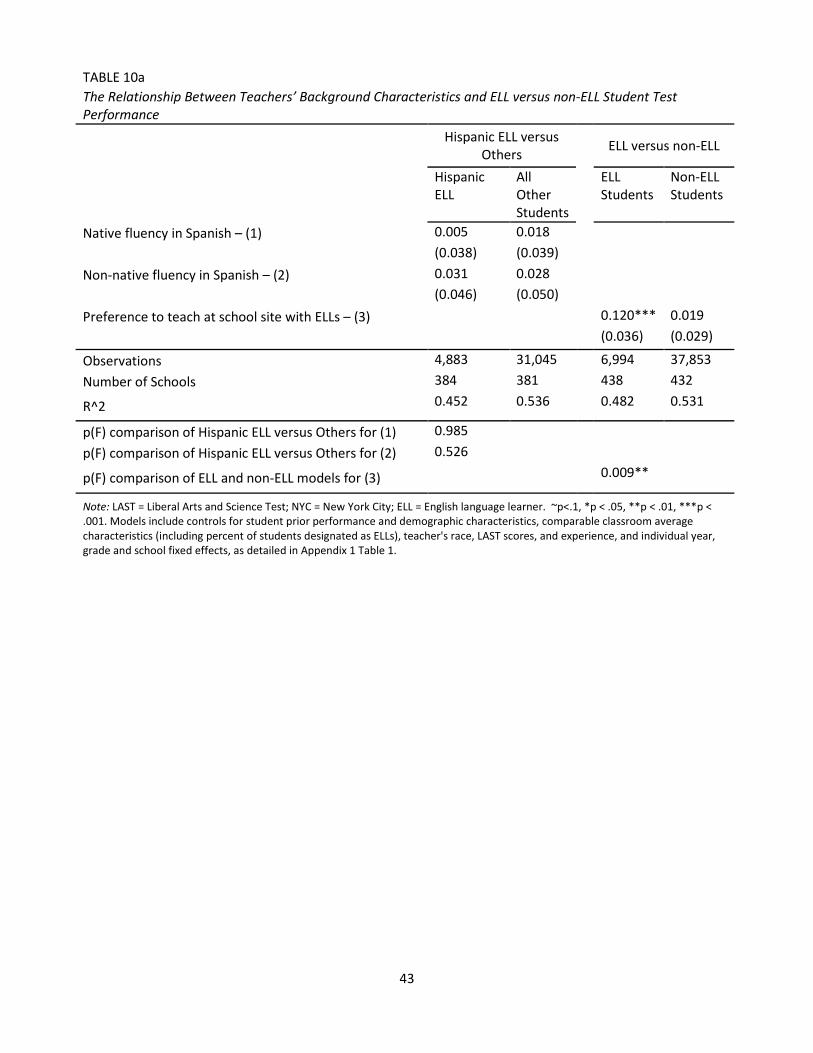
43
TABLE 10a The Relationship Between Teachers’ Background Characteristics and ELL versus non-ELL Student Test Performance
Hispanic ELL versus
Others ELL versus non-ELL
Hispanic ELL
All Other Students
ELL Students
Non-ELL Students
Native fluency in Spanish – (1) 0.005 0.018
(0.038) (0.039)
Non-native fluency in Spanish – (2) 0.031 0.028
(0.046) (0.050)
Preference to teach at school site with ELLs – (3) 0.120*** 0.019 (0.036) (0.029)
Observations 4,883 31,045 6,994 37,853 Number of Schools 384 381 438 432
R^2 0.452 0.536 0.482 0.531
p(F) comparison of Hispanic ELL versus Others for (1) 0.985 p(F) comparison of Hispanic ELL versus Others for (2) 0.526
p(F) comparison of ELL and non-ELL models for (3) 0.009**
Note: LAST = Liberal Arts and Science Test; NYC = New York City; ELL = English language learner. ~p<.1, *p < .05, **p < .01, ***p < .001. Models include controls for student prior performance and demographic characteristics, comparable classroom average characteristics (including percent of students designated as ELLs), teacher's race, LAST scores, and experience, and individual year, grade and school fixed effects, as detailed in Appendix 1 Table 1.
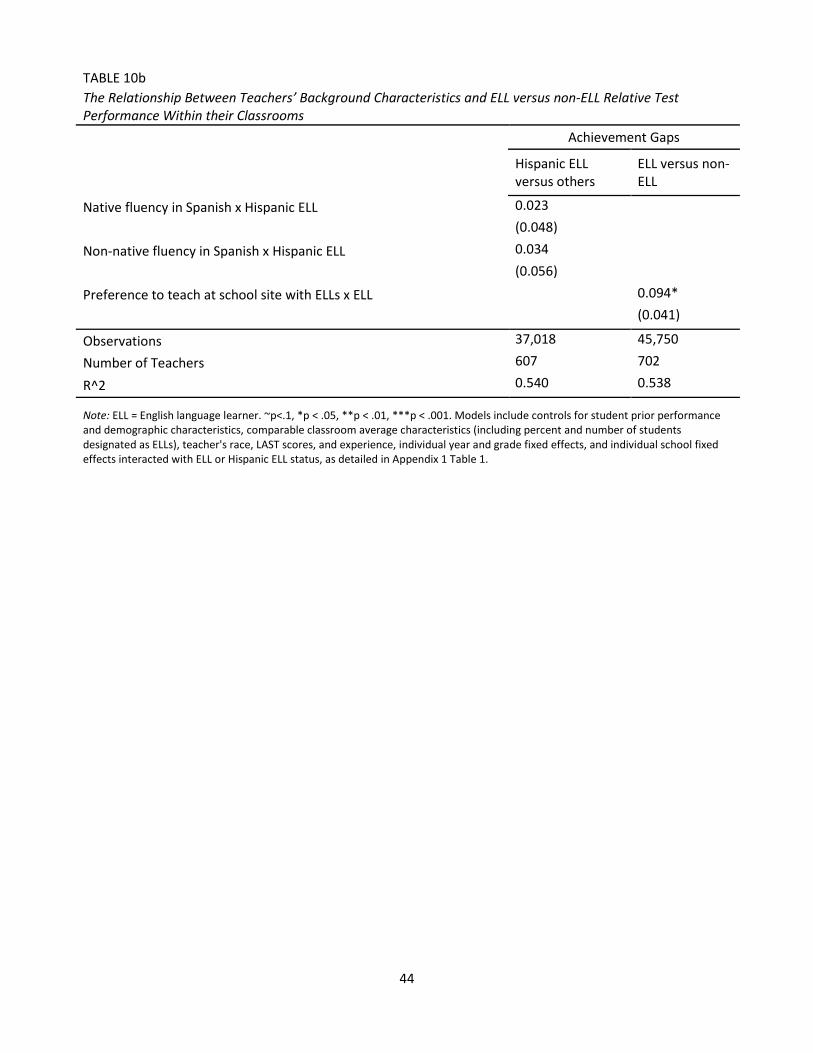
44
TABLE 10b The Relationship Between Teachers’ Background Characteristics and ELL versus non-ELL Relative Test Performance Within their Classrooms
Achievement Gaps
Hispanic ELL versus others
ELL versus non-ELL
Native fluency in Spanish x Hispanic ELL 0.023
(0.048)
Non-native fluency in Spanish x Hispanic ELL 0.034
(0.056)
Preference to teach at school site with ELLs x ELL 0.094*
(0.041)
Observations 37,018 45,750
Number of Teachers 607 702
R^2 0.540 0.538
Note: ELL = English language learner. ~p<.1, *p < .05, **p < .01, ***p < .001. Models include controls for student prior performance and demographic characteristics, comparable classroom average characteristics (including percent and number of students designated as ELLs), teacher's race, LAST scores, and experience, individual year and grade fixed effects, and individual school fixed effects interacted with ELL or Hispanic ELL status, as detailed in Appendix 1 Table 1.
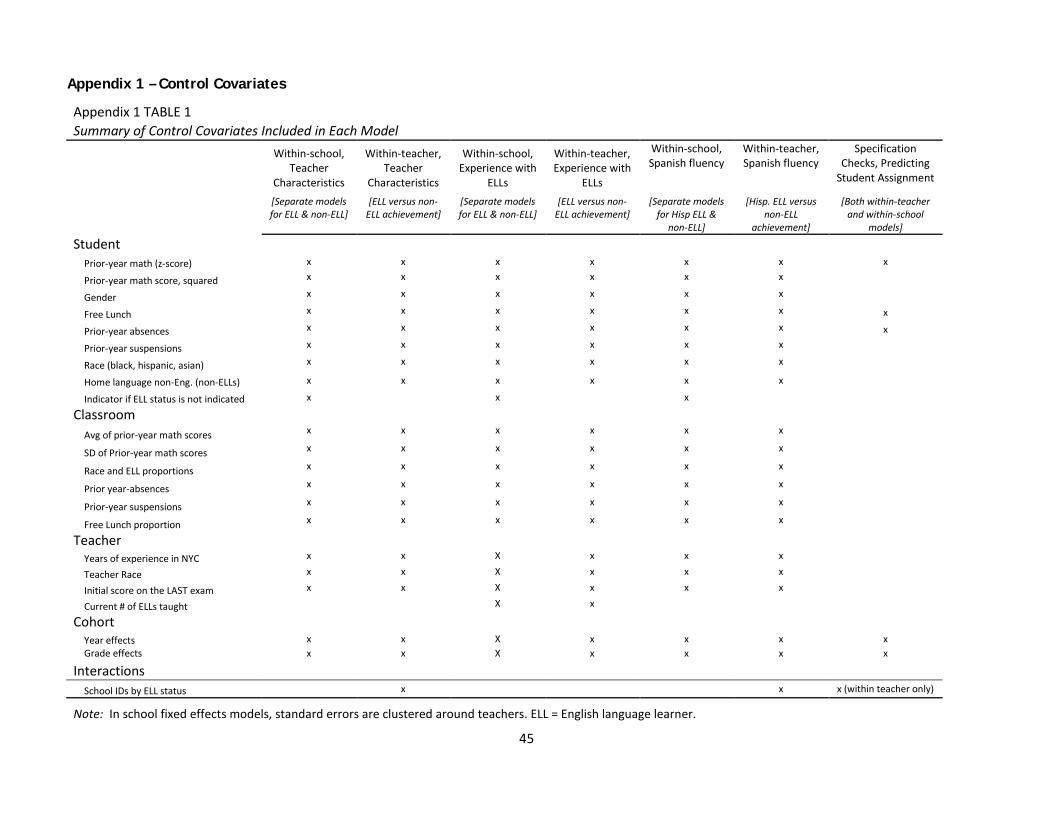
45
Appendix 1 – Control Covariates
Appendix 1 TABLE 1 Summary of Control Covariates Included in Each Model
Within-school, Teacher
Characteristics
Within-teacher, Teacher
Characteristics
Within-school, Experience with
ELLs
Within-teacher, Experience with
ELLs
Within-school, Spanish fluency
Within-teacher, Spanish fluency
Specification Checks, Predicting
Student Assignment
[Separate models for ELL & non-ELL]
[ELL versus non-ELL achievement]
[Separate models for ELL & non-ELL]
[ELL versus non-ELL achievement]
[Separate models for Hisp ELL &
non-ELL]
[Hisp. ELL versus non-ELL
achievement]
[Both within-teacher and within-school
models]
Student
Prior-year math (z-score) x x x x x x x
Prior-year math score, squared x x x x x x
Gender x x x x x x
Free Lunch x x x x x x x
Prior-year absences x x x x x x x
Prior-year suspensions x x x x x x
Race (black, hispanic, asian) x x x x x x
Home language non-Eng. (non-ELLs) x x x x x x
Indicator if ELL status is not indicated x x x Classroom
Avg of prior-year math scores x x x x x x
SD of Prior-year math scores x x x x x x
Race and ELL proportions x x x x x x
Prior year-absences x x x x x x
Prior-year suspensions x x x x x x
Free Lunch proportion x x x x x x
Teacher
Years of experience in NYC x x X x x x
Teacher Race x x X x x x
Initial score on the LAST exam x x X x x x
Current # of ELLs taught X x
Cohort
Year effects x x X x x x x Grade effects x x X x x x x
Interactions
School IDs by ELL status x x x (within teacher only)
Note: In school fixed effects models, standard errors are clustered around teachers. ELL = English language learner.
46
Appendix 2 – Specification Checks
In order to better assess the robustness of our findings in light of potential limitations, we consider a
variety of secondary analyses and specification checks. Specifically, below we investigate potential concerns
related to ELL reclassification, to differential teacher attrition following experience teaching ELL students, and
to differential assignment (by ability level) of ELL and non-ELL students to teachers.
Identifying ELL Students: Many ELL students in our sample are at some point reclassified as non-ELLs.
However, at least initially following reclassification, they may still be more similar to ELL students than to non-
ELL students, and may be intentionally assigned in non-random ways into classrooms based on those
similarities. To assess whether this may have biased our results, we replicate all of the analyses related to our
questions of interest using alternative definitions of ELL status: either including in the ELL category students
who were reclassified as non-ELLs in the prior year, or including in the ELL category students who had ever
been classified as ELLs.
Using these alternate definitions of ELL status produces results in line with our expectations. In
general, model runs using a prior-year ELL definition produce similar, but slightly attenuated findings for all of
our research questions of interest. Model runs using the more conservative definition of ELLs as any student
ever classified also yield the same general findings, but with greater attenuation. As a representative example,
the effect size of the within-school ELL student learning advantage associated with pre-service teacher
preparation, reported as 0.090 in Table8a, was reduced to 0.078 under the first alternate definition of ELL
students, and then to .049 under the most conservative alternative definition of ELL students. All three
specifications, in this example, still yield significant differential performance between ELLs and non-ELLs.
Other model runs yield comparable and similarly predictable trends in terms of attenuation of findings, but no
marked shifts in results that would suggest problematic bias related to the sorting of reclassified ELL students.
We do not include those duplicative tables here for reasons of space, but would be happy to provide them
upon request.
47
Exploring Attrition Relevant to Experience with ELLs: As shown previously in Tables 7a and 7b, we see
significant differential returns to prior experience teaching ELLs among second year teachers. However, if first
year teachers of ELL students differ markedly in their attrition out of teaching in ways that are related to their
instructional effectiveness with ELL students, that could bias our findings. To investigate possible bias related
to attrition effects, we examine two areas of concern. First, we might be concerned if those teachers who
taught ELL students in their first year and who did not attrite from our sample between their first and second
year of teaching were already differentially more effective with ELL students in their first year of teaching. If
this were the case, it might suggest that teachers who remained in teaching for a second year possessed
specialized skills prior to attaining (and not as a result of) first year experience with ELL students. Second, we
might be concerned if those teachers who taught ELL students in their first year of teaching and who did attrite
from our sample after their first year of teaching were differentially worse with ELL students. If this were the
case, it might appear that the remaining second year teachers with ELL experience were more effective due to
what they learned in their first year, when in fact their expertise stemmed from differential sorting rather than
any learning experiences.
In both potential areas of concern, our analyses indicate no evidence of bias stemming from attrition
effects. Among non-attriters, first year performance with ELL students using a within-school model
specification was no different for teachers with six or more ELL students in their first year classrooms. Effect
size differences for teachers with six or more ELL students in their first year classroom were not significantly
different from zero for either ELL or non-ELL students (-0.008 and -0.012 standard deviations, respectively).
Among first-year attriters – a much smaller group – we also found no significant difference in first year
performance, either overall, or differentially with ELL or non-ELL students (effect sizes were -0.044 and -0.022,
respectively). Given that fewer than 10% of teachers attrite after just one year of teaching, it does not seem
plausible that attrition meaningfully biased our findings with respect to experience with ELLs.
Differential “Pre-Treatment” Assignment of ELL and non-ELL Students: Finally, we investigate non-
random sorting of ELL and non-ELL students to teachers in ways that are associated with our teacher
48
characteristics of interest. Given our lack of experimental design, we do not expect to see a randomized
assignment of students to our “treatment” teachers. To account for non-random sorting, we explicitly control
for a range of observable controls associated with student achievement, including prior achievement.
However, by identifying cases where observable student characteristics that we know to be associated with
student ability are significantly different between “treatment” and comparison teachers at the time of
assignment, we can spotlight instances where our methodology is less likely to have eliminated bias and in
which we are more reliant on our observable controls.
Both our within-school and within-teacher model specifications eliminate student assignment bias that
occurs similarly for both ELL and non-ELL students of treatment teachers. However, they do not eliminate bias
in cases where the ELL and non-ELL students assigned to these teachers differ in their ability. In particular,
since our findings relate to indicators of differentially higher learning among ELL students, evidence of
consistent assignment of higher-ability ELL students or lower-ability non-ELL students to teachers with our
characteristics of interest would be potentially problematic. In order to investigate assignment of students by
teacher characteristics, we fit within-school and within-teacher models predicting each teacher characteristic
of interest (e.g. ESL certification, pre-service training, etc.) as a function of ability-related student
characteristics that were determined prior to assignment to those teachers (i.e. prior-year test scores,
free/reduced price lunch status, and prior-year absences).
In our school fixed effects specification checks detailed in Appendix 2 Table 1a, some significant
differential sorting is apparent for teacher characteristics related to prior experience with ELL students, ELL-
specific in-service PD in the same year, preferences to teach at a school site with many ELL students, and
teacher fluency in Spanish. However, in no case does the direction of any sorting bias suggest that our ELL
students of interest possess higher initial ability. Thus, if our control covariates fail to control for the apparent
differential initial ability in these cases, our estimated effect sizes for the benefits of these teacher
characteristics for ELL instruction may be overly conservative.
49
Our teacher fixed effects specification checks in Appendix 2 Table 1b show a slightly different pattern
of differential sorting. Here, we continue to see some evidence of differential ELL versus non-ELL gaps
associated with prior experience with ELL students and ELL-specific PD in the same direction as for the school
fixed effects specification checks. However, ESL certified novice teachers do show some evidence of
assignment to classrooms with lower initial achievement and free/reduced lunch rate gaps between ELL and
non-ELL students. Similarly, teachers with a preference to teach at school sites with ELLs appear to receive ELL
students that are less likely to be classified as receiving free/reduced price lunch. For these two groups, some
caution is warranted in interpreting our within-teacher effect sizes, as we rely more explicitly on our
observable controls to account for differences in initial student academic ability. Overall, the variation in non-
random student sorting on observable characteristics that we observe across our two model specifications
further reinforces the value of attending most to findings that are consistent across both of our analytical
approaches.
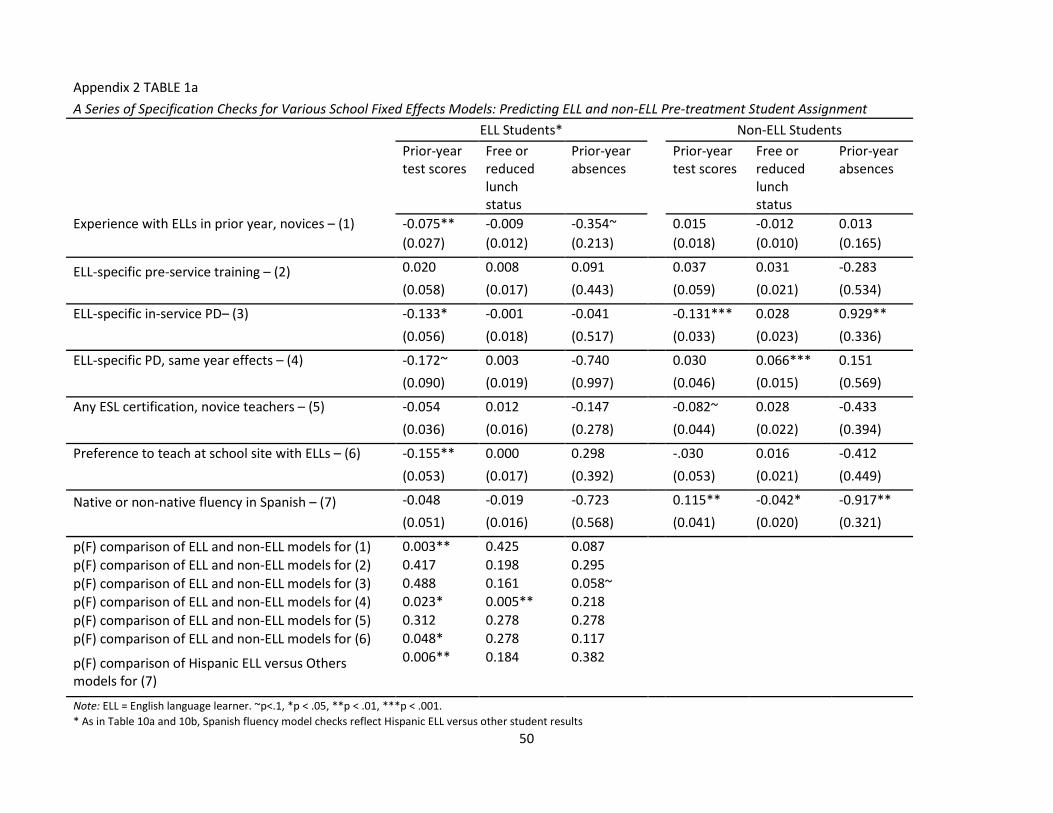
50
Appendix 2 TABLE 1a A Series of Specification Checks for Various School Fixed Effects Models: Predicting ELL and non-ELL Pre-treatment Student Assignment
ELL Students* Non-ELL Students Prior-year
test scores Free or reduced lunch status
Prior-year absences
Prior-year test scores
Free or reduced lunch status
Prior-year absences
Experience with ELLs in prior year, novices – (1) -0.075** -0.009 -0.354~ 0.015 -0.012 0.013 (0.027) (0.012) (0.213) (0.018) (0.010) (0.165)
ELL-specific pre-service training – (2) 0.020 0.008 0.091 0.037 0.031 -0.283 (0.058) (0.017) (0.443) (0.059) (0.021) (0.534)
ELL-specific in-service PD– (3) -0.133* -0.001 -0.041 -0.131*** 0.028 0.929** (0.056) (0.018) (0.517) (0.033) (0.023) (0.336)
ELL-specific PD, same year effects – (4) -0.172~ 0.003 -0.740 0.030 0.066*** 0.151 (0.090) (0.019) (0.997) (0.046) (0.015) (0.569)
Any ESL certification, novice teachers – (5) -0.054 0.012 -0.147 -0.082~ 0.028 -0.433 (0.036) (0.016) (0.278) (0.044) (0.022) (0.394)
Preference to teach at school site with ELLs – (6) -0.155** 0.000 0.298 -.030 0.016 -0.412 (0.053) (0.017) (0.392) (0.053) (0.021) (0.449)
Native or non-native fluency in Spanish – (7) -0.048 -0.019 -0.723 0.115** -0.042* -0.917**
(0.051) (0.016) (0.568) (0.041) (0.020) (0.321)
p(F) comparison of ELL and non-ELL models for (1) 0.003** 0.425 0.087 p(F) comparison of ELL and non-ELL models for (2) 0.417 0.198 0.295 p(F) comparison of ELL and non-ELL models for (3) 0.488 0.161 0.058~ p(F) comparison of ELL and non-ELL models for (4) 0.023* 0.005** 0.218 p(F) comparison of ELL and non-ELL models for (5) 0.312 0.278 0.278 p(F) comparison of ELL and non-ELL models for (6) 0.048* 0.278 0.117
p(F) comparison of Hispanic ELL versus Others models for (7)
0.006** 0.184 0.382
Note: ELL = English language learner. ~p<.1, *p < .05, **p < .01, ***p < .001. * As in Table 10a and 10b, Spanish fluency model checks reflect Hispanic ELL versus other student results
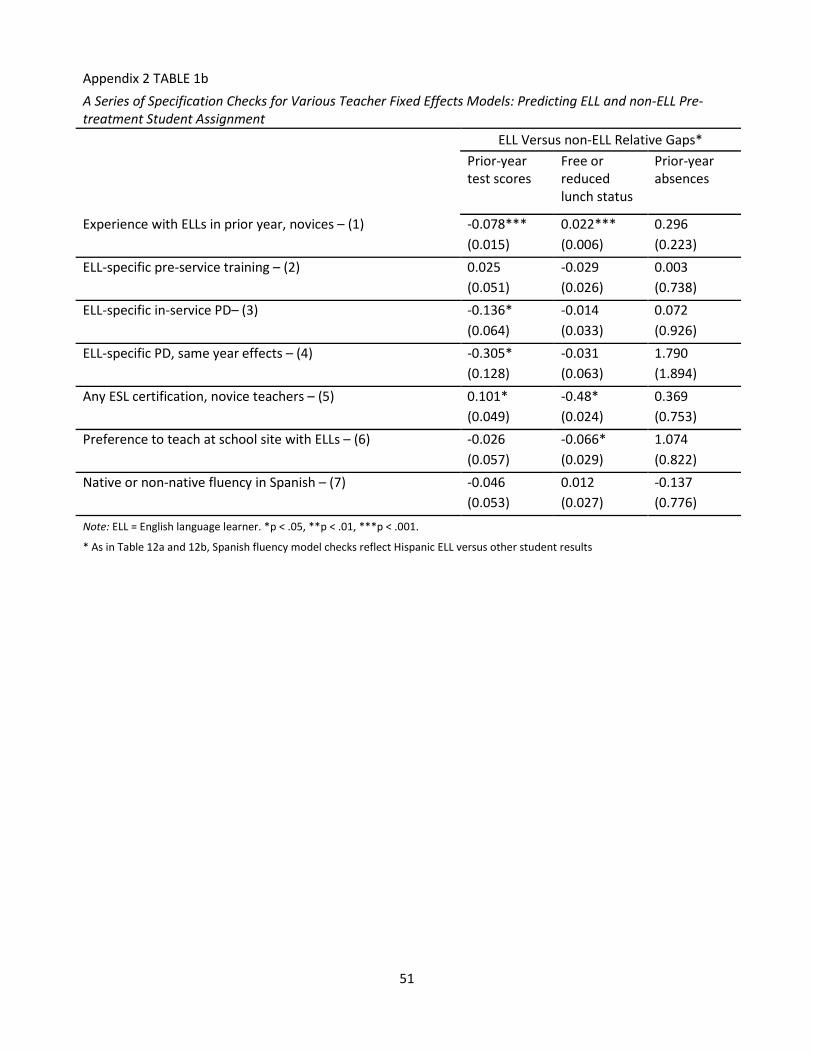
51
Appendix 2 TABLE 1b A Series of Specification Checks for Various Teacher Fixed Effects Models: Predicting ELL and non-ELL Pre-
treatment Student Assignment
ELL Versus non-ELL Relative Gaps* Prior-year
test scores Free or reduced lunch status
Prior-year absences
Experience with ELLs in prior year, novices – (1) -0.078*** 0.022*** 0.296 (0.015) (0.006) (0.223) ELL-specific pre-service training – (2) 0.025 -0.029 0.003 (0.051) (0.026) (0.738) ELL-specific in-service PD– (3) -0.136* -0.014 0.072 (0.064) (0.033) (0.926) ELL-specific PD, same year effects – (4) -0.305* -0.031 1.790 (0.128) (0.063) (1.894) Any ESL certification, novice teachers – (5) 0.101* -0.48* 0.369 (0.049) (0.024) (0.753) Preference to teach at school site with ELLs – (6) -0.026 -0.066* 1.074 (0.057) (0.029) (0.822) Native or non-native fluency in Spanish – (7) -0.046 0.012 -0.137 (0.053) (0.027) (0.776) Note: ELL = English language learner. *p < .05, **p < .01, ***p < .001.
* As in Table 12a and 12b, Spanish fluency model checks reflect Hispanic ELL versus other student results