differential thermal analysis (dta) and … · 5 principle of dta: temperature difference between...
TRANSCRIPT

1
DIFFERENTIAL THERMAL ANALYSIS (DTA) AND
DIFFERENTIAL SCANNING CALORIMETRY (DSC)
n The methods measure energy changes in the sample
n The information from these methods is similar by themeasurement principle is different
n In both methods a reference sample is needed and in thatsample no changes are allowed to happen in the temperaturerange used.
Principles:
DTA: The temperature difference between the sample andreference sample is measured
DSC: The temperature of sample and reference sample is keptthe same and heating energy needed for that ismeasured
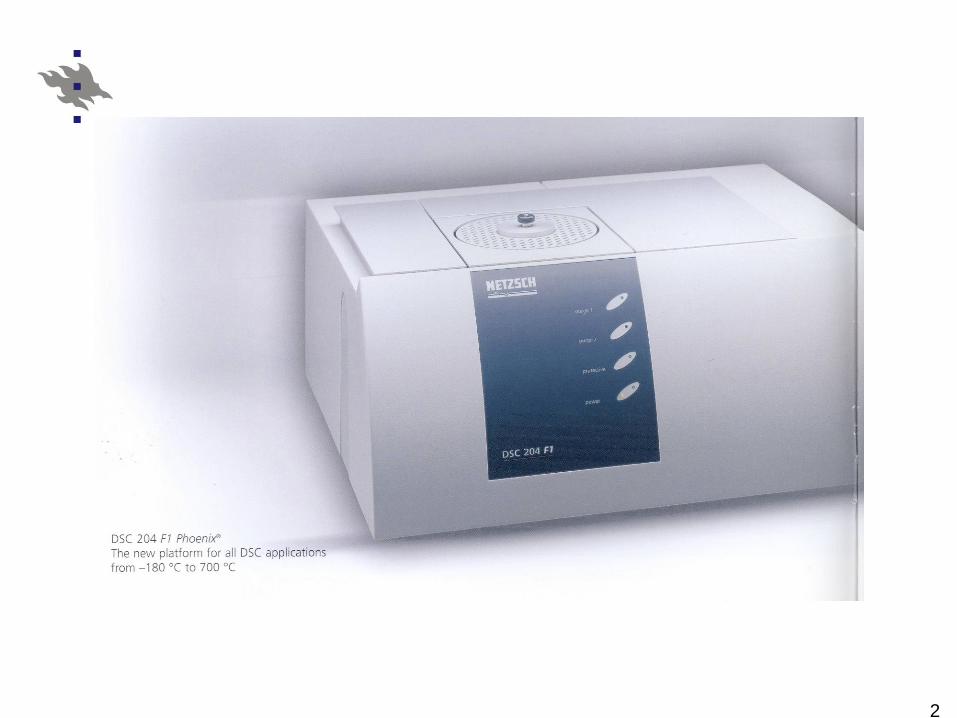
2
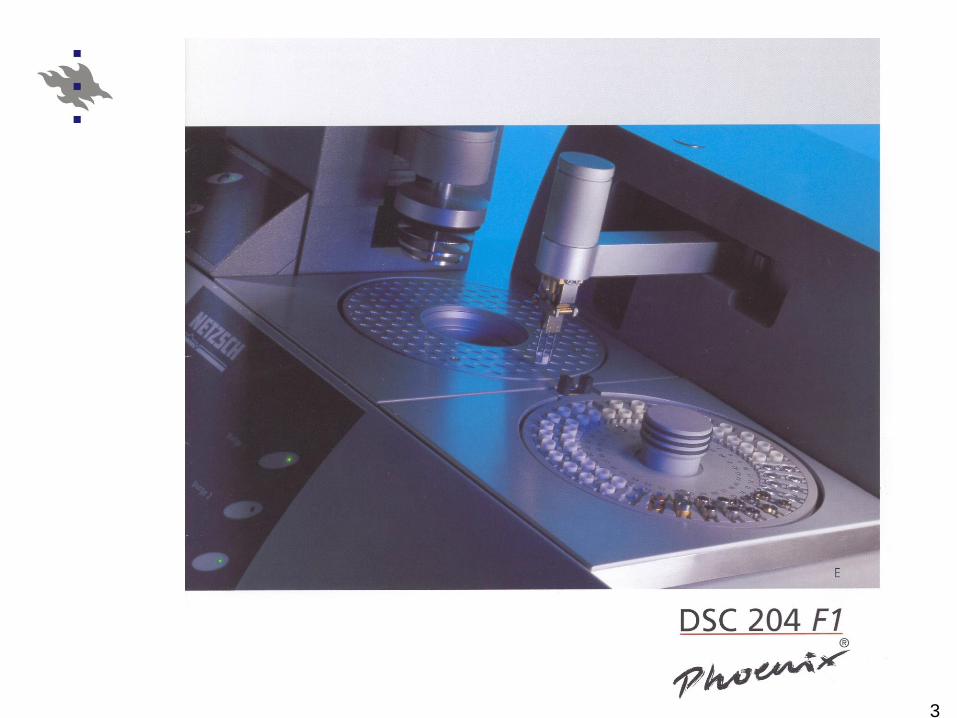
3
4
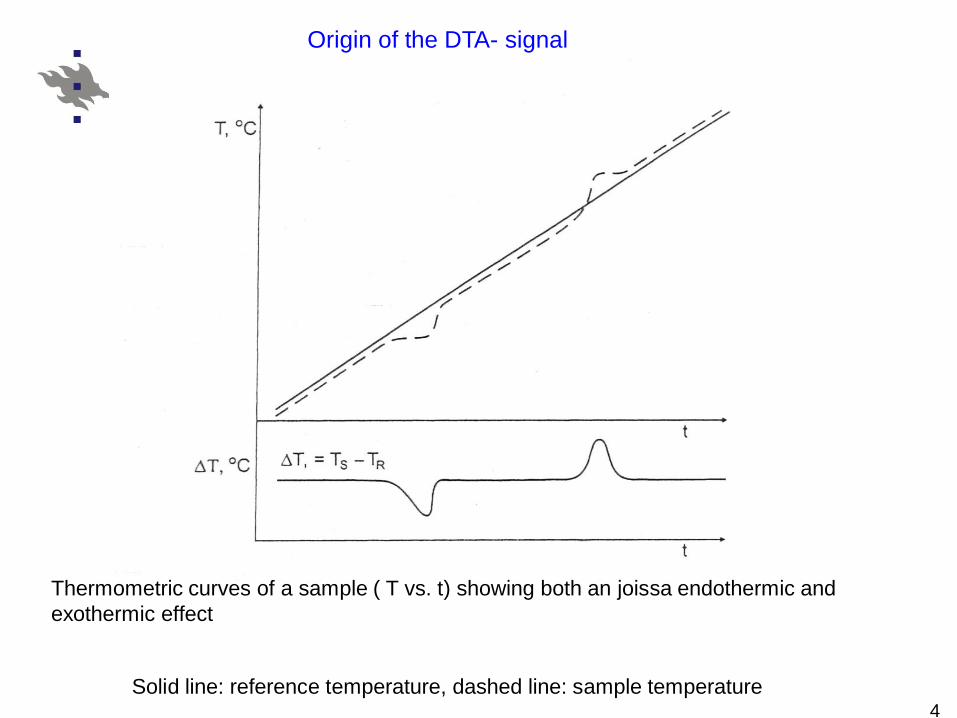
Origin of the DTA- signal
Thermometric curves of a sample ( T vs. t) showing both an joissa endothermic andexothermic effect
Solid line: reference temperature, dashed line: sample temperature

5
Principle of DTA: temperature difference between sample and refernce is measured
Van der Plaats, G., The Practice of Thermal Analysis, Mettler, Switzerland 1991.

6
DTA
n Oldest and most simple TA method
n Qualitative or semiquantitative method (cf. DSC)
n Can be used at high temperatures
n Easy measurement and easy to combine with TG

7
Heat-flux DSC (Boersma DTA, quantitative DTA)
n Very similar as DTA but suits also for quantitativemeasurements
n Principle:
n Sample and reference are placed on platform which canbe heated. The platfom should transfer the very wellcontrolled heat flux from furnace wall to the sample andreference.
n Temperature measurement is carried out on the sameplatform below the sample and reference sample
n Another thermoelement set records the furnacetemperature
n During reaction/phase transition the sample eitherabsorbs or emits heat and changes the heat flux throughthe thermo sensitive platform
n The difference in heat flux causes a small temperaturedifference between the platform and the furnace. Thisdifference is measured.

8
n The heat capacity of the thermosensitive platform as afunction of temperature has been measured by adiabaticcalorimetry when the instrument has been built.
à Enthalpy change can be estimated from the temperaturedifference
Principle of heat-flux DSC
Van der Plaats, G.,The Practice of Thermal Analysis, Mettler, Switzerland 1991.

9
Power-compensation DSC
• Sample and the reference are heated separately• Controller keeps on the temperature program• Controller controls the heating powers so that Ts and TR are the same(energy is feeded either on the sample or reference side)• Quantitative
10
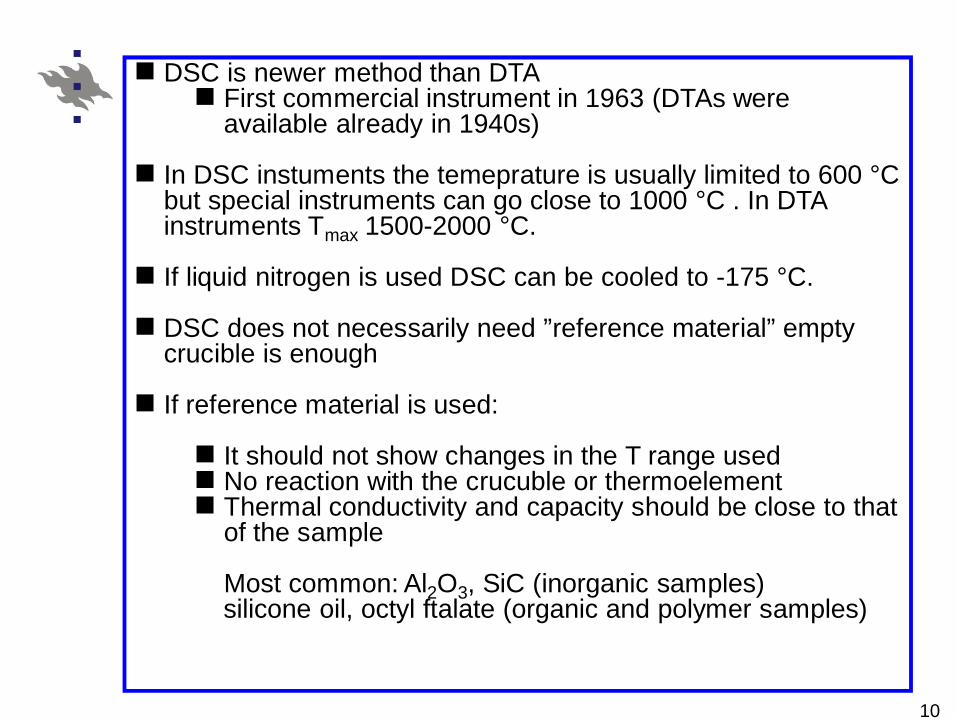
n DSC is newer method than DTAn First commercial instrument in 1963 (DTAs were
available already in 1940s)
n In DSC instuments the temeprature is usually limited to 600 °Cbut special instruments can go close to 1000 °C . In DTAinstruments Tmax 1500-2000 °C.
n If liquid nitrogen is used DSC can be cooled to -175 °C.
n DSC does not necessarily need ”reference material” emptycrucible is enough
n If reference material is used:
n It should not show changes in the T range usedn No reaction with the crucuble or thermoelementn Thermal conductivity and capacity should be close to that
of the sample
Most common: Al2O3, SiC (inorganic samples)silicone oil, octyl ftalate (organic and polymer samples)

11
Calibration of enthalpy and temperature
n Temperature calibartion is based on sharp transition at fixedtemeprature. Meltic points on very pure metals are widelyused (In at 157 °C) and for example α-quartz → β-quartzphase transition at 573 °C.
n Enthalpy calibration is based on melting enthalpies of verypure metal.
n At least two materials should be used in calibration to cover awider temperature range.
n Calibration must be made at same conditions as later the realmeasurments (gas atmosphere, heating rate, crucible etc)
12
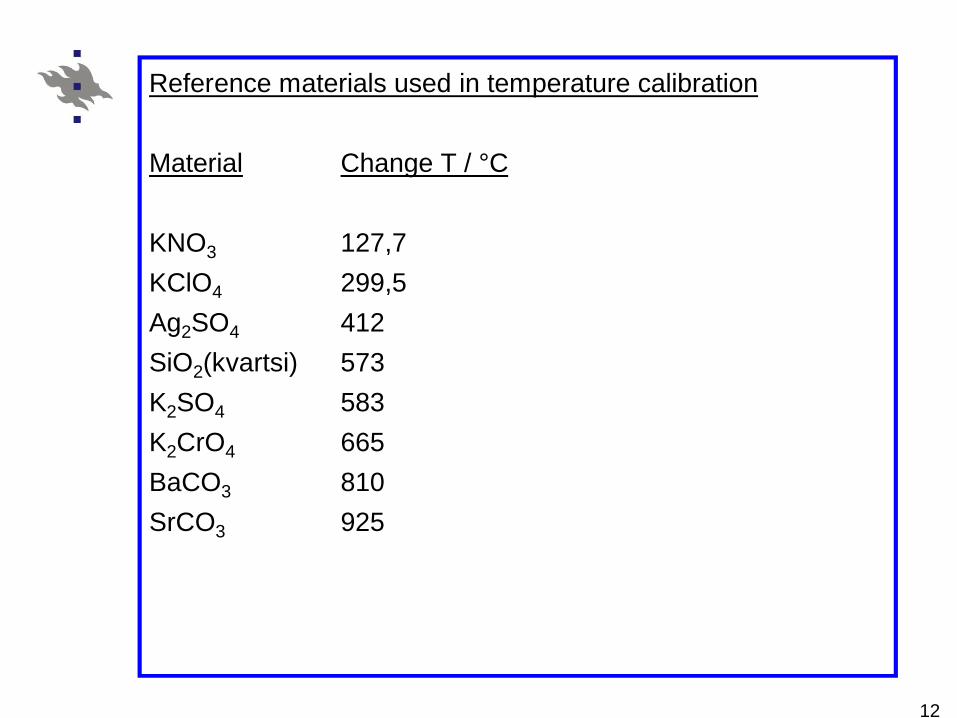
Reference materials used in temperature calibration
Material Change T / °C
KNO3 127,7KClO4 299,5Ag2SO4 412SiO2(kvartsi) 573K2SO4 583K2CrO4 665BaCO3 810SrCO3 925
13
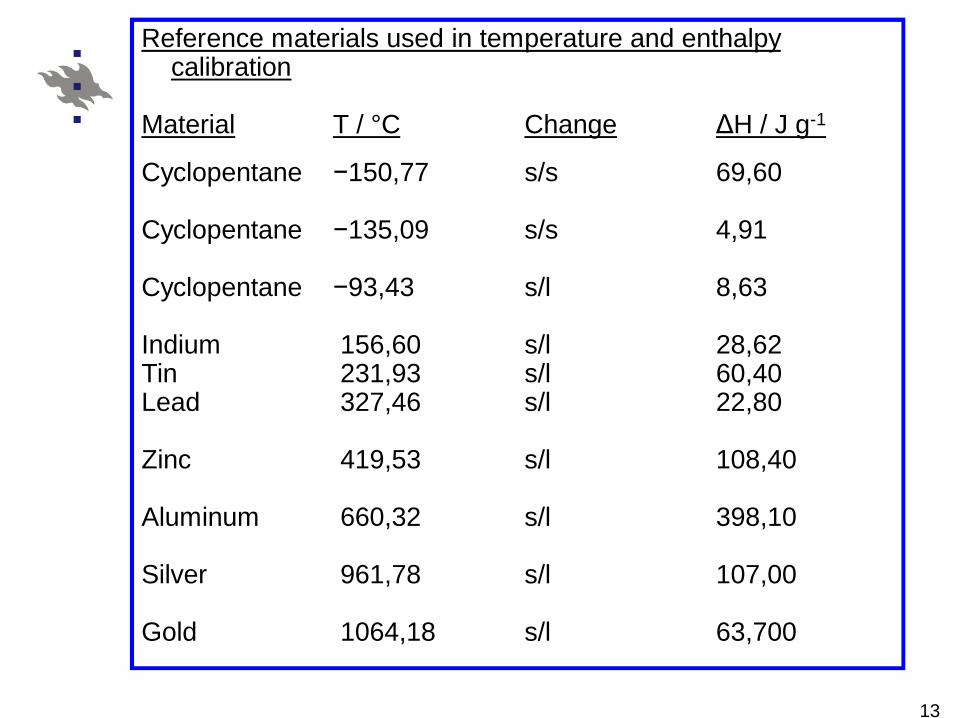
Reference materials used in temperature and enthalpycalibration
Material T / °C Change ΔH / J g-1
Cyclopentane −150,77 s/s 69,60
Cyclopentane −135,09 s/s 4,91
Cyclopentane −93,43 s/l 8,63
Indium 156,60 s/l 28,62Tin 231,93 s/l 60,40Lead 327,46 s/l 22,80
Zinc 419,53 s/l 108,40
Aluminum 660,32 s/l 398,10
Silver 961,78 s/l 107,00
Gold 1064,18 s/l 63,700

14
Determination of baseline is the problem in quantitative analysis(= integration of the peak area)
Why the baseline is changing:
n Thermal properties (thermocapacity) of the sample andreference sample are differentà baseline is increasing
n After the reaction the baseline does not return back to theoriginal level if the thermal properties of the low-temperaturepahse and high-temperature phase are different.
n For the extrapolation of the baseline there are manypossibilities from which the user has to choose the mostsuitable.

15
Examples how the baseline can be selected. The differences in resultscan be significant

16
n The measured enthalpy change ΔH (J/g) is directly proportionalto the peak area:
ΔH =A·k / m A = areak = calibration constantm = sample mass
n k is obtained from the relation between an known enthalpychange (melting of indium) and its peak area to the peak areameasured for the sample .
n k is spesific for instrument and measurement conditions used
If the baseline is increasing:n Correction to baseline is made by measuring first an empty
instrument with the same parametersnà Resulting curve is saved and taken in use when the sample
is measured
17
Sample holder and crucibles
n Sample holder is generally platinumn Crucible (pan) material depends on the temeprature and
sample< 500 °C: Al (most common)> 500 °C: Cu, Ag, Au, Pt, grafite (expensive)ceramic crucibles can also be used, f.ex. Al2O3, SiO2
- sample is not allowed to react with the crucible!
n Pans (crucibles) are normally closed with a lid (not insimultaneous equipment)
n If gases are evolved form the sample, and they increase thepressure in the pan, a hole must be made to the lid (or uselids with hole).
18
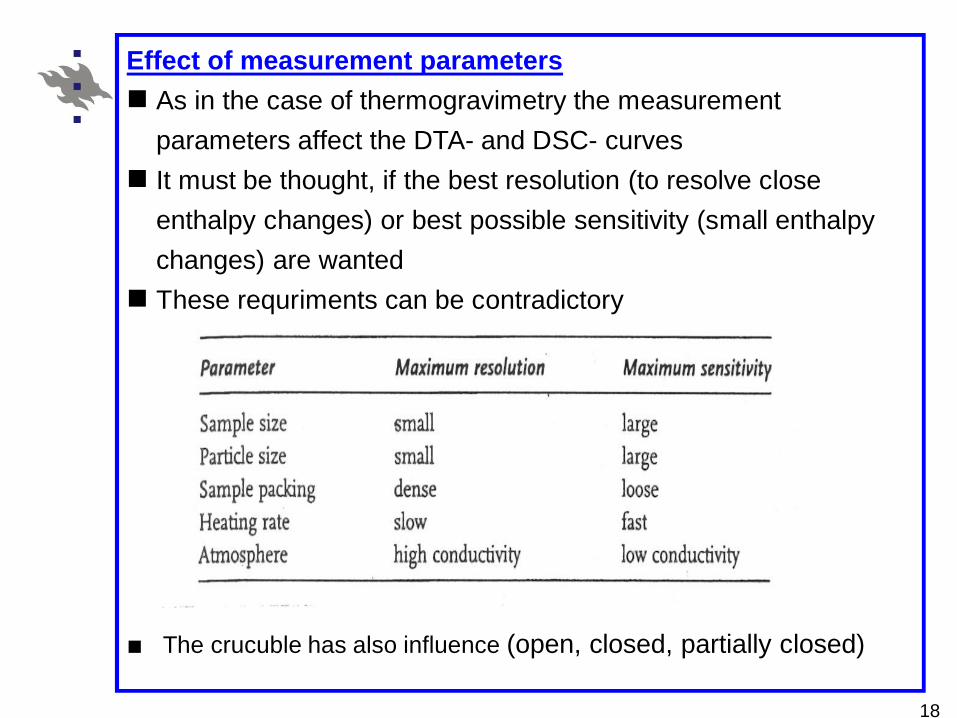
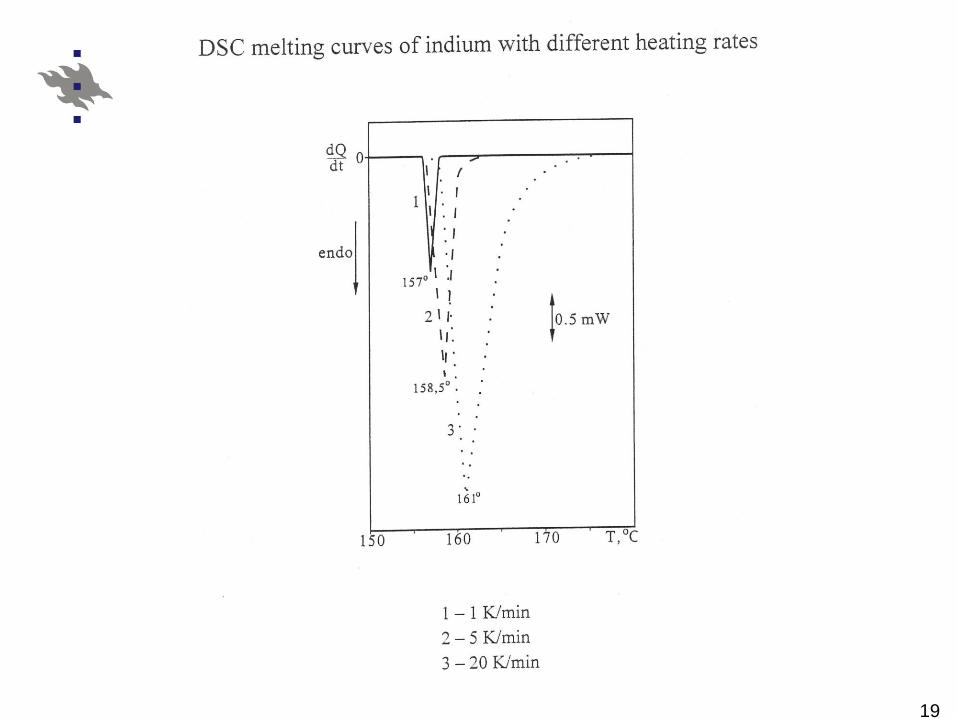
Effect of measurement parametersn As in the case of thermogravimetry the measurement
parameters affect the DTA- and DSC- curvesn It must be thought, if the best resolution (to resolve close
enthalpy changes) or best possible sensitivity (small enthalpychanges) are wanted
n These requriments can be contradictory
■ The crucuble has also influence (open, closed, partially closed)
19

20
21
Applications of DSC (and DTA:n)
n Many applicationsn The methods have similar applications
- DTA is more applied at high temperatures- DSC gives more relable quantitattive information
n Polymorphic transitions (no weight change)n Melting temperatures and –enthalpiesn Purity determinations (impurities lower the melting T)n Glass transition temperature (polymers)n Crystallization degree of polymersn Heat capacity measurementsn Phase diagramsn ”Fingerprint” analysis of materials/molecules

22
Van der Plaats, G.,The Practice of Thermal Analysis, Mettler, Switzerland 1991.
α-S8 transforms to β-S8 (95,3 oC), β-S8 melts at 119,9 oC. Polymerization at 185-190 oC (200 000 units, dark yellow). Boiling point 444,6 oC.
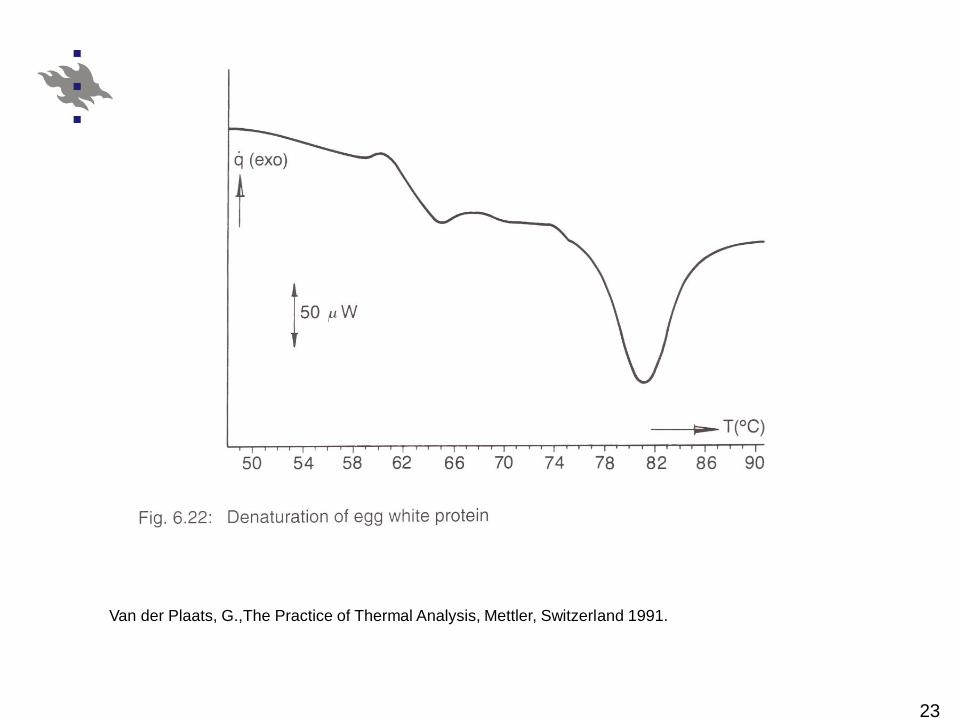
23
Van der Plaats, G.,The Practice of Thermal Analysis, Mettler, Switzerland 1991.
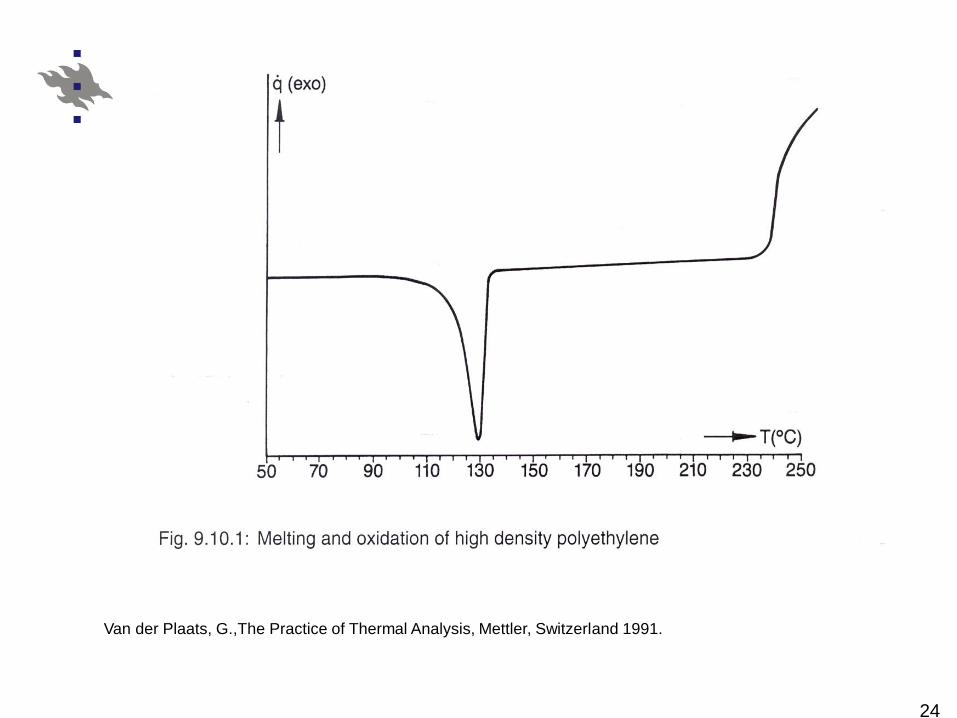
24
Van der Plaats, G.,The Practice of Thermal Analysis, Mettler, Switzerland 1991.
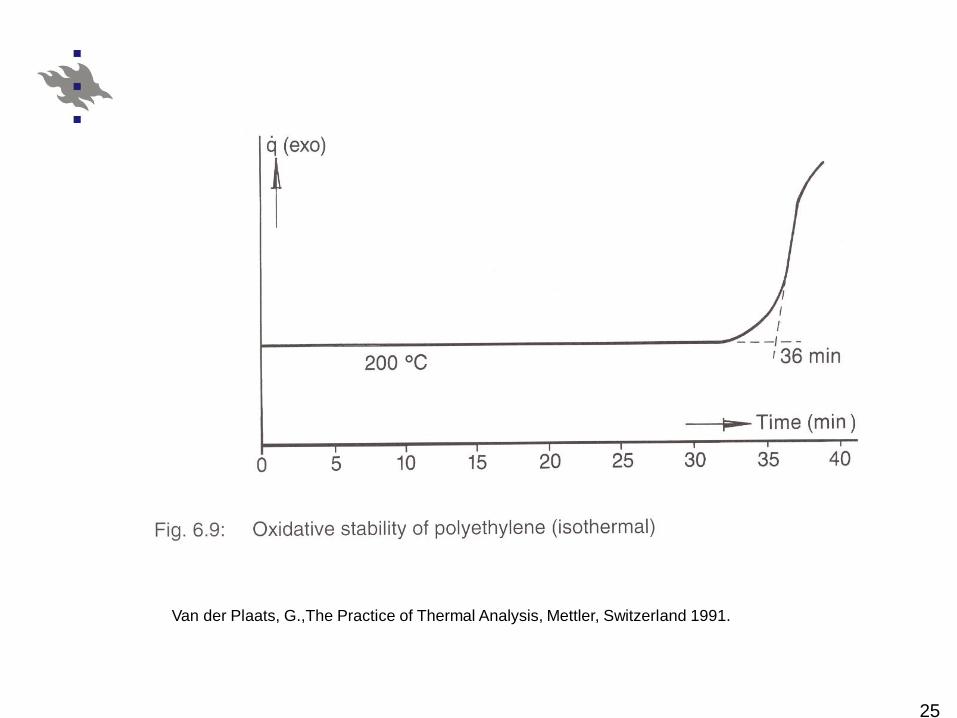
25
Van der Plaats, G.,The Practice of Thermal Analysis, Mettler, Switzerland 1991.

26
Van der Plaats, G.,The Practice of Thermal Analysis, Mettler, Switzerland 1991.
Determination of melting point for PP samples is important. It tells from thestructure (crystallinity) crystalline isotactic, atactic, syndiotactic anddefective isotactic PP all have slightly different melting points.
27
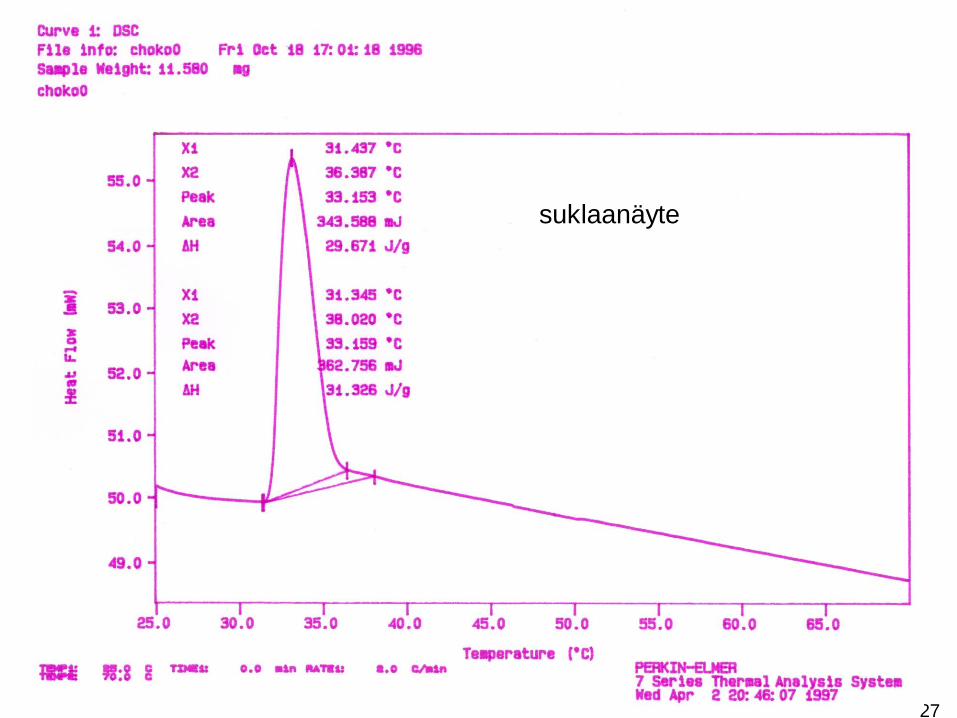
suklaanäyte
28
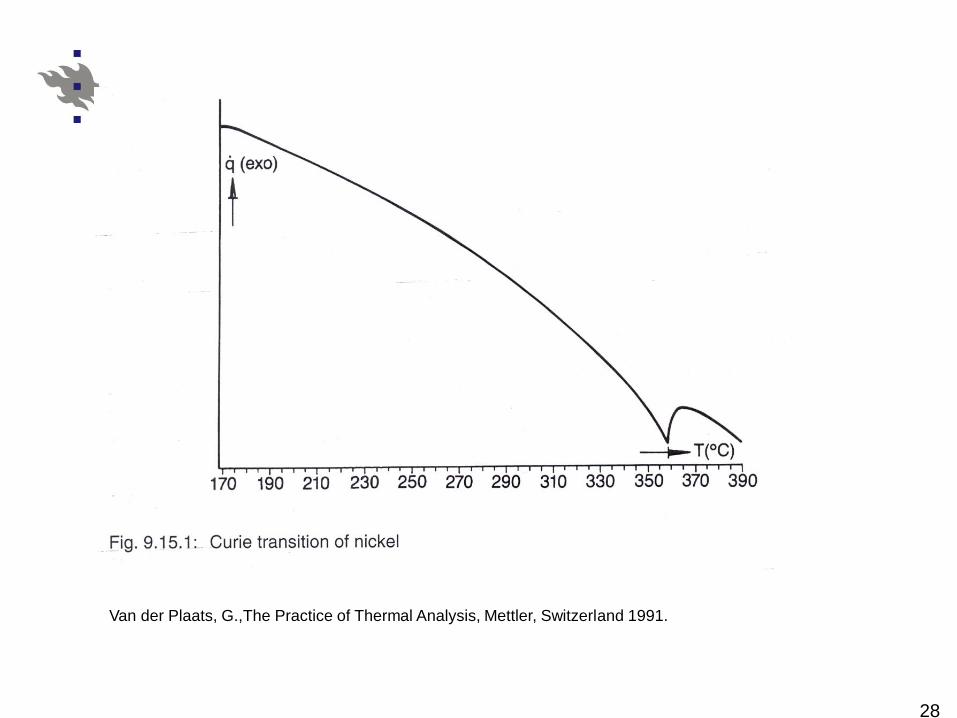
Van der Plaats, G.,The Practice of Thermal Analysis, Mettler, Switzerland 1991.
29
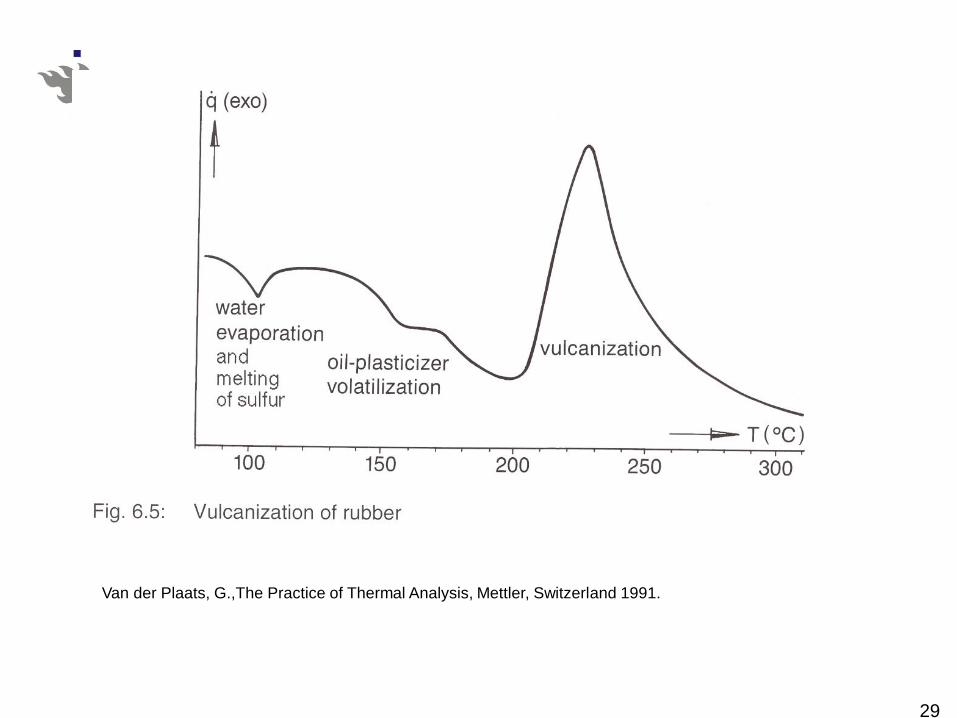
Van der Plaats, G.,The Practice of Thermal Analysis, Mettler, Switzerland 1991.

30
Van der Plaats, G.,The Practice of Thermal Analysis, Mettler, Switzerland 1991.
31
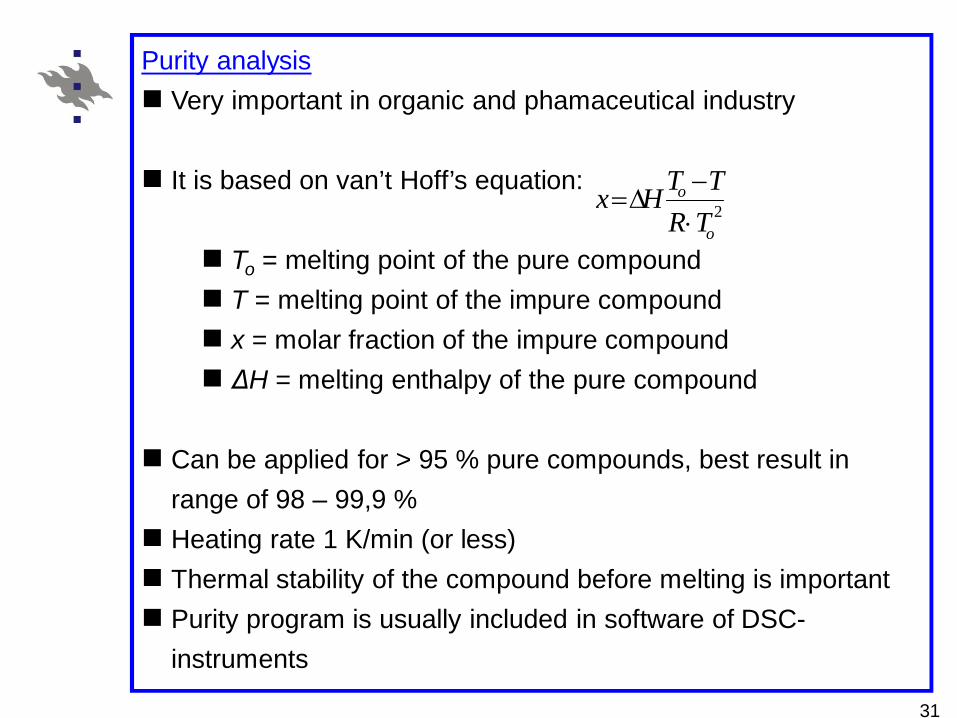
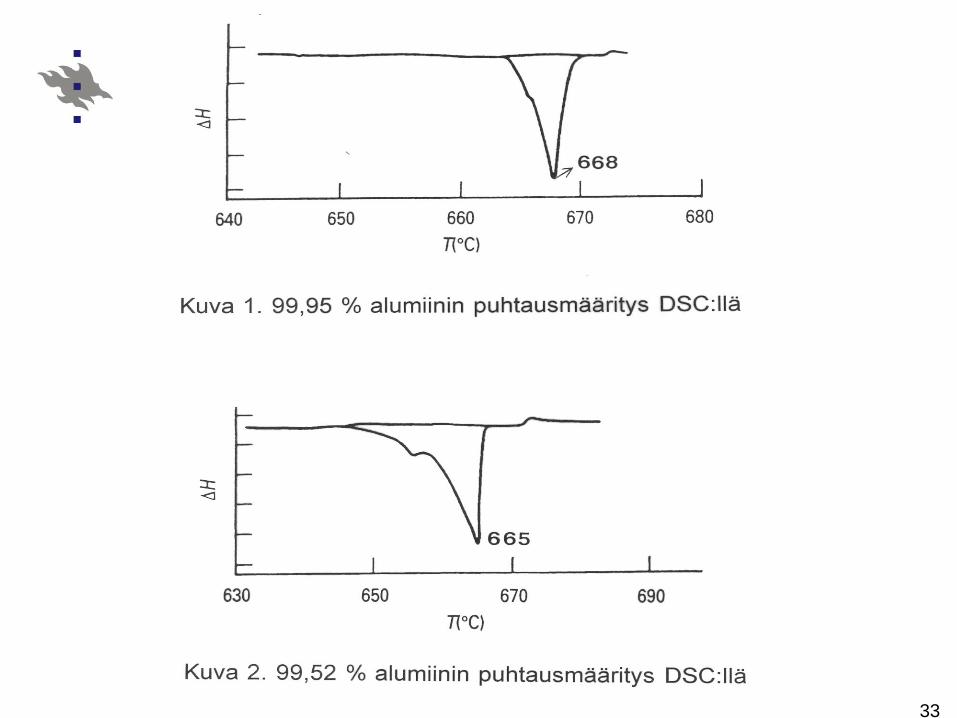
Purity analysisn Very important in organic and phamaceutical industry
n It is based on van’t Hoff’s equation:
n To = melting point of the pure compoundn T = melting point of the impure compoundn x = molar fraction of the impure compoundn ΔH = melting enthalpy of the pure compound
n Can be applied for > 95 % pure compounds, best result inrange of 98 – 99,9 %
n Heating rate 1 K/min (or less)n Thermal stability of the compound before melting is importantn Purity program is usually included in software of DSC-
instruments
2o
o
TRTTHx
×-
D=

32
Van der Plaats, G.,The Practice of Thermal Analysis, Mettler, Switzerland 1991.
33
34
DTA/DSC in process design
n As an example, preparation of sodium chromate (Na2CrO4)from chromium(III)oxide (Cr2O3) and sodium carbonate
n With molar ratio 3 : 1 pahse pure product is obtained
n If molar ratios 6 : 1 or 1 : 1 are applied the product containsalso other phases
n This result could not be seen with X-ray diffraktion becauseof the amorphous nature of the impurity phases or their verylow content.

35
36
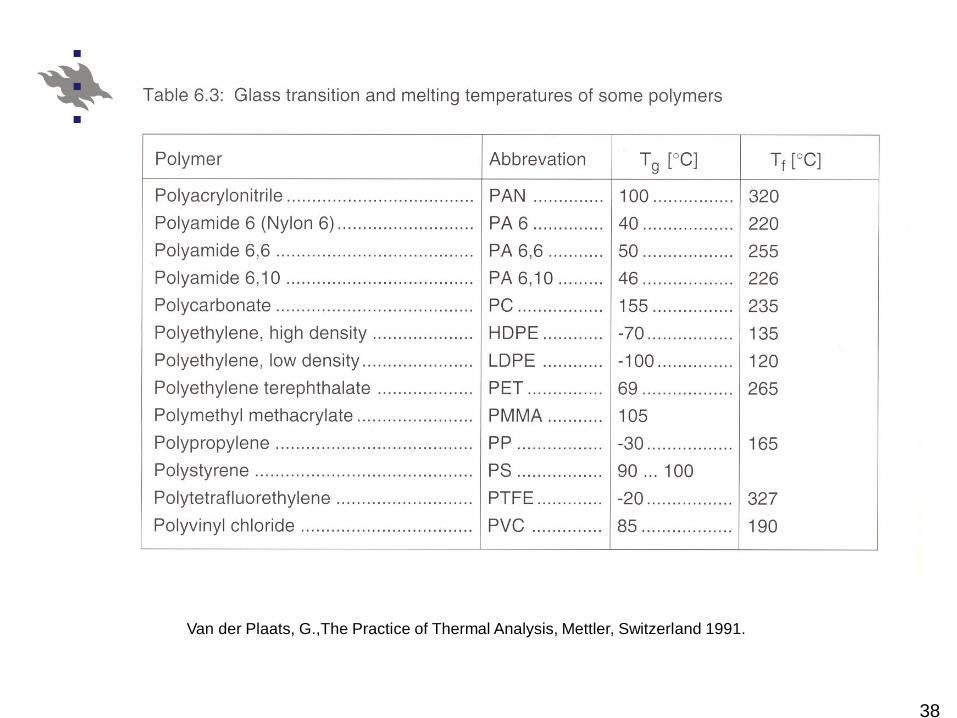
Glass transition temperature (Tg)
n Phase transition and so called second order transitionn ΔH = 0 in the transition!n The change is in heat capacity à DSC baseline is changingn Very important temeprature for polymers and must be
informed for all commercial polymer productsn At glass transition temperature hard material changes to
viscous, rubber-liken Many materials properties (mecanic properties) are
changing at this pointn For example the Tg of polystyrene is ca. 90 °C (disposable
cups)

37
Van der Plaats, G.,The Practice of Thermal Analysis, Mettler, Switzerland 1991.
38
Van der Plaats, G.,The Practice of Thermal Analysis, Mettler, Switzerland 1991.

39

40
Van der Plaats, G.,The Practice of Thermal Analysis, Mettler, Switzerland 1991.

41
Determination of degree of crystallinity of polymersn Polymers often form crystalline domains in the materialsn Crystallinity means ordering of polymer chains parallel to
each other.n Crystallinity degree in in general much less than 100 %; but
depends on the polymern Small crystallites are formed at low temperatures (mobility of
polymer chains is small)n At higher temperatures the crystallites can be larger (mobility
higher)n If the melting enthalpy of 100 % crystalline material is known
the crystallinity dgree of the sample can be calculated fromthe area of the melting peak

42
Mettler Toledo, UserCom 1/2001

43
Mettler Toledo, UserCom 1/2001

44
Mettler Toledo, UserCom 1/2001

45
Problems in the crystallinity determinations
n ∆Hf100% for the fully crystalline material must be known. Ifneeded to be determined experimentally – might bedifficult. The crystallinity must be studied by XRD andconfirmation of 100% crystallinity not easy.
n In DSC the definition of the peak area can be difficultn Baseline might not be straightn If heating causes some structural changes in the material
the crystallinity determination may be impossible

46
Heat capacity (Cp)n Cp = absorbed heat/temperature increase (J/(°C g) tai J/(°C
mol)n Cp means energy which is needed, when the temperature is
increased 1 °C for 1 g or 1 mol substance
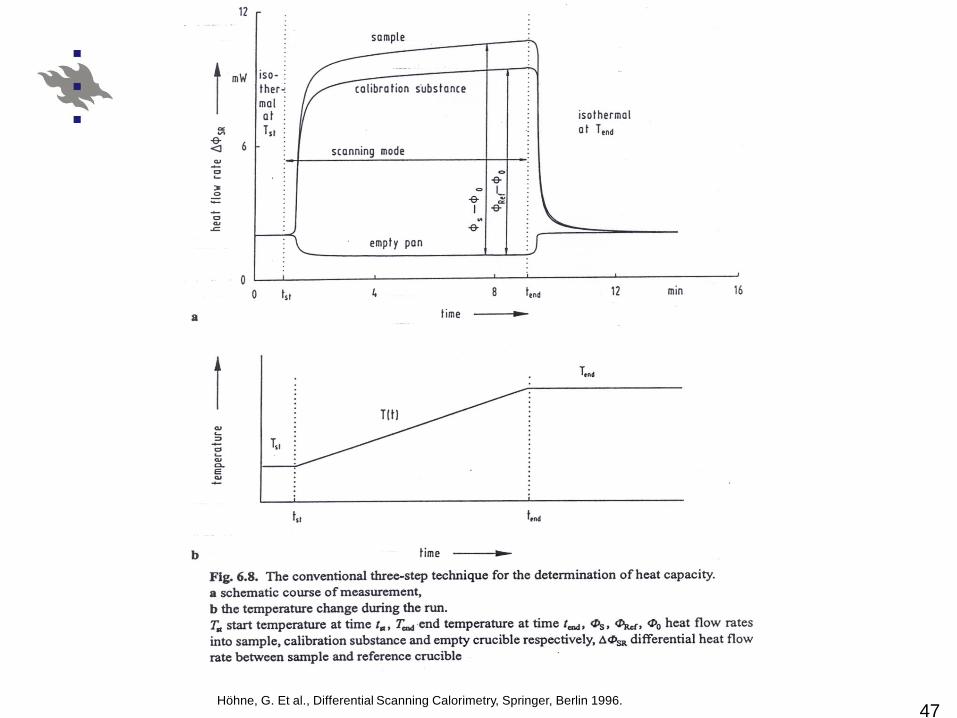
47Höhne, G. Et al., Differential Scanning Calorimetry, Springer, Berlin 1996.

48
Fingerprint of compoundn Studies oif different mixtures and indentication of substances
Fox example butter-margarine, plastic waste, automobilegrease
Van der Plaats, G.,The Practice of Thermal Analysis, Mettler, Switzerland 1991.

49

50
Van der Plaats, G.,The Practice of Thermal Analysis, Mettler, Switzerland 1991.

51
Polymeric fire retardants
n DSC can be used in studies how polymers are burning andhow fire retardants affect the behaviour
Mettler Toledo, UserCom 2/2005
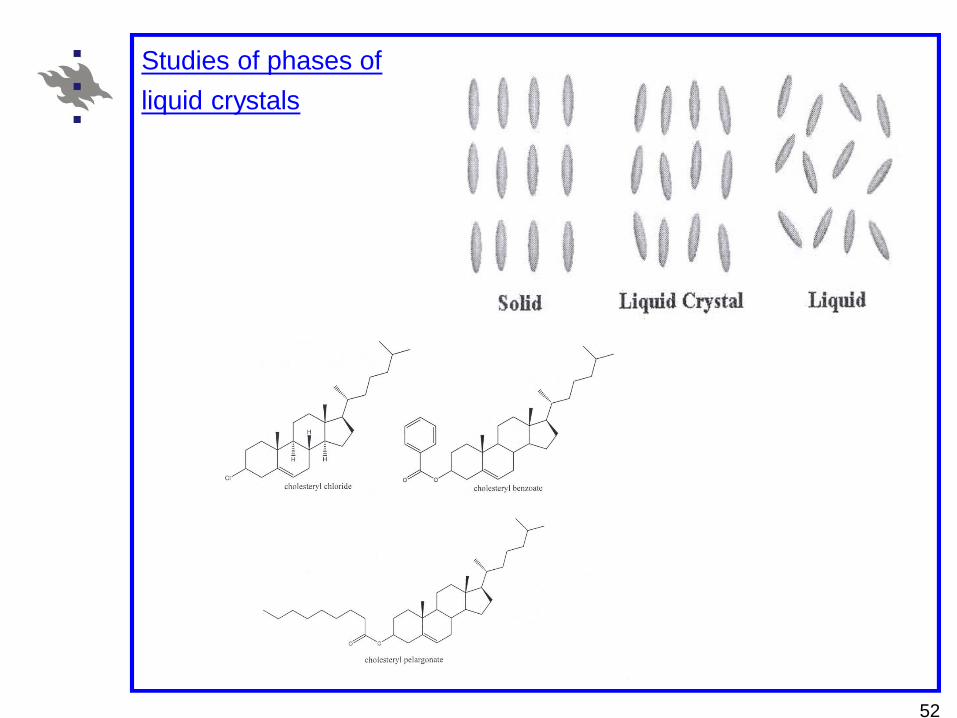
52
Studies of phases ofliquid crystals

53

54
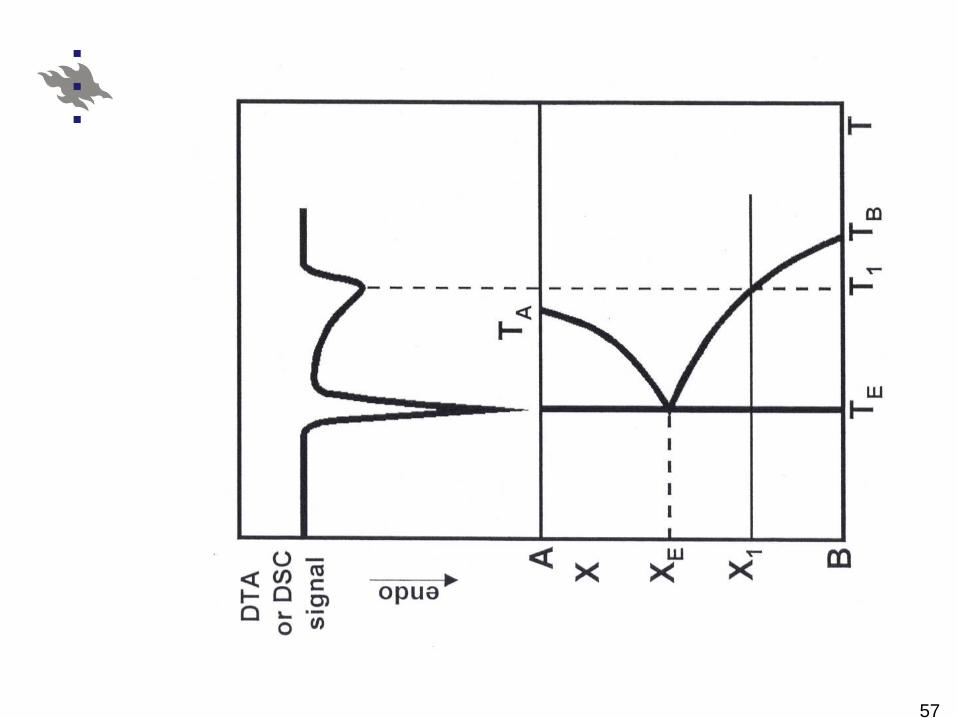
Phase diagramsn Phase diagrams present graphically phases present in certain
system as funtion of experimental parameters (pressure,temperature, composition).
n In metallurgy and mineralogy determinations of phasediagrams thermally has been one of the oldest applicationareas of TAs
n Two-component systems (most simple)n Components are fully miscible as liquidsn Solid phases are of pure compounds/components (solid
phases are immiscible)n Open system, constant pressure (101.325 kPa)n Eutectic point: solid phases are in equilibrium with liquid.
Lowest temperature where liquid is formed.n At eutectic point whole liquid phase is solidified at fixed
temperature to two pure solids

55
Van der Plaats, G., The Practice of Thermal Analysis, Mettler, Switzerland 1991.

56
57
58
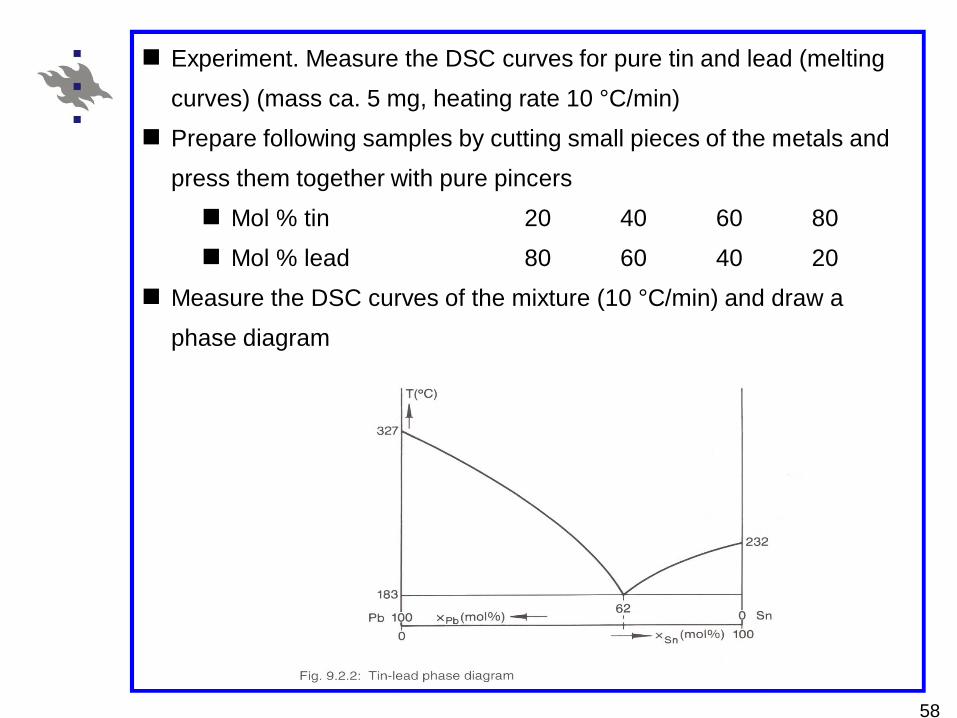
n Experiment. Measure the DSC curves for pure tin and lead (melting
curves) (mass ca. 5 mg, heating rate 10 °C/min)
n Prepare following samples by cutting small pieces of the metals and
press them together with pure pincers
n Mol % tin 20 40 60 80
n Mol % lead 80 60 40 20
n Measure the DSC curves of the mixture (10 °C/min) and draw a
phase diagram
59
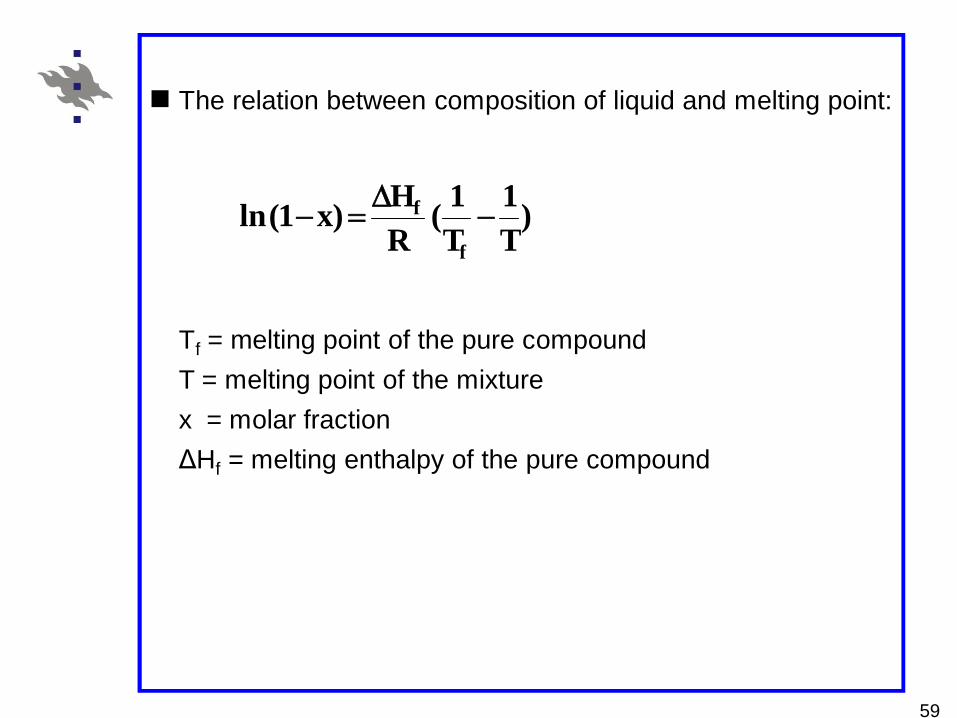
n The relation between composition of liquid and melting point:
Tf = melting point of the pure compoundT = melting point of the mixturex = molar fractionΔHf = melting enthalpy of the pure compound
)T1
T1(
RH)x1(ln
f
f -D
=-
60
Van der Plaats, G., The Practice of Thermal Analysis, Mettler, Switzerland 1991.
61