differentialspectrophotometric determination ofcalcium forpublication oct.22,1962. 704...
TRANSCRIPT
Differential Spectrophotometric Determination
of Calcium
Nathan Radin and Adalbert L. Gramza
The appearance of kits for the determination of micro amounts of calcium stimulated
our interest in the use of Eriochrome Blue SE for this analysis. A study of spectro-photometric curves indicates that, at pH values above 13.7, calcium will complexand cause a change of dye absorbance while magnesium does not complex with thedye. A differential spectrophotometric technic is described in this paper in whichthe spectrophotometer is set at zero absorbance with a dye-calcium standard solu-tion or a dye-calcium sample solution as reference and the absorbance of the dyesolution then measured. For a set of standards the absorbance-calcium relationship islinear. With the Beckman spectrophotometer, Model Dli, it has been found that 1part of serum to 100 parts of alkaline dye solution (100 A of serum to 10 ml. alkalinedye solution) can be used. The technic shows greater sensitivity and accuracy thando previous methods using Eriochrome Blue SE.
‘THE USE OF Eriochrome Blue SE for the colorimetric determination
of calcium and magnesium in serum was first described by Yanagi-
sawa (1). This method was investigated arid modified by Kingsleyand Robnett (2, 3). The modified technic used 0.2 ml. of serum addedto 6 ml. of alkaline dye solution. The photometer was set with the
alkaline dye solution containing no calcium at 10-30% transmittanceand the transmittance values for all the sample solutions were deter-
mined. The wave length region between 615 and 655 mj. was suggestedwith 620 m as the optimum wavelength for this measurement. Two
colorimetric methods for the direct determination of calcium ions in
serum using Eriochrome Blue SE in 1.0 N sodium hydroxide were
reported by Brush (4). An inquiry into methods of photometric meas-
Prom the Division of Biochemistry, Rochester General Hospital, Rochester 8, N. Y.Presented in part at the Fourteenth Annual Meeting of the American Association of Clinical
Chemists, Santa Monica, Oalif., Aug. 28, 1962.Received for publication Oct. 22, 1962.
704

Vol. 10, No. 8, 1964 DETERMINATION OF CALCIUM 705
urements in cases where the introduction of sample causes a decreasein absorbance of the chromogenic reagent solution was reported byReilley and Hildebrand (5).
The work to be described in this paper uses a differential spectro-photometric method of measurement for the determination of calciumusing Eriochrome Blue SE. This method uses 1’ part of serum to 100parts of alkaline dye solution, with the lower limits for the amount ofsolution to be used being set by the size of the cells which can beadapted to the spectrophotometer.
New ProcedureReagents
Potassium hydroxide stock solution, 5 M Dilute 437 ml. of 45%(w/v) KOH (Baker) solution to 1 L. with distilled water. Store solu-tion in a polyethylene bottle.
Eriochrome Blue SE solution, 9.6 X i0 M Dilute 0.5327 gm. of3- (5-chloro-2,2-hydroxyphenylazo )-4,5-dihydroxy-2,7-naphthalene di-sulfonic acid, disodium salt, dihydrate (Eastman, white label) to 1 L.with distilled water and 25 ml. of approximately 0.03 II HC1. The lat-
ter solution is made by diluting 2.5 ml. coilcentrated HC1 (Baker, ACS)to 1 L. with distilled water.
Standard calcium solution, 3.0, 6.0, 9.0, 12.0, and 15.0 mg./100 ml.Dissolve 1.4984 gm. primary standard calcium carbonate (Mallinc-krodt) in 2.5 ml. concentrated HC1 arid dilute to 100 ml. with distilledwater. Transfer 5-, 10-, 15-, 20-, and 25-mi. aliquots of the stock solu-tion to 1-L. volumetric flasks and dilute to the mark with distilledwater.
ProcedureThe glassware for this calcium determination is washed with a de-
tergent, rinsed well with tap water, washed with a 1M nitric acid solu-tion, and rinsed well with tap water and then distilled water. It is es-sential that the glassware be clean to avoid contamination of the dyesolution.
Pyrex, glass-stoppered, volumetric flasks; glass-stoppered bottles;15-ml. glass-stoppered centrifuge tubes; Kimax Class A volumetricpipets; and Pyrex microliter “to contain” pipets are used. The Beck-
man spectrophotometer, Model DU* (Models DB and B may also beused), with 10-mm. light path matched cells (Quaracell, OS) is usedfor the measuring step.
*BeCkmalI Instruments, Inc., Scientific and Process Instruments Division, Fullerton, Calif.

706 RADIN & GRAMZA Clinical Chemistry
1. Transfer 25 ml. of (lye solution to a 250-mi. volumetric flask, addabout 100 ml. distilled water, and transfer 25 ml. of the 5 M KOH solu-tion to the flask, agitate, dilute to mark with water, and mix well.
2. Immediately after preparation transfer 10-mi. aliquots of thealkaline dye solution into 15-mI. centrifuge tubes.
3. With all 0.1-mi. microliter pipet add 0.1 ml. of either water forblank, or serum, or standard solution to the dye solution (Step 2) andrinse pipet with this solution 3 times. Stopper the centrifuge tubesand mix the solutions well.
4. Make measurements at 620 mj.t. Set the instrument at zero ab-sorbance with the dye-calcium standard or sample solution ill the ref-erence cell, and read the absorhance value for the dye-water (blank)solution.
Allow 45 miii. for all operations described above in our routine lab-oratory and complete the measurements during the next 15-mm. in-terval.
CalibrationCarry out tile procedure aI)ove with 0.1-nil. aliquots of each of the
calcium standard solutions.
Substitute the absorbance values into the equations below, whichwere derived from the least-squares formula for fitting a straight lineto a series of points (6)
2 (A15 - A3) + A10 - A6 = b
30
and0.2(A3+AO+AB+A10+A15) -9ba
where a is the intercept, b the slope, and A0 the absorbance, with n in-
dicating the particular calcium standard solution concentration.The calcium concentration iii the sample may then be determined
from
Ar a Concentration of calcium (mg./100 ml.)
where Ax lS the absorhance of dye-water blank with dye-serum solutionas reference solution.
For example, following the procedure described above, absorbancevalues for the 3, 6, 9, 12, and 15 mg./100 ml. of the calcium standardsolutions were found to be 0.065, 0.140, 0.220, 0.280, and 0.352, respec-
tively. The value for the slope, b, is calculated by
2 (0.352 - 0.065) + 0.280 - 0.140 - 0 036
30 - . -.

Vol. ID, No. 8. 1964 DETERMINATION OF CALCIUM 707
and the value for the iiitercept, i, is calculated by
0.2 (0.065 + 0.140 + 0.220 + 0.280 + 0.352) -9 (0.0236) = +0.001.
Following the procedure above with a serum sample it is found thatthe absorbance value is 0.220. The calcium concentration is then deter-mined by
0.220 - 0.001
0.0236 = 9.3 mg./100 iiil.
The procedure above may also be carried out using only the 12
mg./100 ml. calcium standard solution for calibration. The calcula-tions are then simplified to
12 X A3, = Concentration of caleiuiii (iiig./100 ml.)
A12
Using the data from the previous example, the calcium concentrationwould be
12 X 0.2200.280 = 9.4 nig./10() nil.
Experimental
The difficulties reported with other methods (1-4, 7-9), the appear-ance of kits for the calcium determination, and the need for this deter-mination stimulated our interest in micro calcium methodology.
Determination of Optimum pH
Three solutions were prepared which contained 3.0 X 10 M Erio-chrome Blue SE and 3.0 X 10 M calcium. Three solutions were pre-pared containing 3.0 X 10 M Eriochrome Blue SE only. To eachdye-calcium or dye solution sufficient potassium hydroxide had been
added to yield a final KOH concentration of either 0.1, 0.5, or 1.0 M.Similar solutions were prepared which contained 3.0 X 10 M mag-nesium instead of calcium. Absorbance-wave length curves for theprepared solutions, using the KOH reference solutions, were recordedwith a Beckman spectrophotonneter, Model 1)B. Tile curves for thedye, the dye-calcium, and the dye-magnesium compositions iii a 0.5 MKOH solution are shown in Fig. 1. The dye solution and the dye-mag-nesium solution curves coincide, which indicates no apparent mag-
nesium dye complex under these conditions. There is an observed shiftof the dye-calcium solution curve. The curves for the solutions in 1.0M KOH show the same results except that the shift in the dye-calciumsolution curve is less than that observed in 0.3 M KOH solution. The

curves for the solutions in 0.1 M KOH are shown in Fig. 2. It can beseen that the curves for both dye-calcium and dye-magnesium solu-tioiis have shifted considerably from the dye solution curve. This indi-cates that under these conditions both a dye-calcium and a dye-mag-nesium complex exist.
Fig. 1. Absorbance-
wave length spectralcurves for solutions con-
taining 3.0 x 10 MEriochrome Blue SE, 0.5
M KOH, and 0 M calcium
or magnesium (A), 3.0 X
i0 M magnesium (B),and 3.0 X 10 M calcium(C).
Fig. 2. Absorbance-
wave length spectralcurves for solutions con-
taining 3.0 X 1O M inEriochrome Blue SE, 0.1M KOH, 0 M calcium ormagnesium (A), 3.0 X
l0 M magnesium (B),and 3.0 X 10 M calcium
(C).
WAVti.ENSTH. ML&.IM1CRON$
U1CI.
1CI-
800 500
WAVELCNSTH, NILLIMPCSONS
708 RADIN & GRAMZA Clinical Chemistry
UzI-I-z1
I-
The 0.3 M KOH solution concentration was selected as the optimum
alkalinity for this method because under this condition only calciumcomplexes with tile dye, whereas magnesium does not complex withthe dye aiid will not interfere with the determination. On the otherhand, the stability of the dye calcium complex is diminished at higher
KOH concentrations.
Calcium-Eriochrome Blue SE Solution Relationship
The absorbance values of a series of solutions which contained 3.0 X10 M Eriochrome Blue SE, 0.5 M KOH, and which varied in calciumconcentration from 0 to 3.0 X 10 M were measured using a 0.5 MKOH ref ereilce solution at wave lengths in the range from 575 to 630

0.5
UUzUU
C
1CS0
C
4.0
Vol. 10, No. 8, 1964 DETERMINATION OF CALCIUM 709
mj. The difference in absorbance between the solution containing dyeonly and each of the solutions containing both dye and calcium, at a
particular wave length, was plotted against the calcium/dye molar ra-
tio. These curves are given in Fig. 3 at three different wave lengths-
Fig. 3. Absorbaimee
difference-mole ratio of
calcium dye relationship:A, 620 mz; B, 630 m;
and C, 610 m.
MOLE RATIO OF CALCIUM/DYE
namely, 610, 620, and 630 m. The absorbance difference shows a
linear relationship with calcium/dye ratio up to a molar ratio of 1.Above a molar ratio of 1 the slopes of the curves decrease markedlyand a limiting value for the absorbance difference is approached. The
greatest change of absorbance difference with calcium/dye ratio oc-curs at 620 m, thus making this the wave length of choice for thismethod. In addition, solutions containing a calcium/dye molar ratioof less than 1 were employed in this method in order to use conditionswhich permitted maximum sensitivity.
Spectrophotometric Technic
Two methods of photometric measurements, as described by Reilleyand Hildebrand (s), were studied using the Coleman Jr. spectropho-tometer, Model GA, and the Beckman spectrophotometer, Model DU.For both methods the instruments were set to 620 mjz and to read 0%T, the 0% T with the photocells in darkness.
Solutions which contained 4.8 X 10 M Eriochrome Blue SE, 0.5 MKOH and which varied in calcium concentration from 0 to 0.100 mg./
100 ml. of solution were prepared. With the first photometric technicthe instruments were set to read zero absorbance for a 0.5 MI KOH ref-erence solution. The absorbance values were then determined for thedye solution (0 calcium) and the dye-calcium solutions. In Fig. 4 a

710 RADIN & GRAMZA Clinical Chemistry
plot of the data shows the relative insensitivity of this method of meas-
urement. With the Beckman spectrophotometer the absorbancechange for the range of 0 to 0.100 mg./100 ml. of calcium was 0.210,which was greater than the 0.105 value determined with the Coleman
Jr. spectrophotometer.
I I I I I I I I I I
0.6
A - Fig. 4. Absorbance-cal-cium concentration rela-
tionship in 4.8 )< JJJ-5 MEriochrome Blue SE and
04 0.5 M KOH solution: A,#{149} Beckman spectrophotorne-
ter, Model DU; B, Cole-man Jr. spectrophotome-
0.2 - - ter, Model 6A.
0.02 0,04 0.06 0.06 0.10
CALCIUM, MG %
in the second technic, which shall be called the differential spectro-photometric method, the instruments were set to zero absorbance witheach dye-calcium solution as the reference solution. The absorbancevalue for the dye solution was then determined. The plot of the datafor each instrument is showni in Fig. 5 and 6. The relationship betweenabsorbance and calcium concentration, which is linear, and the curvewhich passes through the origin show that the Bouguer-Beer law isobeyed when the Beckman spectrophotometer is used. The data ob-tamed with the Coleman Jr. spectrophotometer* show a nonlinear re-lationship between absorbance and calcium concentration, and thecurve does not pass through the origin. Curve B in Fig. 5 and 6 showthe absorhance-calcium concentration relationship for solutions which
contained 9.6 X 10 MI Eriochrome Blue SE, 0.5 M KOH and whichvaried in calcium concentration from 0 to 0.200 mg./100 ml. of solution.
The data determined with the Beckman spectrophotometer show alinear relationship between absorbance and calcium concentration be-
*Coleman Instruments, Inc., Maywood, Ill.
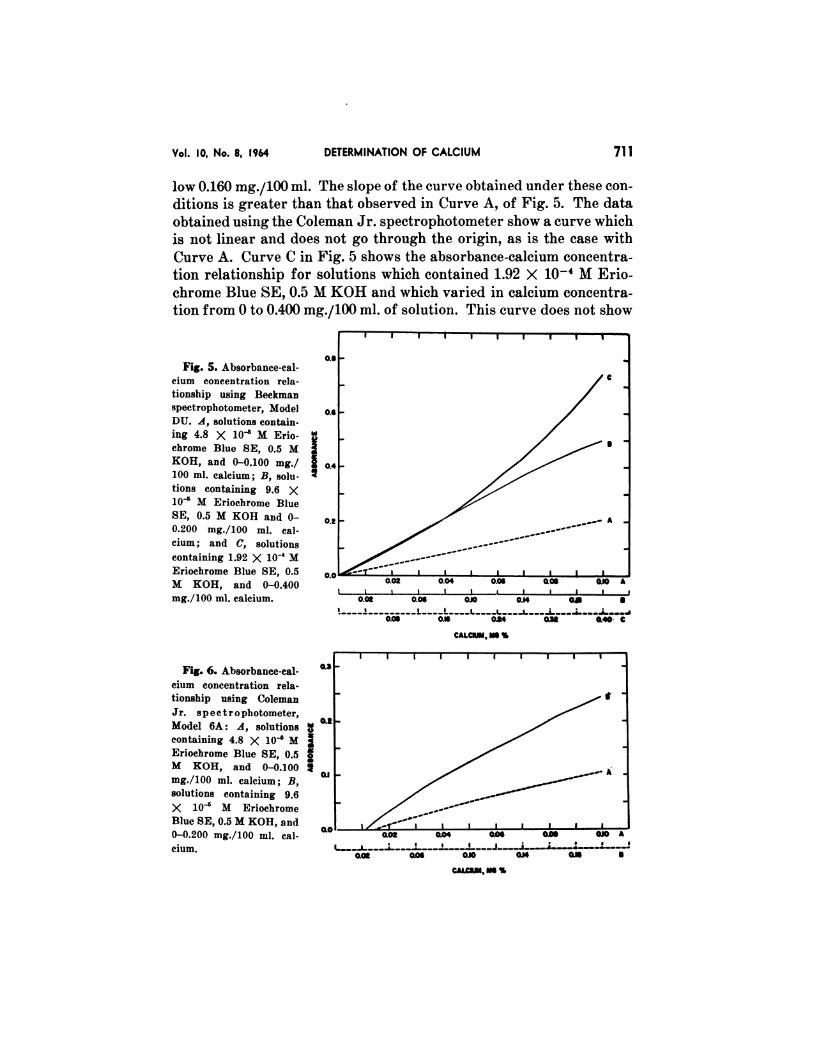
low 0.160 mg./100 ml. The slope of the curve obtained under these con-ditions is greater than that observed in Curve A, of Fig. 5. The dataobtained using the Coleman Jr. spectrophotometer show a curve whichis not linear and does not go through the origin, as is the case with
Curve A. Curve C in Fig. 5 shows the absorbance-calcium concentra-tion relationship for solutions which contained 1.92 X 10 M Erio-
chrome Blue SE, 0.5 MI KOH and which varied in calcium concentra-tion from 0 to 0.400 mg./100 ml. of solution. This curve does not show
I I I I I I I I I I
0.9 .
C
0.6 - .
0.4-
:: _________________:____1A0.02 0.04 0.06 009 010
.
AI I I I I I
0.02 0.06 0.10 014 01 S
0.05 0.* 024 02* 0.40 C
I
US4
0N
CALcwM MS %
02* 010 A
#{149}__L___..L__..L___.L___.L___1____.i____.A___.L 100* 005 0.10 0)4 OS S
CAI.C2M MS S
Vol. 10, No. 8, 1964 DETERMINATION OF CALCIUM 711
Fig. 5. Absorbanee-eal-
cium concentration rela-
tionship using Beckmanspectrophotometer, Model
DU. A, solutions contain-
ing 4.8 X 10 M Erio-
chrome Blue SE, 0.5 MKOH, and 0-0.100 mg./100 ml. calcium; B, solu-
tions containing 9.6 Xi0 M Eriochrome Blue
SE, 0.5 M KOH and 0-
0.200 nmg./100 ml. cal-
cium; and C, solutions
containing 1.92 X iO MEriochrome Blue SE, 0.5
M KOH, and 0-0.400mg./i00 ml. ealcium.
Fig. 6. Absorbance-cal-
cium concentration rela-
tionship using Coleman
Jr. speetrophotometer,
Model 6A: A, solutions
containing 4.8 X 10 MEriochrome Blue SE, 0.5M KOH, and 0-0.100
mg./100 ml. calcium; B,solutions containing 9.6
X 10’ M EriochromeBlue SE, 0.5 M KOH, and0-0.200 mg./100 ml. cal-
cium.

UUS.(
10
8104
Fig. 7. Absorbance-eal-
Cium standard curve us-
ing Beckman spectropho-
tometer, Model DU. So-
lutions contain 9.6 X 10
M Eriochrome Blue SE,
0.5 M KOH and calcium
standard solutions.
CALCIUM, MG S
712 RADIN & GRAMZA Clinical Chemistry
a linear relationship between absorbance and calcium concentration.The Coleman ,Ji. spectrophotometer could not be set to zero absorb-
ance whein the latter dye-calcium solutions were used as reference solu-tions.
The observation that results which obey the Bouguer-Beer law whenthe Beckman spectrophotometer is used do not conform with the
Bouguer-Beer law when the Coleman Jr. spectrophotometer is used isattributed to instrumental differences. The concave curves shown in
Fig. 6 can be expected with a photometer having a relatively large slitwidth, as the absorbancies change rapidly with wave length in thespectral region of measurement (10). The band width for the ColemanJr. specti-ophotometer is approximately 35 m1, and for the Beckmanspectrophotometer at 620 mJL, it is estimated that the band width for
the 0.3-mm. slit width used is approximately 22 m. Another reasonfor nonconformity with the Bouguer-Beer law may be attributed to theColeman Jr. spectrophotometer detection system, which is not sensi-tive enough for the differential spectrophotometric method with dye
solutions which have high absorbance values. The differential spectro-photometric method, using the Beckman spectrophotometer, ModelPU, with conditions as for Curve B, Fig. 5, was chosen for the calcium
analytical procedure. A typical standard curve is shown in Fig. 7.

Vol. 10, No. 8, 1964 DETERMINATION OF CALCIUM 713
Stability
A solution was prepared containing 2.9 X 10 MI Eriochrome Blue
SE and 0.5 MI KOH. Two alkaline dye solutions of the concentrationsabove were prepared with one solution containing a calcium standard,making it equivalent to 9 mg./100 ml. of serun#{236}calcium, and the othersolution containing a serum sample with a 10 mg./100 ml. calcium con-centration. The absorbance values of these solutions were measuredat 10-mill. intervals using 0.5 MI KOH as the ref erence solution. Theabsorbance readings for the dye and the dye-calcium solution wereconstant for 60 miii., when there was a 0.002 decrease every 10 mm.The absorhance readings for the dye-serum solution were constant for45 mm., after which there was a decrease with time.
Further studies were made of stability using the differential spec-trophotometric method. Either an alkaline dye-calcium solution or an
alkaline dye-serum solution was used to set the Beckmall spectropho-tometer to zero absorbance, and the readings were made for the alka-line dye solution at 10-miii. intervals. The absorbance for the alkaline
dye solution measured with the alkaline (lye-calcium solution as thereference solution was constant for 60 mill. The absorbance for thealkaline dye solution measured with the alkaline dye-serum solution
as the reference solution was constant for only 45 miii. It was fromthese studies that 15 mm. was established as the time for the prepara-tion and pipetting of the alkaline dye solution; this left 45 mm. to pre-pare and measure the serum and standard calcium in dye solutionswithout instability effects.
Effects of Other Ions
Alkaline dye solutions, all of which contained 12 mg./100 ml. of cal-cium and 0, 2.9, 5.8, or 14.5 mg./100 ml. of magnesium were prepared.
Another alkaline dye solution containing 2.9 mg./100 ml. magnesiumwith no calcium was prepared. The measurement of the absorbancevalues by the differential spectrophotometric method did not show any
change for the calcium value, and for the magnesium solution the ab-
sorbance was zero. These results show that magnesium did not com-plex with the dye solution and that up to 14.5 mg./100 ml. magnesium
does not interfere with the calcium determination.
The presence of Fe up to 1.3 mg./100 ml. and Cu up to 6.0
mg./100 ml. did not interfere ill the calcium determination. Thepresence of phosphorus as phosphate up to 30 mg./100 ml. of phos-

714 RADIN & GRAMZA Clinical Chemistry
phorus in 15 mg./100 ml. calcium solution#{236}sdid not show any absorb-
ance change from that of a 15 mg./100 ml. calcium control solution.
Determination of Serum Calcium
Accuracy
Serum samples were analyzed for calcium simultaneously by thedifferential spectrophotometric method in duplicate and singly by the
Clark-Collip method (11). Table 1 shows the results of 11 paired anal-yses performed duriiig one laboratory day.
Thirty-four results were used to compare methods by statisticalmeans (12). The mean difference between methods was +0.01176
(+0.01), the standard deviation of the mean difference was 0.07137,
and t = (0.01176/0.07137) (V34) = 0.9608. Since 33 0.05 = 2.036, itis concluded that the data examined give no evidence of a systematicdifference between methods.
Detection of constant errors, or method bias, which would not befound with the classical recovery method can be evaluated withstraight-line statistics (6). Standard values are plotted on the x-axis
and the values found by the analysis are plotted on the y-axis on graphpaper. Standard samples must cover a reasonable concentrationrange if this method is to be used. If there is no constant error in theanalytical process the various points should tend to lie closely along aline passing through the origin. If there is a bias, all points are dis-placed upward (or downward) the same amount and the y-interceptcorresponds to the bias. The slope of the line shows the change in
Table 1. SERUM CALCIUM VALUES DETERMINED WITH THE CLARK-COLLIe AND THE PRESENT
PROCEDURES DURING ONE LABORATORY DAY
Radin-Gram.za
Serum No.
Ciork-Collip(mg./lOO
method
ml.)
method
(mg./iOO ml.)
1 9.5 9.4
2 9.6 9.5
3 11.2 11.2
4 8.6 9.05 6.8 6.5
6 10.5 10.07 8.8 8.48 10.0 10.2
9 9.3 9.310 12.4 12.5
11 7.3 6.8
Vol. ID, No. 8. 1964 DETERMINATION OF CALCIUM 715
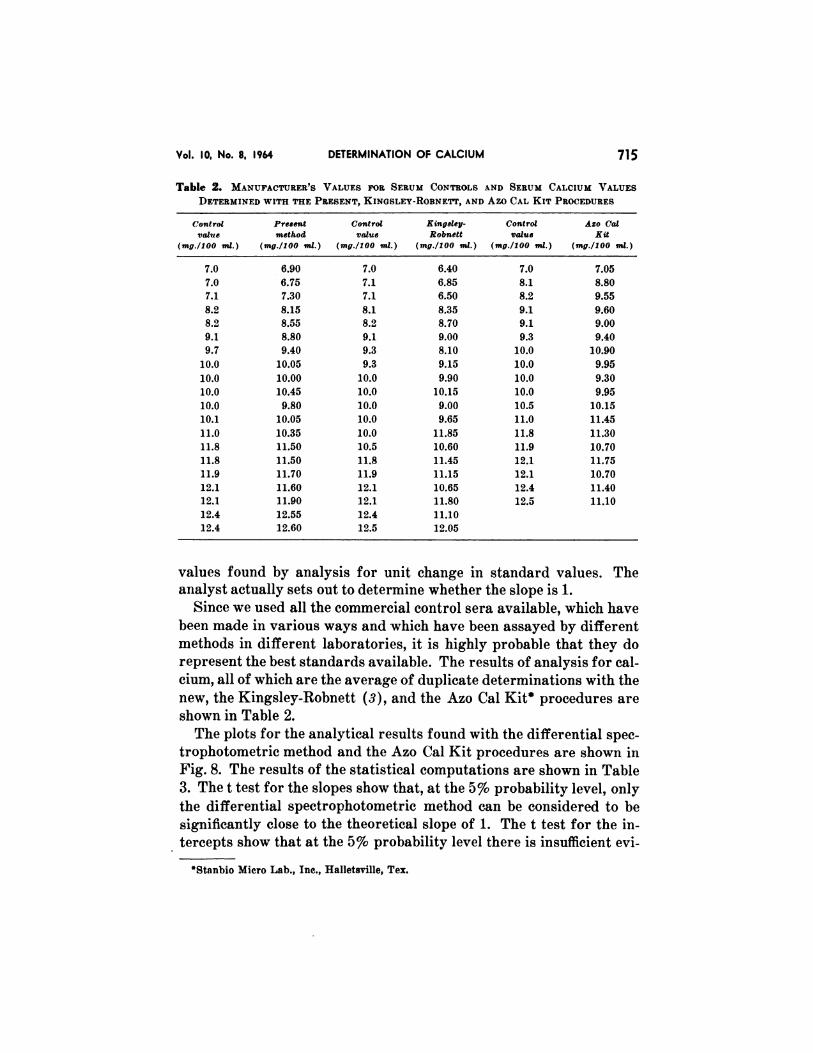
Table 2. MANUFACTURER’S VALUES FOR SERUM CONTROLS AND SERUM CALCIUM VALUES
DETERMINED WITH THE PRESENT, KINGSLEY-ROBNE’1r, AND Azo CAL KIT PROCEDURES
Contravalve
(ing./100
l
ml.)
Pre8ent
method(mg./100 ml.)
Conlro
value
(mg./100
l
ml.)
King8ley-
kobnett(mg./lOO ml)
Contra
value(mg./100
I
ml.)
Azo (‘at
Kit
(mg./100 ml.)
7.0 6.90 7.0 6.40 7.0 7.057.0 6.75 7.1 6.85 8.1 8.80
7.1 7.30 7.1 6.50 8.2 9.55
8.2 8.15 8.1 8.35 9.1 9.608.2 8.55 8.2 8.70 9.1 9.00
9.1 8.80 9.1 9.00 9.3 9.409.7 9.40 9.3 8.10 10.0 10.90
10.0 10.05 9.3 9.15 10.0 9.95
10.0 10.00 10.0 9.90 10.0 9.30
10.0 10.45 10.0 10.15 ]0.0 9.95
10.0 9.80 10.0 9.00 10.5 10.15
10.1 10.05 10.0 9.65 11.0 11.45
11.0 10.35 10.0 11.85 11.8 11.30
11.8 11.50 10.5 10.60 11.9 10.70
11.8 11.50 11.8 11.45 12.1 11.7511.9 11.70 11.9 11.15 12.1 10.70
12.1 11.60 12.1 10.65 12.4 11.4012.1 11.90 12.1 11.80 12.5 11.10
12.4 12.55 12.4 11.1012.4 12.60 12.5 12.05
values found by analysis for unit change in standard values. Theanalyst actually sets out to determine whether the slope is 1.
Since we used all the commercial control sera available, which havebeen made in various ways and which have been assayed by differentmethods in different laboratories, it is highly probable that they do
represent the best standards available. The results of analysis for cal-cium, all of which are the average of duplicate determinations with the
new, the Kingsley-Robnett (3), and the Azo Cal Kit* procedures are
shown in Table 2.The plots for the analytical results found with the differential spec-
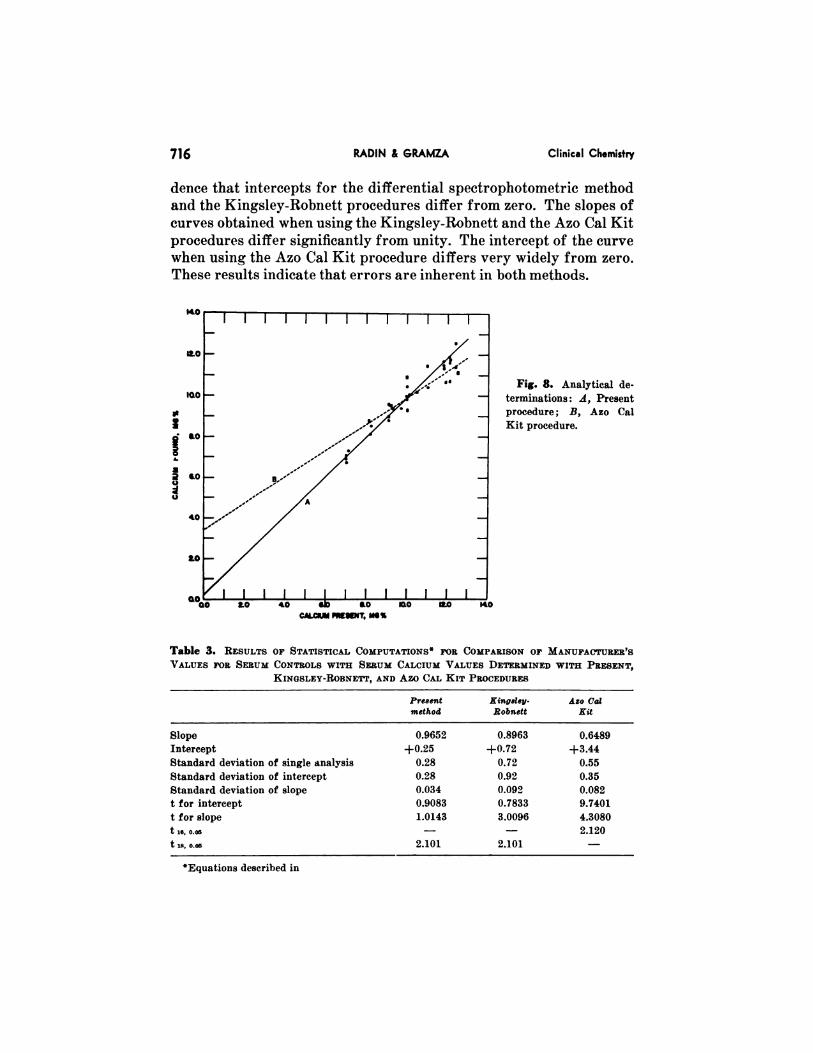
trophotometric method and the Azo Cal Kit procedures are shown inFig. 8. The results of the statistical computations are shown in Table
3. The t test for the slopes show that, at the 5% probability level, only
the differential spectrophotometric method can be considered to be
significantly close to the theoretical slope of 1. The t test for the in-
tercepts show that at the 5% probability level there is insufficient cvi-
Stanbio Micro Lab., Inc., Halletsville, Tex.
2S
a0S
a2U
U
Fig. 8. Analytical de-
terminations: A, Presentprocedure; B, Azo Cal
Kit procedure.
CAL0IUM PE5LNT, MIS
Equations described in
716 RADIN & RAMZA Clinical Chemistry
deuce that intercepts for the differential spectrophotometric methodand the Kingsley-Robnett procedures differ from zero. The slopes ofcurves obtained when using the Kingsley-Robnett and the Azo Cal Kitprocedures differ significantly from unity. The intercept of the curvewhen using the Azo Cal Kit procedure differs very widely from zero.These results indicate that errors are inherent in both methods.
Table 3. RESULTS OF STATISTICAL COMPUTATIONS FOR COMPARISON OIl’ MANUFACr1JRER’S
VALUES FOR SERUM CONTROLS WITH SERUM CALCIUM VALUES DETERMINED WITH PRESENT,
KINGSLEY-ROBNETT, AND Azo CAL KIT PROCEDURES
Present
methodKingsley-
JtobnettAzo Cat
Kit
Slope 0.9652 0.8963 0.6489
Intercept +0.25 +0.72 +3-44Standard deviation of single analysis 0.28 0.72 0.55
Standard deviation of intercept 0.28 0.92 0.35
Standard deviation of slope 0.034 0.092 0.082
t for intercept 0.9083 0.7833 9.7401
t for slope 1.0143 3.0096 4.3080
t . o. - - 2.120t ,, 2.101 2.101 -

Vol. 10. No. 8, 1964 DETERMINATION OF CALCIUM 717
Precision
Studies of the precision of the differential spectrophotometric meth-od and the Clark-Collip, the Kingsley-Robnett, and the Azo Cal Kitprocedures were made using the same serum pooi for all measure-ments. Analytical determinations were made, iii duplicate, with allprocedures every day for 10 days. The statistical results are shown inTable 4. The F test, which is a statistical test that can be used to coni-
pare the precision of two procedures, shows that at the 5% probabilitylevel there is no significant difference ill precision between the differ-ential spectrophotometi’ic method and the Clark-Collip procedure.The critical F value is exceeded by the results obtained with the Kings-ley-Robnett and the Azo Cal Kit procedures, which indicates that thesemethods are not as precise as the differential spectrophotometricmethod.
Effect of Hemolysis
A hemoglobin solution was obtained by hemolyzing packed red bloodcells with distilled water. This solution, which contained 0.554 gm.hemoglobin per 100 ml. solution, was used to prepare aliquots of apooled serum exhibiting a range of 13.8 to 110 mg. of hemoglobin per100 ml. of serum. A perceptible pink color could he just detected with
13.8 mg. hemoglobin per 100 ml. of serum solution. The 110 mg. hemo-globin per 100 ml. of serum solution was dark red. There was no de-
tectable change in the 9.3 mg./100 ml. calcium value of the serum pooi
with hemoglobin present up to 110 mg./100 ml.
Effect of Icterus
Some icteric sera and controls with varying concentrations of hili-
rubin were analyzed for calcium with the differential spectrophoto-
Table 4. STATISTICAL ANALYSIS FOR DETERMINATION OF SERUM CALCIUM IN A POOLED SERuM
WITH PRESENT, CLAHK-COLLIP, KINGSLEY-ROBNETF, AND THE Azo CAL KIT METHODS
Present
methodClark-
Coup
Kingsley-
Robnett
Azo CalKit
No. of determinations 20 20 20 20Mean Ca (mg./100 ml.) 9.08 9.04 8.70 9.16S.D. 0.26 0.35 0.45 0.54Mean difference between duplicates 0.24 020 0.32 0.37
F* L812 2.996 4.314
- Variance of old procedures (S.D.)2
- Variance of new procedures (S.D.)2Critical value F, 5% level, 2.1 712.
718 RADIN & GRAMZA Clinical Chemistry
metric method and the Clark-Collip procedure. The bilirubin contentof the sera was determined with our routine modified Evelyn-Malloymethod. Concentrations up to 20 mg./100 ml. of bilirubin had no effecton the calcium values.
Effect of Lipemia
Some lipemic sera were analyzed for calcium by the differelltialspectrophotometric method. Aliquots of each lipemic serum wereshaken vigorously with equal volumes of ethyl ether and then centri-fuged. The serum layers, which were clear, were then analyzed forcalcium by tile differential spectrophotometl’ic method. The resultsindicated that there was no significant difference between the ex-tracted and nonextracted sera.
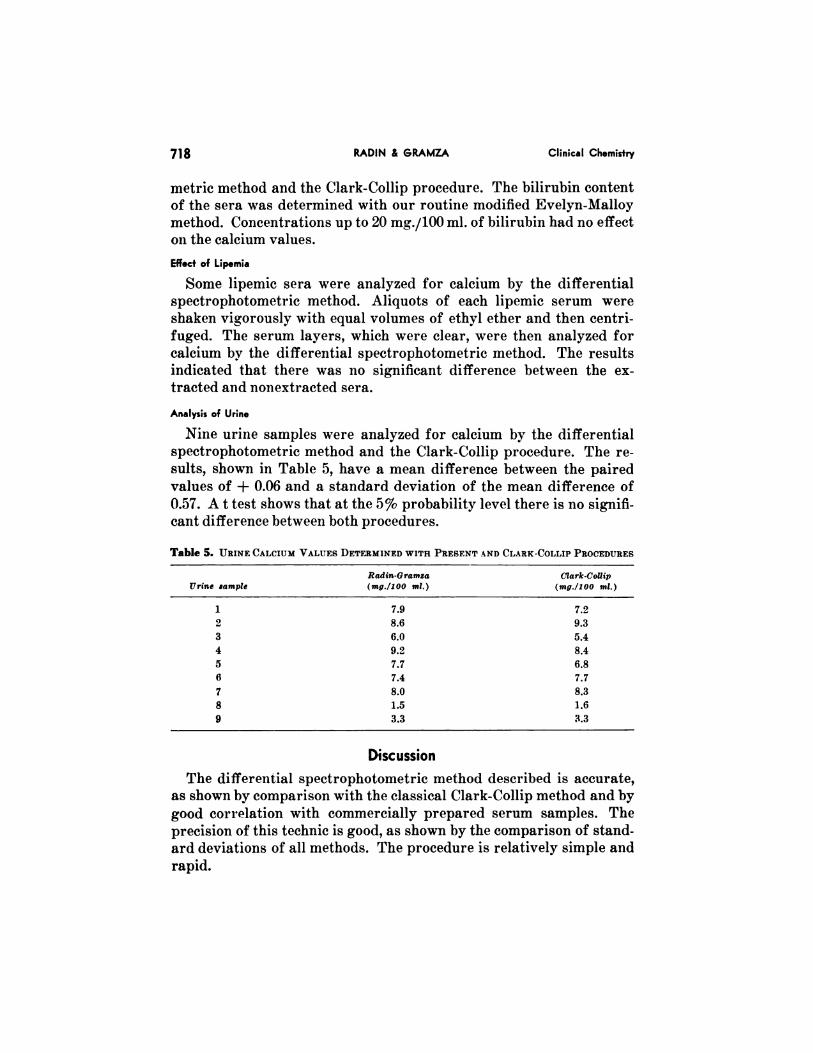
Analysis of Urine
Nine urine samples were analyzed for calcium by tile differentialspectrophotometric method and the Clark-Collip procedure. The re-sults, shown in Table 5, have a mean difference between the pairedvalues of + 0.06 and a standard deviation of the mean difference of0.37. A t test shows that at the 5% probability level there is no signifi-cant difference between both procedures.
Table 5. URINE CALCIUM VALUES DETERMINED WITH PRESENT AND CLARK-COLLIe PROCEDURES
Urine sample
Rodin-Gr
(mg./100
amza
ml.)
(lark-C
(mg./100
oiip
ml.)
1 7.9 7.2
2 8.6 9.3
3 6.0 5.4
4 9.2 8.45 7.7 6.86 7.4 7.7
7 8.0 8.3
8 1.5 1.6
9 3.3 3.3
Discussion
The differential spectrophotometric method described is accurate,as shown by comparison with the classical Clark-Collip method and bygood correlation with commercially prepared serum samples. Theprecision of this technic is good, as shown by tile comparison of stand-
ard deviations of all methods. The procedure is relatively simple andrapid.

Vol. 10. No. 8, 1964 DETERMINATION OF CALCIUM 719
A disadvantage that this procedure may have for sonic laboratories
is that it is necessary to have a high-quality spectrophotometer such asthe Beckman Model DU. It is evident in evaluating the results that inthe authors’ laboratory, the Kingsley-Robnett and the Azo Cal Kitprocedures are not adequate for au accurate or precise calcium analy-sis. In the new procedure, advantage is taken of a differential spectro-photometric (or precision colorimetric) technic which is discussedcomprehensively by Hiskey (13).
Duplicate determinations for each sample are recommended for thedifferential spectrophotometric method. We ran a standard curve, one
set of unknowns and controls, a set of duplicate unknowns and con-trols, and then another standard curve in that order. The calciumvalues were calculated by using the equation developed from the meth-od of least squares, and by using the 12-standard value only, makingthe assumption of a linear relationship between absorbance and con-centration with the intercept value of zero. It was found that the re-sults from both calculation methods were within 0.1 mg./100 ml. Theadvantage of the standard curve method is that the variation of theintercept acts as a control. The curve slopes varied from day to day, as
did the intercepts. When the intercept was outside of the ± 0.010 limitit was usually an indication of contamination. However, even withcontamination, by using the least squares equation, which includes theintercept value in the equation, the calcium values were found to beacceptable.
This procedure may be adapted to smaller (or larger) serum ali-quots. In the procedure as described we used 0.1-ml. aliquots of serumor urine to 10 ml. of alkaline dye solution. Wheui small amounts ofserum are available it is satisfactory to use 0.03-unl. aliquots of serumto 5 ml. of alkaline dye solution. The results for 20 sera showed no
significant differences when analyzed either way. The limiting factorfor determining how little serum can be used is the size of the spectro-photometer cell.
References1. Yanagisawa, F., J. Biochem. (Japan) 42, 3 (1955).2. Kingsley, G. R., alid Robnett, 0., Am. J. Clin. Pat/tot. 27, 223 (1957).3. Kingsley, G. R., and Robnett, 0., Ant. J. GUn. Pat/tot. 29, 171 (1959).4. Brush, James S., Anal. Chem. 33, 798 (1961).5. Reilley, C. N., and Hildebrand, G. P., Anal. C/tern. 31, 1763 (1959).6. Youden, W. J., Statistical Methods for Chemists, John Wiley & Sons, Inc., New York,
1951, Chap. 5.7. Fales, F. W., J. Biol. Chem. 204, 577 (1953).8. Chilcole, M. E., and Wasson, B. D., GUn. C/tern. 4, 200 (1958).

720 RADIN & RAMZA Clinical Chemistry
9. Bachra, B. N., Dauer, A., and Sobel, A. E., Cliv. Chem. 4, 107 (1958).10. Meites, L., and Thomas, H. C.. Advanced Analytical Chemistry, McGraw-Hill Book Com-
pany, Inc., New York, N. Y., 1958, p. 256.11. Clark, E. P., and Collip, J. B., J. Blot. Chem. 63, 461 (1925).12. Bennett, C. A., and Franklin, N. L., Statistical Analysis in Chemistry and the Chemical
Industry, John Wiley & Sons, Inc., 1954, p. 180.13. Hiskey, C. F., Anal. C/tern. 21, 1440 (1949).
Erratum
In Abstracts of Papers from Scientific Sessions, published in theJuly issue, two lines of type were dropped in the abstract of “TheElaboration of 1)eoxyribonuclease (DNase) by Sonically DisruptedStaphylococci” by Jacob Kream, Stanley Marmonek, and NathanKatz (Gun. Ghenu. 10, 652, 1964). The omission creates the erroneousimpression that the work done by the authors was done by Cunninghamin 1956. The following should he inserted between the first two para-graphs.
Continuing the present authors’ laboratory investigation of theproperties of this nuclease, the following is reported: