differentiators that make a difference - qvidianinfo.qvidian.com/rs/qvidian/images/differentiators...
TRANSCRIPT

© 2011 Tom Sant© 2011 Tom Sant
Differentiators that Make a Difference
Value, Differentiators and ProofTom Sant

© 2011 Tom Sant
Why Differentiators Matter:Providing Support for Our Value Propositions
The ultimate goal of differentiating our offer and our company:
Win more business.Do it faster.

© 2011 Tom Sant
Smart Buyers Look for Positive Impact
• Revenue generation• Cost avoidance• Operational efficiency• Reliability of mission-critical operations• Quality of deliverables or execution• Sustainability• Worker productivity• Customer satisfaction• Regulatory compliance• And other key performance indicators

© 2011 Tom Sant
It’s not what you sell; it’s what they’ll gain
Focus on the hole your customer needs to make,not on the drill.
© 2011 Tom Sant
The Estimation Heuristic
Basic principle:Choose the course of action or alternative that
offers the highest rate of return.
Why the Inuit hunt whales.
Basic principle:Choose the course of action or alternative that offers
the highest rate of return.

© 2011 Tom Sant
The Basic Value Proposition
(Values - Costs) > (Valuea - Costa)
where:Values = the value of your solution Costs = the cost of your solution Valuea = the value of the next best alternativeCosta = the cost of the next best alternative

© 2011 Tom Sant
A value proposition is a
promise
to deliver specific results that the client desires,
backed up by evidence that we can keep our promise.

© 2011 Tom Sant
The Importance of the Value Proposition
It answers one of the three questions that clients ask when they are making a buying decision:
Am I getting what I need?Is it good value?
Can they really do it?

© 2011 Tom Sant
It answers one of the three questions that clients ask when they are making a buying decision:
Am I getting what I need?Is it good value?
Can they really do it?

© 2011 Tom Sant
And Differentiations Helps Answer the Third
It answers one of the three questions that clients ask when they are making a buying decision:
Am I getting what I need?Is it good value?
Can they really do it?

© 2011 Tom Sant
Four Principles of Value1. The payback measurements must be client-focused
If the client doesn’t care about it, it has no value.
2. The presentation of payback is more persuasive if it’s quantified
Show me the money!
3. The value proposition is more likely to be noticed and remembered if it’s graphical
Most decision makers don’t read; they skim.
4. To bullet-proof your value proposition, you must base it on your differentiators
Otherwise, your competitor just says, “Me too.”

© 2011 Tom Sant
The Process
1. Identify customer-desired outcomes
2. Quantify the value
3. Select relevant differentiators
4. Prove your claim

© 2011 Tom Sant
Step One:Identify Customer-Desired Outcomes

© 2011 Tom Sant
Four Areas of Outcome
Strategic Value •Budgetary compliance•Profit improvement•Downsizing•Mergers / acquisitions•Market share•Reduced risk•Better clinical outcomes
Strategic outcomes:• Financial metrics• Market share• Growth rate• Shareholder value

© 2011 Tom Sant
Four Areas of OutcomesStrategic:
Business / Financial•Budgetary compliance•Profit improvement•Downsizing•Mergers / acquisitions•Market share•Reduced risk•Better clinical outcomes
Tactical:Technical / Infrastructure• Introducing best practices• Adding flexibility• Improving QC• Automating a labor-
intensive process• Regulatory compliance
Tactical outcomes:• Operational performance• Productivity• Headcount• Quality, compliance

© 2011 Tom Sant
Four Areas of Outcomes
Business / Financial•Budgetary compliance•Profit improvement•Downsizing•Mergers / acquisitions•Market share•Reduced risk•Better clinical outcomes
Technical / infrastructure goals• Introducing best
practices• Adding flexibility• Improving QC
Social / Political:• Internal
- Improve morale-Reduce absenteeism-Decrease turnover
•External-Gain public support-Win approval-Enhance recognition
Social / political outcomes:• Improved relations with employees, suppliers• Customer satisfaction• Sustainable / green operations

© 2011 Tom Sant
Four Areas of Outcomes
Business / Financial•Budgetary compliance•Profit improvement•Downsizing•Mergers / acquisitions•Market share•Reduced risk•Better clinical outcomes
Technical / infrastructure goals• Introducing best
practices• Adding flexibility• Improving QC
Social goals• Internal
- Improve morale-Reduce absenteeism-Decrease turnover
•External-Gain public support-Win approval-Enhance recognition
Personal goals

© 2011 Tom Sant
Activity # 1: Identify Outcomes
15 minutes
Identify specific, quantified outcomes in each of the three areas where clients typically seek results.
Use the examples as a guide to create your own.

15minutes left

14minutes left

13minutes left

12minutes left

11minute left

10minutes left

9minutes left

8minutes left

7minutes left

6minute left

5minutes left

4minutes left

3minutes left

2minutes left

1minute left

Done!

© 2011 Tom Sant
Activity 1: Identifying Typical Outcomes
Share your results.

© 2011 Tom Sant
Categorize the Outcomes
By Business Function
By the Buyer’s Role

© 2011 Tom Sant
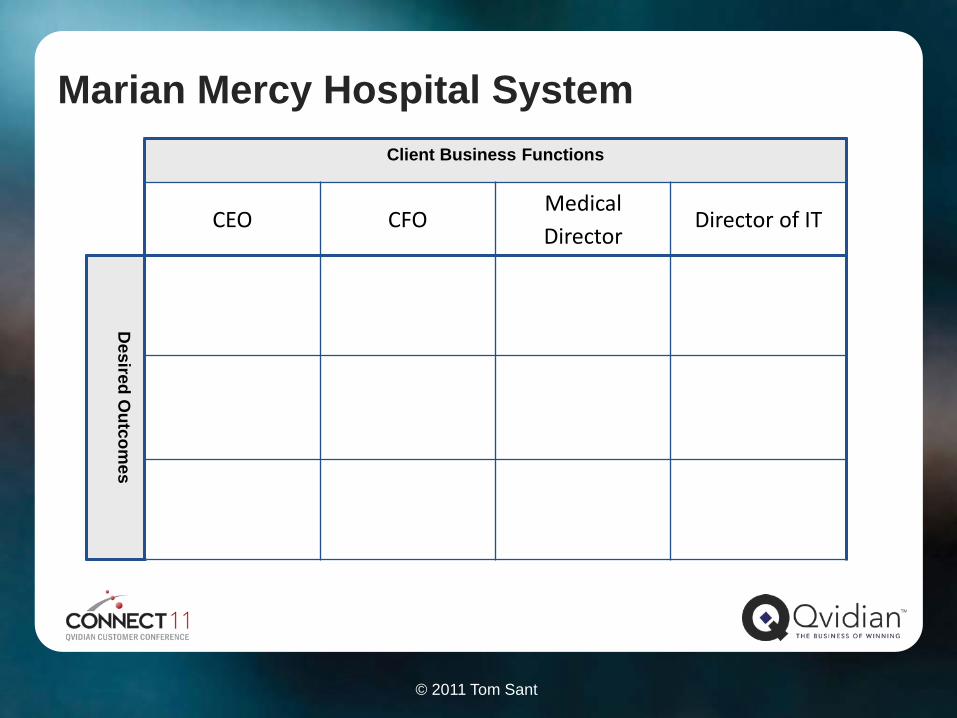
Create an Outcome Map for Your Opportunity
• Identify the key business functions with the client organization that will be part of the decision team.• For example: CEO, CFO, VP of Sales, General Manager of
Quality Operations• List the function across the top row.
• Fill in the specific outcomes each function desires in the columns below.
• Prioritize the outcomes in terms of the client’s decision process.

© 2011 Tom Sant
Client Business Functions
Desired O
utcomes
© 2011 Tom Sant
Marian Mercy Hospital SystemClient Business Functions
CEO CFOMedical Director
Director of IT
Desired O
utcomes

© 2011 Tom Sant
Marian Mercy Hospital SystemClient Business Functions
CEO CFOMedical Director
Director of IT
Desired O
utcomes
Integrate 3 new acquisitions
Achieve Top 100 Hospitals ranking
Improved core measures of performance

© 2011 Tom Sant
Marian Mercy Hospital SystemClient Business Functions
CEO CFOMedical Director
Director of IT
Desired O
utcomes
Integrate 3 new acquisitions
Improve net profitability
Achieve Top 100 Hospitals ranking
Reduce A/R by 5 days average
Improved core measures of performance
Reduced spend on drug therapy
(prompt shifts off of IVs)

© 2011 Tom Sant
Marian Mercy Hospital SystemClient Business Functions
CEO CFOMedical Director
Director of IT
Desired O
utcomes
Integrate 3 new acquisitions
Improve net profitability
Zero “never” events
Achieve Top 100 Hospitals ranking
Reduce A/R by 5 days average
Accurateworkload tracking
Improved core measures of performance
Reduced spend on drug therapy
(prompt shifts off of IVs)
Reduced medication errors
© 2011 Tom Sant
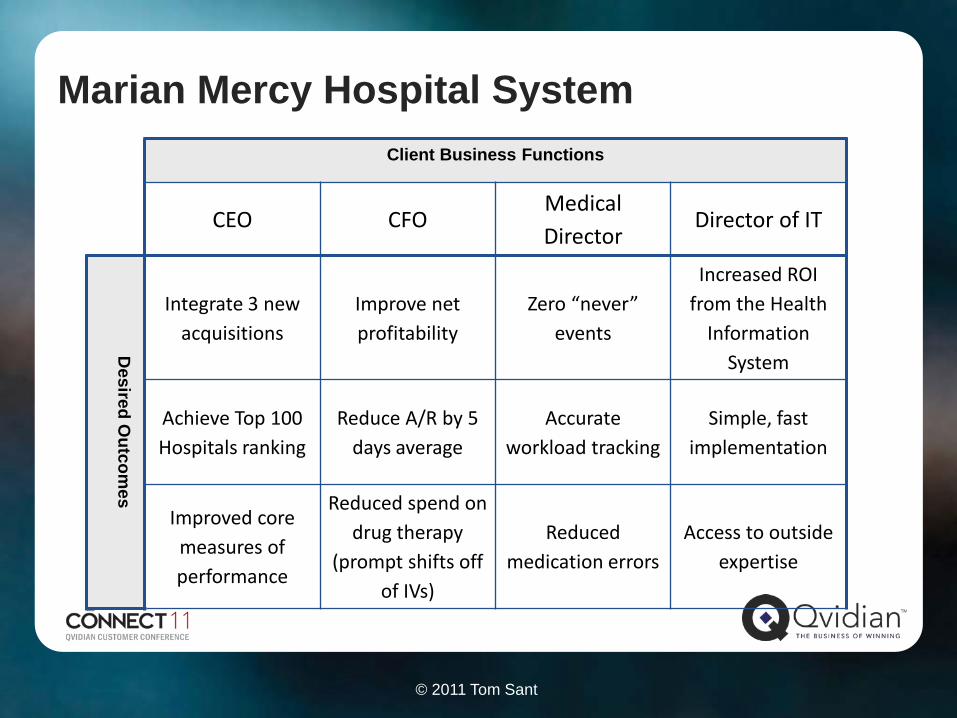
Marian Mercy Hospital SystemClient Business Functions
CEO CFOMedical Director
Director of IT
Desired O
utcomes
Integrate 3 new acquisitions
Improve net profitability
Zero “never” events
Increased ROI from the Health
Information System
Achieve Top 100 Hospitals ranking
Reduce A/R by 5 days average
Accurateworkload tracking
Simple, fast implementation
Improved core measures of performance
Reduced spend on drug therapy
(prompt shifts off of IVs)
Reduced medication errors
Access to outside expertise

© 2011 Tom Sant
Now…
Prioritize and group.
1. Which function or role has the most important voice in the decision?
2. Which outcomes are connected?

© 2011 Tom Sant
Marian Mercy Hospital SystemClient Business Functions
CEO CFOMedical Director
Director of IT
Desired O
utcomes
Integrate 3 new acquisitions
Improve net profitability
Zero “never” events
Increased ROI from the Health
Information System
Achieve Top 100 Hospitals ranking
Reduce A/R by 5 days average
Accurateworkload tracking
Simple, fast implementation
Improved core measures of performance
Reduced spend on drug therapy
(prompt shifts off of IVs)
Reduced medication errors
Access to outside expertise

© 2011 Tom Sant
Activity # 2: Build an Outcome Map
15 minutes
Complete the Outcome Map for an opportunity you are currently pursuing.
1. Name the relevant business functions involved in the decision2. Identify outcomes that each function seeks.3. Prioritize the top outcomes: strategic, tactical or political? 4. Look for opportunities to group outcomes.

15minutes left

14minutes left

13minutes left

12minutes left

11minute left

10minutes left

9minutes left

8minutes left

7minutes left

6minute left

5minutes left

4minutes left

3minutes left

2minutes left

1minute left

Done!

© 2011 Tom Sant
Activity 2: Build an Outcome Map
Share your results.

© 2011 Tom Sant
Step Two:Quantify the Value
© 2011 Tom Sant
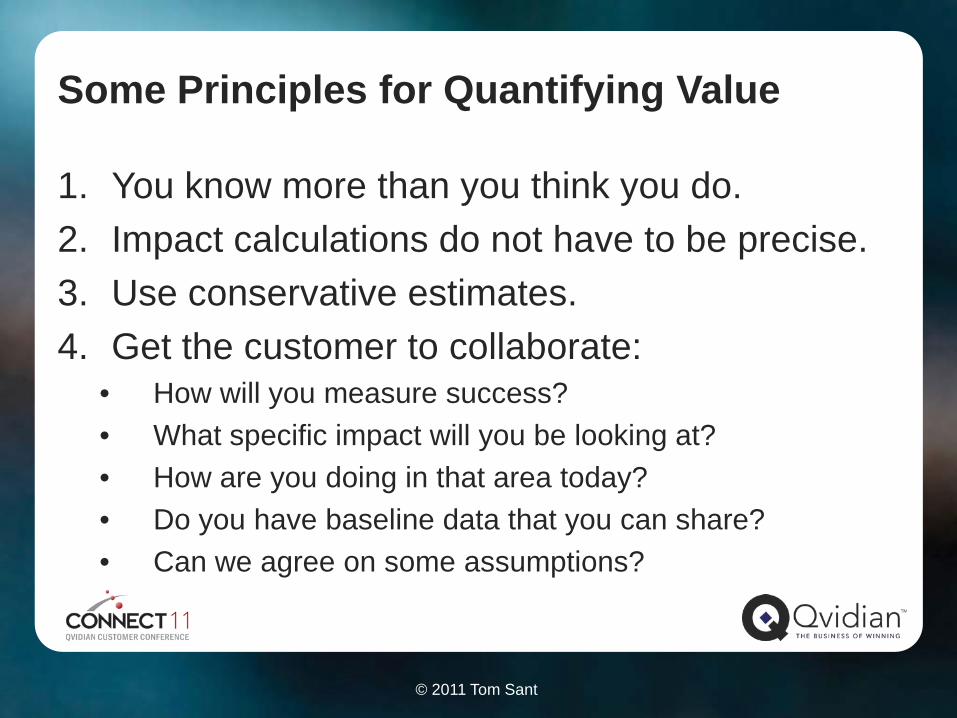
Some Principles for Quantifying Value
1. You know more than you think you do.2. Impact calculations do not have to be precise.3. Use conservative estimates.4. Get the customer to collaborate:
• How will you measure success?• What specific impact will you be looking at?• How are you doing in that area today? • Do you have baseline data that you can share?• Can we agree on some assumptions?

© 2011 Tom Sant
Six Ways to Quantify Value
• Anecdotal• Benchmarking• ROI modeling• Payback analysis• Internal rate of
return• Net present value
Impact on Sales
X
X
X
X
X
X
X
Payback Point

© 2011 Tom Sant
Anecdotal Evidence of Value
Example
Point
Benefit

© 2011 Tom Sant
Related: Case Studies to Establish Value
Problem: the challenge our customer faced.
Action: what we did to help them meet the challenge.
Result: statistics and metrics showing the impact our
actions had; a testimonial from the client.

© 2011 Tom Sant
Six Ways to Quantify Value
AnecdotalBenchmarking
0
10
20
30
40
50
60
70
80
total cost of ownership
Competitor A
Industry Average
ACME

© 2011 Tom Sant
Six Ways to Quantify Value
•Anecdotal•Benchmarking•ROI modeling
Typical Bank Performance Metropolitan Bank Performance
Assume: $2,000,000 trustAssume: 10% return per yearGross yield: $200,000Trustee fee: approx. ½ to 1%
= $10,000 to $20,000Investment management fee: ¼ to ½%
= $5,000 to $10,000Internal cost of administration: Assume 1 FTE @ $40,000/yrTaxes (at corporate rates): 35%
= $70,000Gross income: $200,000Fees: $ 10,000 to $20,000Fees: $ 5,000 to $10,000Administrative costs: $ 40,000Taxes: $ 70,000
Net income: $60,000 to $75,000
Assume: $2,000,000 trustAssume: 10% return per yearGross yield: $200,000Total trustee, investment management, and administrative fees: 2%
= $ 40,000
Taxes (at trust rates): 12%= $24,000
Gross income: $200,000Fees: $ 40,000Taxes: $ 24,000
Net income $136,000

© 2011 Tom Sant
Six Ways to Quantify Value
• Anecdotal• Benchmarking• ROI modeling• Payback
What is Payback?
How long it takes for the monthly savings / benefits from an investment decision to recover the original cost.
Unit of measure = a time period
Very powerful for recurring benefits

© 2011 Tom Sant
Six Ways to Quantify Value
What is Internal Rate of Return?
The investment “return rate per annum” arising from a comparison of all savings against the initial cost of that investment
This measure is a percentage indicating an annualized “rate of profitability” on the original investment)
• Anecdotal
• Benchmarking
• ROI modeling
• Payback
• Internal rate of return

© 2011 Tom Sant
Six Ways to Quantify Value
What is Net Present Value or Economic Value Added?
A measure of whether a sales proposal delivers a “profit” or a “loss” using an annual cost of money applied to the timing of the original spend & future savings
This measure is in money:positive for a profitable proposal, negative for a loss-making one
• Anecdotal
• Benchmarking
• ROI modeling
• Payback
• Internal rate of return
• Net present value or economic value added

© 2011 Tom Sant
Payback, IRR and NPV are related
+9.09
-100.00
+109.09
-100
Today
+120
+120
365 daysSpend100
20%
IRRPayback
(12 Months)
Min return% / Interest
10%
(Original investment)
NPV(EVA)
© 2011 Tom Sant
Use methods you are comfortable with.
Avoid value proposition paranoia.
Gain agreement from the buyer prior to the proposal, if possible.

© 2011 Tom Sant
Step Three:Select Relevant Differentiators

© 2011 Tom Sant
Differentiate Your Solution and Your Firm
What is a differentiator?
Does it matter which ones you use?

© 2011 Tom Sant
What Are Differentiators?
• Product/service features• Corporate capabilities• Methodology • Management practices• Personnel • Facilities • Size• Experience• Recognition, awards

© 2011 Tom Sant
Common Mistakes in Differentiating
1. Not including any differentiators at all.• Without differentiators, it’s a commodity.
2. Using generic differentiators and random lists.• Generic value has no value.
3. Substituting marketing fluff.• No marketing fluff!
4. Insisting on uniqueness.• It’s the stack that’s unique

© 2011 Tom Sant
Activity 3: Differentiators vs. Competitors
10 minutes
1. Identify two of your top competitors.
2. For each competitor, brainstorm 3 or 4 differentiators and then indicate (a) why each matters (how the client benefits from them) and (b) how you can prove them.

10minutes left

9minutes left

8minutes left

7minutes left

6minute left

5minutes left

4minutes left

3minutes left

2minutes left

1minute left

Done!

© 2011 Tom Sant
Activity 3: Differentiators vs. Competitors
Share your results.

© 2011 Tom Sant
Differentiating the Intangible
In differentiating a service, emphasize:
1. How you do the work
2. How you manage the work.
3. The people you will provide.
4. Special equipment, facilities or tools you have.

© 2011 Tom Sant
Activity 4: Identifying Differentiators
10 minutes
Identify as many differentiators and the proof to support them as you can in each category.
How you do the work:Differentiator______________________________________Proof: ___________________________________________
How you manage the work:Differentiator______________________________________Proof: ___________________________________________
Who will do the work:Differentiator______________________________________Proof: ___________________________________________
Special facilities, resources, equipment, etc.:Differentiator______________________________________Proof: ___________________________________________

10minutes left

9minutes left

8minutes left

7minutes left

6minute left

5minutes left

4minutes left

3minutes left

2minutes left

1minute left

Done!

© 2011 Tom Sant
Debrief
Share your results.
Which area was the hardest to differentiate?

© 2011 Tom Sant
Question:
How can you quickly selectthe most effective
differentiators?

© 2011 Tom Sant
Answer: Create a Selection Matrix
List all of your differentiators:• By competitor• By corporate capabilities
Align your differentiators with the most common value positions you encounter.
Weight the differentiators.

© 2011 Tom Sant
Align Your Differentiators with Value Positions
Differentiator Financial Technical SocialAwards for superior products
True Web-based architecture
Lease or buy options
Standard code base
Fastest loading and retrieval
Open architecture
Microsoft Solution Partner
First to market
Team functionality

© 2011 Tom Sant
Align Your Differentiators with Value Positions
Differentiator Financial Technical SocialAwards for superior products 5 3 1True Web-based architecture 2 4 2Lease or buy options 4 5 3Standard code base 3 5 2Fastest loading and retrieval 2 4 2Open architecture 4 3 2Microsoft Solution Partner 5 3 5First to market 2 2 4Team functionality 3 2 5
p. 87

© 2011 Tom Sant
Align Your Differentiators with Value Positions
Differentiator Financial Technical SocialAwards for superior products 5 3 1True Web-based architecture 2 4 2Lease or buy options 4 5 3Standard code base 3 5 2Fastest loading and retrieval 2 4 2Open architecture 4 3 2Microsoft Solution Partner 5 3 5First to market 2 2 4Team functionality 3 2 5

© 2011 Tom Sant
Activity 5: Create a Selection Matrix
10 minutes
1. List your differentiators in column one.2. List the most common value orientations in the
remaining columns.3. Rank the relevance and effectiveness of each
differentiator to substantiate your ability to deliver that kind of value from 1 (none) to 5 (excellent).

10minutes left

9minutes left

8minutes left

7minutes left

6minute left

5minutes left

4minutes left

3minutes left

2minutes left

1minute left

Done!

© 2011 Tom Sant
Debrief
Can you see using this tool in the future?

© 2011 Tom Sant
Step Four:Prove Your Claim

© 2011 Tom Sant
Differentiators Proof
ValueProposition
Value That Has Value.
What you do that no one else
does. What you do
differently from anyone else.
Verifiable claims you make about
yourself. Claims your clients make about you.
Third-party evidence.
Communicating Value That Has Value

© 2011 Tom Sant
What Kind of Proof Matters?Pile up the proof:
• Case studies• References• Testimonials• Team resumés• Project plan• Third-party validation (press clips,
articles, awards, etc.)• Company capabilities• Management philosophy• Guarantees• Quality control methodology
p. 89

© 2011 Tom Sant
Things You Say About Yourself
Resumes or CVsCompany history
Corporate capabilitiesCoverage maps
Process diagrams

© 2011 Tom Sant
Things Your Clients Say About You
ReferencesTestimonialsCase studies

© 2011 Tom Sant
Third-Party Evidence
AwardsRankings
RecognitionCertifications
Accolades

© 2011 Tom Sant
Writing Effective Value Claims

© 2011 Tom Sant
From Value Chain to Value Claim
Client centered?
Focused on a specific value?
Quantified?
Illustrated graphically?
Tied to your best differentiators?

© 2011 Tom Sant
Writing Effective Value Claims
First:State the value the customer will receive, preferably in quantifiable terms
Example: “One important benefit of accepting this proposal is that Acme Ltd will see a decrease in energy consumption of 15 to 18%.”

© 2011 Tom Sant
Link Value with Your Differentiator
Then:Link the value proposition with your differentiator in a cause/effect sentence
Example: “That decrease in energy consumption will come as a direct result of implementing our gas and electric rationalization software, which will automatically manage your energy costs to assure that you pay the lowest possible price 24 hours a day. The only system of its kind, the software has been proven in controlled studies to reduce energy bills.”

© 2011 Tom Sant
Prove It!Third:
Provide a proof statement Case studyReference or testimonialThird-party validationVerifiable statisticsGuarantees or service-level commitments
Example: “For example, when Leeds Smelting implemented the software, they saw an immediate reduction in energy costs of more than 20%. Similarly, Birmingham Hospital reduced energy costs by 17% during the first year of using our software.”

© 2011 Tom Sant
Thank You!