diffuse interstellar bands in upper scorpius: probing ... · model of the diffuse interstellar...
TRANSCRIPT
UvA-DARE is a service provided by the library of the University of Amsterdam (http://dare.uva.nl)
UvA-DARE (Digital Academic Repository)
Diffuse interstellar bands in Upper Scorpius: probing variations in the DIB spectrumdue to changing environmental conditionsVos, D.A.I.; Cox, N.L.J.; Kaper, L.; Spaans, M.; Ehrenfreund, P.
Published in:Astronomy & Astrophysics
DOI:10.1051/0004-6361/200809746
Link to publication
Citation for published version (APA):Vos, D. A. I., Cox, N. L. J., Kaper, L., Spaans, M., & Ehrenfreund, P. (2011). Diffuse interstellar bands in UpperScorpius: probing variations in the DIB spectrum due to changing environmental conditions. Astronomy &Astrophysics, 533. DOI: 10.1051/0004-6361/200809746
General rightsIt is not permitted to download or to forward/distribute the text or part of it without the consent of the author(s) and/or copyright holder(s),other than for strictly personal, individual use, unless the work is under an open content license (like Creative Commons).
Disclaimer/Complaints regulationsIf you believe that digital publication of certain material infringes any of your rights or (privacy) interests, please let the Library know, statingyour reasons. In case of a legitimate complaint, the Library will make the material inaccessible and/or remove it from the website. Please Askthe Library: http://uba.uva.nl/en/contact, or a letter to: Library of the University of Amsterdam, Secretariat, Singel 425, 1012 WP Amsterdam,The Netherlands. You will be contacted as soon as possible.
Download date: 09 Jun 2018
A&A 533, A129 (2011)DOI: 10.1051/0004-6361/200809746c© ESO 2011
Astronomy&
Astrophysics
Diffuse interstellar bands in Upper Scorpius: probing variationsin the DIB spectrum due to changing environmental conditions�,��
D. A. I. Vos1, N. L. J. Cox2, L. Kaper3, M. Spaans4, and P. Ehrenfreund5
1 Radboud University Nijmegen, Toernooiveld 1, Postbus 9010, 6500 GL Nijmegen, The Netherlandse-mail: [email protected]
2 Instituut voor Sterrenkunde, K.U. Leuven, Celestijnenlaan 200D, bus 2401, 3001 Leuven, Belgium3 Astronomical Institute “Anton Pannekoek”, Universiteit van Amsterdam, Postbus 94249, 1090 GE Amsterdam, The Netherlands4 Kapteyn Astronomical Institute, Rijksuniversiteit Groningen, Postbus 800, 9700 AV Groningen, The Netherlands5 Astrobiology Group, Leiden Institute of Chemistry, Leiden University, Einsteinweg 55, 2300 RA Leiden, The Netherlands
Received 7 March 2008 / Accepted 28 July 2011
ABSTRACT
Aims. We study the effects of local environmental conditions affecting the diffuse interstellar band (DIB) carriers within the UpperScorpius subgroup of the Sco OB2 association. The aim is to reveal how the still unidentified DIB carriers respond to different physicalconditions prevailing in interstellar clouds, in order to shed light on the origin of the DIB carriers.Methods. We obtained optical spectra with FEROS on the ESO 1.52 m telescope at La Silla, Chile, and measured the equivalent widthsof five DIBs (at 5780, 5797, 6196, 6379, and 6613 Å) as well as those of absorption lines of di-atomic molecules (CH, CH+, CN) andatoms (K i, Ca i) towards 89 targets in the direction of Upper Scorpius. We construct a simple radiative transfer and chemical networkmodel of the diffuse interstellar medium (ISM) sheet in front of Upp Sco to infer the effective radiation field.Results. By measuring the DIB and molecular spectrum of diffuse clouds towards 89 sightlines in the Upper Scorpius region, wehave obtained a valuable statistical dataset that provides information on the physical conditions that influence the band strengthsof the DIBs. Both the interstellar radiation field strength, IUV, and the molecular hydrogen fraction, fH2 , have been derived for55 sightlines probing the Upp Sco ISM. We discuss the relations between DIB strengths, CH and CH+ line strengths, E(B−V) , IUV,and fH2 . The ratio between the 5780 and 5797 Å DIBs reveals a (spatial) dependence on the local environment in terms of clouddensity and exposure to the interstellar radiation field, reflecting the molecular nature of these DIB carriers.
Key words. astrochemistry – ISM: clouds – ISM: lines and bands – dust, extinction – ISM: individual objects: Upper Scorpius –ISM: molecules
1. Introduction
The diffuse interstellar medium contains compounds of uniden-tified origin that absorb in the UV-visual to near-infrared spectralrange. More than 300 different diffuse interstellar bands (DIBs)are currently identified (Herbig 1995; Hobbs et al. 2008). Manypossible carriers have been proposed, ranging from grain impu-rities and exotic molecules to H2. In the past two decades thefield has converged towards larger carbonaceous molecules, likethe fullerenes and polycyclic aromatic hydrocarbons (PAHs),which have electronic transitions in the optical (see for exampleSalama et al. 1999; Ruiterkamp et al. 2005; Kokkin & Schmidt2006; Zhou et al. 2006; and Salama et al. 2011). New diffusebands have been detected in one line-of-sight which appear tomatch with naphthalene and anthracene cations (Iglesias-Grothet al. 2008, 2010) and the weak 5450 Å DIB is found to matchwith an absorption band arising from a hydrocarbon plasma cre-ated in the laboratory (Linnartz et al. 2010). Linear-C3H2 hasbeen put forward as a carrier of the 5450 and 4881 Å DIBs
� Based on observations collected at the European SouthernObservatory, Paranal, Chile (ESO program 63.H-0456).�� Tables 1, 2, and 5, and Appendices are available in electronic format http://www.aanda.org
by Maier et al. (2011). These assignments are, however, tenta-tive and disputed (Galazutdinov et al. 2011).
In order to understand the chemical and physical propertiesof the DIB carrier(s) it is important to study their behaviour indifferent interstellar environments, both in our own galaxy andbeyond. Studies of DIBs in the Magellanic Clouds (Ehrenfreundet al. 2002; Cox et al. 2006, 2007; Welty et al. 2006), M 31(Cordiner et al. 2008a,b) and beyond (e.g. Heckman & Lehnert2000; York et al. 2006; Sollerman et al. 2005; Cox & Patat 2008)illustrate that DIB carrier abundances (per amount of dust andgas) can be similar to Galactic values. However, these studieshave also revealed systematic differences in these extragalacticenvironments.
A large amount of published information is available regard-ing DIBs in many sightlines probing the Galaxy (e.g. Herbig1993; Chlewicki et al. 1986; Krełowski et al. 1999; Thorburnet al. 2003; Galazutdinov et al. 2004; Weselak et al. 2004, 2008b;Friedman et al. 2011), yielding relations of DIB properties withrespect to each other and to other diffuse ISM gas and dusttracers. Most of these studies focused on DIBs probing vari-ous galactic environments, and provided average results for theMilky Way. Studies dealing with a particular region usually onlyinclude a very limited number of sightlines. One exception isthe study of the Orion region by Jenniskens et al. (1994) which
Article published by EDP Sciences A129, page 1 of 43
A&A 533, A129 (2011)
entails 22 lines of sight. Another multi-object study, by van Loonet al. (2009), used the globular cluster ω Cen to probe fluctua-tions of Ca ii, Na i and the λλ5780 and 5797 DIBs in the dif-fuse – low reddening – foreground ISM. This study revealedsmall-scale structure – on parsec scales – in the warm neutraland weakly ionised medium of the Disc-Halo interface. The ob-served low 5797/5780 DIB ratio was found to be consistent withthe relative high UV radiation levels typically inferred for theextra-planar warm medium.
Nearby OB associations host many bright early-type starsconfined in a relatively small area of the sky. These starshave only few stellar lines in the optical spectrum contami-nating the interstellar spectrum. Thus, these associations pro-vide a setup that is perfectly suited to study the effect ofvarying local conditions on the DIB spectrum. One of theseassociations, Scorpius OB2, is a young (5−20 Myr), low-density(≈0.1 M� pc−3) grouping of stars divided in three subgroups(de Zeeuw et al. 1999; Kouwenhoven et al. 2005). Scorpius(Upp Sco) region is the subgroup near the Ophiuchus star form-ing region and the ρ Oph cloud at a distance of 145 ± 2 pc(de Zeeuw et al. 1999). Combining 2MASS extinction mapswith Hipparcos and Tycho parallaxes, Lombardi et al. (2008)found a distance of 119 ± 6 pc for the ρ Ophiuchi cloud (withthe core at 128 ± 8 pc). Mamajek (2008) suggested a mean dis-tance of 139 ± 6 pc for the distance of the Ophiuchus molecu-lar cloud, which they placed within 11 pc of the centroid of theUpper Scorpius subgroup.
Filamentary – interstellar – material connected to theρOphiuchus cloud complex is observed towards Upper Scorpius(de Geus 1992). The densest part of this complex is the ρOphdark cloud, a site of ongoing low-mass star formation (Grasdalenet al. 1973; Greene & Young 1992; Wilking et al. 1997; Preibisch& Zinnecker 2001) that is exposed to the radiation fields andstellar winds produced by nearby early-type stars. A detailed re-view on the stellar population and star formation history of theSco OB2 association is given by Preibisch & Mamajek (2008)and Wilking et al. (2008).
The advantages of studying the properties of DIBs in theUpper Scorpius region are numerous. It is in close vicinity and ithas been extensively studied in the past. Detailed information isavailable on both the stellar content (spectral types, photometry,distances, kinematics, etc.) and the conditions of the surround-ing interstellar medium (dust emission and absorption, IR-to-far-UV extinction curves, UV emission, molecular content, etc.).It exhibits a significant variation in local environmental condi-tions which should translate into changing properties of the DIBs(if they depend on these conditions) when probing different partsof the Upp Sco region.
Previous studies of interstellar gas and dust in theUpp Sco region focused on the ρ Oph cloud and a few othernearby bright B stars. Snow et al. (2008) give a concise sum-mary of different studies of the Upp Sco region covering a rangeof topics including UV extinction, atomic and molecular hydro-gen, atomic and molecular gas, astrochemistry, and DIBs. Forexample, H2 observations show that sightlines in this region haveboth low (≤0.1) and high (∼0.3−0.6) molecular fractions fH2
(e.g. Savage et al. 1977).In this paper we investigate the behaviour of five well-known
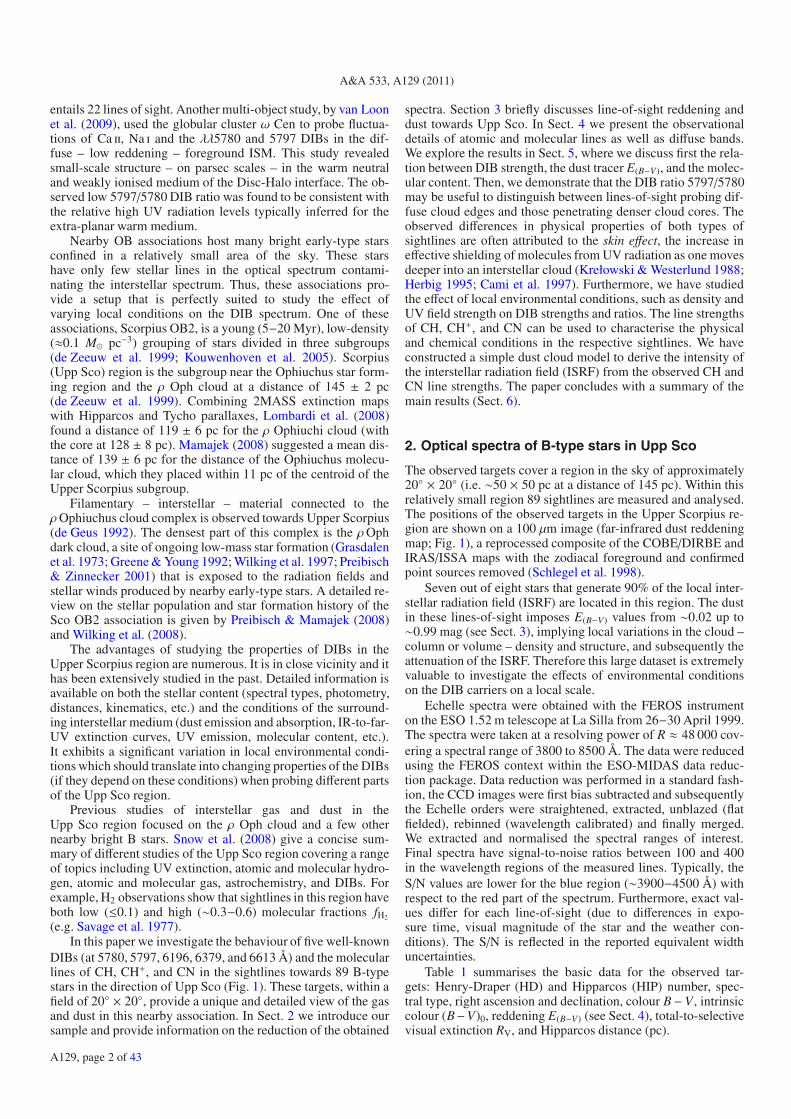
DIBs (at 5780, 5797, 6196, 6379, and 6613 Å) and the molecularlines of CH, CH+, and CN in the sightlines towards 89 B-typestars in the direction of Upp Sco (Fig. 1). These targets, within afield of 20◦ × 20◦, provide a unique and detailed view of the gasand dust in this nearby association. In Sect. 2 we introduce oursample and provide information on the reduction of the obtained
spectra. Section 3 briefly discusses line-of-sight reddening anddust towards Upp Sco. In Sect. 4 we present the observationaldetails of atomic and molecular lines as well as diffuse bands.We explore the results in Sect. 5, where we discuss first the rela-tion between DIB strength, the dust tracer E(B−V), and the molec-ular content. Then, we demonstrate that the DIB ratio 5797/5780may be useful to distinguish between lines-of-sight probing dif-fuse cloud edges and those penetrating denser cloud cores. Theobserved differences in physical properties of both types ofsightlines are often attributed to the skin effect, the increase ineffective shielding of molecules from UV radiation as one movesdeeper into an interstellar cloud (Krełowski & Westerlund 1988;Herbig 1995; Cami et al. 1997). Furthermore, we have studiedthe effect of local environmental conditions, such as density andUV field strength on DIB strengths and ratios. The line strengthsof CH, CH+, and CN can be used to characterise the physicaland chemical conditions in the respective sightlines. We haveconstructed a simple dust cloud model to derive the intensity ofthe interstellar radiation field (ISRF) from the observed CH andCN line strengths. The paper concludes with a summary of themain results (Sect. 6).
2. Optical spectra of B-type stars in Upp Sco
The observed targets cover a region in the sky of approximately20◦ × 20◦ (i.e. ∼50 × 50 pc at a distance of 145 pc). Within thisrelatively small region 89 sightlines are measured and analysed.The positions of the observed targets in the Upper Scorpius re-gion are shown on a 100 μm image (far-infrared dust reddeningmap; Fig. 1), a reprocessed composite of the COBE/DIRBE andIRAS/ISSA maps with the zodiacal foreground and confirmedpoint sources removed (Schlegel et al. 1998).
Seven out of eight stars that generate 90% of the local inter-stellar radiation field (ISRF) are located in this region. The dustin these lines-of-sight imposes E(B−V) values from ∼0.02 up to∼0.99 mag (see Sect. 3), implying local variations in the cloud –column or volume – density and structure, and subsequently theattenuation of the ISRF. Therefore this large dataset is extremelyvaluable to investigate the effects of environmental conditionson the DIB carriers on a local scale.
Echelle spectra were obtained with the FEROS instrumenton the ESO 1.52 m telescope at La Silla from 26−30 April 1999.The spectra were taken at a resolving power of R ≈ 48 000 cov-ering a spectral range of 3800 to 8500 Å. The data were reducedusing the FEROS context within the ESO-MIDAS data reduc-tion package. Data reduction was performed in a standard fash-ion, the CCD images were first bias subtracted and subsequentlythe Echelle orders were straightened, extracted, unblazed (flatfielded), rebinned (wavelength calibrated) and finally merged.We extracted and normalised the spectral ranges of interest.Final spectra have signal-to-noise ratios between 100 and 400in the wavelength regions of the measured lines. Typically, theS/N values are lower for the blue region (∼3900−4500 Å) withrespect to the red part of the spectrum. Furthermore, exact val-ues differ for each line-of-sight (due to differences in expo-sure time, visual magnitude of the star and the weather con-ditions). The S/N is reflected in the reported equivalent widthuncertainties.
Table 1 summarises the basic data for the observed tar-gets: Henry-Draper (HD) and Hipparcos (HIP) number, spec-tral type, right ascension and declination, colour B−V , intrinsiccolour (B−V)0, reddening E(B−V) (see Sect. 4), total-to-selectivevisual extinction RV, and Hipparcos distance (pc).
A129, page 2 of 43
D. A. I. Vos et al.: Diffuse interstellar bands in Upper Scorpius
Rho Oph
152657
152655
152516
151831
151496
151346
151012
150814
150514
149914
149883
149757
149438
149387
149367
148860
148605
148594
148579
148499
148184
148041
147955
147932147889
147888
147701
147683
147648
147196
147165
147103147009/10
146706
146416
146332
146331
146285146284
146029
146001
145964
145792
145657
145631
145556
145554145502
145483
145482145353
144987
144844
144708
144661
144586
144569
144470
144334
144217/8
144175
143956
143600
143567
143275
143018
142990
142983
142884
142883
142669
142378
142301
142250
142184142165142114
142096141774
141444
141180
140543
139518
139486
139160
139094
138503
North
East
Fig. 1. The positions (black and white dots) of the 89 mainly B-type members of Upp Sco are shown (with HD numbers) on top of a 100 μm infrareddust map of this region (Schlegel et al. 1998). The north-east arrows are 3◦ in length. The ρOph cloud can be identified by the bright filamentaryemission located just left to the center of the figure. The dust emission (on a logarithmic grey scale) is proportional to the reddening E(B−V) ofsightlines penetrating these clouds; the lowest intensities correspond to E(B−V) ∼ 0.02 mag (black) and highest intensities to ≥2 mag (white). Thewell-known targets σ Sco (HD 147165, in the ρOph cloud) and ζ Oph (HD 149757, top left) are included in our study.
3. Line-of-sight reddening and dust
For each target we derive the reddening E(B−V) from the B andV photometry (taken from Tycho-2 and converted to Johnsonsystem) after assigning the intrinsic colour (B − V)0 (fromFitzgerald 1970) according to the spectral type of the target(as provided by the Michigan Spectral Catalog of HD stars;Houk 1982; Houk & Smith-Moore 1988). Visual inspection ofthe spectral range from 4000 to 5000 Å, used for the classifica-tion of OB-type stars (Walborn & Fitzpatrick 1990), gives resultsin good agreement with the spectral types listed in the MichiganSpectral Catalog. The adopted magnitudes and results for E(B−V)are listed in Table 1. The total error for E(B−V) is ∼0.03 mag,which is derived from the error of the Tycho-2 B and V photom-etry (∼0.02 mag), the assumed uncertainty (∼0.01 mag) in thetransformation to the Johnson system, the colour range of spec-tral sub-types, and the uncertainty in the spectral classification(both ∼0.01 mag for our B stars).
Two structures of interstellar medium are observed towardsthe Upp Sco complex. A recent study of the distribution and
motions of the interstellar gas in the ρ Oph region provides evi-dence for a low density/extinction ISM component, at a distanceof 50−80 pc, located in front of the ρ Oph complex (Snow et al.2008). This nearest sheet-like structure was also observed at adistance of ∼60 pc towards the Sco-Cen region by Corradi et al.(2004). This structure has a very low column density and an al-most negligible effect on the observed reddening.
The second structure is located at a distance of∼110−150 pc,consisting of diffuse extended portions of the dense ρOph cloudat 122 ± 8 pc (Snow et al. 2008). This is consistent with a meanthickness of ∼30 pc found by Lombardi et al. (2008). Combinedwith the gas densities measured by Zsargó & Federman (2003),which suggest a cloud thicknesses between 1 and 15 pc, this im-plies that these clouds are not spread homogeneously throughoutthe Upp Sco region but form a patchy complex of scattered andloosely connected clouds.
Note that the column density of this dust sheet(N(H) ∼ 3.2−50 × 1020 cm−2; Bohlin et al. 1978; Diplas& Savage 1994) located at approximately 125 pc is an order ofmagnitude higher than that of the nearer sheet. For additional
A129, page 3 of 43

A&A 533, A129 (2011)
100 150 200 250 300 350 400Distance [pc]
0
0.2
0.4
0.6
0.8
1
E(B
-V)
[mag
]
Fore
grou
nd
ρOph cloud
Fig. 2. The colour excess E(B−V) (mag) is plotted against the distance ofthe observed targets (Perryman et al. 1997). Stars with distance errorslarger than 50 pc are shown as squares in grey/blue. The low E(B−V)
below 120 pc indicates that there is little foreground material in frontof Upper Scorpius. The increased scatter at 140 ± 20 pc reflects thedensity variation associated primarily with the ρOph cloud complex.Beyond that distance, no substantial increase of reddening is observedup to 400 pc. A similar figure for the ρOph cloud region was shown inLombardi et al. (2008) (also based on optical photometry, with a partialoverlap in the selected sky region).
information on interstellar material observed towards theρOph molecular cloud complex see also Motte et al. (1998).
The above is supported by the measured colour excess E(B−V)as a function of target distance (Fig. 2). Six stars are probablyin front of Upp Sco while about 10 to 15 of these are back-ground stars. The strong increase of the reddening around adistance of 140 pc suggests that most material contributing tothe extinction is associated with the Upp Sco complex, withthe observed scatter resulting from variations in the – columnor volume – density within this region. The reddening valuesextracted directly from the dust reddening map (Schlegel et al.1998) are compared with the E(B−V) values obtained from opti-cal photometry and stellar classification for the individual sight-lines (Fig. 3). We note, however, that extinction maps basedon infrared emission or optical/near-infrared star counts showsystematic offsets with respect to each other and are unreliableat small scales (≤5′), with typical 1σ uncertainties of 1.2 magin AV (e.g. Schnee et al. 2005). For all sightlines the reddeninginferred from far-infrared emission is higher than that derivedfrom optical photometry and spectroscopy, which suggests that,for most sightlines, the infrared emission also traces dust that islocated behind the observed star. Some caution is required com-paring these two results as some variation would be expecteddue to calibration/systematic and statistical errors on both val-ues. Nevertheless, most sightlines with E(B−V)optical < 0.3 maghave E(B−V)infrared < 0.6 mag, which is fully consistent with adust sheet associated to the Upp Sco OB association, with bothstars and dust inter-dispersed with each other. For sightlines inthe direction of the dense ρ Oph cloud much higher values forE(B−V) (>1 mag) are inferred from the dust map with respect tothe optical photometric data. Logically, stars visible in this di-rection are likely situated at the front side of this dense cloud(the stars at the back will be much fainter/invisible due to higherextinction).
The contribution from foreground material to the observedtotal reddening is very small (E(B−V) <∼ 0.02 mag). Therefore,we conclude that the dust distribution inferred from both the
0 0.1 0.2 0.3 0.4 0.5 0.6 0.7 0.8Optical E(B-V) [mag]
0
0.5
1
1.5
2
IRA
S-Sc
hleg
el E
(B-V
) [m
ag]
local dust peakRho Oph sightlines
Fig. 3. Comparison of the amount of dust, as indicated by E(B−V), in-ferred from optical photometry observations and stellar spectral classi-fication with those inferred from infrared dust emission (IRAS 100 μmmap; Schlegel et al. 1998). ρ Oph sightlines are indicated separatelyas well as 4 sightlines connected to an infrared dust emission structurenorth of ρ Oph. The dashed line indicates the 1-to-1 relation betweenthe two measurements.
100 μm infrared emission and the line-of-sight reddening ispredominantly due to the Upper Scorpius complex. In otherwords, the low-density foreground dust sheet contributes verylittle to the total observed values for the infrared emission andthe reddening.
4. Interstellar absorption lines
In this section we present the properties of the interstellar ab-sorption lines observed towards the 89 Upper Scorpius tar-gets. We determined equivalent widths for the five strong DIBsat 5780, 5797, 6196, 6379, and 6613 Å, for the di-atomic lines ofCH, CH+, and CN as well as for the K i and Ca i lines (Table 2).The Na i D doublet is omitted because it is saturated for the ma-jority of sightlines. Line profiles and central heliocentric veloc-ities for the atomic and di-atomic lines are given in Fig. D.1and Table 5, respectively. To illustrate, the velocity absorptionprofiles of the atomic and molecular absorption lines towardsHD 147889 are shown in Fig. 4.
4.1. Diffuse interstellar bands
Although more than 300 DIBs are known we focus here on thefive strong and narrow bands at 5780, 5797, 6196, 6379, and6613 Å. The strength and width of these features facilitates themeasurement of modest column densities of their carriers inslightly reddened sightlines. Additionally, the Galactic relation-ships between DIB strength and reddening are well establishedfor these DIBs both in the Galaxy and beyond. The equivalentwidth, W, is measured via a straight line continuum integra-tion across the absorption feature (see Appendix. A). For theDIB measurement we do not expect significant contaminationfrom stellar atmosphere lines (see Appendix. B). The measuredequivalent widths, or 2σ upper limits, are listed in Table 2 forthe five DIBs towards the 89 targets in Upp Sco. This is the firstconsistently measured data set containing this many sightlineswithin one region.
To ascertain the accuracy and consistency of our resultswe compare our measured values with those available in the
A129, page 4 of 43
D. A. I. Vos et al.: Diffuse interstellar bands in Upper Scorpius
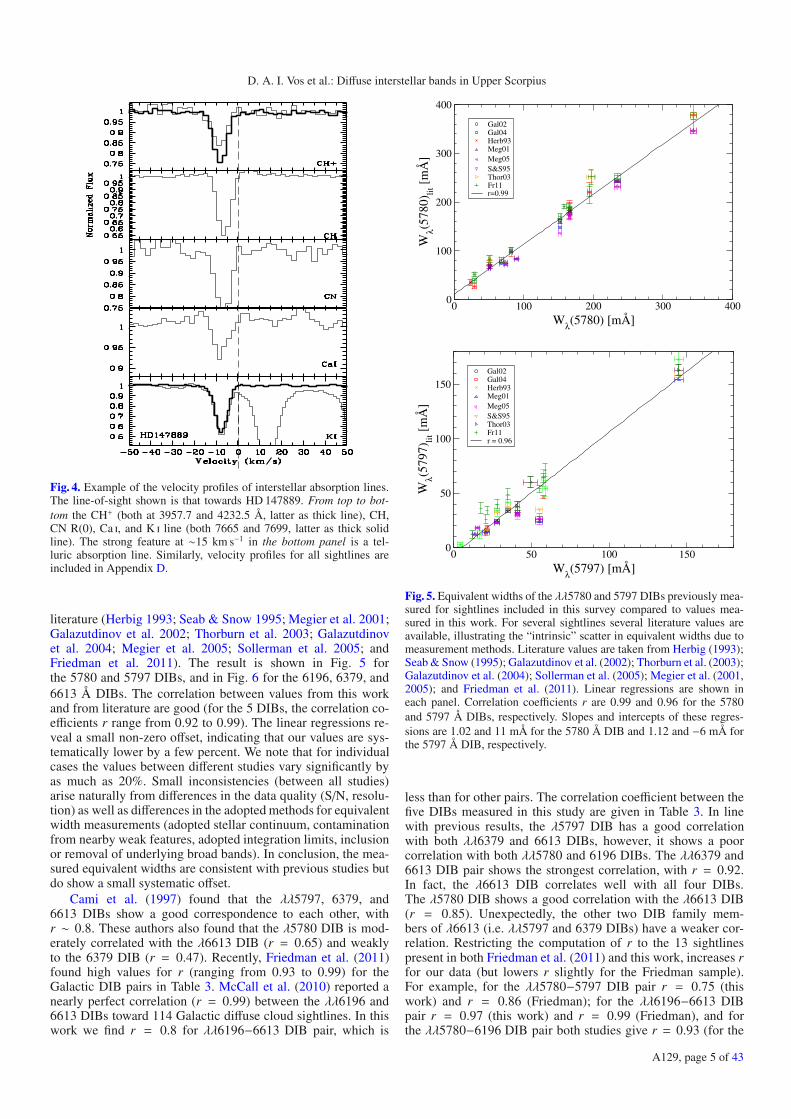
Fig. 4. Example of the velocity profiles of interstellar absorption lines.The line-of-sight shown is that towards HD 147889. From top to bot-tom the CH+ (both at 3957.7 and 4232.5 Å, latter as thick line), CH,CN R(0), Ca i, and K i line (both 7665 and 7699, latter as thick solidline). The strong feature at ∼15 km s−1 in the bottom panel is a tel-luric absorption line. Similarly, velocity profiles for all sightlines areincluded in Appendix D.
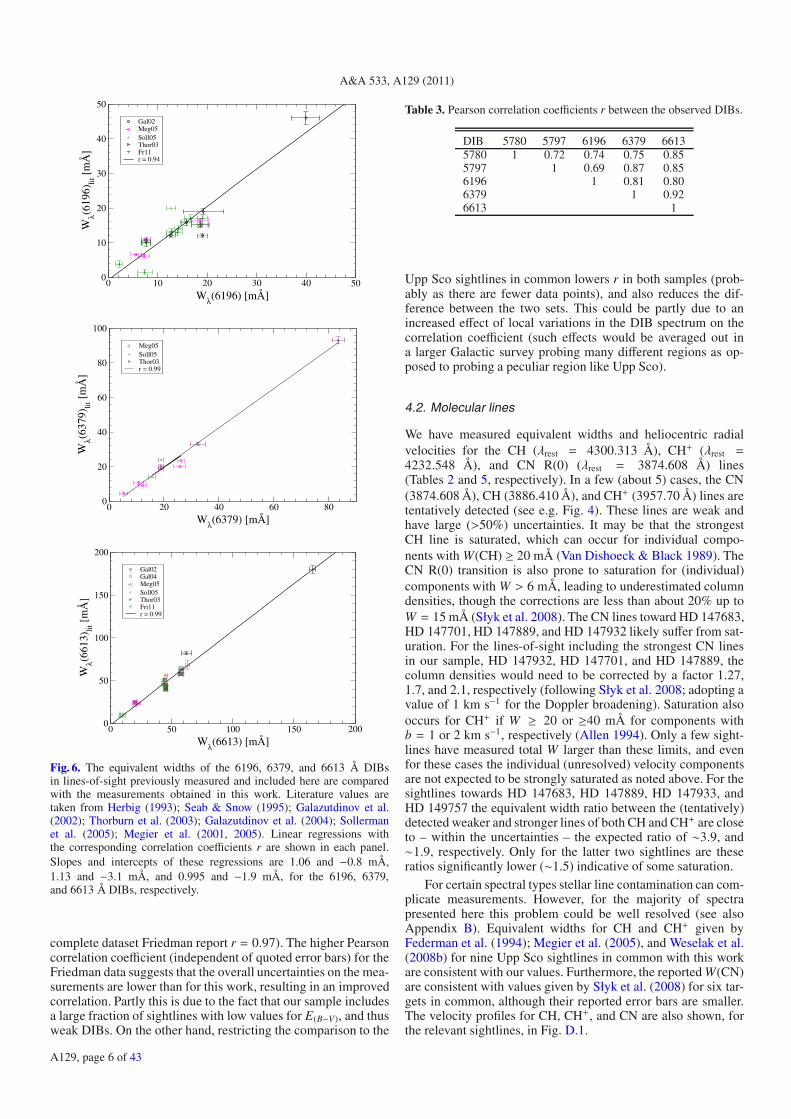
literature (Herbig 1993; Seab & Snow 1995; Megier et al. 2001;Galazutdinov et al. 2002; Thorburn et al. 2003; Galazutdinovet al. 2004; Megier et al. 2005; Sollerman et al. 2005; andFriedman et al. 2011). The result is shown in Fig. 5 forthe 5780 and 5797 DIBs, and in Fig. 6 for the 6196, 6379, and6613 Å DIBs. The correlation between values from this workand from literature are good (for the 5 DIBs, the correlation co-efficients r range from 0.92 to 0.99). The linear regressions re-veal a small non-zero offset, indicating that our values are sys-tematically lower by a few percent. We note that for individualcases the values between different studies vary significantly byas much as 20%. Small inconsistencies (between all studies)arise naturally from differences in the data quality (S/N, resolu-tion) as well as differences in the adopted methods for equivalentwidth measurements (adopted stellar continuum, contaminationfrom nearby weak features, adopted integration limits, inclusionor removal of underlying broad bands). In conclusion, the mea-sured equivalent widths are consistent with previous studies butdo show a small systematic offset.
Cami et al. (1997) found that the λλ5797, 6379, and6613 DIBs show a good correspondence to each other, withr ∼ 0.8. These authors also found that the λ5780 DIB is mod-erately correlated with the λ6613 DIB (r = 0.65) and weaklyto the 6379 DIB (r = 0.47). Recently, Friedman et al. (2011)found high values for r (ranging from 0.93 to 0.99) for theGalactic DIB pairs in Table 3. McCall et al. (2010) reported anearly perfect correlation (r = 0.99) between the λλ6196 and6613 DIBs toward 114 Galactic diffuse cloud sightlines. In thiswork we find r = 0.8 for λλ6196−6613 DIB pair, which is
0 100 200 300 400Wλ(5780) [mÅ]
0
100
200
300
400
Wλ(5
780)
lit [
mÅ
]
Gal02Gal04Herb93Meg01Meg05S&S95Thor03Fr11r=0.99
0 50 100 150Wλ(5797) [mÅ]
0
50
100
150
Wλ(5
797)
lit [
mÅ
]
Gal02Gal04Herb93Meg01Meg05S&S95Thor03Fr11r = 0.96
Fig. 5. Equivalent widths of the λλ5780 and 5797 DIBs previously mea-sured for sightlines included in this survey compared to values mea-sured in this work. For several sightlines several literature values areavailable, illustrating the “intrinsic” scatter in equivalent widths due tomeasurement methods. Literature values are taken from Herbig (1993);Seab & Snow (1995); Galazutdinov et al. (2002); Thorburn et al. (2003);Galazutdinov et al. (2004); Sollerman et al. (2005); Megier et al. (2001,2005); and Friedman et al. (2011). Linear regressions are shown ineach panel. Correlation coefficients r are 0.99 and 0.96 for the 5780and 5797 Å DIBs, respectively. Slopes and intercepts of these regres-sions are 1.02 and 11 mÅ for the 5780 Å DIB and 1.12 and −6 mÅ forthe 5797 Å DIB, respectively.
less than for other pairs. The correlation coefficient between thefive DIBs measured in this study are given in Table 3. In linewith previous results, the λ5797 DIB has a good correlationwith both λλ6379 and 6613 DIBs, however, it shows a poorcorrelation with both λλ5780 and 6196 DIBs. The λλ6379 and6613 DIB pair shows the strongest correlation, with r = 0.92.In fact, the λ6613 DIB correlates well with all four DIBs.The λ5780 DIB shows a good correlation with the λ6613 DIB(r = 0.85). Unexpectedly, the other two DIB family mem-bers of λ6613 (i.e. λλ5797 and 6379 DIBs) have a weaker cor-relation. Restricting the computation of r to the 13 sightlinespresent in both Friedman et al. (2011) and this work, increases rfor our data (but lowers r slightly for the Friedman sample).For example, for the λλ5780−5797 DIB pair r = 0.75 (thiswork) and r = 0.86 (Friedman); for the λλ6196−6613 DIBpair r = 0.97 (this work) and r = 0.99 (Friedman), and forthe λλ5780−6196 DIB pair both studies give r = 0.93 (for the
A129, page 5 of 43
A&A 533, A129 (2011)
A
A
0 10 20 30 40 50Wλ(6196) [mÅ]
0
10
20
30
40
50
Wλ(6
196)
lit [
mÅ
]
Gal02Meg05Soll05A
Thor03Fr11r = 0.94
A
A
0 20 40 60 80Wλ(6379) [mÅ]
0
20
40
60
80
100
Wλ(6
379)
lit [
mÅ
]
Meg05Soll05A
Thor03r = 0.99
AA
0 50 100 150 200
Wλ(6613) [mÅ]
0
50
100
150
200
Wλ(6
613)
lit [
mÅ
]
Gal02Gal04Meg05Soll05A
Thor03Fri11r = 0.99
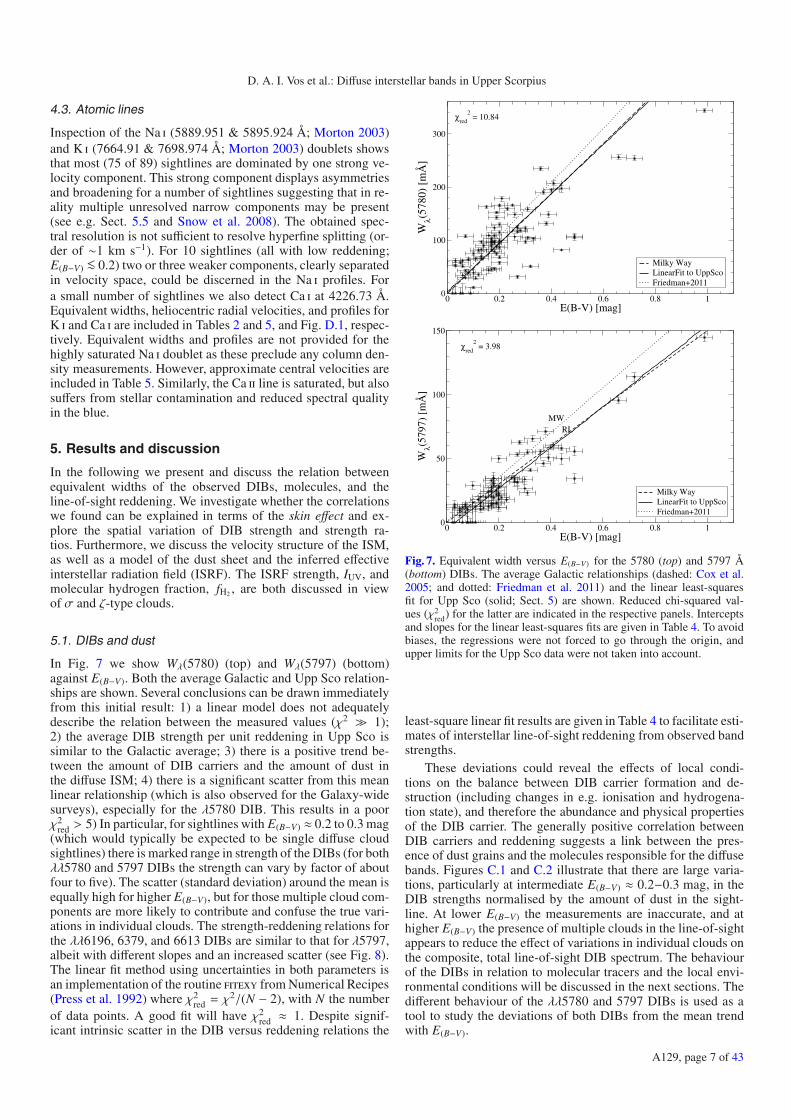
Fig. 6. The equivalent widths of the 6196, 6379, and 6613 Å DIBsin lines-of-sight previously measured and included here are comparedwith the measurements obtained in this work. Literature values aretaken from Herbig (1993); Seab & Snow (1995); Galazutdinov et al.(2002); Thorburn et al. (2003); Galazutdinov et al. (2004); Sollermanet al. (2005); Megier et al. (2001, 2005). Linear regressions withthe corresponding correlation coefficients r are shown in each panel.Slopes and intercepts of these regressions are 1.06 and −0.8 mÅ,1.13 and −3.1 mÅ, and 0.995 and −1.9 mÅ, for the 6196, 6379,and 6613 Å DIBs, respectively.
complete dataset Friedman report r = 0.97). The higher Pearsoncorrelation coefficient (independent of quoted error bars) for theFriedman data suggests that the overall uncertainties on the mea-surements are lower than for this work, resulting in an improvedcorrelation. Partly this is due to the fact that our sample includesa large fraction of sightlines with low values for E(B−V), and thusweak DIBs. On the other hand, restricting the comparison to the
Table 3. Pearson correlation coefficients r between the observed DIBs.
DIB 5780 5797 6196 6379 66135780 1 0.72 0.74 0.75 0.855797 1 0.69 0.87 0.856196 1 0.81 0.806379 1 0.926613 1
Upp Sco sightlines in common lowers r in both samples (prob-ably as there are fewer data points), and also reduces the dif-ference between the two sets. This could be partly due to anincreased effect of local variations in the DIB spectrum on thecorrelation coefficient (such effects would be averaged out ina larger Galactic survey probing many different regions as op-posed to probing a peculiar region like Upp Sco).
4.2. Molecular lines
We have measured equivalent widths and heliocentric radialvelocities for the CH (λrest = 4300.313 Å), CH+ (λrest =4232.548 Å), and CN R(0) (λrest = 3874.608 Å) lines(Tables 2 and 5, respectively). In a few (about 5) cases, the CN(3874.608 Å), CH (3886.410 Å), and CH+ (3957.70 Å) lines aretentatively detected (see e.g. Fig. 4). These lines are weak andhave large (>50%) uncertainties. It may be that the strongestCH line is saturated, which can occur for individual compo-nents with W(CH) ≥ 20 mÅ (Van Dishoeck & Black 1989). TheCN R(0) transition is also prone to saturation for (individual)components with W > 6 mÅ, leading to underestimated columndensities, though the corrections are less than about 20% up toW = 15 mÅ (Słyk et al. 2008). The CN lines toward HD 147683,HD 147701, HD 147889, and HD 147932 likely suffer from sat-uration. For the lines-of-sight including the strongest CN linesin our sample, HD 147932, HD 147701, and HD 147889, thecolumn densities would need to be corrected by a factor 1.27,1.7, and 2.1, respectively (following Słyk et al. 2008; adopting avalue of 1 km s−1 for the Doppler broadening). Saturation alsooccurs for CH+ if W ≥ 20 or ≥40 mÅ for components withb = 1 or 2 km s−1, respectively (Allen 1994). Only a few sight-lines have measured total W larger than these limits, and evenfor these cases the individual (unresolved) velocity componentsare not expected to be strongly saturated as noted above. For thesightlines towards HD 147683, HD 147889, HD 147933, andHD 149757 the equivalent width ratio between the (tentatively)detected weaker and stronger lines of both CH and CH+ are closeto – within the uncertainties – the expected ratio of ∼3.9, and∼1.9, respectively. Only for the latter two sightlines are theseratios significantly lower (∼1.5) indicative of some saturation.
For certain spectral types stellar line contamination can com-plicate measurements. However, for the majority of spectrapresented here this problem could be well resolved (see alsoAppendix B). Equivalent widths for CH and CH+ given byFederman et al. (1994); Megier et al. (2005), and Weselak et al.(2008b) for nine Upp Sco sightlines in common with this workare consistent with our values. Furthermore, the reported W(CN)are consistent with values given by Słyk et al. (2008) for six tar-gets in common, although their reported error bars are smaller.The velocity profiles for CH, CH+, and CN are also shown, forthe relevant sightlines, in Fig. D.1.
A129, page 6 of 43
D. A. I. Vos et al.: Diffuse interstellar bands in Upper Scorpius
4.3. Atomic lines
Inspection of the Na i (5889.951 & 5895.924 Å; Morton 2003)and K i (7664.91 & 7698.974 Å; Morton 2003) doublets showsthat most (75 of 89) sightlines are dominated by one strong ve-locity component. This strong component displays asymmetriesand broadening for a number of sightlines suggesting that in re-ality multiple unresolved narrow components may be present(see e.g. Sect. 5.5 and Snow et al. 2008). The obtained spec-tral resolution is not sufficient to resolve hyperfine splitting (or-der of ∼1 km s−1). For 10 sightlines (all with low reddening;E(B−V) <∼ 0.2) two or three weaker components, clearly separatedin velocity space, could be discerned in the Na i profiles. Fora small number of sightlines we also detect Ca i at 4226.73 Å.Equivalent widths, heliocentric radial velocities, and profiles forK i and Ca i are included in Tables 2 and 5, and Fig. D.1, respec-tively. Equivalent widths and profiles are not provided for thehighly saturated Na i doublet as these preclude any column den-sity measurements. However, approximate central velocities areincluded in Table 5. Similarly, the Ca ii line is saturated, but alsosuffers from stellar contamination and reduced spectral qualityin the blue.
5. Results and discussion
In the following we present and discuss the relation betweenequivalent widths of the observed DIBs, molecules, and theline-of-sight reddening. We investigate whether the correlationswe found can be explained in terms of the skin effect and ex-plore the spatial variation of DIB strength and strength ra-tios. Furthermore, we discuss the velocity structure of the ISM,as well as a model of the dust sheet and the inferred effectiveinterstellar radiation field (ISRF). The ISRF strength, IUV, andmolecular hydrogen fraction, fH2 , are both discussed in viewof σ and ζ-type clouds.
5.1. DIBs and dust
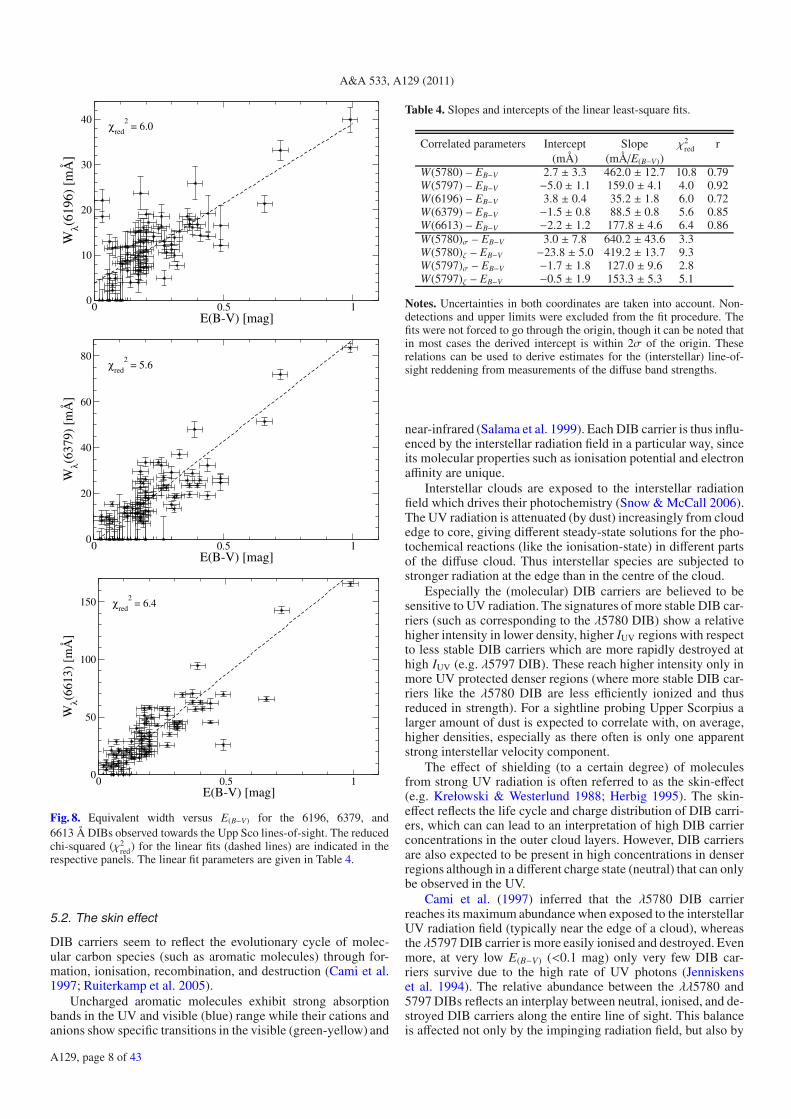
In Fig. 7 we show Wλ(5780) (top) and Wλ(5797) (bottom)against E(B−V). Both the average Galactic and Upp Sco relation-ships are shown. Several conclusions can be drawn immediatelyfrom this initial result: 1) a linear model does not adequatelydescribe the relation between the measured values (χ2 1);2) the average DIB strength per unit reddening in Upp Sco issimilar to the Galactic average; 3) there is a positive trend be-tween the amount of DIB carriers and the amount of dust inthe diffuse ISM; 4) there is a significant scatter from this meanlinear relationship (which is also observed for the Galaxy-widesurveys), especially for the λ5780 DIB. This results in a poorχ2
red > 5) In particular, for sightlines with E(B−V) ≈ 0.2 to 0.3 mag(which would typically be expected to be single diffuse cloudsightlines) there is marked range in strength of the DIBs (for bothλλ5780 and 5797 DIBs the strength can vary by factor of aboutfour to five). The scatter (standard deviation) around the mean isequally high for higher E(B−V), but for those multiple cloud com-ponents are more likely to contribute and confuse the true vari-ations in individual clouds. The strength-reddening relations forthe λλ6196, 6379, and 6613 DIBs are similar to that for λ5797,albeit with different slopes and an increased scatter (see Fig. 8).The linear fit method using uncertainties in both parameters isan implementation of the routine fitexy from Numerical Recipes(Press et al. 1992) where χ2
red = χ2/(N − 2), with N the number
of data points. A good fit will have χ2red ≈ 1. Despite signif-
icant intrinsic scatter in the DIB versus reddening relations the
0 0.2 0.4 0.6 0.8 1E(B-V) [mag]
0
100
200
300
Wλ(5
780)
[m
Å]
Milky WayLinearFit to UppScoFriedman+2011
χred
2 = 10.84
0 0.2 0.4 0.6 0.8 1E(B-V) [mag]
0
50
100
150
Wλ(5
797)
[m
Å]
Milky WayLinearFit to UppScoFriedman+2011
χred
2 = 3.98
MWRL
Fig. 7. Equivalent width versus E(B−V) for the 5780 (top) and 5797 Å(bottom) DIBs. The average Galactic relationships (dashed: Cox et al.2005; and dotted: Friedman et al. 2011) and the linear least-squaresfit for Upp Sco (solid; Sect. 5) are shown. Reduced chi-squared val-ues (χ2
red) for the latter are indicated in the respective panels. Interceptsand slopes for the linear least-squares fits are given in Table 4. To avoidbiases, the regressions were not forced to go through the origin, andupper limits for the Upp Sco data were not taken into account.
least-square linear fit results are given in Table 4 to facilitate esti-mates of interstellar line-of-sight reddening from observed bandstrengths.
These deviations could reveal the effects of local condi-tions on the balance between DIB carrier formation and de-struction (including changes in e.g. ionisation and hydrogena-tion state), and therefore the abundance and physical propertiesof the DIB carrier. The generally positive correlation betweenDIB carriers and reddening suggests a link between the pres-ence of dust grains and the molecules responsible for the diffusebands. Figures C.1 and C.2 illustrate that there are large varia-tions, particularly at intermediate E(B−V) ≈ 0.2−0.3 mag, in theDIB strengths normalised by the amount of dust in the sight-line. At lower E(B−V) the measurements are inaccurate, and athigher E(B−V) the presence of multiple clouds in the line-of-sightappears to reduce the effect of variations in individual clouds onthe composite, total line-of-sight DIB spectrum. The behaviourof the DIBs in relation to molecular tracers and the local envi-ronmental conditions will be discussed in the next sections. Thedifferent behaviour of the λλ5780 and 5797 DIBs is used as atool to study the deviations of both DIBs from the mean trendwith E(B−V).
A129, page 7 of 43
A&A 533, A129 (2011)
0 0.5 1E(B-V) [mag]
0
10
20
30
40
Wλ(6
196)
[m
Å]
χred
2 = 6.0
0 0.5 1E(B-V) [mag]
0
20
40
60
80
Wλ(6
379)
[m
Å]
χred
2 = 5.6
0 0.5 1E(B-V) [mag]
0
50
100
150
Wλ(6
613)
[m
Å]
χred
2 = 6.4
Fig. 8. Equivalent width versus E(B−V) for the 6196, 6379, and6613 Å DIBs observed towards the Upp Sco lines-of-sight. The reducedchi-squared (χ2
red) for the linear fits (dashed lines) are indicated in therespective panels. The linear fit parameters are given in Table 4.
5.2. The skin effect
DIB carriers seem to reflect the evolutionary cycle of molec-ular carbon species (such as aromatic molecules) through for-mation, ionisation, recombination, and destruction (Cami et al.1997; Ruiterkamp et al. 2005).
Uncharged aromatic molecules exhibit strong absorptionbands in the UV and visible (blue) range while their cations andanions show specific transitions in the visible (green-yellow) and
Table 4. Slopes and intercepts of the linear least-square fits.
Correlated parameters Intercept Slope χ2red r
(mÅ) (mÅ/E(B−V))W(5780) – EB−V 2.7 ± 3.3 462.0 ± 12.7 10.8 0.79W(5797) – EB−V −5.0 ± 1.1 159.0 ± 4.1 4.0 0.92W(6196) – EB−V 3.8 ± 0.4 35.2 ± 1.8 6.0 0.72W(6379) – EB−V −1.5 ± 0.8 88.5 ± 0.8 5.6 0.85W(6613) – EB−V −2.2 ± 1.2 177.8 ± 4.6 6.4 0.86W(5780)σ – EB−V 3.0 ± 7.8 640.2 ± 43.6 3.3W(5780)ζ – EB−V −23.8 ± 5.0 419.2 ± 13.7 9.3W(5797)σ – EB−V −1.7 ± 1.8 127.0 ± 9.6 2.8W(5797)ζ – EB−V −0.5 ± 1.9 153.3 ± 5.3 5.1
Notes. Uncertainties in both coordinates are taken into account. Non-detections and upper limits were excluded from the fit procedure. Thefits were not forced to go through the origin, though it can be noted thatin most cases the derived intercept is within 2σ of the origin. Theserelations can be used to derive estimates for the (interstellar) line-of-sight reddening from measurements of the diffuse band strengths.
near-infrared (Salama et al. 1999). Each DIB carrier is thus influ-enced by the interstellar radiation field in a particular way, sinceits molecular properties such as ionisation potential and electronaffinity are unique.
Interstellar clouds are exposed to the interstellar radiationfield which drives their photochemistry (Snow & McCall 2006).The UV radiation is attenuated (by dust) increasingly from cloudedge to core, giving different steady-state solutions for the pho-tochemical reactions (like the ionisation-state) in different partsof the diffuse cloud. Thus interstellar species are subjected tostronger radiation at the edge than in the centre of the cloud.
Especially the (molecular) DIB carriers are believed to besensitive to UV radiation. The signatures of more stable DIB car-riers (such as corresponding to the λ5780 DIB) show a relativehigher intensity in lower density, higher IUV regions with respectto less stable DIB carriers which are more rapidly destroyed athigh IUV (e.g. λ5797 DIB). These reach higher intensity only inmore UV protected denser regions (where more stable DIB car-riers like the λ5780 DIB are less efficiently ionized and thusreduced in strength). For a sightline probing Upper Scorpius alarger amount of dust is expected to correlate with, on average,higher densities, especially as there often is only one apparentstrong interstellar velocity component.
The effect of shielding (to a certain degree) of moleculesfrom strong UV radiation is often referred to as the skin-effect(e.g. Krełowski & Westerlund 1988; Herbig 1995). The skin-effect reflects the life cycle and charge distribution of DIB carri-ers, which can can lead to an interpretation of high DIB carrierconcentrations in the outer cloud layers. However, DIB carriersare also expected to be present in high concentrations in denserregions although in a different charge state (neutral) that can onlybe observed in the UV.
Cami et al. (1997) inferred that the λ5780 DIB carrierreaches its maximum abundance when exposed to the interstellarUV radiation field (typically near the edge of a cloud), whereasthe λ5797 DIB carrier is more easily ionised and destroyed. Evenmore, at very low E(B−V) (<0.1 mag) only very few DIB car-riers survive due to the high rate of UV photons (Jenniskenset al. 1994). The relative abundance between the λλ5780 and5797 DIBs reflects an interplay between neutral, ionised, and de-stroyed DIB carriers along the entire line of sight. This balanceis affected not only by the impinging radiation field, but also by
A129, page 8 of 43
D. A. I. Vos et al.: Diffuse interstellar bands in Upper Scorpius
the carbon abundance and the dust particle size distribution (Cox& Spaans 2006). A difference in the observed ratio of these twoDIBs is thus directly related to the skin-effect.
Krelowski (1989); Sneden et al. (1991); Krełowski et al.(1992) identified two types of clouds, referred to asσ and ζ-type.σ-type clouds show atomic lines and DIBs, but the molecularlines are weak or absent, while ζ-type clouds have strong di-atomic lines in addition to DIBs. The main difference betweenboth types lies in a combination of density and UV irradiationby the ISRF, with σ clouds associated with low density and/orstrong exposure to UV radiation, while ζ clouds are associatedwith higher densities and/or more protection from UV radiation.Therefore, differentiation between σ and ζ-type clouds is di-rectly linked to the skin-effect described previously. For sight-lines probing ζ-type clouds the 5797 Å DIB is deeper thanthe 5780 Å, while for σ-type clouds the reverse is observed.Therefore, the W(5797)/W(5780) ratio has been used to distin-guish between UV exposed (σ) and UV protected (ζ) sightlines.The nomenclature for the σ and ζ type sightlines is historicaland based on the representative lines-of-sight towardsσ Sco andζ Oph, respectively (Krełowski & Westerlund 1988; Krełowskiet al. 1992; Krełowski & Sneden 1995). Note that both sightlinesare included in our analysis.
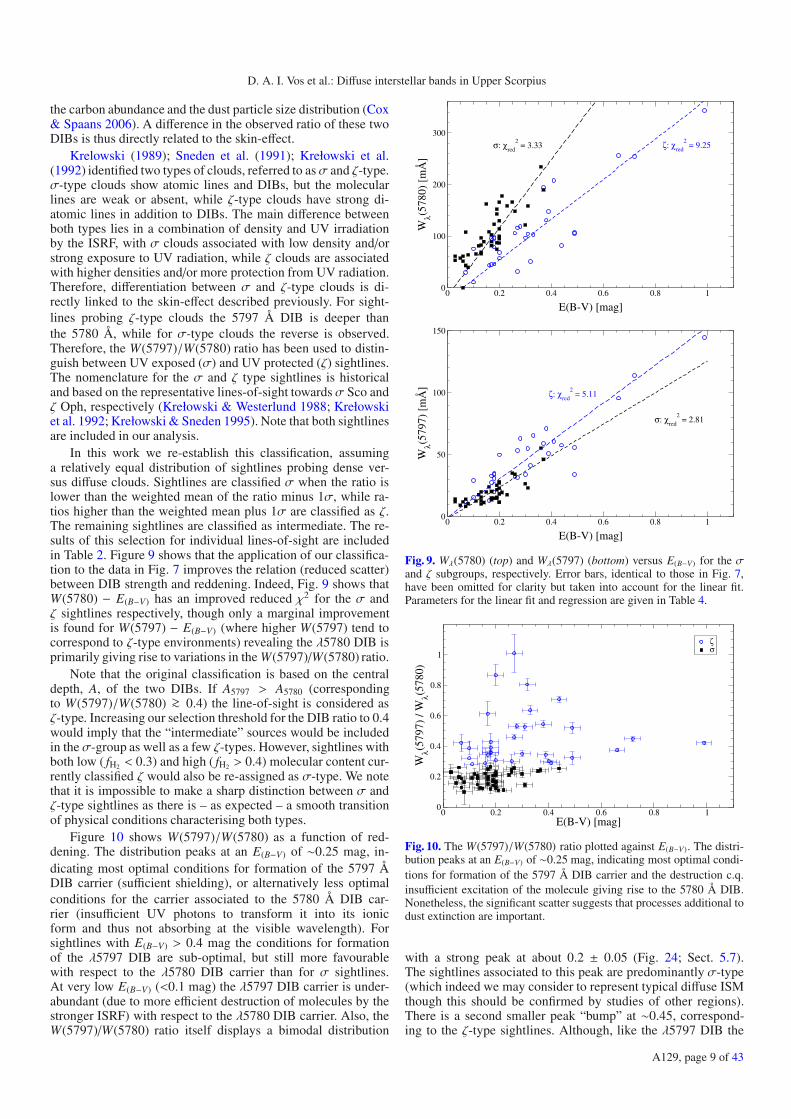
In this work we re-establish this classification, assuminga relatively equal distribution of sightlines probing dense ver-sus diffuse clouds. Sightlines are classified σ when the ratio islower than the weighted mean of the ratio minus 1σ, while ra-tios higher than the weighted mean plus 1σ are classified as ζ.The remaining sightlines are classified as intermediate. The re-sults of this selection for individual lines-of-sight are includedin Table 2. Figure 9 shows that the application of our classifica-tion to the data in Fig. 7 improves the relation (reduced scatter)between DIB strength and reddening. Indeed, Fig. 9 shows thatW(5780) − E(B−V) has an improved reduced χ2 for the σ andζ sightlines respectively, though only a marginal improvementis found for W(5797) − E(B−V) (where higher W(5797) tend tocorrespond to ζ-type environments) revealing the λ5780 DIB isprimarily giving rise to variations in the W(5797)/W(5780) ratio.
Note that the original classification is based on the centraldepth, A, of the two DIBs. If A5797 > A5780 (correspondingto W(5797)/W(5780) >∼ 0.4) the line-of-sight is considered asζ-type. Increasing our selection threshold for the DIB ratio to 0.4would imply that the “intermediate” sources would be includedin the σ-group as well as a few ζ-types. However, sightlines withboth low ( fH2 < 0.3) and high ( fH2 > 0.4) molecular content cur-rently classified ζ would also be re-assigned as σ-type. We notethat it is impossible to make a sharp distinction between σ andζ-type sightlines as there is – as expected – a smooth transitionof physical conditions characterising both types.
Figure 10 shows W(5797)/W(5780) as a function of red-dening. The distribution peaks at an E(B−V) of ∼0.25 mag, in-dicating most optimal conditions for formation of the 5797 ÅDIB carrier (sufficient shielding), or alternatively less optimalconditions for the carrier associated to the 5780 Å DIB car-rier (insufficient UV photons to transform it into its ionicform and thus not absorbing at the visible wavelength). Forsightlines with E(B−V) > 0.4 mag the conditions for formationof the λ5797 DIB are sub-optimal, but still more favourablewith respect to the λ5780 DIB carrier than for σ sightlines.At very low E(B−V) (<0.1 mag) the λ5797 DIB carrier is under-abundant (due to more efficient destruction of molecules by thestronger ISRF) with respect to the λ5780 DIB carrier. Also, theW(5797)/W(5780) ratio itself displays a bimodal distribution
0 0.2 0.4 0.6 0.8 1
E(B-V) [mag]
0
100
200
300
Wλ(5
780)
[m
Å]
σ: χred
2 = 3.33 ζ: χ
red
2 = 9.25
0 0.2 0.4 0.6 0.8 1
E(B-V) [mag]
0
50
100
150
Wλ(5
797)
[m
Å]
ζ: χred
2 = 5.11
σ: χred
2 = 2.81
Fig. 9. Wλ(5780) (top) and Wλ(5797) (bottom) versus E(B−V) for the σand ζ subgroups, respectively. Error bars, identical to those in Fig. 7,have been omitted for clarity but taken into account for the linear fit.Parameters for the linear fit and regression are given in Table 4.
0 0.2 0.4 0.6 0.8 1E(B-V) [mag]
0
0.2
0.4
0.6
0.8
1
Wλ(5
797)
/ W
λ(578
0)
ζσ
Fig. 10. The W(5797)/W(5780) ratio plotted against E(B−V). The distri-bution peaks at an E(B−V) of ∼0.25 mag, indicating most optimal condi-tions for formation of the 5797 Å DIB carrier and the destruction c.q.insufficient excitation of the molecule giving rise to the 5780 Å DIB.Nonetheless, the significant scatter suggests that processes additional todust extinction are important.
with a strong peak at about 0.2 ± 0.05 (Fig. 24; Sect. 5.7).The sightlines associated to this peak are predominantly σ-type(which indeed we may consider to represent typical diffuse ISMthough this should be confirmed by studies of other regions).There is a second smaller peak “bump” at ∼0.45, correspond-ing to the ζ-type sightlines. Although, like the λ5797 DIB the
A129, page 9 of 43

A&A 533, A129 (2011)
0 0.2 0.4 0.6 0.8 1
E(B-V) [mag]
0
10
20
30
40
50
W(C
H)
[mÅ
]
ζσ
0 0.2 0.4 0.6 0.8 1
E(B-V) [mag]
0
10
20
30
W(C
H+)
[mÅ
]
ζσ
Fig. 11. Equivalent width versus E(B−V) for the CH 4300 Å (top) andCH+ 4232 Å (bottom) transitions. For σ (black squares) and ζ-type(blue circles) sightlines designations see Sects. 5.2 and 5.7.
λλ 6196, 6379 and 6613 DIBs also show signficant scatter on therespective W − E(B−V) trends, the λ5780 DIB reveals the clearestdistinction in behaviour between σ and ζ sightlines. The link be-tween the W(5797)/W(5780) ratio and the strength of the ISRFis discussed in more detail in Sect. 5.6.
For comparison we plot also the W(6196)/W(6613) ratio asa function of E(B−V) in Fig. C.4. This ratio is less sensitive to red-dening and therefore is not such a useful tracer of local condi-tions such as density and UV irradiation. This is indeed expectedfrom the recent results by McCall et al. (2010) who found an ex-cellent correlation between the 6196 and 6613 Å DIB strengths.
5.3. Diatomic molecules and dust
Different interstellar species are restricted to different regions(see e.g. Fig. 6 in Pan et al. 2005): CN and CO are present indense regions, CH and K i are predominantly present in moder-ately high density regions (n > 30 cm−3), and CH+ and Ca i inintermediate density regions (n ∼ 10−300 cm−3).
In Fig. 11 we show W(CH) (top) and W(CH+) (bottom) ver-sus E(B−V). It can be seen that CH correlates much betterwith E(B−V) than CH+, which is in line with previous observa-tions (Crawford 1989; Krełowski et al. 1999). CH traces thedense, molecular gas and its abundance is directly proportionalto N(H2) as N(CH)/N(H2)= 3.5× 10⁻⁸ (Federman 1982; Mattila1986; Weselak et al. 2004; Sheffer et al. 2008). For 8 lines-of-sight direct measurements of N(H2) (IUE or FUSE; com-piled in Friedman et al. 2011) can be compared to those derived
0 10 20 30 40 50
W(CH) [mÅ]
0
10
20
30
40
50
60
W(C
H+
) [m
Å]
σζ
N(CH+)/N(CH) < 0.5
N(CH+)/N(CH) > 2
(quiescent)
(turbulent)
Fig. 12. W(CH+) versus W(CH). Assuming optically thin lines theN(CH+)/N(CH) ratio is equal to 0.95 ×W(CH+)/W(CH). Turbulent andquiescent regions are indicated by shaded areas. See text for further de-tails. For σ and ζ-type sightlines designations see Sects. 5.2 and 5.7.
from N(CH) in this work (Table 2). The scatter is less than∼0.5 dex, and in good agreement with the results of Sheffer et al.(2008) and references therein. Theoretically, one can thus inferthe molecular hydrogen fraction fH2 from N(H2) derived fromCH together with N(H i) derived from W(5780) (log N(H i) =19.00 + 0.94 log(W(5780)); Friedman et al. 2011). The result-ing values for fH2 are given in Table 2. These values are con-sistent with – though systematically higher than – the directlymeasured fH2 (e.g. Friedman et al. 2011; Table 2) for the eightsightlines in common. Here we have used the average Galacticrelation between W(5780) and N(H i), whereas this relation mayactually be lower for Upp Sco (similar to the lower gas-to-dustratio in this region; Schlegel et al. 1998) thus leading to a higherestimate of fH2 . The strongly improved regression coefficient be-tween CH and E(B−V) for the ζ-type sightlines (r = 0.83) com-pared to its σ-type equivalent (r = 0.53) supports the interpre-tation that ζ-type lines-of-sight trace dense gas. It is noteworthyto recall that the significant scatter for the diffuse band strengthsat low E(B−V) (∼0.2 mag) as illustrated in Figs. 7 and 8 is notobserved for CH. CH+, on the other hand, is not a good tracerof H2 (Weselak et al. 2008a). Therefore, the low value of thecorrelation coefficient for CH+ is not unexpected. Furthermore,note that significant amounts of CH are needed before CN isproduced (Federman et al. 1984), with the latter tracing also rel-atively dense material (Joseph et al. 1986).
Work by Crawford (1989) suggests that the ratio of N(CH+)and N(CH) is indicative of the turbulent or quiescent nature ofthe interstellar medium in the line-of-sight. For shocked envi-ronments an offset velocity between CH and CH+ or a veloc-ity broadening of CH+ is predicted by models. For the sight-lines in this work we obtain an average Δv of 0.3 km s−1, withindividual velocity measurements that have errors of about 1to 2 km s−1 (see also Sect. 5.5). Our data support recent sur-veys which find no evidence for a velocity difference betweenCH and CH+ (Crane et al. 1995; Pan et al. 2005). The data donot allow for an accurate measurement and comparison of CHand CH+ line widths. The line profiles of atomic and di-atomicspecies can be compared in Fig. 4 (and associated Fig. D.1).W(CH+) is plotted against W(CH) in Fig. 12 with the turbu-lent (N(CH+)/N(CH) > 2) and quiescent (N(CH+)/N(CH) < 0.5)regions indicated by the shaded areas. The general correlationbetween CH+ and CH (Pan et al. 2005) is poor, but it appearsthat two separate trends might in fact exist for the quiescent
A129, page 10 of 43
D. A. I. Vos et al.: Diffuse interstellar bands in Upper Scorpius
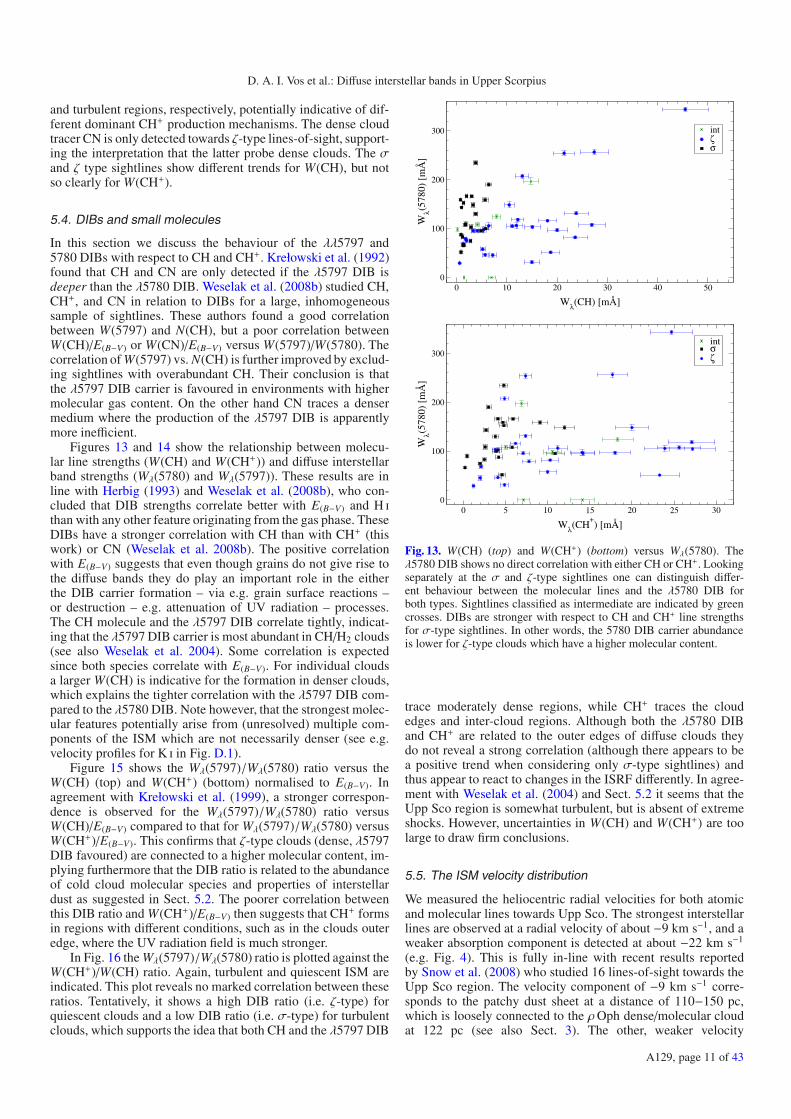
and turbulent regions, respectively, potentially indicative of dif-ferent dominant CH+ production mechanisms. The dense cloudtracer CN is only detected towards ζ-type lines-of-sight, support-ing the interpretation that the latter probe dense clouds. The σand ζ type sightlines show different trends for W(CH), but notso clearly for W(CH+).
5.4. DIBs and small molecules
In this section we discuss the behaviour of the λλ5797 and5780 DIBs with respect to CH and CH+. Krełowski et al. (1992)found that CH and CN are only detected if the λ5797 DIB isdeeper than the λ5780 DIB. Weselak et al. (2008b) studied CH,CH+, and CN in relation to DIBs for a large, inhomogeneoussample of sightlines. These authors found a good correlationbetween W(5797) and N(CH), but a poor correlation betweenW(CH)/E(B−V) or W(CN)/E(B−V) versus W(5797)/W(5780). Thecorrelation of W(5797) vs. N(CH) is further improved by exclud-ing sightlines with overabundant CH. Their conclusion is thatthe λ5797 DIB carrier is favoured in environments with highermolecular gas content. On the other hand CN traces a densermedium where the production of the λ5797 DIB is apparentlymore inefficient.
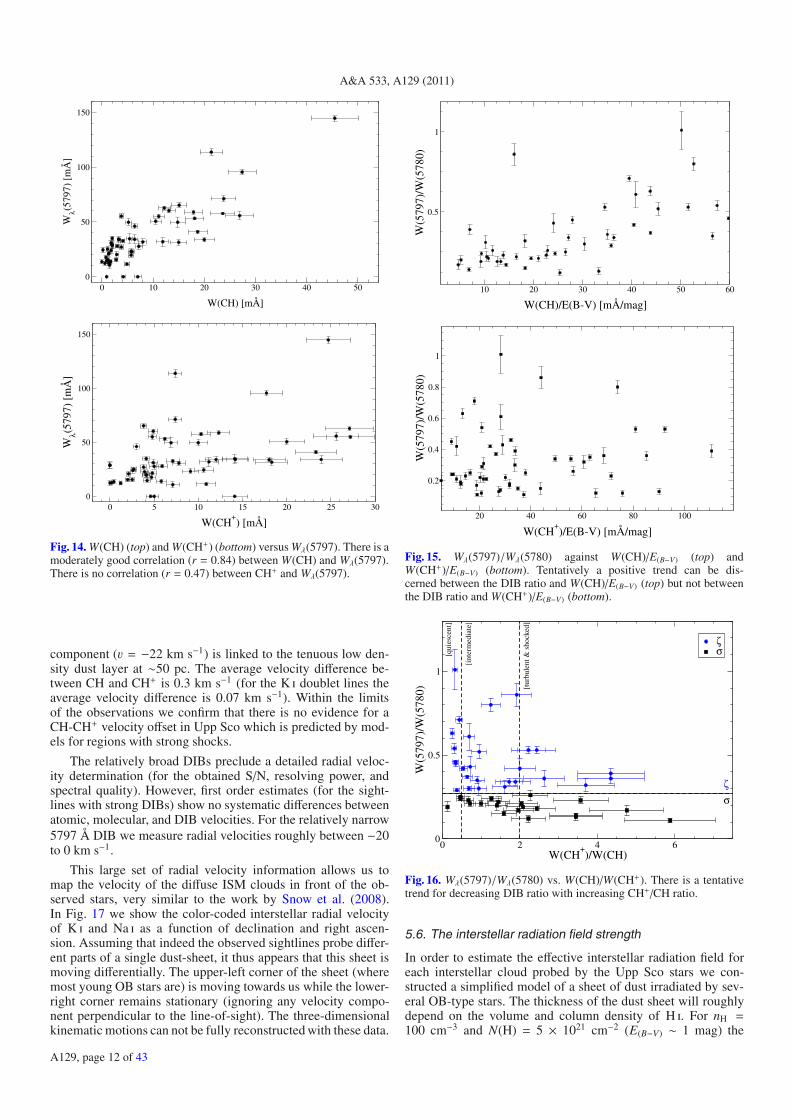
Figures 13 and 14 show the relationship between molecu-lar line strengths (W(CH) and W(CH+)) and diffuse interstellarband strengths (Wλ(5780) and Wλ(5797)). These results are inline with Herbig (1993) and Weselak et al. (2008b), who con-cluded that DIB strengths correlate better with E(B−V) and H ithan with any other feature originating from the gas phase. TheseDIBs have a stronger correlation with CH than with CH+ (thiswork) or CN (Weselak et al. 2008b). The positive correlationwith E(B−V) suggests that even though grains do not give rise tothe diffuse bands they do play an important role in the eitherthe DIB carrier formation – via e.g. grain surface reactions –or destruction – e.g. attenuation of UV radiation – processes.The CH molecule and the λ5797 DIB correlate tightly, indicat-ing that the λ5797 DIB carrier is most abundant in CH/H2 clouds(see also Weselak et al. 2004). Some correlation is expectedsince both species correlate with E(B−V). For individual cloudsa larger W(CH) is indicative for the formation in denser clouds,which explains the tighter correlation with the λ5797 DIB com-pared to the λ5780 DIB. Note however, that the strongest molec-ular features potentially arise from (unresolved) multiple com-ponents of the ISM which are not necessarily denser (see e.g.velocity profiles for K i in Fig. D.1).
Figure 15 shows the Wλ(5797)/Wλ(5780) ratio versus theW(CH) (top) and W(CH+) (bottom) normalised to E(B−V). Inagreement with Krełowski et al. (1999), a stronger correspon-dence is observed for the Wλ(5797)/Wλ(5780) ratio versusW(CH)/E(B−V) compared to that for Wλ(5797)/Wλ(5780) versusW(CH+)/E(B−V). This confirms that ζ-type clouds (dense, λ5797DIB favoured) are connected to a higher molecular content, im-plying furthermore that the DIB ratio is related to the abundanceof cold cloud molecular species and properties of interstellardust as suggested in Sect. 5.2. The poorer correlation betweenthis DIB ratio and W(CH+)/E(B−V) then suggests that CH+ formsin regions with different conditions, such as in the clouds outeredge, where the UV radiation field is much stronger.
In Fig. 16 the Wλ(5797)/Wλ(5780) ratio is plotted against theW(CH+)/W(CH) ratio. Again, turbulent and quiescent ISM areindicated. This plot reveals no marked correlation between theseratios. Tentatively, it shows a high DIB ratio (i.e. ζ-type) forquiescent clouds and a low DIB ratio (i.e. σ-type) for turbulentclouds, which supports the idea that both CH and the λ5797 DIB
0 10 20 30 40 50
Wλ(CH) [mÅ]
0
100
200
300
Wλ(5
780)
[m
Å]
intζσ
0 5 10 15 20 25 30
Wλ(CH+) [mÅ]
0
100
200
300
Wλ(5
780)
[m
Å]
intσζ
Fig. 13. W(CH) (top) and W(CH+) (bottom) versus Wλ(5780). Theλ5780 DIB shows no direct correlation with either CH or CH+. Lookingseparately at the σ and ζ-type sightlines one can distinguish differ-ent behaviour between the molecular lines and the λ5780 DIB forboth types. Sightlines classified as intermediate are indicated by greencrosses. DIBs are stronger with respect to CH and CH+ line strengthsfor σ-type sightlines. In other words, the 5780 DIB carrier abundanceis lower for ζ-type clouds which have a higher molecular content.
trace moderately dense regions, while CH+ traces the cloudedges and inter-cloud regions. Although both the λ5780 DIBand CH+ are related to the outer edges of diffuse clouds theydo not reveal a strong correlation (although there appears to bea positive trend when considering only σ-type sightlines) andthus appear to react to changes in the ISRF differently. In agree-ment with Weselak et al. (2004) and Sect. 5.2 it seems that theUpp Sco region is somewhat turbulent, but is absent of extremeshocks. However, uncertainties in W(CH) and W(CH+) are toolarge to draw firm conclusions.
5.5. The ISM velocity distribution
We measured the heliocentric radial velocities for both atomicand molecular lines towards Upp Sco. The strongest interstellarlines are observed at a radial velocity of about −9 km s−1, and aweaker absorption component is detected at about −22 km s−1
(e.g. Fig. 4). This is fully in-line with recent results reportedby Snow et al. (2008) who studied 16 lines-of-sight towards theUpp Sco region. The velocity component of −9 km s−1 corre-sponds to the patchy dust sheet at a distance of 110−150 pc,which is loosely connected to the ρOph dense/molecular cloudat 122 pc (see also Sect. 3). The other, weaker velocity
A129, page 11 of 43
A&A 533, A129 (2011)
0 10 20 30 40 50
W(CH) [mÅ]
0
50
100
150
Wλ(5
797)
[m
Å]
0 5 10 15 20 25 30
W(CH+) [mÅ]
0
50
100
150
Wλ(5
797)
[m
Å]
Fig. 14. W(CH) (top) and W(CH+) (bottom) versus Wλ(5797). There is amoderately good correlation (r = 0.84) between W(CH) and Wλ(5797).There is no correlation (r = 0.47) between CH+ and Wλ(5797).
component (v = −22 km s−1) is linked to the tenuous low den-sity dust layer at ∼50 pc. The average velocity difference be-tween CH and CH+ is 0.3 km s−1 (for the K i doublet lines theaverage velocity difference is 0.07 km s−1). Within the limitsof the observations we confirm that there is no evidence for aCH-CH+ velocity offset in Upp Sco which is predicted by mod-els for regions with strong shocks.
The relatively broad DIBs preclude a detailed radial veloc-ity determination (for the obtained S/N, resolving power, andspectral quality). However, first order estimates (for the sight-lines with strong DIBs) show no systematic differences betweenatomic, molecular, and DIB velocities. For the relatively narrow5797 Å DIB we measure radial velocities roughly between −20to 0 km s−1.
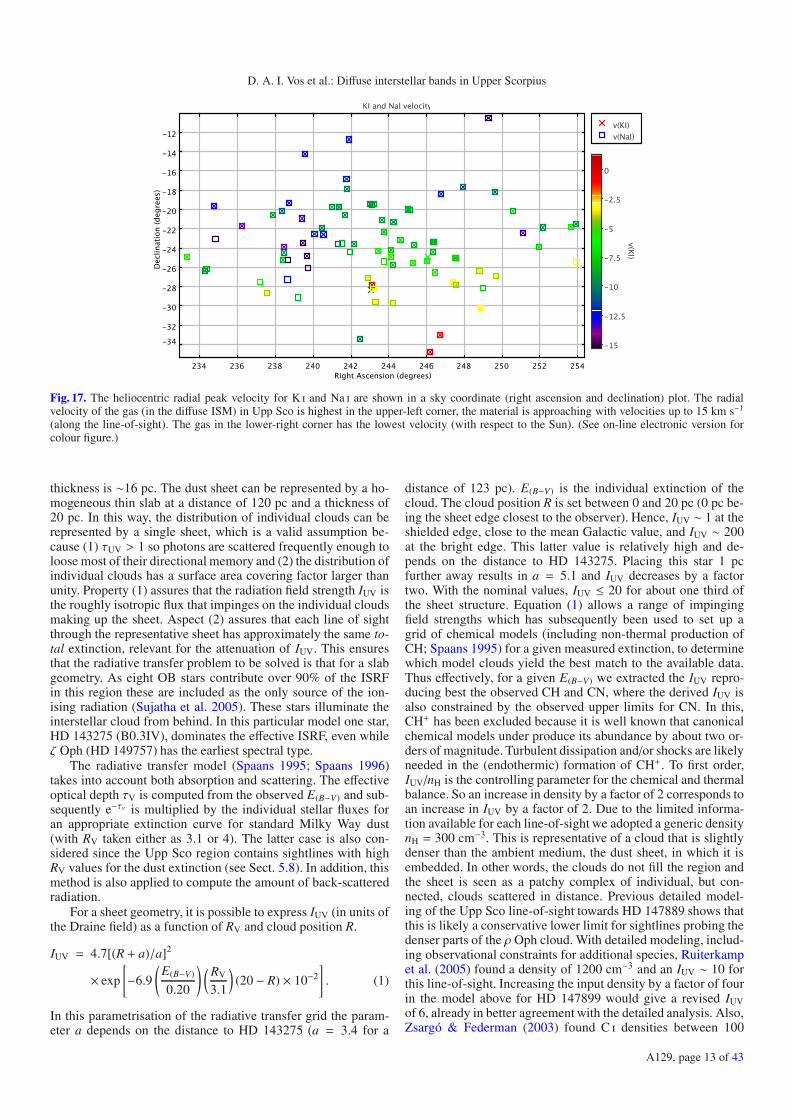
This large set of radial velocity information allows us tomap the velocity of the diffuse ISM clouds in front of the ob-served stars, very similar to the work by Snow et al. (2008).In Fig. 17 we show the color-coded interstellar radial velocityof K i and Na i as a function of declination and right ascen-sion. Assuming that indeed the observed sightlines probe differ-ent parts of a single dust-sheet, it thus appears that this sheet ismoving differentially. The upper-left corner of the sheet (wheremost young OB stars are) is moving towards us while the lower-right corner remains stationary (ignoring any velocity compo-nent perpendicular to the line-of-sight). The three-dimensionalkinematic motions can not be fully reconstructed with these data.
10 20 30 40 50 60
W(CH)/E(B-V) [mÅ/mag]
0.5
1
W(5
797)
/W(5
780)
20 40 60 80 100
W(CH+)/E(B-V) [mÅ/mag]
0.2
0.4
0.6
0.8
1
W(5
797)
/W(5
780)
Fig. 15. Wλ(5797)/Wλ(5780) against W(CH)/E(B−V) (top) andW(CH+)/E(B−V) (bottom). Tentatively a positive trend can be dis-cerned between the DIB ratio and W(CH)/E(B−V) (top) but not betweenthe DIB ratio and W(CH+)/E(B−V) (bottom).
0 2 4 6W(CH
+)/W(CH)
0
0.5
1
W(5
797)
/W(5
780)
[int
erm
edia
te]
[tur
bule
nt &
sho
cked
]
ζσ[q
uies
cent
]
σζ
Fig. 16. Wλ(5797)/Wλ(5780) vs. W(CH)/W(CH+). There is a tentativetrend for decreasing DIB ratio with increasing CH+/CH ratio.
5.6. The interstellar radiation field strength
In order to estimate the effective interstellar radiation field foreach interstellar cloud probed by the Upp Sco stars we con-structed a simplified model of a sheet of dust irradiated by sev-eral OB-type stars. The thickness of the dust sheet will roughlydepend on the volume and column density of H i. For nH =100 cm−3 and N(H) = 5 × 1021 cm−2 (E(B−V) ∼ 1 mag) the
A129, page 12 of 43
D. A. I. Vos et al.: Diffuse interstellar bands in Upper Scorpius
Fig. 17. The heliocentric radial peak velocity for K i and Na i are shown in a sky coordinate (right ascension and declination) plot. The radialvelocity of the gas (in the diffuse ISM) in Upp Sco is highest in the upper-left corner, the material is approaching with velocities up to 15 km s−1
(along the line-of-sight). The gas in the lower-right corner has the lowest velocity (with respect to the Sun). (See on-line electronic version forcolour figure.)
thickness is ∼16 pc. The dust sheet can be represented by a ho-mogeneous thin slab at a distance of 120 pc and a thickness of20 pc. In this way, the distribution of individual clouds can berepresented by a single sheet, which is a valid assumption be-cause (1) τUV > 1 so photons are scattered frequently enough toloose most of their directional memory and (2) the distribution ofindividual clouds has a surface area covering factor larger thanunity. Property (1) assures that the radiation field strength IUV isthe roughly isotropic flux that impinges on the individual cloudsmaking up the sheet. Aspect (2) assures that each line of sightthrough the representative sheet has approximately the same to-tal extinction, relevant for the attenuation of IUV. This ensuresthat the radiative transfer problem to be solved is that for a slabgeometry. As eight OB stars contribute over 90% of the ISRFin this region these are included as the only source of the ion-ising radiation (Sujatha et al. 2005). These stars illuminate theinterstellar cloud from behind. In this particular model one star,HD 143275 (B0.3IV), dominates the effective ISRF, even whileζ Oph (HD 149757) has the earliest spectral type.
The radiative transfer model (Spaans 1995; Spaans 1996)takes into account both absorption and scattering. The effectiveoptical depth τV is computed from the observed E(B−V) and sub-sequently e−τν is multiplied by the individual stellar fluxes foran appropriate extinction curve for standard Milky Way dust(with RV taken either as 3.1 or 4). The latter case is also con-sidered since the Upp Sco region contains sightlines with highRV values for the dust extinction (see Sect. 5.8). In addition, thismethod is also applied to compute the amount of back-scatteredradiation.
For a sheet geometry, it is possible to express IUV (in units ofthe Draine field) as a function of RV and cloud position R.
IUV = 4.7[(R + a)/a]2
× exp
[−6.9
(E(B−V)
0.20
) ( RV
3.1
)(20 − R) × 10−2
]. (1)
In this parametrisation of the radiative transfer grid the param-eter a depends on the distance to HD 143275 (a = 3.4 for a
distance of 123 pc). E(B−V) is the individual extinction of thecloud. The cloud position R is set between 0 and 20 pc (0 pc be-ing the sheet edge closest to the observer). Hence, IUV ∼ 1 at theshielded edge, close to the mean Galactic value, and IUV ∼ 200at the bright edge. This latter value is relatively high and de-pends on the distance to HD 143275. Placing this star 1 pcfurther away results in a = 5.1 and IUV decreases by a factortwo. With the nominal values, IUV ≤ 20 for about one third ofthe sheet structure. Equation (1) allows a range of impingingfield strengths which has subsequently been used to set up agrid of chemical models (including non-thermal production ofCH; Spaans 1995) for a given measured extinction, to determinewhich model clouds yield the best match to the available data.Thus effectively, for a given E(B−V) we extracted the IUV repro-ducing best the observed CH and CN, where the derived IUV isalso constrained by the observed upper limits for CN. In this,CH+ has been excluded because it is well known that canonicalchemical models under produce its abundance by about two or-ders of magnitude. Turbulent dissipation and/or shocks are likelyneeded in the (endothermic) formation of CH+. To first order,IUV/nH is the controlling parameter for the chemical and thermalbalance. So an increase in density by a factor of 2 corresponds toan increase in IUV by a factor of 2. Due to the limited informa-tion available for each line-of-sight we adopted a generic densitynH = 300 cm−3. This is representative of a cloud that is slightlydenser than the ambient medium, the dust sheet, in which it isembedded. In other words, the clouds do not fill the region andthe sheet is seen as a patchy complex of individual, but con-nected, clouds scattered in distance. Previous detailed model-ing of the Upp Sco line-of-sight towards HD 147889 shows thatthis is likely a conservative lower limit for sightlines probing thedenser parts of the ρ Oph cloud. With detailed modeling, includ-ing observational constraints for additional species, Ruiterkampet al. (2005) found a density of 1200 cm−3 and an IUV ∼ 10 forthis line-of-sight. Increasing the input density by a factor of fourin the model above for HD 147899 would give a revised IUVof 6, already in better agreement with the detailed analysis. Also,Zsargó & Federman (2003) found C i densities between 100
A129, page 13 of 43

A&A 533, A129 (2011)
and 300 cm−3 for HD 143275 and HD 147165, but lower val-ues, ∼50 to ∼200, for HD 144470 and HD 144217. However,as C i traces the purely atomic phase of clouds, it is likely thatthis yields lower densities than for the molecular/shielded partsas traced by e.g. C2, CN and CH. Clearly, the simplificationsintroduced in the model presented in this work do not fully in-corporate all the intricacies of a full-fledged analysis. However,the strength of this model, which relies only on the CH andCN abundance, is in giving statistically relevant predictions ofthe ISRF for a larger dataset for which only limited informa-tion is available. For accurate equivalent width measurementsof both CH and CN the computed IUV has an uncertainty ofapproximately 25%, not including any unknown systematic ef-fects. Uncertainties in the density, D = dn/n, propagate into IUVas D1/2. If only CH is detected the value of IUV should there-fore be considered indicative only (like a model dependent lowerlimit). The resulting interstellar radiation field strengths are pre-sented in Table 2.
For diffuse clouds the ISRF can also be estimated fromsteady-state gas phase chemistry (see e.g. Welty et al. 2006;Ritchey et al. 2006):
IUV/nH ∝ N(CH+)N(CH)
fH2 , (2)
which is valid for non-thermal CH production and for small val-ues of fH2 . On the other hand, rotational excitation modelingof H2 gives (see e.g. Jura 1975; Black & van Dishoeck 1987;Lee et al. 2007):
log(nH/IUV) ∝ log f (3)
which is appropriate for n(H2) � n(H) ≈ nH (but the linear-ity holds also for higher N(H2) (e.g. Lee et al. 2007). Note thatEqs. (2) and (3) show an opposite dependence of IUV/nH on fH2 .
In addition, UV pumping can produce excited H∗2 leadingto an enhancement in the production of CH+ via C+ + H∗2 →CH+ + H. Therefore, we compare the independently obtainedvalues for CH+ and IUV, as well as CH/CH+ and IUV to investi-gate whether this process is important. Figure 18 illustrates thatsightlines with high CH+ abundances show only moderate val-ues for IUV (i.e. less than 10), while sightlines with high IUV(i.e. larger than ∼10) all show low-to-normal CH+ abundances.From this relation it appears that a strong ISRF (IUV > 10)does not lead to enhanced CH+ production, possibly becausethe molecular hydrogen abundance of these sightlines is too low.However, W(CH+)/E(B−V) peaks at IUV = 5 which may reveala delicate balance for the presence of UV pumping at interme-diate IUV and moderate fH2 . On the other hand, Fig. 19 showsthat the CH/CH+ ratio drops rapidly for IUV > 4. Thus despite alower total CH+ abundance (per unit reddening) for higher val-ues of IUV the relative production of CH+ with respect to CH in-creases. This could be due to more efficient production of CH+ orless efficient formation of CH in these low density, strongly UVexposed environments. The latter is indeed expected as N(CH)correlates with N(H2) whose relative presence reduces also withincreasing IUV (see below). UV pumping may thus contributesignificantly to CH+ formation only in diffuse clouds with suffi-cient abundance of both H2 and UV photons. Other mechanisms,like turbulent dissipation of mechanical energy, could also beimportant for CH+ formation in this region.
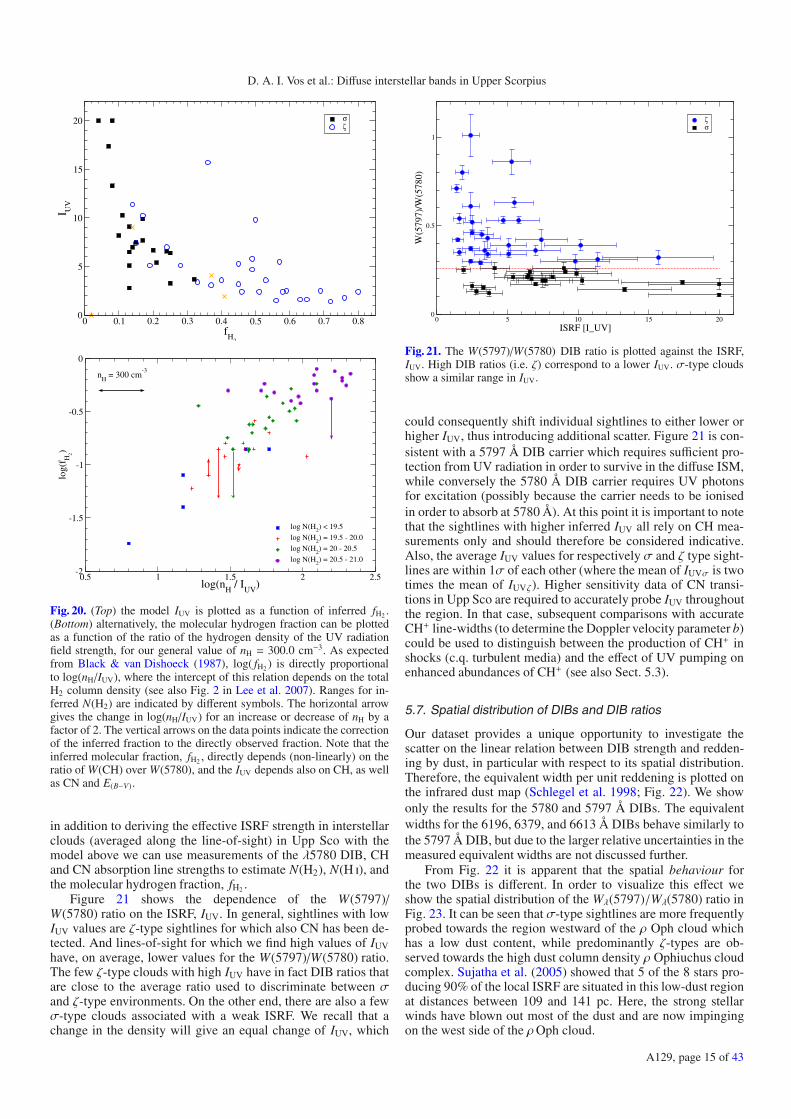
Figure 20 (top panel) reveals an evident inverse relation be-tween the strength of the ISRF, IUV, and the molecular hydro-gen fraction, fH2 . This effect of lower IUV for interstellar cloudswith higher molecular fractions (and thus more efficient shield-ing of the UV radiation) is expected from Eq. (3). This figure
0 5 10 15 20 25ISRF [I_UV]
0
20
40
60
80
100
W(C
H+)/
E(B
-V)
[mÅ
/mag
]
ζσ
Fig. 18. The CH+ line strength per unit reddening is shown as a func-tion of the ISRF strength, IUV. Highest values for IUV are found forlow CH+ abundances per unit reddening. Because N(CH) ∝ N(H2) andE(B−V) ∝ H i Eq. (2) gives IUV/nH ∝ N(CH+)/E(B−V) . There is some ev-idence for enhanced CH+ production (UV pumping?) in clouds withmoderate IUV ∼ 5.
0 5 10 15 20 25ISRF [I_UV]
0
1
2
3
4W
(CH
)/W
(CH
+)
Fig. 19. The CH over CH+ line strength ratio is plotted as a functionof the ISRF strength, IUV. There is a drop in this ratio (i.e. enhancedCH+ or reduced CH production) for stronger radiation fields (IUV). Thistrend is consistent with non-thermal production of CH, otherwise notrend would be expected.
also illustrates the general trend that the σ-type clouds havea higher IUV and a lower molecular content fH2 , while ζ-typesightlines have a higher molecular content and are exposed toa weaker ISRF. Note that although a few sightlines with lowfH2 and higher IUV values were classified as ζ-type based on theobserved W(5797)/W(5780) ratio, there is a clear separation –based on physical conditions – between the σ- and ζ-type sight-lines. Weselak et al. (2004) also show a similar distinction be-tween σ and ζ at fH2 ∼ 0.4 (although their σ-ζ classificationis based on central depth ratios resulting in a slightly differentdivision between the two types).
The linear relation between log( fH2) and log(nH/IUV)(i.e. Eq. (3)) in Fig. 20 (bottom panel) can be compared directlyto Fig. 2 in Lee et al. (2007) showing indeed a close relationbetween the molecular fraction and the ratio of hydrogen den-sity over radiation field strength, nH/IUV. This relation is sensi-tive to the total H2 column density but does not depend stronglyon the hydrogen particle density, nH. Nonetheless, knowledge ofthe latter value (either estimated or derived from complementarydata) is required to derive IUV. Non-thermal H2 excitation due toturbulence can mimic UV pumping and thus alter the relation be-tween the model IUV and the observed fH2 (Spaans 1995). Thus,
A129, page 14 of 43
D. A. I. Vos et al.: Diffuse interstellar bands in Upper Scorpius
0 0.1 0.2 0.3 0.4 0.5 0.6 0.7 0.8fH
2
0
5
10
15
20
I UV
σζ
0.5 1 1.5 2 2.5log(n
H / I
UV)
-2
-1.5
-1
-0.5
0
log(
f H2)
log N(H2) < 19.5
log N(H2) = 19.5 - 20.0
log N(H2) = 20 - 20.5
log N(H2) = 20.5 - 21.0
nH
= 300 cm-3
Fig. 20. (Top) the model IUV is plotted as a function of inferred fH2 .(Bottom) alternatively, the molecular hydrogen fraction can be plottedas a function of the ratio of the hydrogen density of the UV radiationfield strength, for our general value of nH = 300.0 cm−3. As expectedfrom Black & van Dishoeck (1987), log( fH2 ) is directly proportionalto log(nH/IUV), where the intercept of this relation depends on the totalH2 column density (see also Fig. 2 in Lee et al. 2007). Ranges for in-ferred N(H2) are indicated by different symbols. The horizontal arrowgives the change in log(nH/IUV) for an increase or decrease of nH by afactor of 2. The vertical arrows on the data points indicate the correctionof the inferred fraction to the directly observed fraction. Note that theinferred molecular fraction, fH2 , directly depends (non-linearly) on theratio of W(CH) over W(5780), and the IUV depends also on CH, as wellas CN and E(B−V).
in addition to deriving the effective ISRF strength in interstellarclouds (averaged along the line-of-sight) in Upp Sco with themodel above we can use measurements of the λ5780 DIB, CHand CN absorption line strengths to estimate N(H2), N(H i), andthe molecular hydrogen fraction, fH2 .
Figure 21 shows the dependence of the W(5797)/W(5780) ratio on the ISRF, IUV. In general, sightlines with lowIUV values are ζ-type sightlines for which also CN has been de-tected. And lines-of-sight for which we find high values of IUVhave, on average, lower values for the W(5797)/W(5780) ratio.The few ζ-type clouds with high IUV have in fact DIB ratios thatare close to the average ratio used to discriminate between σand ζ-type environments. On the other end, there are also a fewσ-type clouds associated with a weak ISRF. We recall that achange in the density will give an equal change of IUV, which
0 5 10 15 20ISRF [I_UV]
0
0.5
1
W(5
797)
/W(5
780)
ζσ
Fig. 21. The W(5797)/W(5780) DIB ratio is plotted against the ISRF,IUV. High DIB ratios (i.e. ζ) correspond to a lower IUV. σ-type cloudsshow a similar range in IUV.
could consequently shift individual sightlines to either lower orhigher IUV, thus introducing additional scatter. Figure 21 is con-sistent with a 5797 Å DIB carrier which requires sufficient pro-tection from UV radiation in order to survive in the diffuse ISM,while conversely the 5780 Å DIB carrier requires UV photonsfor excitation (possibly because the carrier needs to be ionisedin order to absorb at 5780 Å). At this point it is important to notethat the sightlines with higher inferred IUV all rely on CH mea-surements only and should therefore be considered indicative.Also, the average IUV values for respectively σ and ζ type sight-lines are within 1σ of each other (where the mean of IUVσ is twotimes the mean of IUVζ). Higher sensitivity data of CN transi-tions in Upp Sco are required to accurately probe IUV throughoutthe region. In that case, subsequent comparisons with accurateCH+ line-widths (to determine the Doppler velocity parameter b)could be used to distinguish between the production of CH+ inshocks (c.q. turbulent media) and the effect of UV pumping onenhanced abundances of CH+ (see also Sect. 5.3).
5.7. Spatial distribution of DIBs and DIB ratios
Our dataset provides a unique opportunity to investigate thescatter on the linear relation between DIB strength and redden-ing by dust, in particular with respect to its spatial distribution.Therefore, the equivalent width per unit reddening is plotted onthe infrared dust map (Schlegel et al. 1998; Fig. 22). We showonly the results for the 5780 and 5797 Å DIBs. The equivalentwidths for the 6196, 6379, and 6613 Å DIBs behave similarly tothe 5797 Å DIB, but due to the larger relative uncertainties in themeasured equivalent widths are not discussed further.
From Fig. 22 it is apparent that the spatial behaviour forthe two DIBs is different. In order to visualize this effect weshow the spatial distribution of the Wλ(5797)/Wλ(5780) ratio inFig. 23. It can be seen that σ-type sightlines are more frequentlyprobed towards the region westward of the ρ Oph cloud whichhas a low dust content, while predominantly ζ-types are ob-served towards the high dust column density ρ Ophiuchus cloudcomplex. Sujatha et al. (2005) showed that 5 of the 8 stars pro-ducing 90% of the local ISRF are situated in this low-dust regionat distances between 109 and 141 pc. Here, the strong stellarwinds have blown out most of the dust and are now impingingon the west side of the ρOph cloud.
A129, page 15 of 43
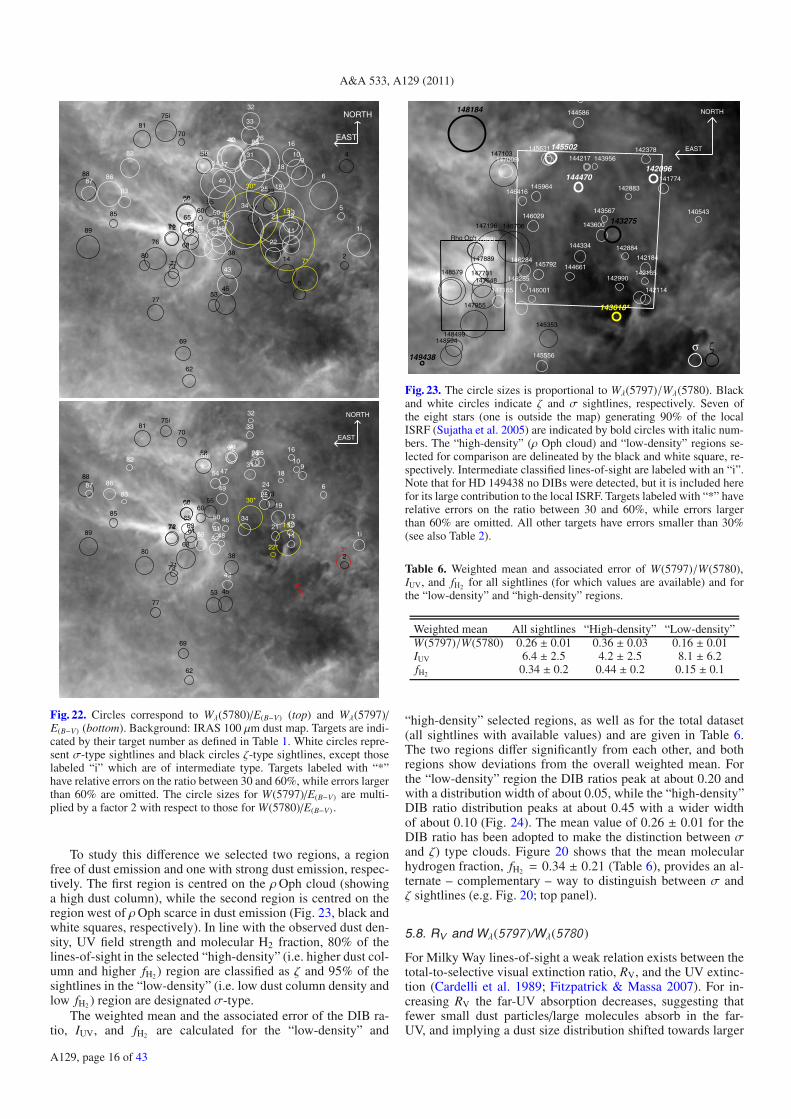
A&A 533, A129 (2011)
EAST
NORTH
89
8887
86
85
83
82
81
80
77
76
75i
74
73
72
71
70
69
68
6766
65
64i
63
62
61
60
59
5856i
55
54
53
52
5150
49
48
47
46
45
44
43
4241
38
34
33
32
31
30*
2928
27
26
25
24
23
22
21
19
18
16
15*
14
1312
11
109
8
7*
6
5
4
2
1i
EAST
NORTH
89
8887 86
85
83
82
81
80
77
75i
74
73
72
71
70
69
68
6766
65
64i
63
62
61
60
59
5856i
55
54
53
52
51
50
49
48
47
46
45
44
43
4241
38
34
33
32
31
30*
292826
25
2423
22*
21
19
18
16
15*1312
11
109
8*
6
3*2
1i
Fig. 22. Circles correspond to Wλ(5780)/E(B−V) (top) and Wλ(5797)/E(B−V) (bottom). Background: IRAS 100 μm dust map. Targets are indi-cated by their target number as defined in Table 1. White circles repre-sent σ-type sightlines and black circles ζ-type sightlines, except thoselabeled “i” which are of intermediate type. Targets labeled with “*”have relative errors on the ratio between 30 and 60%, while errors largerthan 60% are omitted. The circle sizes for W(5797)/E(B−V) are multi-plied by a factor 2 with respect to those for W(5780)/E(B−V) .
To study this difference we selected two regions, a regionfree of dust emission and one with strong dust emission, respec-tively. The first region is centred on the ρOph cloud (showinga high dust column), while the second region is centred on theregion west of ρOph scarce in dust emission (Fig. 23, black andwhite squares, respectively). In line with the observed dust den-sity, UV field strength and molecular H2 fraction, 80% of thelines-of-sight in the selected “high-density” (i.e. higher dust col-umn and higher fH2 ) region are classified as ζ and 95% of thesightlines in the “low-density” (i.e. low dust column density andlow fH2 ) region are designated σ-type.
The weighted mean and the associated error of the DIB ra-tio, IUV, and fH2 are calculated for the “low-density” and
EAST
NORTH
σ ζ
Rho Oph
149438
148594
148579
148499
148184
147955
147889
147888i
147701 147648
147196
147165
147103 147009i
146706
146416
146285
146284
146029
146001
145964
145792
145631
145556
145502
145353
144661
144586
144470
144334
144217 143956
143600
143567
143275
143018*
142990
142884
142883
142378
142184
142165
142114
142096 141774
140543
Fig. 23. The circle sizes is proportional to Wλ(5797)/Wλ(5780). Blackand white circles indicate ζ and σ sightlines, respectively. Seven ofthe eight stars (one is outside the map) generating 90% of the localISRF (Sujatha et al. 2005) are indicated by bold circles with italic num-bers. The “high-density” (ρ Oph cloud) and “low-density” regions se-lected for comparison are delineated by the black and white square, re-spectively. Intermediate classified lines-of-sight are labeled with an “i”.Note that for HD 149438 no DIBs were detected, but it is included herefor its large contribution to the local ISRF. Targets labeled with “*” haverelative errors on the ratio between 30 and 60%, while errors largerthan 60% are omitted. All other targets have errors smaller than 30%(see also Table 2).
Table 6. Weighted mean and associated error of W(5797)/W(5780),IUV, and fH2 for all sightlines (for which values are available) and forthe “low-density” and “high-density” regions.
Weighted mean All sightlines “High-density” “Low-density”W(5797)/W(5780) 0.26 ± 0.01 0.36 ± 0.03 0.16 ± 0.01IUV 6.4 ± 2.5 4.2 ± 2.5 8.1 ± 6.2fH2 0.34 ± 0.2 0.44 ± 0.2 0.15 ± 0.1
“high-density” selected regions, as well as for the total dataset(all sightlines with available values) and are given in Table 6.The two regions differ significantly from each other, and bothregions show deviations from the overall weighted mean. Forthe “low-density” region the DIB ratios peak at about 0.20 andwith a distribution width of about 0.05, while the “high-density”DIB ratio distribution peaks at about 0.45 with a wider widthof about 0.10 (Fig. 24). The mean value of 0.26 ± 0.01 for theDIB ratio has been adopted to make the distinction between σand ζ) type clouds. Figure 20 shows that the mean molecularhydrogen fraction, fH2 = 0.34 ± 0.21 (Table 6), provides an al-ternate – complementary – way to distinguish between σ andζ sightlines (e.g. Fig. 20; top panel).
5.8. RV and Wλ(5797 )/Wλ(5780 )
For Milky Way lines-of-sight a weak relation exists between thetotal-to-selective visual extinction ratio, RV, and the UV extinc-tion (Cardelli et al. 1989; Fitzpatrick & Massa 2007). For in-creasing RV the far-UV absorption decreases, suggesting thatfewer small dust particles/large molecules absorb in the far-UV, and implying a dust size distribution shifted towards larger
A129, page 16 of 43
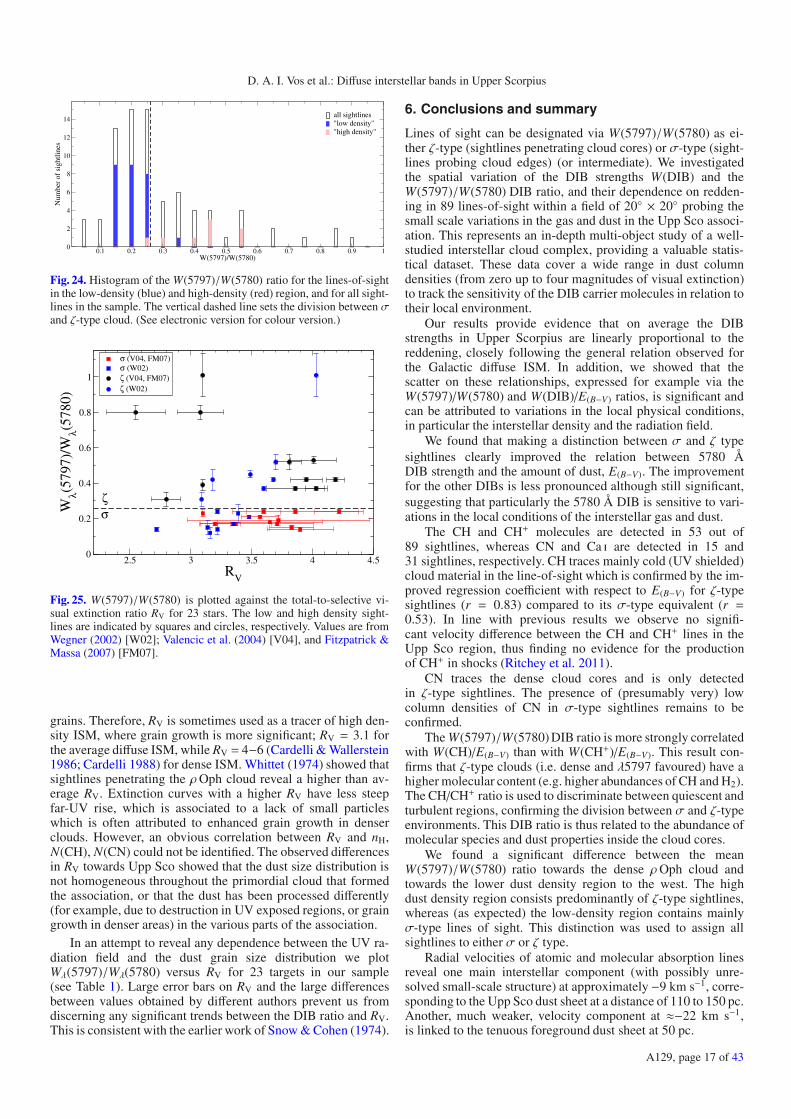
D. A. I. Vos et al.: Diffuse interstellar bands in Upper Scorpius
0.1 0.2 0.3 0.4 0.5 0.6 0.7 0.8 0.9 1W(5797)/W(5780)
0
2
4
6
8
10
12
14
Num
ber
of s
ight
lines
all sightlines"low density""high density"
Fig. 24. Histogram of the W(5797)/W(5780) ratio for the lines-of-sightin the low-density (blue) and high-density (red) region, and for all sight-lines in the sample. The vertical dashed line sets the division between σand ζ-type cloud. (See electronic version for colour version.)
2.5 3 3.5 4 4.5R
V
0
0.2
0.4
0.6
0.8
1
Wλ(5
797)
/Wλ(5
780)
σ (V04, FM07)σ (W02)ζ (V04, FM07)ζ (W02)
ζσ
Fig. 25. W(5797)/W(5780) is plotted against the total-to-selective vi-sual extinction ratio RV for 23 stars. The low and high density sight-lines are indicated by squares and circles, respectively. Values are fromWegner (2002) [W02]; Valencic et al. (2004) [V04], and Fitzpatrick &Massa (2007) [FM07].
grains. Therefore, RV is sometimes used as a tracer of high den-sity ISM, where grain growth is more significant; RV = 3.1 forthe average diffuse ISM, while RV = 4−6 (Cardelli & Wallerstein1986; Cardelli 1988) for dense ISM. Whittet (1974) showed thatsightlines penetrating the ρOph cloud reveal a higher than av-erage RV. Extinction curves with a higher RV have less steepfar-UV rise, which is associated to a lack of small particleswhich is often attributed to enhanced grain growth in denserclouds. However, an obvious correlation between RV and nH,N(CH), N(CN) could not be identified. The observed differencesin RV towards Upp Sco showed that the dust size distribution isnot homogeneous throughout the primordial cloud that formedthe association, or that the dust has been processed differently(for example, due to destruction in UV exposed regions, or graingrowth in denser areas) in the various parts of the association.
In an attempt to reveal any dependence between the UV ra-diation field and the dust grain size distribution we plotWλ(5797)/Wλ(5780) versus RV for 23 targets in our sample(see Table 1). Large error bars on RV and the large differencesbetween values obtained by different authors prevent us fromdiscerning any significant trends between the DIB ratio and RV.This is consistent with the earlier work of Snow & Cohen (1974).
6. Conclusions and summary
Lines of sight can be designated via W(5797)/W(5780) as ei-ther ζ-type (sightlines penetrating cloud cores) or σ-type (sight-lines probing cloud edges) (or intermediate). We investigatedthe spatial variation of the DIB strengths W(DIB) and theW(5797)/W(5780) DIB ratio, and their dependence on redden-ing in 89 lines-of-sight within a field of 20◦ × 20◦ probing thesmall scale variations in the gas and dust in the Upp Sco associ-ation. This represents an in-depth multi-object study of a well-studied interstellar cloud complex, providing a valuable statis-tical dataset. These data cover a wide range in dust columndensities (from zero up to four magnitudes of visual extinction)to track the sensitivity of the DIB carrier molecules in relation totheir local environment.
Our results provide evidence that on average the DIBstrengths in Upper Scorpius are linearly proportional to thereddening, closely following the general relation observed forthe Galactic diffuse ISM. In addition, we showed that thescatter on these relationships, expressed for example via theW(5797)/W(5780) and W(DIB)/E(B−V) ratios, is significant andcan be attributed to variations in the local physical conditions,in particular the interstellar density and the radiation field.
We found that making a distinction between σ and ζ typesightlines clearly improved the relation between 5780 ÅDIB strength and the amount of dust, E(B−V). The improvementfor the other DIBs is less pronounced although still significant,suggesting that particularly the 5780 Å DIB is sensitive to vari-ations in the local conditions of the interstellar gas and dust.
The CH and CH+ molecules are detected in 53 out of89 sightlines, whereas CN and Ca i are detected in 15 and31 sightlines, respectively. CH traces mainly cold (UV shielded)cloud material in the line-of-sight which is confirmed by the im-proved regression coefficient with respect to E(B−V) for ζ-typesightlines (r = 0.83) compared to its σ-type equivalent (r =0.53). In line with previous results we observe no signifi-cant velocity difference between the CH and CH+ lines in theUpp Sco region, thus finding no evidence for the productionof CH+ in shocks (Ritchey et al. 2011).
CN traces the dense cloud cores and is only detectedin ζ-type sightlines. The presence of (presumably very) lowcolumn densities of CN in σ-type sightlines remains to beconfirmed.
The W(5797)/W(5780) DIB ratio is more strongly correlatedwith W(CH)/E(B−V) than with W(CH+)/E(B−V). This result con-firms that ζ-type clouds (i.e. dense and λ5797 favoured) have ahigher molecular content (e.g. higher abundances of CH and H2).The CH/CH+ ratio is used to discriminate between quiescent andturbulent regions, confirming the division between σ and ζ-typeenvironments. This DIB ratio is thus related to the abundance ofmolecular species and dust properties inside the cloud cores.
We found a significant difference between the meanW(5797)/W(5780) ratio towards the dense ρOph cloud andtowards the lower dust density region to the west. The highdust density region consists predominantly of ζ-type sightlines,whereas (as expected) the low-density region contains mainlyσ-type lines of sight. This distinction was used to assign allsightlines to either σ or ζ type.
Radial velocities of atomic and molecular absorption linesreveal one main interstellar component (with possibly unre-solved small-scale structure) at approximately −9 km s−1, corre-sponding to the Upp Sco dust sheet at a distance of 110 to 150 pc.Another, much weaker, velocity component at ≈−22 km s−1,is linked to the tenuous foreground dust sheet at 50 pc.
A129, page 17 of 43
A&A 533, A129 (2011)
Asymmetries and widths of the Na i and K i line profiles sug-gests that the main velocity component may be resolved in nar-rower components at higher spectral resolution. The radial ve-locities for individual sightlines reveal velocity gradient in thedust sheet associated to Upp Sco. This could be seen as a differ-entially moving sheet, with the south-west corner fixed and thenorth-east corner moving towards the observer. For the sightlineswith the strongest DIBs, the atomic, molecular, and DIB radialvelocities are similar within uncertainties, indicating that thesespecies spatially co-exist with each other.
A simplified radiative transfer model of the main Upp Scodust sheet was used to compute the effective interstellar radi-ation field (ISRF) from CN and CH observations. Five (of theeight) stars that strongly contribute to the local ISRF are locatedin the lower-density region of the Upp Sco cloud complex, sub-stantiating the inferred strong radiation field. The most accuratevalues for IUV are derived if both CN and CH are detected, andtherefore these sightlines correspond to those probing denserζ-type regions. From the observed peak in the CH+/E(B−V) ra-tio for IUV ≈ 5 we can infer that UV pumping plays a rolein the production of CH+ in the Upp Sco region for diffuseclouds with sufficiently strong UV field and significant abun-dance of H2. The drop in CH/CH+ with increasing IUV is prob-ably due to lower CH abundances for the more tenuous, UV ex-posed clouds. In fact the effective radiation field, IUV, is aninverse function of the molecular hydrogen fraction, fH2 , de-rived from N(CH) and W(5780). And, log( fH2) is, as expected,proportional to log(nH/IUV). The W(5797)/W(5780) ratio ver-sus IUV relation in Upp Sco confirms that most of the sightlineswith low IUV values are of ζ-type for which also CN is detected,while only few ζ-type sightlines have large IUV. The average IUVfor σ-type sightlines is higher than for ζ-types, but the standarddeviation is relatively large for the poorly determined σ-typesightlines due to limited CN data. Exceptionally high S/N spec-tra are needed to probe the CN content of these most tenuousdiffuse clouds.
Our results indicate that the relative abundance of the λ5780DIB carrier increases with respect to the λ5797 DIB with anincrease in the effective strength of the interstellar UV radia-tion field. A possible scenario is that a sufficiently large UV fluxionises the molecule whose cation has an electronic transition at5780 Å. The λ5797 DIB carrier, on the other hand, is more ef-ficiently destroyed in regions with high IUV and is only able tosurvive in the deeper layers of the cloud. The behaviour of theλλ5780 and 5797 DIBs is thus strongly dependent on the localeffective UV radiation field (and consequently fH2 ) as is to beexpected for molecular carriers.
The scatter on the relation between DIB strength and red-dening can ultimately be translated to monitor the life cycle ofthe carriers as they get formed, excited, and destroyed through-out the complex interstellar cloud structure associated with theρ Oph cloud and the Upp Sco association. The main driver forthis cycle is the UV radiation field. More information is neededon the exact conditions of these diffuse clouds to disentangle ad-ditional (secondary) drivers. Measurements of additional atomicand molecular lines, such as C2, CN, H2, and CO, can improvethe constraints on the chemical networks and physical conditionsof individual clouds and thus improve our insight in the effects ofthese parameters on the abundance of DIB carriers. In additionto the two strong narrow DIBs at 5780 and 5797 Å discussedin this work, accurate – high S/N – observations of additionalnarrow and broad diffuse bands are essential to fully probe theeffects of changing environmental conditions on the ensembleof carriers giving rise to the DIB spectrum. Moreover, additional
detailed studies of the Upp Sco region need to be complementedwith similar studies of other specific Galactic and extra-galacticregions to probe a variety and range of different conditions thataffect formation and destruction of the DIB carriers.
Acknowledgements. We thank Jos de Bruijne for obtaining the FEROS spec-tra. D.A.I.V. thanks Paul Groot and Gijs Nelemans for stimulating discussions.P.E. is supported by the NASA Astrobiology Institute. Furthermore, we thankthe referee for a very thorough reading of the manuscript and many interestingand helpful suggestions that helped to improve this paper.
ReferencesAllen, M. M. 1994, ApJ, 424, 754Black, J. H., & van Dishoeck, E. F. 1987, ApJ, 322, 412Bohlin, R. C., Savage, B. D., & Drake, J. F. 1978, ApJ, 224, 132Cami, J., Sonnentrucker, P., Ehrenfreund, P., & Foing, B. H. 1997, A&A, 326,
822Cardelli, J. A. 1988, ApJ, 335, 177Cardelli, J. A., & Wallerstein, G. 1986, ApJ, 302, 492Cardelli, J. A., Clayton, G. C., & Mathis, J. S. 1989, ApJ, 345, 245Chalabaev, A., & Maillard, J. P. 1983, A&A, 127, 279Chlewicki, G., Van der Zwet, G. P., Van Ijzendoorn, L. J., Greenberg, J. M., &
Alvarez, P. P. 1986, ApJ, 305, 455Clayton, G. C., & Cardelli, J. A. 1988, AJ, 96, 695Cordiner, M. A., Cox, N. L. J., Trundle, C., et al. 2008a, A&A, 480, L13Cordiner, M. A., Smith, K. T., Cox, N. L. J., et al. 2008b, A&A, 492, L5Corradi, W. J. B., Franco, G. A. P., & Knude, J. 2004, MNRAS, 347, 1065Cox, N. L. J., & Patat, F. 2008, A&A, 485, L9Cox, N. L. J., & Spaans, M. 2006, A&A, 451, 973Cox, N. L. J., Kaper, L., Foing, B. H., & Ehrenfreund, P. 2005, A&A, 438, 187Cox, N. L. J., Cordiner, M. A., Cami, J., et al. 2006, A&A, 447, 991Cox, N. L. J., Cordiner, M. A., Ehrenfreund, P., et al. 2007, A&A, 470, 941Crane, P., Lambert, D. L., & Sheffer, Y. 1995, ApJS, 99, 107Crawford, I. A. 1989, MNRAS, 241, 575de Geus, E. J. 1992, A&A, 262, 258de Zeeuw, P. T., Hoogerwerf, R., de Bruijne, J. H. J., Brown, A. G. A., & Blaauw,
A. 1999, AJ, 117, 354Diplas, A., & Savage, B. D. 1994, ApJ, 427, 274Ehrenfreund, P., Cami, J., Jiménez-Vicente, J., et al. 2002, ApJ, 576, L117Federman, S. R. 1982, ApJ, 257, 125Federman, S. R., Danks, A. C., & Lambert, D. L. 1984, ApJ, 287, 219Federman, S. R., Strom, C. J., Lambert, D. L., et al. 1994, ApJ, 424, 772Fitzgerald, M. P. 1970, A&A, 4, 234Fitzpatrick, E. L., & Massa, D. 2007, ApJ, 663, 320Friedman, S. D., York, D. G., McCall, B. J., et al. 2011, ApJ, 727, 33Galazutdinov, G., Moutou, C., Musaev, F., & Krełowski, J. 2002, A&A, 384,
215Galazutdinov, G. A., Manicò, G., Pirronello, V., & Krełowski, J. 2004, MNRAS,
355, 169Galazutdinov, G., Lee, B., Song, I., Kazmierczak, M., & Krełowski, J. 2011,
MNRAS, 412, 1259Grasdalen, G. L., Strom, K. M., & Strom, S. E. 1973, ApJ, 184, L53Greene, T. P., & Young, E. T. 1992, ApJ, 395, 516Gummersbach, C. A., & Kaufer, A. 1996, The Hot Star Newsletter, 22, 16Heckman, T. M., & Lehnert, M. D. 2000, ApJ, 537, 690Herbig, G. H. 1993, ApJ, 407, 142Herbig, G. H. 1995, ARA&A, 33, 19Hobbs, L. M., York, D. G., Snow, T. P., et al. 2008, ApJ, 680, 1256Houk, N. 1982, in Michigan Spectral Survey, Ann Arbor, Dep. Astron., Univ.
Michigan, 3, 0Houk, N., & Smith-Moore, M. 1988, in Michigan Spectral Survey, Ann Arbor,
Dept. of Astronomy, Univ. Michigan, 4, 0Iglesias-Groth, S., Manchado, A., García-Hernández, D. A., González
Hernández, J. I., & Lambert, D. L. 2008, ApJ, 685, L55Iglesias-Groth, S., Manchado, A., Rebolo, R., et al. 2010, MNRAS, 407, 2157Jenniskens, P., Ehrenfreund, P., & Foing, B. 1994, A&A, 281, 517Joseph, C. L., Snow, Jr., T. P., Seab, C. G., & Crutcher, R. M. 1986, ApJ, 309,
771Jura, M. 1975, ApJ, 197, 581Kokkin, D. L., & Schmidt, W. T. 2006, J. Phys. Chem. A, 110, 6173Kouwenhoven, M. B. N., Brown, A. G. A., Zinnecker, H., Kaper, L., &
Portegies Zwart, S. F. 2005, A&A, 430, 137Krelowski, J. 1989, in Interstellar Dust, ed. L. J. Allamandola, & A. G. G. M.
Tielens, IAU Symp., 135, 67Krełowski, J., & Sneden, C. 1995, Diffuse Interstellar Bands in Individual
Sightlines, ASSL, 202, 13
A129, page 18 of 43
D. A. I. Vos et al.: Diffuse interstellar bands in Upper Scorpius
Krełowski, J., & Westerlund, B. E. 1988, A&A, 190, 339Krełowski, J., Snow, T. P., Seab, C. G., & Papaj, J. 1992, MNRAS, 258, 693Krełowski, J., Ehrenfreund, P., Foing, B. H., et al. 1999, A&A, 347, 235Larson, K. A., & Whittet, D. C. B. 2005, ApJ, 623, 897Lee, D.-H., Pak, S., Van Dyke Dixon, W., & van Dishoeck, E. F. 2007, ApJ, 655,
940Lewis, N. K., Cook, T. A., & Chakrabarti, S. 2005, ApJ, 619, 357Linnartz, H., Wehres, N., van Winckel, H., et al. 2010, A&A, 511, L3Lombardi, M., Lada, C. J., & Alves, J. 2008, A&A, 489, 143Maier, J. P., Walker, G. A. H., Bohlender, D. A., et al. 2011, ApJ, 726, 41Mamajek, E. E. 2008, Astron. Nachr., 329, 10Mattila, K. 1986, A&A, 160, 157McCall, B. J., Drosback, M. M., Thorburn, J. A., et al. 2010, ApJ, 708, 1628Megier, A., Aiello, S., Barsella, B., Casu, S., & Krełowski, J. 2001, MNRAS,
326, 1095Megier, A., Krełowski, J., & Weselak, T. 2005, MNRAS, 358, 563Morton, D. C. 2003, ApJS, 149, 205Motte, F., Andre, P., & Neri, R. 1998, A&A, 336, 150Pan, K., Federman, S. R., Sheffer, Y., & Andersson, B. 2005, ApJ, 633, 986Perryman, M. A. C., Lindegren, L., Kovalevsky, J., et al. 1997, A&A, 323, L49Preibisch, T., & Mamajek, E. 2008, The Nearest OB Association: Scorpius-
Centaurus (Sco OB2), ed. B. Reipurth, 235Preibisch, T., & Zinnecker, H. 2001, in From Darkness to Light: Origin and
Evolution of Young Stellar Clusters, ed. T. Montmerle, & P. André, ASPConf. Ser., 243, 791
Press, W., Teukolsky, S., Vetterling, W., & Flannery, B. 1992, Numerical Recipesin Fortran 77, Second Edition (Cambridge University Press)
Ritchey, A. M., Martinez, M., Pan, K., Federman, S. R., & Lambert, D. L. 2006,ApJ, 649, 788
Ritchey, A. M., Federman, S. R., & Lambert, D. L. 2011, ApJ, 728, 36Ruiterkamp, R., Cox, N. L. J., Spaans, M., et al. 2005, A&A, 432, 515Salama, F., Galazutdinov, G. A., Krełowski, J., Allamandola, L. J., & Musaev,
F. A. 1999, ApJ, 526, 265Salama, F., Galazutdinov, G. A., Krełowski, J., et al. 2011, ApJ, 728, 154Savage, B. D., Drake, J. F., Budich, W., & Bohlin, R. C. 1977, ApJ, 216, 291Schlegel, D. J., Finkbeiner, D. P., & Davis, M. 1998, ApJ, 500, 525
Schnee, S. L., Ridge, N. A., Goodman, A. A., & Li, J. G. 2005, ApJ, 634, 442Seab, C. G., & Snow, T. P. 1995, ApJ, 443, 698Sheffer, Y., Rogers, M., Federman, S. R., et al. 2008, ApJ, 687, 1075Słyk, K., Bondar, A. V., Galazutdinov, G. A., & Krełowski, J. 2008, MNRAS,
390, 1733Sneden, C., Woszczyk, A., & Krełowski, J. 1991, PASP, 103, 1005Snow, Jr., T. P., & Cohen, J. G. 1974, ApJ, 194, 313Snow, T. P., & McCall, B. J. 2006, ARA&A, 44, 367Snow, T. P., Destree, J. D., & Welty, D. E. 2008, ApJ, 679, 512Sollerman, J., Cox, N., Mattila, S., et al. 2005, A&A, 429, 559Spaans, M. 1995, Ph.D. Thesis, University of Leiden, Leiden, The NetherlandsSpaans, M. 1996, A&A, 307, 271Sujatha, N. V., Shalima, P., Murthy, J., & Henry, R. C. 2005, ApJ, 633, 257Thorburn, J. A., Hobbs, L. M., McCall, B. J., et al. 2003, ApJ, 584, 339Valencic, L. A., Clayton, G. C., & Gordon, K. D. 2004, ApJ, 616, 912Van Dishoeck, E. F., & Black, J. H. 1989, ApJ, 340, 273van Loon, J. T., Smith, K. T., McDonald, I., et al. 2009, MNRAS, 399, 195Vollmann, K., & Eversberg, T. 2006, Astron. Nachr., 327, 862Walborn, N. R., & Fitzpatrick, E. L. 1990, PASP, 102, 379Wegner, W. 2002, Baltic Astron., 11, 1Welty, D. E., Federman, S. R., Gredel, R., Thorburn, J. A., & Lambert, D. L.
2006, ApJS, 165, 138Weselak, T., Galazutdinov, G. A., Musaev, F. A., & Krełowski, J. 2004, A&A,
414, 949Weselak, T., Galazutdinov, G., Musaev, F., & Krełowski, J. 2008a, A&A, 479,
149Weselak, T., Galazutdinov, G. A., Musaev, F. A., & Krełowski, J. 2008b, A&A,
484, 381Whittet, D. C. B. 1974, MNRAS, 168, 371Wilking, B. A., Gagné, M., & Allen, L. E. 2008, Star Formation in the ρOphiuchi
Molecular Cloud, ed. Reipurth, B., 351Wilking, B. A., Schwartz, R. D., Fanetti, T. M., & Friel, E. D. 1997, PASP, 109,
549York, B. A., Ellison, S. L., Lawton, B., et al. 2006, ApJ, 647, L29Zhou, Z., Sfeir, M. Y., Zhang, L., et al. 2006, ApJ, 638, L105Zsargó, J., & Federman, S. R. 2003, ApJ, 589, 319
Pages 20 to 43 are available in the electronic edition of the journal at http://www.aanda.org
A129, page 19 of 43
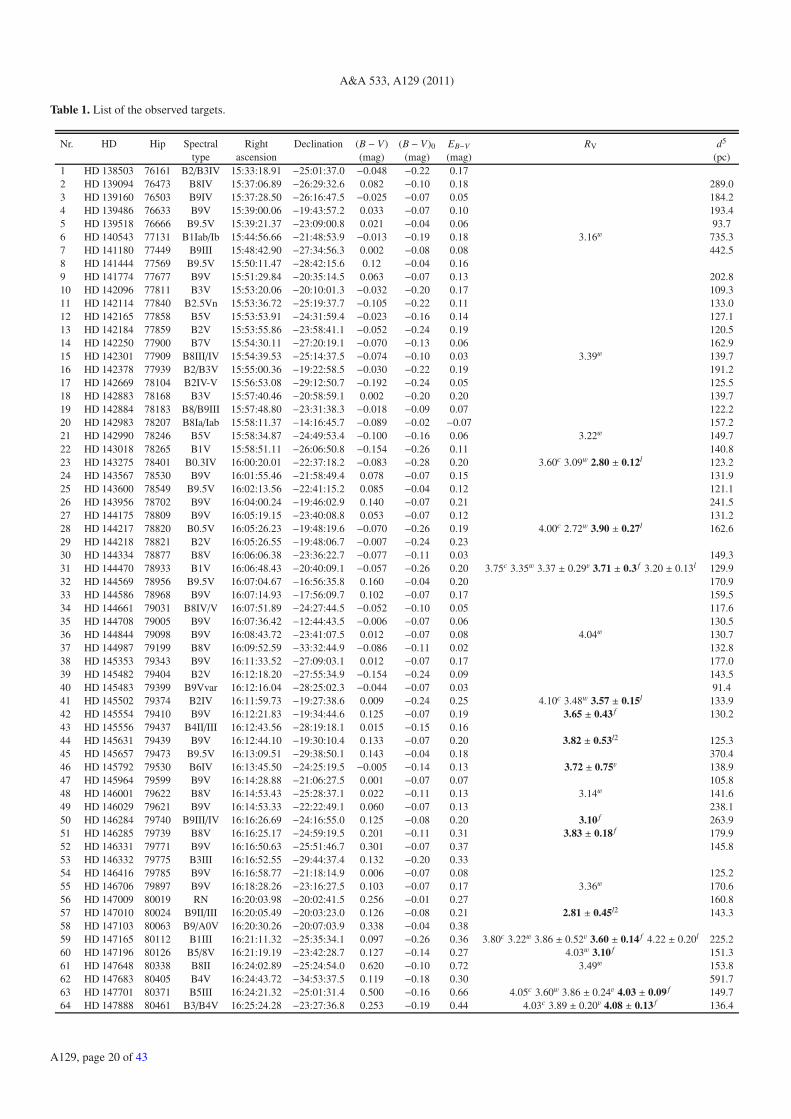
A&A 533, A129 (2011)
Table 1. List of the observed targets.
Nr. HD Hip Spectral Right Declination (B − V) (B − V)0 EB−V RV d5
type ascension (mag) (mag) (mag) (pc)1 HD 138503 76161 B2/B3IV 15:33:18.91 −25:01:37.0 −0.048 −0.22 0.172 HD 139094 76473 B8IV 15:37:06.89 −26:29:32.6 0.082 −0.10 0.18 289.03 HD 139160 76503 B9IV 15:37:28.50 −26:16:47.5 −0.025 −0.07 0.05 184.24 HD 139486 76633 B9V 15:39:00.06 −19:43:57.2 0.033 −0.07 0.10 193.45 HD 139518 76666 B9.5V 15:39:21.37 −23:09:00.8 0.021 −0.04 0.06 93.76 HD 140543 77131 B1Iab/Ib 15:44:56.66 −21:48:53.9 −0.013 −0.19 0.18 3.16w 735.37 HD 141180 77449 B9III 15:48:42.90 −27:34:56.3 0.002 −0.08 0.08 442.58 HD 141444 77569 B9.5V 15:50:11.47 −28:42:15.6 0.12 −0.04 0.169 HD 141774 77677 B9V 15:51:29.84 −20:35:14.5 0.063 −0.07 0.13 202.810 HD 142096 77811 B3V 15:53:20.06 −20:10:01.3 −0.032 −0.20 0.17 109.311 HD 142114 77840 B2.5Vn 15:53:36.72 −25:19:37.7 −0.105 −0.22 0.11 133.012 HD 142165 77858 B5V 15:53:53.91 −24:31:59.4 −0.023 −0.16 0.14 127.113 HD 142184 77859 B2V 15:53:55.86 −23:58:41.1 −0.052 −0.24 0.19 120.514 HD 142250 77900 B7V 15:54:30.11 −27:20:19.1 −0.070 −0.13 0.06 162.915 HD 142301 77909 B8III/IV 15:54:39.53 −25:14:37.5 −0.074 −0.10 0.03 3.39w 139.716 HD 142378 77939 B2/B3V 15:55:00.36 −19:22:58.5 −0.030 −0.22 0.19 191.217 HD 142669 78104 B2IV-V 15:56:53.08 −29:12:50.7 −0.192 −0.24 0.05 125.518 HD 142883 78168 B3V 15:57:40.46 −20:58:59.1 0.002 −0.20 0.20 139.719 HD 142884 78183 B8/B9III 15:57:48.80 −23:31:38.3 −0.018 −0.09 0.07 122.220 HD 142983 78207 B8Ia/Iab 15:58:11.37 −14:16:45.7 −0.089 −0.02 −0.07 157.221 HD 142990 78246 B5V 15:58:34.87 −24:49:53.4 −0.100 −0.16 0.06 3.22w 149.722 HD 143018 78265 B1V 15:58:51.11 −26:06:50.8 −0.154 −0.26 0.11 140.823 HD 143275 78401 B0.3IV 16:00:20.01 −22:37:18.2 −0.083 −0.28 0.20 3.60c 3.09w 2.80 ± 0.12l 123.224 HD 143567 78530 B9V 16:01:55.46 −21:58:49.4 0.078 −0.07 0.15 131.925 HD 143600 78549 B9.5V 16:02:13.56 −22:41:15.2 0.085 −0.04 0.12 121.126 HD 143956 78702 B9V 16:04:00.24 −19:46:02.9 0.140 −0.07 0.21 241.527 HD 144175 78809 B9V 16:05:19.15 −23:40:08.8 0.053 −0.07 0.12 131.228 HD 144217 78820 B0.5V 16:05:26.23 −19:48:19.6 −0.070 −0.26 0.19 4.00c 2.72w 3.90 ± 0.27l 162.629 HD 144218 78821 B2V 16:05:26.55 −19:48:06.7 −0.007 −0.24 0.2330 HD 144334 78877 B8V 16:06:06.38 −23:36:22.7 −0.077 −0.11 0.03 149.331 HD 144470 78933 B1V 16:06:48.43 −20:40:09.1 −0.057 −0.26 0.20 3.75c 3.35w 3.37 ± 0.29v 3.71 ± 0.3 f 3.20 ± 0.13l 129.932 HD 144569 78956 B9.5V 16:07:04.67 −16:56:35.8 0.160 −0.04 0.20 170.933 HD 144586 78968 B9V 16:07:14.93 −17:56:09.7 0.102 −0.07 0.17 159.534 HD 144661 79031 B8IV/V 16:07:51.89 −24:27:44.5 −0.052 −0.10 0.05 117.635 HD 144708 79005 B9V 16:07:36.42 −12:44:43.5 −0.006 −0.07 0.06 130.536 HD 144844 79098 B9V 16:08:43.72 −23:41:07.5 0.012 −0.07 0.08 4.04w 130.737 HD 144987 79199 B8V 16:09:52.59 −33:32:44.9 −0.086 −0.11 0.02 132.838 HD 145353 79343 B9V 16:11:33.52 −27:09:03.1 0.012 −0.07 0.17 177.039 HD 145482 79404 B2V 16:12:18.20 −27:55:34.9 −0.154 −0.24 0.09 143.540 HD 145483 79399 B9Vvar 16:12:16.04 −28:25:02.3 −0.044 −0.07 0.03 91.441 HD 145502 79374 B2IV 16:11:59.73 −19:27:38.6 0.009 −0.24 0.25 4.10c 3.48w 3.57 ± 0.15l 133.942 HD 145554 79410 B9V 16:12:21.83 −19:34:44.6 0.125 −0.07 0.19 3.65 ± 0.43 f 130.243 HD 145556 79437 B4II/III 16:12:43.56 −28:19:18.1 0.015 −0.15 0.1644 HD 145631 79439 B9V 16:12:44.10 −19:30:10.4 0.133 −0.07 0.20 3.82 ± 0.53l2 125.345 HD 145657 79473 B9.5V 16:13:09.51 −29:38:50.1 0.143 −0.04 0.18 370.446 HD 145792 79530 B6IV 16:13:45.50 −24:25:19.5 −0.005 −0.14 0.13 3.72 ± 0.75v 138.947 HD 145964 79599 B9V 16:14:28.88 −21:06:27.5 0.001 −0.07 0.07 105.848 HD 146001 79622 B8V 16:14:53.43 −25:28:37.1 0.022 −0.11 0.13 3.14w 141.649 HD 146029 79621 B9V 16:14:53.33 −22:22:49.1 0.060 −0.07 0.13 238.150 HD 146284 79740 B9III/IV 16:16:26.69 −24:16:55.0 0.125 −0.08 0.20 3.10 f 263.951 HD 146285 79739 B8V 16:16:25.17 −24:59:19.5 0.201 −0.11 0.31 3.83 ± 0.18 f 179.952 HD 146331 79771 B9V 16:16:50.63 −25:51:46.7 0.301 −0.07 0.37 145.853 HD 146332 79775 B3III 16:16:52.55 −29:44:37.4 0.132 −0.20 0.3354 HD 146416 79785 B9V 16:16:58.77 −21:18:14.9 0.006 −0.07 0.08 125.255 HD 146706 79897 B9V 16:18:28.26 −23:16:27.5 0.103 −0.07 0.17 3.36w 170.656 HD 147009 80019 RN 16:20:03.98 −20:02:41.5 0.256 −0.01 0.27 160.857 HD 147010 80024 B9II/III 16:20:05.49 −20:03:23.0 0.126 −0.08 0.21 2.81 ± 0.45l2 143.358 HD 147103 80063 B9/A0V 16:20:30.26 −20:07:03.9 0.338 −0.04 0.3859 HD 147165 80112 B1III 16:21:11.32 −25:35:34.1 0.097 −0.26 0.36 3.80c 3.22w 3.86 ± 0.52v 3.60 ± 0.14 f 4.22 ± 0.20l 225.260 HD 147196 80126 B5/8V 16:21:19.19 −23:42:28.7 0.127 −0.14 0.27 4.03w 3.10 f 151.361 HD 147648 80338 B8II 16:24:02.89 −25:24:54.0 0.620 −0.10 0.72 3.49w 153.862 HD 147683 80405 B4V 16:24:43.72 −34:53:37.5 0.119 −0.18 0.30 591.763 HD 147701 80371 B5III 16:24:21.32 −25:01:31.4 0.500 −0.16 0.66 4.05c 3.60w 3.86 ± 0.24v 4.03 ± 0.09 f 149.764 HD 147888 80461 B3/B4V 16:25:24.28 −23:27:36.8 0.253 −0.19 0.44 4.03c 3.89 ± 0.20v 4.08 ± 0.13 f 136.4
A129, page 20 of 43
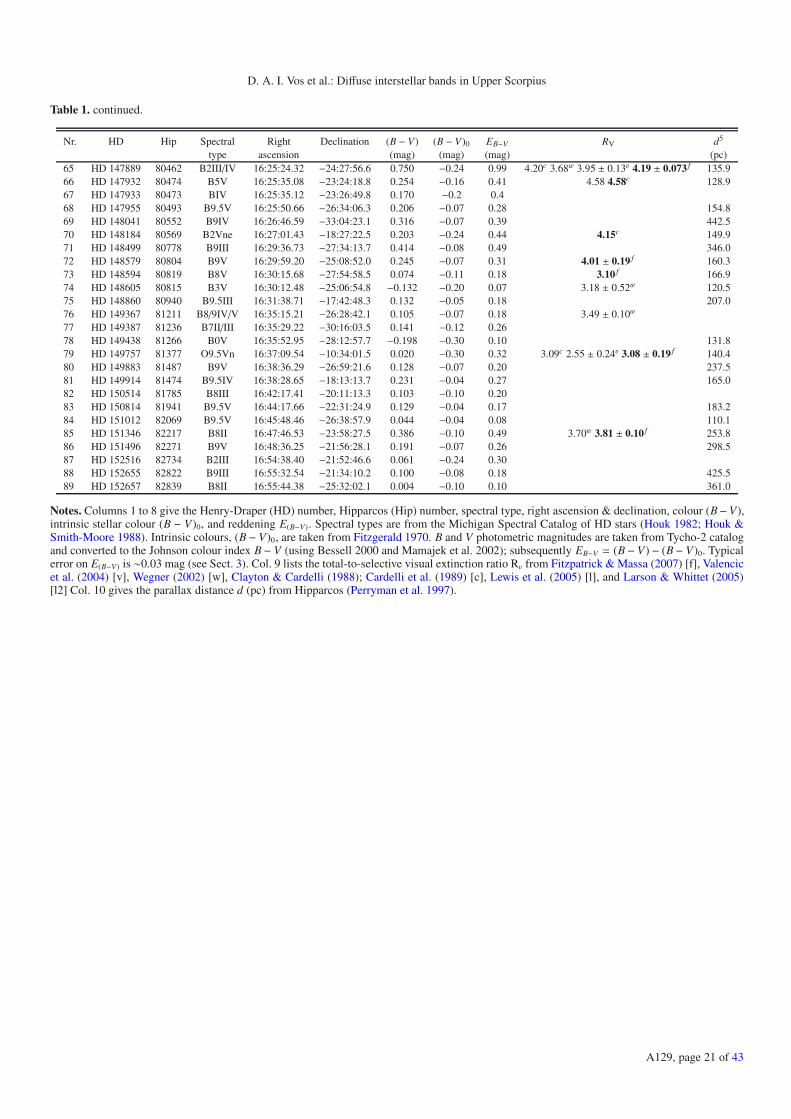
D. A. I. Vos et al.: Diffuse interstellar bands in Upper Scorpius
Table 1. continued.
Nr. HD Hip Spectral Right Declination (B − V) (B − V)0 EB−V RV d5
type ascension (mag) (mag) (mag) (pc)65 HD 147889 80462 B2III/IV 16:25:24.32 −24:27:56.6 0.750 −0.24 0.99 4.20c 3.68w 3.95 ± 0.13v 4.19 ± 0.073 f 135.966 HD 147932 80474 B5V 16:25:35.08 −23:24:18.8 0.254 −0.16 0.41 4.58 4.58c 128.967 HD 147933 80473 BIV 16:25:35.12 −23:26:49.8 0.170 −0.2 0.468 HD 147955 80493 B9.5V 16:25:50.66 −26:34:06.3 0.206 −0.07 0.28 154.869 HD 148041 80552 B9IV 16:26:46.59 −33:04:23.1 0.316 −0.07 0.39 442.570 HD 148184 80569 B2Vne 16:27:01.43 −18:27:22.5 0.203 −0.24 0.44 4.15c 149.971 HD 148499 80778 B9III 16:29:36.73 −27:34:13.7 0.414 −0.08 0.49 346.072 HD 148579 80804 B9V 16:29:59.20 −25:08:52.0 0.245 −0.07 0.31 4.01 ± 0.19 f 160.373 HD 148594 80819 B8V 16:30:15.68 −27:54:58.5 0.074 −0.11 0.18 3.10 f 166.974 HD 148605 80815 B3V 16:30:12.48 −25:06:54.8 −0.132 −0.20 0.07 3.18 ± 0.52w 120.575 HD 148860 80940 B9.5III 16:31:38.71 −17:42:48.3 0.132 −0.05 0.18 207.076 HD 149367 81211 B8/9IV/V 16:35:15.21 −26:28:42.1 0.105 −0.07 0.18 3.49 ± 0.10w
77 HD 149387 81236 B7II/III 16:35:29.22 −30:16:03.5 0.141 −0.12 0.2678 HD 149438 81266 B0V 16:35:52.95 −28:12:57.7 −0.198 −0.30 0.10 131.879 HD 149757 81377 O9.5Vn 16:37:09.54 −10:34:01.5 0.020 −0.30 0.32 3.09c 2.55 ± 0.24v 3.08 ± 0.19 f 140.480 HD 149883 81487 B9V 16:38:36.29 −26:59:21.6 0.128 −0.07 0.20 237.581 HD 149914 81474 B9.5IV 16:38:28.65 −18:13:13.7 0.231 −0.04 0.27 165.082 HD 150514 81785 B8III 16:42:17.41 −20:11:13.3 0.103 −0.10 0.2083 HD 150814 81941 B9.5V 16:44:17.66 −22:31:24.9 0.129 −0.04 0.17 183.284 HD 151012 82069 B9.5V 16:45:48.46 −26:38:57.9 0.044 −0.04 0.08 110.185 HD 151346 82217 B8II 16:47:46.53 −23:58:27.5 0.386 −0.10 0.49 3.70w 3.81 ± 0.10 f 253.886 HD 151496 82271 B9V 16:48:36.25 −21:56:28.1 0.191 −0.07 0.26 298.587 HD 152516 82734 B2III 16:54:38.40 −21:52:46.6 0.061 −0.24 0.3088 HD 152655 82822 B9III 16:55:32.54 −21:34:10.2 0.100 −0.08 0.18 425.589 HD 152657 82839 B8II 16:55:44.38 −25:32:02.1 0.004 −0.10 0.10 361.0
Notes. Columns 1 to 8 give the Henry-Draper (HD) number, Hipparcos (Hip) number, spectral type, right ascension & declination, colour (B−V),intrinsic stellar colour (B − V)0, and reddening E(B−V). Spectral types are from the Michigan Spectral Catalog of HD stars (Houk 1982; Houk &Smith-Moore 1988). Intrinsic colours, (B − V)0, are taken from Fitzgerald 1970. B and V photometric magnitudes are taken from Tycho-2 catalogand converted to the Johnson colour index B− V (using Bessell 2000 and Mamajek et al. 2002); subsequently EB−V = (B− V) − (B− V)0. Typicalerror on E(B−V) is ∼0.03 mag (see Sect. 3). Col. 9 lists the total-to-selective visual extinction ratio Rv from Fitzpatrick & Massa (2007) [f], Valencicet al. (2004) [v], Wegner (2002) [w], Clayton & Cardelli (1988); Cardelli et al. (1989) [c], Lewis et al. (2005) [l], and Larson & Whittet (2005)[l2] Col. 10 gives the parallax distance d (pc) from Hipparcos (Perryman et al. 1997).
A129, page 21 of 43

A&A 533, A129 (2011)Ta
ble
2.D
IBan
dat
omic
line
equi
vale
ntw
idth
s.
HD
Equ
ival
entw
idth
W(m
Å)
Lin
est
reng
thra
tios
f H2
I UVζ/σ
Subg
roup
λ57
80λ
5797
λ61
96λ
6379
λ66
13C
H(4
300)
CH+
(423
2)C
N(3
875)
Cai
(422
7)Ki(
7699
)Ki(
7665
)λ
5797/λ
5780λ
6196/λ
6613
CH/C
H+
1385
0398
.0±4
.224
.4±2
.215
.2±2
.415
.9±2
.135
.9±2
.70.
210
.6–
–48
.4±3
.863
.6±3
.60.
25±0
.02
0.42±0
.07
0.02
0.02
(50)
int
1390
9446
.0±3
.019
.7±2
.213
.0±1
.99.
5±1
.917
.3±1
.75.
74.
15.
0–
121.
7±3
.916
2.1±3
.40.
43±0
.06
0.75±0
.13
1.4
0.53
3.6
ζ
1391
60–
10.8±2
.9<
6.9
9.3±3
.121
.2±2
.91.
57.
1–
–25
.6±5
.839
.5±5
.9–
<0.
330.
21–
3.5
1394
8638
.5±6
.9<
11.8
<11
.8<
19.6
<15
.3–
––
–25
.9±9
.518
.5±8
.3<
0.32
––
––
1395
18<
17.6
<6
<6
<5.
1<
6–
––
–<
3.3
––
––
––
σ
1405
4312
3.0±5
.114
.7±4
.023
.7±3
.725
.0±3
.451
.6±4
.4–
––
–43
.6±6
.850
.0±8
.00.
12± 0
.03
0.46±0
.08
––
–σ
1411
8039
.3±4
.6<
10.3
11.7±2
.2<
12.6
9.5±2
.6–
––
–6.
3±5
.1–
<0.
261.
23±0
.40
––
–σ
1414
4443
.8±6
.312
.7±3
.79.
5±3
.5<
22.2
14.7±3
.3–
––
–49
.4±9
.051
.8±4
.80.
29±0
.09
0.64±0
.28
––
–ζ
1417
7482
.7±4
.115
.6±1
.910
.2±1
.69.
7±1
.828
.8±2
.31.
22.
5–
–24
.4±3
.122
.7±3
.80.
19±0
.02
0.35±0
.06
0.48
0.11
10.3
σ
1420
9689
.5±3
.113
.7±1
.65.
6±1
.2<
8.4
22.9±1
.7–
0.45
–5.
823
.0±3
.119
.0±2
.90.
15±0
.02
0.25±0
.05
–(9
.0)σ
Lowρ
1421
1465
.5±2
.812
.5±2
.48.
1±1
.2<
5.5
20.9±1
.41.
3–
––
22.4±2
.620
.1±4
.00.
19±0
.04
0.39±0
.06
–0.
157.
5σ
Lowρ
1421
6589
.5±3
.411
.3±1
.64.
0±1
.2<
9.7
14.3±1
.4–
––
–18
.8±4
.015
.7±3
.40.
13±0
.02
0.28±0
.09
––
–σ
Lowρ
1421
8474
.5±2
.715
.5±1
.57.
3±1
.210
.9±1
.819
.9±1
.82.
82.
0–
–32
.2±3
.248
.2±4
.40.
21±0
.02
0.36±0
.07
1.4
0.25
6.4
σL
owρ
1422
5034
.5±4
.5<
8.5
<10
.3<
11<
13.1
––
––
8.7±4
.2–
<0.
26–
––
–14
2301
61.0±3
.714
.1±2
.822
.1±2
.410
.1±2
.210
.6±2
.6–
––
–10
.5±2
.4–
0.23±0
.05
2.09±0
.56
––
–σ
Lowρ
1423
7887
.4±2
.814
.7±2
.210
.7±1
.16.
9±1
.817
.4±1
.60.
94.
2–
–22
.6±2
.123
.0±3
.70.
17±0
.03
0.61±0
.09
0.21
0.08
20.0
σL
owρ
1426
69<
11.4
<5.
5<
2.0
<4.
2<
3.1
––
––
4.5±2
.3–
––
––
–14
2883
95.1±2
.211
.5±1
.48.
1±1
.1<
7.8
24.4±1
.74.
910
.9–
–65
.9±2
.184
.1±3
.80.
12±0
.02
0.33±0
.05
0.45
0.32
3.7
σL
owρ
1428
8410
7.7±3
.113
.9±1
.811
.5±1
.315
.3±1
.228
.6±2
.21.
75.
8–
–35
.3±2
.344
.8±5
.70.
13±0
.02
0.40±0
.06
0.29
0.13
2.8
σL
owρ
1429
8381
.8±2
.39.
7±1
.58.
4±1
.1–
27.0±1
.5–
––
–7.
2±2
.66.
8±3
.30.
12±0
.02
0.31±0
.04
––
–σ
1429
9051
.5±2
.0<
10.1
12.9±1
.6<
6.9
10.1±1
.50.
94.
6–
–11
.3±2
.06.
8±2
.9<
0.20
1.28±0
.25
0.20
0.13
5.1
σL
owρ
1430
1828
.8±3
.0<
8.2
<7.
8<
11.5
10.5±2
.0–
––
–4.
7±2
.92.
6±2
.4<
0.28
0.74±0
.21
–[0
.08]
–14
3275
68.2±3
.120
.9±2
.27.
4±1
.512
.3±1
.520
.3±1
.21.
32.
1–
–30
.9±2
.241
.3±1
.80.
31±0
.04
0.36±0
.08
0.62
0.14
[0.1
1]11
.4ζ
Lowρ
1435
6716
2.5±3
.619
.8±2
.512
.1±2
.313
.2±2
.040
.1±2
.7–
––
–21
.0±3
.119
.0±3
.60.
12±0
.02
0.30±0
.06
––
–σ
Lowρ
1436
0081
.3±5
.317
.7±2
.48.
6±1
.613
.8±2
.519
.2±3
.0–
––
–30
.0±4
.046
.2±2
.80.
22±0
.03
0.45±0
.11
––
–σ
Lowρ
1439
5617
8.0±4
.519
.4±2
.817
.2±2
.017
.8±2
.449
.9±2
.2–
––
–23
.1±5
.829
.5±5
.00.
11±0
.02
0.34±0
.04
––
–σ
Lowρ
1441
7535
.8±3
.6<
2.7
11.9±3
.211
.4±2
.1<
5.7
––
––
5.4±2
.1–
<0.
08>
2.1
––
–L
owρ
1442
1715
2.3±2
.121
.6±1
.712
.7±0
.915
.6±1
.244
.4±1
.41.
44.
8–
1.2
23.1±2
.032
.3±2
.20.
14±0
.01
0.29±0
.02
0.29
0.08
13.3
σL
owρ
1442
1815
8.8±2
.317
.6±1
.814
.0±1
.019
.2±1
.442
.9±1
.10.
84.
7–
1.5
28.0±2
.033
.8±1
.50.
11±0
.01
0.33±0
.02
0.17
0.04
20.0
σL
owρ
1443
3452
.9±1
.512
.0±1
.518
.5±1
.28.
2±1
.610
.3±1
.7–
––
–4.
5±1
.7–
0.23±0
.03
1.79±0
.32
––
–σ
Lowρ
1444
7016
5.8±2
.128
.0±1
.619
.0±1
.026
.2±1
.258
.2±1
.53.
05.
9–
1.5
29.1± 1
.434
.8±2
.00.
17±0
.01
0.33±0
.02
0.51
0.14
[0.1
3]7.
0σ
Lowρ
1445
6986
.7±4
.811
.5±2
.711
.3±2
.218
.4±2
.725
.5±2
.9–
––
–29
.7±5
.230
.0±4
.50.
13±0
.03
0.44±0
.10
––
–σ
1445
8681
.7±3
.415
.0±2
.210
.0±1
.811
.1±2
.030
.8±2
.5–
––
–27
.2±2
.739
.7±2
.00.
18±0
.03
0.32±0
.06
––
–σ
1446
6157
.4±1
.69.
0±1
.4<
5.6
<5.
86.
9±1
.6–
––
–4.
1±2
.42.
4±2
.20.
16±0
.02
<0.
81–
––
σL
owρ
1447
0861
.0±2
.611
.8±2
.14.
8±1
.28.
5±1
.817
.3±2
.0–
––
–13
.1±2
.317
.5±3
.10.
19±0
.04
0.28±0
.08
––
–σ
1448
44–
<8.
0<
5.7
<8.
621
.3±1
.3–
––
–9.
0±1
.89.
5±3
.0–
<0.
27–
––
Lowρ
1449
87<
7.0
<7.
8<
4.6
<3.
47.
6±1
.4–
––
–4.
7±1
.5–
–0.
61±0
.13
––
–14
5353
95.5±2
.932
.7±1
.79.
0±1
.411
.5±1
.731
.8±1
.94.
17.
1–
1.8
48.9±2
.957
.0±3
.00.
34±0
.02
0.28±0
.05
0.58
0.28
5.1
ζ
1454
82<
10.3
<3
<1.
4<
4.4
4.6±1
.6–
––
–3.
0±1
.8–
–<
0.3
––
–14
5483
<13
.2<
12.2
<2.
3<
4.7
4.9±1
.4–
––
–7.
5±2
.1–
–<
0.47
––
–14
5502
166.
2±2
.035
.0±1
.515
.8±1
.133
.6±1
.257
.0±1
.72.
04.
1–
3.8
38.9±1
.155
.5±2
.00.
21±0
.01
0.28±0
.02
0.49
0.10
[0.0
9]8.
2σ
Lowρ
1455
5414
3.0±3
.825
.2±2
.016
.0±2
.024
.5±1
.848
.3±2
.01.
12.
7–
1.7
39.2±3
.547
.9±4
.10.
18±0
.01
0.33±0
.04
0.41
0.07
17.4
σL
owρ
1455
5610
8.5±5
.524
.0±3
.114
.9±2
.311
.3±2
.136
.9±3
.61.
82.
6–
–27
.9±3
.817
.6±4
.00.
22±0
.03
0.40±0
.07
0.69
0.13
6.5
σ
1456
3112
9.9±3
.727
.1±2
.114
.9±1
.719
.0±2
.036
.5±2
.33.
83.
8–
2.9
47.9±2
.361
.0±4
.00.
21±0
.02
0.41±0
.05
1.0
0.21
5.4
σL
owρ
1456
5797
.2±5
.834
.7±4
.310
.6±2
.829
.4±2
.757
.0±3
.35.
414
.1–
5.7
78.0±4
.193
.7±6
.90.
36±0
.05
0.19±0
.05
0.38
0.33
3.4
ζ
1457
9266
.0±2
.612
.8±1
.98.
9±1
.714
.1±1
.514
.6±1
.41.
50.
2–
–14
.4±1
.812
.9±2
.30.
19±0
.03
0.61±0
.13
7.5
0.17
7.7
σL
owρ
1459
6443
.1± 2
.38.
1±1
.43.
3±1
.17.
6±1
.316
.2±1
.9–
––
–4.
6±1
.7–
0.19±0
.03
0.21±0
.07
––
–σ
Lowρ
A129, page 22 of 43
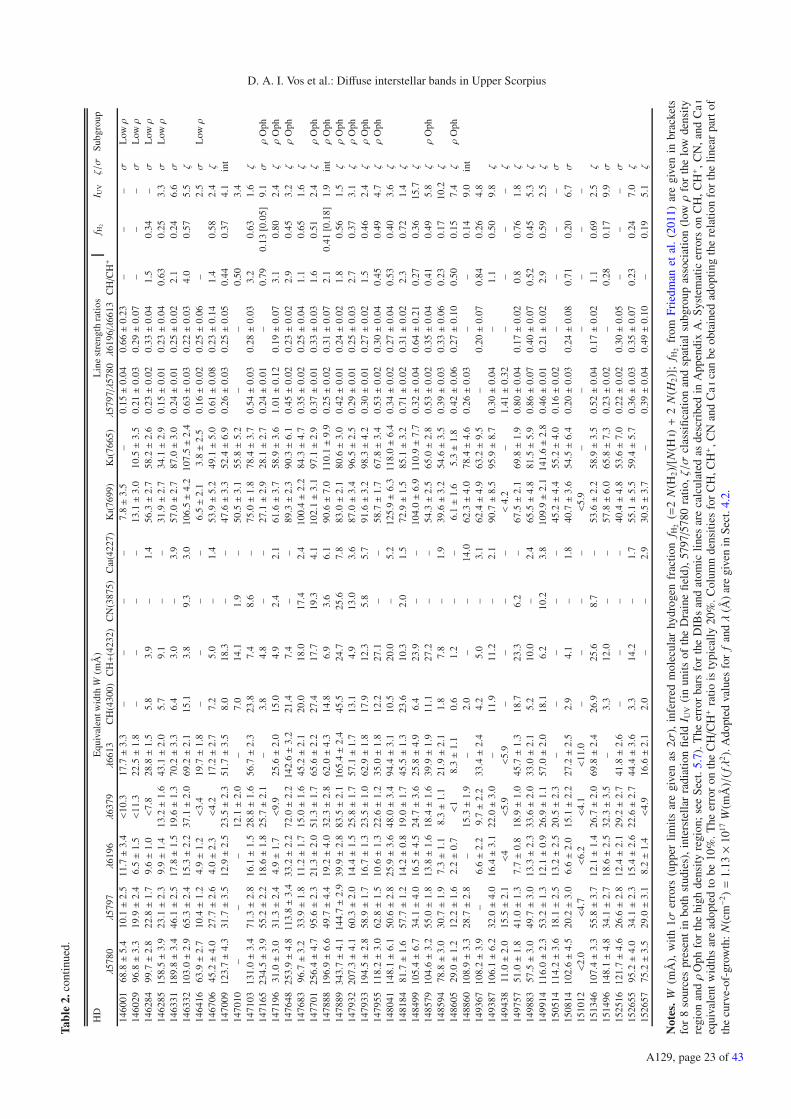
D. A. I. Vos et al.: Diffuse interstellar bands in Upper ScorpiusTa
ble
2.co
ntin
ued.
HD
Equ
ival
entw
idth
W(m
Å)
Lin
est
reng
thra
tios
f H2
I UVζ/σ
Subg
roup
λ57
80λ
5797
λ61
96λ
6379
λ66
13C
H(4
300)
CH+
(423
2)C
N(3
875)
Cai
(422
7)Ki(
7699
)Ki(
7665
)λ
5797/λ
5780λ
6196/λ
6613
CH/C
H+
1460
0168
.8±5
.410
.1±2
.511
.7±3
.4<
10.3
17.7±3
.3–
––
–7.
8±3
.5–
0.15±0
.04
0.66±0
.23
––
–σ
Lowρ
1460
2996
.8±3
.319
.9±2
.46.
5±1
.5<
11.3
22.5±1
.8–
––
–13
.1±3
.010
.5±3
.50.
21±0
.03
0.29±0
.07
––
–σ
Lowρ
1462
8499
.7±2
.822
.8±1
.79.
6±1
.0<
7.8
28.8±1
.55.
83.
9–
1.4
56.3±2
.758
.2±2
.60.
23±0
.02
0.33±0
.04
1.5
0.34
–σ
Lowρ
1462
8515
8.5±3
.923
.1±2
.39.
9±1
.413
.2±1
.643
.1±2
.05.
79.
1–
–31
.9±2
.734
.1±2
.90.
15±0
.01
0.23±0
.04
0.63
0.25
3.3σ
Lowρ
1463
3118
9.8±3
.446
.1±2
.517
.8±1
.519
.6±1
.370
.2±3
.36.
43.
0–
3.9
57.0±2
.787
.0±3
.00.
24±0
.01
0.25±0
.02
2.1
0.24
6.6σ
1463
3210
3.0±2
.965
.3±2
.415
.3±2
.237
.1±2
.069
.2±2
.115
.13.
89.
33.
010
6.5±4
.210
7.5±2
.40.
63±0
.03
0.22±0
.03
4.0
0.57
5.5
ζ
1464
1663
.9±2
.710
.4±1
.24.
9±1
.2<
3.4
19.7±1
.8–
––
–6.
5±2
.13.
8±2
.50.
16±0
.02
0.25±0
.06
–2.
5σ
Lowρ
1467
0645
.2±4
.027
.7±2
.64.
0±2
.3<
4.2
17.2±2
.77.
25.
0–
1.4
53.9±5
.249
.1±5
.00.
61±0
.08
0.23±0
.14
1.4
0.58
2.4
ζ
1470
0912
3.7±4
.331
.7±3
.512
.9±2
.523
.5±2
.351
.7±3
.58.
018
.3–
–47
.6±3
.352
.4±6
.90.
26±0
.03
0.25±0
.05
0.44
0.37
4.1
int
1470
10–
––
12.1±2
.0–
7.0
14.1
1.9
–50
.5±3
.155
.8±5
.2–
–0.
503.
414
7103
131.
0±3
.471
.3±2
.816
.1±1
.528
.8± 1
.656
.7±2
.323
.87.
48.
6–
75.0±1
.878
.4±3
.70.
54±0
.03
0.28±0
.03
3.2
0.63
1.6
ζ
1471
6523
4.5±3
.955
.2±2
.218
.6±1
.825
.7±2
.1–
3.8
4.8
––
27.1±2
.928
.1±2
.70.
24±0
.01
–0.
790.
13[0
.05]
9.1σ
ρO
ph14
7196
31.0±3
.031
.3±2
.44.
9±1
.7<
9.9
25.6±2
.015
.04.
92.
42.
161
.6±3
.758
.9±3
.61.
01±0
.12
0.19±0
.07
3.1
0.80
2.4
ζρ
Oph
1476
4825
3.9±4
.811
3.8±3
.433
.2±2
.272
.0±2
.214
2.6±3
.221
.47.
4–
–89
.3±2
.390
.3±6
.10.
45±0
.02
0.23±0
.02
2.9
0.45
3.2
ζρ
Oph
1476
8396
.7±3
.233
.9±1
.811
.2±1
.715
.0±1
.645
.2±2
.120
.018
.017
.42.
410
0.4±2
.284
.3±4
.70.
35±0
.02
0.25±0
.04
1.1
0.65
1.6
ζ
1477
0125
6.4±4
.795
.6±2
.321
.3±2
.051
.3±1
.765
.6± 2
.227
.417
.719
.34.
110
2.1±3
.197
.1±2
.90.
37±0
.01
0.33±0
.03
1.6
0.51
2.4
ζρ
Oph
1478
8819
6.9±6
.649
.7±4
.419
.2±4
.032
.3±2
.862
.0±4
.314
.86.
93.
66.
190
.6±7
.011
0.1±9
.90.
25±0
.02
0.31±0
.07
2.1
0.41
[0.1
8]1.
9in
tρ
Oph
1478
8934
3.7±4
.114
4.7±2
.939
.9±2
.883
.5±2
.116
5.4±2
.445
.524
.725
.67.
883
.0±2
.180
.6±3
.00.
42±0
.01
0.24±0
.02
1.8
0.56
1.5
ζρ
Oph
1479
3220
7.3±4
.160
.3±2
.014
.4±1
.525
.8±1
.757
.1±1
.713
.14.
913
.03.
687
.0±3
.496
.5±2
.50.
29±0
.01
0.25±0
.03
2.7
0.37
3.1
ζρ
Oph
1479
3319
4.5±2
.858
.9±1
.716
.7±1
.323
.5±1
.062
.9±1
.817
.912
.35.
85.
791
.6±3
.298
.3±4
.20.
30±0
.01
0.27±0
.02
1.5
0.46
2.4
ζρ
Oph
1479
5511
8.2±3
.062
.8±1
.510
.6± 1
.322
.6±1
.235
.0±1
.812
.227
.1–
–58
.7±1
.767
.8±3
.40.
53±0
.02
0.30±0
.04
0.45
0.49
4.7
ζρ
Oph
1480
4114
8.1±6
.150
.6±2
.825
.9±3
.648
.0±3
.494
.4±3
.110
.520
.0–
5.2
125.
9±6
.311
8.0±6
.40.
34±0
.02
0.27±0
.04
0.53
0.40
3.6
ζ
1481
8481
.7±1
.657
.7±1
.214
.2±0
.819
.0±1
.745
.5±1
.323
.610
.32.
01.
572
.9±1
.585
.1±3
.20.
71±0
.02
0.31±0
.02
2.3
0.72
1.4
ζ
1484
9910
5.4±6
.734
.1±4
.016
.5±4
.524
.7±3
.625
.8±4
.96.
423
.9–
–10
4.0±6
.911
0.9±7
.70.
32±0
.04
0.64±0
.21
0.27
0.36
15.7
ζ
1485
7910
4.6±3
.255
.0±1
.813
.8±1
.618
.4±1
.639
.9±1
.911
.127
.2–
–54
.3±2
.565
.0±2
.80.
53±0
.02
0.35±0
.04
0.41
0.49
5.8
ζρ
Oph
1485
9478
.8±3
.030
.7±1
.97.
3±1
.18.
3±1
.121
.9±2
.11.
87.
8–
1.9
39.6±3
.254
.6±3
.50.
39±0
.03
0.33±0
.06
0.23
0.17
10.2
ζ
1486
0529
.0±1
.212
.2±1
.62.
2±0
.7<
18.
3±1
.10.
61.
2–
–6.
1±1
.65.
3±1
.80.
42±0
.06
0.27±0
.10
0.50
0.15
7.4
ζρ
Oph
1488
6010
8.9±3
.328
.7±2
.8–
15.3±1
.9–
2.0
––
14.0
62.3±4
.078
.4±4
.60.
26±0
.03
––
0.14
9.0
int
1493
6710
8.2±3
.9–
6.6±2
.29.
7±2
.233
.4±2
.44.
25.
0–
3.1
62.4±4
.963
.2±9
.5–
0.20±0
.07
0.84
0.26
4.8
1493
8710
6.1±6
.232
.0±4
.016
.4±3
.122
.0±3
.0–
11.9
11.2
–2.
190
.7±8
.595
.9±8
.70.
30±0
.04
–1.
10.
509.
8ζ
1494
3811
.0±2
.015
.5±2
.1<
4<
5.9
<5.
9–
––
–<
4.2
–1.
41±0
.32
––
––
ζ
1497
5751
.0±1
.841
.0±1
.37.
7±0
.818
.9±1
.045
.7±1
.318
.723
.36.
2–
67.5±2
.169
.8±1
.90.
80±0
.04
0.17±0
.02
0.8
0.76
1.8
ζ
1498
8357
.5±3
.049
.7±3
.013
.3±2
.333
.6±2
.033
.0±2
.15.
210
.0–
2.4
65.5±4
.881
.5±5
.90.
86±0
.07
0.40±0
.07
0.52
0.45
5.3
ζ
1499
1411
6.0±2
.353
.2±1
.312
.1±0
.926
.9±1
.157
.0±2
.018
.16.
210
.23.
810
9.9±2
.114
1.6±2
.80.
46±0
.01
0.21±0
.02
2.9
0.59
2.5
ζ
1505
1411
4.2±3
.618
.1±2
.513
.2±2
.520
.5±2
.3–
––
––
45.2±4
.455
.2±4
.00.
16±0
.02
––
––
σ
1508
1410
2.6±4
.520
.2±3
.06.
6±2
.015
.1±2
.227
.2±2
.52.
94.
1–
1.8
40.7±3
.654
.5±6
.40.
20±0
.03
0.24±0
.08
0.71
0.20
6.7σ
1510
12<
2.0
<4.
7<
6.2
<4.
1<
11.0
––
––
<5.
9–
––
––
–15
1346
107.
4±3
.355
.8±3
.712
.1±1
.426
.7±2
.069
.8±2
.426
.925
.68.
7–
53.6±2
.258
.9±3
.50.
52±0
.04
0.17±0
.02
1.1
0.69
2.5
ζ
1514
9614
8.1±4
.834
.1±2
.718
.6±2
.532
.3±3
.5–
3.3
12.0
––
57.8±6
.065
.8±7
.30.
23±0
.02
–0.
280.
179.
9σ
1525
1612
1.7±4
.626
.6±2
.812
.4±2
.129
.2±2
.741
.8±2
.6–
––
–40
.4±4
.853
.6±7
.00.
22±0
.02
0.30±0
.05
––
–σ
1526
5595
.2±4
.034
.1±2
.315
.4±2
.622
.6±2
.744
.4±3
.63.
314
.2–
1.7
55.1±5
.559
.4±5
.70.
36±0
.03
0.35±0
.07
0.23
0.24
7.0
ζ
1526
5775
.2±3
.529
.0±3
.18.
2±1
.4<
4.9
16.6±2
.12.
0–
–2.
930
.5±3
.7–
0.39±0
.04
0.49±0
.10
–0.
195.
1ζ
Not
es.
W(m
Å),
wit
h1σ
erro
rs(u
pper
lim
its
are
give
nas
2σ),
infe
rred
mol
ecul
arhy
drog
enfr
acti
onf H
2(=
2N
(H2)/
[N(Hi)+
2N
(H2)]
;f H
2fr
omF
ried
man
etal
.(2
011)
are
give
nin
brac
kets
for
8so
urce
spr
esen
tin
both
stud
ies)
,in
ters
tell
arra
diat
ion
fiel
dI U
V(i
nun
its
ofth
eD
rain
efi
eld)
,579
7/57
80ra
tio,ζ/σ
clas
sifi
cati
onan
dsp
atia
lsu
bgro
upas
soci
atio
n(l
owρ
for
the
low
dens
ity
regi
onan
dρ
Oph
for
the
high
dens
ity
regi
on;
see
Sec
t.5.
7).T
heer
ror
bars
for
the
DIB
san
dat
omic
line
sar
eca
lcul
ated
asde
scri
bed
inA
ppen
dix
A.S
yste
mat
icer
rors
onC
H,C
H+,C
N,a
ndC
ai
equi
vale
ntw
idth
sar
ead
opte
dto
be10
%.T
heer
ror
onth
eC
H/C
H+
rati
ois
typi
call
y20
%.C
olum
nde
nsit
ies
for
CH
,CH+,C
Nan
dC
ai
can
beob
tain
edad
opti
ngth
ere
lati
onfo
rth
eli
near
part
ofth
ecu
rve-
of-g
row
th:
N(c
m−2
)=
1.13×1
017W
(mÅ
)/(fλ
2).
Ado
pted
valu
esfo
rf
andλ
(Å)
are
give
nin
Sec
t.4.
2.
A129, page 23 of 43
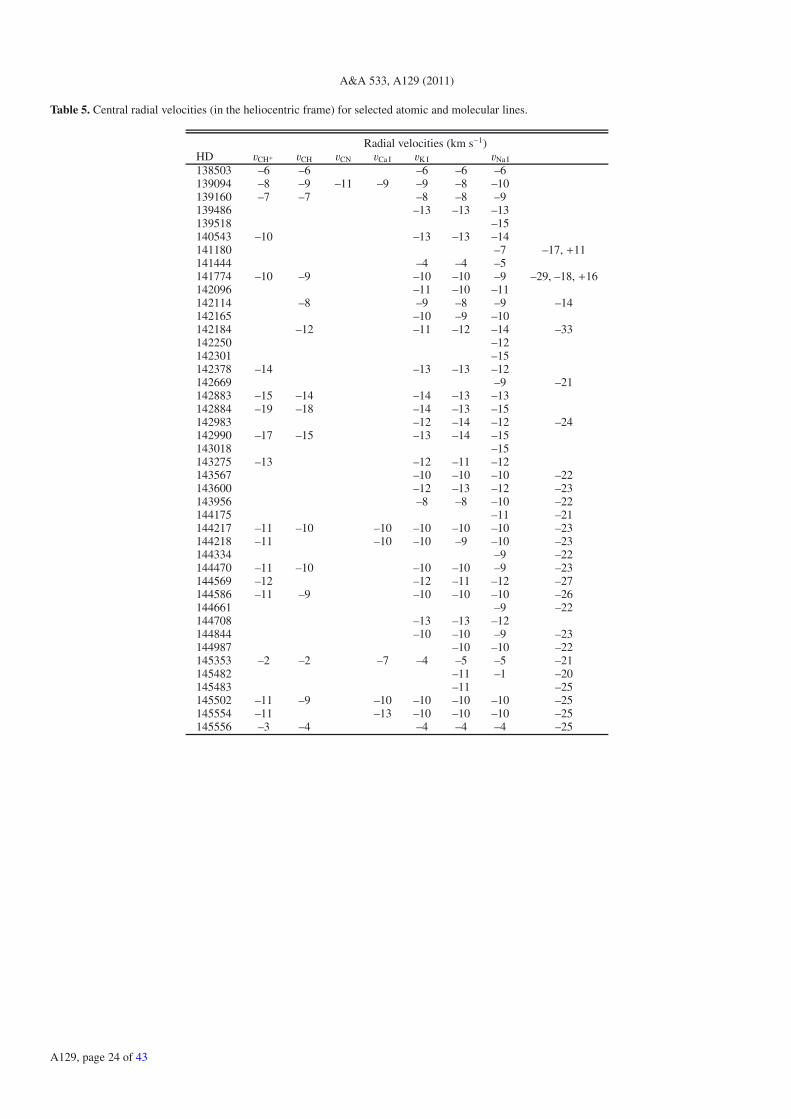
A&A 533, A129 (2011)
Table 5. Central radial velocities (in the heliocentric frame) for selected atomic and molecular lines.
Radial velocities (km s−1)HD vCH+ vCH vCN vCa I vK I vNa I
138503 –6 –6 –6 –6 –6139094 –8 –9 –11 –9 –9 –8 –10139160 –7 –7 –8 –8 –9139486 –13 –13 –13139518 –15140543 –10 –13 –13 –14141180 –7 –17, +11141444 –4 –4 –5141774 –10 –9 –10 –10 –9 –29, –18, +16142096 –11 –10 –11142114 –8 –9 –8 –9 –14142165 –10 –9 –10142184 –12 –11 –12 –14 –33142250 –12142301 –15142378 –14 –13 –13 –12142669 –9 –21142883 –15 –14 –14 –13 –13142884 –19 –18 –14 –13 –15142983 –12 –14 –12 –24142990 –17 –15 –13 –14 –15143018 –15143275 –13 –12 –11 –12143567 –10 –10 –10 –22143600 –12 –13 –12 –23143956 –8 –8 –10 –22144175 –11 –21144217 –11 –10 –10 –10 –10 –10 –23144218 –11 –10 –10 –9 –10 –23144334 –9 –22144470 –11 –10 –10 –10 –9 –23144569 –12 –12 –11 –12 –27144586 –11 –9 –10 –10 –10 –26144661 –9 –22144708 –13 –13 –12144844 –10 –10 –9 –23144987 –10 –10 –22145353 –2 –2 –7 –4 –5 –5 –21145482 –11 –1 –20145483 –11 –25145502 –11 –9 –10 –10 –10 –10 –25145554 –11 –13 –10 –10 –10 –25145556 –3 –4 –4 –4 –4 –25
A129, page 24 of 43
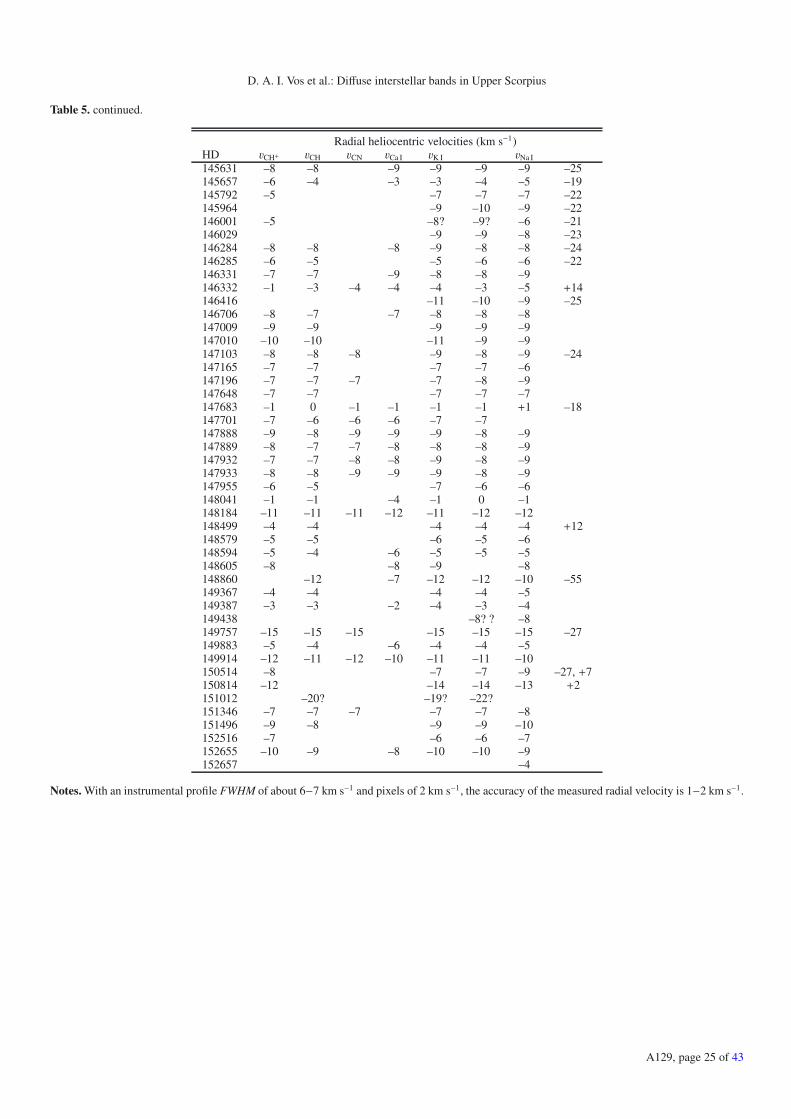
D. A. I. Vos et al.: Diffuse interstellar bands in Upper Scorpius
Table 5. continued.
Radial heliocentric velocities (km s−1)HD vCH+ vCH vCN vCa I vK I vNa I
145631 –8 –8 –9 –9 –9 –9 –25145657 –6 –4 –3 –3 –4 –5 –19145792 –5 –7 –7 –7 –22145964 –9 –10 –9 –22146001 –5 –8? –9? –6 –21146029 –9 –9 –8 –23146284 –8 –8 –8 –9 –8 –8 –24146285 –6 –5 –5 –6 –6 –22146331 –7 –7 –9 –8 –8 –9146332 –1 –3 –4 –4 –4 –3 –5 +14146416 –11 –10 –9 –25146706 –8 –7 –7 –8 –8 –8147009 –9 –9 –9 –9 –9147010 –10 –10 –11 –9 –9147103 –8 –8 –8 –9 –8 –9 –24147165 –7 –7 –7 –7 –6147196 –7 –7 –7 –7 –8 –9147648 –7 –7 –7 –7 –7147683 –1 0 –1 –1 –1 –1 +1 –18147701 –7 –6 –6 –6 –7 –7147888 –9 –8 –9 –9 –9 –8 –9147889 –8 –7 –7 –8 –8 –8 –9147932 –7 –7 –8 –8 –9 –8 –9147933 –8 –8 –9 –9 –9 –8 –9147955 –6 –5 –7 –6 –6148041 –1 –1 –4 –1 0 –1148184 –11 –11 –11 –12 –11 –12 –12148499 –4 –4 –4 –4 –4 +12148579 –5 –5 –6 –5 –6148594 –5 –4 –6 –5 –5 –5148605 –8 –8 –9 –8148860 –12 –7 –12 –12 –10 –55149367 –4 –4 –4 –4 –5149387 –3 –3 –2 –4 –3 –4149438 –8? ? –8149757 –15 –15 –15 –15 –15 –15 –27149883 –5 –4 –6 –4 –4 –5149914 –12 –11 –12 –10 –11 –11 –10150514 –8 –7 –7 –9 –27, +7150814 –12 –14 –14 –13 +2151012 –20? –19? –22?151346 –7 –7 –7 –7 –7 –8151496 –9 –8 –9 –9 –10152516 –7 –6 –6 –7152655 –10 –9 –8 –10 –10 –9152657 –4
Notes. With an instrumental profile FWHM of about 6−7 km s−1 and pixels of 2 km s−1, the accuracy of the measured radial velocity is 1−2 km s−1.
A129, page 25 of 43

A&A 533, A129 (2011)
HD146029λDIB ~ 5780 ÅEB-V = 0.15 magS/N = 235.1Wλ = 96.7 ± 3.3 mÅ
Wλ
ΔλΔλ λ2λ1 ΔλΔλ
Fig. A.1. Typical example illustrating the determination of the DIBequivalent width.
Appendix A: Error on equivalent width
.For the equivalent width measurement (W =
∫ λ2
λ1
(Fc−Fλ
Fc
)),
two integration borders λ1 and λ2 are selected for which the av-erage intensity in the continuum is derived in a window of widthΔλc = 1.4 Å centred on the borders (Fig. A.1).
The broader DIBs at 5778 and 5796 Å underlying the strong5780 and 5797 Å DIBs are largely removed from the spectra inthe local continuum normalisation. They are very weak, even forhigh E(B−V), and do not significantly contaminate the W mea-surements of the 5780 and 5797 Å DIBs.
Taking into account both the noise of the measured flux(σnoise) and the uncertainty in estimating the continuum (σc), theerror on the equivalent width is given according to Chalabaev &Maillard (1983) [CM83], in our notation:
σ2W = σ
2noise + σ
2continuum (A.1)
via Eq. (A.9) from CM83:
= Mδλ
SNR
2
(F j
Fc)2 +σ(Fc)
Fc
2
(Δλ −W)2 (A.2)
= Δλlineδλ
SNR2(F j)
2 +δλ
Δλc
1
SNR2(Δλline −W)2 (A.3)
=δλ
SNR2
(ΔλlineF2
j +(Δλline −W)2
Δλc
)(A.4)
=Δλ δλ
SNR2
(F j +
(Δλ −W)Δλ2
)(A.5)
≈ Δλ δλSNR2
(1 +
(Δλ −W)Δλ2
)(A.6)
σW ≈√Δλ δλ
SNR
√2 (A.7)
where we used the integration range λ2 − λ1 = M δλ = Δλline,
SNR is the signal-to-noise ratio (per pixel),σ2
Fc
F2c= 1
Nc SNR2 , Nc =
Δλ/δλ, δλ is the spectral dispersion in Å/pix, M the number ofpixels in the integration range, and we take Δλc ≈ Δλline = Δλ.In Eq. (A.6) the last term is approximately 2 as for shallow-weaklines W � Δλ = 3 Å. We have δλ = 0.03 Å, FWHM ≈ 1 Å(typical for a narrow DIB), so that Δλ ≈ 3 FWHM. This errorestimate yields similar results as when applying the error esti-mate in the weak line limit by Vollmann & Eversberg (2006)
(Eq. (A.X)): σW =√
2 (Δλ−W)SNR =
√2
SNR
√Δλδλ.
For the strong narrow K i line the approximation in Eq. (A.6)is not valid and the given σW will be an upper limit to thetrue σW .
Table B.1. Overview of possible significant contamination from stellarlines to the interstellar line equivalent width measurements.
Measured line Contaminating line Spectral types Contamination W
5780 Å Fe ii (5780.1 Å) B5V-A0V 13 mÅ′′ <B5V <4 mÅ
He i (5780.5 Å) O9V ∼2 mÅ6379 Å Ne ii (6379.6 Å) B0V, B1V, B2V 8, 22, 8 mÅCH (4300.3 Å) Ti ii (4300.0 Å) B5V 4 mÅ
′′ A0V 161 mÅCH+ (4232.5 Å) Fe ii (4232.8 Å) B2V <12 mÅ
′′ B5V ∼98 mÅA0V ∼300 mÅ
Si ii (4233.2 Å) B2V <12 mÅ
Appendix B: Contamination with the photosphericspectrum
In order to evaluate possible contamination from stellar lines tothe measured equivalent widths of the interstellar lines (bothDIBs and molecules) we have checked synthetic spectra ofB main-sequence (A0V, B5V, B2V, B0V, O9V) stars for thepresence of atmospheric lines in the regions of interest in thisstudy (see Gummersbach & Kaufer 1996, for details on the mod-els). A brief overview of the expected contamination is givenin Table B.1.
For the 5797, 6196 Å DIBs no contamination above the2 mÅ level is expected for these B-type main-sequence stars.The N ii line at 6610.6 Å present in spectra of O9V to B2V starsis clearly separated from the 6613 Å DIB at the spectral re-solving power of FEROS. Both the O ii line at 4303.6 Å andthe Fe ii line at 4303.2 Å are also well resolved from theCH 4300.3 Å line (the rest wavelength velocity difference ismore than 200 km s−1). For CH (4300.3 Å) the contamina-tion in A0V spectra may be severe due to the presence of Ti ii,however in that case also the Fe ii line at 4303.2 Å should beclearly present (with W ∼ 200 mÅ). Strong Fe i lines appearin A0V spectra at 3872.5 Å and 3878.6 Å, however, these arealso clearly separated from the interstellar CN line (3874.6 Å).The velocity profile plots cover a region of ±0.6 Å around theCN line. Also the weak to strong (Wtotal ∼ 34 to ∼185 mÅ)C ii lines around 3876.0−3876.7 Å fall outside the plotted win-dow. Only the Ne ii line at 3875.3 Å is relatively close to theCN line (with rest wavelength difference of 54 km s−1).
There are several ways to investigate the potential prob-lem of contamination. For example, the line widths of all stel-lar lines are set by the rotational velocity (v sin i), whereas thedi-atomic lines have intrinsically small widths, and can thus bedistinguished from each other. Also, the radial velocities of thestellar and interstellar lines are (in virtually all cases) different.Therefore, any (di)atomic line with a velocity significantly dif-ferent from e.g. that of the K i doublet (no contamination ex-pected) is suspect. Furthermore, in the case of relatively strongCH+ line, the CH+ transition at 3957.7 Å can be used to ver-ify and confirm the abundance of CH+. For the relatively broadDIBs this differentiation due to velocity differences is less se-cure. Fortunately, the contamination expected at the DIB wave-lengths is very low.
A129, page 26 of 43
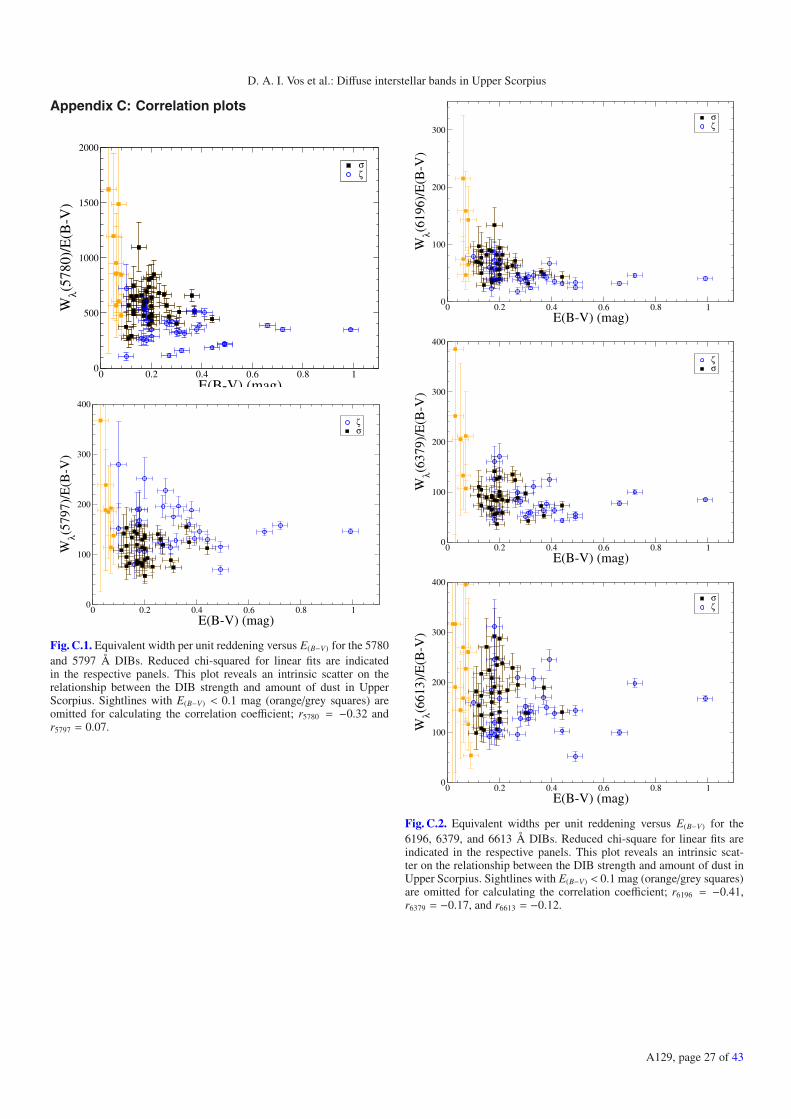
D. A. I. Vos et al.: Diffuse interstellar bands in Upper Scorpius
Appendix C: Correlation plots
0 0.2 0.4 0.6 0.8 1E(B-V) (mag)
0
500
1000
1500
2000
Wλ(5
780)
/E(B
-V)
σζ
0 0.2 0.4 0.6 0.8 1E(B-V) (mag)
0
100
200
300
400
Wλ(5
797)
/E(B
-V)
ζσ
Fig. C.1. Equivalent width per unit reddening versus E(B−V) for the 5780and 5797 Å DIBs. Reduced chi-squared for linear fits are indicatedin the respective panels. This plot reveals an intrinsic scatter on therelationship between the DIB strength and amount of dust in UpperScorpius. Sightlines with E(B−V) < 0.1 mag (orange/grey squares) areomitted for calculating the correlation coefficient; r5780 = −0.32 andr5797 = 0.07.
0 0.2 0.4 0.6 0.8 1E(B-V) (mag)
0
100
200
300
Wλ(6
196)
/E(B
-V)
σζ
0 0.2 0.4 0.6 0.8 1E(B-V) (mag)
0
100
200
300
400
Wλ(6
379)
/E(B
-V)
ζσ
0 0.2 0.4 0.6 0.8 1E(B-V) (mag)
0
100
200
300
400
Wλ(6
613)
/E(B
-V)
σζ
Fig. C.2. Equivalent widths per unit reddening versus E(B−V) for the6196, 6379, and 6613 Å DIBs. Reduced chi-square for linear fits areindicated in the respective panels. This plot reveals an intrinsic scat-ter on the relationship between the DIB strength and amount of dust inUpper Scorpius. Sightlines with E(B−V) < 0.1 mag (orange/grey squares)are omitted for calculating the correlation coefficient; r6196 = −0.41,r6379 = −0.17, and r6613 = −0.12.
A129, page 27 of 43
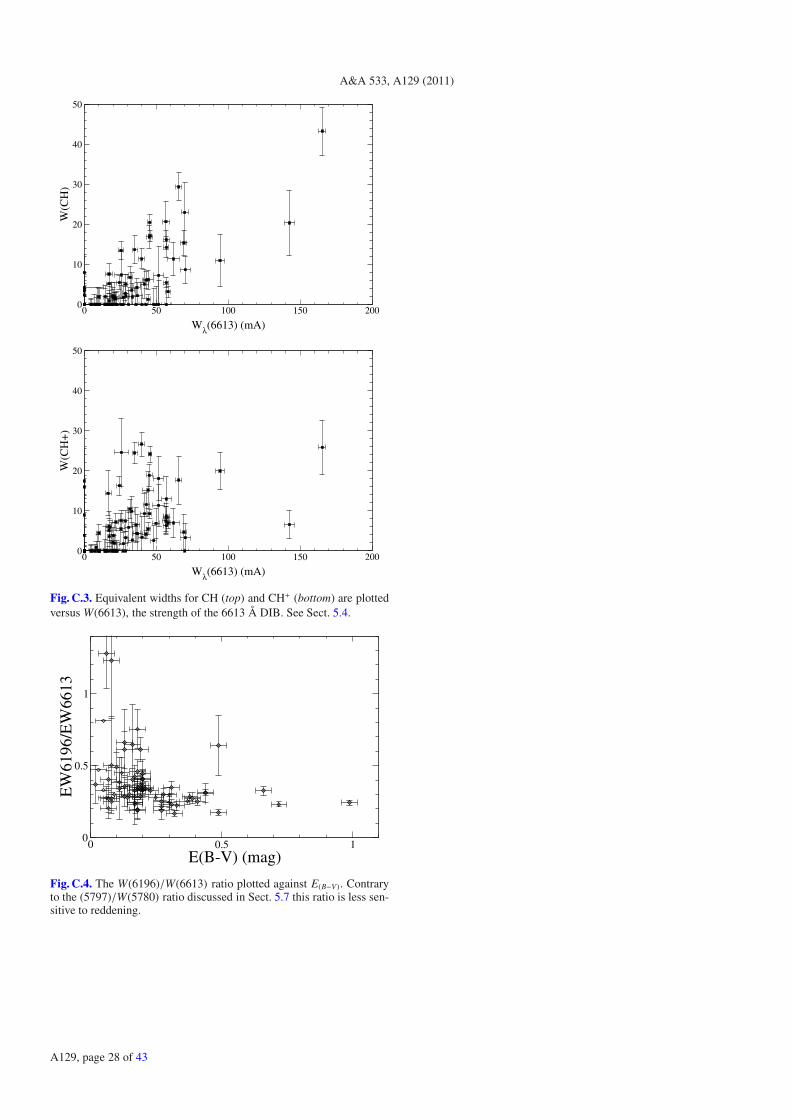
A&A 533, A129 (2011)
0 50 100 150 200
Wλ(6613) (mA)
0
10
20
30
40
50
W(C
H)
0 50 100 150 200
Wλ(6613) (mA)
0
10
20
30
40
50
W(C
H+
)
Fig. C.3. Equivalent widths for CH (top) and CH+ (bottom) are plottedversus W(6613), the strength of the 6613 Å DIB. See Sect. 5.4.
0 0.5 1E(B-V) (mag)
0
0.5
1
EW
6196
/EW
6613
Fig. C.4. The W(6196)/W(6613) ratio plotted against E(B−V). Contraryto the (5797)/W(5780) ratio discussed in Sect. 5.7 this ratio is less sen-sitive to reddening.
A129, page 28 of 43
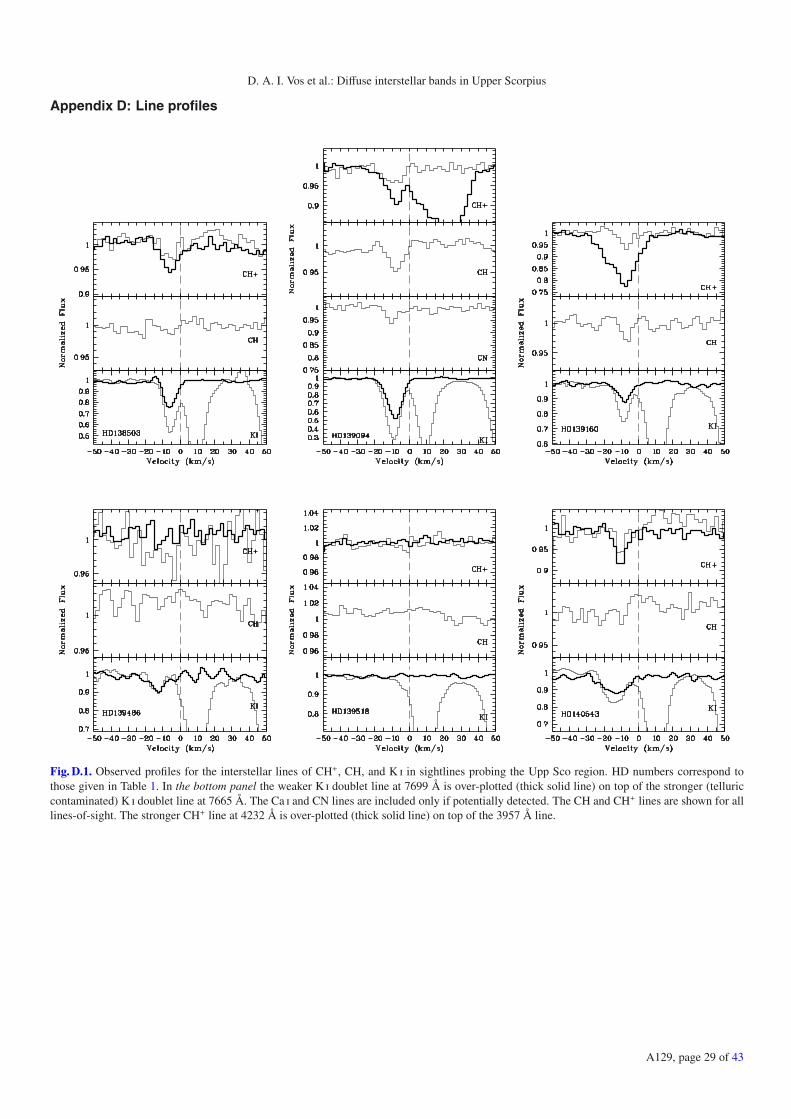
D. A. I. Vos et al.: Diffuse interstellar bands in Upper Scorpius
Appendix D: Line profiles
Fig. D.1. Observed profiles for the interstellar lines of CH+, CH, and K i in sightlines probing the Upp Sco region. HD numbers correspond tothose given in Table 1. In the bottom panel the weaker K i doublet line at 7699 Å is over-plotted (thick solid line) on top of the stronger (telluriccontaminated) K i doublet line at 7665 Å. The Ca i and CN lines are included only if potentially detected. The CH and CH+ lines are shown for alllines-of-sight. The stronger CH+ line at 4232 Å is over-plotted (thick solid line) on top of the 3957 Å line.
A129, page 29 of 43
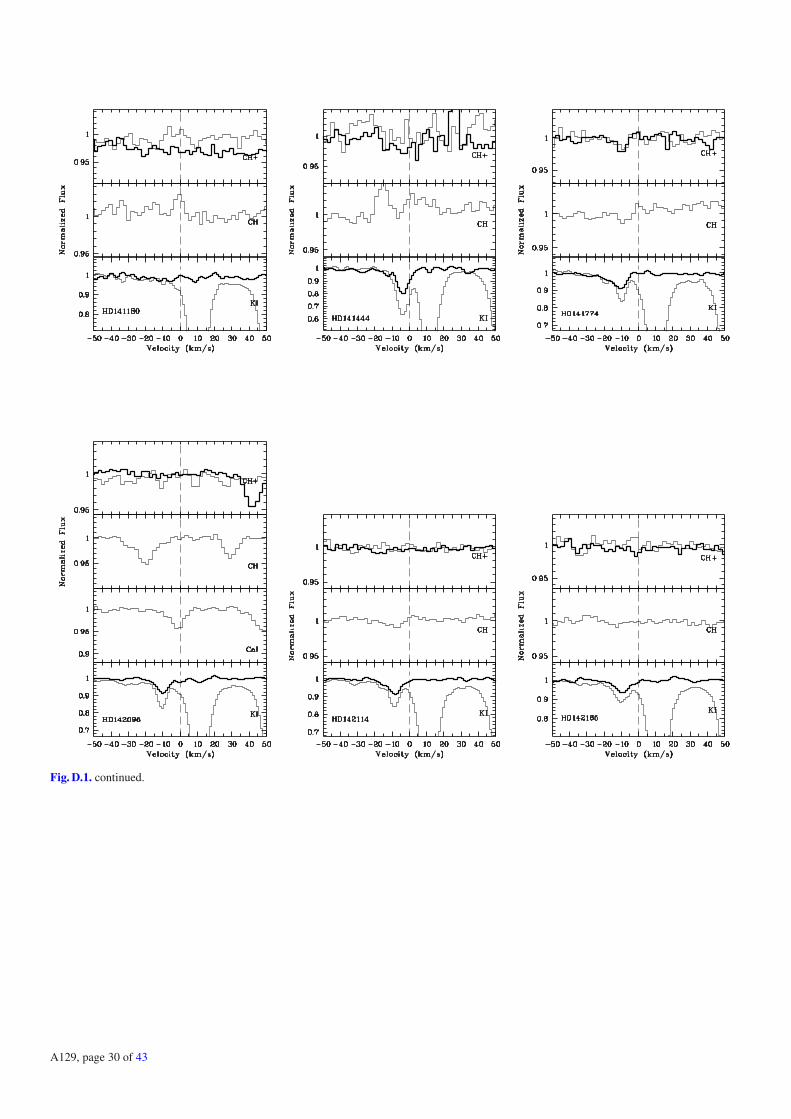
A&A 533, A129 (2011)
Fig. D.1. continued.
A129, page 30 of 43

D. A. I. Vos et al.: Diffuse interstellar bands in Upper Scorpius
Fig. D.1. continued.
A129, page 31 of 43
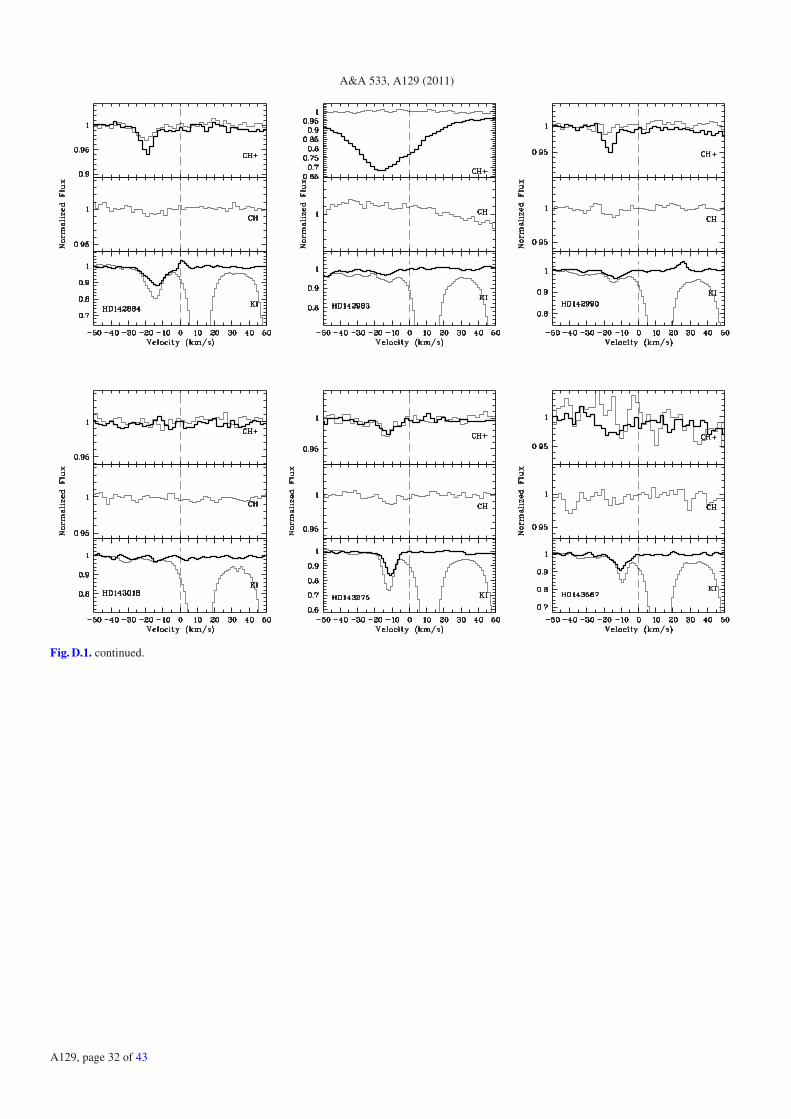
A&A 533, A129 (2011)
Fig. D.1. continued.
A129, page 32 of 43

D. A. I. Vos et al.: Diffuse interstellar bands in Upper Scorpius
Fig. D.1. continued.
A129, page 33 of 43
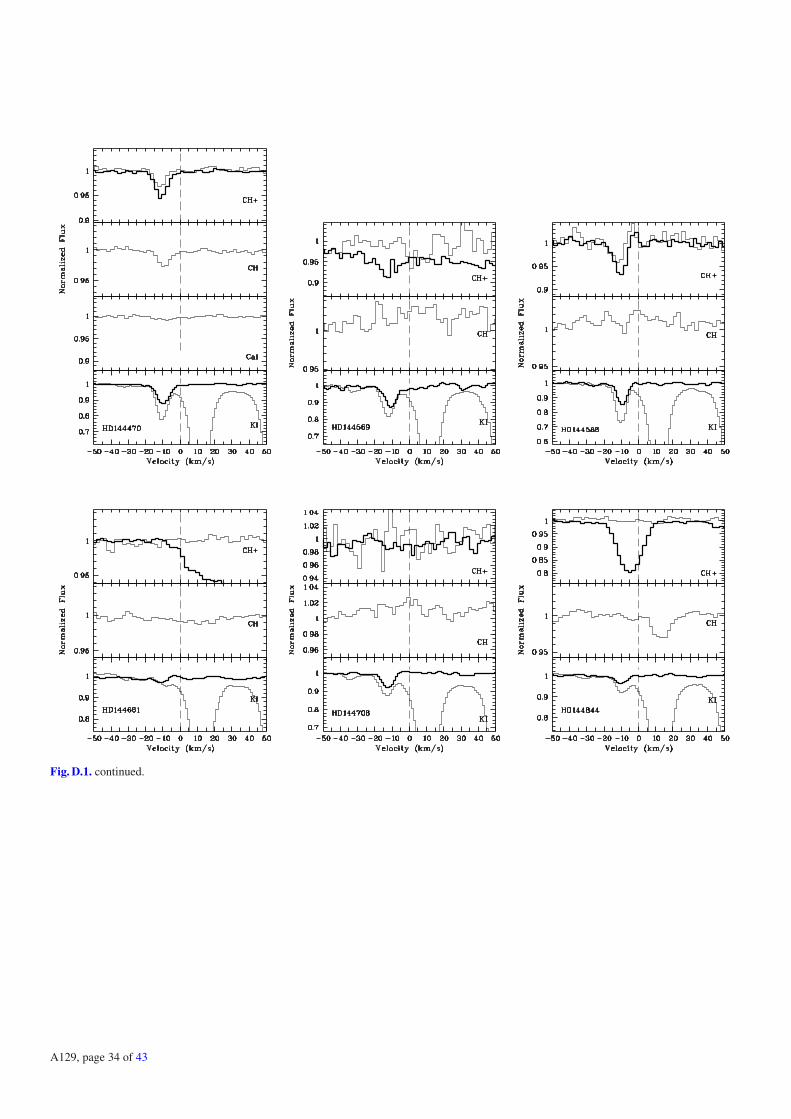
A&A 533, A129 (2011)
Fig. D.1. continued.
A129, page 34 of 43
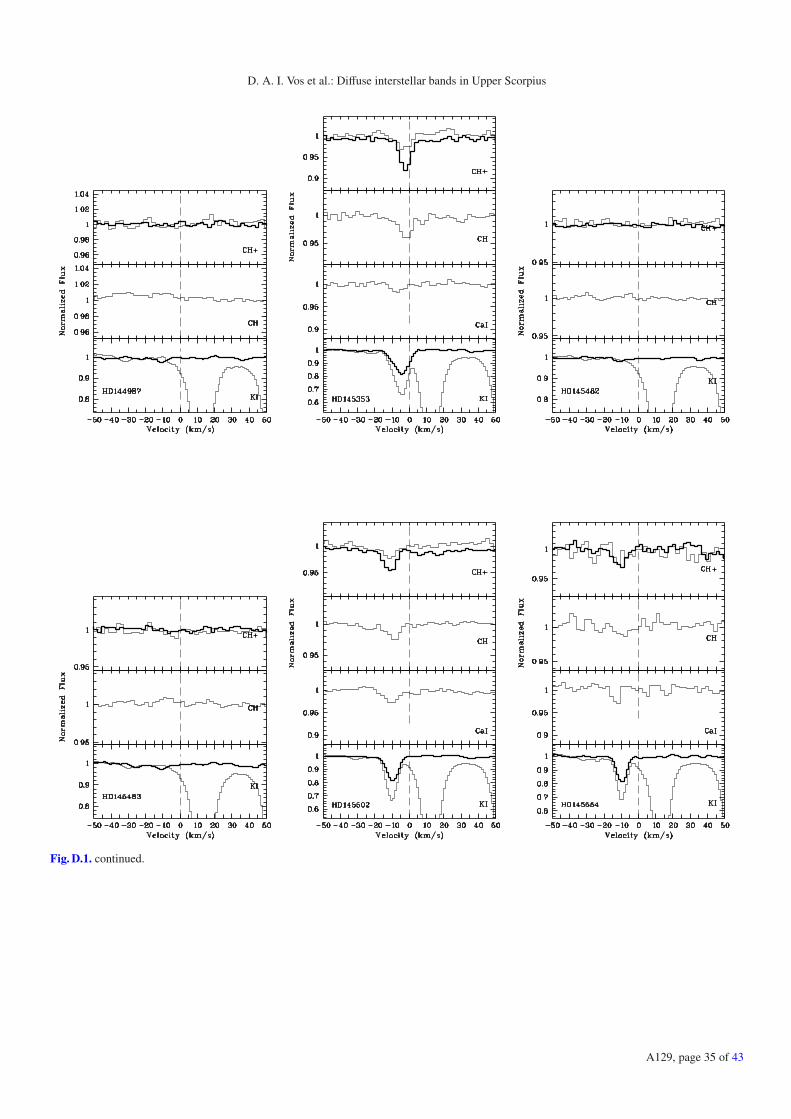
D. A. I. Vos et al.: Diffuse interstellar bands in Upper Scorpius
Fig. D.1. continued.
A129, page 35 of 43
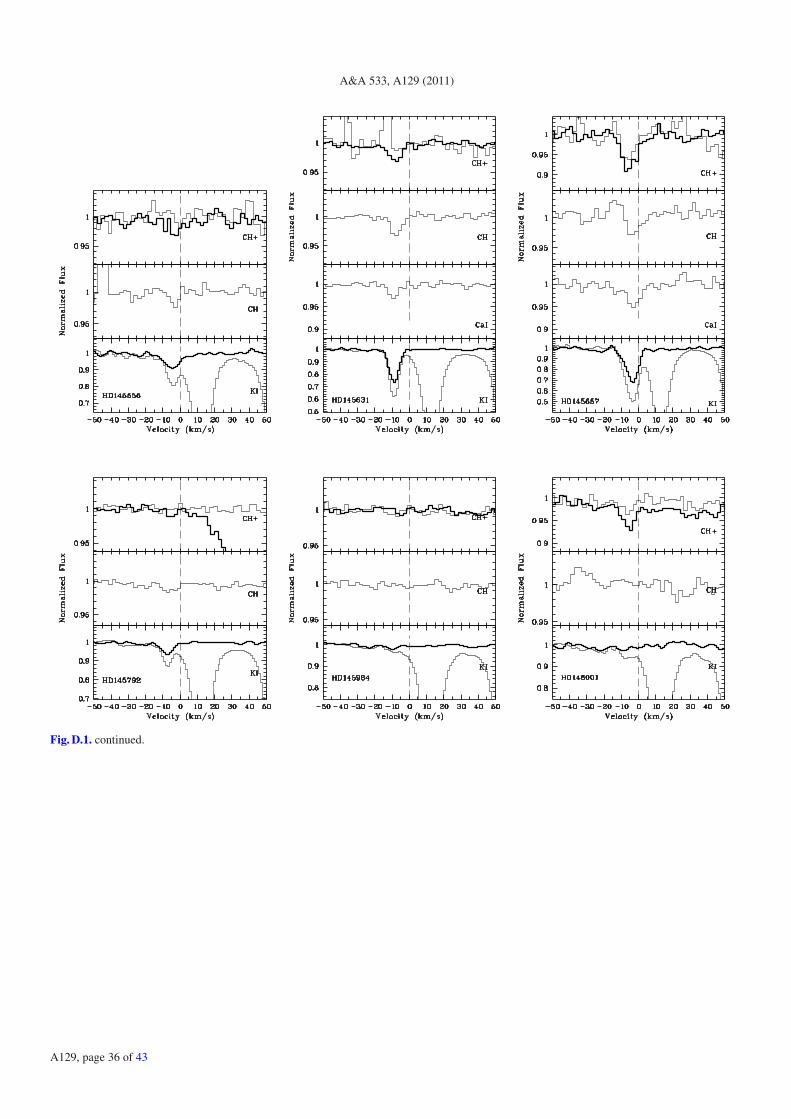
A&A 533, A129 (2011)
Fig. D.1. continued.
A129, page 36 of 43
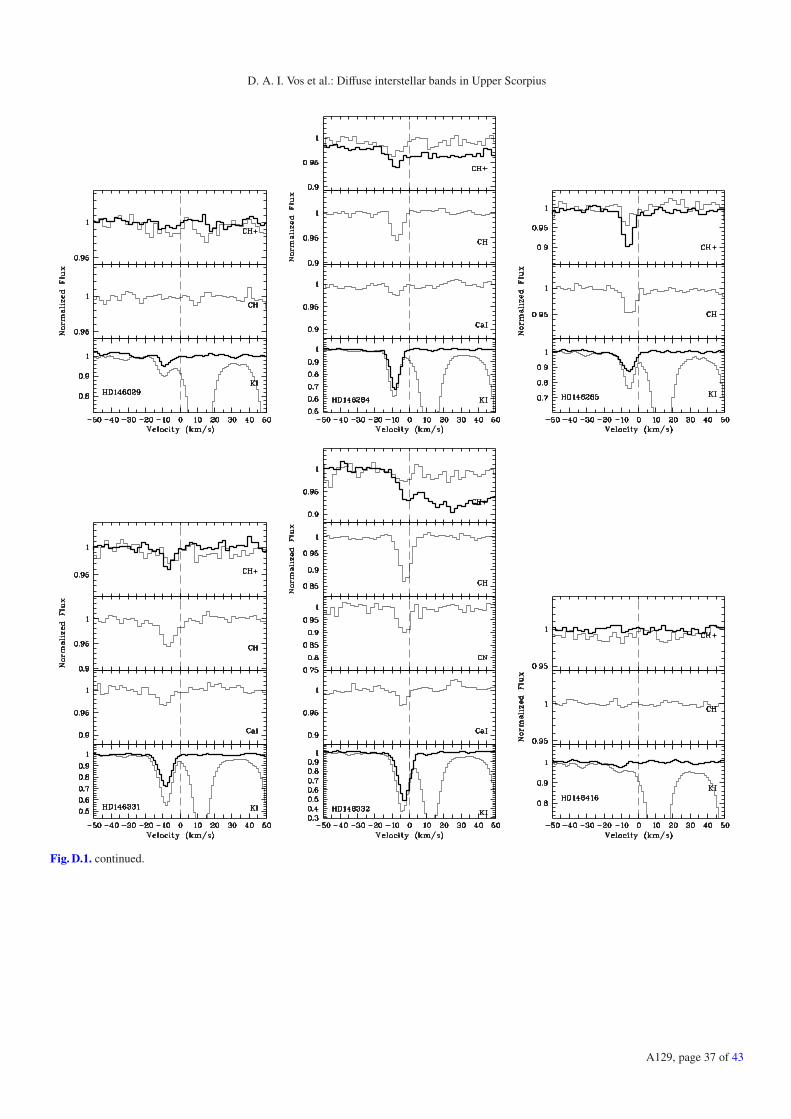
D. A. I. Vos et al.: Diffuse interstellar bands in Upper Scorpius
Fig. D.1. continued.
A129, page 37 of 43
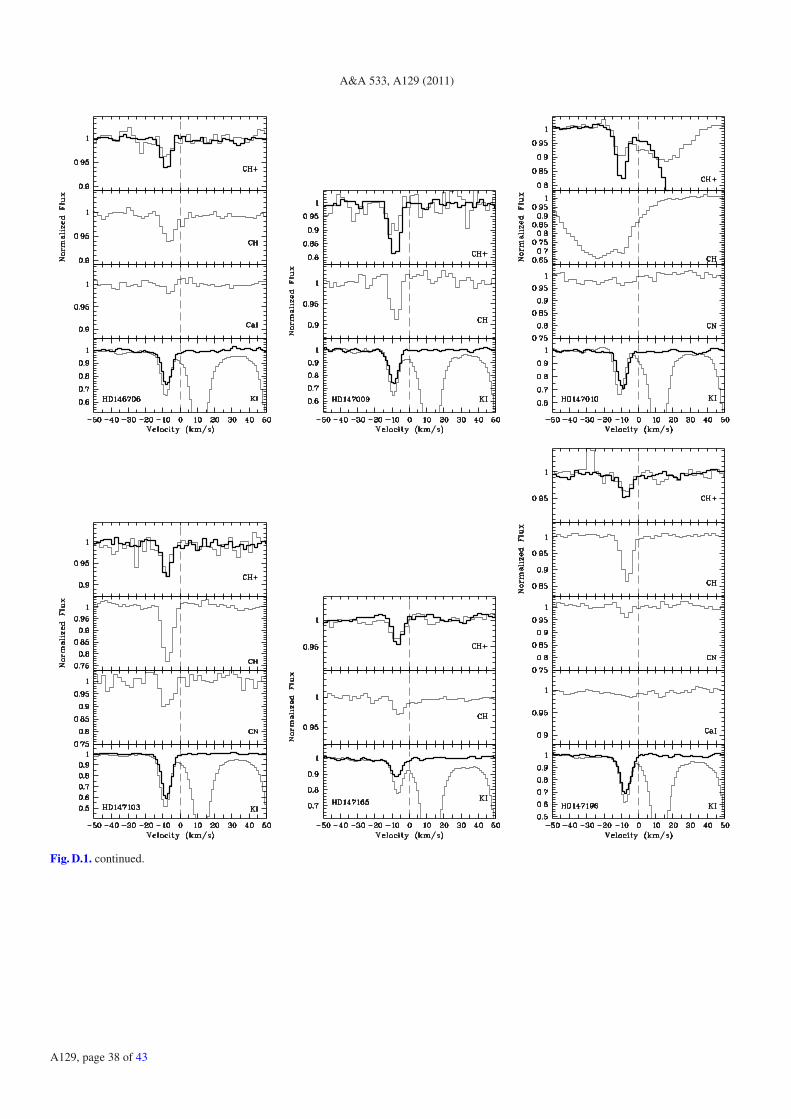
A&A 533, A129 (2011)
Fig. D.1. continued.
A129, page 38 of 43
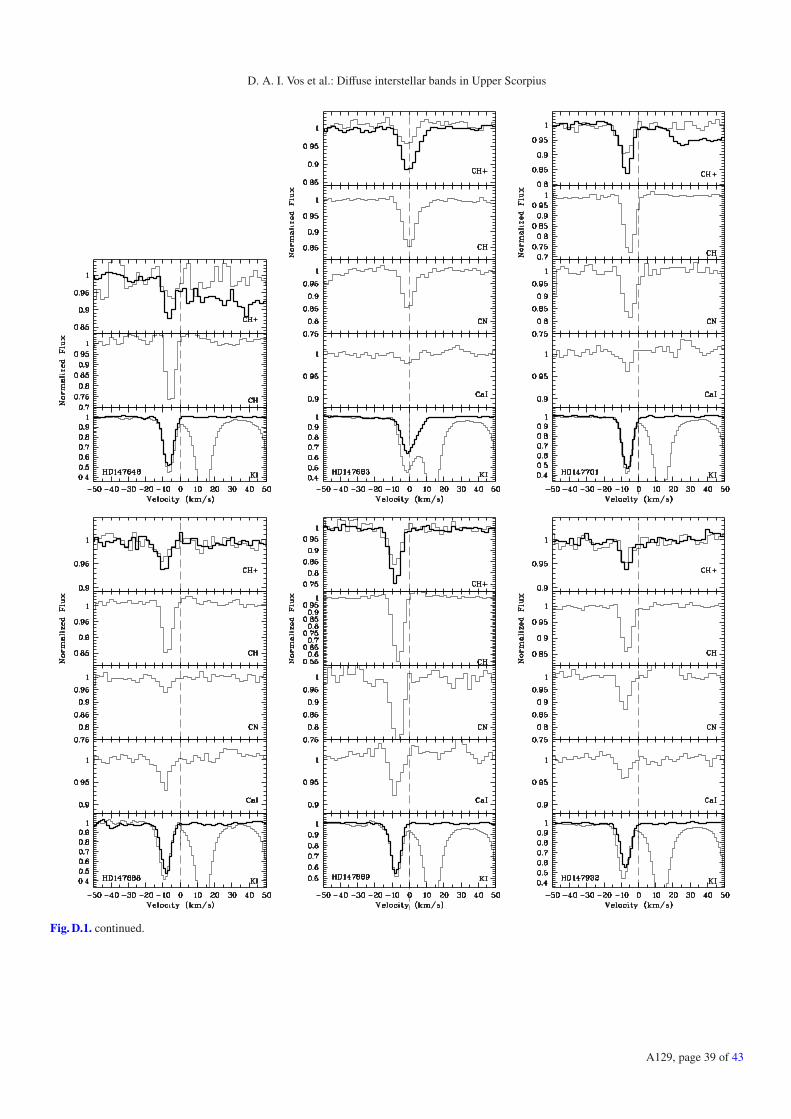
D. A. I. Vos et al.: Diffuse interstellar bands in Upper Scorpius
Fig. D.1. continued.
A129, page 39 of 43
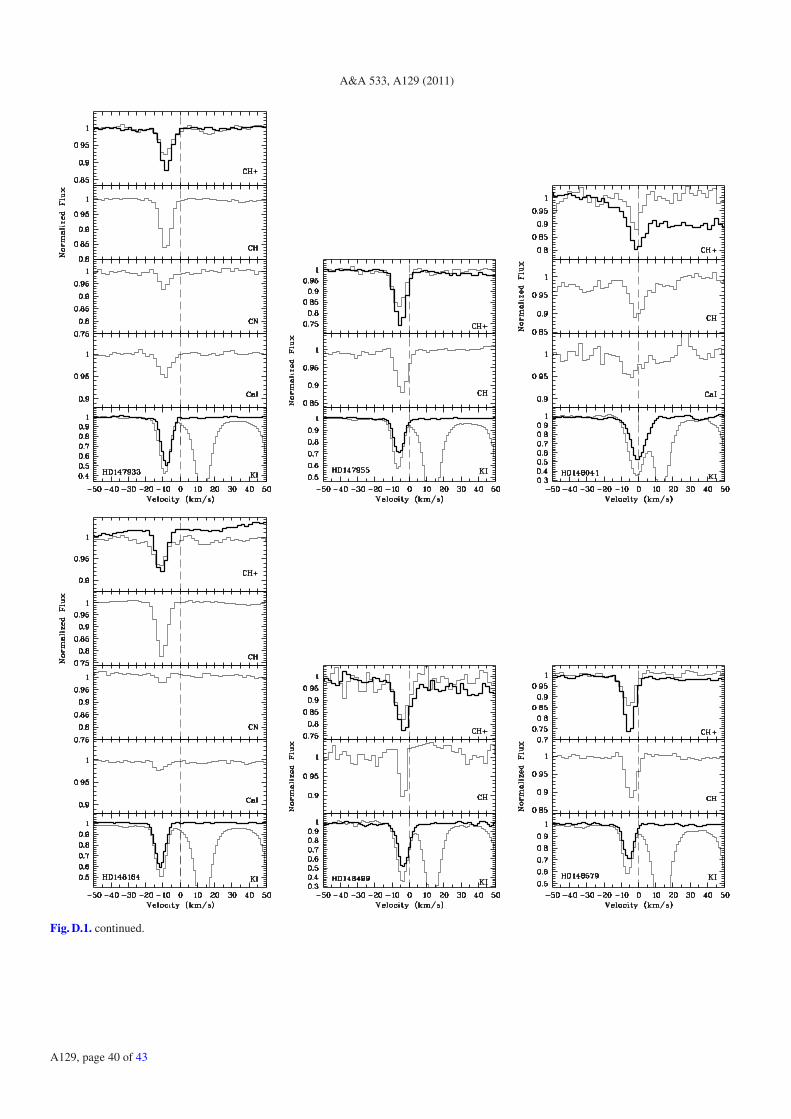
A&A 533, A129 (2011)
Fig. D.1. continued.
A129, page 40 of 43
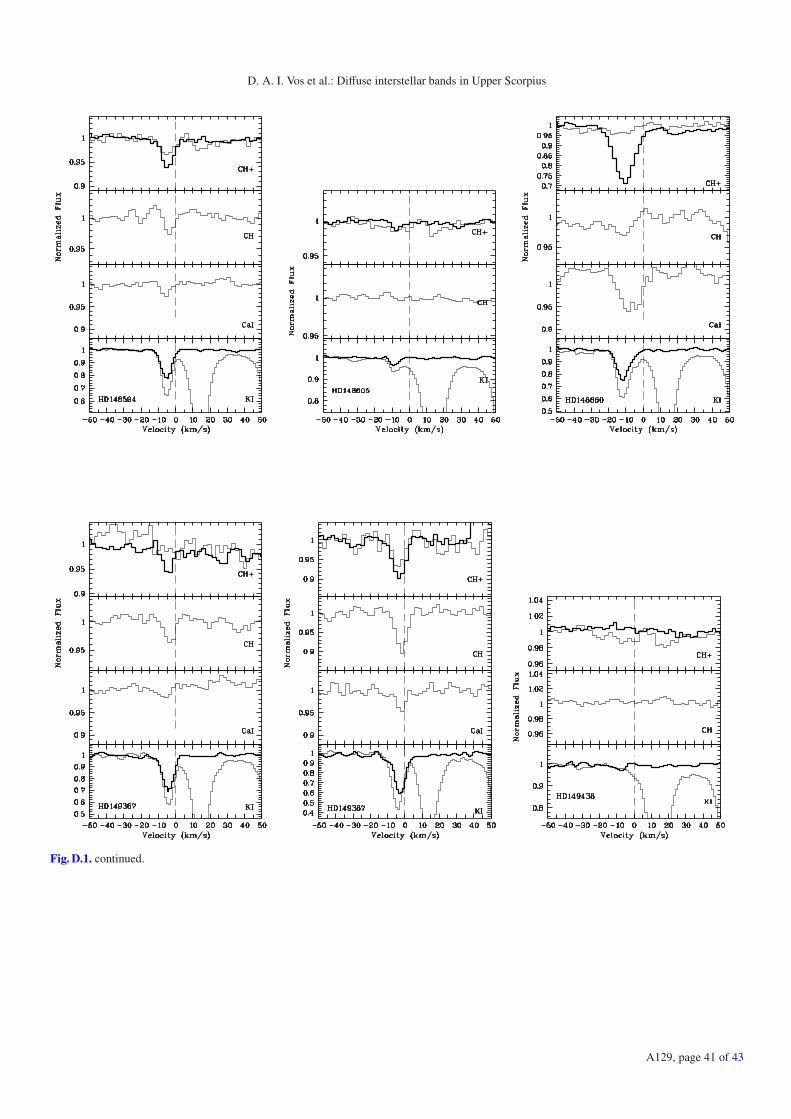
D. A. I. Vos et al.: Diffuse interstellar bands in Upper Scorpius
Fig. D.1. continued.
A129, page 41 of 43

A&A 533, A129 (2011)
Fig. D.1. continued.
A129, page 42 of 43
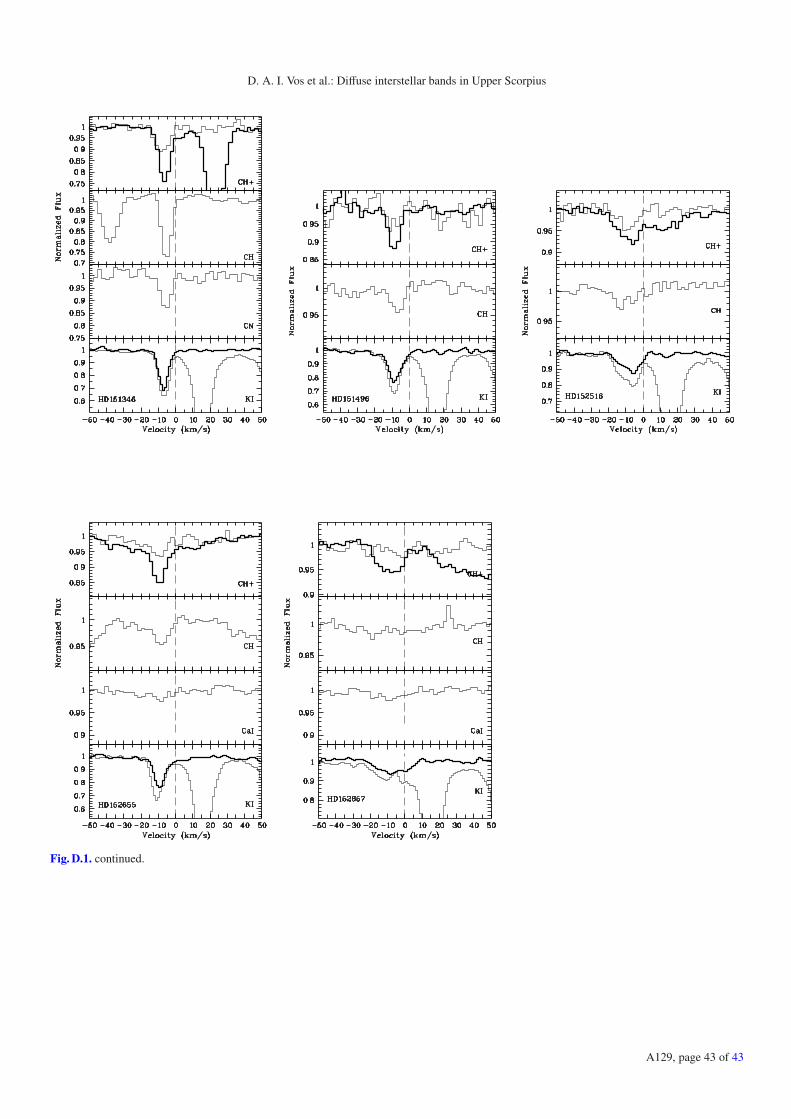
D. A. I. Vos et al.: Diffuse interstellar bands in Upper Scorpius
Fig. D.1. continued.
A129, page 43 of 43