diffusion and distortion of evidence in science
TRANSCRIPT

Diffusion and Distortion of Evidence in Science
Dr. Rhodri Ivor LengDepartment of Science, Technology,
and Innovation Studies, University of Edinburgh

Introduction
“The anthropologist feels vindicated in having retained his
anthropological perspective in the face of the beguiling charms of
his informants: they claimed merely to be scientists discovering
facts; he doggedly argued that they were writers and readers in the
business of being convinced and convincing others”.
Latour and Woolgar (1979, p.88)

A vast and steeply growing literature
Fig.1: Cumulative growth of articles and reviews
in Web of Science S SCI, 1900-2019. Exponential
fit.
Fig 2: Figure displays growth of publication
and authors in physics since 1900: Source:
Sinatra et al. (2015).

The growth of a topic: Intranasal oxytocin
Fig 3: The left axis shows the number of articles and reviews published per year and indexed in
the Web of Science (WoS) with terms indicating a focus on intranasal oxytocin published since
2000 as of Jan 2021, while the right axis shows the annual citations received by these papers.
0
2000
4000
6000
8000
10000
0
50
100
150
200
250
2000 2005 2010 2015 2020
Publications
Citations

Citation networks (CNA)
• We can represent the scientific literature on any given area of
interest as an interconnected network (graph) of papers – with
connections from a citing document to the cited document.
• Nodes represent single documents, depicted as blue circle
• Edges represent citations from a document to another document,
depicted as blue arrows

Intranasal oxytocin: 2000-2019
Fig 4: Citation network of articles and reviews with terms indicating a focus on intranasal oxytocin in the titles,
abstracts, and associated keywords 2000-2020 (n=1,354; m=22,511) Data extracted from Web of Science.
Nodes coloured by cluster membership and edges between nodes coloured by the colour of the target node.

100 years of oxytocin research
Fig 5: Left image is a citation network clustered by the Leiden algorithm, with nodes coloured by cluster
membership and edges between nodes coloured by the colour of the target node (n=10,357; m=163,668). The image
in the top right is the same network with edges removed

Skewed distribution of citation
• A given network is dominated by a few,
highly cited papers – citation distribution
are heavily right skewed.
• Typically 80% of citations are directed at
only 20% of all publications if we include
articles, reviews, and other documents
types (Gingras 2014)
• The ‘Rich get Richer’ phenomenon; the
‘Matthew Effect’ (Merton 1968);
Cumulative Advantage (Price 1965;
1976)
Fig 6. How often articles and reviews with “oxytocin” in the
title have been cited? Citation distribution of 6,329 oxytocin
articles and reviews published <2010 (total citations:
266,510). Y-axis shows proportion of papers, X-axis shows
proportion of citations.
0%
20%
40%
60%
80%
100%
0% 20% 40% 60% 80% 100%

• Fanelli (2012) examined hypothesis-testing papers. In a sample of ~2000 papers derived from
20 disciplines between 2000–2007 and comparing these to ~2000 papers published in the
1990s, Fanelli found that ‘negative findings’ appeared to be disappearing from the literature in
all disciplines. Of papers published between 1990 and 1991, 70% returned findings supportive
to the hypothesis being tested in those papers, but by 2005 this had risen to 89%.
• Many possible contributing factors. Few direct replication studies conducted and Questionable
Research Practices (QRPs), such as P-hacking, HARKing, publication bias, etc. See Ioannidis
(2005), Gelman and Loken (2014) Song et al. (2010), Baker (2016).
A positive skew

Positive Skew II
• Not only are ‘positive findings’ more likely to be published, they are also more likely to
be cited.
• Citation bias refers to the act of preferentially citing evidence of a particular direction
(typically significant ‘positive’ results) and ignoring inconvenient evidence. On
average, it seems, scientists tend to cite studies returning statistically significant
‘positive’ results more than twice as often than those reporting equivocal or negative
findings (Duyx et al. 2017). The authors concluded: “Our results suggest that
citations are mostly based on the conclusion that authors draw rather
than the underlying data.” (p.97)

Citation Bias I
Greenberg (2009) How citation distortions create unfounded authority: analysis of a citation network. BMJ 2009; 339
:b2680
The claim
β amyloid is implicated in inclusion body myositis
The evidence
11 primary studies
5 supported the claim
6 contradicted it

Citation Bias II
Leng RI (2018) A network analysis of the propagation of evidence
regarding the effectiveness of fat-controlled diets in the secondary
prevention of coronary heart disease (CHD): Selective citation in
reviews. PLOS ONE 13(5): e0197716
The claim:
Evidence from RCTs supports the use of dietary
fat modification for treating CHD
The evidence
4 RCTs
1 supported the claim
3 contradicted it
Citations
By 1984, the supportive trial accumulated 259citations, the highest cited unsupportive trial
received just 60.
How were reviews citing these trials?


Distortion of MeaningIn 2010, Andreas Stang published a critique of the Newcastle–Ottawa scale (NOS), a scale introduced by Wells et al.
to assess the quality of non-randomised studies for the purposes of meta-analysis. He came to an unequivocally
critical conclusion:
“I believe Wells et al. provide a quality score that has unknown validity at best, or that includes quality items that
are even invalid. The current version appears to be inacceptable for the quality ranking of both case-control
studies and cohort studies in meta-analyses. The use of this score in evidence-based reviews and meta-analyses
may produce highly arbitrary results” (2010, p.6).
Eight years later, Stang and colleagues (2018) published a second paper calling attention to the widespread inaccurate
citation to ‘Stang (2010)’. In the intervening years, ‘Stang (2010)’ had become the ‘go to’ reference for scientists
seeking something to reference when they used NOS in their publications – accumulating, by 2016, 1,250 citations.
Stan. In a sample of 96 citing systematic reviews, ‘Stang (2010)’ was cited in a manner that suggested it supported use
of the NOS in 94 – and only 18 of these systematic reviews provided any other reference in support of its use.
“…the vast majority of indirect quotations of the commentary have been misleading. It appears that authors of
systematic reviews who quote the commentary most likely did not read it” (2018 p.1030).
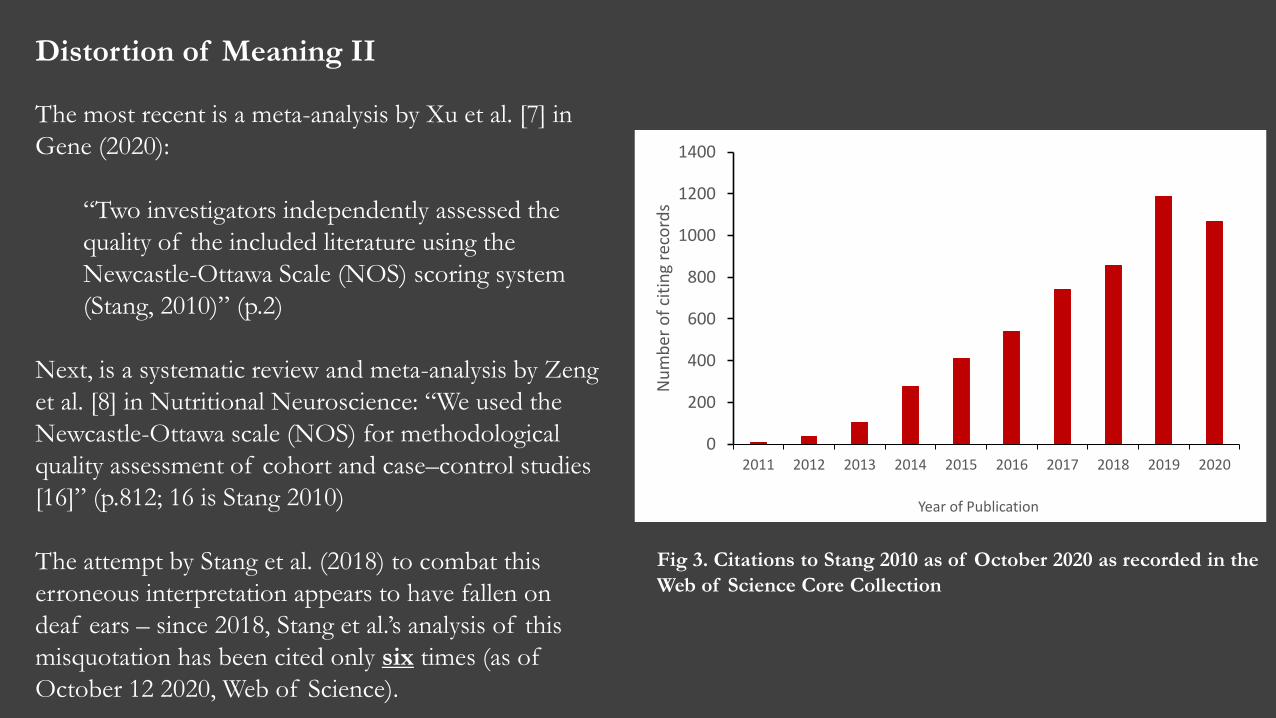
Fig 3. Citations to Stang 2010 as of October 2020 as recorded in the
Web of Science Core Collection
0
200
400
600
800
1000
1200
1400
2011 2012 2013 2014 2015 2016 2017 2018 2019 2020
Nu
mb
er o
f ci
tin
g re
cord
s
Year of Publication
Distortion of Meaning II
The most recent is a meta-analysis by Xu et al. [7] in
Gene (2020):
“Two investigators independently assessed the
quality of the included literature using the
Newcastle-Ottawa Scale (NOS) scoring system
(Stang, 2010)” (p.2)
Next, is a systematic review and meta-analysis by Zeng
et al. [8] in Nutritional Neuroscience: “We used the
Newcastle-Ottawa scale (NOS) for methodological
quality assessment of cohort and case–control studies
[16]” (p.812; 16 is Stang 2010)
The attempt by Stang et al. (2018) to combat this
erroneous interpretation appears to have fallen on
deaf ears – since 2018, Stang et al.’s analysis of this
misquotation has been cited only six times (as of
October 12 2020, Web of Science).

The Phantom Reference
Sun et al. (2008)
“Rutin is often used as a therapeutical medicine …
which can dilute the blood, reduce capillary
permeability and lower blood pressure [1]”
1. Van der Geer J, Hanraads JAJ, Lupton RA (2000) The
art of writing a scientific article J Sci Commun 163:51–59
By 2019, this phantom had been cited more 480 times,
including 79 times in peer-reviewed journal papers.
In 13 journal papers, this phantom was used to support the
claim that rutin has health benefits

Read before you cite…
• Citations are not a proxy for study quality.
• You cannot take the description of previous findings or the references used to previous studies in
other scientific papers as an accurate or representative account of the existing evidence. You need
to read the original papers yourself.
• Importantly, you need be aware that authors can, and do, selectively cite the evidence that supports
their preferred interpretation. So if you follow the papers that an author cites, you will tend to find
the literature that supports the author’s position, and may miss the ‘inconvenient’ evidence.


Relevant Reading
• Greenberg, SA. (2009). How citation distortions create unfounded authority: analysis of a citation network. BMJ. 339:b2680• Leng, RI. (2018). A network analysis of the propagation of evidence regarding the effectiveness of fat-controlled diets in the secondary prevention of
coronary heart disease (CHD): Selective citation in reviews. PLoS One. 13(5):e0197716. DOI: 10.1371/journal.pone.0197716• Leng, RI. (2020). The phantom reference and the propagation of error. Stable URL:• https://www.the-matter-of-facts.com/post/the-phantom-reference-and-the-propagation-oferror• Leng G., Leng RI. (2020). The Matter of Facts: Skepticism, Persuasion, and Evidence in Science. MIT Press, Cambridge, Massachusetts• Leng, G., Leng RI., Maclean, S. (2019). The vasopressin-memory hypothesis: a citation network analysis of a debate. Ann N Y Acad Sci. 1455(1):126–140• Duyx, B., Urlings, MJ., Swaen, GM., et al. (2017). Scientific citations favor positive results: a systematic review and meta-analysis. J Clin Epidemiol.
88:92–101• Fanelli, D. (2012). Negative results are disappearing from most disciplines and countries. Scientometrics. 90(3):891–904• Latour, B., Woolgar, S. (1979). Laboratory Life, the Social Construction of Scientific Facts. Beverly Hills, CA: Sage• Price, DJ. ([1963] 1986). Little Science, Big Science …and Beyond. New York, NY: Columbia University Press• Price, DJ. (1965). Networks of scientific papers. Science. 149:510–5• Price, DJ. (1976). A general theory of bibliometric and other cumulative advantage processes. J Am Soc Inform Sci Tec. 27(5):292–306• Leng G., Leng RI. (2020). The Matter of Facts: Skepticism, Persuasion, and Evidence in Science. MIT Press, Cambridge, Massachusetts• Gingras, Y. (2014). Bibliometrics and Research Evaluation: Uses and Abuses. Cambridge, MA: MIT Press• Merton, RK. (1968). The Matthew Effect in science. Science. 159(3810):56–63• Sinatra, R., Deville, P., Szell, M., et al. (2015). A century of physics. Nature Physics. 11(10):791–6• Stang, A. (2010). Critical evaluation of the Newcastle–Ottawa scale for the assessment of the quality of nonrandomized studies in meta analyses. Euro
J Epidemiol. 25(9):603–5• Stang, A., Jonas, S., Poole, C. (2018). Case Study in Major Quotation Errors: A Critical Commentary of the Newcastle–Ottawa Scale. Euro J Epidemiol.
33(11):1025–31• Ioannidis, JP. (2005). Why most published research findings are false. PLoS Med. 2(8):e124• Gelman, A., Loken, E. (2014). The Statistical Crisis in Science. American Scientist 102:460• Song, P., Parekh, S., Hooper, L., et al. (2010). Dissemination and publication of research findings: an updated review of related biases. Health Technol
Assess. 14(8):iii, ix-xi, 1–193• Baker, M. (2016). 1500 scientists lift the lid on reproducibility. Nature. 533:452–4