diffusion in soft heterogeneous biomaterials · carrageen gel lijkt daarentegen wel veelbelovend en...
TRANSCRIPT

DIFFUSION IN SOFT HETEROGENEOUS
BIOMATERIALS
Hannes DEVELTER Student number: 01203622
Promoter: Prof. Dr. Kevin Braeckmans
Co-promoter: Prof. Dr. Niklas Lorén and Prof. Dr. Anette Larsson
RISE: Research Institutes of Sweden - Unit of Bioscience and materials - Agrifood and
Bioscience - Product Design and Perception
Commissioners: Dr. Juan Fraire and Dr. Evelien Wynendaele
A Master dissertation for the study programme Master in Pharmaceutical Care
Academic year: 2016 - 2017


COPYRIGHT
“The author and promotors give the authorization to consult and to copy parts of this thesis for personal use only. Any
other use is limited by the laws of copyright, especially concerning the obligation to refer to the source whenever
results from this thesis are cited.”
May 24, 2017
Promoter
Prof. Dr. K. Braeckmans
Co-promoter
Prof. Dr. N. Lorén
Author
Hannes Develter


ABSTRACT
The knowledge of mass transport is very important in pharmaceutical and food preparations. Many
techniques are established to determine the local mass transport of a substance. However, while most diffusion
experiments have been done in homogeneous materials, soft matter systems, like hydrogels, often have very
complex microstructures. They can be heterogeneous with many interfaces, which can have a large impact on
the local diffusion properties of the substance. It is therefore interesting to investigate the diffusion near these
interfaces. There is moreover a need for stable and flexible model systems to develop new quantitative
microscopy techniques.
In this thesis, the diffusion in hydrogels is investigated, starting with relatively homogeneous systems
and gradually introducing more heterogeneous models with interfaces. The diffusion in 1% κ-carrageenan and
4% alginate gels is investigated. Polystyrene spheres and alginate beads are introduced in the carrageenan gel,
evaluated and the diffusion near the alginate and carrageenan interface is studied. Sodium fluorescein and
70kDa FITC-dextran are tested as fluorescent diffusion probes. For each system, Fluorescence Recovery After
Photobleaching (FRAP) and Raster Image Correlation Spectroscopy (RICS) are applied for measuring the
diffusion. The applied techniques are investigated and tested near interfaces and inside the bulk of the gels.
It appears that 70kDa FITC-dextran is better suited as a probe than sodium fluorescein in the used model
systems regarding the extent of photobleaching and possible interaction with the gel network. Furthermore, PS
spheres inside a 1% κ-carrageenan hydrogel does not seem to be the optimal model for this thesis. The alginate
gel inside the carrageenan gel seems to be a more promising model and the internal method for producing the
alginate gel is superior regarding the homogeneity.
In general for both techniques, the measured diffusion coefficients of 70kDa FITC-dextran inside the
alginate gel are in the range of 3µm2/s to 7µm2/s and inside the carrageenan gel in the range of approximately
15µm2/s to 18µm2/s by RICS and 20µm2/s to 25µm2/s by FRAP. The diffusion coefficient of the probe in water is
found to be in the range of 27µm2/s to 30µm2/s using RICS. The measured diffusion coefficients of RICS are slightly
higher inside the alginate gel, but lower inside the carrageenan gel in comparison with the FRAP experiments.
The results of the FRAP experiments near the interface show a slightly increasing trend in diffusion of the probe
inside the carrageenan gel when moving the ROI further away from the interface. This is in contrast to the RICS
experiments near the interface inside the alginate gel, where the diffusion coefficient remains relatively
consistent at each investigated distance from the interface.
The mass transport in heterogeneous biomaterials and their interfaces remains an interesting but
difficult subject. The results in this thesis are promising but more experiments are necessary to receive more
closing and reliable results.

SAMENVATTING
De kennis van massatransport is zeer belangrijk in farmaceutische en voedsel preparaten. Vele
technieken zijn beschikbaar om de lokale massatransport van een stof te bepalen. Hoewel de meeste
experimenten rond diffusie uitgevoerd zijn in homogene materialen, zijn systemen van zachte materie, zoals
hydrogels, echter vaak complexe microstructuren. Deze kunnen heterogeen zijn met veel interfaces, die een
grote impact kunnen hebben op de lokale diffusie eigenschappen van een stof. Het is daarom interessant om de
diffusie in de buurt van deze interfaces te onderzoeken. Er is daarnaast ook nood aan stabiele en flexibele
modelsystemen om nieuwe kwantitatieve microscopie technieken te ontwikkelen.
In deze thesis is de diffusie in hydrogels onderzocht, startende met relatief homogene systemen,
waarbij geleidelijk meer heterogene modellen worden gepresenteerd. De diffusie in 1% carrageen en 4% alginaat
gels is bestudeerd. Polystyreen sferen en alginaat druppels zijn geintroduceerd in de carrageen gel, geëvalueerd
en de diffusie in de buurt van de alginaat en carrageen interface is bestudeerd. Natrium fluoresceïne en 70kDa
FITC-dextraan zijn getest als fluorescente diffusie probes. Voor elk systeem werden Fluorescence Recovery After
Photobleaching (FRAP) en Raster Image Correlation Spectroscopy (RICS) toegepast om de diffusie te meten. De
toegepaste technieken zijn bestudeerd en getest dicht bij de interfaces en in de bulk van de gels.
Het blijkt dat 70kDa FITC-dextraan beter geschikt is als probe dan natrium fluoresceïne in de gebruikte
model systemen met betrekking tot de mate van fotobleking en mogelijke interactie met het gelnetwerk. Ook
lijkt het model met de PS sferen in de 1% carrageen gel niet optimaal voor deze thesis. De alginaat gel in de
carrageen gel lijkt daarentegen wel veelbelovend en de interne methode voor de productie van de alginaat gel
is superieur inzake de homogeniciteit.
In het algemeen zijn voor beide technieken diffusiecoëfficiënten van 70kDa FITC-dextraan gemeten
tussen 3µm2/s en 7µm2/s in de alginaat gel en ongeveer van 15µm2/s tot 18µm2/s door RICS en 20µm2/s tot 25µm2/s
door FRAP in de carrageen gel. De gemeten diffusiecoëfficiënten bij RICS zijn iets hoger in de alginaat gel, maar
lager in de carrageen gel, in vergelijking met de FRAP experimenten. De resultaten van de FRAP experimenten
dicht bij de interface vertonen een licht stijgende trend in diffusie van de probe in de carrageen gel wanneer de
ROI verder weg van de interface wordt geplaatst. Dit staat in contrast met de RICS experimenten aan de interface
in de alginaat gel, waar de diffusiecoëfficiënt relatief consistent blijft op elke onderzochte afstand van de
interface.
De massatransport in heterogene materialen en hun interfaces blijft een interessant maar moeilijk
onderwerp. De resultaten in deze thesis zijn veelbelovend, maar meer experimenten zijn noodzakelijk om tot
meer sluitende en betrouwbare resultaten te bekomen.

ACKNOWLEDGEMENTS
Above all, I would like to express my sincere gratitude to my supervisor Niklas Lorén for the endless support
and enthusiasm in my project, the help with my experiments and for answering all of my questions and coming
up with great ideas during my work. I had a very interesting and educational experience during my stay, mostly
thanks to him. I could not have wished for a better supervisor. I would also like to thank my promotor Prof.
Kevin Braeckmans of Ghent University for all the help. I am most grateful for Niklas Lorén, Prof. Kevin
Braeckmans and Prof. Anette Larsson for giving me the opportunity to establish my master thesis at RISE.
Furthermore, I would like to thank Magnus for the big help with the analysis of my data and with the RICS
experiments and also Annika Altskär and Annika Krona for teaching me the basics of the CLSM. I would like to
thank all the people in general at RISE for the amazing time during my stay and for the fun and entertaining
fika and lunch breaks every day, especially the other diploma workers and interns for the support and talks
every day.
I would like thank all my new friends in Göteborg for the amazing time I had during my Erasmus and my
friends in Belgium as well for the support and help.
Finally, I am very grateful for my parents, brother, sister and girlfriend for giving me the opportunity and
support during my stay in Sweden and for everything they have done for me.


TABLE OF CONTENTS
1 INTRODUCTION ............................................................................................................................................................................................................. 1
1.1 DIFFUSION ................................................................................................................................................................................................................ 2
1.2 HETEROGENEOUS MATERIALS ....................................................................................................................................................................... 2
1.3 HYDROGEL ............................................................................................................................................................................................................... 3
1.3.1 Carrageenan ................................................................................................................................................................................................ 4
1.3.2 Alginate .......................................................................................................................................................................................................... 5
1.4 POLYSTYRENE MICROSPHERES ..................................................................................................................................................................... 5
1.5 CONFOCAL LASER SCANNING MICROSCOPY (CLSM) ............................................................................................................................6
1.6 FLUORESCENCE...................................................................................................................................................................................................... 7
1.6.1 Fluorescent diffusion probes .............................................................................................................................................................8
1.6.1.1 Fluorescein ............................................................................................................................................................................................ 8
1.6.1.2 FITC-dextran ..........................................................................................................................................................................................9
1.7 OPTICAL TECHNIQUES TO MEASURE DIFFUSION .................................................................................................................................10
1.7.1 Fluorescence Recovery After Photobleaching (FRAP) ........................................................................................................ 10
1.7.2 Correlation spectroscopy .................................................................................................................................................................... 11
2 OBJECTIVES .................................................................................................................................................................................................................. 13
3 MATERIALS AND METHODS .................................................................................................................................................................................. 15
3.1 HYDROGEL ............................................................................................................................................................................................................. 15
3.1.1 Carrageenan gel ...................................................................................................................................................................................... 15
3.1.2 Alginate gel ................................................................................................................................................................................................ 16
3.1.2.1 Droplet method ................................................................................................................................................................................. 16
3.1.2.2 Internal method ................................................................................................................................................................................ 16
3.1.3 Mixture of Carrageenan and Alginate ......................................................................................................................................... 17
3.2 POLYSTYRENE MICROSPHERES .............................................................................................................................................................. 17
3.3 FLUORESCENT DIFFUSION PROBES...................................................................................................................................................... 18
3.3.1 Fluorescein ................................................................................................................................................................................................. 18
3.3.2 70kDa FITC-dextran ............................................................................................................................................................................... 18
3.4 CLSM..................................................................................................................................................................................................................... 19
3.5 FRAP..................................................................................................................................................................................................................... 19
3.5.1 Analysis ....................................................................................................................................................................................................... 20
3.6 RICS ..................................................................................................................................................................................................................... 20
4 RESULTS ....................................................................................................................................................................................................................... 22
4.1 POLYSTYRENE SPHERES INSIDE CARRAGEENAN GEL ..................................................................................................................... 22
4.2 FRAP EXPERIMENTS ................................................................................................................................................................................... 23
4.2.1 Concentration effect of sodium fluorescein........................................................................................................................... 23
4.2.2 Carrageenan bulk .................................................................................................................................................................................. 24
4.2.3 Alginate bulk ............................................................................................................................................................................................ 25
4.2.3.1 Droplet method ................................................................................................................................................................................ 25
4.2.3.2 Internal method ............................................................................................................................................................................... 27
4.2.4 Interface ..................................................................................................................................................................................................... 28

4.2.5 Mixture of carrageenan and alginate gel ................................................................................................................................ 33
4.3 RICS EXPERIMENTS ..................................................................................................................................................................................... 34
4.3.1 Optimal scanning rate ........................................................................................................................................................................ 34
4.3.2 H2O ................................................................................................................................................................................................................. 35
4.3.3 Carrageenan bulk .................................................................................................................................................................................. 36
4.3.4 Alginate bulk ............................................................................................................................................................................................ 37
4.3.5 Interface ..................................................................................................................................................................................................... 38
5 DISCUSSION ................................................................................................................................................................................................................40
5.1 POLYSTYRENE SPHERES INSIDE CARRAGEENAN GEL .................................................................................................................... 40
5.2 FRAP EXPERIMENTS .................................................................................................................................................................................. 40
5.2.1 Concentration effect of sodium fluorescein...........................................................................................................................40
5.2.2 Carrageenan bulk ................................................................................................................................................................................... 41
5.2.3 Alginate bulk ............................................................................................................................................................................................. 41
5.2.3.1 Droplet method ................................................................................................................................................................................ 42
5.2.3.2 Internal method ............................................................................................................................................................................... 42
5.2.4 Interface ..................................................................................................................................................................................................... 42
5.2.5 Mixture of carrageenan and alginate ........................................................................................................................................ 44
5.3 RICS EXPERIMENTS ..................................................................................................................................................................................... 44
5.3.1 Optimal scanning rate ........................................................................................................................................................................ 44
5.3.2 H2O ................................................................................................................................................................................................................. 45
5.3.3 Carrageenan bulk .................................................................................................................................................................................. 45
5.3.4 Alginate bulk ............................................................................................................................................................................................ 45
5.3.5 Interface ..................................................................................................................................................................................................... 45
5.4 FURTHER RESEARCH .................................................................................................................................................................................. 46
6 CONCLUSION .............................................................................................................................................................................................................. 47
7 REFERENCES .............................................................................................................................................................................................................. 49

ABBREVIATIONS
CLSM Confocal Laser Scanning Microscopy
FITC Fluorescein-5-isothiocyanate
FRAP Fluorescence Recovery After Photobleaching
GDL Glucono-δ-Lactone
HPC Hybrid Photon Counting
NA Numerical Aperture
PMT Photomultiplier Tube
PS Polystyrene
PSF Point Spread Function
RICS Raster Image Correlation Spectroscopy
ROI Region Of Interest

1
1 INTRODUCTION
Many pharmaceutical and food formulations are dependent on the control of diffusion properties for
their performance, for example the water or fat migration in respectively bread and chocolate or controlled
release formulations of numerous drugs. It is often desirable to control both release and uptake of molecules
inside soft materials as well. In addition, the free diffusion in liquid will change when mechanisms such as
obstruction or interactions with the medium are active. In a pharmaceutical context, it is also important to
determine the release of drugs out of their formulations and to measure the uptake in the human body. This is
why knowledge of mass transport dynamics and its measurement is very important.
Soft matter systems often have very complex microstructures. They can be heterogeneous, hierarchical,
and multiphase, which can have a large impact on the diffusion properties depending on variations within
temporal and spatial scales. A lot of interfaces are present in multiphase systems, thus making it pertinent to
investigate diffusion near them.
Many techniques have been established to determine the local mass transport of a substance, such as
fluorescence recovery after photobleaching (FRAP), single particle tracking (SPT), fluorescence correlation
spectroscopy (FCS), (raster) image correlation spectroscopy ((R)ICS) and many more. On the other hand, the
global mass transport inside a material can be measured as well by numerous techniques, like nuclear magnetic
resonance diffusometry (NMRd). Since the microscopy and mathematical models for analyzing of the data are
developing further as time passes, these techniques also become gradually more accurate. However, while most
diffusion experiments have been carried out in homogeneous materials, most materials have a rather
heterogeneous and complex structure. This makes it harder to measure the diffusion properties in these systems
and provides a need for stable model systems to develop new quantitative microscopy techniques.
In this thesis, the diffusion in hydrogels is investigated, starting with relative homogeneous systems
such as carrageenan and alginate gels and slowly introducing more heterogeneous models with interfaces.
Different techniques for measuring diffusion are applied to each system, more specifically RICS and FRAP. The
applied techniques are investigated and tested near interfaces to find out if there is any difference between the
diffusion inside the bulk and at these interfaces and if there is a relation to the difference in diffusion in function
of the distance from the interface. All systems are studied under the CLSM with the use of sodium fluorescein or
70kDa FITC-dextran as a fluorescent probe.
Chapter 1 of this thesis describes the theoretical aspects of the used materials and techniques. Chapter
2 provides an overview of the main objectives, while the used materials and methods are listed in chapter 3.
Finally, the results of all the experiments, the discussion of these results and the conclusion of this thesis are
described respectively in chapters 4, 5 and 6.

2
1.1 DIFFUSION
Diffusion is a passive transport mechanism (i.e. only thermal energy is needed), where the total mass
of a substance (solvents or solutes) moves in a medium, randomly or due to a concentration gradient (from
regions with higher concentration to regions with lower concentration) until an equilibrium is reached. Self-
diffusion is a process where the molecules collide with other molecules from their surroundings, causing a
movement (1). Fick’s second law of diffusion describes the diffusion process mathematically (1, 2) (1.1):
𝛿𝐶
𝛿𝑡= 𝐷
𝛿2𝐶
𝛿𝑥2 (1.1)
Where C: concentration (mole/m3)
t: time (s)
D: diffusion coefficient (m2/s)
x: position parameter (m)
The Stokes-Einstein equation describes the diffusion constant of a particle in an infinitely diluted solution (1.2)
(1, 2).
𝐷= 𝑘𝐵𝑇
6𝜋𝜂𝑟𝐻 (1.2)
Where D: diffusion coefficient (m2/s)
kB: Boltzmann’s constant (1.38e-23 m2.kg/(K.s))
T: temperature (K)
η: macroscopic dynamic viscosity (kg/m)
rH: hydrodynamic radius of a spherical particle (m)
1.2 HETEROGENEOUS MATERIALS
Many biomaterials are heterogeneous, as shown in the microscopic images of a carrageenan gel, gelatin
and maltodextrin, emulsion and chocolate as examples in FIG. 1.1. It is clear that many interfaces are present
inside these heterogeneous materials. In general, soft materials and cells are composed of various elements and
structures at different length scales that influence the mobility of diffusing particles. Microstructures can be
organized for example in a fractal, hierarchical or periodical manner (1), as illustrated in FIG. 1.2.

3
Hydrogels in particular can be classified as homogeneous and heterogeneous. Homogeneous hydrogels
show a random dispersion of mobile chains and pores in the gel network, for example PEG (polyethylene glycol)
and PVA (polyvinyl alcohol). Heterogeneous hydrogels on the other hand, show a gel network with a high polymer
interaction, with different properties in different directions. Examples of heterogeneous hydrogels are κ-
carrageenan, calcium alginate and agarose (3).
FIG. 1.1: Microscopic images as illustration of heterogeneous biomaterials at different length scales: a) 1% κ-carrageenan gel with 200 mM NaCl and 20 mM KCl; b) 4% gelatine and 7.3% maltodextrin labelled with RITC, where the bright phase shows the maltodextrin; c) bicontinuous emulsion with the oil phase visible; d) chocolate, where the bright phase represents the fat. The pictures are reproduced, with permission, from reference (2).
FIG. 1.2: Illustrations of possible organizations of heterogeneous microstructures: (a) fractal, (b) hierarchical or (c) periodical. The different length scales are shown by δ (2).
1.3 HYDROGEL
Hydrogels consist of cross-linked hydrophilic polymeric networks, swollen by the presence of water (4).
They are classified as “soft matter” and are an important medium in numerous food and pharmaceutical
applications to restrict and control the release of active substances, the texture and viscosity or to stabilize
products. The gel strand network acts as a sieve in which the molecules can move. It can cause a decrease in
diffusion transport of the particles, depending on the size of the particles and the size of the pores of the gel
strand network (2, 5). Gels consist mostly of at least two components: the solvent and a polymer that forms the
gel-network, giving the gel solid-like mechanical properties (6).
The two polysaccharide hydrogels used in this thesis are sodium alginate and κ-carrageenan. Due to
their biocompatibility, biodegradability, immunogenicity and nontoxicity, they are regularly applied in drug
delivery systems (7).

4
1.3.1 Carrageenan
Carrageenan is an anionic hydrocolloid seaweed gum collected from red algae (Rhodophyta). It is mainly
used as a stabilizer and gelling agent in foods and pharmaceuticals. Carrageenan is a linear polysaccharide as it
consists of many sulfated D-galactose residues. There exist many different types of carrageenan with various
solubility and gelation properties, depending on the manufacturing and chemical composition. The two most
common carrageenan types are known as κ-carrageenan (the gelling fraction) and λ-carrageenan (the non-
gelling fraction), both with a slightly different chemical composition. κ-carrageenan, which is used in this thesis,
consists of alternating α-(1-3)-D-galactose-4-sulphate and β-(1-4)-3,6-anhydro-D-galactose (8, 9) as illustrated
in FIG. 1.3a.
Through heating followed by cooling of the aqueous solutions of κ-carrageenan together with the
required cations (Na+, K+ or Ca2+, etc.) thermo-reversible cross-linked gels can be formed. In this thesis potassium
ions (K+) are used, which can bind on specific binding sites on the polymer (10). The mechanism involves a
conformational coil-helix transition: in solution-state and when heating, κ-carrageenan has a random coil
formation. However, by decreasing the temperature of the heated solution a conformational change occurs from
a random coil to a (double) helix formation as shown in FIG. 1.3b. These helices can aggregate in the presence of
cations (in adequate concentrations) by decreasing the repulsion of the negative sulfonic groups of κ-
carrageenan. The gel-network is now formed (9, 11, 12) (FIG. 1.3c).
The formation of the gel depends on the chemical structure and concentration of the carrageenan, the
nature of the cations and on the temperature (9). The mean pore size of the gel decreases with increasing
carrageenan concentration (13). Κ-carrageenan gels are interesting for determining the diffusion because the
gel structure can be fitted to meet the requirements (10).
FIG. 1.3: (a) Repetitive disaccharide in a κ-carrageenan chain; Formation and destruction of the gel-network by cooling and heating: (b) (double) helix formation and (c) further aggregation of helices in presence of cations (14).
(b)
(a)
(c)

5
1.3.2 Alginate
Alginate is generally collected from brown algae (Phaeophyceae), but it can also be produced by
bacteria. Like carrageenan, alginate is commonly used as a gelling agent and thickener in food and
pharmaceutical products, along with being suitable for biomedical applications. Alginate is a charged linear
copolymer polysaccharide composed of a variable ratio of (1–4) linked β-D-mannuronic acid (M) and α-L-
guluronic acid (G) (15), as illustrated in FIG. 1.4a.
It can form a gel in presence of most di- and trivalent cations (such as Ca2+) in low concentration. In
presence of calcium ions, as used in this thesis, an enhanced chelation between the hydroxyl groups of the poly-
G segments can occur via a two-step network formation mechanism. During this formation, a dimerization
process takes place, followed by a dimer–dimer aggregation of Ca2+ and G units, resulting in the formation of a
three-dimensional ionically cross-linked gel network (6), as illustrated in FIG. 1.4b. This process is also called the
egg-box model. Usually, if the calcium concentration increases at fixed alginate concentration, the gel network
becomes thicker (15). Alginate gels are typically nanoporous with an average pore size of 5nm (16).
In contrast to carrageenan, sodium alginate is a cold gelling agent that does not require heat to form a
gel network (6). Moreso, alginate gels are thermostable over the range of 0-100°C (17) and are for therefore
suitable to use in combination with carrageenan gels, which require a heating process up to 90°C (18).
FIG. 1.4: (a) Repetitive structure of G- and M-units in an alginate chain; (b) Network formation of the alginate gel in presence of calcium-ions (19).
1.4 POLYSTYRENE MICROSPHERES
Polystyrene is a synthetic aromatic polymer, composed of linked styrene monomers (20). Polymeric
micro-particles are suitable as a drug delivery system thanks to their controlled-release properties, limited size
and biocompatibility with body cells and tissue. Drugs can be coupled at the surface of the sphere or
encapsulated within the sphere. Although nanoparticles are more beneficial than microparticles, the latter have
been chosen in this thesis in order to improve the investigation of the diffusion at the interface.
(a)
(b)

6
Generally, negatively charged PS spheres, as used in this thesis, show a moderate gastrointestinal
uptake due to (low) affinity to intestinal tissues (21). The structure and dynamics of the matrix determine the
mobility of the spheres (22). In a 1% κ-carrageenan hydrogel for example, the PS spheres get completely
immobilized because of the high crosslinking of the polymers.
FIG. 1.5: Chemical structure of polystyrene (6).
1.5 CONFOCAL LASER SCANNING MICROSCOPY (CLSM)
The confocal laser scanning microscope (CLSM) is based on fluorescence and is used in this thesis to
form an image of the sample and to perform FRAP and RICS. The basic principle is visualized in FIG. 1.6a. The laser
can scan the sample pixel by pixel in the x- and y-direction and at different depths in the z-direction, which is
directed by the scanning mirrors. This can also result in three-dimensional images if the images from adjacent
focal planes (so called z-stack images) are added. It works by optical sectioning of the sample: it generates clear
images of thin sections in thick samples, without any need for physical sectioning (non-invasive method). Only
a bare minimum of sample preparation is required (23) thanks to this way of functioning. The CLSM can also be
used to detect dynamic changes in the microstructure such as phase separation or coalescence (24).
Different lasers with specific wavelength and intensity can be employed and controlled by the acousto-
optical tunable filter (AOTF). These wavelength and intensity settings can precisely and instantaneously be
modified at a high scan rate on a linked computer. The laser illuminates the sample and can be focused onto one
spot in the sample, the focal plane. The fluorophores in the sample will re-emit fluorescent light picked up by a
detector, for each pixel separately. The beam splitter separates the laser light and emitted fluorescent light from
the sample and sends it to respectively the sample and the detector. The detector can consist of a
Photomultiplier Tube (PMT) or a Hybrid Photon Counting (HPC) detector that amplifies its signal (with the gain
setting) and records the fluorescence intensity. The HPC also counts the photons pixel by pixel (24). It creates a
digital signal that can be processed by a computer, which generates the image. The scanning laser beam can be
used to apply a ROI of any size and shape for FRAP (25).

7
A considerable advantage is that the CLSM only allows the emitted fluorescent light from the focal point
(i.e. in-focus light) in the sample to be detected. Most of the out-of-focus light (i.e. from above or below the focal
point that receive much lower laser intensity) can be eliminated with the confocal pinhole so that it doesn’t
reach the detector. The majority of the out-of-focus light is reflected and not included in the final image as
illustrated in FIG. 1.6b. This increases the optical resolution (26). Since CLSM is a fluorescence microscope, the
samples will have to be fluorescent or contain a fluorophore to be visible (24).
FIG. 1.6: (a) Basic principle of the CLSM (24); (b) The confocal pinhole eliminates the out-of-focus light (26).
1.6 FLUORESCENCE
Fluorescence is a particular case of luminescence (27). Fluorescent molecules or fluorophores can
absorb light energy (photons, for example from laser light) with a specific wavelength and re-emit it typically
at a longer wavelength (lower energy) within nanoseconds (24, 28). Only when photons with sufficient and
correct energy are absorbed can a transition happen from the ground singlet energy state (S0) to a higher excited
energy state (usually S1 or S2). The fluorophore receives all the energy that the photon originally had, described
in the Planck-Einstein equation (1.3):
𝐸 = ℎ𝑐
𝜆 (1.3)
Where: E: energy (J)
h: constant of Planck (J.s)
c: speed of light (m/s)
λ: wavelength (1/m)
When the electron falls back to its original ground energy state, the fluorophore emits a photon on its
own as a means to lose its excess energy, as displayed in FIG. 1.7. Because the electron loses some energy by
(a) (b)

8
vibration, rotation and heat, the energy of the emission light is lower than the original absorbed light, which
corresponds to a longer wavelength (1, 24, 28). This difference between the absorption and emission
wavelengths is known as the Stokes Shift (28). The transition takes place swiftly. By emitting fluorescent light
the electrons fall back to the ground state (28).
FIG. 1.7: Example of a simplified energy (Jablonski) diagram illustrating the process of fluorescence (29).
1.6.1 Fluorescent diffusion probes
Fluorescent probes are fluorescent chemical components or fluorophores that can be used in
fluorescent optical techniques and experiments. They can directly be used or attached to molecules that are to
be studied under a fluorescent microscope (1). When determining the mobility properties, it is of great
importance that it does not greatly alter the diffusion and interaction of the molecule of interest (1, 30). For
FRAP experiments it is also necessary to have a fluorescent probe with a good balance between photostability
(stable against bleaching) and photoinstability (easy bleachable at low laser intensity) (2, 31).
1.6.1.1 Fluorescein
Fluorescein and its derivate Fluorescein-5-isothiocyanate (FITC) (FIG. 1.8a and FIG. 1.8b) are commonly
used hydrophilic fluorophores that emit green-yellow light (29, 31). Both fluorescein and FITC are evenly
photostable as instable (31) which is necessary in a FRAP experiment. They possess an opportune long absorption
maximum of approximately 494 nm and an emission maximum of approximately 521nm (29, 32), as described
in FIG. 1.8c.. The molecular weight of fluorescein and FITC is 376Da and 389Da (1), respectively.
Fluorescein is negatively charged and used in many FRAP experiments on its own as it can be bleached
relatively easily. The process of bleaching, however, is not a normal first order reaction, which complicates the

9
measurement of the diffusion coefficient (33). FITC on the other hand is often coupled with dextrans or proteins
(1, 31).
FIG. 1.8: (a) Chemical structure of Fluorescein (b) and its derivate Fluorescein-5-isothiocyanate (FITC); (c) Excitation and emission spectrum of FITC (29).
1.6.1.2 FITC-dextran
Dextrans are hydrophilic polysaccharides of anhydroglucose, typically defined by their high water
solubility and molecular weight (ranging mostly from 3kDa to 2,000kDa), inertness and low toxicity. They are
produced by Leuconostoc bacteria and commonly used as effective carriers for many fluorescent dyes, such as
FITC. They possess α-1,6-polyglucose linkages, which are resistant to cleavage by most glycosidases and are ideal
to use as live cell tracers for this very reason. Their net charge can vary, depending on the method of preparation
and the coupled fluorophore, but dextrans are mostly weakly anionic (32, 34). Due to the large range of molecular
weight, they can be used as a model for drugs, such as peptides and proteins (4).
As mentioned before, FITC is often coupled with dextran-molecules (FIG. 1.9), which gives an ideal
fluorescent probe for FRAP and RICS experiments. 70kDa FITC-dextrans are typically labeled with three to eight
dyes per dextran and are only weakly anionic (32, 33). The free diffusion of FITC-dextran depends on the ionic
conditions and temperature of the sample. 500kDa FITC-dextran shows phase-separation when used in a 1% κ-
carrageenan hydrogel, rendering it unusable in this thesis (5).
FIG. 1.9: Chemical structure of FITC-dextran. It is assumed that the attachment site of FITC (represented by *) is randomly associated with any free hydroxyl group of the dextran molecule (34).
(a) (b) (c)

10
1.7 OPTICAL TECHNIQUES TO MEASURE DIFFUSION
1.7.1 Fluorescence Recovery After Photobleaching (FRAP)
In a FRAP or photolysis experiment, a fraction of the fluorescent labels or fluorophores are
photobleached for a short period of time by irradiation with one or several high-intensity lasers (bleaching, t=0).
Photobleaching induces an irreversible loss of a molecule’s fluorescence ability due to the chemical interaction
of the fluorophore in the excited state with free oxygen (i.e. oxidation). This will cause an immediate decrease
of the fluorescence intensity in the bleached region of interest (ROI), as illustrated in FIG 1.10a. The fluorescence
intensity will however directly recover due to the diffusion of the bleached molecules out of the photobleached
region and the diffusion of the fluorescent molecules from surrounding unbleached areas into the ROI (t>0), as
shown in FIG. 1.10b. Typically a ROI in the range of 5 to 50µm in diameter or length is chosen for FRAP experiments
(1). The time evolution of this recovery can be monitored with the CLSM or another fluorescent microscope, from
which the diffusion rate can be measured on a micrometer scale (0.01 to 100µm2/s) (1).
This technique is very interesting as it is a non-invasive and very specific method to determine the
diffusion coefficient and interaction properties (molecular dynamics in general) of samples. The immobile
fraction of bleached molecules can also be determined by the difference between the fluorescence intensity
before the photobleaching and after the experiment (t∞) (1, 4). It is assumed that the photobleaching is
irreversible so that the fluorescent recovery is stated to nothing but the diffusion of the fluorophores (31).
FIG. 1.10: Simple presentation of a FRAP experiment: on t<0 a pre-bleach image is taken without any bleaching performed. On t=0 the circular ROI is fully bleached by the laser, causing the fluorescence intensity of the fluorophores to drop inside this ROI. The bleached fluorophores that lost their fluorescent ability are presented by the black spots in (b). Over time (t>0 and t∞) the bleached fluorophores will diffuse out of the ROI and un-bleached fluorophores from outside the ROI will diffuse inside the ROI, causing the fluorescence intensity to rise again. (a) Recovery curve of a FRAP experiment with the mean fluorescence intensity of the fluorophores inside the ROI in function of the time; (b) Illustration of the mechanism of the FRAP technique in relation to CLSM images over time (35).
(a) (b)

11
In order to carry out a FRAP experiment correctly, certain requirements must be met: All the fluorescent
probes (sodium fluorescein or FITC-dextran as used in this thesis) must be distributed evenly inside the samples.
The laser beam must also be able to pass through the sample and the used FRAP evaluation model and
experimental settings must be appropriate for the FRAP experiment (2). It is also important to use an objective
with a relative low numerical aperture (NA) to acquire a cylindrical bleaching profile, which is assumed in the
FRAP model (see 3.1.5), and gives a better bleaching as well (10). This way, only two dimensional lateral diffusion
has to be considered, as the bleaching generates no significant gradient in the z-direction (22). Another very
important criterion of a FRAP experiment is that a bleaching of 30% of the pre-bleach fluorescence intensity
should be achieved to have a good FRAP measurement (35).
1.7.2 Correlation spectroscopy
Fluorescence correlation spectroscopy (FCS) and imaging correlation spectroscopy (ICS) are important
correlation spectroscopy techniques for measuring molecular mobility. In FCS the fluctuations in the fluorescence
intensity of the observed diffusing fluorophores are analyzed, which correlates with the diffusion rate. On the
other hand, ICS is a type of extension (imaging analog) of FCS that provides better spatial coverage as it uses an
entire microscope image but is limited to rather slow diffusion (1, 36).
The fluorescent raster imaging correlation spectroscopy (RICS) combines the advantages of both
methods: spatial information from ICS and temporal information from FCS. It uses the raster-scan images of the
CLSM, where the scanning laser moves sequentially in the x-direction for a much shorter time than the adjoining
pixels in the y-direction, as illustrated in FIG.1.11. The fluorescence intensity is measured one pixel at a time,
where ‘pixel’ stands for a localized intensity measurement. The laser starts measuring at the top left pixel from
left to right. When the top row of pixels is collected, the laser starts collecting the second row from the left to
the right. This process goes on until the entire image is obtained. It generates temporal information (since each
pixel is collected at a different time) on the diffusion of the molecules of every single image in a range of seconds
(images), milliseconds (scan lines) and microseconds (pixels) (1, 36, 37).
Using RICS analysis, the diffusion coefficient and concentration is determined from the images, starting
with background subtraction followed by image correlation. The image autocorrelation is estimated in all
frames, averaged and fitted relating the correlation to the particle concentration and the diffusion coefficient
using the equation described in literature (38, 39). Typically a diffusion coefficient on a micrometer scale can be
measured, like FRAP (1).
The biggest difference with FRAP is that in RICS no photobleaching is performed and that, besides the
diffusion coefficient, RICS can also measure the concentration of fluorescent probes in mediums (39) It is also
possible to generate a two-dimensional diffusion coefficient map with this technique (1, 36, 37).
12
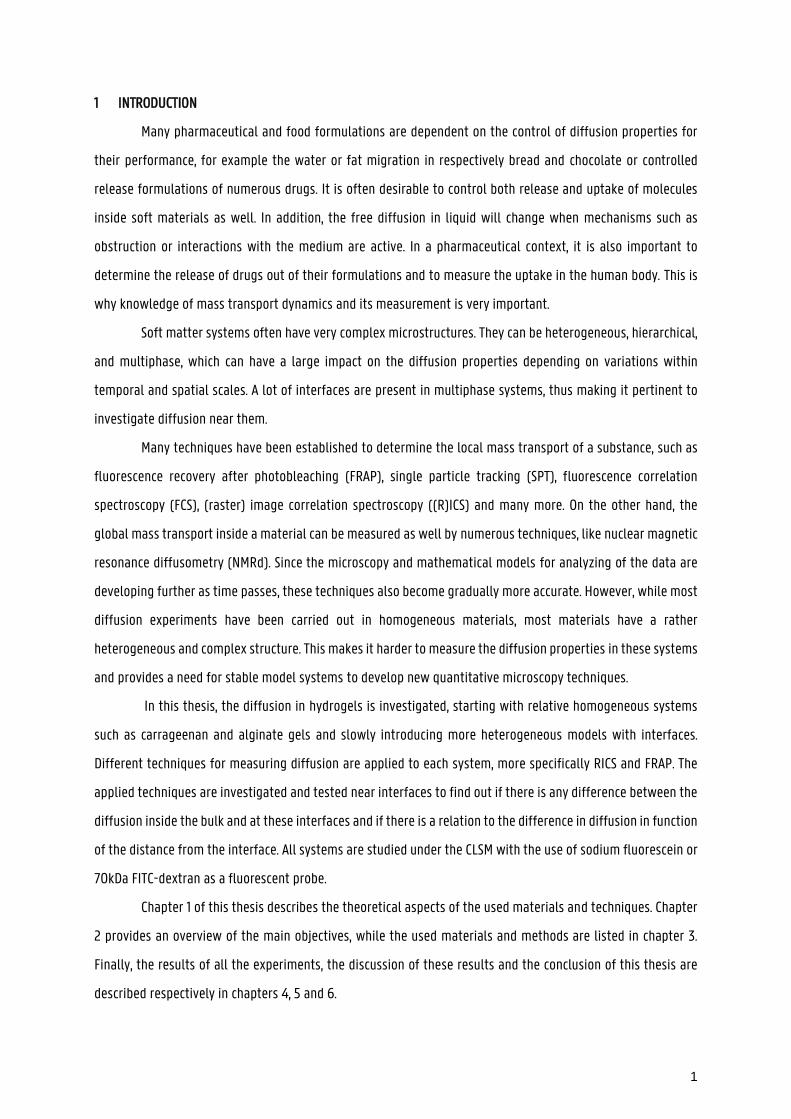
However, RICS is sensitive to experimental settings. For example, if the scanning rate is too high, but
the diffusion is slow the estimate of the diffusion coefficient will most likely be less accurate (38). It is therefore
interesting to investigate the best scanning rates for the sample, as carried out in this thesis. A normal RICS
method only accepts squared ROI. Another recently developed method exists that allows the use of ROIs with an
arbitrarily shape (of any shape), known as ARICS or Arbitrary-Region RICS (33).
FIG. 1.11: Movement of the scanning laser in a raster scan by CLSM, where τp and τl are respectively the scanning
time between pixels in x- and y-direction (37).

13
2 OBJECTIVES
Numerous types of solutions and gels with different fluorescent probes have been used as a model to
study the mobility of molecules in the past, but there is a need for a stable and heterogeneous model. In this
project the point of focus is the development of stable and flexible models for heterogeneous structures that
are easy to control. The second purpose of this thesis is to increase the understanding of the mass transport near
interfaces and in the bulk of two different phases in a heterogeneous model. In order to control, design and
optimize the diffusion properties of a substance, it is important to investigate the mass transport in
heterogeneous materials and its restrictions by the structure and the heterogeneity of the system on different
length scales.
Following tasks were formulated to accomplish the goals of this project:
Evaluation of a 1% κ-carrageenan hydrogel with 50µm PS spheres as a model system.
Determination of the effect of different concentrations (from 20ppm to 200ppm) of sodium fluorescein
on FRAP experiments in a 1% κ-carrageenan gel.
Evaluation of the use of sodium fluorescein and 70kDa FITC-dextran as a fluorescent diffusion probe in
a 1% κ-carrageenan gel.
Evaluation of a 1% κ-carrageenan hydrogel with a 2% or 4% alginate gel as a model system.
Evaluation of different production techniques for alginate gels.
Measurement of the diffusion coefficient of the fluorescent diffusion probe inside a carrageenan gel
and alginate gel separately using both FRAP and RICS techniques. Measurements of the probe inside
distilled water can be used as a reference.
Evaluating the use of different sizes (length of 50µm to 5µm) of rectangle ROIs in FRAP experiments
together with different zoom functions.
Determining the optimal scanning rate for the measurement of the diffusion coefficient of the probe in
a carrageenan gel and evaluating different zoom functions using RICS.
Measurement of the diffusion coefficient of the probe near the interface of a carrageenan and alginate
gel using both FRAP and RICS techniques.
Because the PS spheres have a solid and impenetrable surface, the boundaries will be extremely sharp,
resulting in a well-defined and limited interface. This will be the more homogeneous model. In the model with
the alginate gel inside the carrageenan, the interface will be less well defined and not limited because of the
penetrable and diffusible alginate gel. This will be the more heterogeneous model. FRAP and RICS will be

14
performed on each model to determine the diffusion and to test each technique at the interfaces and bulk. For
the FRAP and RICS experiments near the interface, each observed ROI will always be placed at the interface of
the two gels and gradually further away from the interface in each hydrogel phase. Measurements of the
diffusion coefficient will also be made in the bulk-phase of the gels to investigate any possible difference in
mobility between the experiments near the interface.
The purpose of this project is to increase the understanding of diffusion properties inside
heterogeneous biomaterials. The structure designs of the systems used in this thesis can be employed as a model
for real food or pharmaceutical products in order to control the diffusion properties of these preparations, like
controlled release preparations.

15
3 MATERIALS AND METHODS
All gels and solutions were made with distilled and ultrafiltrated water from a NANOpure system
(Barnstead/Thermolyne, Dubuque, IA, USA). All gels were made and stored in glass vials of 5 mL with a plastic
snap-cap (Hecht-Assistent, Sondheim, Germany). The observed samples mostly contained 7 to 8µL of the
hydrogel or solution in a Secure-Seal™ adhesive spacer (Molecular Probes, Invitrogen, Eugene, OR, USA) that is
absorbed in a sandwich manner onto two cover-glass slides giving perfectly defined dimensions of the sample:
120mm in depth and 9mm in diameter. It also avoids evaporation and convection (33) and restricts possible flow
(5). Some samples were observed in a metallic cup instead, with a cover glass placed on top. The carrageenan
hydrogel was poured into the metallic cup and cooled down, giving a flat surface. The alginate bulk gel, produced
by the internal method was instead cut and placed inside the metallic cup, as the gelling process is different
from the carrageenan gel. Every sample was prepared twice to establish reproducible experiments. Generally,
the samples were analyzed a few hours after the preparation, to ensure the obtaining of the final
microstructures after the gelation process.
3.1 HYDROGEL
3.1.1 Carrageenan gel
First a stock solution of 500mM (0.5M) KCl (Merck KGaA, Darmstadt, Germany) was made by dissolving
1.86g KCl in 50mL distilled water. 5mL of a 1% w/v κ-carrageenan hydrogel was made by adding 0.05g κ-
carrageenan (Danisco Cultor, Grindsted, Denmark) in a closable vial of 5mL with 5mL of total solution. The total
solution of 5mL consists of 100mM (0.1M) KCl, the required volume of the desired concentration of the
fluorescent diffusion probe and distilled water. The mixture was then heated under stirring at 90ᵒC in a warm
water bad for 15 minutes, while closing the vial to prevent evaporation. It was then cooled down to room
temperature (20ᵒC) to initiate the gelling-process (18). The final sample must always be covered by aluminum
foil when not in use. This prevents possible bleaching of the fluorescent probe by stray light (40, 41).
Because of the inability to pipet the final hydrogel into the secure seal spacer on the cover glass, the
hydrogel must be pipetted right after the heating of the mixture, when it is still in liquid phase. The pipet points
were put into an oven on 90ᵒC for a few minutes to be on the same temperature as the hydrogel. The sample
was then pipetted into the closed seal on the cover glass as quickly as possible to avoid clotting of the gel in the
pipet.

16
3.1.2 Alginate gel
A stock solution of 20mL 2% and 4% (w/v) sodium alginate solution was made, by gradual adding respectively
0.4g and 0.8g sodium alginate (Aldrich, Sigma-Aldrich, St. Louis, USA) to 20mL distilled water at room
temperature under vigorous stirring until it completely dissolved. If necessary the dispersion could also be
warmed up to 80ᵒC in a water bath under stirring while covering it to avoid evaporation (42). For the FRAP and
RICS experiments, a 4% alginate solution was made with respectively 100ppm and 80nM 70kDa FITC-dextran.
3.1.2.1 Droplet method
The alginate gel-beads were prepared by using the dripping technique, as shown in FIG. 3.1. the sodium
alginate solution was released dropwise from a stainless steel needle and collected in a 0.5M CaCl2 solution
(using calcium chloride dehydrate, CaCl2.2H2O, Merck KGaA, Darmstadt, Germany) (43). This way the calcium ions
diffuse from the outside of the drop towards the center of the bead,
causing the gelling of the outside of the drop to be faster than the inside.
The alginate particle size depends on the size of the initial drop. This way
the beads of 500µ to 200µm could be formed. To produce smaller drops,
a tweezer is used to take the small alginate drop from the needle and
place it in the CaCl2 solution. These beads were small enough to be placed
in a closed seal spacer. For the FRAP interface experiments 5 of the
smallest beads were placed in a closed seal spacer on a sample glass. The
heated carrageenan gel was pipetted onto the cover glass with the beads
and finally a cover glass was placed on top of the sample. Smaller microbeads could in theory be produced with
the modified emulsification method as reported in some articles (44). This is however a method to produce solid
core-microbeads instead of gel-beads and therefore not appropriate for this thesis.
3.1.2.2 Internal method
To produce a relatively homogeneous alginate gel, the so-called internal method was employed by
controlled release of calcium. In this method, insoluble calcium carbonate was dispersed in the alginate solution.
Next, a slowly hydrolyzed acid glucono-δ-lactone (GDL) is added to the system. GDL gets deprotonated over time
by slow hydrolysis of the lactone causing the calcium salt to be solubilized and the gelling process to start.
Because of the fast chelation of calcium alginate, it is necessary to slowly introduce the calcium ions in the
mixture (15).
FIG 3.1: Preparing the alginate gel-beads by using the dripping technique in the CaCl2 solution.

17
2mL of a 4% sodium alginate solution was prepared with the required volume of the stem solution of
70kDa FITC-dextran to obtain a final concentration of 100ppm in the mixture. CaCO3 (Acros Organics, Thermo
Fisher Scientific, New Jersey, US) and GDL (Jungbunzlauer S.A., Basel, Switzerland) were introduced to the
alginate and FITC-dextran mixture. A final concentration of 30mM CaCO3 and 60mM GDL was obtained. The vial
was sealed and covered with aluminum foil and stored at room temperature for 2 days prior to use. It is necessary
to always maintain a CaCO3 to GDL molar ratio of 0.5 to prevent changes in pH value (15, 45).
For the RICS experiments in the bulk of the alginate gel and at
the interface between the alginate and the carrageenan gel, the alginate
gel was cut into small pieces and placed in a metallic cup in random order
with a sample glass on top of it. For the interface experiments, the
heated carrageenan gel was quickly poured between the alginate gel
pieces, to create the interfaces between the two gels, as shown in FIG.
3.2. Both gels were prepared with the 70kDa FITC-dextran concentration
of 80nM.
3.1.3 Mixture of Carrageenan and Alginate
A mixture of 2mL 1% carrageenan gel and 1mL 4% alginate gel was made, both with a 70kDa FITC-dextran
concentration of 100ppm. The alginate mixture was prepared using the internal method protocol as described
in 3.1.2.2 on the same day as the carrageenan gel. The carrageenan mixture was prepared using the protocol
described in 3.1.1, without heating. The alginate mixture was then mixed with the carrageenan gel while heating
and stirring the entire solution. After heating the mixture was cooled off to form the carrageenan gel. The
mixture was kept at room temperature to complete the formation of the alginate gel.
3.2 POLYSTYRENE MICROSPHERES
The non-fluorescent PS microspheres with carboxylate surface modifications (Phosphorex, Inc.,
Hopkinton, MA) were selected in this thesis with a diameter of 50μm, to observe the diffusion at the boundary
inside a 1% carrageenan gel. The hydrophilic carboxylate modifications were chosen to distribute the spheres
easier in the hydrogel. The particular diameter of 50µm was selected to have a well-defined surface and to fit
inside the closed-seal samples. Smaller particles might lead to more undefined interfaces and an undesirable
curved surface. Another reason for this diameter is that the used ROIs in the FRAP experiments (50µm to 5µm in
length) should not be bigger than the bead itself.
The spheres must first be dispersed in some distillated water and vortexed for 5 minutes to ensure the
microspheres are fully distributed in the mixture. The PS spheres were then added in the 1% κ-carrageenan
FIG. 3.2: 4% alginate (rather opaque) and 1% carrageenan gel (transparant) with 80nM 70kDa FITC dextran in a metallic cup.

18
mixture with a concentration of 1% and 0.1%. Instead of heating up to 90ᵒC, the total mixture was now heated
under stirring at 80ᵒC for 15 minutes. Heating up the PS spheres above this temperature might lead to problems
as the glass transition temperature (Tg) is 94̊C, according to the manufacturer (20).
3.3 FLUORESCENT DIFFUSION PROBES
For FRAP experiments sodium fluorescein (Fluka, Sigma-Aldrich, St. Louis, USA) and 70kDa FITC-dextran
(Invitrogen, Eugene, Oregon, USA) were used as a diffusion probe. For RICS experiments only 70kDa FITC-dextran
is used. The probes must always be dissolved in distilled water first to ensure a homogeneous and unhindered
distribution in the water and afterwards in the sample (final hydrogel-solution mixture) as well. Otherwise the
diffusion in the gel can be affected by the presence of a possible concentration gradient of the probe. Initially a
more concentrated stem solution was made in distilled water (e.g. 500ppm) to fully allow a homogeneous
distribution. The probe solutions were then added to the vial of the mixture always in such volumes to reach the
desired final probe concentration (e.g. 100ppm) (5) together with the desired volume of the KCl stem solution
and the distilled water. Before adding the carrageenan, the mixture was always vortexed for a couple of minutes
for the same reason as above. To prevent the bleaching by stray light, the stock solution must always be covered
with aluminum foil as well (40, 41).
The chosen concentrations of the fluorescent probes are all well-within the concentration range in
which a linear ratio is shown between the fluorescence intensity (signal) and the concentration of the
fluorescent probe (41). This is required since the used analysis model assumes that the fluorescence intensity of
the used fluorescent probes is more or less linear depending on the concentration, see 3.5.1.
3.3.1 Fluorescein
A stock solution of 500ppm was made by dissolving 25mg sodium fluorescein in 50mL distilled water.
A concentration of 20ppm, 50ppm, 100ppm and 200ppm were obtained from this solution. These concentrations
were used to determine which concentration is the most optimal to use in a FRAP experiment.
3.3.2 70kDa FITC-dextran
A stock solution of 400ppm was made by dissolving 4mg 70kDa FITC-dextran in 10mL distilled water.
As mentioned by the manufacturer, the aqueous stock solution of FITC-dextran should be stored at 2-6ᵒC when
not in use (6). From this solution, a concentration of 50ppm and 100ppm were obtained for the FRAP
experiments. However, for the RICS experiments, lower concentrations of the probe were used, such as 20nM,
50nM and 80mM. The fluctuations in fluorescence intensity when the fluorescent probe enters or leaves the ROI
are registered with the RICS technique, which is only possible if the concentrations of the probe are low enough

19
(in the nanomolar concentration range). If higher concentrations are used, the fluorescence intensity would be
constantly high, resulting in no fluctuations to be seen. This concentration corresponds to one molecule per
detection volume (46). The concentrations of 70kDa FITC-dextran were chosen as found in some literature, where
sodium fluorescein was used to determine the concentration range with the lowest associated errors (38) and
as described in some articles with 500kDa FITC-dextran as a probe for RICS experiments (42).
3.4 CLSM
All FRAP experiments were performed on a Leica SP2 AOBS (Acousto-
Optical Beam Splitter) CLSM as showed in FIG. 3.3 and all RICS experiments on
a Leica SP5 CLSM (Heidelberg, Germany). For all experiments, the built-in
488nm emission argon (Ar-ion, Ar/ArKr) laser of the CLSM was operated for
imaging and bleaching. The PMT and HPC detector were both set at the
wavelength range of 500nm to 650nm (ideally for sodium fluorescein and
FITC dextran, see 1.7). All diffusion coefficients were calculated using Matlab
(MathWorks, Natick, MA).
3.5 FRAP
The used objectives were PL FLUOTAR 10x 0.30NA dry (Leica, Heidelberg, Germany) and HCX APO L 20x
0.50NA Water immersion U-V-I objective (Leica, Heidelberg, Germany). An image format of 256x256, gray scale
and depth of 12bit was chosen for every experiment without the use of a beam expander (it was kept at 1). The
pinhole was kept at 20µm. All other images apart from FRAP experiment and FRAP images were always in
1024x1024 format. For bleaching, 100% of the maximum power of the laser was used, with a zoom-in during
bleaching, to maximize the photobleaching (1). For most FRAP experiments 50 pre-bleach images were made,
with one bleaching frame and 100 to 150 post-bleach images. For the 10µm ROI however, it was generally
required to take 2 bleach images in order to achieve an adequate bleaching in relation to the pre-bleaching
fluorescence intensity. In general, the AOTF was set on 4% laser intensity, with the total laser power set on
approximately 40% for the used CLSM.
The optimal scanning speed of FRAP experiments depends on the diffusion coefficient of the analyzed
probe. But the higher the scanning speed, the lower the image quality will be, leading to more noise in each pixel
(35). The scanning speed of 800Hz was chosen in the unidirectional scanning mode for every experiment,
corresponding to a time of 0.5s per frame. When using the 20x objective, a zoom factor of 4 was used for the
50µm ROI, 8 for the 20µm and 16 for the 10µm ROI, yielding a pixel size of respectively 732.42nm, 336.21nm and
183.11nm. In every FRAP experiment the ROI was carefully placed in the center of the image (47).
FIG. 3.3: The Leica SP2 AOBS CLSM used in this thesis
20
The depth in the sample was mostly kept at 30µm under the cover glass for every experiment, unless
explicitly noted, to decrease the possible effect of inner filtering (1). Most FRAP experiments were repeated a
couple of times at different random positions in the same sample to receive reproducible results. In addition, for
every FRAP and RICS measurement in the bulk gels, the sample was always examined in three dimensions before
the start of the experiment to ensure that the diffusion in the ROI is not influenced by possible boundaries
nearby (25, 35).
3.5.1 Analysis
The model used for the analysis of the FRAP data was the rectangle FRAP (rFRAP) model, a newer
alternative pixel-based model, where a rectangular bleached area (ROI) can be used instead of the more usual
circular ROI. It is a very fast and practical method that reckon with the full temporal and spatial information of
the images and is not restricted by the ROI size, giving a maximum flexibility (25). This model can thus use ROI
with a length of 10µm or lower as it is valid for all rectangle sizes and aspect ratios. FRAP experiments can
therefore be performed closer to the interface, which is interesting in this thesis. It also not affected by diffusion
during the bleaching (1). In a pixel-based model every pixel in the images is used for extimating the parameters
(41).
One drawback is that it is only valid for a limited amount of photobleaching: as it assumes a linear
photobleaching process no more than 50% of bleaching should be carried out on the ROI (1, 25). It also assumes
that the fluorescence intensity of the used fluorescent probes is more or less linear depending on the
concentration. This is only valid if the concentration of the fluorescent probe (Na2Fluorescein or FITC-dextran) is
low enough (41). The calculations, recovery curves and residual plots of the FRAP experiments were analyzed
with an in-house developed Matlab script (48) based on (49).
3.6 RICS
For every RICS experiment 100 frames were taken, which is generally sufficient for a good S/N ratio (38).
The format of each frame is 512x512 and 8Bits and the time-mode xyt was used. A 1.2NA 63x water immersion
HCX PL APO objective (Leica, Heidelberg, Germany) was used. A zoom factor of 7, 12 and 16 was utilized for most
experiments, yielding a pixel size of respectively 68.78nm, 40.12nm and 30.09nm. The lights of the room where
the measurements were performed needed to be turned off, to protect the sample from tray light during RICS
experiments. A HPC detector was used instead of the PMT for the experiments. The PMT detector was however
used to find the desired area in the sample, both set in the wavelength range of 500nm to 650nm.
To make it practically achievable, 400 frames were used in most RICS experiments. By increasing the
laser intensity, a higher photon count was acquired. However, to prevent photobleaching, the AOTF was set on

21
4% laser intensity for all experiments, giving a photon count of approximately 10 for each frame. The total laser
power was set on 20% for the used CLSM. The HPC detector, which is more sensitive, compensates for the low
laser power (39).
The depth in the sample was kept at 10µm under the cover glass. A series of experiments with a scanning
rate of 10Hz to 1000Hz were performed. In the carrageenan sample a FITC-dextran concentration of 20nM, 50nM
and 80nM were used, in the alginate and water sample only the 80nM concentration. It became clear that the
20nM and 50nM concentration of the probe in the sample needed too much laser intensity (i.e. 10% to 20% laser
intensity) by the AOTF to achieve a sufficient photon count in the RICS experiments, which is not favorable
because of the higher risk of bleaching. The probe concentration of 80nM required less laser intensity and was
therefore chosen for all next experiments.
The whole image was always selected for data analysis. A Matlab script kindly provided by Prof. Marcel
Ameloot and Dr. Nick Smisdom from Hasselt University (UH RICS program, Belgium) was used to analyze the RICS
experiments and estimate a diffusion coefficient using the calculated correlation function and residual plot as
described in (50, 51).

22
4 RESULTS
At first, the model system of a 1% carrageenan hydrogel with polystyrene spheres is evaluated.
Preparations with sodium fluorescein or 70kDa FITC-dextran as a diffusion probe are investigated to define the
best fluorescent probe to use. Next, the diffusion in rather homogeneous preparations is studied at micrometer
scale: 1% κ-carrageenan gels and 2% to 4% alginate gels. Finally the diffusion in more heterogeneous
preparations are investigated, i.e. the carrageenan gel together with the alginate gel in the form of beads or
bulk gel. In particular, the diffusion near the interface is studied. In this chapter, the FRAP experiments are listed
first, followed by the RICS experiments. It is important to note that all diffusion coefficients are described as a
mean of the diffusion coefficient of the performed experiments together with the calculated standard deviations
as error bars in the graphs. All listed images are shown in self-chosen colors (not the real colors of the
preparations) and generated with the CLSM.
4.1 POLYSTYRENE SPHERES INSIDE CARRAGEENAN GEL
FIG. 4.1: CLSM images of 1% carrageenan gel with 1% 50µm PS-spheres and 100ppm Na2Fluorescein. A scale bar of 100µm (left) and 50µm (right) is specified.
FIG. 4.1 shows the CLSM images of the PS-spheres inside the 1% κ-carrageenan gel with sodium
fluorescein as a fluorescent diffusion probe. The green background represents the carrageenan gel. The black
and dark or very bright circles represent the PS-spheres. Light-scattering of the laser light of the CLSM on the
spheres causes the boundaries of the spheres to appear unclear. It seems that the chosen concentration of PS
spheres is too high, as it would be difficult to measure the diffusion coefficient at the boundaries with FRAP as
the spheres are so close to each other as seen in FIG. 4.1. In order to remove the possibility of the diffusion being
altered by other PS spheres near the bleached area, a lower concentration of PS spheres inside the carrageenan
gel is chosen, namely 0.1%. This seems to be a more optimal concentration because the spheres are much further
away from each other, as represented in FIG. 4.2.

23
FIG. 4.2: CLSM images of 1% carrageenan gel with 0.1% 50µm PS-spheres and 100ppm Na2Fluorescein. A scale bar of 100µm (left) and 50µm (right) is specified.
4.2 FRAP EXPERIMENTS
The CLSM and the Matlab script shows for each FRAP experiment the recovery curve with the mean
fluorescence intensity of all pixels in the ROI of each image (a.u.) in function of the time (s). Some recovery curves
are listed in this chapter. The green line in the recovery curve of the CLSM refers to this mean fluorescence
intensity of all pixels in the ROI of each pre-bleach, bleach or post bleach image taken at different times. The
first straight line at the beginning of the curve describes the calculated intensity of the images before the
bleaching (pre-bleach). The drop of the fluorescence intensity presents the bleaching and the recovery of the
curve is described by the fluorescence intensity of the images right after the bleaching (post-bleach) as
illustrated in FIG. 1.10a. The red circles in the recovery curve by the Matlab script represent the experimental data
of the post-bleach images only and the solid black line illustrates the corresponding fit of the rFRAP model. It is
interesting to note that the recovery curves of the CLSM illustrate the bleaching extend in relation to the pre-
bleaching intensity, while the recovery curves of the Matlab script show the fitting of the model with the real
data of the FRAP experiments.
4.2.1 Concentration effect of sodium fluorescein
All experiments are performed with a circular ROI of 50µm in diameter. The diffusion coefficients are
not calculated. For the concentration of 20ppm (FIG. 4.3A) of sodium fluorescein, the recovery graph of the FRAP
experiment shows a very weak fluorescence intensity and a few fluctuations appear to overshadow the signal.
The concentration of 50ppm (FIG. 4.3B) shows a slightly better bleaching than the 20ppm, but the bleaching
extend is less than 30% of the pre-bleach fluorescence intensity, as well. The concentrations 100ppm (FIG. 4.3C)
and 200ppm (FIG. 4.3D) show a better bleaching profile. It appears that only a concentration of 100ppm of
sodium fluorescein can achieve a bleaching extend of more than 30% of the pre-bleach fluorescence intensity.

24
FIG. 4.3: The recovery curves displayed by the CLSM. All investigated samples are a 1% κ-carrageenan gel with Na2fluorescein as a diffusion probe. A circular ROI of 50µm in diameter is used. The concentration of the probe is (A) 20ppm; (B) 50ppm; (C) 100ppm; (D) 200ppm.
4.2.2 Carrageenan bulk
The results of the FRAP experiments inside the 1% κ-carrageenan gel are listed in FIG. 4.4. The ROI with
a length of 10µm has a lower standard deviation because only 2 experiments had a good recovery curve and they
happened to be close. For the ROI with a length of 20µm, on the other hand, 7 good recovery curves were found,
which led to a higher standard deviation. The diffusion coefficients are relatively consistent for the two ROI sizes.
FIG. 4.4: Average diffusion coefficients of 100ppm 70kDa FITC-dextran in 1% κ-carrageenan gel with a rectangle ROI of 10µm and 20µm in length.
An example of the recovery curve of the CLSM of a FRAP experiment and the recovery curve of its analysis
by the Matlab script is listed in FIG. 4.5. In contrast to the bleaching of sodium fluorescein in previous
experiments, bleaching appears to be easier with 70kDa FITC-dextran as a fluorescent probe in the carrageenan
0.00
5.00
10.00
15.00
20.00
25.00
30.00
Dif
fusi
on
co
eff
icie
nt
(µm
²/s)
ROI 10µm
ROI 20µm
A B
D C

25
gel. Even with just one bleaching frame and a lower ROI size (20µm instead of the 50µm with sodium fluorescein
in the first experiments described in 4.2.1), a bleaching of more than 30% of the pre-bleach fluorescence intensity
is achieved.
FIG 4.5: A FRAP experiment inside a 1% κ-carrageenan hydrogel using a rectangle ROI with the length of 20µm. (A) the recovery curve formed by the CLSM; (B) the recovery curve plotted by the Matlab script.
The analysis of these FRAP experiments of 70kDa FITC-dextran inside a carrageenan gel using a binding
and diffusion model shows relatively extreme values of kon and koff (generally in the order of respectively 10-4
and 101).
4.2.3 Alginate bulk
4.2.3.1 Droplet method
The first image in FIG. 4.6 is taken directly after inserting 2% alginate beads in a 50ppm 70kDa FITC-
dextran 1% carrageenan gel, without dissolution of the 70kDa FITC-dextran in the alginate bead beforehand.
After approximately 30 minutes, it is clear on the second image that the probe distributes from the carrageenan
hydrogel into the alginate bead, and this in a heterogeneous matter. Next, the alginate beads are kept in the
carrageenan gel for 2 days and the distribution of the fluorescent probe is evaluated again. It appears that the
fluorescent probe never fully distributes equally between the carrageenan gel and the alginate bead.
Because of this distribution process, it is assumed that a higher concentration of FITC-dextran is needed,
i.e. 100ppm instead of 50ppm. Also, in order to have a higher probability to have a difference in diffusion
coefficient between the alginate and the carrageenan gel, a higher concentrated alginate bead is made for the
FRAP and RICS experiments, i.e. 4% instead of 2%. Furthermore, to perform better FRAP experiments inside the
alginate beads, the beads are to be made with 100ppm ́70kDa FITC-dextran.
A B

26
FIG. 4.6: 2% alginate bead (represented as the dark circle on top of the image), without any FITC-dextran in 1% κ-carrageenan gel with 50ppm FITC-dextran, in a metallic cup. At first no probe is present inside the alginate bead (left). After approximately 30min the fluorescent probe starts to diffuse inside the alginate bead in a heterogeneous manner (right). Scale bar is 200µm left and 100µm right.
It appears that the alginate beads are slightly bigger than 120µm, which is the depth of the closed-seal.
When the beads are placed inside the closed-seal sandwiched sample glasses, they will be deformed because of
the pressure, leading to a more compact alginate bead as seen in FIG. 4.7.
FIG. 4.7: Deformation of an 4% alginate bead in the center of the image with 100ppm FITC-dextran inside, in a 1% κ-carrageenan closed seal sample (left). Right is a zoomed-in image to visualize the heterogeneity inside the bead. Scale bar is 200µm left and 50µm right.
The alginate drop is very heterogeneous and compact, which makes it very hard to perform FRAP
experiments inside this bead. The attempted FRAP-experiments were not successful and resulted in variable and
strange recovery curves. A different sample with a big alginate drop was made inside a metallic cup, giving better
recovery curves. The results of the experiments are listed in FIG. 4.8.

27
FIG. 4.8: Average diffusion coefficients of 100ppm 70kDa FITC-dextran in 4% Alginate gel produced by the droplet method with a rectangle ROI of 20µm and 50µm in length.
4.2.3.2 Internal method
A more homogeneous alginate gel is obtained with the internal method. It appears that the gel made
with the internal method is less heterogeneous than the gel made with the droplet method. However, there is
still a certain degree of inhomogeneity visible inside the alginate gel as seen in FIG. 4.9, though less
heterogeneities are visible in contrast to the alginate drop as seen in FIG. 4.7.
FIG. 4.9: CLSM image a 4% alginate gel with 100ppm 70kDa FITC-dextran, made with the internal method. Scale bar is 200µm.
It is experienced that the bleaching of 70kDa FITC-dextran in the FRAP experiments is easier in contrast
to the bleaching of the probe inside the carrageenan gel. A relative low diffusion coefficient of the probe is
measured with FRAP in the alginate gel, produced by the internal method, as listed in FIG. 4.10.
0.00
5.00
10.00
15.00
20.00
25.00
30.00
Diff
usio
n co
effic
ient
(µm
²/s)
ROI 20µm
ROI 50µm

28
FIG. 4.10: Average diffusion coefficients of 100ppm 70kDa FITC-dextran in a 4% alginate gel produced by the internal method by FRAP using a rectangle ROI of 10µm and 20µm in length.
4.2.4 Interface
All the FRAP experiments at the interface are carried out in a 1% κ-carrageenan hydrogel with 100ppm
70kDa FITC-dextran, near the interface of 4% alginate beads without 70kDa FITC-dextran, as shown with two
CLSM images in FIG. 4.11. The sample is examined 24 hours after its production. The experiments started with the
placement of the ROI relative far away from the interface to gradually closer by.
FIG. 4.11: 4% alginate bead (black area, C) inside a 1% carrageenan gel (lighter (A) and slightly darker areas (B)) in a closed seal sample. The concentration of 70kDa FITC dextran in the carrageenan gel is 100ppm. Scale bar is 100µm (left) and 200µm (right).
It appears that the carrageenan show lighter and darker phases inside the closed seal samples, in
contrast to the samples in the metallic cups. All FRAP experiments are performed inside the lighter carrageenan
areas since these phases are bordering with the alginate beads.
FIG. 4.12 shows the results of the FRAP experiments executed with different sizes of ROI. The average
diffusion coefficients with their standard deviations are plotted in function of the distance of the chosen ROI
from the interface.
0.00
0.50
1.00
1.50
2.00
2.50
3.00
3.50
4.00
Diff
usio
n co
effic
ient
(µm
²/s)
ROI 10µm
ROI 20µm
A
B
C
B B
C
A

29
FIG. 4.12: Average diffusion coefficients of 100ppm 70kDa FITC-dextran in 1% κ-carrageenan gel in function of the distance of the interface with the 4% alginate bead. A rectangle ROI of 10µm, 20µm and 50µm in length are used.
There appears to be a somewhat increasing trend in diffusion of the probe in the carrageenan bulk when
placing the ROI further away from the interface with the alginate bead. The measured diffusion coefficients at
the range of 30µ to 100µm from the interface are relatively consistent. It is interesting to notice that the ROI of
50µm in length shows less noise, but measures the average diffusion coefficient as the ROI covers a relative
large distance, also illustrated in FIG. 4.13. It gives the diffusion coefficient of the probe in a bigger fragment of
the structure. The ROI of 10µm in length, on the other hand, shows more noise but covers less distance and shows
the diffusion coefficient of the probe in a more localized region in the hydrogel.
FIG. 4.13 is an illustration of the performed FRAP experiments near the interface, with the sizes of the
ROI in function of the distance from the interface. The distance from the interface should be interpreted as the
the distance from the interface to the left border of the ROI for all experiments. The rectangles represent the
ROIs according to their sizes. All ROIs are placed inside the carrageenan gel. FIG. 4.14 is an illustration of the
experiments shown with the real CLSM images with the bleached ROI of 20µm in length.
As an example of the FRAP experiments near the interface of the 4% alginate bead inside the 1%
carrageenan gel, some grayscale images of the experiments are listed in FIG. 4.15 for each ROI size used, as well
as the recovery curves of the CLSM and the recovery curve formed with the Matlab script in FIG. 4.16.
0
5
10
15
20
25
30
35
0 10 20 30 40 50 60 100
Diff
usio
n co
effic
ient
(µm
²/s)
Distance from interface, r (µm)
ROI 10µm
ROI 20µm
ROI 50µm

30
FIG. 4.13: Illustration of the FRAP experiment near the interface with the ROI size in function of the distance from the interface. Each rectangle ROI of 10µm, 20µm and 50µm in length is placed inside the carrageenan gel with a distance far away from the interface to closer to the alginate bead.
FIG. 4.14: An example of CLSM images of a general FRAP interface experiment with a rectangle ROI of 20µm inside the carrageenan gel (shown as red in the image, A) with a distance far away from the interface to closer (from left to right) to the alginate bead (shown as green in the image, B). The ROI is illustrated as a white rectangle, always placed in the center of the image. Scale bar is 25µm.
A zoom-in during bleaching is carried out for each FRAP experiment, which explains the bigger size of
the ROI in bleaching frame in FIG. 4.15. The gray background represents the carrageenan gel, the white (t=0) and
dark (t>0) rectangles display the bleaching of 70kDa FITC-dextran in the sample. The fluorescence intensity of
the probes in the ROI recovers by diffusion of the probes as shown by the dark pixels fading away in the next
images (t>>0). The bleaching of the sample using the ROI with size 50µmx50µm is much clearer and it takes a
longer time for the fluorescence intensity to recover in contrast to the smaller ROI sizes.
A
B
A
A
B

31
In the post-bleaching frame 10s after the bleaching, there are still some bleached probes present in the
ROI, in comparison with the smaller ROI sizes. The fluorescence intensity in this ROI will eventually recover as
well over time.
ROI
size
PRE-BLEACH
t<0
BLEACH
t=0
POST-BLEACH
t>0 (0.5s)
t>>0 (10s)
10µm
X
10µm
20µm
X
20µm
50µm
X
50µm
FIG. 4.15: Typical pre-bleach (t<0), bleach (t=0) and post-bleach (t>0: 0.5s after bleaching; t>>0: 10s after bleaching) images from the FRAP experiments for different sizes of the chosen ROI. For the ROI with a length of 10µm, 20µm and 50µm the distance from the interface of the alginate gel was respectively 20µm, 40µm and 100µm. The image sizes of the pre- and post-bleaching images are respectively 45.88µmx45.88µm, 93.75µmx93.75µm and 187.50µmx187.50µm.
FIG. 4.16 shows the common recovery curves of the performed FRAP experiments. It is again clear that
the recovery is slower in the ROI of size 50µmx50µm in relation to the recovery in fluorescence intensity of the
ROI of size 20µmx20µm and 10µmx10µm, which is in agreement with FIG. 4.15. When looking at the recovery
graphs of the CLSM, the 20µm ROI shows the largest bleaching extend (drop in fluorescence intensity), in contrast
to the bleaching extend for the 50µm and 10µm ROI.
When analyzing the recovery curves of the Matlab script, it appears that the fit of the model is
appropriate for all experiments. However, it appears that the model fit is not perfect for the data of the
experiment using the ROI of size 50µmx50µm and 10µmx10µm, shown by the black arrows in FIG. 4.16. For the
ROI of size 50µ there appears to be an underestimation of the model, while for the ROI of size 10µm there seems
to be an overestimation of the model in the indicated areas.

32
ROI
size
Recovery curve by CLSM Recovery curve by Matlab
10µm
X
10µm
20µm
X
20µm
50µm
X
50µm
FIG. 4.16: The common recovery curves of the FRAP interface experiments for each chosen ROI. The curves shown left are the curves produced by the CLSM right after the experiments. The curves shown right are the curves calculated by the Matlab script in the analysis of data of the experiments. For the ROI with a length of 10µm, 20µ and 50µm, the distance from the interface of the alginate gel was respectively 20µm, 40µm and 100µm.
The residual plots of the FRAP experiments, produced by the Matlab script, can be used as a guideline
for analyzing the quality of the model fit. The common residual plot is shown in FIG. 4.17. It is the plot of a FRAP
experiment with an ROI with a length of 20µm, placed 40µm from the interface of the alginate gel. The residual
plot of the real experiment data is presented in the top half of the image with the bleached probes shown as
dark blue stripes. The lower half of the image shows the model of the Matlab script with the bleached probes as
dark blue stripes without the residuals. The fluorescence intensity recovers as the dark blue stripes become

33
smaller and ultimately fade away. Notice that the images with the post-bleach ROIs are compromised and placed
next to each other. The residuals should be as random as possible (random noise) and the model should be
similar to the real data. No structure should be seen on the residual plot. It appears that the model fit is
appropriate for the data.
FIG 4.17: A common residual plot of the data of the FRAP experiments in comparison with the model. For this plot a ROI with a length of 20µm is used, placed 40µm from the interface of the alginate gel. The residual plot is in relation to the recovery graphs in FIG for the same experiment. The residual plot of the real data is shown on top, with the model without residuals shown below.
Some FRAP interface experiments with alginate beads inside a carrageenan gel in a metallic cup are
also performed at lower depth in the sample, but they did not show good recovery graphs and are therefore not
analyzed.
4.2.5 Mixture of carrageenan and alginate gel
A mixture by stirring and heating of a 1% carrageenan gel with a 4% alginate gel is tried out to
investigate the use of this system for the experiments in this thesis. As shown in FIG. 4.18, one can see small
unclear indications of phase-separation due to the patterns.
FIG. 4.18: CLSM image of the mixture of 1% carrageenan and 4% alginate gel, both with 100ppm 70kDa FITC-dextran. Scale bar is 25µm.

34
4.3 RICS EXPERIMENTS
All fitted correlation functions and their corresponding residual plots are plotted by the Matlab script.
Gs(ξ,ψ) represents the autocorrelation function plotted in three dimensions and ΔGs(ξ,ψ) is the difference in
autocorrelation function (residual). ξ and ψ are the pixel coordinates of the image, where ξ is the horizontal
correlation shift and ψ the vertical correlation shift. The magnitude of the autocorrelation function is shown by
the colors in the graphs.
4.3.1 Optimal scanning rate
Different scanning rates are tested to find out what the optimal scanning rate is for the diffusion
coefficient of the probe in the systems. The common fitted correlation functions with their top view are listed in
FIG. 4.20 for the RICS experiments in 1% κ-carrageenan hydrogel with 80nM 70kDa FITC-dextran as a fluorescent
diffusion probe. A scanning rate of 10Hz, 400Hz, 600Hz and 1000Hz is employed. The correlation function graphs
show the correlated fluorescence fluctuations of the fluorescent probe over space and time in the stack of CLSM
images of one experiment.
The two most common residual plots are listed in FIG. 4.19. FIG. 4.19a shows an interesting pattern, while
FIG. 4.19b shows a more random residual plot. The scale bar of the first plot shows higher residuals in contrast
to the second plot.
It appears that no correlation is visible in the ψ direction for the 10Hz scanning rate, as described in FIG.
4.20a. One basically see a somewhat broaden width of the Point Spread Function (PSF) at this scanning rate. As
the scanning rate rises from 10Hz to 1000Hz, it can be seen that the plot shows more and more correlation in
the ψ direction. It can be seen that the diffusing molecules contribute to the correlation function for the higher
scanning rates (400Hz, 600Hz and 1000Hz), in contrast to the scanning rate of 10Hz. For this reason a higher
scanning rate (400Hz to 1000Hz) was chosen for the next experiments.
FIG. 4.19: The residual plots of the RICS experiments inside a 1% carrageenan gel with 80nM 70kDa FITC-dextran as a diffusion probe. A scanning rate of (a) 10Hz and (b) 1000Hz is used.
(a) (b)

35
FIG. 4.20: The fitted correlation spectrums in 3D (left) and top view (right) of 80nM 70kDa FITC-dextran in a 1% κ-carrageenan gel. The RICS experiments are performed with a zoom of 7 and a scanning rate of (a) 10Hz, (b) 400Hz, (c) 600Hz and (d) 100Hz. Gs(ξ,ψ) represents the auto correlation function and ξ and ψ are the pixel coordinates.
4.3.2 H2O
The diffusion coefficients of 70kDa FITC-dextran in distillated water measured by RICS are listed in FIG.
4.21. The results are consistent with the different zoom factor used (7 and 12) and a gradually higher diffusion
coefficient is measured when increasing the scanning rate from 400 to 1000Hz. There is no clear advantage
when using a zoom factor of 7 or 12.
(a)
(b)
(c)
(d)

36
FIG. 4.21: Average diffusion coefficients of 80nM 70kDa FITC-dextran in H2O measured by RICS. For each experiment a scanning rate of 400Hz, 600Hz and 1000Hz were employed with a zoom of 7 and 12.
4.3.3 Carrageenan bulk
The average diffusion coefficients of 70kDa FITC-dextran in a 1% κ-carrageenan gel measured by RICS
are listed in FIG. 4.22 with their standard deviations. Again, it appears that the diffusion rate rises when a higher
scanning rate (from 400Hz to 600Hz and 100Hz) is used, also giving better correlations. As in the previous
experiments, there is no clear advantage when using a zoom factor of 7, 12 or 16.
FIG. 4.22: Average diffusion coefficients of 80nM 70kDa FITC-dextran in 1% κ-carrageenan gel with RICS. For each experiment a scanning rate of 400Hz, 600Hz and 1000Hz is used with a zoom of 7 and 12. For the scanning rate of 1000Hz a zoom of 16 is also used.
In the first RICS experiments, some results are very inconsistent. For example, a diffusion coefficient of
44µm2/s is measured inside a brighter area of the carrageenan gel in a closed seal spacer. Therefore, it is decided
to only perform RICS experiments in the metallic cup samples for the next experiments.
0.00
5.00
10.00
15.00
20.00
25.00
30.00
35.00
400 600 1000
Diff
usio
n co
effic
ient
(µm
²/s)
Scanning rate (Hz)
zoom 7
zoom 12
0.00
2.00
4.00
6.00
8.0010.00
12.00
14.00
16.00
18.0020.00
400 600 1000
Diff
usio
n co
effic
ient
(µm
²/s)
Scanning rate (Hz)
zoom 7
zoom 12
zoom 16

37
4.3.4 Alginate bulk
FIG. 4.23: Average diffusion coefficients of 80nM 70kDa FITC-dextran in 4% alginate gel with RICS. For each experiment a scanning rate of 400Hz, 600Hz, 800Hz and 1000Hz is used with a zoom of 7. Only one experiment is performed with a scanning rate of 400Hz to 800Hz, 4 experiments are performed with a scanning rate of 1000Hz.
The diffusion coefficients of 70kDa FITC-dextran in a 4% alginate gel, produced by the internal method,
are listed in FIG. 4.23. One can again observe an increasing trend in diffusion coefficient from a scanning rate of
400Hz to 1000Hz. The correlation spectrum and its residual plot is shown in FIG. 4.24 of a RICS experiment inside
the alginate gel. A scanning rate of 400Hz is used in this experiment. The residual plot shows some interesting
patterns, most likely caused by the heterogeneities in the alginate gel. The fitted correlation spectrum shows a
good correlation in all directions.
FIG. 4.24: The graphs of the analysis of the RICS experiment on the 4% alginate gel with 80nM 70kDa FITC-dextran. (a) The residual plot with (b) the fitted correlation spectrum of the experiment with a scanning rate of 400Hz and a zoom of 7.
0
1
2
3
4
5
6
7
400 600 800 1000
Diff
usio
n co
effic
ient
(µm
²/s)
Scanning rate (Hz)
(a)
(b)

38
4.3.5 Interface
The RICS experiments are carried out near the interface of the 1% carrageenan gel and the 4% alginate
gel, both with 80nM 70kDa FITC-dextran as a diffusion probe. The results are listed in FIG. 4.25. The negative
distance refers to the experiments in the carrageenan gel, while the positive distance refers to the experiments
in the alginate gel. It appears that the diffusion of the probe decreases for measurements in the carrageenan
phase to further away from the interface in the alginate phase. The diffusion coefficient measured at the
interface is the average of the diffusion coefficients inside both gel phases, as shown in FIG. 4.26b. Apart from
the measurements done at the interface, only one experiment is done on each distance from the interface in
both gels. The results of the measurements performed in 40µm, 70 and 100µm from the interface inside the
alginate gel are relatively similar.
FIG. 4.25: Average diffusion coefficients of 80nM 70kDa FITC-dextran in 4% alginate gel and 1% carrageenan gel with RICS. For each experiment a zoom of 7 is used with a scanning rate of 600Hz. The positive distance from the interface refers to measurements inside the alginate gel, zero is at the interface and the negative distance is inside the carrageenan gel. The image size of the experiments is always 35.14µmx35.14µm. The CLSM image of the interface between the carrageenan and alginate gel is shown in FIG. 4.26a. The
carrageenan gel is shown on top of the image, the alginate gel is shown at the bottom. Notice that the interface
of the two gels shows an interesting transition. FIG. 4.26b shows an illustration of the RICS experiments near the
interface in relation to the graph in FIG. 4.25. The distance from the interface should be interpreted as the
distance from the interface to the closest border of the CLSM image.
0.00
2.00
4.00
6.00
8.00
10.00
12.00
14.00
16.00
-10 0 10 40 70 100
Diff
usio
n co
effic
ient
(µm
²/s)
Distance from the interface, r (µm)
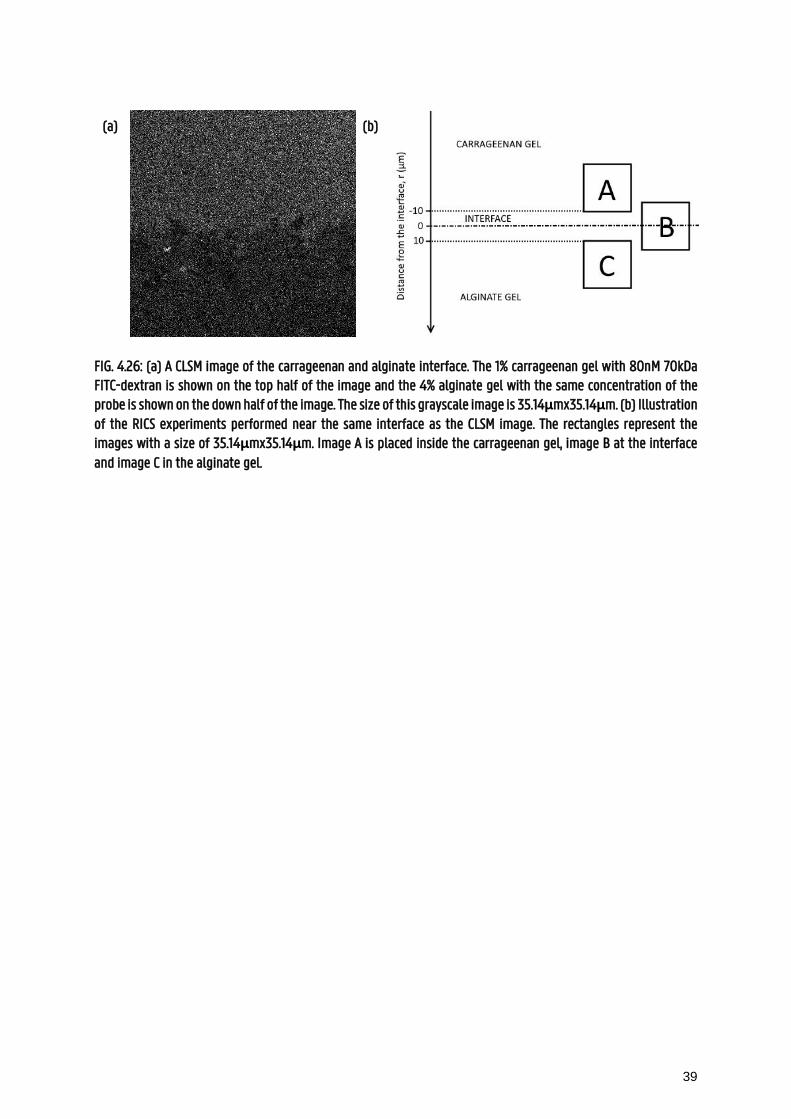
39
FIG. 4.26: (a) A CLSM image of the carrageenan and alginate interface. The 1% carrageenan gel with 80nM 70kDa FITC-dextran is shown on the top half of the image and the 4% alginate gel with the same concentration of the probe is shown on the down half of the image. The size of this grayscale image is 35.14µmx35.14µm. (b) Illustration of the RICS experiments performed near the same interface as the CLSM image. The rectangles represent the images with a size of 35.14µmx35.14µm. Image A is placed inside the carrageenan gel, image B at the interface and image C in the alginate gel.
(a) (b)

40
5 DISCUSSION
5.1 POLYSTYRENE SPHERES INSIDE CARRAGEENAN GEL
It was expected that the PS beads would have clear, sharp boundaries when observed under the CLSM.
However, the boundaries are not sharp but rather unclear as shown in FIG. 4.2. This is most likely due to the
excessive reflection of laser light at the boundaries of the spheres since the refractive index of the polystyrene
beads (n is 1.61 for a wavelength of 488nm (52)) is much higher than the refractive index of water (n is 1.34 for
a wavelength of 488nm (53)). For this reason, it appears that this model system is not the optimal model to use
for investigating the diffusion near the interface of the spheres and the carrageenan gel. The model system is
therefore replaced by the carrageenan gel with the alginate gel as beads or bulk.
5.2 FRAP EXPERIMENTS
5.2.1 Concentration effect of sodium fluorescein
A concentration of 20ppm of sodium fluorescein as a fluorescent probe gives an undesirable ratio
between signal and background noise (signal-to-noise ratio, SNR) and a low fluorescence intensity, which is also
described in literature as an effect of too low concentration of the fluorescent probe (1). On the other hand, inner
filtering effects may occur when using a concentration that is too high (41). Inner filtering is the absorption of
the emitted light of fluorophores in the focal plane by nearby probe molecules so the light does not reach the
detector, causing the observed fluorescence intensity to drop. This can cause a change in the linearity of
fluorescence at high fluorophore concentration (1). This might be the case for the 200ppm concentration. The
bleaching extend seems to be greater as well for a concentration of 100ppm (and 200ppm). For these reasons
it can be concluded that a 100ppm concentration of sodium fluorescein is the optimal concentration to use for
FRAP experiments in a 1% κ-carrageenan hydrogel.
When looking at the recovery curves of 70kDa FITC-dextran in FIG. 4.5 in contrast to the recovery curves
of sodium fluorescein in FIG. 4.3, the latter is more difficult to bleach inside the carrageenan gel than the 70kDa
FITC-dextran. A bleaching profile of 30% of the pre-bleach fluorescence intensity inside the ROI or more (which
is necessary for a good FRAP measurement, as stated in (35)) is very hard to obtain in contrast to the FITC-
dextran, even with 5 bleaching images and an ROI of 50µm in diameter. The reason for this difference in
bleaching extend is most likely because of the difference in molecular mass between the two probes. As 70kDa
FITC-dextran has a higher molecular weight then fluorescein, it will diffuse slower, as stated in (33), resulting
in a slower fluorescence recovery and higher visible bleaching depth.
In addition, and in contrast to 70kDa FITC-dextran, there is a possibility of sodium fluorescein to be
influenced by interaction with the carrageenan gel-network, as this interaction is also present in a study of the

41
same probe in a β-lactoglobulin gel (BLG) (33). Because of the repulsion of the negatively charged sodium
fluorescein and κ-carrageenan polymer network, it is possible that a depletion area occurs close to the polymer
strings causing the sodium fluorescein to move in a more crowded environment. If this is indeed the case for the
carrageenan gel as well, it is necessary to describe the recorded recovery with a model that takes binding into
account for determining the diffusion coefficient of this fluorescent probe (33).
The relatively extreme values of kon and koff when analyzing the diffusion of 70kDa FITC-dextran using
the binding and diffusion model in experiments in the carrageenan bulk (as described in 4.2.2) can also be found
in literature (33). This indicates that the diffusion of the 70kDa FITC-dextran probe is most likely not influenced
by binding events in the κ-carrageenan gel. It can be assumed that the rFRAP model without implementing
binding, can be safely used for analyzing the diffusion of this probe. The difference in polymer interaction
between the two probes could be explained by the difference in surface-charge density (33). These two problems
result in the choice of 70kDa FITC-dextran as fluorescent diffusion probe in the following experiments.
5.2.2 Carrageenan bulk
The diffusion coefficients are relatively consistent in FIG. 4.4 for both ROI sizes. The standard deviation
of the experiments are acceptable when the results of other FRAP experiments are observed in literature (33).
The results should be compared with the diffusion coefficient of the same probe in a 2% (w/v) agarose hydrogel
measured by FRAP and RICS, which is described to be approximately 28µm2/s for both techniques (46). The free
diffusion rate (D0) of 70kDa FITC-dextran in water at room temperature is described to be 29.9±3.1µm2/s (33).
The measured diffusion coefficients of the probe in a 1% carrageenan gel are thus lower than the diffusion of the
probe in an agarose hydrogel and in water, which is plausible. The recovery graph listed in FIG. 4.5 shows an
appropriate fit of the model.
5.2.3 Alginate bulk
The measured diffusion coefficient for both production methods are very different. It is however not
clear if the FRAP experiments are made in the bead or in the liquid layer on top of the bead. The liquid layer may
give rise to a flow or sample drift, which can lead to an apparent increase in fluorescence recovery rate as stated
in literature, leading to higher measured diffusion coefficients (1). It appears that the results of the internal
method are more trustworthy. However, more experiments should be performed, with both RICS and FRAP to
assure the accuracy of the diffusion coefficients. There is another method to dissolute the probe inside the
alginate gel, as described in literature, called external-diffusive mechanism (15). This could be used in further
experiments and could possibly result in better FRAP and RICS experiments.

42
5.2.3.1 Droplet method
The beads are very heterogeneous as seen in FIG. 4.7 and it is difficult to control their properties because
of the almost instantaneous gelling process, which is also described in literature (19). It also appears that the
distribution of the fluorescent probe is not homogenous inside the alginate bead, which could possibly indicate
a certain internal structure of the alginate bead. This inhomogeneous distribution is however only a seen for the
alginate gel made by the droplet method. When an alginate gel is produced with the internal method, a more
homogeneous distribution of the probe can be reached. In addition, the lower concentration of the probe inside
the alginate bead after two days is a possibly due to a higher affinity of 70kDa FITC dextran for the carrageenan
gel in contrast to the alginate gel.
5.2.3.2 Internal method
It is clear that the internal method is a method to obtain a more homogeneous alginate gel. This is
especially favorable if FRAP experiments are to be performed inside the gel. There are however still some clear
heterogeneities visible in the alginate gel as shown in FIG. 4.9. This may also give rise to less accurate results
with FRAP as these heterogeneities could influence the mobility of the fluorescent probes by obstruction or even
binding, as described in literature (1). It is however unknown what the effect of structural heterogeneity on FRAP
measurements is. The ROI for FRAP experiments should be placed in more homogeneous phases, as far away as
possible from the heterogeneities, as stated in (2). A more practical way to resolve this problem is the use of a
different model that can account for the heterogeneities in media or the use of line FRAP, where FRAP
experiments can be performed in smaller regions (2).
The measured diffusion coefficients of the probe in the alginate gel, produced with the internal method
are relative consistent and approximately between 3 and 4µm2/s. In literature it is found that the diffusion of
70kDa FITC-dextran is reduced by 80% inside a 2% alginate gel, produced by the internal gelation method (15).
If a free diffusion coefficient (D0) of approximately 30µm2/s (33) is assumed for the probe, a diffusion coefficient
of 6µm2/s is described in this article. It is likely that the diffusion of the probe is lower in a more concentrated
alginate gel as the gel network can interfere with the mobility of the probe. The results seem to be plausible.
5.2.4 Interface
The increasing trend in diffusion coefficient of the probe inside the carrageenan gel is observed. The
lower diffusion coefficient near the surface of the alginate bead is possible as the relative dens alginate bead
could obstruct the movement of the molecules near the interface in contrast to the molecules further away from
the interface. The standard deviations of the results are relatively large, which makes it hard to say with one
hundred percent certainty that the diffusion close to the interface is different. It is however a very interesting
observation. It would be interesting to do more experiments with higher resolution to better resolve the trend.

43
A requirement for FRAP analysis is that the diffusion should be free and unaffected by boundaries in
the hydrogel (35). Some FRAP experiments are however performed near the border of the alginate bead, which
could lead to incorrect or less accurate diffusion rates. A new FRAP model could solve this problem, also stated
in 5.2.3.2, for instance the model described in (54) that can account for the heterogeneities in media. Some FRAP
experiments with a ROI of 5µm in diameter are also performed, but the signal to noise ratio is unfavorable. Next
experiments with a 63x objective could solve this problem.
The alginate beads employed in this experiment are produced without 70kDa FICT-dextran, in contrast
to the 100ppm concentration of the probe in the carrageenan gel. This may, however, create a variable diffusion
coefficient due to a concentration-dependent non-equilibrium phenomena, because of the different
concentrations in both phases. The experiments are however performed one day after the production of the
sample so the equilibrium could have been set already. Through, in literature it is described to avoid this
phenomena as much as possible (42). This should be kept in mind for further experiments in the future.
The reason for the strange recovery curves of the FRAP experiments at the interface of the alginate
beads inside the carrageenan gel in the metallic cup might be that the laser light experiences inner filtering
because of the greater depth of the FRAP experiments. The depth into the sample is 900µm for these
experiments, instead of the depth of 30µm for the usual experiments. This phenomena occurs if the
concentration of the probe is too high, as stated in 5.2.1. However, the effect of inner filtering can also grow if
the depth in the sample where the measurements are performed, increases (1, 35). For this reason, it is decided
that the depth should be kept at 30µm for all the other experiments.
The difference between the recovery graphs of the FRAP experiments in FIG. 4.16 using a ROI with a
length of 10µm and 20µm with the ROI with a length of 50µm is that it takes more time for the bleached probes
inside the center of the ROI to diffuse outside the bigger ROI in contrast to the smaller ROIs. As it takes more
time, the recovery of the fluorescence will be slower as well. As the average fluorescence of all pixels inside the
ROI is plotted on the recovery curve, there is a noticeable difference between the sizes of the ROI.
In literature, an enrichment of solvent in the interface between two coexisting polymer solutions is
described, because of the prevention of mutual contact of two incompatible polymers (55). The measured
diffusion coefficient at the interface should be approximately the same as the free diffusion rate of the probe in
water (D0) in that case. It seems that this is not the case at the FRAP and RICS experiments at the interface of
carrageenan and alginate gel. The reason for this could be that the polymers are compatible and do not phase
separate or that the enrichment of the solvent occurs at a much smaller length scale.

44
5.2.5 Mixture of carrageenan and alginate
It can be concluded that this method is not the desired method to investigate the diffusion at the
interface, because the interface of the carrageenan and alginate gel is not visible at the micrometer level. More
research is needed to form a conclusion on the phase-separation of the two gels.
5.3 RICS EXPERIMENTS
Generally, in all RICS experiments it is clear that the more frames are used, the lower the error in each
data point and the higher the precision of the fit. The correlation function shape does not differ much in relation
to the number of frames used, which is all in agreement with research literature (38). The measured diffusion
coefficient did not differ much in relation to a different zoom function (between 7 or 12) as stated in chapter 4.3.
This is in contrast to the FRAP experiments, where more accurate diffusion coefficients are found when using a
higher zoom function, in relation to the size of the ROI, while keeping in mind that the size of the ROI must never
be bigger than the image size (1).
5.3.1 Optimal scanning rate
For the evaluation of the analysis of the RICS experiments, it is important to check for the sharpness of
the fitted correlation function. A correlation function that is too sharp shows no correlation in the ψ-direction as
observed for the scanning rate of 10Hz in FIG. 4.20a. Here, the correlation function graph only shows the PSF
instead of the diffusion molecules. This is the case if the molecule of interest diffuses faster than the laser scans
the image in raster lines, as stated in (56). The diffusing molecules do not contribute to the correlation function
and the measured diffusion coefficient by the RICS analysis will be smaller than the true diffusion coefficient.
For the scanning rates of 400Hz to 1000Hz however, this is not the case. The scanning rates seems to be fast
enough (i.e. faster than the movement of the fluorophore) to show correlation between pixels in the ψ-direction.
It is important to note that the optimal scanning rate will depend on the diffusion rate of the molecule of interest
and should always be investigated to select the appropriate scanning rate. Only then accurate RICS
measurements can be performed (39). Because all images are scanned in the horizontal direction, all correlation
functions show an extension in the horizontal direction.
When observing the interesting pattern of the residual plot in FIG. 4.19a it is difficult to state that the
residual plot is not random enough. The same residual plot can also be found in literature where the diffusion
of gold nanoparticles in different glycerol:water mixtures is determined using photothermal RICS (36). On the
other hand, the residual plot in FIG. 4.19b appears close to random noise, which is desirable for a residual plot of
the RICS analysis (39).

45
5.3.2 H2O
In the literature the diffusion coefficient of 70kDa FITC-dextran in water at room temperature (D0) is
described as 29.9±3.1µm2/s (33). The results of the RICS experiments of the probe in water are similar to the
values of literature research.
5.3.3 Carrageenan bulk
The results listed in FIG. 4.22 are less consistent than the results of the RICS experiments in water. In
addition, the diffusion coefficients of 70kDa FITC-dextran measured in the bulk of the carrageenan gel is slightly
lower with RICS in comparison with FRAP. However, RICS and FRAP measurements cannot directly be compared,
because of the different size of ROI. Also, with FRAP the diffusion of fluorophores outside the ROI is indirectly
measured as well, while the diffusion coefficient with RICS is more locally determined with less power on the
sample (57). In some articles, approximately the same values are obtained for RICS and FRAP measurements,
while other results differ more between the two techniques (46).
The strange diffusion coefficient of 44µm2/s of 70kDa FITC-dextran inside a brighter area inside the
carrageenan gel is even higher than the normal diffusion coefficient of the probe in water. This should be
impossible, as the mobility is most cases decreased in a gel (1). It could perhaps be the reason of a too high
concentration of probes inside the area, which could lead to unreliable results. This is however just a hypothesis
and more research is needed to be able to explain the higher diffusion coefficient.
5.3.4 Alginate bulk
The measured diffusion coefficient inside the alginate gel by RICS is in the range of 4 to 6µm2/s, which
is slightly higher than the diffusion coefficient found by the FRAP experiments in the same system (3 to 4 µm2/s).
It is still slightly lower than the reported diffusion coefficient of the probe in a 2% alginate gel (15) as stated in
5.2.3.2 and seems therefore also plausible. The experiments with a scanning rate of 400Hz, 600Hz and 800Hz
are only performed once, because of shortage of time. More experiments should be performed with these
scanning rates to find out if the results are consistent.
5.3.5 Interface
The system used for these experiments is extremely interesting, as the diffusion could be measured in
both phases with ease. This is in contrast to the FRAP experiments performed at the interface with the alginate
beads, where the alginate bead is too compact for FRAP measurements. Unfortunately, there was not enough
time to perform more experiments by RICS in this model. If more time was available, more experiments would
be performed to find out if the results are consistent, as well with a higher zoom factor to measure the diffusion
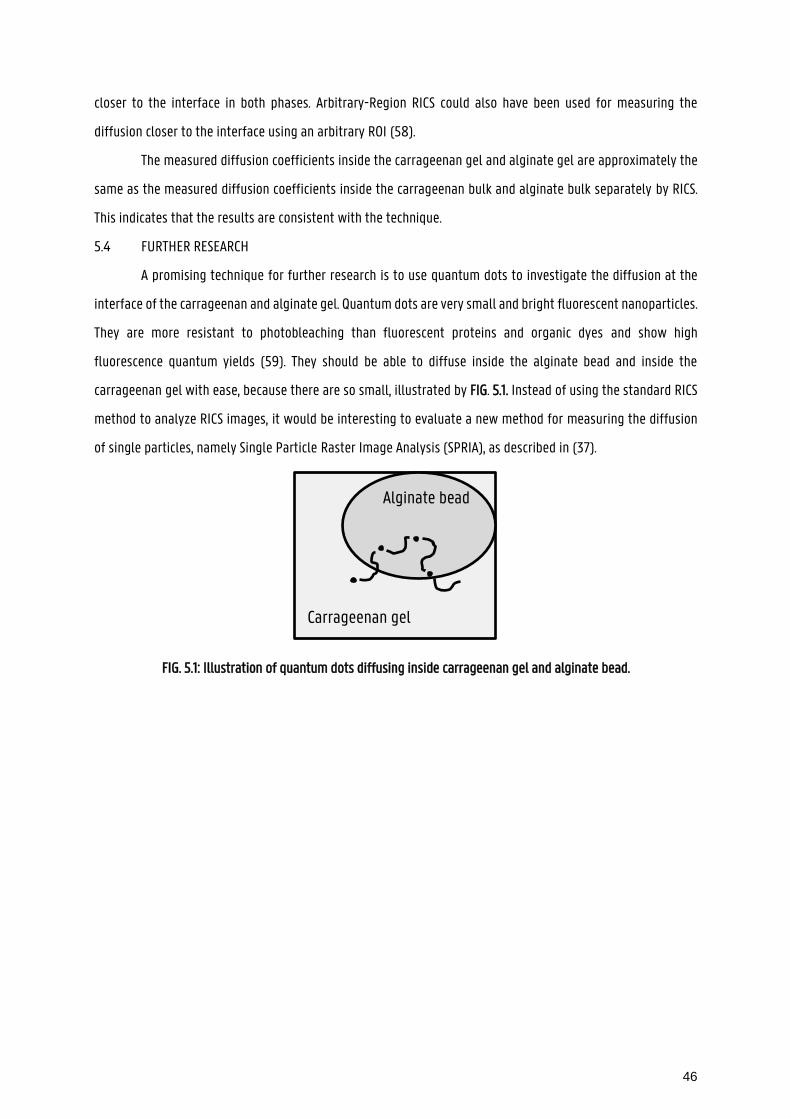
46
closer to the interface in both phases. Arbitrary-Region RICS could also have been used for measuring the
diffusion closer to the interface using an arbitrary ROI (58).
The measured diffusion coefficients inside the carrageenan gel and alginate gel are approximately the
same as the measured diffusion coefficients inside the carrageenan bulk and alginate bulk separately by RICS.
This indicates that the results are consistent with the technique.
5.4 FURTHER RESEARCH
A promising technique for further research is to use quantum dots to investigate the diffusion at the
interface of the carrageenan and alginate gel. Quantum dots are very small and bright fluorescent nanoparticles.
They are more resistant to photobleaching than fluorescent proteins and organic dyes and show high
fluorescence quantum yields (59). They should be able to diffuse inside the alginate bead and inside the
carrageenan gel with ease, because there are so small, illustrated by FIG. 5.1. Instead of using the standard RICS
method to analyze RICS images, it would be interesting to evaluate a new method for measuring the diffusion
of single particles, namely Single Particle Raster Image Analysis (SPRIA), as described in (37).
FIG. 5.1: Illustration of quantum dots diffusing inside carrageenan gel and alginate bead.
Alginate bead
Carrageenan gel

47
6 CONCLUSION
To measure the diffusion coefficient near the interface in a hydrogel, the PS spheres inside a 1% κ-
carrageenan hydrogel does not seems to be the optimal model, regarding the unclear boundaries of the spheres
due to the excessive reflection of the laser light. The carrageenan gel with the alginate gel seems to be a more
promising model.
A concentration of 100ppm of sodium fluorescein seems to be optimal for FRAP experiments inside a
1% κ-carrageenan hydrogel. However, in terms of the extend of bleaching of the fluorescence intensity in relation
to the pre-bleaching fluorescence intensity and possible interaction with the gel-network it is clear that sodium
fluorescein is not the best choice as a fluorescent probe for the used hydrogels. 70kDa FITC-dextran seems better
suited as a probe in the used systems.
Of the two methods that are used to produce an alginate gel, the internal gelling method is superior in
terms of homogeneity in comparison with the alginate beads produced by the droplet method. The mixture of
carrageenan and alginate is not the optimal system to use for this thesis, regarding the unclear interfaces. The
1% κ-carrageenan hydrogel with a 4% internally set alginate gel seems a good model system for measuring the
diffusion near the interface by FRAP or RICS.
In general for both techniques, the measured diffusion coefficient of 70kDa FITC-dextran inside the
alginate gel is in the range of 3µm2/s to 7µm2/s and inside the carrageenan gel in the range of approximately
15µm2/s to 18µm2/s by RICS and 20µm2/s to 25µm2/s by FRAP. RICS measurements of the diffusion of the probe
inside the internally set alginate gel are slightly higher than the FRAP experiments. The RICS measurements of
70kDa FITC-dextran in water, results in diffusion coefficients in the range of 27μm2/s to 30μm2/s. When comparing
the RICS and FRAP results inside the carrageenan hydrogel, it is clear that the techniques slightly differ from
each other and that it is not easy to compare the results.
The bleaching of the probe in the sample using the ROI with size 50µmx50µm is much clearer and it
takes a longer time for the fluorescence intensity to recover in contrast to the smaller ROI sizes. It is interesting
to notice that the ROI of 50µm in length shows less noise, but measures the average diffusion coefficient as the
ROI covers a bigger fragment of the structure. The ROI of 10µm in length, on the other hand, shows more noise
but covers less distance and shows the diffusion coefficient of the probe in a more localized region in the
hydrogel. When analyzing the recovery curves of the Matlab script, it appears that the fit of the model is
appropriate for all FRAP performed experiments.
The diffusion coefficients in RICS experiments show a rising trend as the scanning rate is increased from
400Hz and 600Hz to 1000Hz, along with a better correlation of the fitted correlation spectrum in the ψ-
direction.

48
The fitted correlation function by a scanning rate of 10Hz shows no correlation in the ψ-direction. 600Hz
or 1000Hz seems to be a good scanning rate for measuring the diffusion of 70kDa FITC-dextran in the alginate
and carrageenan gels. An increased zoom factor does not seem to greatly alter the measurements of the
diffusion coefficient.
The results of the FRAP experiments near the interface of the 4% alginate bead inside the 1% κ-
carrageenan are interesting as there appears to be a slightly increasing trend in diffusion of the probe when
moving the ROI further away from the interface inside the carrageenan gel. However, more experiments with
higher resolution are necessary to better resolve the trend. A new FRAP model that accounts for heterogeneities
in the medium could be used for experiments near the interface in the future. This increasing trend in diffusion
of the probe is not seen in the RICS experiments near the interface in the alginate gel, but more research is
needed. The RICS and FRAP measurements of the diffusion of the probe far away from the interface in both the
carrageenan and alginate gel showes diffusion coefficients that are in agreement with the results in the separate
alginate and carrageenan bulk. It appears that the results are consistent for both techniques.
The mass transport in heterogeneous biomaterials and their interfaces remains an interesting but
difficult subject. The results in this thesis are promising, but it can be concluded that more experiments are
necessary to receive more closing and reliable results, especially for the RICS experiments near the interface.
Arbitrary-Region RICS could be used for measuring the diffusion closer to the interface using an arbitrary ROI.
Further research could also involve the measurement of the diffusion of quantum dots inside the model system
with the use of SPRIA analysis.

49
7 REFERENCES
1. Loren N, Hagman J, Jonasson J, Deschout H, Bernin D, Cella-Zanacchi F, et al. Fluorescence recovery after photobleaching in material and life sciences: putting theory into practice. 2015. 2. Lorén N, Nydén M, Hermansson A-M. Determination of local diffusion properties in heterogeneous biomaterials. Advances in Colloid and Interface Science. 2009;150(1):5-15. 3. Wong JY, Bronzino JD. Biomaterials: CRC Press; 2007. 4. Deschout H, Raemdonck K, Demeester J, De Smedt SC, Braeckmans K. FRAP in Pharmaceutical Research: Practical Guidelines and Applications in Drug Delivery. Pharmaceutical Research. 2014;31(2):255-70. 5. Hagman J, Lorén N, Hermansson A-M. Probe diffusion in κ-carrageenan gels determined by fluorescence recovery after photobleaching. Food Hydrocolloids. 2012;29(1):106-15. 6. Nussinovitch A, SpringerLink. Polymer macro- and micro-gel beads: fundamentals and applications. 1st ed. New York: Springer; 2010. 7. Popescu V, Popescu GL, Dudescu MC, Borodi G, Dinescu AM, Moldovan M. Obtaining and Characterizing Alginate/k-Carrageenan Hydrogel Cross-Linked with Adipic Dihydrazide. Advances in Materials Science and Engineering. 2013;2013:12. 8. Khan IA, Abourashed EA. Leung's Encyclopedia of Common Natural Ingredients. Hoboken, UNITED STATES: John Wiley & Sons, Incorporated; 2011. 9. Mangione M, Giacomazza D, Bulone D, Martorana V, San Biagio P. Thermoreversible gelation of κ-Carrageenan: relation between conformational transition and aggregation. Biophysical Chemistry. 2003;104(1):95-105. 10. Lorén N, Shtykova L, Kidman S, Jarvoll P, Nydén M, Hermansson A-M. Dendrimer diffusion in kappa-carrageenan gel structures. Biomacromolecules. 2009;10(2):275-84. 11. Gulrez SKH, Al-Assaf S, Phillips GO. Hydrogels: Methods of Preparation, Characterisation and Applications. Progress in Molecular and Environmental Bioengineering - From Analysis and Modeling to Technology Applications. Rijeka: InTech; 2011. p. Ch. 0. 12. Tuvikene R, Truus K, Robal M, Volobujeva O, Mellikov E, Pehk T, et al. The extraction, structure, and gelling properties of hybrid galactan from the red alga Furcellaria lumbricalis (Baltic Sea, Estonia). Journal of Applied Phycology. 2010;22(1):51-63. 13. Moon S-H, Parulekar SJ. Characterization of κ-Carrageenan Gels Used for Immobilization of Bacillus firmus. Biotechnology Progress. 1991;7(6):516-25. 14. Kara S, Tamerler C, Bermek H, Pekcan Ö. Cation effects on sol–gel and gel–sol phase transitions of κ-carrageenan–water system. International Journal of Biological Macromolecules. 2003;31(4–5):177-85. 15. Schuster E, Eckardt J, Hermansson A-M, Larsson A, Lorén N, Altskär A, et al. Microstructural, mechanical and mass transport properties of isotropic and capillary alginate gels. Soft matter. 2013;1(2):357-66. 16. Lee KY, Mooney DJ. Alginate: properties and biomedical applications. Progress in polymer science. 2012;37(1):106-26. 17. Oates CG, Ledward DA. Studies on the effect of heat on alginates. Food Hydrocolloids. 1990;4(3):215-20. 18. Hermansson AM, Eriksson E, Jordansson E. Effects of potassium, sodium and calcium on the microstructure and rheological behaviour of kappa-carrageenan gels. Carbohydrate Polymers. 1991;16(3):297-320. 19. Bruchet M, Melman A. Fabrication of patterned calcium cross-linked alginate hydrogel films and coatings through reductive cation exchange. Carbohydrate Polymers. 2015;131:57-64. 20. Phosphorex, "Material Safety Data Sheets: Polystyrene Microspheres (Diameter >20um)" [Internet]. [cited 10-March-2017]. Available from: http://phosphorex.com/uploads/3/1/1/3/3113014/msds_plain_ps_microspheres_dry.pdf. 21. Pinto Reis C, Neufeld RJ, Ribeiro AJ, Veiga F. Nanoencapsulation I. Methods for preparation of drug-loaded polymeric nanoparticles. Nanomedicine: Nanotechnology, Biology and Medicine. 2006;2(1):8-21.

50
22. Seiffert S, Oppermann W. Diffusion of linear macromolecules and spherical particles in semidilute polymer solutions and polymer networks. Polymer. 2008;49(19):4115-26. 23. Cardona JAR, Iriart CH, Herrera ML. Applications of Confocal Laser Scanning Microscopy (CLSM) in Foods: INTECH Open Access Publisher; 2013. 24. McClements DJ, Knovel. Understanding and Controlling the Microstructure of Complex Foods. Boca Raton;Florence;: C R C Press LLC; 2007. 25. Deschout H, Hagman J, Fransson S, Jonasson J, Rudemo M, Lorén N, et al. Straightforward FRAP for quantitative diffusion measurements with a laser scanning microscope. Opt Express. 2010;18(22):22886-905. 26. Park JS, Kihm KD. Use of confocal laser scanning microscopy (CLSM) for depthwise resolved microscale-particle image velocimetry (μ-PIV). Optics and Lasers in Engineering. 2006;44(3–4):208-23. 27. Valeur B, Berberan-Santos MN. Molecular fluorescence: principles and applications: John Wiley & Sons; 2012. 28. Conchello J-A, Lichtman JW. Fluorescence microscopy. Nature Methods. 2005;2(12):910-9. 29. Lakowicz JR, SpringerLink, SpringerLink A. Principles of Fluorescence Spectroscopy. Boston, MA: Springer US; 1999. 30. Swift JL, Cramb DT. Nanoparticles as Fluorescence Labels: Is Size All that Matters? Biophysical Journal. 2008;95(2):865-76. 31. Meyvis TKL, De Smedt SCA, Van Oostveldt P, Demeester J. Fluorescence recovery after photobleaching: a versatile tool for mobility and interaction measurements in pharmaceutical research. 1999. 32. Invitrogen, "Dextran Conjugates" [Internet]. [cited 25-April-2017]. Available from: https://tools.thermofisher.com/content/sfs/manuals/mp01800.pdf. 33. Schuster E, Hermansson A-M, Öhgren C, Rudemo M, Lorén N. Interactions and Diffusion in Fine-Stranded β-lactoglobulin Gels Determined via FRAP and Binding. Biophysical Journal. 2014;106(1):253-62. 34. Sigma-Aldrich, "Fluorescein Isothiocyanate-Dextran" [Internet]. [cited 25-April-2017]. Available from: http://www.sigmaaldrich.com/technical-documents/protocols/biology/fluorescein-isothiocyanate-dextran.html. 35. Hagman J, Chalmers University of T, SuMo B, Chalmers tekniska h, Department of C, Biological Engineering ASC, et al. Structure Dynamics and Heterogeneity in Soft Materials Determined by FRAP 2012. 36. Nieves DJ, Li Y, Fernig DG, Lévy R. Photothermal raster image correlation spectroscopy of gold nanoparticles in solution and on live cells. Royal Society Open Science. 2015;2(6). 37. Longfils M, Schuster E, LorÉN N, SÄRkkÄ A, Rudemo M. Single particle raster image analysis of diffusion. Journal of Microscopy. 2017;266(1):3-14. 38. Brown CM, Dalal RB, Hebert B, Digman MA, Horwitz AR, Gratton E. Raster image correlation spectroscopy (RICS) for measuring fast protein dynamics and concentrations with a commercial laser scanning confocal microscope. Journal of Microscopy. 2008;229(1):78-91. 39. Rossow MJ, Sasaki JM, Digman MA, Gratton E. Raster image correlation spectroscopy in live cells. Nature Protocols. 2010;5(11):1761-74. 40. Burke MD, Park JO, Srinivasarao M, Khan SA. Diffusion of Macromolecules in Polymer Solutions and Gels: A Laser Scanning Confocal Microscopy Study. Macromolecules. 2000;33(20):7500-7. 41. Jonasson JK, LorÉN N, Olofsson P, NydÉN M, Rudemo M. A pixel‐based likelihood framework for analysis of fluorescence recovery after photobleaching data. Journal of Microscopy. 2008;232(2):260-9. 42. Schuster E, Sott K, Strom A, Altskar A, Smisdom N, Geback T, et al. Interplay between flow and diffusion in capillary alginate hydrogels. Soft Matter. 2016;12(17):3897-907. 43. Yotsuyanagi T, Ohkubo T, Ohhashi T, Ikeda KEN. Calcium-induced gelation of alginic acid and pH-sensitive reswelling of dried gels. Chemical and Pharmaceutical Bulletin. 1987;35(4):1555-63. 44. Rahman Z, Kohli K, Khar RK, Ali M, Charoo NA, Shamsher AAA. Characterization of 5-fluorouracil microspheres for colonic delivery. AAPS PharmSciTech. 2006;7(2):E113-E21. 45. Fernández Farrés I, Norton IT. Formation kinetics and rheology of alginate fluid gels produced by in-situ calcium release. Food Hydrocolloids. 2014;40:76-84.

51
46. Norris SCP, Humpolíčková J, Amler E, Huranová M, Buzgo M, Macháň R, et al. Raster image correlation spectroscopy as a novel tool to study interactions of macromolecules with nanofiber scaffolds. Acta Biomaterialia. 2011;7(12):4195-203. 47. Wassen S, Bordes R, Geback T, Bernin D, Schuster E, Loren N, et al. Probe diffusion in phase-separated bicontinuous biopolymer gels. Soft Matter. 2014;10(41):8276-87. 48. Röding, M., "FRAP diffusion and binding" [Internet]. [cited 22-March-2017]. Available from: https://github.com/roding/frap_diffusion_and_binding. 49. Xiong R, Deschout H, Demeester J, De Smedt SC, Braeckmans K. Rectangle FRAP for Measuring Diffusion with a Laser Scanning Microscope. In: Engelborghs Y, Visser AJWG, editors. Fluorescence Spectroscopy and Microscopy: Methods and Protocols. Totowa, NJ: Humana Press; 2014. p. 433-41. 50. Smisdom N. The dynamic behavior of the glycine receptor in the plasma membrane. An exploratory study by ensemble averaging microfluorimetric methods 2011. 51. Gielen E, Smisdom N, vandeVen M, De Clercq B, Gratton E, Digman M, et al. Measuring Diffusion of Lipid-like Probes in Artificial and Natural Membranes by Raster Image Correlation Spectroscopy (RICS): Use of a Commercial Laser-Scanning Microscope with Analog Detection. Langmuir. 2009;25(9):5209-18. 52. Sultanova N, Kasarova S, Nikolov I. Dispersion Proper ties of Optical Polymers. Acta Physica Polonica-Series A General Physics. 2009;116(4):585. 53. Hale GM, Querry MR. Optical Constants of Water in the 200-nm to 200-µm Wavelength Region. Applied Optics. 1973;12(3):555-63. 54. Sniekers YH, van Donkelaar CC. Determining Diffusion Coefficients in Inhomogeneous Tissues Using Fluorescence Recovery after Photobleaching. Biophysical Journal. 2005;89(2):1302-7. 55. Hidalgo-Alvarez R. Structure and Functional Properties of Colloidal Systems: CRC Press; 2009. 56. Digman MA, Stakic M, Gratton E. Chapter Six - Raster Image Correlation Spectroscopy and Number and Brightness Analysis. In: Sergey YT, editor. Methods in Enzymology. Volume 518: Academic Press; 2013. p. 121-44. 57. Gielen E, Smisdom N, vandeVen M, De Clercq B, Gratton E, Digman M, et al. Measuring diffusion of lipid-like probes in artificial and natural membranes by raster image correlation spectroscopy (RICS): use of a commercial laser-scanning microscope with analog detection. Langmuir : the ACS journal of surfaces and colloids. 2009;25(9):5209-18. 58. Hendrix J, Dekens T, Schrimpf W, Lamb DC. Arbitrary-Region Raster Image Correlation Spectroscopy. Biophysical Journal. 2016;111(8):1785-96. 59. Hynson NA, Allison SD, Treseder KK. Quantum Dots Reveal Shifts in Organic Nitrogen Uptake by Fungi Exposed to Long-Term Nitrogen Enrichment. PloS one. 2015;10(9):e0138158.

52