diffusion in zeolites : towards a microscopic understanding
TRANSCRIPT
Diffusion in zeolites : towards a microscopic understanding
Citation for published version (APA):Schuring, D. (2002). Diffusion in zeolites : towards a microscopic understanding. Technische UniversiteitEindhoven. https://doi.org/10.6100/IR558779
DOI:10.6100/IR558779
Document status and date:Published: 01/01/2002
Document Version:Publisher’s PDF, also known as Version of Record (includes final page, issue and volume numbers)
Please check the document version of this publication:
• A submitted manuscript is the version of the article upon submission and before peer-review. There can beimportant differences between the submitted version and the official published version of record. Peopleinterested in the research are advised to contact the author for the final version of the publication, or visit theDOI to the publisher's website.• The final author version and the galley proof are versions of the publication after peer review.• The final published version features the final layout of the paper including the volume, issue and pagenumbers.Link to publication
General rightsCopyright and moral rights for the publications made accessible in the public portal are retained by the authors and/or other copyright ownersand it is a condition of accessing publications that users recognise and abide by the legal requirements associated with these rights.
• Users may download and print one copy of any publication from the public portal for the purpose of private study or research. • You may not further distribute the material or use it for any profit-making activity or commercial gain • You may freely distribute the URL identifying the publication in the public portal.
If the publication is distributed under the terms of Article 25fa of the Dutch Copyright Act, indicated by the “Taverne” license above, pleasefollow below link for the End User Agreement:www.tue.nl/taverne
Take down policyIf you believe that this document breaches copyright please contact us at:[email protected] details and we will investigate your claim.
Download date: 16. Nov. 2021
Diffusion in Zeolites:
Towards a Microscopic Understanding
PROEFSCHRIFT
ter verkrijging van de graad van doctoraan de Technische Universiteit Eindhoven,
op gezag van de Rector Magnificus,prof.dr. R.A. van Santen,
voor een commissie aangewezendoor het College voor Promoties
in het openbaar te verdedigenop dinsdag 5 november 2002 om 16.00 uur
door
Danny Schuring
geboren te Amersfoort
Dit proefschrift is goedgekeurd door de promotoren:
prof.dr. R.A. van Santenenprof.dr. P.A.J. Hilbers
CIP-DATA LIBRARY TECHNISCHE UNIVERSITEIT EINDHOVEN
Schuring, Danny.
Diffusion in zeolites : towards a microscopic understanding / by DannySchuring. - Eindhoven: Technische Universiteit Eindhoven, 2002.Proefschrift. - ISBN 90-386-2624-X
NUR 913
Trefwoorden: heterogene katalyse ; zeolieten / poreuze materialen ;diffusie / adsorptie / fysisch-chemische simulatie en modellering /moleculaire dynamica / alkanen / radiochemie ; positron-emissieSubject headings: heterogeneous catalysis ; zeolites / porous materials;diffusion / adsorption / physiochemical simulation and modeling /molecular dynamics / alkanes / radiochemistry ; positron emission
Printed atUniversiteitsdrukkerij, Eindhoven University of Technology.
The work described in this thesis has been carried out at the Schuit Institute of Catal-ysis (part of NIOK, the Netherlands School for Catalysis Research), Eindhoven Uni-versity of Technology, The Netherlands.
Contents
1 Introduction 11.1 Catalysis . . . . . . . . . . . . . . . . . . . . . . . . . . . . . . . . 1
1.1.1 The principles of catalysis . . . . . . . . . . . . . . . . . . 21.1.2 Zeolites . . . . . . . . . . . . . . . . . . . . . . . . . . . . 31.1.3 Zeolites and the catalytic cycle . . . . . . . . . . . . . . . . 5
1.2 Diffusion . . . . . . . . . . . . . . . . . . . . . . . . . . . . . . . 61.2.1 Diffusion in gases and liquids . . . . . . . . . . . . . . . . 61.2.2 Diffusion in microporous materials . . . . . . . . . . . . . 7
1.3 The study of diffusion in zeolites . . . . . . . . . . . . . . . . . . . 81.4 Computational techniques . . . . . . . . . . . . . . . . . . . . . . 81.5 Questions to be answered . . . . . . . . . . . . . . . . . . . . . . . 91.6 Overview of this thesis . . . . . . . . . . . . . . . . . . . . . . . . 101.7 References . . . . . . . . . . . . . . . . . . . . . . . . . . . . . . . 11
2 Diffusion in Zeolites: Concepts and Techniques 132.1 Intracrystalline diffusion . . . . . . . . . . . . . . . . . . . . . . . 13
2.1.1 From gas-phase to micropore diffusion . . . . . . . . . . . 132.1.2 Diffusion in zeolites . . . . . . . . . . . . . . . . . . . . . 14
2.2 Self-diffusion versus transport diffusion . . . . . . . . . . . . . . . 152.2.1 Fickian diffusion . . . . . . . . . . . . . . . . . . . . . . . 152.2.2 Self-diffusion . . . . . . . . . . . . . . . . . . . . . . . . . 162.2.3 The Darken relation . . . . . . . . . . . . . . . . . . . . . 17
2.3 Factors influencing the diffusivity . . . . . . . . . . . . . . . . . . 182.3.1 Adsorbate concentration . . . . . . . . . . . . . . . . . . . 182.3.2 Temperature . . . . . . . . . . . . . . . . . . . . . . . . . 19
2.4 Anomalous diffusion in zeolites . . . . . . . . . . . . . . . . . . . 202.5 Experimental techniques: an overview . . . . . . . . . . . . . . . . 21
2.5.1 Macroscopic techniques . . . . . . . . . . . . . . . . . . . 222.5.2 Microscopic techniques . . . . . . . . . . . . . . . . . . . 232.5.3 Comparing the results of different techniques . . . . . . . . 24
2.6 Positron Emission Profiling . . . . . . . . . . . . . . . . . . . . . . 25
iv CONTENTS
2.6.1 Detection principles . . . . . . . . . . . . . . . . . . . . . 262.6.2 Production of radioactively labelled molecules . . . . . . . 272.6.3 Diffusion experiments . . . . . . . . . . . . . . . . . . . . 28
2.7 Simulating diffusion in zeolites . . . . . . . . . . . . . . . . . . . . 282.7.1 Classical diffusion theory . . . . . . . . . . . . . . . . . . 292.7.2 Molecular dynamics simulations . . . . . . . . . . . . . . . 302.7.3 Dynamic Monte Carlo methods . . . . . . . . . . . . . . . 312.7.4 Other techniques . . . . . . . . . . . . . . . . . . . . . . . 32
2.8 Final remarks . . . . . . . . . . . . . . . . . . . . . . . . . . . . . 332.9 References . . . . . . . . . . . . . . . . . . . . . . . . . . . . . . . 34
3 Molecular Dynamics of Alkanes in Zeolites 373.1 Introduction . . . . . . . . . . . . . . . . . . . . . . . . . . . . . . 373.2 Model and calculations . . . . . . . . . . . . . . . . . . . . . . . . 39
3.2.1 The zeolite model . . . . . . . . . . . . . . . . . . . . . . . 393.2.2 The alkane model . . . . . . . . . . . . . . . . . . . . . . . 413.2.3 Calculations . . . . . . . . . . . . . . . . . . . . . . . . . 41
3.3 Comparison with other studies . . . . . . . . . . . . . . . . . . . . 433.4 Diffusion in single-file pore systems . . . . . . . . . . . . . . . . . 443.5 Concentration dependence of the diffusivity . . . . . . . . . . . . . 463.6 Chainlength dependence . . . . . . . . . . . . . . . . . . . . . . . 513.7 Diffusion of branched alkanes . . . . . . . . . . . . . . . . . . . . 533.8 Conclusions . . . . . . . . . . . . . . . . . . . . . . . . . . . . . . 543.9 References . . . . . . . . . . . . . . . . . . . . . . . . . . . . . . . 55
4 Diffusion in Single-File Systems 574.1 Introduction . . . . . . . . . . . . . . . . . . . . . . . . . . . . . . 574.2 Methodology . . . . . . . . . . . . . . . . . . . . . . . . . . . . . 59
4.2.1 Hard-sphere dynamics . . . . . . . . . . . . . . . . . . . . 594.2.2 Molecular dynamics with Lennard-Jones type interactions . 614.2.3 Computational procedure . . . . . . . . . . . . . . . . . . . 63
4.3 Diffusion inside an unstructured tube . . . . . . . . . . . . . . . . . 644.3.1 The mean-square displacement . . . . . . . . . . . . . . . . 644.3.2 Concentration dependence . . . . . . . . . . . . . . . . . . 664.3.3 Influence of boundary conditions . . . . . . . . . . . . . . . 66
4.4 Diffusion in a structured tube . . . . . . . . . . . . . . . . . . . . . 684.4.1 The mean-square displacement in a structured tube . . . . . 694.4.2 Dependence on outer pore diameter . . . . . . . . . . . . . 724.4.3 Changing the pore geometry and interactions . . . . . . . . 754.4.4 Finite size effects in a structured tube . . . . . . . . . . . . 76
CONTENTS v
4.5 Implications and conclusions . . . . . . . . . . . . . . . . . . . . . 784.6 References . . . . . . . . . . . . . . . . . . . . . . . . . . . . . . . 81
5 Measurement and Simulation of Binary Diffusion in Zeolites 83
5.1 Introduction . . . . . . . . . . . . . . . . . . . . . . . . . . . . . . 835.2 Experimental setup . . . . . . . . . . . . . . . . . . . . . . . . . . 855.3 Modeling the tracer exchange process . . . . . . . . . . . . . . . . 86
5.3.1 The model equations . . . . . . . . . . . . . . . . . . . . . 875.3.2 Solving the model . . . . . . . . . . . . . . . . . . . . . . 895.3.3 Adsorption/desorption at the crystal boundary . . . . . . . . 895.3.4 Influence of the diffusion and adsorption constants . . . . . 92
5.4 Results and discussion . . . . . . . . . . . . . . . . . . . . . . . . 925.4.1 Adsorption of single components: comparison with literature 945.4.2 Binary adsorption: Results and comparison with CBMC . . 965.4.3 Multicomponent diffusion . . . . . . . . . . . . . . . . . . 98
5.5 Conclusions . . . . . . . . . . . . . . . . . . . . . . . . . . . . . . 1015.6 References . . . . . . . . . . . . . . . . . . . . . . . . . . . . . . . 102
6 The Influence of Siting on Adsorption and Diffusion 105
6.1 Introduction . . . . . . . . . . . . . . . . . . . . . . . . . . . . . . 1056.2 Modeling the diffusion in a 2-D pore network . . . . . . . . . . . . 107
6.2.1 Dynamic Monte Carlo simulations . . . . . . . . . . . . . . 1076.2.2 The lattice-gas model . . . . . . . . . . . . . . . . . . . . . 1086.2.3 Computational details . . . . . . . . . . . . . . . . . . . . 111
6.3 Adsorption of Single-component systems . . . . . . . . . . . . . . 1126.3.1 Influence of preferential siting . . . . . . . . . . . . . . . . 1126.3.2 Influence of lateral interactions . . . . . . . . . . . . . . . . 115
6.4 Single-component diffusion . . . . . . . . . . . . . . . . . . . . . . 1176.4.1 Influence of the lattice topology . . . . . . . . . . . . . . . 1176.4.2 Influence of preferential siting . . . . . . . . . . . . . . . . 118
6.5 Influence of site blocking . . . . . . . . . . . . . . . . . . . . . . . 1206.5.1 Diffusivity at varying coverages . . . . . . . . . . . . . . . 1206.5.2 Blocking at constant coverage . . . . . . . . . . . . . . . . 122
6.6 Binary diffusion . . . . . . . . . . . . . . . . . . . . . . . . . . . . 1226.6.1 Diffusivity versus coverage . . . . . . . . . . . . . . . . . . 1226.6.2 Influence of the mixture composition . . . . . . . . . . . . 124
6.7 Conclusions . . . . . . . . . . . . . . . . . . . . . . . . . . . . . . 1266.8 References . . . . . . . . . . . . . . . . . . . . . . . . . . . . . . . 129
vi CONTENTS
7 Concluding Remarks 1337.1 Diffusion in zeolites: where do we stand now? . . . . . . . . . . . . 1337.2 The results: an overview . . . . . . . . . . . . . . . . . . . . . . . 134
7.2.1 Molecular dynamics: modeling on microscopic scale . . . . 1347.2.2 Single-file diffusion: simple systems with complex behaviour 1357.2.3 Diffusion in mixtures . . . . . . . . . . . . . . . . . . . . . 1357.2.4 DMC: a coarse-grained model of diffusion . . . . . . . . . 136
7.3 The big picture . . . . . . . . . . . . . . . . . . . . . . . . . . . . 1367.3.1 The importance of intermolecular interactions . . . . . . . . 1367.3.2 The limitations of DMC . . . . . . . . . . . . . . . . . . . 1377.3.3 Macroscopic versus microscopic viewpoints . . . . . . . . . 1377.3.4 Theory versus experiment . . . . . . . . . . . . . . . . . . 138
Summary 141
Samenvatting 143
Dankwoord 145
Publications 147
Curriculum Vitae 149
1Introduction
In this chapter some background information, necessary for understand-ing the relevance of the study conducted in this thesis, will be given. Ashort introduction is given on catalysis, zeolites, and their use. The im-portance of diffusion and adsorption for the catalytic performance ofthese materials is discussed, as well as the diffusive process itself, bothin the gas phase, as well as in microporous materials. Finally, a shortoverview is given of the contents of this thesis.
Although the research presented in this thesis is performed in the inorganic chemistryand catalysis group at the Eindhoven University of Technology, this thesis does notcontain any chemical (catalytic) reactions. Instead, it deals with a subject of physicalchemistry, the diffusion of molecules in zeolites. At first sight, these two subjects donot seem to be too closely related. Diffusion can however be a very important param-eter when understanding the catalytic performance of chemical reactors, somethingwhich will hopefully become clear in the next few sections. This chapter is aimedat only giving a general overview of the field, a more detailed description of thediffusion can be found in the next chapter.
1.1 Catalysis
Nowadays, catalysis plays a very important role in the chemical industries. Althoughmost people only know of the existence of catalysts because they have one under-neath their car, nearly all products originating from the chemical industries (morethan 90%!)1 in one way or the other are produced utilizing these materials. Someof the most important processes are the production of high-quality fuels from crudeoil, the production of ammonia, of all kinds of plastics, and increasingly also in
2 Introduction
Eact
Ene
rgy
Products
Reactants
A + B
C + D
Reaction coordinate
Activation barrier
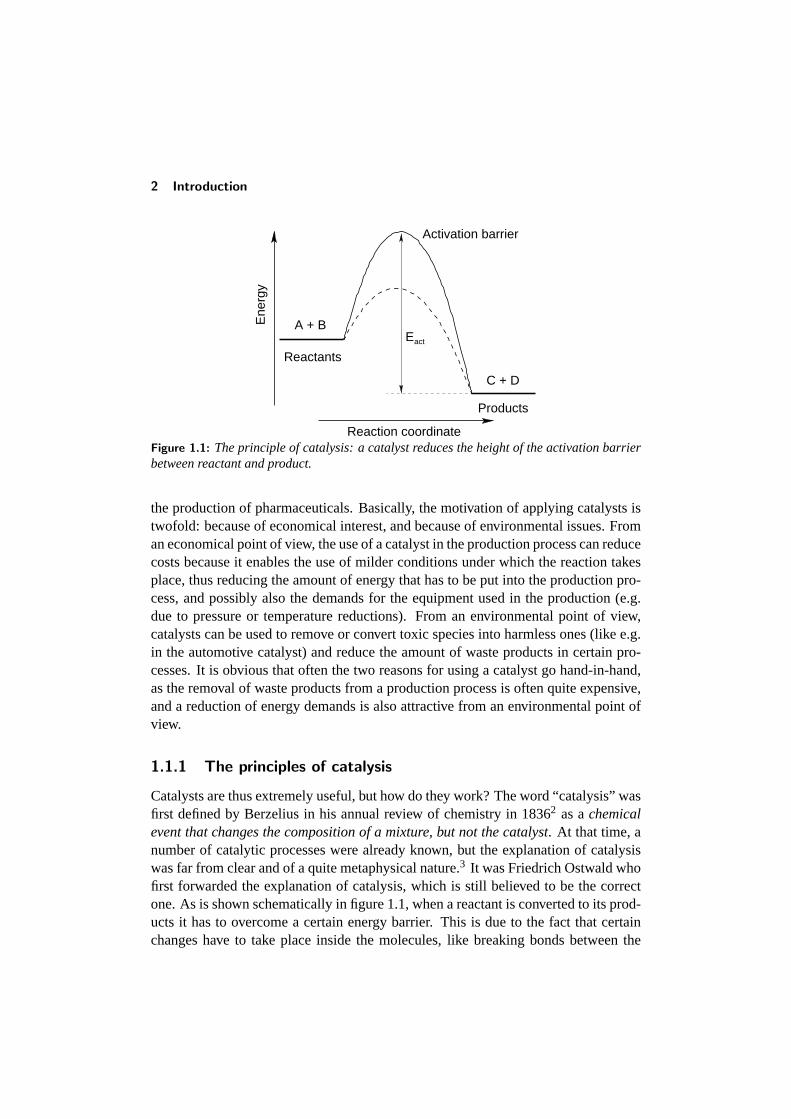
Figure 1.1: The principle of catalysis: a catalyst reduces the height of the activation barrierbetween reactant and product.
the production of pharmaceuticals. Basically, the motivation of applying catalysts istwofold: because of economical interest, and because of environmental issues. Froman economical point of view, the use of a catalyst in the production process can reducecosts because it enables the use of milder conditions under which the reaction takesplace, thus reducing the amount of energy that has to be put into the production pro-cess, and possibly also the demands for the equipment used in the production (e.g.due to pressure or temperature reductions). From an environmental point of view,catalysts can be used to remove or convert toxic species into harmless ones (like e.g.in the automotive catalyst) and reduce the amount of waste products in certain pro-cesses. It is obvious that often the two reasons for using a catalyst go hand-in-hand,as the removal of waste products from a production process is often quite expensive,and a reduction of energy demands is also attractive from an environmental point ofview.
1.1.1 The principles of catalysis
Catalysts are thus extremely useful, but how do they work? The word “catalysis” wasfirst defined by Berzelius in his annual review of chemistry in 18362 as achemicalevent that changes the composition of a mixture, but not the catalyst. At that time, anumber of catalytic processes were already known, but the explanation of catalysiswas far from clear and of a quite metaphysical nature.3 It was Friedrich Ostwald whofirst forwarded the explanation of catalysis, which is still believed to be the correctone. As is shown schematically in figure 1.1, when a reactant is converted to its prod-ucts it has to overcome a certain energy barrier. This is due to the fact that certainchanges have to take place inside the molecules, like breaking bonds between the
Catalysis 3
(a) (b)
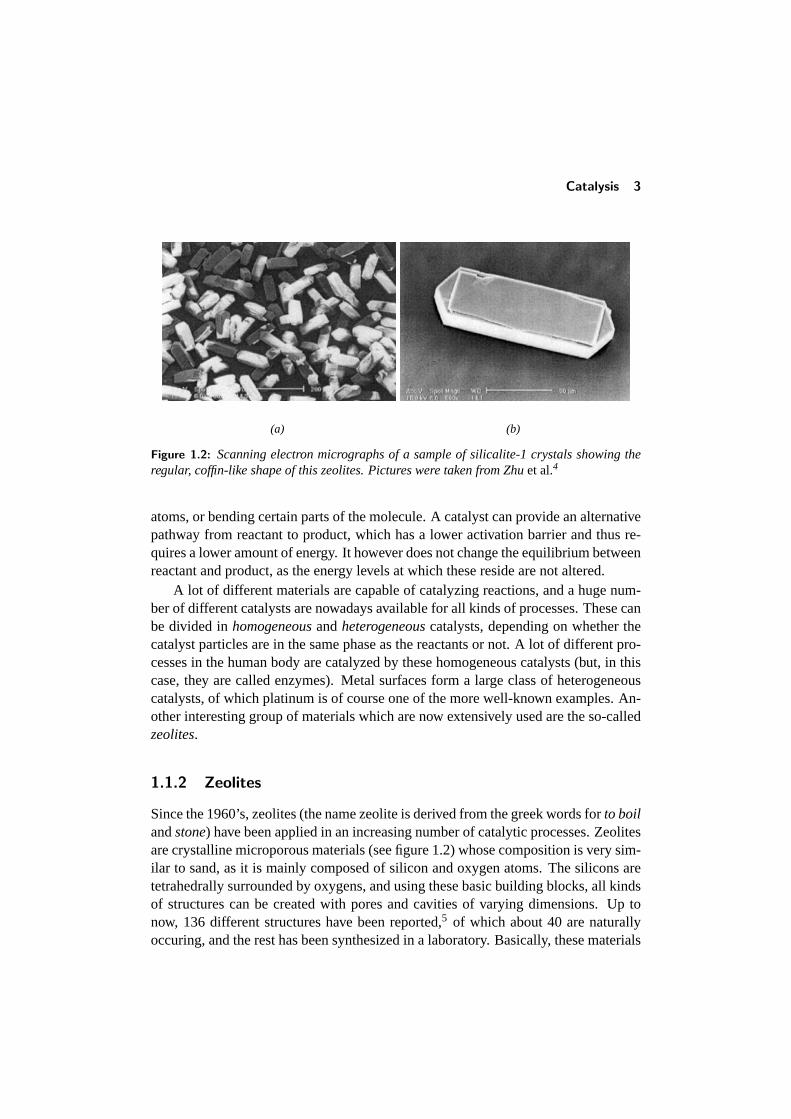
Figure 1.2: Scanning electron micrographs of a sample of silicalite-1 crystals showing theregular, coffin-like shape of this zeolites. Pictures were taken from Zhuet al.4
atoms, or bending certain parts of the molecule. A catalyst can provide an alternativepathway from reactant to product, which has a lower activation barrier and thus re-quires a lower amount of energy. It however does not change the equilibrium betweenreactant and product, as the energy levels at which these reside are not altered.
A lot of different materials are capable of catalyzing reactions, and a huge num-ber of different catalysts are nowadays available for all kinds of processes. These canbe divided inhomogeneousandheterogeneouscatalysts, depending on whether thecatalyst particles are in the same phase as the reactants or not. A lot of different pro-cesses in the human body are catalyzed by these homogeneous catalysts (but, in thiscase, they are called enzymes). Metal surfaces form a large class of heterogeneouscatalysts, of which platinum is of course one of the more well-known examples. An-other interesting group of materials which are now extensively used are the so-calledzeolites.
1.1.2 Zeolites
Since the 1960’s, zeolites (the name zeolite is derived from the greek words forto boilandstone) have been applied in an increasing number of catalytic processes. Zeolitesare crystalline microporous materials (see figure 1.2) whose composition is very sim-ilar to sand, as it is mainly composed of silicon and oxygen atoms. The silicons aretetrahedrally surrounded by oxygens, and using these basic building blocks, all kindsof structures can be created with pores and cavities of varying dimensions. Up tonow, 136 different structures have been reported,5 of which about 40 are naturallyoccuring, and the rest has been synthesized in a laboratory. Basically, these materials
4 Introduction
(a) (b)
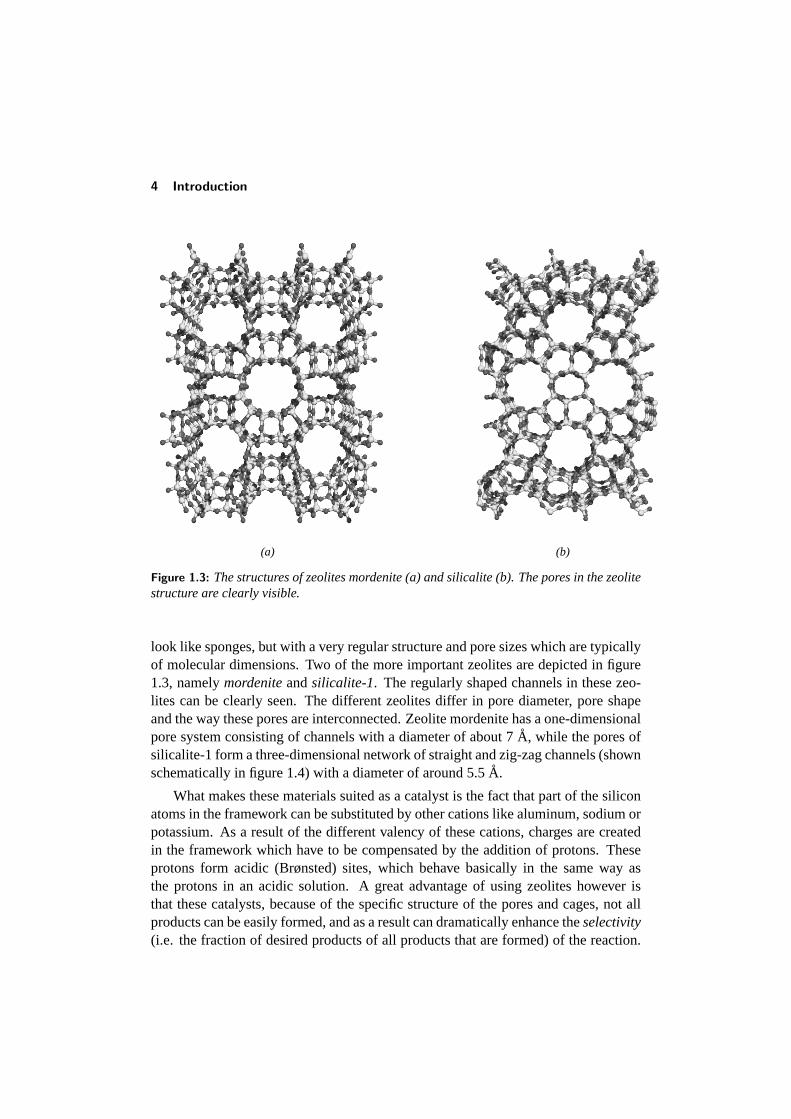
Figure 1.3: The structures of zeolites mordenite (a) and silicalite (b). The pores in the zeolitestructure are clearly visible.
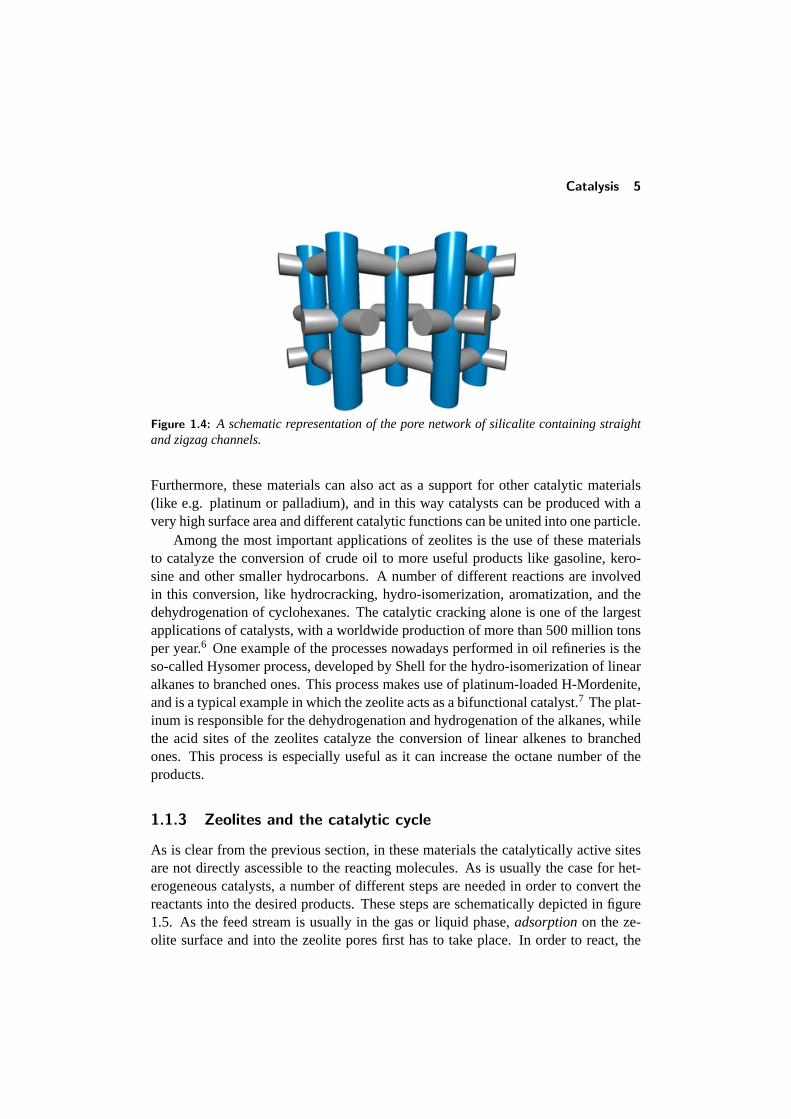
look like sponges, but with a very regular structure and pore sizes which are typicallyof molecular dimensions. Two of the more important zeolites are depicted in figure1.3, namelymordeniteandsilicalite-1. The regularly shaped channels in these zeo-lites can be clearly seen. The different zeolites differ in pore diameter, pore shapeand the way these pores are interconnected. Zeolite mordenite has a one-dimensionalpore system consisting of channels with a diameter of about 7A, while the pores ofsilicalite-1 form a three-dimensional network of straight and zig-zag channels (shownschematically in figure 1.4) with a diameter of around 5.5A.
What makes these materials suited as a catalyst is the fact that part of the siliconatoms in the framework can be substituted by other cations like aluminum, sodium orpotassium. As a result of the different valency of these cations, charges are createdin the framework which have to be compensated by the addition of protons. Theseprotons form acidic (Brønsted) sites, which behave basically in the same way asthe protons in an acidic solution. A great advantage of using zeolites however isthat these catalysts, because of the specific structure of the pores and cages, not allproducts can be easily formed, and as a result can dramatically enhance theselectivity(i.e. the fraction of desired products of all products that are formed) of the reaction.
Catalysis 5
Figure 1.4: A schematic representation of the pore network of silicalite containing straightand zigzag channels.
Furthermore, these materials can also act as a support for other catalytic materials(like e.g. platinum or palladium), and in this way catalysts can be produced with avery high surface area and different catalytic functions can be united into one particle.
Among the most important applications of zeolites is the use of these materialsto catalyze the conversion of crude oil to more useful products like gasoline, kero-sine and other smaller hydrocarbons. A number of different reactions are involvedin this conversion, like hydrocracking, hydro-isomerization, aromatization, and thedehydrogenation of cyclohexanes. The catalytic cracking alone is one of the largestapplications of catalysts, with a worldwide production of more than 500 million tonsper year.6 One example of the processes nowadays performed in oil refineries is theso-called Hysomer process, developed by Shell for the hydro-isomerization of linearalkanes to branched ones. This process makes use of platinum-loaded H-Mordenite,and is a typical example in which the zeolite acts as a bifunctional catalyst.7 The plat-inum is responsible for the dehydrogenation and hydrogenation of the alkanes, whilethe acid sites of the zeolites catalyze the conversion of linear alkenes to branchedones. This process is especially useful as it can increase the octane number of theproducts.
1.1.3 Zeolites and the catalytic cycle
As is clear from the previous section, in these materials the catalytically active sitesare not directly ascessible to the reacting molecules. As is usually the case for het-erogeneous catalysts, a number of different steps are needed in order to convert thereactants into the desired products. These steps are schematically depicted in figure1.5. As the feed stream is usually in the gas or liquid phase,adsorptionon the ze-olite surface and into the zeolite pores first has to take place. In order to react, the
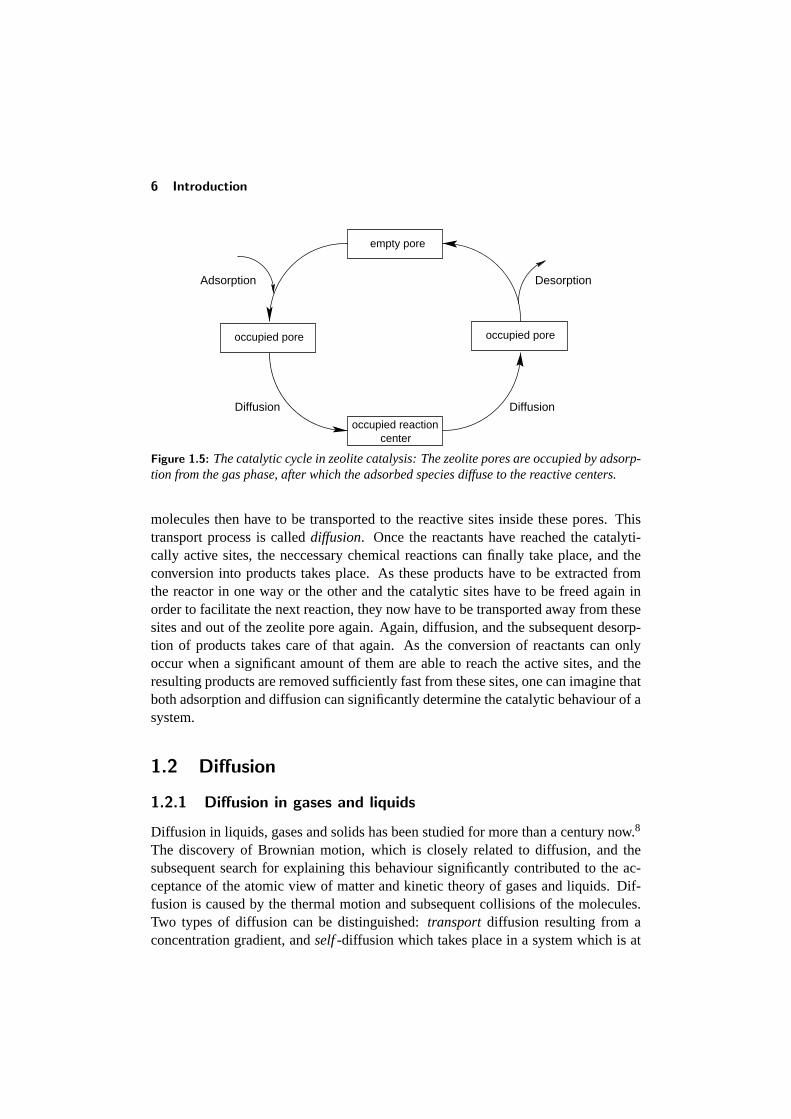
6 Introduction
Desorption
Diffusion
occupied reactioncenter
occupied pore
Adsorption
empty pore
occupied pore
Diffusion
Figure 1.5: The catalytic cycle in zeolite catalysis: The zeolite pores are occupied by adsorp-tion from the gas phase, after which the adsorbed species diffuse to the reactive centers.
molecules then have to be transported to the reactive sites inside these pores. Thistransport process is calleddiffusion. Once the reactants have reached the catalyti-cally active sites, the neccessary chemical reactions can finally take place, and theconversion into products takes place. As these products have to be extracted fromthe reactor in one way or the other and the catalytic sites have to be freed again inorder to facilitate the next reaction, they now have to be transported away from thesesites and out of the zeolite pore again. Again, diffusion, and the subsequent desorp-tion of products takes care of that again. As the conversion of reactants can onlyoccur when a significant amount of them are able to reach the active sites, and theresulting products are removed sufficiently fast from these sites, one can imagine thatboth adsorption and diffusion can significantly determine the catalytic behaviour of asystem.
1.2 Diffusion
1.2.1 Diffusion in gases and liquids
Diffusion in liquids, gases and solids has been studied for more than a century now.8
The discovery of Brownian motion, which is closely related to diffusion, and thesubsequent search for explaining this behaviour significantly contributed to the ac-ceptance of the atomic view of matter and kinetic theory of gases and liquids. Dif-fusion is caused by the thermal motion and subsequent collisions of the molecules.Two types of diffusion can be distinguished:transport diffusion resulting from aconcentration gradient, andself-diffusion which takes place in a system which is at
Diffusion 7
equilibrium. The flux due to transport diffusion can be described using Fick’s FirstLaw of Diffusion:
~J =−D ·∇c (1.1)
in whichD is the diffusion constant andc the concentration. Self-diffusion is usuallyexpressed in terms of a self-diffusion constantDc. In the case of tracer diffusion,where the labelled molecules mix with unlabelled molecules with the same prop-erties, the transport and self-diffusivity are identical. But, although transport andself-diffusion generally occur by essentially the same microscopic principle, usuallythese coefficients for transport and self-diffusion are not the same.
1.2.2 Diffusion in microporous materials
Diffusion in zeolites differs from ordinary diffusion in the sense that the moleculeshave to move through channels of molecular dimensions. As a result, there is aconstant interaction between the diffusing molecules and the zeolite framework, andthe molecular motion is thus also strongly influenced by the exact size and shape ofthese channels instead of the temperature and concentration only. While in the caseof gases and liquids the behaviour and exact value of the diffusivity can be calculatedwith relative ease, the exact values of these are much harder to predict for zeolites.The interactions between molecules and the pore wall for example lead to large dif-ferences in the diffusivities of different alkane isomers, as the more bulky branchedisomers have a much larger interaction with the zeolite framework. A special typeof diffusion can be observed in one-dimensional zeolites, calledsingle-filediffusion.This type of diffusion results from the fact that some types of molecules are unable topass each other in the narrow pores of the zeolites, and leads to a significant reductionof the mobility in these systems. Clearly, these effects are not present in pure liquidsand gases.
From an industrial point of view, it is important to be able to predict and describethe mass transfer through the packed-bed reactors used in the chemical industries.A better understanding of this phenomenon will aid in the optimization and devel-opment of industrial applications of these materials in separation and catalytic pro-cesses. For this purpose, the transport diffusivities are needed. A number of differentexperimental techniques are nowadays available for determining these values.9 Thereis however no reliable theory that can easily predict the diffusivity for different com-ponents in different zeolites, as it is often hard to relate these values to the underlyingmicroscopic mechanisms.10, 11 Furthermore, large discrepancies often exist betweenvalues obtained from different techniques, and performing these experiments is oftennot straightforward. It would thus be advantageous to have a good understanding ofwhat can happen inside these zeolites, and what kind of influence this will have on areactor scale.
8 Introduction
From a fundamental point of view, the study of diffusion is also interesting asthe interactions between molecules and the zeolite can lead to all kinds of unex-pected behaviour. The dependencies on for example the concentration of the dif-fusing molecules is expected to be completely different, as also the topology of thezeolite pore network plays an important role in this behaviour. The diffusion of mix-tures of different molecules is also less straightforward. These kind of effects can bereadily studied using zeolites, as in a sense, due to their regular structure, they canact as models for more complicated systems like for example amorphous materials.Furthermore, a thorough understanding of the underlying microscopic mechanismsinvolved will aid in understanding the interaction between transport properties andthe reactivity in these materials.
1.3 The study of diffusion in zeolites
As was already mentioned in the previous section a number of different techniquesare available for studying the diffusion in zeolites. The most common techniqueis to follow the time response of an adsorbate-adsorbent system after changing thepressure or composition of the surrounding atmosphere. By analyzing the responsecurves the contributing diffusion coefficients can then be calculated.12 A number ofdifferent sorption techniques are nowadays available, which all have their advantagesand disadvantages. A special class of techniques form the ones in which labelledmolecules are used, as these techniques are capable of measuring the diffusion underequilibrium conditions and can thus probe thetracer- or self-diffusivity. More re-cently, two new techniques have been introduced to directly probe the self-diffusivityin these materials called pulse-field gradient NMR (PFG-NMR)13 and Quasi-ElasticNeutron Scattering (QENS).14 Both techniques are capable of measuring the mean-square displacement of the molecules inside the zeolite pores.
1.4 Computational techniques
Since the beginning of the 1980’s, an increasing number of theoretical studies havebeen conducted.15 Due to the increase in computational power, different methodsoriginating from the field of statistical mechanics could now be applied to the studyof diffusion and adsorption in these microporous materials. Monte Carlo techniquescould now be applied to investigate the adsorptive behaviour of molecules. Latticedynamics studies served to study the influence of the lattice topology on reactionsand transport phenomena. Molecular dynamics simulations gave a more detailed de-scription of the diffusive and adsorptive processes, and have proven to be successful
Questions to be answered 9
in studying the diffusive behaviour. Nowadays, even quantum chemical calculationscan be applied.16
One of the main reasons why theoretical methods have received an increasingamount of attention is that they potentially provide an inexpensive and time-effectiveway to determine the diffusive and adsorptive behaviour of adsorbents in zeolites. Asexperimental techniques are often very expensive and time-consuming, and the inter-pretation of the results is not always unambiguous, the development of reliable theo-retical methods can significantly contribute to the prediction of transport phenomena.Using theoretical methods, the different parameters of interest (pore structure, con-centration, temperature) can furthermore easily be varied, and their influence on theparameters of interest readily be calculated. Furthermore, the microscopic under-standing resulting from these model studies often help in understanding the experi-mental results. In this respect, a close synergy between experiment and theory is offundamental importance to both fields.
1.5 Questions to be answered
Although an extensive amount of research is nowadays available in literature on thesubject of diffusion in zeolites, a number of questions still remain in this field. One ofthe most important problems is the apparent discrepancy between the results obtainedfrom different techniques, especially when comparing macroscopic and microscopicmethods. As the interactions between adsorbates and the zeolite taking place on amolecular scale are the main cause for the completely different behaviour comparedto the gas phase, a better insight into the effect of these interactions might help in clar-ifying this problem. This will therefore be one of the main focusses of the researchpresented in this thesis.
As was already discussed in the previous section, theoretical methods are, al-though they only provide an approximative description of reality, excellently suitedfor investigating the diffusive process on a microscopic scale. These will thereforebe the primary tools used in this thesis. Using these, the influence of different ex-perimental parameters (zeolite structure, type of adsorbate, concentration, tempera-ture) on the diffusivity are determined. The controversy in literature regarding theoccurrence of single-file diffusion in zeolites with one-dimensional pore structuresseems to indicate that a study of the fundamentals of this process might also help inunderstanding the problems encountered in zeolite science. The diffusion of binarymixtures provides an excellent test-case in which the interrelation between adsorbate-adsorbate and adsorbate-zeolite interactions can be investigated. The same holds forsystems in which molecules have a preference of residing in certain regions of thepore structure. All these problems will hopefully provide us with some idea of what
10 Introduction
microscopic phenomena influence the mobility of the adsorbates in the zeolite, andwhat the consequences will be on a macroscopic scale.
1.6 Overview of this thesis
Now that it is clear why the study of diffusion in zeolites is of interest, it is timeto have a more in-depth look at this field of research. In the upcoming chapters, ashort overview will be given of the current insights in the diffusion of molecules inmicroporous materials, and different techniques will be applied to study some of thephenomena present in these systems. The different chapters are written in such a way,that they can in principle be read seperately.
Chapter 2 starts with a short overview of the basic concepts of diffusion in zeo-lites. After that, a short overview is given of both the experimental and theoreticaltechniques that are available to study the subject. As the details of the methods usedin this thesis are described in the respective chapters in which they are applied, onlythe basic principles will be discussed. The aim is to provide an overview of the mostimportant available techniques, together with some of their advantages and disadvan-tages.
In chapter 3, molecular dynamics simulations have been applied to study theinfluence of the zeolite structure, size of the diffusing molecules, and pore loadingon the diffusivity. As this technique is capable of quite accurately describing theprocess on a microscopic level, it is particularly suited to study this phenomenonon a microscopic scale. Although the simulations themselves are computationallydemanding, different parameters like the ones mentioned before can be easily variedand their influences studied without having to worry about influencing other factors.
Chapter 4 focusses on the more fundamental subject of single-file diffusion. Thistype of diffusion can be observed in zeolites with one-dimensional pore structures,and results in anomalous diffusive behviour which significantly alters the behaviouron a microscopic scale, but also has a great impact on the behaviour on a macro-scopic scale. Using very simple model systems, some of the basic factors leadingto this behaviour are studied, and, although these results are generally applicable toall single-file systems, the consequences for the diffusive behaviour in zeolites arediscussed.
In Chapter 5, the more practical subject of diffusion in binary mixtures is consid-ered. In this case, a mixture ofn-hexane and2-methylpentane in silicalite was used,as this is a system which is also quite interesting from an industrial point of view. Forthis study, an experimental technique called Positron Emission Profiling (PEP) wasused. In order to be able to interpret the results, a mathematical model describing theflow in zeolite packed-bed reactors was developed, and this model will be discussed
References 11
in detail here. The obtained results raise some questions regarding the influence ofthe siting of different components inside the zeolite pore network on the diffusivebehaviour.
One of the questions raised in chapter 5 is investigated further in chapter 6. Us-ing dynamic Monte Carlo simulations, the diffusive behaviour of particles on a 2-dimensional pore network is studied. As these simulations make use of a coarse-grained model of the zeolite pore network, these simulations can be performed atmuch larger time- and length scales than for example molecular dynamics simula-tions. Although these simulations do not give a detailed description of the interac-tions on a microscopic scale, some of the essential features can be easily included andtheir influences can be readily investigated. In this case, the effects of the preferentialsiting of particles for a certain type of adsorption site in the lattice on the single- andbinary-component diffusion and adsorption will be studied.
This thesis will finish with chapter 7, which will give a general overview of theresults obtained in the previous chapters, and summarizes the conclusions that can bedrawn from this research. Some general insights will be considered which have beenobtained from the research in this thesis.
1.7 References
1 J. M. Thomas and W. J. Thomas,Principles and practice of heterogeneous catalysis,VCH, Weinheim, Germany (1996).
2 J. J. Berzelius,Jahresber. Chem.15, 242–244 (1836).3 R. A. van Santen and J. W. Niemantsverdriet,Chemical kinetics and catalysis, Plenum
Press, New York, New York (1995).4 W. Zhu, F. Kapteijn, and J. A. Moulijn,Microporous Mesoporous Mater.47, 157–171
(2001).5 C. Baerlocher, W. M. Meier, and D. H. Olson,Atlas of zeolite framework types, Elsevier,
Amsterdam, The Netherlands, 5th ed. (2001).6 R. A. van Santen, P. W. N. M. van Leeuwen, J. A. Moulijn, and B. A. Averill (Eds.),Catal-
ysis: An integrated approach, second, revised and enlarged edition, Elsevier, Amsterdam,The Netherlands, 2nd ed. (1999).
7 P. B. Weisz,Polyfunctional heterogeneous catalysis, in: Advances in catalysis and relatedsubjects, D. D. Eley, P. W. Selwood, and P. B. Weisz, eds., vol. 13, pp. 137–190, AcademicPress, New York (1962).
8 W. Jost,Diffusion in solids, liquids and gases, Academic Press, New York (1960).9 J. Karger and D. M. Ruthven,Diffusion in zeolites and other microporous solids, John
Wiley & Sons, Inc., New York (1992).10 N. Y. Chen, T. F. Degnan Jr., and C. M. Smith,Molecular transport and reaction in
zeolites - design and application of shape selective catalysis, VCH Publishers, New York(1994).
11 N. Benes and H. Verweij,Langmuir15(23), 8292–8299 (1999).
12 Introduction
12 D. M. Ruthven,Principles of adsorption and adsorption processes, John Wiley & Sons,New York (1984).
13 J. Karger and H. Pfeifer,Zeolites7, 90–107 (1987).14 H. Jobic, M. Bee, and G. J. Kearley,J. Phys. Chem.98, 4660–4665 (1994).15 F. J. Keil, R. Krishna, and M.-O. Coppens,Rev. Chem. Eng.16(2), 71–197 (2000).16 L. Benco, T. Demuth, J. Hafner, F. Hutschka, and H. Toulhoat,J. Chem. Phys.114(14),
6327–6334 (2001).
2Diffusion in Zeolites: Concepts
and Techniques
Nowadays a number of different techniques, both experimental and the-oretical, are available to study the diffusion in zeolites. Roughly, thesemethods can be divided in macroscopic and microscopic methods, de-pending on the time- or lengthscale at which they probe the diffusiveprocess. In this chapter, a short overview is given of the different tech-niques available. The emphasis will be more on the theoretical methods,as these were used for the largest part of the research in this thesis.Some extra attention will futhermore be paid on the methods applied inthis thesis.
2.1 Intracrystalline diffusion
2.1.1 From gas-phase to micropore diffusion
As was already discussed in the introduction, the diffusion of molecules through thepores of a zeolite crystal differs greatly from gaseous diffusion. In gases the diffu-sion is controlled by the interactions (or collisions) between the different moleculesdue to their thermal motion. As gases and liquids form an isotropic medium, differ-ent properties like the average collision rate, collision rate and mean free path can becalculated relatively easy using kinetic theory, based on the laws of classical mechan-ics.1 More sophisticated theories, which also account for intermolecular interactions,vibration and rotation of the molecules, and quantum effects are nowadays availableand are quite capable of describing the behaviour of a variety of systems.
The diffusion of molecules in pores can be classified in a number of different

14 Diffusion in Zeolites: Concepts and Techniques
10−12
10−8
10−4
10−16
1001000 10 1 0.1
Diff
usiv
ity [m
/s]
2
Configurational
MolecularKnudsen
100
75
50
25
01001000 10 1 0.1
Act
ivat
ion
Ene
rgy
[kJ/
mol
]
Pore diameter [nm] Pore diameter [nm]
Figure 2.1: Effect of pore size on the diffusivity and activation energy of diffusion (taken fromPost2).
regimes depending on the pore diameter (see figure 2.1). For large pore diameters,of the order of 1µm or larger, usually calledmacropores, collisions between themolecules occurs much more frequently than collisions with the wall, and moleculardiffusion is the dominant mechanism. Typically, the diffusion constants of gases arearound 10−5 m2·s−1. As the size of the pores decreases, the number of collisions withthe wall increases until it finally becomes smaller than the mean free path (the averagedistance travelled by a molecule between two collisions) of the gas molecules. Atthis point, Knudsen diffusion takes over and the mobility starts to depend on thedimensions of the pore.3 At even smaller pore sizes, in the range of 20A and smallerwhen the pore diameter become comparable to the size of the molecules, these willcontinuously feel the interaction with the walls. Diffusion in the micropores of azeolite usually takes place in this regime, and is calledconfigurationaldiffusion.4
2.1.2 Diffusion in zeolites
The mechanism by which the molecules move through the pores in the configura-tional regime is comparable to that of surface diffusion of adsorbed molecules ona surface. Due to the small distance between the molecules and the pore wall, themolecules are more or less physically bonded to it, and the mechanism is comparableto surface diffusion. The diffusivity in this regime will depend strongly on the porediameter, the structure of the pore wall, the interactions between the surface atomsand the diffusing molecules, the shape of the diffusing molecules and the way thechannels are connected. As a result, it is very difficult to derive generalized equa-tions relating the forementioned properties to the diffusion coefficient one finds forthese systems. The values of these coefficients furthermore span an enormous range
Self-diffusion versus transport diffusion 15
from 10−8 to as low as 10−20 m2·s−1.5 Compared to the gas phase, the diffusivity ofthe molecules inside the zeolite channels is thus greatly reduced, and a much strongertemperature dependence is often observed. The fact that the particles have to movethrough the pore network also introduces correlation effects, which can also greatlyenhance the concentration dependence.
2.2 Self-diffusion versus transport diffusion
2.2.1 Fickian diffusion
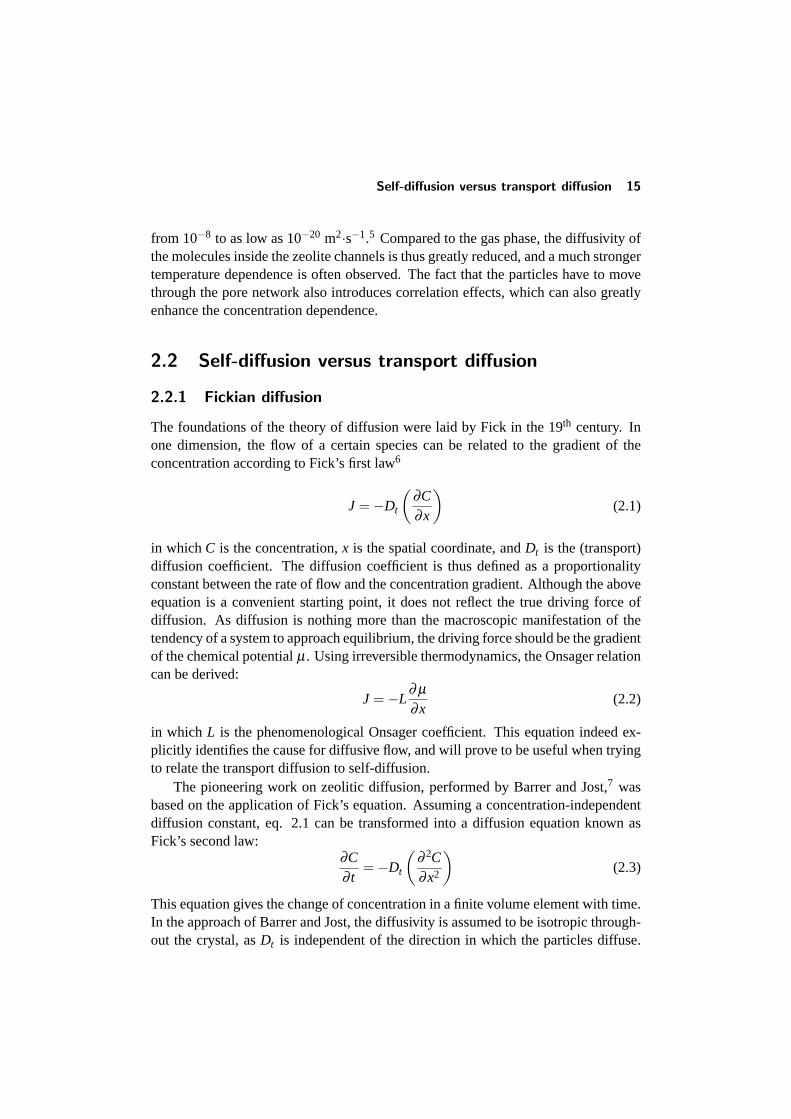
The foundations of the theory of diffusion were laid by Fick in the 19th century. Inone dimension, the flow of a certain species can be related to the gradient of theconcentration according to Fick’s first law6
J =−Dt
(∂C∂x
)(2.1)
in whichC is the concentration,x is the spatial coordinate, andDt is the (transport)diffusion coefficient. The diffusion coefficient is thus defined as a proportionalityconstant between the rate of flow and the concentration gradient. Although the aboveequation is a convenient starting point, it does not reflect the true driving force ofdiffusion. As diffusion is nothing more than the macroscopic manifestation of thetendency of a system to approach equilibrium, the driving force should be the gradientof the chemical potentialµ. Using irreversible thermodynamics, the Onsager relationcan be derived:
J =−L∂ µ
∂x(2.2)
in which L is the phenomenological Onsager coefficient. This equation indeed ex-plicitly identifies the cause for diffusive flow, and will prove to be useful when tryingto relate the transport diffusion to self-diffusion.
The pioneering work on zeolitic diffusion, performed by Barrer and Jost,7 wasbased on the application of Fick’s equation. Assuming a concentration-independentdiffusion constant, eq. 2.1 can be transformed into a diffusion equation known asFick’s second law:
∂C∂ t
=−Dt
(∂ 2C∂x2
)(2.3)
This equation gives the change of concentration in a finite volume element with time.In the approach of Barrer and Jost, the diffusivity is assumed to be isotropic through-out the crystal, asDt is independent of the direction in which the particles diffuse.
16 Diffusion in Zeolites: Concepts and Techniques
Assuming spherical particles, Fick’s second law can be readily solved in radial co-ordinates. As a result, all information about the exact shape and connectivity of thepore structure is lost, and only reflected by the value of the diffusion constant.
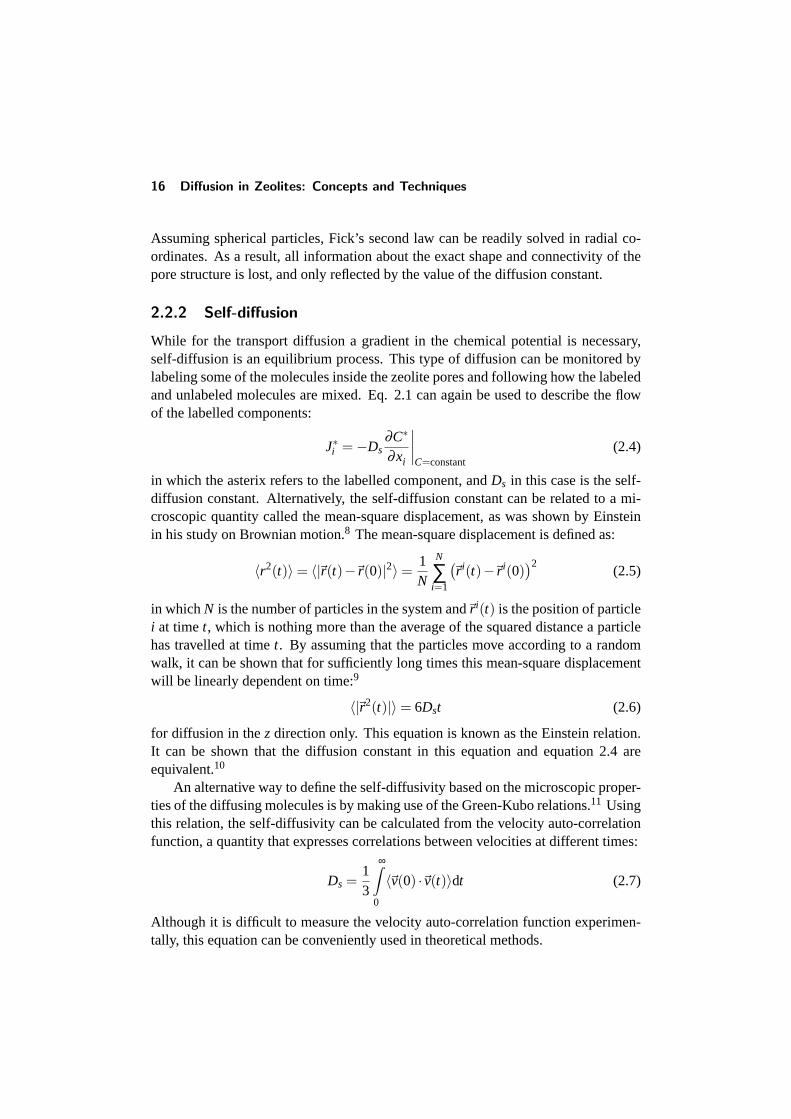
2.2.2 Self-diffusion
While for the transport diffusion a gradient in the chemical potential is necessary,self-diffusion is an equilibrium process. This type of diffusion can be monitored bylabeling some of the molecules inside the zeolite pores and following how the labeledand unlabeled molecules are mixed. Eq. 2.1 can again be used to describe the flowof the labelled components:
J∗i =−Ds∂C∗
∂xi
∣∣∣∣C=constant
(2.4)
in which the asterix refers to the labelled component, andDs in this case is the self-diffusion constant. Alternatively, the self-diffusion constant can be related to a mi-croscopic quantity called the mean-square displacement, as was shown by Einsteinin his study on Brownian motion.8 The mean-square displacement is defined as:
〈r2(t)〉= 〈|~r(t)−~r(0)|2〉=1N
N
∑i=1
(~r i(t)−~r i(0)
)2(2.5)
in whichN is the number of particles in the system and~r i(t) is the position of particlei at timet, which is nothing more than the average of the squared distance a particlehas travelled at timet. By assuming that the particles move according to a randomwalk, it can be shown that for sufficiently long times this mean-square displacementwill be linearly dependent on time:9
〈|~r2(t)|〉= 6Dst (2.6)
for diffusion in thez direction only. This equation is known as the Einstein relation.It can be shown that the diffusion constant in this equation and equation 2.4 areequivalent.10
An alternative way to define the self-diffusivity based on the microscopic proper-ties of the diffusing molecules is by making use of the Green-Kubo relations.11 Usingthis relation, the self-diffusivity can be calculated from the velocity auto-correlationfunction, a quantity that expresses correlations between velocities at different times:
Ds =13
∞∫0
〈~v(0) ·~v(t)〉dt (2.7)
Although it is difficult to measure the velocity auto-correlation function experimen-tally, this equation can be conveniently used in theoretical methods.
Self-diffusion versus transport diffusion 17
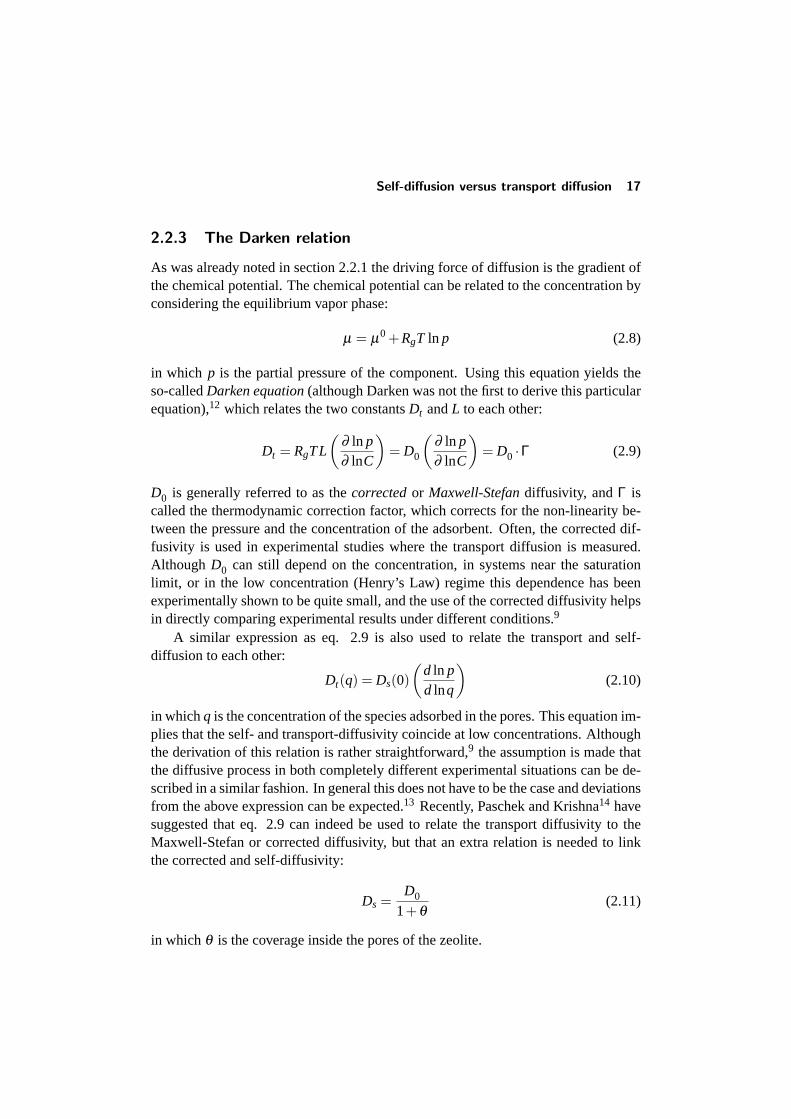
2.2.3 The Darken relation
As was already noted in section 2.2.1 the driving force of diffusion is the gradient ofthe chemical potential. The chemical potential can be related to the concentration byconsidering the equilibrium vapor phase:
µ = µ0 +RgT ln p (2.8)
in which p is the partial pressure of the component. Using this equation yields theso-calledDarken equation(although Darken was not the first to derive this particularequation),12 which relates the two constantsDt andL to each other:
Dt = RgTL
(∂ ln p∂ lnC
)= D0
(∂ ln p∂ lnC
)= D0 ·Γ (2.9)
D0 is generally referred to as thecorrectedor Maxwell-Stefandiffusivity, and Γ iscalled the thermodynamic correction factor, which corrects for the non-linearity be-tween the pressure and the concentration of the adsorbent. Often, the corrected dif-fusivity is used in experimental studies where the transport diffusion is measured.Although D0 can still depend on the concentration, in systems near the saturationlimit, or in the low concentration (Henry’s Law) regime this dependence has beenexperimentally shown to be quite small, and the use of the corrected diffusivity helpsin directly comparing experimental results under different conditions.9
A similar expression as eq. 2.9 is also used to relate the transport and self-diffusion to each other:
Dt(q) = Ds(0)(
d ln pd lnq
)(2.10)
in whichq is the concentration of the species adsorbed in the pores. This equation im-plies that the self- and transport-diffusivity coincide at low concentrations. Althoughthe derivation of this relation is rather straightforward,9 the assumption is made thatthe diffusive process in both completely different experimental situations can be de-scribed in a similar fashion. In general this does not have to be the case and deviationsfrom the above expression can be expected.13 Recently, Paschek and Krishna14 havesuggested that eq. 2.9 can indeed be used to relate the transport diffusivity to theMaxwell-Stefan or corrected diffusivity, but that an extra relation is needed to linkthe corrected and self-diffusivity:
Ds =D0
1+θ(2.11)
in which θ is the coverage inside the pores of the zeolite.
18 Diffusion in Zeolites: Concepts and Techniques
DsDs Ds
Ds Ds
C CC
C C
Type I Type II Type III
Type IV Type V
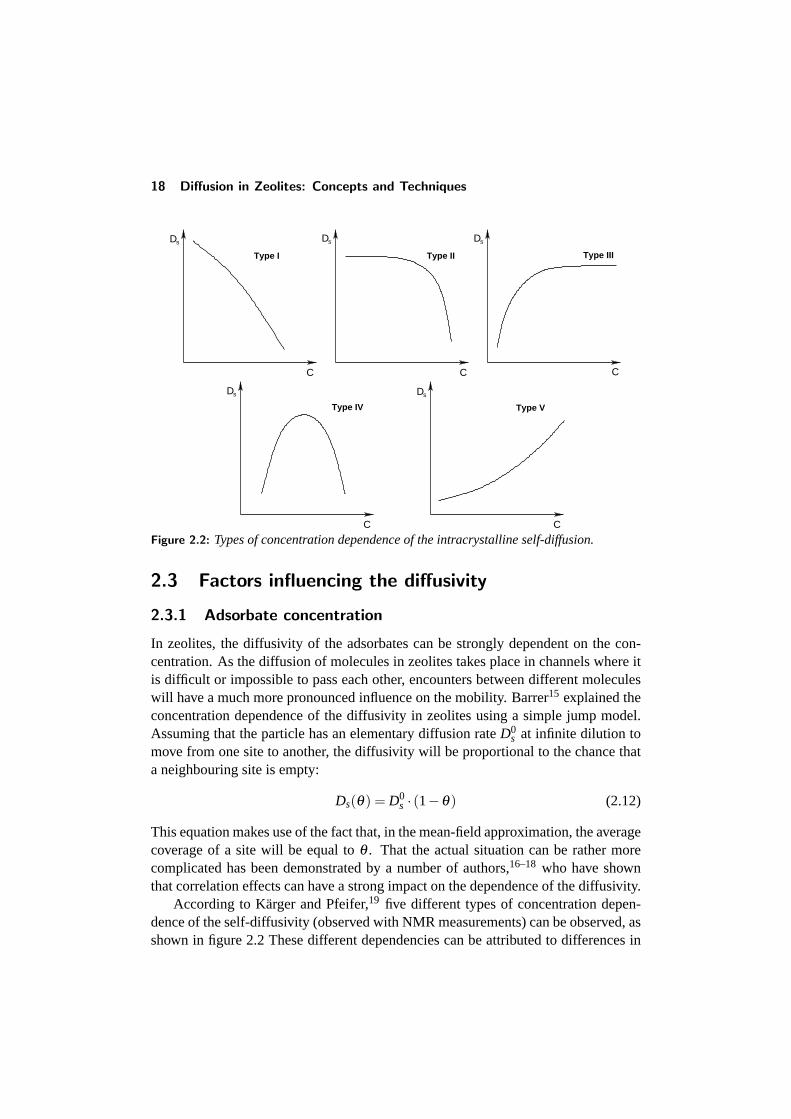
Figure 2.2: Types of concentration dependence of the intracrystalline self-diffusion.
2.3 Factors influencing the diffusivity
2.3.1 Adsorbate concentration
In zeolites, the diffusivity of the adsorbates can be strongly dependent on the con-centration. As the diffusion of molecules in zeolites takes place in channels where itis difficult or impossible to pass each other, encounters between different moleculeswill have a much more pronounced influence on the mobility. Barrer15 explained theconcentration dependence of the diffusivity in zeolites using a simple jump model.Assuming that the particle has an elementary diffusion rateD0
s at infinite dilution tomove from one site to another, the diffusivity will be proportional to the chance thata neighbouring site is empty:
Ds(θ) = D0s · (1−θ) (2.12)
This equation makes use of the fact that, in the mean-field approximation, the averagecoverage of a site will be equal toθ . That the actual situation can be rather morecomplicated has been demonstrated by a number of authors,16–18 who have shownthat correlation effects can have a strong impact on the dependence of the diffusivity.
According to Karger and Pfeifer,19 five different types of concentration depen-dence of the self-diffusivity (observed with NMR measurements) can be observed, asshown in figure 2.2 These different dependencies can be attributed to differences in
Factors influencing the diffusivity 19
the interactions between the framework atoms and the diffusing molecules, like forexample interactions with different cations in the zeolite, or the presence of strongand weak adsorption sites. In addition the pore topology can also have a significantinfluence on the diffusivity, as was shown by Coppenset al.18 This is mainly due tothe stronger correlations present in systems with lower connectivity. As a result, thereis an increased chance that a molecule will move back into its previous location asthe chance of finding an empty space there is larger, and a larger decrease in mobilitywith increasing pore loading is observed.9 The prediction of the concentration de-pendence for different systems however remains difficult, and further investigationson this dependence remain of interest.
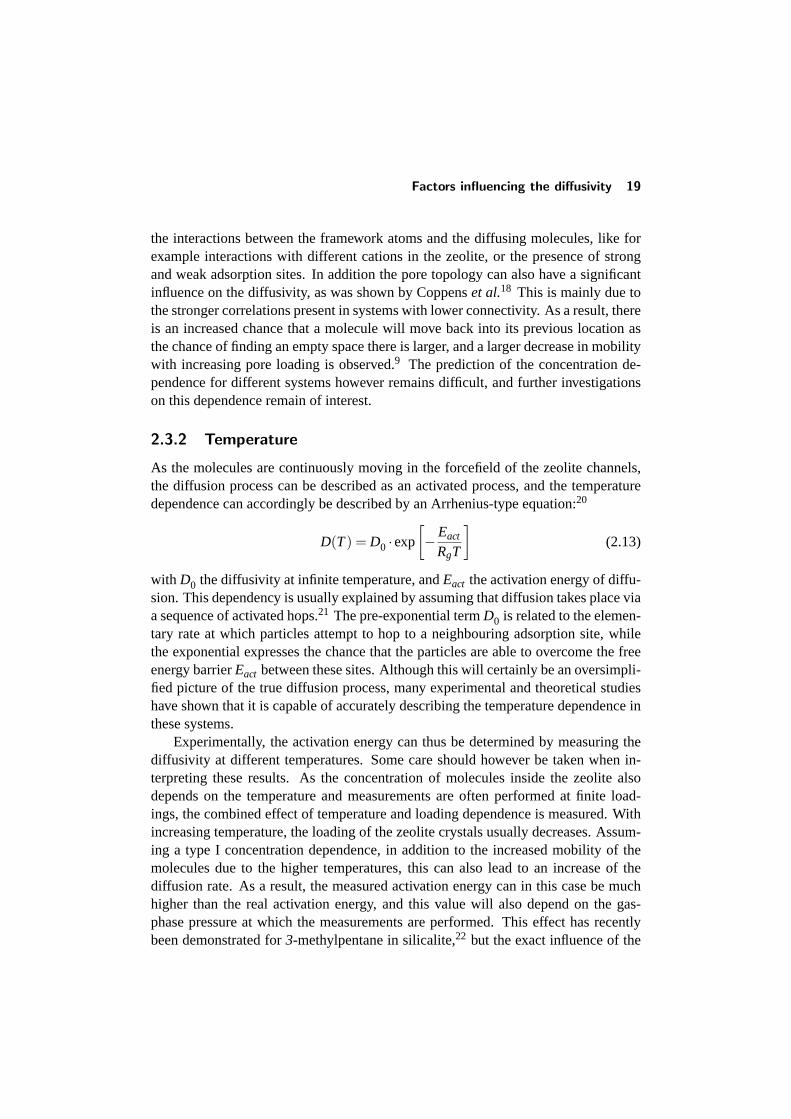
2.3.2 Temperature
As the molecules are continuously moving in the forcefield of the zeolite channels,the diffusion process can be described as an activated process, and the temperaturedependence can accordingly be described by an Arrhenius-type equation:20
D(T) = D0 ·exp
[−Eact
RgT
](2.13)
with D0 the diffusivity at infinite temperature, andEact the activation energy of diffu-sion. This dependency is usually explained by assuming that diffusion takes place viaa sequence of activated hops.21 The pre-exponential termD0 is related to the elemen-tary rate at which particles attempt to hop to a neighbouring adsorption site, whilethe exponential expresses the chance that the particles are able to overcome the freeenergy barrierEact between these sites. Although this will certainly be an oversimpli-fied picture of the true diffusion process, many experimental and theoretical studieshave shown that it is capable of accurately describing the temperature dependence inthese systems.
Experimentally, the activation energy can thus be determined by measuring thediffusivity at different temperatures. Some care should however be taken when in-terpreting these results. As the concentration of molecules inside the zeolite alsodepends on the temperature and measurements are often performed at finite load-ings, the combined effect of temperature and loading dependence is measured. Withincreasing temperature, the loading of the zeolite crystals usually decreases. Assum-ing a type I concentration dependence, in addition to the increased mobility of themolecules due to the higher temperatures, this can also lead to an increase of thediffusion rate. As a result, the measured activation energy can in this case be muchhigher than the real activation energy, and this value will also depend on the gas-phase pressure at which the measurements are performed. This effect has recentlybeen demonstrated for3-methylpentane in silicalite,22 but the exact influence of the
20 Diffusion in Zeolites: Concepts and Techniques
concentration dependence of course depends on the concentration dependence of thesystem. Ways to circumvent this problem is by measuring at very low coverages, orchoosing experimental conditions in such a way that the concentration inside the ze-olite remains constant. For systems with a moderate dependence of the diffusivity onthe concentration the effect might be small, but this dependence can possibly com-plicate the comparison of activation energies of diffusion for different experimentalconditions, especially when considering that the activation energy itself might alsodepend on the temperature (see chapter 3 of this thesis).
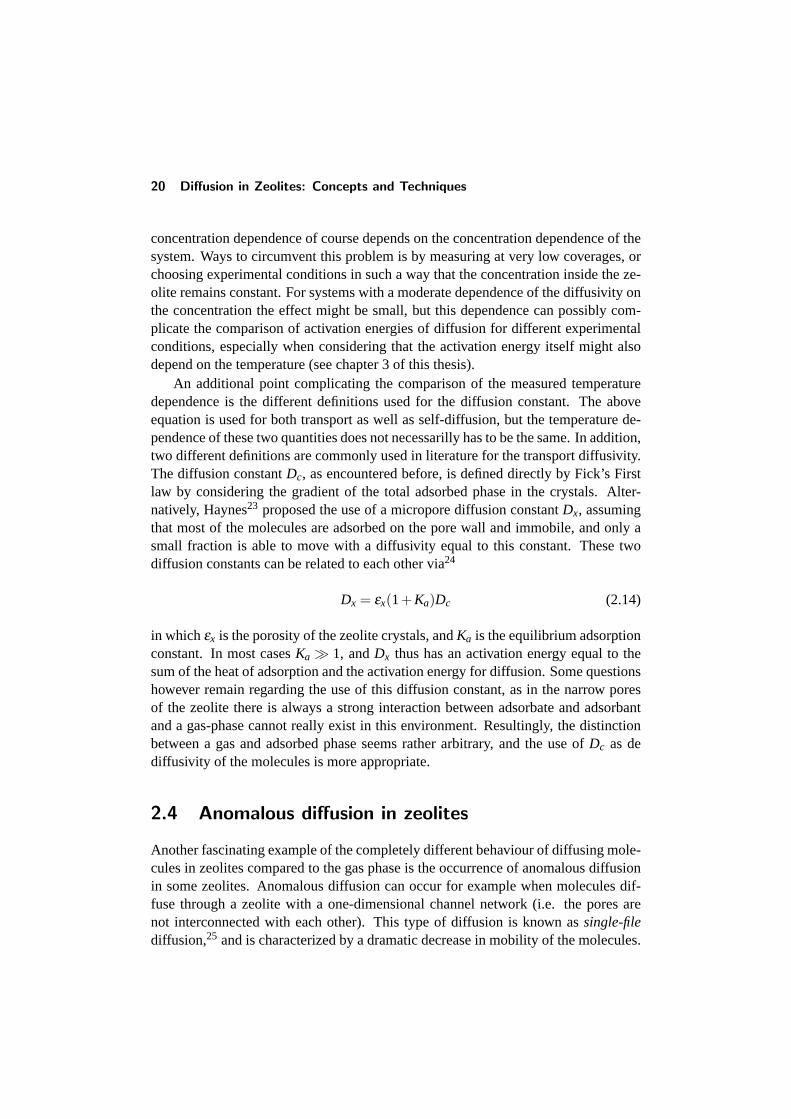
An additional point complicating the comparison of the measured temperaturedependence is the different definitions used for the diffusion constant. The aboveequation is used for both transport as well as self-diffusion, but the temperature de-pendence of these two quantities does not necessarilly has to be the same. In addition,two different definitions are commonly used in literature for the transport diffusivity.The diffusion constantDc, as encountered before, is defined directly by Fick’s Firstlaw by considering the gradient of the total adsorbed phase in the crystals. Alter-natively, Haynes23 proposed the use of a micropore diffusion constantDx, assumingthat most of the molecules are adsorbed on the pore wall and immobile, and only asmall fraction is able to move with a diffusivity equal to this constant. These twodiffusion constants can be related to each other via24
Dx = εx(1+Ka)Dc (2.14)
in whichεx is the porosity of the zeolite crystals, andKa is the equilibrium adsorptionconstant. In most casesKa � 1, andDx thus has an activation energy equal to thesum of the heat of adsorption and the activation energy for diffusion. Some questionshowever remain regarding the use of this diffusion constant, as in the narrow poresof the zeolite there is always a strong interaction between adsorbate and adsorbantand a gas-phase cannot really exist in this environment. Resultingly, the distinctionbetween a gas and adsorbed phase seems rather arbitrary, and the use ofDc as dediffusivity of the molecules is more appropriate.
2.4 Anomalous diffusion in zeolites
Another fascinating example of the completely different behaviour of diffusing mole-cules in zeolites compared to the gas phase is the occurrence of anomalous diffusionin some zeolites. Anomalous diffusion can occur for example when molecules dif-fuse through a zeolite with a one-dimensional channel network (i.e. the pores arenot interconnected with each other). This type of diffusion is known assingle-filediffusion,25 and is characterized by a dramatic decrease in mobility of the molecules.
Experimental techniques: an overview 21
As a result, this type of diffusion is expected to have a large impact on the catalyticbehaviour of these zeolites.26–28
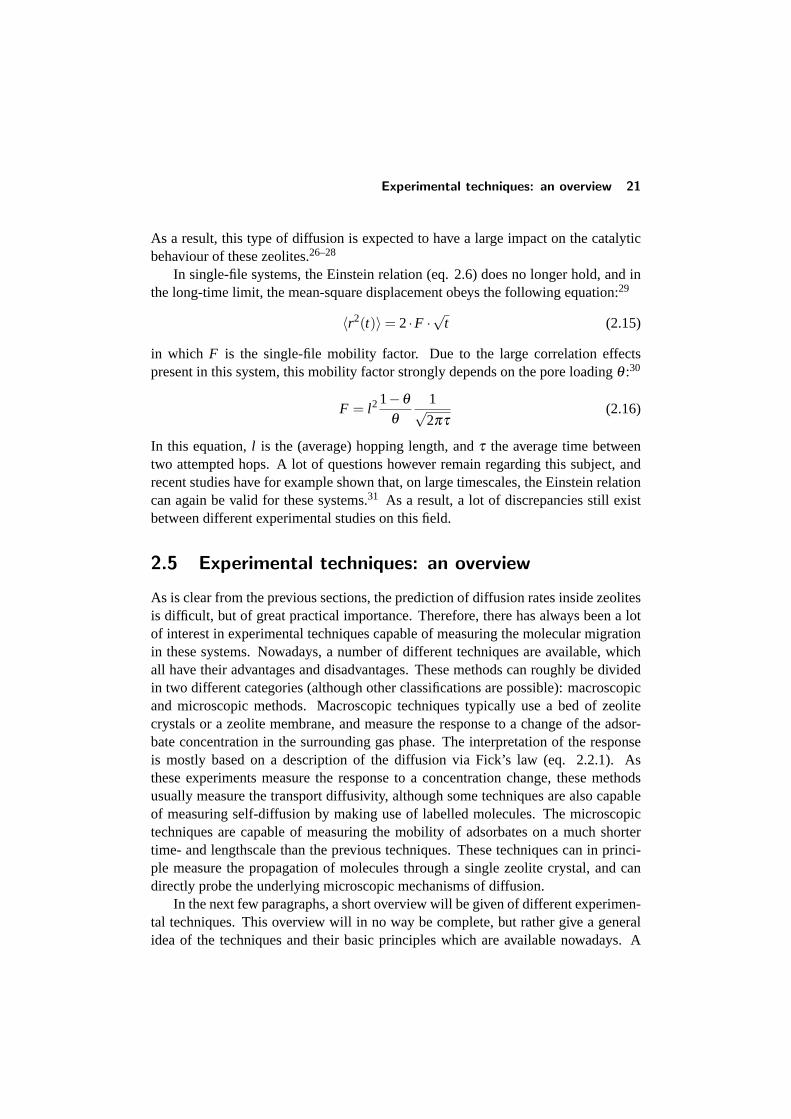
In single-file systems, the Einstein relation (eq. 2.6) does no longer hold, and inthe long-time limit, the mean-square displacement obeys the following equation:29
〈r2(t)〉= 2·F ·√
t (2.15)
in which F is the single-file mobility factor. Due to the large correlation effectspresent in this system, this mobility factor strongly depends on the pore loadingθ :30
F = l21−θ
θ
1√2πτ
(2.16)
In this equation,l is the (average) hopping length, andτ the average time betweentwo attempted hops. A lot of questions however remain regarding this subject, andrecent studies have for example shown that, on large timescales, the Einstein relationcan again be valid for these systems.31 As a result, a lot of discrepancies still existbetween different experimental studies on this field.
2.5 Experimental techniques: an overview
As is clear from the previous sections, the prediction of diffusion rates inside zeolitesis difficult, but of great practical importance. Therefore, there has always been a lotof interest in experimental techniques capable of measuring the molecular migrationin these systems. Nowadays, a number of different techniques are available, whichall have their advantages and disadvantages. These methods can roughly be dividedin two different categories (although other classifications are possible): macroscopicand microscopic methods. Macroscopic techniques typically use a bed of zeolitecrystals or a zeolite membrane, and measure the response to a change of the adsor-bate concentration in the surrounding gas phase. The interpretation of the responseis mostly based on a description of the diffusion via Fick’s law (eq. 2.2.1). Asthese experiments measure the response to a concentration change, these methodsusually measure the transport diffusivity, although some techniques are also capableof measuring self-diffusion by making use of labelled molecules. The microscopictechniques are capable of measuring the mobility of adsorbates on a much shortertime- and lengthscale than the previous techniques. These techniques can in princi-ple measure the propagation of molecules through a single zeolite crystal, and candirectly probe the underlying microscopic mechanisms of diffusion.
In the next few paragraphs, a short overview will be given of different experimen-tal techniques. This overview will in no way be complete, but rather give a generalidea of the techniques and their basic principles which are available nowadays. A
22 Diffusion in Zeolites: Concepts and Techniques
distinction is being made between macroscopic and microscopic methods. A num-ber of excellent, and more exhaustive reviews regarding the different experimentaltechniques can be found in literature.2, 9, 32–34
2.5.1 Macroscopic techniques
Membrane permeation: Permeation measurements are one of the earliest waysto determine the diffusivity through porous solids.9 With this technique, the flux ofthe adsorbate through a parallel sides slab or membrane is measured under conditionsin which the concentrations at both faces are known. As the flux is related to the dif-fusivity of the adsorbate via Fick’s law, this quantity can thus be directly calculated.The pressure can either be kept constant (like e.g. in the Wicke-Kallenbach method),or a constant pressure gradient is applied. Although the technique is rather straight-forward, its application to zeolites depends on the availability of zeolite membranes,which have only recently become available.35
Uptake methods: Uptake methods are based on the measurement of the responseof the zeolitic host-guest system to a change in the pressure or concentration of thesurrounding gas phase. If the influence of non-diffusive processes can be eliminated,either experimentally or through suitable data analysis, the contributing diffusion co-efficients may be calculated from the observed response curves.9, 36, 37 Usually, thisanalysis relies on analytical solutions of the diffusion equations that describe the masstransfer inside the zeolite crystals. For the measurement of the response of the sys-tem, different techniques can be used. Examples are the gravimetric method, whichuses a vacuum microbalance to measure the change in weight of the zeolite sampleafter exposure to a change in the gas phase, and volumetric methods which mea-sure the change in the amount of gas phase molecules in the sorption vessel. Morerecently, the tapered element oscillating microbalance (TEOM) technique has beenintroduced, which measures the uptake in a zeolite sample via a change in eigenfre-quency of the oscillating tube holding the sample.38
Chromatographic methods: The chromatographic technique has been introducedas an alternative to the uptake methods, as the use of a steady-state flow can sig-nificantly reduce the influence of heat and external mass transfer resistance of thesystem. The technique is based on the measurement of the response of a chromato-graphic column filled with pellets composed of zeolite crystals to a perturbation inthe sorbate concentration at the inlet. The conventional methods use either a pulse orstep injection of the sorbate, after which the desired diffusion constants can be ex-tracted by using moments analysis, which relates the time lag and broadening of theresponse curve to the diffusive and adsorptive properties, or by fitting an approximateanalytical solution to the measured response of the column.23, 39 More recently, withthe advent of fast computers, more accurate numerical models can also be used to
Experimental techniques: an overview 23
analyze the results.24, 40
A number of variations on the traditional chromatographic techniques have beenintroduced in the passed decades. By injecting radiochemically labelled molecules,this method can for example be used to study tracer diffusion, provided that the in-jected pulse is sufficiently small (see e.g. Hyun and Dannyer41). The frequencyresponse method42 uses a sinusoidally varying perturbation of the inlet concentra-tion, and obtains information from the phase shift and amplitude of the response ofthe chromatographic column. The zero-length column (ZLC) method43 uses a verysmall gas volume which is equilibrated with the sorbate of interest and subsequentlypurged with an inert gas at a high flowrate in order to further decrease external masstransfer resistances. More recently, TAP experiments44, 45 have been introduced thatmeasure the pulse response of a bed under ultra-high vacuum conditions using a massspectrometer.
2.5.2 Microscopic techniques
Pulsed Field Gradient NMR: The Pulsed Field Gradient (PFG) NMR10, 19 tech-nique makes use of the spatial dependence of the nuclear magnetic resonance fre-quency in an inhomogeneous magnetic field. This inhomogeneous magnetic fieldincreases linearly with the spatial coordinatez, and is superimposed over the con-stant magnetic field. In the PFG-NMR technique, this field is only applied duringtwo equal, short time intervals, separated by timet. The resulting NMR signal, gen-erated by an appropriate sequence of radiofrequent pulses, will be proportional to thepropagator of the diffusing molecules. This propagator denotes the propability den-sity that during a time intervalt a molecule is shifted over a certain distance, whichis determined by the field gradient that is applied during the experiments. As a result,from these experiments the self-diffusion constant and mean-square displacementcan be calculated inside the zeolite crystals. Typically, the displacements measuredusing this technique are in the order of micrometers, much smaller than the typicallengthscales encountered in the macroscopic methods.Other NMR techniques: Apart from PFG-NMR, other techniques based on NMRspectroscopy have been introduced. Nuclear spin interactions probed by solid-stateNMR are generally anisotropic, and as a result encode for the molecular orientationwith respect to the external magnetic field. By studying the motional averaging ortime-correlation functions of these interactions, information can be obtained aboutthe rotational motion of the molecules.46–48 By assuming a certain relation betweenrotational and translational mobility (i.e. molecules have to reorient in a certain wayto move from one site to another49) the elementary diffusion rates can be extracted.More recently, Magusinet al.50 have introduced a technique which makes use of thedifferent chemical environments of molecules in the different cages of zeolite ZK-
24 Diffusion in Zeolites: Concepts and Techniques
5. This difference is used to selectively label the molecules in one of the cages andmeasure the elementary exchange rate. Although the above-mentioned techniquescan only be applied to a small number of zeolite-sorbate systems, their main advan-tage is that they are capable of measuring systems with extremely low mobility (Ds
in the order of 10−20 m2·s−1).Quasi-Elastic Neutron Scattering: Quasi-elastic neutron scattering (QENS) hasbeen introduced in the early 90’s as an alternative to PFG-NMR measurements tomeasure the intracrystalline diffusion in zeolites.51 This technique is based on theanalysis of the quasi-elastic broadening in the energy of the scattered neutron beam.The broadening is caused by an energy transfer between the incident wave and thediffusing molecules, which in its turn depends on the elementary diffusion process ofthe particles. From these experiments, the self-diffusivity can be determined, and themean jump length may be estimated. The application of this technique is limited tospecies with higher mobilities, and the diffusion paths covered during a measurementare typically of the order of a few nanometers.Interference microscopy: A technique that has recently been introduced in thestudy of diffusion in zeolite crystals is interference microscopy.52 It is based on themeasurement of the change in optical density of the zeolite crystallites during tran-sient adsorption or desorption. The optical density in the zeolite is determined bythe integral of the sorbate concentration in the observation direction. By using amicroscope, pixel sizes of 1× 1 µm can be achieved, and localized concentrationmeasurements on zeolite crystals can be performed. As the method measures con-centration changes, this technique is capable of measuring the transport-diffusion ona microscopic scale. Alternatively, infrared absorbance can be used instead of theoptical density for measuring the concentration.53
2.5.3 Comparing the results of different techniques
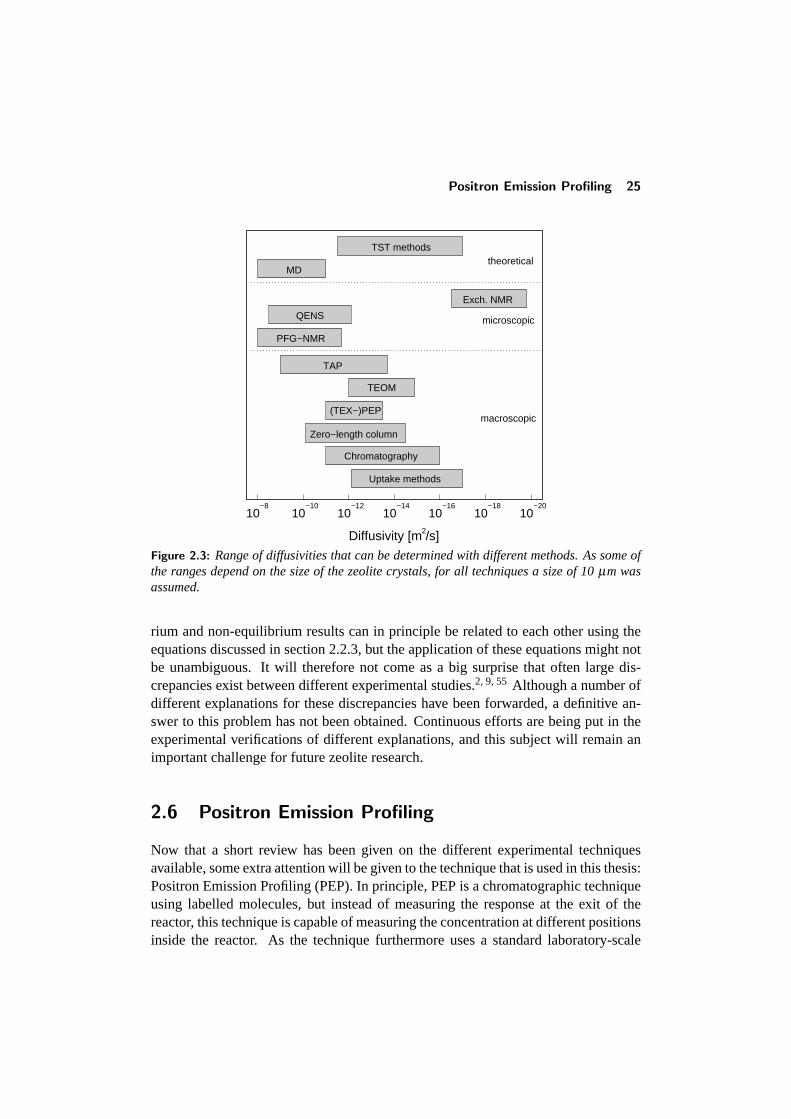
As will have become clear from the previous section, there is a vast amount of tech-niques available for studying the diffusion in zeolites. These techniques all vary intheir basic principles, the time- and length scales at which the diffusion process ismeasured, and the underlying assumptions made to analyze the experiments. As aresult, the range of diffusivities accessible to the different methods will be different.This is illustrated in figure 2.3, in which the range of diffusivities that can typically bemeasured by different techiques is plotted. This makes a direct comparison betweendifferent techniques harder to accomplish. All techniques furthermore rely on certainassumptions, and for the macroscopic techniques complex, but approximative modelsare used for determining the diffusivity, which should be treated with some caution.54
The fact that some methods determine the transport diffusivities, while others probethe self-diffusion in these systems, further complicates the situation. These equilib-
Positron Emission Profiling 25
10−8
10−10
10−12
10−14
10−16
10−18
10−20
Diffusivity [m /s]2
Chromatography
(TEX−)PEP
TEOM
Zero−length column
TAP
PFG−NMR
Exch. NMR
QENS microscopic
macroscopic
MD
TST methodstheoretical
Uptake methods
Figure 2.3: Range of diffusivities that can be determined with different methods. As some ofthe ranges depend on the size of the zeolite crystals, for all techniques a size of 10µm wasassumed.
rium and non-equilibrium results can in principle be related to each other using theequations discussed in section 2.2.3, but the application of these equations might notbe unambiguous. It will therefore not come as a big surprise that often large dis-crepancies exist between different experimental studies.2, 9, 55 Although a number ofdifferent explanations for these discrepancies have been forwarded, a definitive an-swer to this problem has not been obtained. Continuous efforts are being put in theexperimental verifications of different explanations, and this subject will remain animportant challenge for future zeolite research.
2.6 Positron Emission Profiling
Now that a short review has been given on the different experimental techniquesavailable, some extra attention will be given to the technique that is used in this thesis:Positron Emission Profiling (PEP). In principle, PEP is a chromatographic techniqueusing labelled molecules, but instead of measuring the response at the exit of thereactor, this technique is capable of measuring the concentration at different positionsinside the reactor. As the technique furthermore uses a standard laboratory-scale
26 Diffusion in Zeolites: Concepts and Techniques
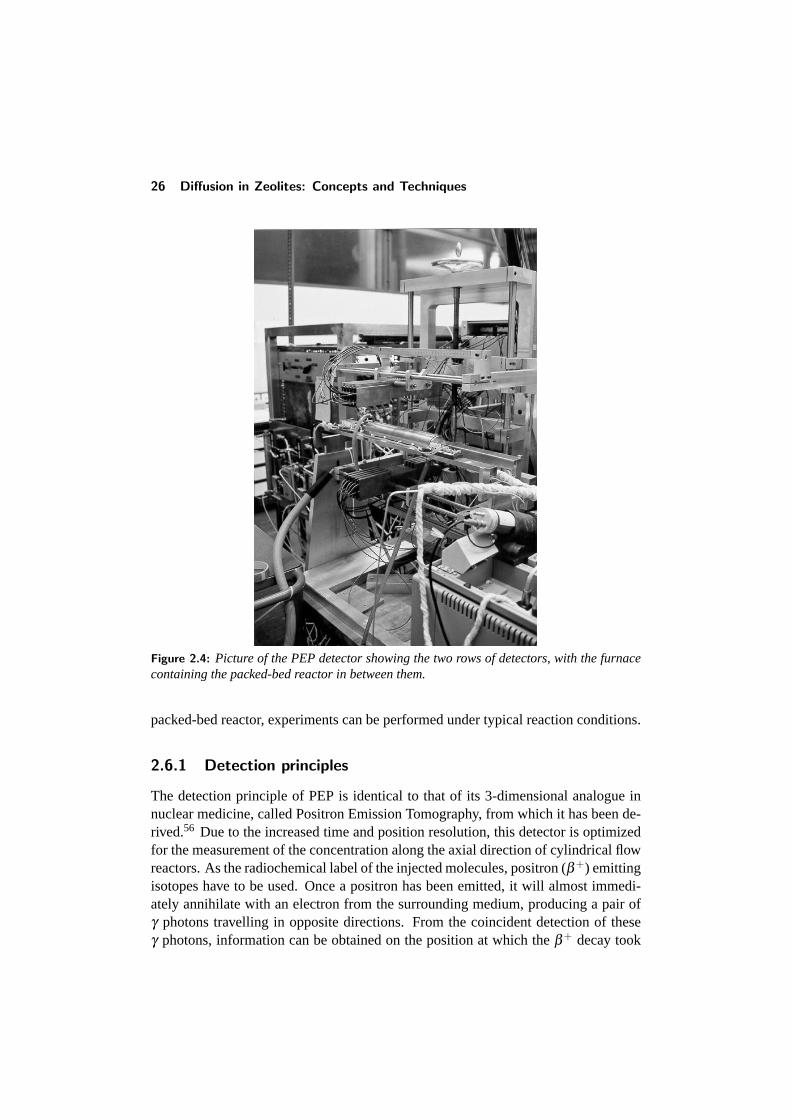
Figure 2.4: Picture of the PEP detector showing the two rows of detectors, with the furnacecontaining the packed-bed reactor in between them.
packed-bed reactor, experiments can be performed under typical reaction conditions.
2.6.1 Detection principles
The detection principle of PEP is identical to that of its 3-dimensional analogue innuclear medicine, called Positron Emission Tomography, from which it has been de-rived.56 Due to the increased time and position resolution, this detector is optimizedfor the measurement of the concentration along the axial direction of cylindrical flowreactors. As the radiochemical label of the injected molecules, positron (β+) emittingisotopes have to be used. Once a positron has been emitted, it will almost immedi-ately annihilate with an electron from the surrounding medium, producing a pair ofγ photons travelling in opposite directions. From the coincident detection of theseγ photons, information can be obtained on the position at which theβ+ decay took
Positron Emission Profiling 27
reconstructionvolume
1 2 3 4 5
reactor
annihilation
detector banks
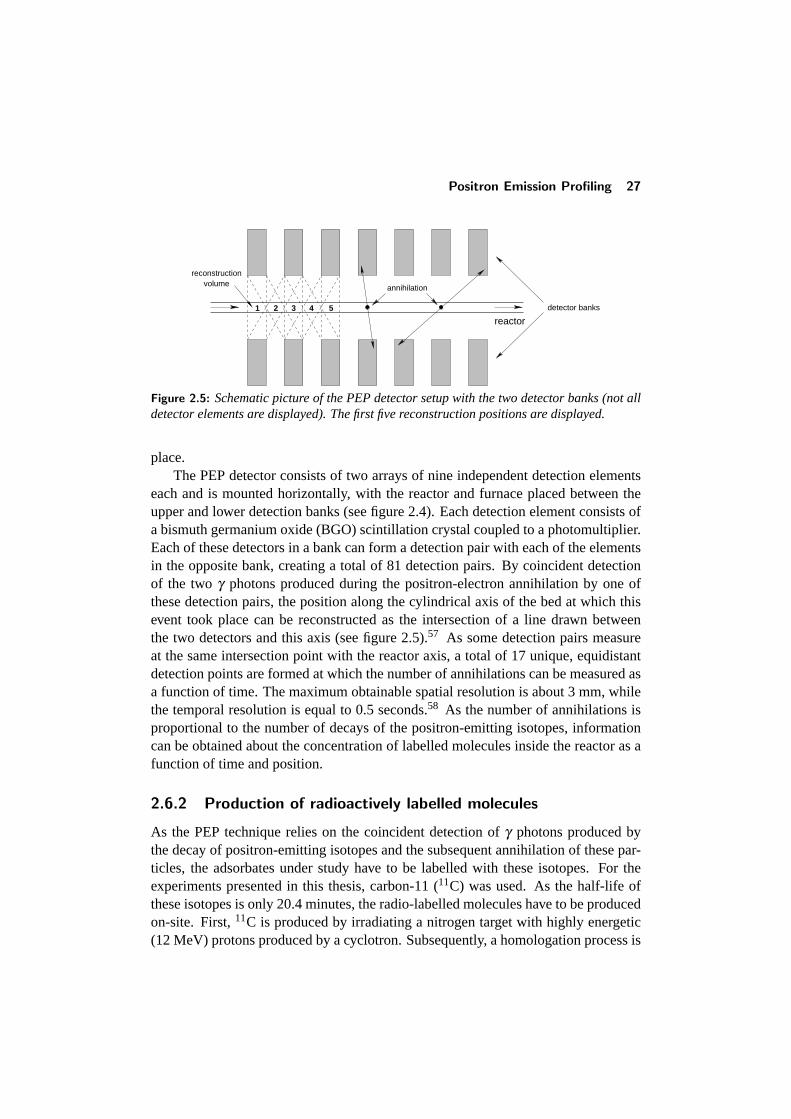
Figure 2.5: Schematic picture of the PEP detector setup with the two detector banks (not alldetector elements are displayed). The first five reconstruction positions are displayed.
place.The PEP detector consists of two arrays of nine independent detection elements
each and is mounted horizontally, with the reactor and furnace placed between theupper and lower detection banks (see figure 2.4). Each detection element consists ofa bismuth germanium oxide (BGO) scintillation crystal coupled to a photomultiplier.Each of these detectors in a bank can form a detection pair with each of the elementsin the opposite bank, creating a total of 81 detection pairs. By coincident detectionof the twoγ photons produced during the positron-electron annihilation by one ofthese detection pairs, the position along the cylindrical axis of the bed at which thisevent took place can be reconstructed as the intersection of a line drawn betweenthe two detectors and this axis (see figure 2.5).57 As some detection pairs measureat the same intersection point with the reactor axis, a total of 17 unique, equidistantdetection points are formed at which the number of annihilations can be measured asa function of time. The maximum obtainable spatial resolution is about 3 mm, whilethe temporal resolution is equal to 0.5 seconds.58 As the number of annihilations isproportional to the number of decays of the positron-emitting isotopes, informationcan be obtained about the concentration of labelled molecules inside the reactor as afunction of time and position.
2.6.2 Production of radioactively labelled molecules
As the PEP technique relies on the coincident detection ofγ photons produced bythe decay of positron-emitting isotopes and the subsequent annihilation of these par-ticles, the adsorbates under study have to be labelled with these isotopes. For theexperiments presented in this thesis, carbon-11 (11C) was used. As the half-life ofthese isotopes is only 20.4 minutes, the radio-labelled molecules have to be producedon-site. First,11C is produced by irradiating a nitrogen target with highly energetic(12 MeV) protons produced by a cyclotron. Subsequently, a homologation process is
28 Diffusion in Zeolites: Concepts and Techniques
used to produce labelled hydrocarbons ranging from propane to hexane,59 which canbe trapped and injected into the reactor.
2.6.3 Diffusion experiments
With the PEP setup, two different types of experiments can be conducted. In the firsttype of experiments, the labelled molecules are injected as a small pulse in a steady-state feed stream of either an inert carrier gas, or of unlabelled molecules of the samekind. The propagation of the pulse through the reactor can then be followed usingthe PEP detector. Information about the diffusive processes can be obtained fromthe delay and broadening of the pulse, and quantitative information can be obtainedby analysis of the measurements using an appropriate model, as will be discussed inmore detail in the next section. In the second type of experiment, which is calledtracer exchange-PEP (TEX-PEP),60 the labelled molecules are constantly “leaked”into the feed stream, instead of injected as a single pulse. The PEP detector can againbe used to measure the tracer exchange once the injection has started. By switchingoff the injection of labelled molecules after equilibrium is reached, the subsequentre-exchange can be followed as well. Again, information can be obtained by fittingappropriate models to the time evolution of the tracer exchange at the various po-sitions along the reactor bed. This technique will be applied to the study of binarymixtures, and described in more detail in chapter 5.
The PEP technique has a number of different advantages over more conventionaltechniques. First of all, it is capable of measuring the in-situ concentration insidea packed bed reactor, which enables it to study phenomena which would otherwiseremain invisible.61 Furthermore, this enables one to observe the evolution of a pulseor step change inside the reactor itself, therefore excluding the influence of reactorexit effects and minimizing the influence of entrance effects. Due to the penetratingpower of theγ photons used in the detection, no special requirements are being put onthe experimental system holding the zeolite sample, and standard plug-flow reactorscan be used under typical conditions also found in the laboratory. Finally, the useof radiochemically labelled molecules makes this method particularly suited to studythe diffusion of mixtures, as one of the components can be selectively labelled.
2.7 Simulating diffusion in zeolites
Theoretical methods nowadays form a valuable addition to the available experimentalmethods. The first theoretical foundations of zeolitic diffusion were based on clas-sical diffusion theory, based on Fick’s second law of diffusion (see section 2.2.1).These studies focussed on the description of the diffusive behaviour of systems used
Simulating diffusion in zeolites 29
in experiments to determine the diffusivity. With the advent of faster computers,more complex calculations could be conducted. Using microscopic simulation meth-ods like molecular dynamics and transition-state theory, predictions could now bemade regarding the elementary rate of diffusion base on an atomistic model of thezeolite-adsorbate system. In this thesis, a number of different techniques will be usedto simulate the diffusion in zeolites. A short overview will be given of the availabletechniques.
2.7.1 Classical diffusion theory
Theoretical methods based on classical diffusion theory have been used to describethe mass transfer in zeolitic systems since the start of this research field. The basisof this method is formed by Fick’s second law of diffusion (eq. 2.3). Assuming thatmass transfer occurs via diffusion, and that the zeolite crystals are spherically shaped,a mass balance over the zeolite particle gives
∂q∂ t
= Dc
(∂ 2q∂ r2 +
2r
∂q∂ r
)(2.17)
in which q is the adsorbed phase concentration,Dc the diffusion constant, andr isthe radial coordinate. This expression can be used to describe the uptake of a zeolitesample, assuming that micropore diffusion is the rate-controlling step. The effectof micropore diffusion is contained in the constantDc, and as a result, this methoditself is not capable of predicting the value of this constant, but merely describes whathappens to the zeolitic system on a macroscopic scale. Assuming a step change inthe concentration, this equation can be solved analytically:9
q(t)−q0
q∞−q0= 1− 6
π2
∞
∑n=1
1n2 exp
(n2π2Dct
r2c
)(2.18)
in which q(t), q0 and q∞ are the adsorbed phase concentrations at timet, at time0, and the equilibrium value at infinite time, respectively.rc is the radius of thecatalyst particle. The situation becomes more complex when more than one type ofresistance significantly contribute to the mass transfer in the zeolite sample. As thezeolite crystals are often pressed in pellets, when the diffusion in the micropores isrelatively fast, the uptake can also be influenced by macropore diffusion and externalfilm resistances, and more complex equations are needed to describe the uptake.
In case of a chromatographic experiment, mass transfer also occurs via the con-stant flow through the reactor bed. In this case, a mass balance is also needed thatdescribes the flow in the bed:9
∂c∂ t
= DL∂ 2c∂z2 −v
∂c∂z
−(
1− ε
ε
)∂q∂ t
(2.19)
30 Diffusion in Zeolites: Concepts and Techniques
In this equation,c is the gas-phase concentration in the bed,DL is the axial diffusioncoefficient,z the coordinate along the reactor axis,v the velocity of the flowing gas,andε the porosity of the bed. Additionally, when using a biporous bed, an equation isneeded that describes the mass transfer in the macroparticles, resulting from macro-pore diffusion.23, 62 This leads to a set of three coupled differential equations, whichare difficult to solve analytically. Originally, approximative models were thereforeused, like the linear driving force model,40 or by assuming that certain contributionsto the mass transfer could be neglected. Nowadays, numerical methods can be usedto solve this set of differential equations, and the contribution of the different pro-cesses to the overall behaviour of the zeolite bed can be analyzed. A more detaileddescription of this method will be given in chapter 5.
2.7.2 Molecular dynamics simulations
A completely different type of simulations is formed by molecular dynamics. Whilethe previous method is based on a phenomenological description of the behaviour ofa zeolite system, in these type of simulations a detailed, atomistic model is built ofthe zeolite-sorbate system. At the start of the calculations, a small slab of the zeolitecrystal (with typical dimensions in the order of 50 to 100A) is reproduced by defin-ing the positions of the framework atoms. Often, all-silica structures are used, as thepresence of cations and their resulting long-range electrostatic interactions seriouslycomplicate the simulations.34 Interactions between the atoms are usually modelledby using two-body potentials. For the adsorption and diffusion of alkanes, disper-sive forces are the dominating interactions, and usually, Lennard-Jones potentials areused:
V(r i j ) = 4εi j
(σi j
r i j
)12
−
(σi j
r i j
)6 (2.20)
in which r i j is the distance between the two interacting atoms,εi j is the energy pa-rameter, andσi j the size parameter of the potential for the interaction between atomsiand j. The interaction parameters can in principle be calculated by some type of com-bination rule from the properties of the individual atoms.63 However, as the aboveequation is only an approximation of the real interactions between sorbate and zeo-lite, these values are usually chosen so that the model is capable of reproducing somereference experimental data for the system under study.64 Although there are somegeneral forcefields available, calculations with these often do not lead to adequateresults.65
In addition to these interatomic potentials, potentials have to be defined that de-scribe the behaviour of the adsorbates, like bond bending, torsion, and bond vibra-tions which give a total contributionVinternal. A more detailed description of these
Simulating diffusion in zeolites 31
interactions can be found in chapter 3. Once all interactions are defined, the totalpotential energy felt by a single atom can be calculated by summing all individualtwo-body interaction energies:
V itot = V i
zeo+V iinter+V i
internal=N
∑j=1
V(r i j )+M
∑k=1
V(r ik)+V iinternal (2.21)
in which N is the number of framework atoms, andM is the total number of atomsfrom other sorbates. The forces acting on the atom can be calculated from the gradientof the total potential energy of this particle:
~F i =−∇V itot (2.22)
The molecular dynamics simulation now proceeds by calculating the time evolutionof the system by using Newton’s equations of motion:
mi~r i = ~F i (2.23)
with mi the mass of atomi. Given the initial positions and velocities of the atoms,Newton’s equation can be integrated, and the positions of the adsorbates can be calcu-lated as a function of time. For this integration, different techniques are available,66
but all these methods are based on taking sufficiently small timesteps, modifyingthe positions of the atoms, after which the interactions are recalculated. This proc-cess is repeated untill the desired timespan has been covered. During the simulation,the various parameters of interest, like the mean-square displacement or the velocityauto-correlation function, can be calculated and stored. From these parameters, thediffusivity can be calculated.
Although this technique has proven to be very useful and is capable of providingreasonable values for the diffusivities,67, 68 it also has some disadvantages. As the in-teractions between all atoms in the system have to be calculated after each timestep,these methods are computationally demanding. Therefore, only rather small sys-tems with a limited amount sorbate molecules can be simulated, and the timescale islimited to the order of nanoseconds. Furthermore, approximations often have to bemade to reduce computer time, like assuming a rigid zeolite structure, using united-atom models, and assuming an all-silica structure, which makes these simulationsless realistic. Nevertheless, these simulations are capable of probing the elementarymechanisms of diffusion on a microscopic scale, and can help in gaining more insightin its fundamentals.
2.7.3 Dynamic Monte Carlo methods
The Dynamic (or Kinetic) Monte Carlo (DMC) technique is based on a stochasticdescription of the diffusion in zeolites, as was already forwarded by Barrer in 1941.15
32 Diffusion in Zeolites: Concepts and Techniques
In this technique, the zeolite crystal is modeled as a network of interconnected pores.Transport of molecules proceeds via a sequence of jumps from one adsorption siteto another. For adsorbates with high activation energies, this seems a reasonableassumption, as the residence time of these molecules in the low-energy regions ofthe zeolite is large compared to the time it spends travelling from one site to another.In principle, the dynamic Monte Carlo technique provides a numerical solution toa stochastic description based on a Markovian master equation, which describes theevolution over time of the system through jumps between configurations in phasespace.68 These stochastic descriptions have been applied by a number of authors toaddress the problem of diffusion in high-occupancy and blocked zeolites,17, 69 buthave proven to be difficult to solve for these complex systems.
A first step for performing DMC simulations is the definition of the zeolite porenetwork. Often, simple square or cubic lattices are used, but sometimes more detailedmodels are developed that try to accurately mimic the adsorption sites and connec-tivity of the real system under study. The next step is to assign appropriate hoppingrates to the different possible jumps which describe the elementary diffusion process.Given an initial configuration, the time evolution of the system is then calculated bycreating a list of al possible events, assigning a tentative time for each of these eventsaccording to a Poisson-distribution, and executing the first possible event. The sys-tem time is then updated to the time of this event, and the event list is updated, afterwhich the next event is executed, and so on. A number of different algorithms areavailable for advancing the time, which differ in implementation, but are conceptuallyidentical.70
As the DMC simulations use a coarse-grained model of the zeolite-adsorbate sys-tem, this method is computationally much less demanding than molecular dynamicssimulations. This method can therefore be used to simulate on much larger time-and lengthscales than this method, and can be used to study the influence of the mi-croscopic hopping mechanism on a mesoscopic scale. This coarse-graining is how-ever also the greatest disadvantage of the method: in order to achieve the timescaleof these simulations, a lot of details regarding the zeolite-adsorbate and adsorbate-adsorbate interactions are lost. Furthermore, not all systems might be suitably repre-sented by a hopping mechanism.
2.7.4 Other techniques
In addition to the methods described above, which have been applied in this thesis,a number of other techniques are available. As an alternative to MD simulations,transition state methods can be used to calculate the diffusion constants from atom-istic models of the zeolite-sorbate system. This method is especially suitable for themore bulky molecules inside small-pore zeolites, as these molecules typically have
Final remarks 33
low diffusion rates. The basic principle behind this type of calculations is the rateat which a molecule moves over an activation barrier is determined by the productof the probability of finding the molecule at the top of this barrier, and a dynamicterm describing the rate at which the barrier is crossed.71 One of the main tasks ofthese methods is thus to calculate the free energy profile in the zeolite, often by usingumbrella-sampling or similar techniques.72–74
A technique that has recently received an increasing amount of attention is theMaxwell-Stefan theory of diffusion. This macroscopic approach is based on theMaxwell-Stefan formulation of diffusion, which relates the flux due to the diffu-sive motion to the gradient of the chemical potential in the system. The interactionwith the zeolite is modelled as if the adsorbate diffuses in a mixture with giant dustmolecules, which are essentially motionless.75 This method has proven to be espe-cially usefull in describing the behaviour of mixtures.35, 76, 77
2.8 Final remarks
As is evident from the previous section, the number of techniques available for study-ing the diffusion in zeolites is numerous. Historically, experimental techniques thatmeasure the diffusivity on a macroscopic scale have always played an important rolein this field of research. With the introduction of new techniques capable of mea-suring the diffusion processes on a microscopic scale, it has become clear that themacroscopic techniques don’t always reveal the underlying processes, and are oftendifficult to interpret. Not in the least place, this is due to the simultaneous occur-rence of a number of different processes during these experiments, which are hardto separate from each other. The interpretation of these methods often have to relyon models in which the zeolite crystals are assumed to be isotropic, while in realitya strong diffusion anisotropy can exist. Furthermore, the completely different time-and lengthscales of the different techniques might be another cause, as on a largetimescale different mechanisms can manifest themselves than on short timescales.
Theoretical methods are a valuable addition to the available experimental tech-niques. Although these methods can only provide an approximate description of thereal system, different characteristics of the system can be easily varied, and their in-fluences systematically studied. In this respect, they can provide valuable answers tothe questions that have been raised from the different experiments. Furthermore, a lotof experimental methods rely on an accurate description of the flow inside the zeolitebed. In the coming chapters, different theoretical techniques will be used to furtherclarify some of the open questions still present in zeolite research.
34 Diffusion in Zeolites: Concepts and Techniques
2.9 References
1 W. Kauzmann,Kinetic theory of gases, Addison-Wesley, Reading (1966).2 M. F. M. Post,Diffusion in zeolite molecular sieves, in: Introduction to zeolite science
and practice, H. van Bekkum, E. M. Flanigen, and J. C. Jansen, eds., vol. 58 ofStudies insurface science and catalysis, pp. 391–443, Elsevier, Amsterdam (1991).
3 N. Wakao and S. Kaguei,Heat and mass transfer in packed beds, Gordon and BreachScience, London (1982).
4 P. B. Weisz,Chem. Tech.3, 498–505 (1973).5 N. Y. Chen, T. F. Degnan Jr., and C. M. Smith,Molecular transport and reaction in
zeolites - design and application of shape selective catalysis, VCH Publishers, New York(1994).
6 A. Fick, Ann. Phys.94, 59–86 (1855).7 R. M. Barrer and W. Jost,Trans. Faraday Soc.45, 928–930 (1949).8 A. Einstein,Ann. Phys.17, 549–560 (1905).9 J. Karger and D. M. Ruthven,Diffusion in zeolites and other microporous solids, John
Wiley & Sons, Inc., New York (1992).10 J. Karger, H. Pfeifer, and W. Heink,Adv. Magn. Res.12, 1 (1988).11 D. N. Theodorou, R. Q. Snurr, and A. T. Bell,Molecular dynamics and diffusion
in microporous materials, in: Comprehensive Supramolecular Chemistry: Solid-statesupramolecular chemistry - Two- and three-dimensional inorganic networks, vol. 7,G. Alberti and T. Bein, eds., pp. 507–548, Pergamon, Oxford (1996).
12 L. S. Darken,Trans. AIME175, 184–192 (1948).13 A. I. Skoulidas and D. S. Sholl,J. Phys. Chem. B105(16), 3151–3154 (2001).14 D. Paschek and R. Krishna,Chem. Phys. Lett.333, 278–284 (2001).15 R. M. Barrer,Trans. Faraday Soc.37, 590–594 (1941).16 D. N. Theodorou and J. Wei,J. Catal.83, 205–224 (1983).17 J. Tsikoyiannis and J. Wei,Chem. Engng Sci.46(1), 233–253 (1991).18 M.-O. Coppens, A. T. Bell, and A. K. Chakraborty,Chem. Engng. Sci.53(11), 2053–2061
(1998).19 J. Karger and H. Pfeifer,Zeolites7, 90–107 (1987).20 J. Xiao and J. Wei,Chem. Engng Sci.47(5), 1123–1141 (1992).21 L. Riekert,Adv. Catal.21, 281 (1970).22 A. O. Koriabkina, D. Schuring, A. M. de Jong, and R. A. van Santen,J. Phys. Chem. B
(2002), submitted for publication.23 H. W. Haynes and P. N. Sarma,AIChE J.19(5), 1043–1046 (1973).24 N. J. Noordhoek, L. J. van IJzendoorn, B. G. Anderson, F. J. de Gauw, R. A. van Santen,
and M. J. A. de Voigt,Ind. Eng. Chem. Res.37(3), 825–833 (1998).25 J. Karger, M. Petzold, H. Pfeifer, S. Ernst, and J. Weitkamp,J. Catal. 136, 283–299
(1992).26 C. Rodenbeck, J. Karger, and K. Hahn,J. Catal.157, 656–664 (1995).27 C. Rodenbeck, J. Karger, and K. Hahn,J. Catal.176, 513–526 (1998).28 F. J. M. M. de Gauw, J. van Grondelle, and R. A. van Santen,J. Catal.204, 53–63 (2001).29 D. G. Levitt,Phys. Rev. A8(6), 3050–3054 (1973).30 K. Hahn and J. Karger,J. Phys. Chem.100(1), 316–326 (1996).
References 35
31 P. H. Nelson and S. M. Auerbach,J. Chem. Phys110(18), 9235–9243 (1999).32 R. M. Barrer,Zeolites and clay minerals as sorbents and molecular sieves, Academic
Press, London (1978).33 J. Karger,Determination of diffusion coefficients in porous media, in: Handbook of het-
erogeneous catalysis, G. Ertl, H. Knozinger, and J. Weitkamp, eds., pp. 1253–1261, VCH,Weinheim (1997).
34 J. Karger, S. Vasenkov, and S. M. Auerbach,Diffusion in zeolites, in: Handbook of zeolitecatalysts and microporous materials, S. M. Auerbach, K. A. Carrado, and P. K. Dutta,eds., Marcel Dekker, New York (2002).
35 J. M. van de Graaf,Permeation and separation properties of supported silicalite-1 mem-branes - A modeling approach, Ph.D. thesis, Delft University of Technology, Delft, TheNetherlands (1999).
36 W. Boersma-Klein and J. A. Moulijn,Chem. Eng. Sci.34(7), 959–969 (1979).37 D. M. Ruthven,Principles of adsorption and adsorption processes, John Wiley & Sons,
New York (1984).38 W. Zhu, J. M. van de Graaf, L. J. P. van den Broeke, F. Kapteijn, and J. A. Moulijn,Ind.
Eng. Chem. Res.37(5), 1934–1942 (1998).39 B. G. Anderson, N. J. Noordhoek, F. J. M. M. de Gauw, L. J. van IJzendoorn, M. J. A.
de Voigt, and R. A. van Santen,Ind. Eng. Chem. Res.37(3), 815–824 (1998).40 N. S. Raghavan and D. M. Ruthven,Chem. Eng. Sci.40, 699–706 (1985).41 S. H. Hyun and R. P. Danner,AIChE J.31(7), 1077–1085 (1985).42 D. Shen and L. V. C. Rees,Zeolites11, 666–671 (1991).43 M. Eic and D. Ruthven,Zeolites8, 40–45 (1988).44 O. P. Keipert and M. Baerns,Chem. Eng. Sci.53(20), 3623–3634 (1998).45 T. A. Nijhuis, L. J. P. van den Broeke, M. J. G. Linders, J. M. van de Graaf, F. Kapteijn,
M. Makkee, and J. A. Moulijn,Chem. Eng. Sci.54(4423–4436) (1999).46 L. F. Gladden, J. A. Sousa-Goncalves, and P. Alexander,J. Phys. Chem. B101(48),
10121–10127 (1997).47 D. J. Schaefer, D. E. Favre, M. Wilhelm, S. J. Weigel, and B. F. Chmelka,J. Am. Chem.
Soc.119(39), 9252–9267 (1997).48 D. E. Favre, D. J. Schaefer, S. M. Auerbach, and B. F. Chmelka,Phys. Rev. Lett.81(26),
5852–5855 (1998).49 S. M. Auerbach and H. I. Metiu,J. Chem. Phys.106(7), 2893–2905 (2000).50 P. C. M. M. Magusin, D. Schuring, E. M. van Oers, J. W. de Haan, and R. A. van Santen,
Magn. Reson. Chem.37, S108–S117 (1999).51 H. Jobic, M. Bee, and G. J. Kearley,J. Phys. Chem.98, 4660–4665 (1994).52 U. Schemmert, J. Karger, and J. Weitkamp,Microporous Mesoporous Mater.32, 101–110
(1999).53 Y. S. Lin, N. Yamamoto, Y. Choi, T. Yamaguchi, T. Okubo, and S.-I. Nakao,Microporous
Mesoporous Mater.38, 207–220 (2000).54 N. Benes and H. Verweij,Langmuir15(23), 8292–8299 (1999).55 J. Karger and D. M. Ruthven,Zeolites9, 267–281 (1989).56 B. G. Anderson, A. M. de Jong, and R. A. van Santen,In situ measurement of heteroge-
neous catalytic reactor phenomena using positron emission, in: In-situ spectroscopy inheterogeneous catalysis, J. A. Haw, ed., pp. 195–237, Wiley-VCH, Weinheim (2002).
36 Diffusion in Zeolites: Concepts and Techniques
57 A. V. G. Mangnus,A detection system for positron emission profiling, Ph.D. thesis, Eind-hoven University of Technology, Eindhoven, The Netherlands (2000).
58 A. V. G. Mangnus, L. J. van IJzendoorn, J. J. M. de Goeij, R. H. Cunningham, R. A. vanSanten, and M. J. A. de Voigt,Nucl. Instr. and Meth. in Phys. Res. B99, 649–652 (1995).
59 R. H. Cunningham, A. V. G. Mangnus, J. van Grondelle, and R. A. van Santen,J. Molec.Catal. A: Chem.107, 153–158 (1996).
60 R. R. Schumacher, B. G. Anderson, N. J. Noordhoek, F. J. M. M. de Gauw, A. M. de Jong,M. J. A. de Voigt, and R. A. van Santen,Microporous Mesoporous Mater.35–36, 315–326(2000).
61 N. J. Noordhoek, D. Schuring, F. J. M. M. de Gauw, B. G. Anderson, A. M. de Jong,M. J. A. de Voigt, and R. A. van Santen,Ind. Eng. Chem. Res.41(8), 1973–1985 (2002).
62 N. J. Noordhoek,Positron emission profiling study of hydrocarbon conversion on zeolites,Ph.D. thesis, Eindhoven University of Technology, Eindhoven, The Netherlands (2000).
63 I. M. Torrens,Interatomic potentials, Academic Press, New York (1972).64 S. M. Auerbach, F. Jousse, and D. P. Vercauteren,Dynamics of sorbed molecules in zeo-
lites, in: Computer modelling of microporous and mesoporous materials, C. R. A. Catlow,R. A. van Santen, and B. Smit, eds., Academic Press, London (2002), in press.
65 M. D. Macedonia and E. J. Maginn,Mol. Phys.96(9), 1375–1390 (1999).66 M. P. Allen and D. J. Tildesley,Computer simulation of liquids, Clarendon, Oxford
(1987).67 P. Demontis and G. B. Suffritti,Chem. Rev.97(8), 2845–2878 (1997).68 F. J. Keil, R. Krishna, and M.-O. Coppens,Rev. Chem. Eng.16(2), 71–197 (2000).69 S. Sundaresan and C. K. Hall,Chem. Eng. Sci.41(6), 1631–1645 (1986).70 J. Segers,Algorithms for the simulation of surface processes, Ph.D. thesis, Eindhoven
University of Technology, Eindhoven (1999).71 B. Smit, L. D. J. C. Loyens, and G. L. M. M. Verbist,Faraday Discuss.106, 93–104
(1997).72 R. L. June, A. T. Bell, and D. N. Theodorou,J. Phys. Chem.95(22), 8866–8878 (1991).73 T. Mosell, G. Schrimpf, and J. Brickmann,J. Phys. Chem.100(11), 4582–4590 (1996).74 T. J. H. Vlugt, C. Dellago, and B. Smit,J. Chem. Phys.113(19), 8791–8799 (2000).75 R. Krishna and J. A. Wesselingh,Chem. Eng. Sci.52(6), 861–911 (1997).76 R. Krishna,Chem. Phys. Lett.355, 483–489 (2002).77 R. Krishna and D. Paschek,Phys. Chem. Chem. Phys.4, 1891–1898 (2002).
3Molecular Dynamics of Alkanes
in Zeolites
Molecular dynamics simulations are a powerful tool to investigate thediffusion of alkanes in zeolites on a microscopic scale. With this type ofsimulations, alkane-zeolite interactions are described using forcefieldsand atomistic models of the zeolite and adsorbents. This technique wasused to study the diffusion of linear and branched alkanes in different ze-olites. The concentration dependence was investigated, as well as chain-length and temperature dependency.
3.1 Introduction
The diffusive and adsorptive properties of alkanes in zeolite molecular sieves havebeen the focus of numerous experimental and theoretical studies. Not only are theseproperties important from a fundamental point of view, but also because zeolites areused in a number of important petroleum refining processes such as hydro-isomerizationand catalytic cracking.1 Furthermore zeolites are increasingly used for separationprocesses. For all these applications the dynamic behaviour of the molecules insidethe zeolite micropores play an essential role in determining its catalytic and separat-ing properties. A thorough understanding of this behaviour will thus aid in the designand efficient operation of catalysts.
Experimentally, a number of different techniques are available for measuring the
†Reproduced in part from D. Schuring, A.P.J. Jansen, and R.A. van Santen, “Concentration andChainlength Dependence of the Diffusivity of Alkanes in Zeolites Studied with MD Simulations”,J.Phys. Chem. B104(5), 941–948 (2000). 2000 American Chemical Society.
38 Molecular Dynamics of Alkanes in Zeolites
diffusivity in zeolites which can roughly be divided in macroscopic and microscopicmethods. Macroscopic methods typically relate the dynamic response of a zeolitesample to small perturbations in the concentration of the sorbate, and measure theFickian or transport diffusivity. Examples include the zero-length column technique(ZLC),2 the frequency response method,3 and, recently, Positron Emission Profil-ing (PEP).4 With microscopic techniques such as pulsed-field gradient NMR (PFG-NMR),5 1D-exchange13C NMR6 and quasi-elastic neutron scattering (QENS),7 onecan directly measure the self-diffusion of the molecules under equilibrium conditions.The results obtained with these microscopic methods (the self-diffusivity) can be di-rectly compared with the Fickian diffusivity obtained from macroscopic techniquesby using the “Darken equation”.8 Although in some cases results from both thesetechniques agree reasonably well, often one can find large discrepancies between theresults of these different methods. The source of these discrepancies still remains thesubject of much debate.
In recent years, molecular simulations have become an increasingly importanttool for studying sorbates in zeolites. A number of different methods are available.9
Configurational-bias Monte Carlo (CBMC) can be used to effectively compute equi-librium properties and adsorption isotherms for even large alkanes.10 With moleculardynamics simulations (MD) both equilibrium as well as the dynamical behaviour of asystem can be studied. These simulations allow the user to follow the time evolutionof a model system over a given length of time, which make them ideally suited to getinsight into the microscopic mechanism of the process involved. Drawback of thismethod however is that they are relatively time-consuming, limiting its applicabilityto small systems and timescales and thus to systems with relatively small activationenergies. In order to overcome these problems and be able to study reaction kineticsas well, Kinetic Monte-Carlo simulations can be used in which diffusion is modelledas a jump from one adsorption site to another.11–13
Most of the molecular dynamics studies up to now have focussed on the simu-lation of small linear alkanes such asn-butane andn-hexane in MFI-type zeolites.14
Runnebaum and Maginn have performed a similar study for alkanes up ton-C20.15
Interestingly, they found that the self-diffusivity along the [010] axis of MFI is aperiodic function of chain length, which they ascribed to a resonant diffusion mech-anism. Furthermore it is noteworthy that only small variations of the self-diffusioncoefficient with chainlength were observed, which seems in contrast with the resultsfound in macroscopic experiments. Studies in other (all-silica) zeolite structures havemostly been limited to methane.
In this chapter molecular dynamics simulations have been used to investigate thediffusion of alkanes ranging from methane ton-dodecane in four different zeolites:Silicalite (MFI), Mordenite (MOR), Ferrierite (FER) and ZSM-22 (TON). The choice
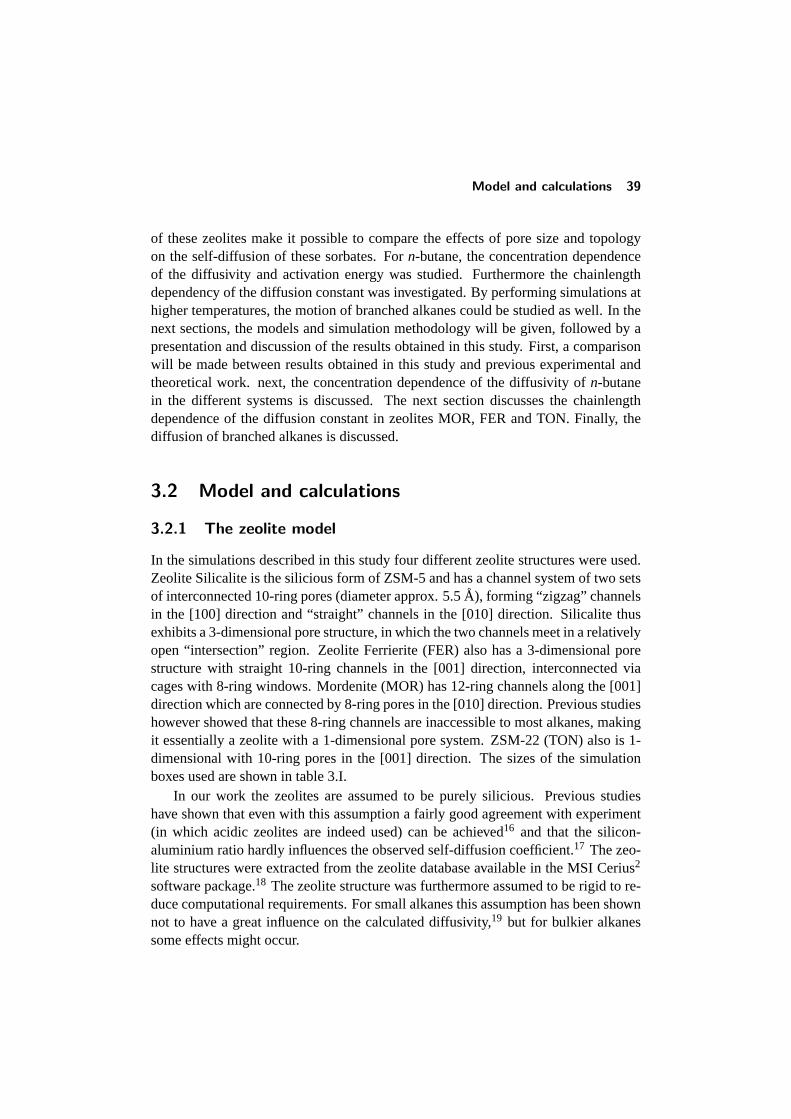
Model and calculations 39
of these zeolites make it possible to compare the effects of pore size and topologyon the self-diffusion of these sorbates. Forn-butane, the concentration dependenceof the diffusivity and activation energy was studied. Furthermore the chainlengthdependency of the diffusion constant was investigated. By performing simulations athigher temperatures, the motion of branched alkanes could be studied as well. In thenext sections, the models and simulation methodology will be given, followed by apresentation and discussion of the results obtained in this study. First, a comparisonwill be made between results obtained in this study and previous experimental andtheoretical work. next, the concentration dependence of the diffusivity ofn-butanein the different systems is discussed. The next section discusses the chainlengthdependence of the diffusion constant in zeolites MOR, FER and TON. Finally, thediffusion of branched alkanes is discussed.
3.2 Model and calculations
3.2.1 The zeolite model
In the simulations described in this study four different zeolite structures were used.Zeolite Silicalite is the silicious form of ZSM-5 and has a channel system of two setsof interconnected 10-ring pores (diameter approx. 5.5A), forming “zigzag” channelsin the [100] direction and “straight” channels in the [010] direction. Silicalite thusexhibits a 3-dimensional pore structure, in which the two channels meet in a relativelyopen “intersection” region. Zeolite Ferrierite (FER) also has a 3-dimensional porestructure with straight 10-ring channels in the [001] direction, interconnected viacages with 8-ring windows. Mordenite (MOR) has 12-ring channels along the [001]direction which are connected by 8-ring pores in the [010] direction. Previous studieshowever showed that these 8-ring channels are inaccessible to most alkanes, makingit essentially a zeolite with a 1-dimensional pore system. ZSM-22 (TON) also is 1-dimensional with 10-ring pores in the [001] direction. The sizes of the simulationboxes used are shown in table 3.I.
In our work the zeolites are assumed to be purely silicious. Previous studieshave shown that even with this assumption a fairly good agreement with experiment(in which acidic zeolites are indeed used) can be achieved16 and that the silicon-aluminium ratio hardly influences the observed self-diffusion coefficient.17 The zeo-lite structures were extracted from the zeolite database available in the MSI Cerius2
software package.18 The zeolite structure was furthermore assumed to be rigid to re-duce computational requirements. For small alkanes this assumption has been shownnot to have a great influence on the calculated diffusivity,19 but for bulkier alkanessome effects might occur.
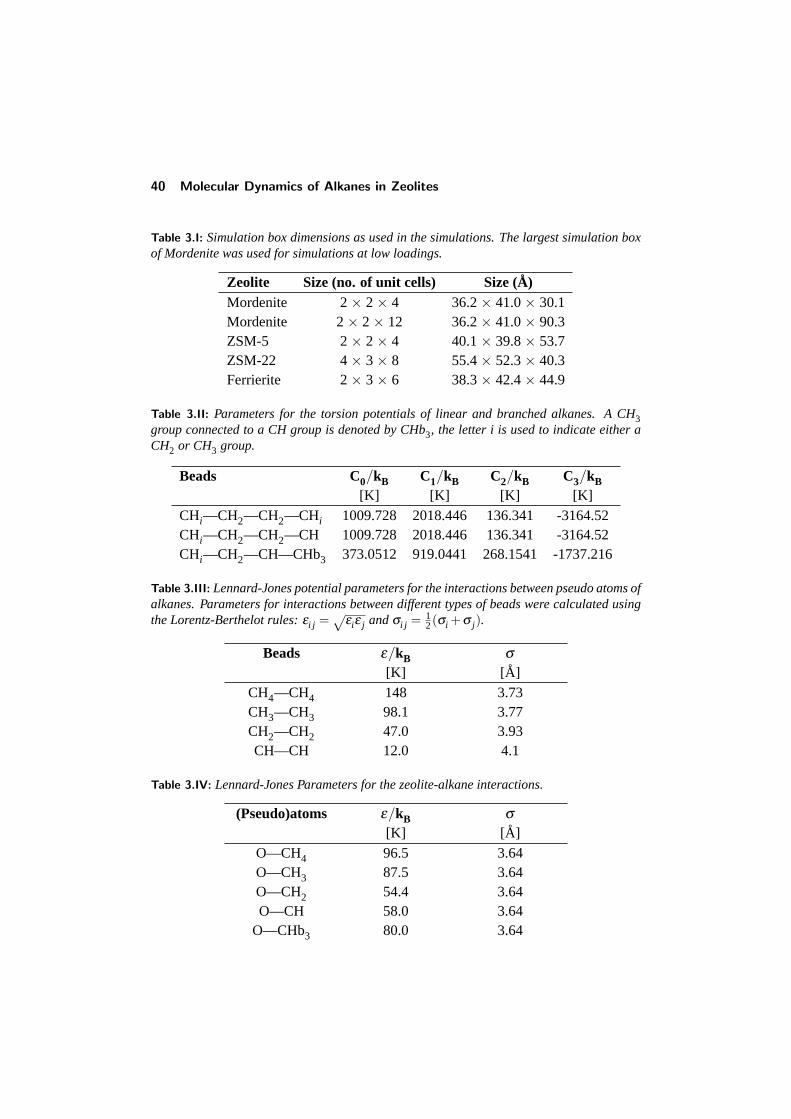
40 Molecular Dynamics of Alkanes in Zeolites
Table 3.I: Simulation box dimensions as used in the simulations. The largest simulation boxof Mordenite was used for simulations at low loadings.
Zeolite Size (no. of unit cells) Size (A)Mordenite 2× 2× 4 36.2× 41.0× 30.1Mordenite 2× 2× 12 36.2× 41.0× 90.3ZSM-5 2× 2× 4 40.1× 39.8× 53.7ZSM-22 4× 3× 8 55.4× 52.3× 40.3Ferrierite 2× 3× 6 38.3× 42.4× 44.9
Table 3.II: Parameters for the torsion potentials of linear and branched alkanes. A CH3group connected to a CH group is denoted by CHb3, the letter i is used to indicate either aCH2 or CH3 group.
Beads C0/kB C1/kB C2/kB C3/kB[K] [K] [K] [K]
CHi—CH2—CH2—CHi 1009.728 2018.446 136.341 -3164.52CHi—CH2—CH2—CH 1009.728 2018.446 136.341 -3164.52CHi—CH2—CH—CHb3 373.0512 919.0441 268.1541 -1737.216
Table 3.III: Lennard-Jones potential parameters for the interactions between pseudo atoms ofalkanes. Parameters for interactions between different types of beads were calculated usingthe Lorentz-Berthelot rules:εi j =
√εiε j andσi j = 1
2(σi +σ j).
Beads ε/kB σ
[K] [ A]CH4—CH4 148 3.73CH3—CH3 98.1 3.77CH2—CH2 47.0 3.93CH—CH 12.0 4.1
Table 3.IV: Lennard-Jones Parameters for the zeolite-alkane interactions.
(Pseudo)atoms ε/kB σ
[K] [ A]O—CH4 96.5 3.64O—CH3 87.5 3.64O—CH2 54.4 3.64O—CH 58.0 3.64
O—CHb3 80.0 3.64
Model and calculations 41
3.2.2 The alkane model
Following the work of Reykaert and Bellemans20 the alkane molecules are modelledusing united atom models, whereby the methyl and methylene groups are treatedas single interaction centres. The bond length is kept fixed at 1.54A and bondangles between three adjacent atoms were allowed to fluctuate under the influence ofa harmonic potential:21
ubb(θi) =12·k
θ· (θi −θ0)
2 (3.1)
in which θ0 is the equilibrium bond angle of 114◦ andkθ
the force constant, takenequal to 62500 K·rad−2.22 Torsion is modelled using a four-term cosine expansion inthe dihedral angle:23
utorsion(φi) =3
∑n=0
Cncosn(φi) (3.2)
with the parametersCn given in table 3.II. Note that a different torsion potential isneeded when describing branched alkanes. The alkane beads can interact with eachother via a Lennard-Jones potential:
ul ji j = 4εi j
(σi j
r i j
)12
−
(σi j
r i j
)6 (3.3)
Intramolecular interactions between beads of the same molecule are only includedwhen they are separated by more than three bonds. These interactions prevent thebackbone of the alkane from crossing over itself. The interaction parameters areshown in table 3.III and were taken from Vlugt et al.24 For the intermolecular poten-tials a cut-off radius of 13A was used and the usual tail corrections were applied.25
Zeolite-alkane intermolecular interactions are also modelled using a Lennard-Jones interaction. As is common in these kind of simulations the interactions be-tween the alkane beads and the zeolite silicon atoms are neglected.26 To account forthe absence of the silicon atoms, modified oxygen interaction parameters were used.These parameters were obtained from fitting Configurational-Bias Monte Carlo sim-ulations to adsorption data.10 The parameters used are summarized in table 3.IV. Theinteractions were truncated at 13.8A.
3.2.3 Calculations
The models described above were used in a canonical (NVT) MD simulation. Inthese simulations a Verlet algorithm25 was used for the integration of the equationsof motion, using a timestep of 0.5 fs. The bond lengths were kept fixed using a Shakealgorithm.9 To maintain a constant temperature, a Nose-Hoover thermostat27 was
42 Molecular Dynamics of Alkanes in Zeolites
applied with a time constant of 2 ps. Furthermore, periodic boundary conditions wereapplied. During the simulation, the different contributions to the potential energy andthe total energy can be monitored in order to check if the system is equilibrated. Fromthe entire run the average potential energy contributions are calculated.
The self-diffusion coefficient can be calculated using the Einstein relation:
Ds =16
limt→∞
ddt〈|~r(t)−~r(0)|2〉 (3.4)
in which the term between brackets is the ensemble average of the mean-square dis-placement (MSD) of the molecules. This mean-square displacement is monitoredduring the simulation using an order-n algorithm.9 According to the previous equa-tion the diffusion coefficient can then be calculated by a linear fit of the MSD versustime. The temperature dependency of the self-diffusion constant is governed by theArrhenius equation:
Ds = D0exp
[−Eact
RT
](3.5)
in whichD0 is the diffusion constant at infinite temperature,Eact the activation energyfor diffusion,R the gas constant andT the temperature.
Prior to a simulation run, a predetermined number of molecules were placed in-side the zeolite simulation box. In zeolites having one-dimensional pore structures,no exchange of the molecules between different pores takes place. Experimental de-termination of the diffusivity typically involves the averaging of the movements overa large number of pores, so that fluctuations of the number of molecules inside thechannels are averaged out. In the simulations performed in this study however only afairly limited number (≈ 20) of pores are monitored. In order to still be able to extractreliable information regarding the concentration dependence of the self-diffusion co-efficient, care has to be taken that every pore contains an equal amount of molecules.
To ascertain a quick equilibration of the molecules, low-energy starting configu-rations were generated by using a Monte Carlo simulation previous to the simulationrun. After the generation of these low-energy configurations, an MD run of 125 pswas sufficient to equilibrate the system. An additional run of 1 to 5 ns was then con-ducted in which the mean-square displacement and the equilibrium properties werecalculated. The number of molecules inside the simulation boxes varied from 8 to144 molecules, depending on the concentration which was modelled. In order to getgood statistics for the measured diffusivity at low concentration, several simulationsat equal loading were performed using different starting configurations and the aver-age results of all simulations were used. In this way it was ensured that an ensembleaverage of at least 100 molecules was taken, which provided sufficient accuracy.
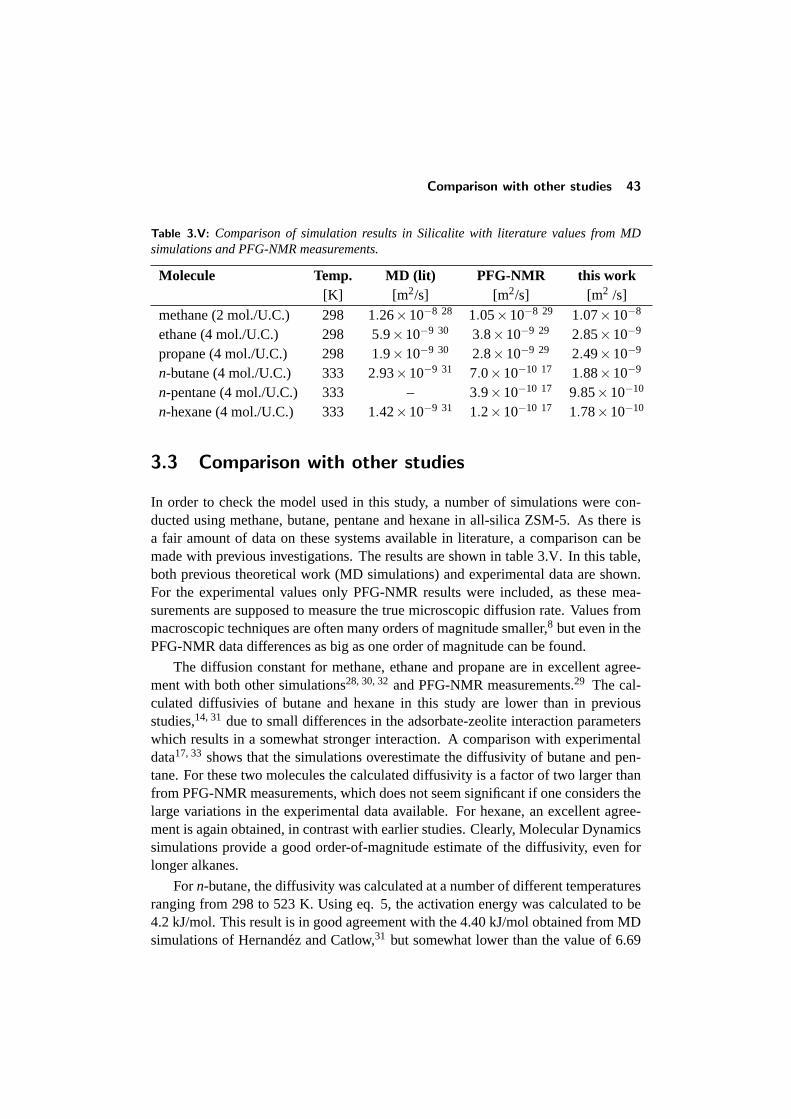
Comparison with other studies 43
Table 3.V: Comparison of simulation results in Silicalite with literature values from MDsimulations and PFG-NMR measurements.
Molecule Temp. MD (lit) PFG-NMR this work[K] [m 2/s] [m2/s] [m2 /s]
methane (2 mol./U.C.) 298 1.26×10⁻⁸ 28 1.05×10⁻⁸ 29 1.07×10⁻⁸
ethane (4 mol./U.C.) 298 5.9×10⁻⁹ 30 3.8×10⁻⁹ 29 2.85×10⁻⁹
propane (4 mol./U.C.) 298 1.9×10⁻⁹ 30 2.8×10⁻⁹ 29 2.49×10⁻⁹
n-butane (4 mol./U.C.) 333 2.93×10⁻⁹ 31 7.0×10⁻¹⁰ 17 1.88×10⁻⁹
n-pentane (4 mol./U.C.) 333 – 3.9×10⁻¹⁰ 17 9.85×10⁻¹⁰
n-hexane (4 mol./U.C.) 333 1.42×10⁻⁹ 31 1.2×10⁻¹⁰ 17 1.78×10⁻¹⁰
3.3 Comparison with other studies
In order to check the model used in this study, a number of simulations were con-ducted using methane, butane, pentane and hexane in all-silica ZSM-5. As there isa fair amount of data on these systems available in literature, a comparison can bemade with previous investigations. The results are shown in table 3.V. In this table,both previous theoretical work (MD simulations) and experimental data are shown.For the experimental values only PFG-NMR results were included, as these mea-surements are supposed to measure the true microscopic diffusion rate. Values frommacroscopic techniques are often many orders of magnitude smaller,8 but even in thePFG-NMR data differences as big as one order of magnitude can be found.
The diffusion constant for methane, ethane and propane are in excellent agree-ment with both other simulations28, 30, 32and PFG-NMR measurements.29 The cal-culated diffusivies of butane and hexane in this study are lower than in previousstudies,14, 31 due to small differences in the adsorbate-zeolite interaction parameterswhich results in a somewhat stronger interaction. A comparison with experimentaldata17, 33 shows that the simulations overestimate the diffusivity of butane and pen-tane. For these two molecules the calculated diffusivity is a factor of two larger thanfrom PFG-NMR measurements, which does not seem significant if one considers thelarge variations in the experimental data available. For hexane, an excellent agree-ment is again obtained, in contrast with earlier studies. Clearly, Molecular Dynamicssimulations provide a good order-of-magnitude estimate of the diffusivity, even forlonger alkanes.
Forn-butane, the diffusivity was calculated at a number of different temperaturesranging from 298 to 523 K. Using eq. 5, the activation energy was calculated to be4.2 kJ/mol. This result is in good agreement with the 4.40 kJ/mol obtained from MDsimulations of Hernandez and Catlow,31 but somewhat lower than the value of 6.69
44 Molecular Dynamics of Alkanes in Zeolites
kJ/mol found by Runnebaum and Maginn.15 The calculated activation energy is alsoin good agreement with the value of about 5 kJ/mol obtained from QENS by Jobic etal.34 The value found by Datema et al.33 (8.1 kJ/mol) is significantly higher, but aswe will see later this might be due to the high loading of 7 molecules per unit cell atwhich the activation energy was determined.
Unfortunately, as far as the authors know no PFG-NMR or QENS data exist foralkanes in zeolites Mordenite, Ferrierite, and ZSM-22, so no comparison could bemade with experimental results in these systems. No theoretically calculated datawas available for comparison as well.
3.4 Diffusion in single-file pore systems
As was already discussed in a previous section, diffusion in a number of differentzeolites was studied. Two of the zeolite structures, Mordenite and ZSM-22, containsingle-file pores. In these systems, deviations from normal diffusion behaviour, inwhich the MSD is proportional to time, might be expected.8 For a single file ofinfinite length and for larget the MSD is proportional to the square root of time:35
〈|~r(t)−~r(0)|2〉= 2·F ·√
t (3.6)
in which F is the single-file mobility. This behaviour is a result of the fact that themolecules cannot pass each other inside the pores. Although the occurrence of thiskind of behaviour can be predicted from first principles, the experimental evidenceof single-file diffusion is still contradictory and a continuing subject of discussion.35
Molecular dynamics studies of these systems have, as far as the authors know, beenrather limited and mostly confined to simple systems.35–38
Figure 3.1 shows the mean-square displacement ofn-butane in zeolite Mordeniteat a loading of 1 and 1.5 molecules per unit cell (corresponding to 28.6 and 42.9%of the maximum loading, respectively). Clearly, no single-file diffusion behaviour isobserved. Even at maximum pore filling (3.5 molecules/U.C., not shown in fig. 3.1,the MSD is still proportional tot, indicating normal diffusion behaviour. The sameobservation holds for zeolite ZSM-22. One possible explanation for the absence ofsingle-file diffusion behaviour could be that the model does not accurately representthe physical properties of the system. One of the possibilities could be the assump-tion of periodic boundary conditions, as the boundaries seem to strongly influencethe behaviour of the system.35 However, increasing the simulation box size by afactor of five (and accordingly the number of molecules) did not result in deviationsfrom the results found with the standard simulation box size. Furthermore boundaryeffects should not be significant if the box size is significantly larger than the averagedistance travelled by the molecules during the simulations.
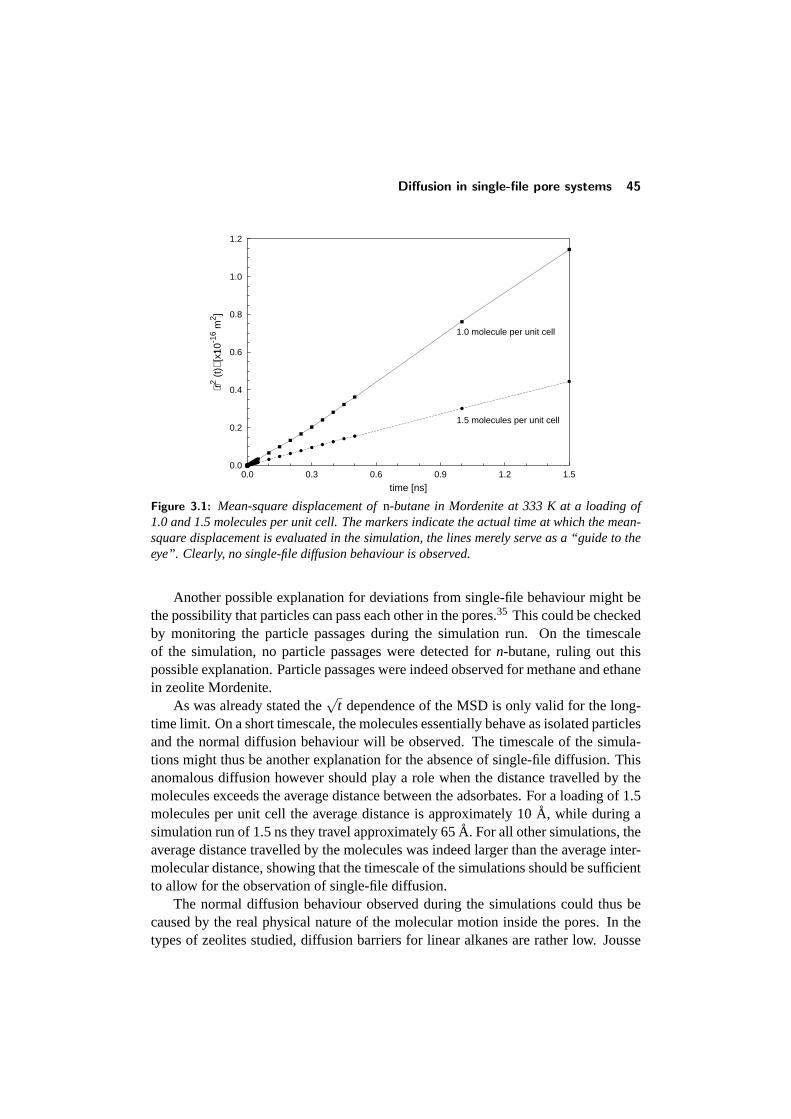
Diffusion in single-file pore systems 45
0.0
0.2
0.4
0.6
0.8
1.0
1.2
0.0 0.3 0.6 0.9 1.2 1.5
⟨r2 (
t)⟩ [
x10
�
-16 m
2 ]
time [ns]
1.5 molecules per unit cell
1.0 molecule per unit cell
Figure 3.1: Mean-square displacement ofn-butane in Mordenite at 333 K at a loading of1.0 and 1.5 molecules per unit cell. The markers indicate the actual time at which the mean-square displacement is evaluated in the simulation, the lines merely serve as a “guide to theeye”. Clearly, no single-file diffusion behaviour is observed.
Another possible explanation for deviations from single-file behaviour might bethe possibility that particles can pass each other in the pores.35 This could be checkedby monitoring the particle passages during the simulation run. On the timescaleof the simulation, no particle passages were detected forn-butane, ruling out thispossible explanation. Particle passages were indeed observed for methane and ethanein zeolite Mordenite.
As was already stated the√
t dependence of the MSD is only valid for the long-time limit. On a short timescale, the molecules essentially behave as isolated particlesand the normal diffusion behaviour will be observed. The timescale of the simula-tions might thus be another explanation for the absence of single-file diffusion. Thisanomalous diffusion however should play a role when the distance travelled by themolecules exceeds the average distance between the adsorbates. For a loading of 1.5molecules per unit cell the average distance is approximately 10A, while during asimulation run of 1.5 ns they travel approximately 65A. For all other simulations, theaverage distance travelled by the molecules was indeed larger than the average inter-molecular distance, showing that the timescale of the simulations should be sufficientto allow for the observation of single-file diffusion.
The normal diffusion behaviour observed during the simulations could thus becaused by the real physical nature of the molecular motion inside the pores. In thetypes of zeolites studied, diffusion barriers for linear alkanes are rather low. Jousse
46 Molecular Dynamics of Alkanes in Zeolites
et al.39 already pointed out that for these low barriers, the diffusive motion can nolonger be modelled as a series of uncorrelated jumps because the transition-state ap-proximation no longer holds. Kramers showed that transition state theory is onlyvalid if Eb > 5kT.40 This condition ensures that the time the molecules spend on theadsorption sites is much larger that the time to jump from one site to the other, thusallowing for sufficient thermalization. In our case, this condition is clearly not met,as the required activation barrier (at 333 K) equals 13.8 kJ/mol, much higher than thetypical barriers of± 5 kJ/mol in these zeolites. A “hopping-like” diffusion mech-anism, in which the particles move as random walkers, therefore might not give anaccurate description of this motion. Instead the particles “memorize” their directionof motion when moving from one minimum-energy site to another so that the mo-tion is no longer uncorrelated and close to ballistic. Furthermore the intermolecularinteractions are not of a hard-sphere type, and effects such as cluster formation caninfluence the diffusive behaviour.41, 42 A more thorough treatment of the fundamen-tals of single-file diffusion will be given in chapter 4.
3.5 Concentration dependence of the diffusivity
As is already evident from figure 3.1, the diffusivity strongly depends on the zeoliteloading. To study this concentration dependence the diffusion ofn-butane was sim-ulated in zeolites Mordenite, Silicalite, Ferrierite and ZSM-22 at different loadings.Figure 3.2 shows the calculated self-diffusion coefficients as a function of loading.The concentration is normalized on the maximum pore loading of the different zeo-lites. The maximum pore loading was determined from experimental data43 (whenpossible) or grand-canonical CBMC simulations. These values were determined tobe 3.5, 9, 3.5 and 1.5 molecules per unit cell for Mordenite, Silicalite, Ferrierite, andZSM-22, respectively.
At low loadings, the molecules have the highest mobility in zeolite Mordenite,due to the fact that it has large 12-ring pores instead of the smaller 10-ring poresof the other zeolites. Diffusion in silicalite is faster than in Ferrierite and ZSM-22because of its slightly larger pore diameter and its 3-dimensional pore structure. Moreremarkable is the differences in mobility in zeolites Ferrierite and ZSM-22. Bothzeolites have pores of comparable dimensions, and although FER has a 3-dimensionalpore structure, on the timescale of the simulations only 1-dimensional diffusion wasobserved, as is the case in ZSM-22. However, the presence of the 8-ring windowsand cages in FER significantly increases the freedom of movement of the molecules.
For all zeolites, the diffusivity decreases as a function of the loading. This is aresult of the more frequent occurrence of molecular collisions between the differentmolecules at higher concentrations. At sufficiently low loadings, the molecules no
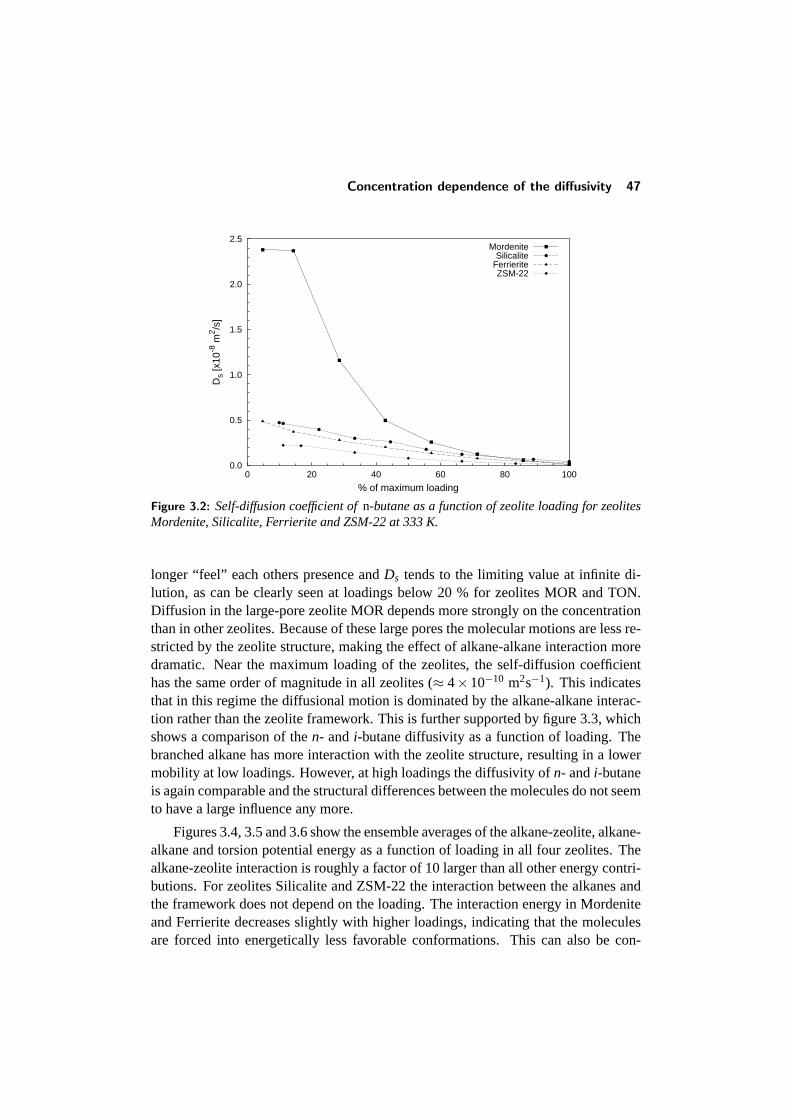
Concentration dependence of the diffusivity 47
0.0
0.5
1.0
1.5
2.0
2.5
0 20 40 60 80 100
Ds
[x10
-8 m
2 /s]
% of maximum loading
MordeniteSilicalite
FerrieriteZSM-22
Figure 3.2: Self-diffusion coefficient ofn-butane as a function of zeolite loading for zeolitesMordenite, Silicalite, Ferrierite and ZSM-22 at 333 K.
longer “feel” each others presence andDs tends to the limiting value at infinite di-lution, as can be clearly seen at loadings below 20 % for zeolites MOR and TON.Diffusion in the large-pore zeolite MOR depends more strongly on the concentrationthan in other zeolites. Because of these large pores the molecular motions are less re-stricted by the zeolite structure, making the effect of alkane-alkane interaction moredramatic. Near the maximum loading of the zeolites, the self-diffusion coefficienthas the same order of magnitude in all zeolites (≈ 4×10⁻¹⁰ m2s−1). This indicatesthat in this regime the diffusional motion is dominated by the alkane-alkane interac-tion rather than the zeolite framework. This is further supported by figure 3.3, whichshows a comparison of then- and i-butane diffusivity as a function of loading. Thebranched alkane has more interaction with the zeolite structure, resulting in a lowermobility at low loadings. However, at high loadings the diffusivity ofn- andi-butaneis again comparable and the structural differences between the molecules do not seemto have a large influence any more.
Figures 3.4, 3.5 and 3.6 show the ensemble averages of the alkane-zeolite, alkane-alkane and torsion potential energy as a function of loading in all four zeolites. Thealkane-zeolite interaction is roughly a factor of 10 larger than all other energy contri-butions. For zeolites Silicalite and ZSM-22 the interaction between the alkanes andthe framework does not depend on the loading. The interaction energy in Mordeniteand Ferrierite decreases slightly with higher loadings, indicating that the moleculesare forced into energetically less favorable conformations. This can also be con-
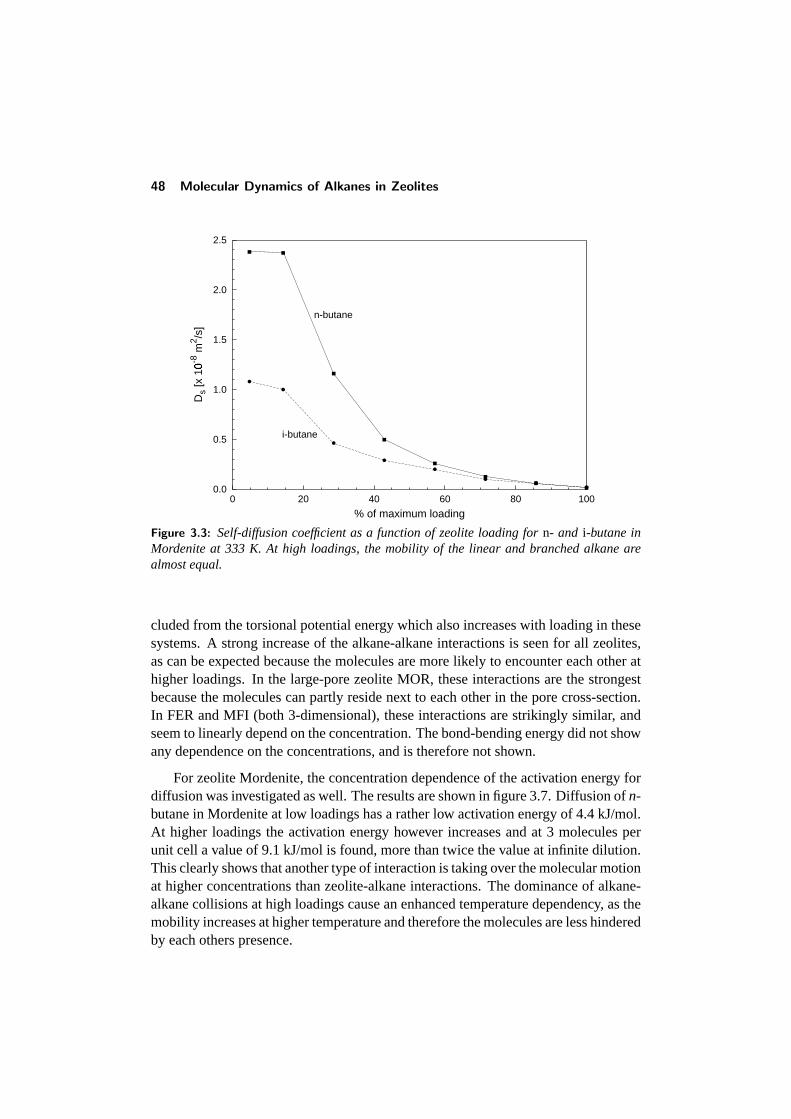
48 Molecular Dynamics of Alkanes in Zeolites
0.0
0.5
1.0
1.5
2.0
2.5
0 20 40 60 80 100
Ds
[x 1
0� -8 m
2 /s]
% of maximum loading
n-butane
i-butane
Figure 3.3: Self-diffusion coefficient as a function of zeolite loading forn- and i-butane inMordenite at 333 K. At high loadings, the mobility of the linear and branched alkane arealmost equal.
cluded from the torsional potential energy which also increases with loading in thesesystems. A strong increase of the alkane-alkane interactions is seen for all zeolites,as can be expected because the molecules are more likely to encounter each other athigher loadings. In the large-pore zeolite MOR, these interactions are the strongestbecause the molecules can partly reside next to each other in the pore cross-section.In FER and MFI (both 3-dimensional), these interactions are strikingly similar, andseem to linearly depend on the concentration. The bond-bending energy did not showany dependence on the concentrations, and is therefore not shown.
For zeolite Mordenite, the concentration dependence of the activation energy fordiffusion was investigated as well. The results are shown in figure 3.7. Diffusion ofn-butane in Mordenite at low loadings has a rather low activation energy of 4.4 kJ/mol.At higher loadings the activation energy however increases and at 3 molecules perunit cell a value of 9.1 kJ/mol is found, more than twice the value at infinite dilution.This clearly shows that another type of interaction is taking over the molecular motionat higher concentrations than zeolite-alkane interactions. The dominance of alkane-alkane collisions at high loadings cause an enhanced temperature dependency, as themobility increases at higher temperature and therefore the molecules are less hinderedby each others presence.
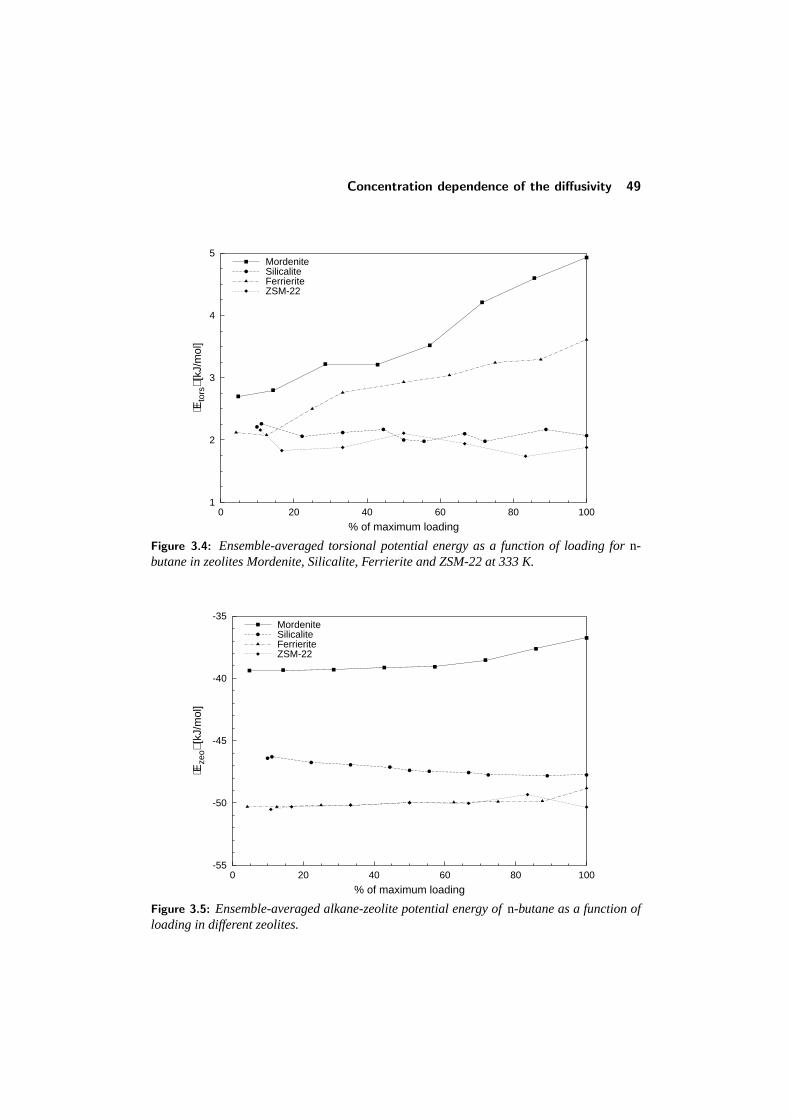
Concentration dependence of the diffusivity 49
1
2
3
4
5
0 20 40 60 80 100
⟨Eto
rs⟩ [
kJ/m
ol]
% of maximum loading
MordeniteSilicaliteFerrieriteZSM-22
Figure 3.4: Ensemble-averaged torsional potential energy as a function of loading forn-butane in zeolites Mordenite, Silicalite, Ferrierite and ZSM-22 at 333 K.
-55
-50
-45
-40
-35
0 20 40 60 80 100
⟨Eze
o⟩ [k
J/m
ol]
% of maximum loading
MordeniteSilicaliteFerrieriteZSM-22
Figure 3.5: Ensemble-averaged alkane-zeolite potential energy ofn-butane as a function ofloading in different zeolites.
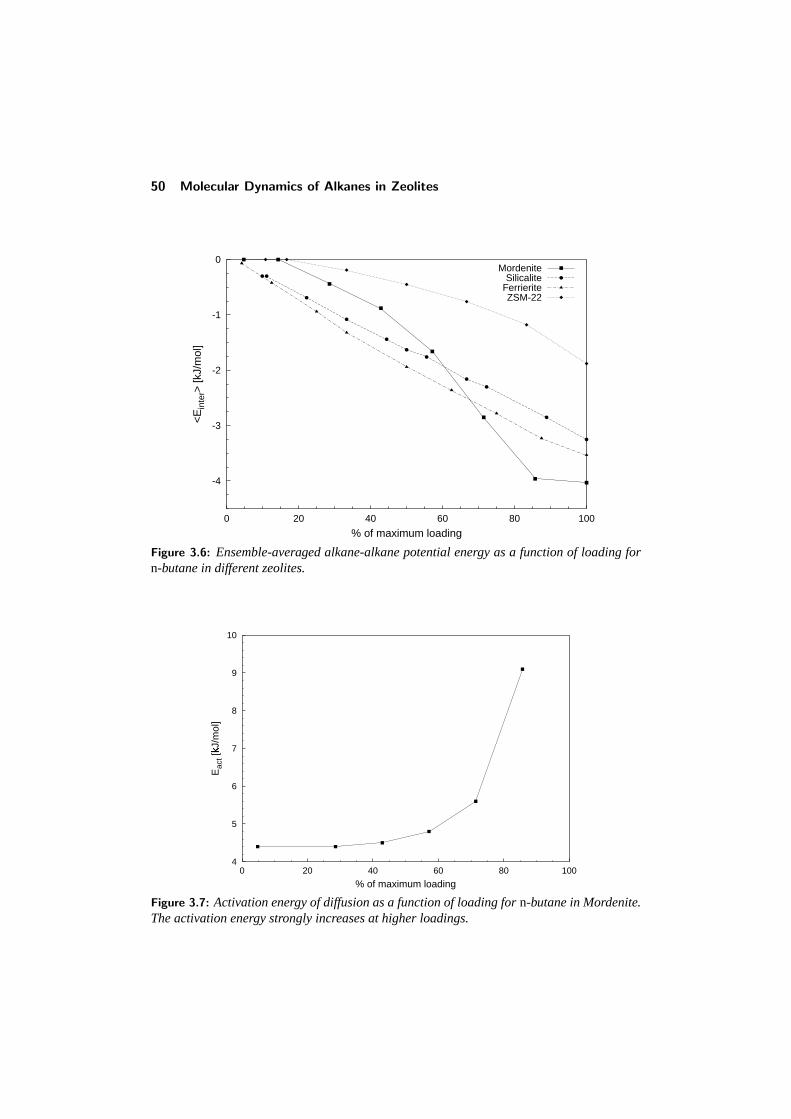
50 Molecular Dynamics of Alkanes in Zeolites
-4
-3
-2
-1
0
0 20 40 60 80 100
<E
inte
r> [k
J/m
ol]
% of maximum loading
MordeniteSilicalite
FerrieriteZSM-22
Figure 3.6: Ensemble-averaged alkane-alkane potential energy as a function of loading forn-butane in different zeolites.
4
5
6
7
8
9
10
0 20 40 60 80 100
Eac
t [kJ
/mol
]
�
% of maximum loading
Figure 3.7: Activation energy of diffusion as a function of loading forn-butane in Mordenite.The activation energy strongly increases at higher loadings.

Chainlength dependence 51
0.0
1.0
2.0
3.0
4.0
5.0
6.0
7.0
0 1 2 3 4 5 6 7 8 9 10 11 12
Ds
[x 1
0� -8 m
2 /s]
no. of beads
MordeniteFerrieriteZSM-22
Figure 3.8: Self-diffusivities as a function of chainlength at 333K for zeolites Mordenite,Ferrierite and ZSM-22 at loadings of16, 1
3 and 14 molecules per unit cell, respectively. The
lines merely serve as a “guide to the eye”.
3.6 Chainlength dependence
The number of carbon atoms in an alkane clearly influences the self-diffusivity ofthese molecules, as an increased number of atoms results in a larger interaction withthe zeolite framework. That this does not necessarily result in a straightforward re-lationship between chainlength and diffusivity was already demonstrated by Run-nebaum et al.15 for alkanes in Silicalite. The effects encountered in this study wereascribed to resonant diffusion effects, which occurs whenever the length of the dif-fusing molecule is an integral multiple of the periodicity of the host lattice.
Figure 3.8 shows the chainlength dependence ofn-alkanes in zeolites Mordenite,Ferrierite and ZSM-22. The simulations were performed at a loading of1
6, 13 and 1
4molecules per unit cell, respectively, at a temperature of 333K, with alkanes rangingfrom methane ton-dodecane. For the small alkanes up to propane, the diffusivitydecreases with increasing chainlength in all zeolites. The magnitude of the diffusionconstant furthermore reflects the pore sizes of the different zeolites: diffusion is fastfor MOR, and much slower as the medium-pore zeolites FER and ZSM-22. For largerchainlengths, this relation however is not necessary observed any more.
Most remarkable in figure 3.8 are the enhanced diffusivities of hexane in Fer-rierite and octane/nonane in ZSM-22. The behaviour of Ferrierite can be partiallyexplained by its topology consisting of 10-ring channels and cages with 8-ring win-dows. Van Well et al. showed that this topology resulted in a siting which depends
52 Molecular Dynamics of Alkanes in Zeolites
on the alkane chainlength.44 The shorter alkanes up ton-pentane can easily adsorbinto the complete pore system. The fraction of the molecules adsorbed in the cageshowever decreases with increasing chainlength. Due to the limited volume,n-hexaneand longer alkanes no longer can reside in the cages, and for these molecules essen-tially a 1-dimensional network of 10-ring channels remains. Diffusion in these poresis relatively fast compared to the movement from one pore to the other via the cages,as the 8-ring windows result in a high activation energy for this process. These acti-vation barriers are so high that on the timescale of the simulations these events do notoccur, and the molecules inside the cages are essentially trapped. For methane up ton-pentane, the calculated diffusivity made up of two contributions: the relatively fastdiffusion in the 10-ring pores and the slow inter-pore diffusion whereby the moleculespass the 8-ring windows and the cages. The diffusion coefficient merely reflects thefraction of the molecules adsorbed in the cages, resulting in an increased diffusivityfor the bulkier alkanes. Asn-hexane can no longer adsorb in the cages, the diffusivityis only determined by the fast motion in the 10-ring pores.
The enhanced diffusivity ofn-octane andn-nonane in TON might possibly becaused by resonant diffusion. When the end-to-end chainlength of a molecule matchesthe lattice periodicity, an enhanced mobility might be observed because these moleculesare smeared out of the low- and high-energy areas of the zeolite and thus experiencea lower activation barrier. An examination of the end-to-end chainlengths revealsvalues of 8.9 and 10.3A, close to twice the lattice periodicity of 5A for the 10-ringchannels. Resonant diffusion is also expected forn-pentane (end-to-end chainlength5.1 A), and indeed a small increase of mobility compared ton-butane is seen. Thiseffect is however not that dramatic because the smaller molecules behave less “rigid”as the longer ones and are not that tightly aligned in the pores.
Resonant diffusion is also present in Mordenite. For this zeolite,n-heptane showsan increased diffusivity. Again, its end-to-end chainlength of 7.8A closely matchesthe channel periodicity of 7.5A, but the effects are less dramatic than in the case ofthe medium-pore zeolites. This might be caused by the fact that the conformationsof the molecules are more constrained in the smaller pores than in the relatively largepores of MOR.16 These constraints force the molecules into straight conformations,making them better candidates for resonant diffusion. Furthermore the constraintsin the medium-pore zeolites might explain why the calculated diffusivities for thesesystems lie close to or are sometimes even larger than in Mordenite.
More evidence for resonant diffusion is found when examining the activationenergy of diffusion of the different alkanes. As was already observed by Runnebaumand Maginn,15 molecules that match the lattice periodicity of the alkane experiencelower activation barriers. Forn-octane in ZSM-22, an activation energy of -0.3 kJ/molwas found, almost equal to zero. This is much lower compared to the values of 4.7
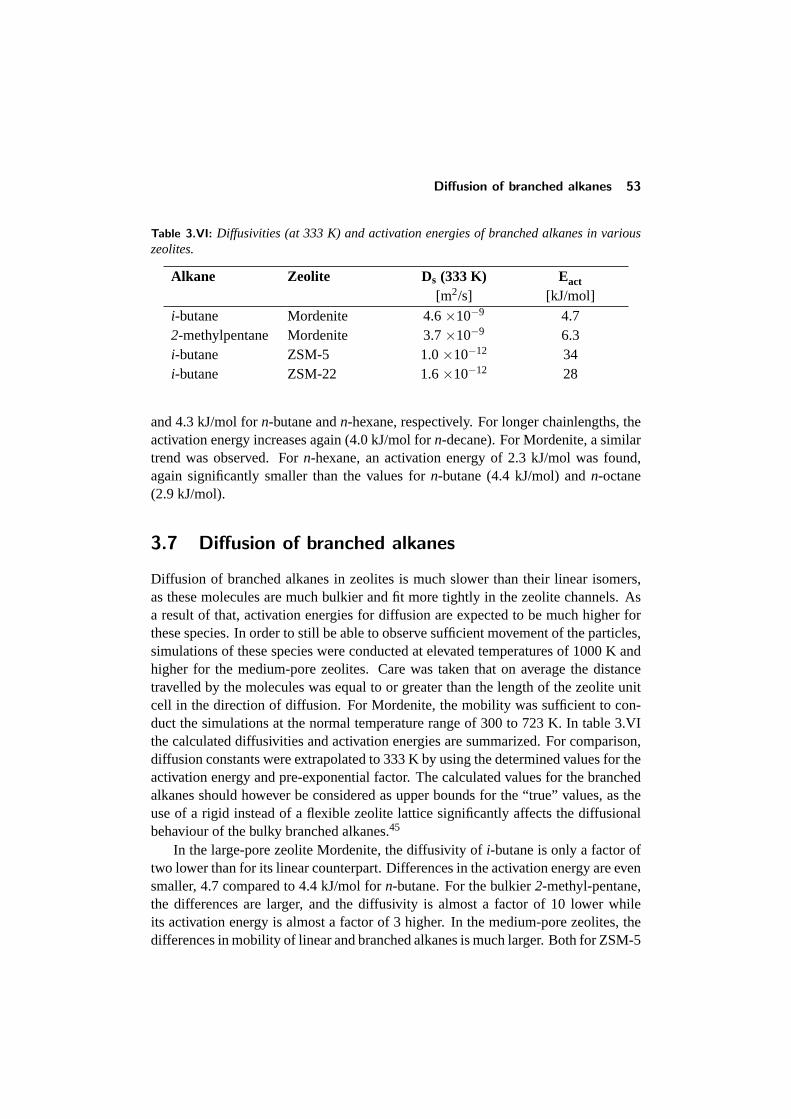
Diffusion of branched alkanes 53
Table 3.VI: Diffusivities (at 333 K) and activation energies of branched alkanes in variouszeolites.
Alkane Zeolite Ds (333 K) Eact
[m2/s] [kJ/mol]i-butane Mordenite 4.6×10⁻⁹ 4.72-methylpentane Mordenite 3.7×10⁻⁹ 6.3i-butane ZSM-5 1.0×10⁻¹² 34i-butane ZSM-22 1.6×10⁻¹² 28
and 4.3 kJ/mol forn-butane andn-hexane, respectively. For longer chainlengths, theactivation energy increases again (4.0 kJ/mol forn-decane). For Mordenite, a similartrend was observed. Forn-hexane, an activation energy of 2.3 kJ/mol was found,again significantly smaller than the values forn-butane (4.4 kJ/mol) andn-octane(2.9 kJ/mol).
3.7 Diffusion of branched alkanes
Diffusion of branched alkanes in zeolites is much slower than their linear isomers,as these molecules are much bulkier and fit more tightly in the zeolite channels. Asa result of that, activation energies for diffusion are expected to be much higher forthese species. In order to still be able to observe sufficient movement of the particles,simulations of these species were conducted at elevated temperatures of 1000 K andhigher for the medium-pore zeolites. Care was taken that on average the distancetravelled by the molecules was equal to or greater than the length of the zeolite unitcell in the direction of diffusion. For Mordenite, the mobility was sufficient to con-duct the simulations at the normal temperature range of 300 to 723 K. In table 3.VIthe calculated diffusivities and activation energies are summarized. For comparison,diffusion constants were extrapolated to 333 K by using the determined values for theactivation energy and pre-exponential factor. The calculated values for the branchedalkanes should however be considered as upper bounds for the “true” values, as theuse of a rigid instead of a flexible zeolite lattice significantly affects the diffusionalbehaviour of the bulky branched alkanes.45
In the large-pore zeolite Mordenite, the diffusivity ofi-butane is only a factor oftwo lower than for its linear counterpart. Differences in the activation energy are evensmaller, 4.7 compared to 4.4 kJ/mol forn-butane. For the bulkier2-methyl-pentane,the differences are larger, and the diffusivity is almost a factor of 10 lower whileits activation energy is almost a factor of 3 higher. In the medium-pore zeolites, thedifferences in mobility of linear and branched alkanes is much larger. Both for ZSM-5
54 Molecular Dynamics of Alkanes in Zeolites
and ZSM-22, the diffusivities ofi-butane are three orders of magnitude lower than forn-butane. The activation energies are in the order of 30 kJ/mol, compared to 4.2 and4.7 kJ/mole for its linear counterpart in ZSM-5 and ZSM-22, respectively. Clearly,the bulky iso-alkanes fit tightly in the 10-ring channels. The slightly higher activationenergy of ZSM-5 can be accounted for by the pressence of the rather spacious channelintersections, where the molecules are preferentially sited.
3.8 Conclusions
Molecular dynamics simulations have been used to study the diffusion of a numberof different linear and branched alkanes in zeolites Mordenite, Silicalite, Ferrieriteand ZSM-22. This simulation technique can give useful insight in the effects of poretopology on the dynamical properties of the adsorbates and provides data which aredifficult to obtain from experimental techniques. A comparison with PFG-NMR andQENS data shows that MD simulations provide good estimates for the diffusivity andthe activation energy of diffusion. Unfortunately the amount of available data fromthese experimental techniques is rather limited making a comparison for systemsother than Silicalite difficult.
A close examination of the mean-squared displacement revealed that no single-file diffusion behaviour was observed in the 1-dimensional zeolites Mordenite andZSM-22. Changing the simulation box dimensions and, accordingly, the total num-ber of molecules inside the box, did not influence the results, indicating that boundaryeffects are not the cause for the absence of single-file diffusion. Forn-butane, no par-ticle passages were observed during the simulation run, so this possible explanationcould also be excluded. Possibly, the low activation barriers for diffusion in thesezeolites might be the cause that this behaviour cannot be observed on the timescaleof the simulations.
The diffusion constants strongly depend on the zeolite loading. These effects aremost dramatic in the large-pore zeolite Mordenite. At high loadings, the diffusivityhas the same order of magnitude for all systems, and the alkane-alkane interactionsseem to have the largest influence on the alkane mobility. The activation energy wasfound to increase with zeolite loading. These results indicate that for comparison ofexperimental and/or theoretical data the adsorbate concentration has to be taken intoclose consideration.
The chainlength dependence of the diffusivity in different zeolites seems to indi-cate that a resonant diffusion mechanism occurs in all these systems. Due to its poretopology consisting of 10-ring channels and cages with 8-ring windows, Ferrieriteshows a remarkable diffusive behaviour, because the smaller alkanes are trapped in-side the cages. The effects of resonant diffusion are much more pronounced in the
References 55
medium-pore zeolites, because the molecules in these systems are more rigid andtherefore better candidates for the occurrence of this phenomenon. A close examina-tion of the activation energy of different alkanes gives further evidence for resonantdiffusion, as these values are found to decrease when the end-to-end chainlength ofthe molecules matches the lattice periodicity. For all alkanes, the activation barriersare rather low.
By performing simulations at higher temperatures, it is possible to obtain diffu-sion constants and activation energies for branched alkanes. In Mordenite the dif-ferences in mobilities ofi-butane and2-methyl-pentane and their linear counterpartsare rather small (about one order of magnitude), and activation barriers are still low.In the medium-pore zeolites the molecules fit tightly in the pores, and as a result themobility is three orders of magnitude lower, and activation energies are in the orderof 30 kJ/mole. The presence of channel intersections increases the activation barriersas the molecules are preferentially sited in these rather spacious regions.
3.9 References
1 W. O. Haag,Catalysis by zeolites - science and technology, in: Zeolites and RelatedMicroporous Materials: State of the Art 1994, J. Weitkamp, H. G. Karge, H. Pfeifer, andW. Holderich, eds., vol. 84 ofStudies in Surface Science and Catalysis, pp. 1375–1394,Elsevier, Amsterdam (1994).
2 J. R. Hufton and D. M. Ruthven,Ind. Eng. Chem. Res.32, 2379–2386 (1993).3 N. van den Begin, L. V. C. Rees, J. Caro, and M. Bulow, Zeolites9, 287–292 (1989).4 B. G. Anderson, N. J. Noordhoek, F. J. M. M. de Gauw, L. J. van IJzendoorn, M. J. A.
de Voigt, and R. A. van Santen,Ind. Eng. Chem. Res.37(3), 815–824 (1998).5 W. Heink, J. Karger, H. Pfeifer, and F. J. Stallmach,J. Am. Chem. Soc.112, 2175–2178
(1990).6 P. C. M. M. Magusin, D. Schuring, E. M. van Oers, J. W. de Haan, and R. A. van Santen,
Magn. Reson. Chem.37, S108–S117 (1999).7 H. Jobic, M. Bee, and G. J. Kearley,J. Phys. Chem.98, 4660–4665 (1994).8 J. Karger and D. M. Ruthven,Diffusion in zeolites and other microporous solids, John
Wiley & Sons, Inc., New York (1992).9 D. Frenkel and B. Smit,Understanding molecular simulation: from algorithms to appli-
cations, Academic Press, Inc., San Diego (1996).10 B. Smit and J. I. Siepmann,J. Phys. Chem.98(34), 8442–8452 (1994).11 D. N. Theodorou and J. Wei,J. Catal.83, 205–224 (1983).12 X.-Y. Guo, Z.-W. Liu, and B. Zhong,Microporous Mesoporous Mater.23, 203–209
(1998).13 C. Saravanan and S. M. Auerbach,J. Chem. Phys.107(19), 8132–8137 (1997).14 R. L. June, A. T. Bell, and D. N. Theodorou,J. Phys. Chem.96(3), 1051–1060 (1992).15 R. C. Runnebaum and E. J. Maginn,J. Phys. Chem. B101(33), 6394–6408 (1997).
56 Molecular Dynamics of Alkanes in Zeolites
16 S. P. Bates, W. J. M. van Well, R. A. van Santen, and B. Smit,J. Am. Chem. Soc.118(28),6753–6759 (1996).
17 W. Heink, J. Karger, H. Pfeifer, K. P. Datema, and A. K. Nowak,J. Chem. Soc. FaradayTrans.88(23), 3505–3509 (1992).
18 Molecular Simulations Inc., San Diego, CA, Cerius2, version 3.8(1998).19 C. R. A. Catlow, C. M. Freeman, B. Vessal, S. M. Tomlinson, and M. Leslie,J. Chem.
Soc., Faraday Trans.87(13), 1947–1950 (1991).20 J.-P. Ryckaert and A. Bellemans,Faraday Discuss. Chem. Soc.66, 95–106 (1978).21 P. van der Ploeg and H. J. C. Berendsen,J. Chem. Phys.76(6), 3271–3276 (1982).22 J. I. Siepmann, S. Karaborni, and B. Smit,Nature365, 330–332 (1993).23 B. Smit, L. D. J. C. Loyens, and G. L. M. M. Verbist,Faraday Discuss.106, 93–104
(1997).24 T. J. H. Vlugt, R. Krishna, and B. Smit,J. Phys. Chem. B103(7), 1103–1118 (1999).25 M. P. Allen and D. J. Tildesley,Computer simulation of liquids, Clarendon, Oxford
(1987).26 A. V. Kiselev, A. A. Lopatkin, and A. A. Shulga,Zeolites5, 261–267 (1985).27 W. G. Hoover,Phys. Rev. A31(3), 1695–1697 (1985).28 S. J. Goodbody, K. Watanabe, D. MacGowan, J. P. R. B. Walton, and N. Quirke,J. Chem.
Soc., Faraday Trans.87(13), 1951–1958 (1991).29 M. B. J. Caro, W. Schirmer, J. Karger, W. Heink, H. Pfeifer, and S. P. . Zdanov,J. Chem.
Soc., Faraday Trans. 181, 2541–2550 (1985).30 D. Dumont and D. Bougeard,Zeolites15, 650–655 (1995).31 E. Hernandez and C. R. A. Catlow,Proc. R. Soc. Lond. A448, 143–160 (1995).32 E. J. Maginn, A. T. Bell, and D. N. Theodorou,J. Phys. Chem.97(16), 4173–4181 (1993).33 K. P. Datema, C. J. J. den Ouden, W. D. Ylstra, H. P. C. E. Kuipers, M. F. M. Post, and
J. Karger,J. Chem. Soc. Faraday Trans.87(12), 1935–1943 (1991).34 H. Jobic, M. Bee, and J. Caro, in:Proc. 9th Int. Zeolite Conf., R. V. Balmoos, J. B.
Higgins, and M. M. J. Treacy, eds., Butterworth-Heinemann, Boston (1993).35 K. Hahn and J. Karger,J. Phys. Chem. B102(30), 5766–5771 (1998).36 K. Hahn and J. Karger,J. Phys. Chem.100(1), 316–326 (1996).37 J. M. D. MacElroy and S.-H. Suh,J. Chem. Phys.106(20), 8595–8597 (1997).38 D. Keffer, A. V. McCormick, and H. T. Davis,Mol. Phys.87(2), 367–387 (1996).39 F. Jousse and S. M. Auerbach,J. Chem. Phys.107(22), 9629–9639 (1997).40 R. A. van Santen and J. W. Niemantsverdriet,Chemical kinetics and catalysis, Plenum
Press, New York, New York (1995).41 D. S. Sholl and K. A. Fichthorn,Phys. Rev. Lett.79(19), 3569–3572 (1997).42 C. Saravanan and S. M. Auerbach,J. Chem. Phys.110(22), 11000–11011 (1999).43 W. J. M. van Well,Adsorption of alkanes in zeolites, Ph.D. thesis, Eindhoven University
of Technology, Eindhoven (1998).44 W. J. M. van Well, X. Cottin, B. Smit, J. H. C. van Hooff, and R. A. van Santen,J. Phys.
Chem. B102(20), 3952–3958 (1998).45 A. Bouermaouen and A. Bellemans,J. Chem. Phys.108(5), 2170–2172 (1998).
4Diffusion in Single-File Systems
When a zeolite contains one-dimensional pores in which molecules areunable to pass each other a special type of diffusion, called single-filediffusion, occurs. One of the characteristic features which can resultfrom this diffusion mode, is that the mean-square displacement of themolecules becomes proportional to the square root of time. Whether ornot this characteristic behaviour can be observed, seems to be closelyrelated on the pore geometry. In this chapter, this dependency will beinvestigated. A simple model of a narrow pore will be used in orderto obtain a better understanding of the fundamentals of this single-filediffusion.
4.1 Introduction
When particles or molecules move inside a narrow one-dimensional channel in whichthey cannot pass each other, a special type of diffusion called single-file diffusion canbe observed. Originally, interest in this subject was raised in the field of biophysics,where diffusion through very narrow pores in membranes was studied.1 In the seven-ties and early eighties, interest in the subject was raised in the field of mathematicalphysics, resulting in a number of papers dealing with an analytical description of thebehaviour of particles in these systems.2–4 The systems themselves are treated ei-ther as one-dimensional lines or arrays of lattice sites, in which the isolated particlesmove as random walkers. One of the important conclusions resulting from these pa-pers was that, in the long time limit, the mean-square displacement of the particles in
†Reproduced in part from D. Schuring and R.A. van Santen, “Properties of Single-File Systems:What Determines the Typical Single-File Behaviour?”,J. Phys. Chem. B, submitted for publication.
58 Diffusion in Single-File Systems
these systems would become proportional to the square root of time:
〈z2(t)〉= 2·F ·√
t (4.1)
in which F is the single-file mobility. This is in contrast with the behaviour of 3-dimensional systems, in which normal “Fickian” diffusion is observed, where thisquantity is proportional tot.
More recently, the zeolite community has become interested in the field of single-file diffusion. A substantial number of zeolite structure types contain narrow, uncon-nected straight channels,5 making them excellent candidates for the occurrence of thisphenomenon. As this type of diffusion is expected to strongly influence the transportbehaviour, and consequently, the catalytic performance, a better understanding ofthis is not only important from a fundamental, but also from a practical point of view.Both the influence on reaction rates, as well as the long-time behaviour of particlesin these systems were consequently studied by Karger et al.6–8 With the advent oftechniques such as PFG-NMR and QENS, it furthermore became possible to directlyprobe the single-file behaviour of molecules on a microscopic scale in these exper-iments.9–13 Discrepancies between different experimental studies14 recently shiftedthe interest to possible deviations from the single-file behaviour due to e.g. particlepassages,15, 16finite file lengths,17–19or concerted cluster diffusion.20, 21
Although the subject has been studied extensively, a lot of questions still remainabout the fundamentals of this process. One of the most important ones to be an-swered is under what conditions the single-file diffusion behaviour will or will notoccur. The criterium that particles cannot pass each other appears to be essential, butdoes not guarantee that the long-time behaviour of the mean-square displacement isactually observed. A hopping-like mechanism, where the individual particles moveas random walkers as was often used as an assumption in early papers dealing withthe theory of single-file diffusion, is also not stricly necessary. One thing that has be-come clear from previous studies, is that the observation of or deviations from the
√t
behaviour of the mean-square displacement strongly depend on the geometry (chan-nel length, diameter, type of boundary) of the systems under study. In this chapter,this dependence will be the main focus.
To investigate the geometry dependence, it is not necessary to apply a detailedmodel of a zeolite pore. Instead, a much simpler model is used with a well-definedpotential, thereby greatly reducing the computational costs of the simulations. Us-ing these models, the dimensions of the pore and the shape of the pore wall and theparticle-wall interaction potentials, the influence can be readily studied. As the in-teraction between the adsorbates can be easily switched of, the relation between themotion of non-interacting (isolated) particles and interacting particles in a single filesystem can be investigated as well. This is particularly interesting in view of the
Methodology 59
common assumption that the single-file motion can be considered as the product ofthe motion of the individual particles, and a contribution due to the interaction be-tween the different particles in the system.22 Finally, by varying the pore length forthe different systems, the dependence of system size on the diffusive behaviour canbe studied.
In this chapter, the different techniques to simulate the motion in narrow poreswill be discussed. The special characteristics of these systems will be considered,and used to simplify the simulations and reduce computation time. Next, the resultswill be presented, starting with diffusion in a cylindrical pore and hard-sphere interac-tions, after which more complicated systems will be discussed. By comparing the be-haviour in these systems, more information can be obtained on the exact mechanismof single-file diffusion. Possible implications for the theoretical understanding ofthis phenomenon, as well as for the occurrence of this behaviour in one-dimensional,narrow-pore zeolites, will be discussed.
4.2 Methodology
Although the main interest for single-file diffusion in this thesis is focussed on thetransport of molecules through zeolites having a one-dimensional pore structure, adetailed description of these systems is not needed to gain insight in its fundamentals.A number of studies have indeed considered a detailed model of the zeolite porestructure (see e.g. Tepper et al.,15 and Keffer et al.23), but due to the long-rangecorrelations in these systems (requiring large system sizes), simulations using thesemodels are very time-consuming. Therefore, a much simpler approach was chosen,whereby a system consisting of spherical particles, a cylindrically shaped pore andeither hard-sphere or simple Lennard-Jones interactions is considered.
4.2.1 Hard-sphere dynamics
The easiest way to describe interactions in a single-file system is by using hard po-tentials (i.e. potentials which are discontinuous functions of the distance). Simula-tions of these type of systems stem from the early days of computational (statistical)physics, as these calculations are relatively easy to implement and at that time couldbe used to check approximative analytical theories of these systems.24 Nowadays, thestudy of these type of systems still proves to be useful and are still applied in the fieldof fluids in confined geometries (see e.g. Suh and MacElroy,25 Mon and Perkus,26
and Henderson27). As a result of the discontinuous character of the interactions, con-ventional molecular dynamics with continuous time integration cannot be used, asthis would lead to infinite forces. Instead, the main task of the simulation algorithm
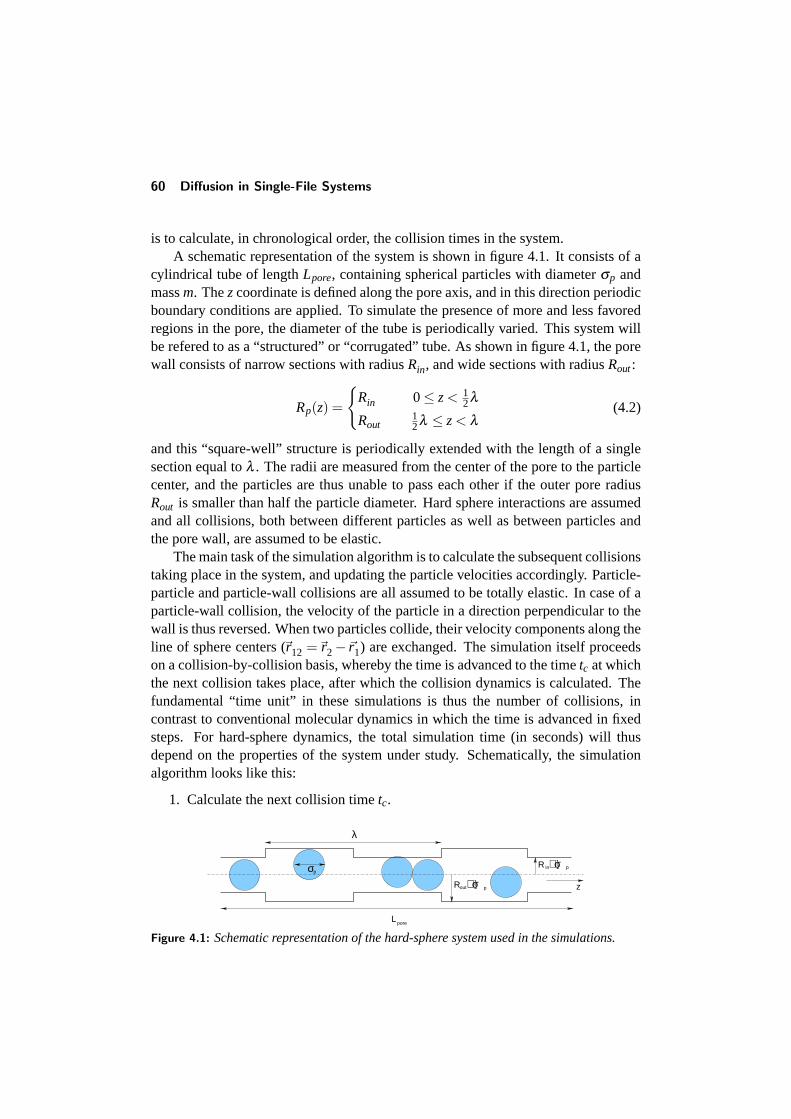
60 Diffusion in Single-File Systems
is to calculate, in chronological order, the collision times in the system.A schematic representation of the system is shown in figure 4.1. It consists of a
cylindrical tube of lengthLpore, containing spherical particles with diameterσp andmassm. Thezcoordinate is defined along the pore axis, and in this direction periodicboundary conditions are applied. To simulate the presence of more and less favoredregions in the pore, the diameter of the tube is periodically varied. This system willbe refered to as a “structured” or “corrugated” tube. As shown in figure 4.1, the porewall consists of narrow sections with radiusRin, and wide sections with radiusRout:
Rp(z) =
{Rin 0≤ z< 1
2λ
Rout12λ ≤ z< λ
(4.2)
and this “square-well” structure is periodically extended with the length of a singlesection equal toλ . The radii are measured from the center of the pore to the particlecenter, and the particles are thus unable to pass each other if the outer pore radiusRout is smaller than half the particle diameter. Hard sphere interactions are assumedand all collisions, both between different particles as well as between particles andthe pore wall, are assumed to be elastic.
The main task of the simulation algorithm is to calculate the subsequent collisionstaking place in the system, and updating the particle velocities accordingly. Particle-particle and particle-wall collisions are all assumed to be totally elastic. In case of aparticle-wall collision, the velocity of the particle in a direction perpendicular to thewall is thus reversed. When two particles collide, their velocity components along theline of sphere centers (~r12 =~r2−~r1) are exchanged. The simulation itself proceedson a collision-by-collision basis, whereby the time is advanced to the timetc at whichthe next collision takes place, after which the collision dynamics is calculated. Thefundamental “time unit” in these simulations is thus the number of collisions, incontrast to conventional molecular dynamics in which the time is advanced in fixedsteps. For hard-sphere dynamics, the total simulation time (in seconds) will thusdepend on the properties of the system under study. Schematically, the simulationalgorithm looks like this:
1. Calculate the next collision timetc.
R in
Rout+ σ
+ σ
Lpore
z
σ
λ
_21
_21
pp
p
Figure 4.1: Schematic representation of the hard-sphere system used in the simulations.
Methodology 61
2. Calculate the positions of the colliding particles at timetc, and update thesepositions accordingly.
3. Implement the collision dynamics for these particles and update particle veloc-ities.
4. Update the collision times of the collided particles and their direct neighbours.
5. When the important properties of the system need to be sampled, update allparticle positions to the current time, and sample properties.
The scheme shown above is slightly different from a conventional hard-sphere dy-namics system. Due to the special character of the system under study, a numberof modifications were implemented to reduce computation time. As particles cannotpass each other only collisions with nearest neighbours occur, and consequently onlycollision times between adjacent particles, and of each particle with the wall have tobe calculated. After a collision has occured, only a limited number of collision timesthus have to be updated instead of a complete recalculation of the collision times withall other particles in the system. A further reduction in computation time could beachieved by, after each collision, only updating the particle positions of the particleswhich have collided, and only updating the positions of all particles when samplingof properties is needed.
In addition to the structure shown in figure 4.1, simulations were also performedusing a “sawtooth” structure to investigate the influence of the pore structure on thesingle-file behaviour. This structure was chosen because the time at which the parti-cles collide with the wall can still be calculated analytically, as numerical evaluationof the collisiontime will be computationally expensive. In this case, for a single pe-riod the radius varies according to:
Rp(z) =
{Rin +2· Rout−Rin
λ·z 0≤ z< 1
2λ
Rout−2· Rout−Rinλ
· (z− 12λ ) 1
2λ ≤ z< λ(4.3)
As a result of this structure, a collision with the pore wall leads to a partial transferof momentum both parallel and perpendicular to the channel axis.
4.2.2 Molecular dynamics with Lennard-Jones type interactions
By using Lennard-Jones type potentials, a system can be simulated that more closelyresembles the situation inside the zeolite pore. Furthermore, these kind of simula-tions represent a much “softer” type of interactions, influencing the single-file be-haviour. The small attractive contribution in the interparticle potentials might leadto an increased correlation between the motion of the individual particles. For the
62 Diffusion in Single-File Systems
particle-particle interactions, a shifted Lennard-Jones potential is used:28
Vp(r) =
4εp
((σp
r
)12−(
σp
r
)6)−c1(r
2− r2c)−c2 for r < rc
0 for r > rc
(4.4)
in whichr is the radial distance of the particle center from the channel axis.σp can beregarded as the effective diameter of the particles. The constantsc1 andc2 are chosenin such a way that both the potential and the forces are zero at the cutoff radiusrc.The cutoff radius is chosen to be 13.0A, a value commonly used in the simulation ofsmall molecules in zeolites.
In zeolites, the potential energy felt by the particles moving inside the pores isdetermined by the interaction with many atoms of the surrounding zeolite lattice.Usually, this is described by two-particle Lennard-Jones type potentials. Assuminga pore with a cylindrical symmetry, the resulting potential energy consisting of theintegral of all separate interactions is a function of the axial position and the distancefrom the center of the pore. As the calculation of the previously mentioned potentialsis computationally rather expensive, and such a detailed description is not strictlynecessary to study single-file behaviour, a much simpler approach is used. For the in-teractions with the pore wall, an inverse Lennard-Jones potential was used, as appliedpreviously by Hahn et al.28
Vt(rt ,z) =
4εt
((rt
σt
)12
−(
rt
σt
)6)
+ εt for rt > rc
0 for rt < rc
(4.5)
In this equation, the variablert equals the distance from the center of the tube.σt isthe parameter determining the radius of the tube, as at this radial distance the potentialstrongly increases. As the interactions are calculated between the center-of-mass ofthe spheres and the center of the tube, the effective diameter of the tube thus equals2σt +σp. The value ofσt can be a function of axial coordinatez to mimic a structuredpore. As zeolites are periodic structures, the tube radius is assumed to be a periodicfunction ofz:
σt(z) = σt,0 +∆σt sin
(2πzλ
)(4.6)
The parameterλ determines the periodicity of the tube,σt,0 the average tube radius,and∆σt the variation in the tube radius.
The simulation are carried out using a conventional leapfrog algorithm29 in themicrocanonical ensemble (i.e. at constant energy). For the integration, a step size of2 ps proved to be sufficiently small in order to achieve a constant total energy of the
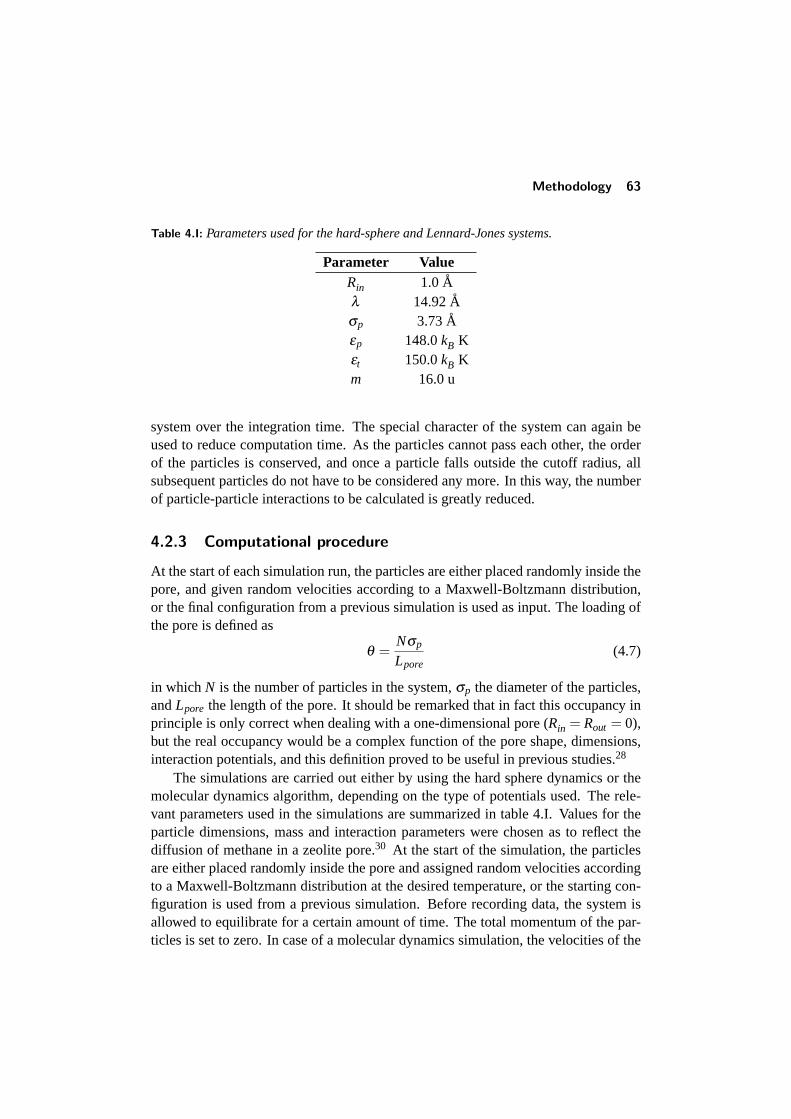
Methodology 63
Table 4.I: Parameters used for the hard-sphere and Lennard-Jones systems.
Parameter ValueRin 1.0Aλ 14.92Aσp 3.73Aεp 148.0kB Kεt 150.0kB Km 16.0 u
system over the integration time. The special character of the system can again beused to reduce computation time. As the particles cannot pass each other, the orderof the particles is conserved, and once a particle falls outside the cutoff radius, allsubsequent particles do not have to be considered any more. In this way, the numberof particle-particle interactions to be calculated is greatly reduced.
4.2.3 Computational procedure
At the start of each simulation run, the particles are either placed randomly inside thepore, and given random velocities according to a Maxwell-Boltzmann distribution,or the final configuration from a previous simulation is used as input. The loading ofthe pore is defined as
θ =Nσp
Lpore(4.7)
in which N is the number of particles in the system,σp the diameter of the particles,andLpore the length of the pore. It should be remarked that in fact this occupancy inprinciple is only correct when dealing with a one-dimensional pore (Rin = Rout = 0),but the real occupancy would be a complex function of the pore shape, dimensions,interaction potentials, and this definition proved to be useful in previous studies.28
The simulations are carried out either by using the hard sphere dynamics or themolecular dynamics algorithm, depending on the type of potentials used. The rele-vant parameters used in the simulations are summarized in table 4.I. Values for theparticle dimensions, mass and interaction parameters were chosen as to reflect thediffusion of methane in a zeolite pore.30 At the start of the simulation, the particlesare either placed randomly inside the pore and assigned random velocities accordingto a Maxwell-Boltzmann distribution at the desired temperature, or the starting con-figuration is used from a previous simulation. Before recording data, the system isallowed to equilibrate for a certain amount of time. The total momentum of the par-ticles is set to zero. In case of a molecular dynamics simulation, the velocities of the
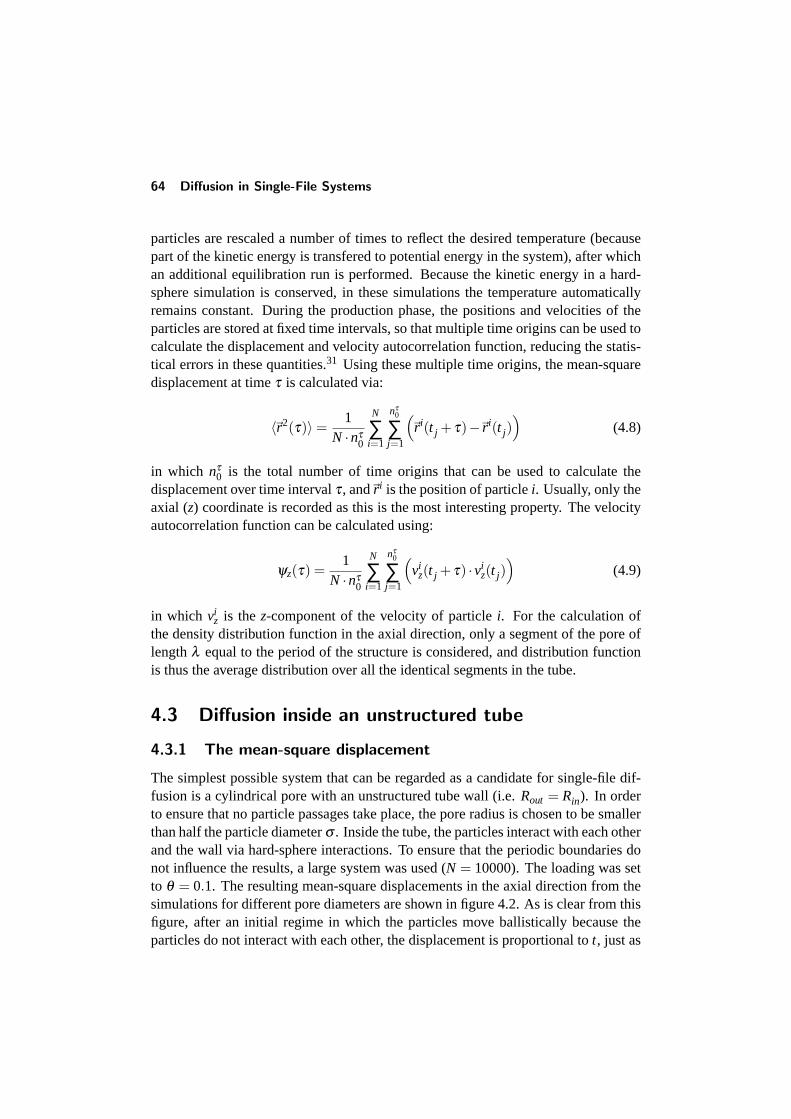
64 Diffusion in Single-File Systems
particles are rescaled a number of times to reflect the desired temperature (becausepart of the kinetic energy is transfered to potential energy in the system), after whichan additional equilibration run is performed. Because the kinetic energy in a hard-sphere simulation is conserved, in these simulations the temperature automaticallyremains constant. During the production phase, the positions and velocities of theparticles are stored at fixed time intervals, so that multiple time origins can be used tocalculate the displacement and velocity autocorrelation function, reducing the statis-tical errors in these quantities.31 Using these multiple time origins, the mean-squaredisplacement at timeτ is calculated via:
〈~r2(τ)〉=1
N ·nτ0
N
∑i=1
nτ0
∑j=1
(~r i(t j + τ)−~r i(t j)
)(4.8)
in which nτ0 is the total number of time origins that can be used to calculate the
displacement over time intervalτ, and~r i is the position of particlei. Usually, only theaxial (z) coordinate is recorded as this is the most interesting property. The velocityautocorrelation function can be calculated using:
ψz(τ) =1
N ·nτ0
N
∑i=1
nτ0
∑j=1
(vi
z(t j + τ) ·viz(t j)
)(4.9)
in which viz is thez-component of the velocity of particlei. For the calculation of
the density distribution function in the axial direction, only a segment of the pore oflengthλ equal to the period of the structure is considered, and distribution functionis thus the average distribution over all the identical segments in the tube.
4.3 Diffusion inside an unstructured tube
4.3.1 The mean-square displacement
The simplest possible system that can be regarded as a candidate for single-file dif-fusion is a cylindrical pore with an unstructured tube wall (i.e.Rout = Rin). In orderto ensure that no particle passages take place, the pore radius is chosen to be smallerthan half the particle diameterσ . Inside the tube, the particles interact with each otherand the wall via hard-sphere interactions. To ensure that the periodic boundaries donot influence the results, a large system was used (N = 10000). The loading was setto θ = 0.1. The resulting mean-square displacements in the axial direction from thesimulations for different pore diameters are shown in figure 4.2. As is clear from thisfigure, after an initial regime in which the particles move ballistically because theparticles do not interact with each other, the displacement is proportional tot, just as
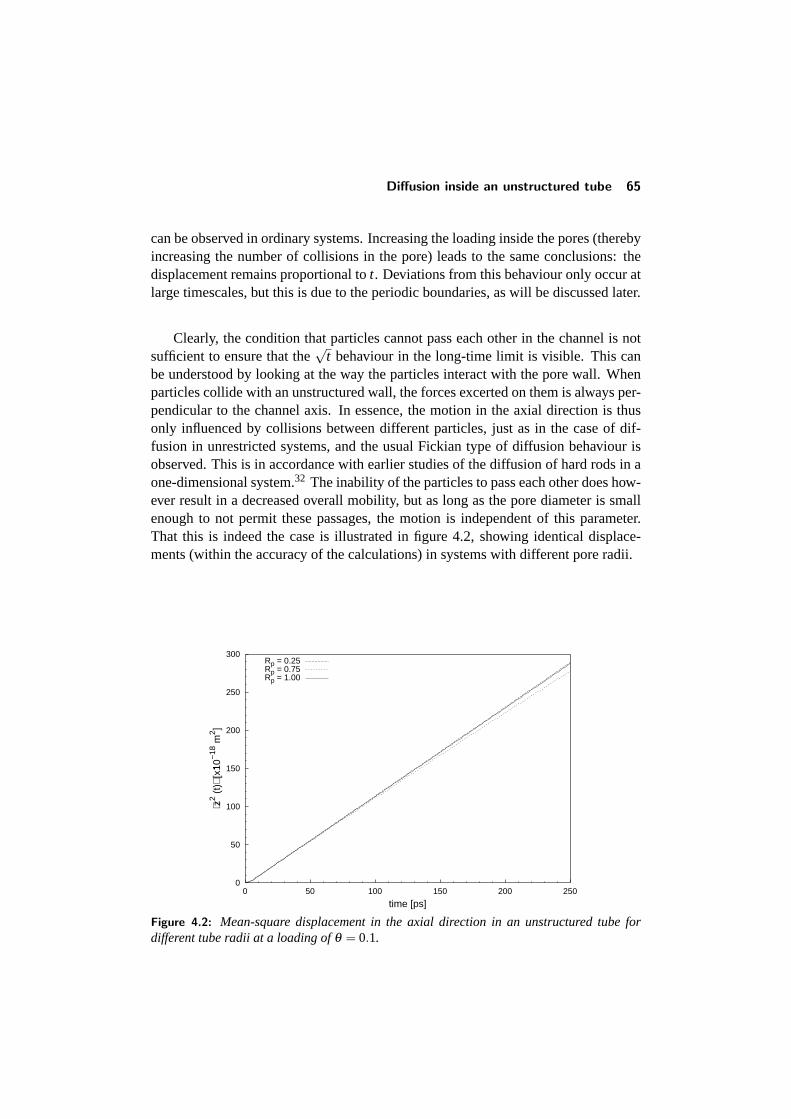
Diffusion inside an unstructured tube 65
can be observed in ordinary systems. Increasing the loading inside the pores (therebyincreasing the number of collisions in the pore) leads to the same conclusions: thedisplacement remains proportional tot. Deviations from this behaviour only occur atlarge timescales, but this is due to the periodic boundaries, as will be discussed later.
Clearly, the condition that particles cannot pass each other in the channel is notsufficient to ensure that the
√t behaviour in the long-time limit is visible. This can
be understood by looking at the way the particles interact with the pore wall. Whenparticles collide with an unstructured wall, the forces excerted on them is always per-pendicular to the channel axis. In essence, the motion in the axial direction is thusonly influenced by collisions between different particles, just as in the case of dif-fusion in unrestricted systems, and the usual Fickian type of diffusion behaviour isobserved. This is in accordance with earlier studies of the diffusion of hard rods in aone-dimensional system.32 The inability of the particles to pass each other does how-ever result in a decreased overall mobility, but as long as the pore diameter is smallenough to not permit these passages, the motion is independent of this parameter.That this is indeed the case is illustrated in figure 4.2, showing identical displace-ments (within the accuracy of the calculations) in systems with different pore radii.
0
50
100
150
200
250
300
0 50 100 150 200 250
⟨z2 (
t)⟩ [
x10
�
−18
m2 ]
time [ps]
Rp = 0.25Rp = 0.75Rp = 1.00
Figure 4.2: Mean-square displacement in the axial direction in an unstructured tube fordifferent tube radii at a loading ofθ = 0.1.
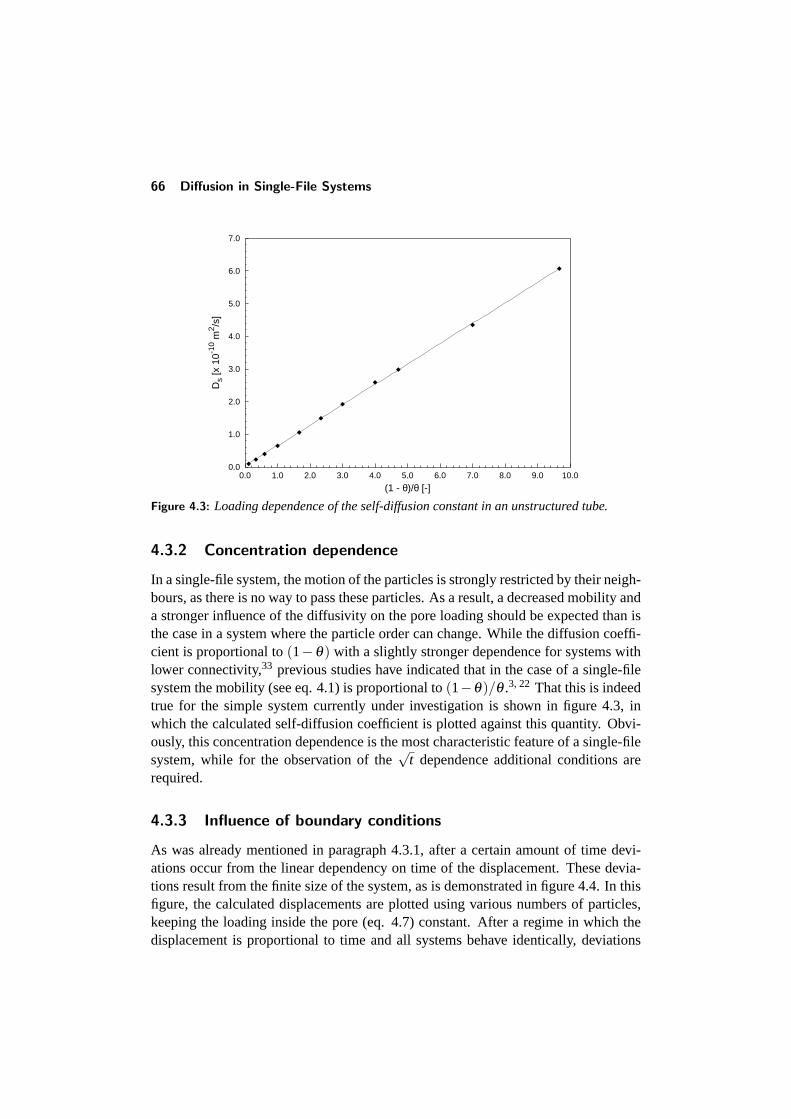
66 Diffusion in Single-File Systems
0.0
1.0
2.0
3.0
4.0
5.0
6.0
7.0
0.0 1.0 2.0 3.0 4.0 5.0 6.0 7.0 8.0 9.0 10.0
Ds
[x 1
0-10 m
2 /s]
(1 - θ)/θ [-]
Figure 4.3: Loading dependence of the self-diffusion constant in an unstructured tube.
4.3.2 Concentration dependence
In a single-file system, the motion of the particles is strongly restricted by their neigh-bours, as there is no way to pass these particles. As a result, a decreased mobility anda stronger influence of the diffusivity on the pore loading should be expected than isthe case in a system where the particle order can change. While the diffusion coeffi-cient is proportional to(1−θ) with a slightly stronger dependence for systems withlower connectivity,33 previous studies have indicated that in the case of a single-filesystem the mobility (see eq. 4.1) is proportional to(1−θ)/θ .3, 22 That this is indeedtrue for the simple system currently under investigation is shown in figure 4.3, inwhich the calculated self-diffusion coefficient is plotted against this quantity. Obvi-ously, this concentration dependence is the most characteristic feature of a single-filesystem, while for the observation of the
√t dependence additional conditions are
required.
4.3.3 Influence of boundary conditions
As was already mentioned in paragraph 4.3.1, after a certain amount of time devi-ations occur from the linear dependency on time of the displacement. These devia-tions result from the finite size of the system, as is demonstrated in figure 4.4. In thisfigure, the calculated displacements are plotted using various numbers of particles,keeping the loading inside the pore (eq. 4.7) constant. After a regime in which thedisplacement is proportional to time and all systems behave identically, deviations
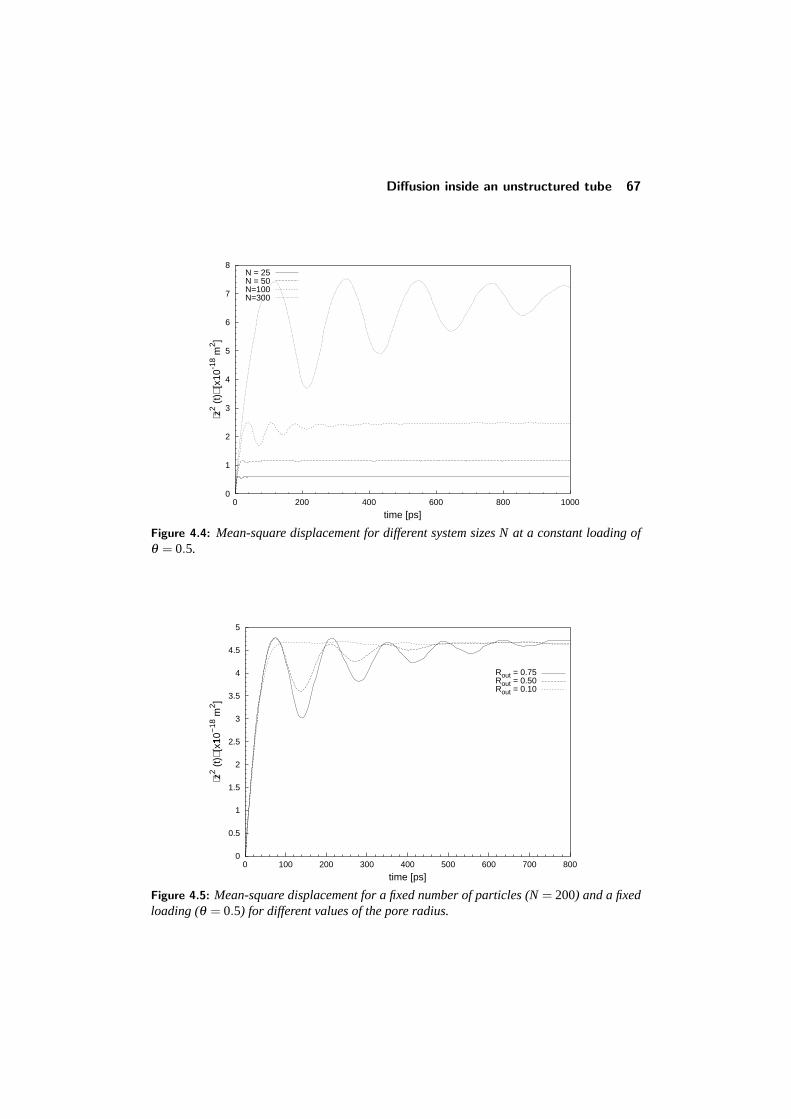
Diffusion inside an unstructured tube 67
0
1
2
3
4
5
6
7
8
0 200 400 600 800 1000
⟨z2 (
t)⟩ [
x10-1
8 m2 ]
time [ps]
N = 25N = 50N=100N=300
Figure 4.4: Mean-square displacement for different system sizes N at a constant loading ofθ = 0.5.
0
0.5
1
1.5
2
2.5
3
3.5
4
4.5
5
0 100 200 300 400 500 600 700 800
⟨z2 (
t)⟩ [
x10
�
−18
m2 ]
time [ps]
Rout = 0.75Rout = 0.50Rout = 0.10
Figure 4.5: Mean-square displacement for a fixed number of particles (N= 200) and a fixedloading (θ = 0.5) for different values of the pore radius.
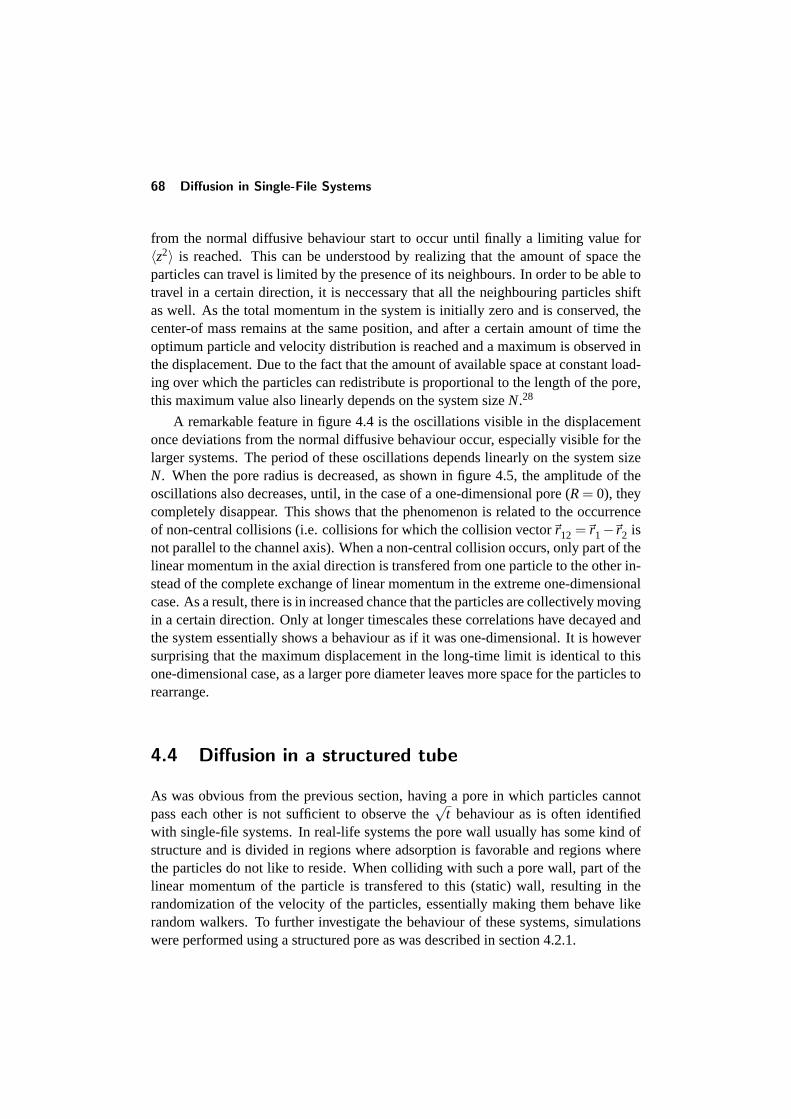
68 Diffusion in Single-File Systems
from the normal diffusive behaviour start to occur until finally a limiting value for〈z2〉 is reached. This can be understood by realizing that the amount of space theparticles can travel is limited by the presence of its neighbours. In order to be able totravel in a certain direction, it is neccessary that all the neighbouring particles shiftas well. As the total momentum in the system is initially zero and is conserved, thecenter-of mass remains at the same position, and after a certain amount of time theoptimum particle and velocity distribution is reached and a maximum is observed inthe displacement. Due to the fact that the amount of available space at constant load-ing over which the particles can redistribute is proportional to the length of the pore,this maximum value also linearly depends on the system sizeN.28
A remarkable feature in figure 4.4 is the oscillations visible in the displacementonce deviations from the normal diffusive behaviour occur, especially visible for thelarger systems. The period of these oscillations depends linearly on the system sizeN. When the pore radius is decreased, as shown in figure 4.5, the amplitude of theoscillations also decreases, until, in the case of a one-dimensional pore (R= 0), theycompletely disappear. This shows that the phenomenon is related to the occurrenceof non-central collisions (i.e. collisions for which the collision vector~r12 =~r1−~r2 isnot parallel to the channel axis). When a non-central collision occurs, only part of thelinear momentum in the axial direction is transfered from one particle to the other in-stead of the complete exchange of linear momentum in the extreme one-dimensionalcase. As a result, there is in increased chance that the particles are collectively movingin a certain direction. Only at longer timescales these correlations have decayed andthe system essentially shows a behaviour as if it was one-dimensional. It is howeversurprising that the maximum displacement in the long-time limit is identical to thisone-dimensional case, as a larger pore diameter leaves more space for the particles torearrange.
4.4 Diffusion in a structured tube
As was obvious from the previous section, having a pore in which particles cannotpass each other is not sufficient to observe the
√t behaviour as is often identified
with single-file systems. In real-life systems the pore wall usually has some kind ofstructure and is divided in regions where adsorption is favorable and regions wherethe particles do not like to reside. When colliding with such a pore wall, part of thelinear momentum of the particle is transfered to this (static) wall, resulting in therandomization of the velocity of the particles, essentially making them behave likerandom walkers. To further investigate the behaviour of these systems, simulationswere performed using a structured pore as was described in section 4.2.1.
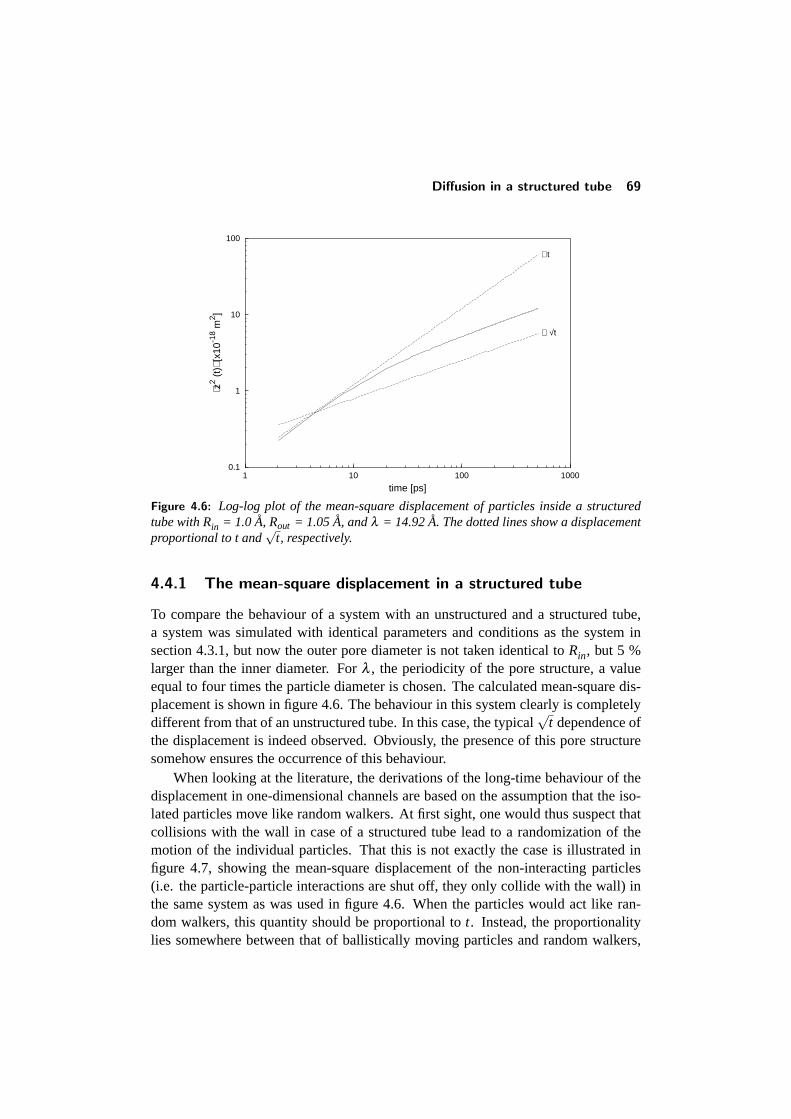
Diffusion in a structured tube 69
0.1
1
10
100
1 10 100 1000
⟨z2 (
t)⟩ [
x10-1
8 m2 ]
time [ps]
∝ √t
∝t
Figure 4.6: Log-log plot of the mean-square displacement of particles inside a structuredtube with Rin = 1.0 A, Rout = 1.05 A, andλ = 14.92A. The dotted lines show a displacementproportional to t and
√t, respectively.
4.4.1 The mean-square displacement in a structured tube
To compare the behaviour of a system with an unstructured and a structured tube,a system was simulated with identical parameters and conditions as the system insection 4.3.1, but now the outer pore diameter is not taken identical toRin, but 5 %larger than the inner diameter. Forλ , the periodicity of the pore structure, a valueequal to four times the particle diameter is chosen. The calculated mean-square dis-placement is shown in figure 4.6. The behaviour in this system clearly is completelydifferent from that of an unstructured tube. In this case, the typical
√t dependence of
the displacement is indeed observed. Obviously, the presence of this pore structuresomehow ensures the occurrence of this behaviour.
When looking at the literature, the derivations of the long-time behaviour of thedisplacement in one-dimensional channels are based on the assumption that the iso-lated particles move like random walkers. At first sight, one would thus suspect thatcollisions with the wall in case of a structured tube lead to a randomization of themotion of the individual particles. That this is not exactly the case is illustrated infigure 4.7, showing the mean-square displacement of the non-interacting particles(i.e. the particle-particle interactions are shut off, they only collide with the wall) inthe same system as was used in figure 4.6. When the particles would act like ran-dom walkers, this quantity should be proportional tot. Instead, the proportionalitylies somewhere between that of ballistically moving particles and random walkers,
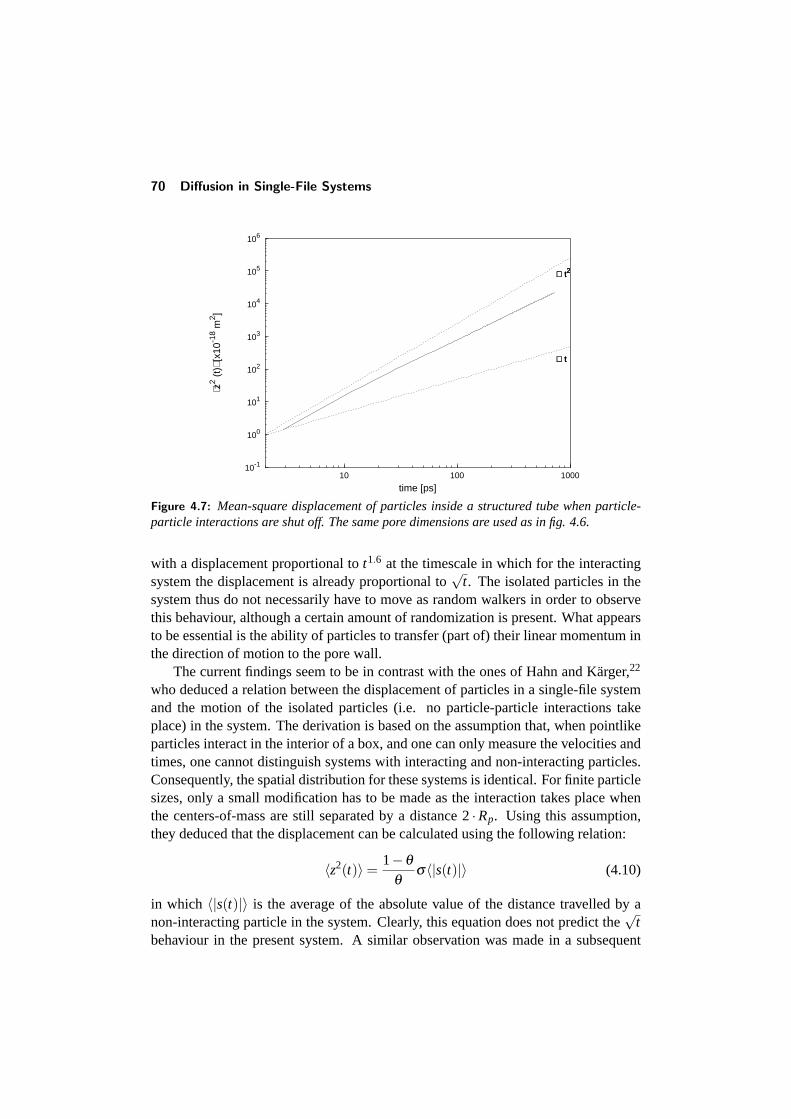
70 Diffusion in Single-File Systems
10-1
100
101
102
103
104
105
106
10 100 1000
⟨z2 (
t)⟩ [
x10-1
8 m2 ]
time [ps]
∝ t2
∝ t
∝ t2
∝ t
∝ t2
∝ t
Figure 4.7: Mean-square displacement of particles inside a structured tube when particle-particle interactions are shut off. The same pore dimensions are used as in fig. 4.6.
with a displacement proportional tot1.6 at the timescale in which for the interactingsystem the displacement is already proportional to
√t. The isolated particles in the
system thus do not necessarily have to move as random walkers in order to observethis behaviour, although a certain amount of randomization is present. What appearsto be essential is the ability of particles to transfer (part of) their linear momentum inthe direction of motion to the pore wall.
The current findings seem to be in contrast with the ones of Hahn and Karger,22
who deduced a relation between the displacement of particles in a single-file systemand the motion of the isolated particles (i.e. no particle-particle interactions takeplace) in the system. The derivation is based on the assumption that, when pointlikeparticles interact in the interior of a box, and one can only measure the velocities andtimes, one cannot distinguish systems with interacting and non-interacting particles.Consequently, the spatial distribution for these systems is identical. For finite particlesizes, only a small modification has to be made as the interaction takes place whenthe centers-of-mass are still separated by a distance 2·Rp. Using this assumption,they deduced that the displacement can be calculated using the following relation:
〈z2(t)〉=1−θ
θσ〈|s(t)|〉 (4.10)
in which 〈|s(t)|〉 is the average of the absolute value of the distance travelled by anon-interacting particle in the system. Clearly, this equation does not predict the
√t
behaviour in the present system. A similar observation was made in a subsequent
Diffusion in a structured tube 71
0.230
0.235
0.240
0.245
0.250
0.255
0.260
0.265
0.270
0 2 4 6 8 10 12 14
dens
ity d
istr
ibut
ion
func
tion
[−]
�
z [Å]
interacting particlesnon−interacting particles
Figure 4.8: A comparison of the density distribution as a function of the axial coordinate zfor a system with and without particle-particle interactions using Rin = 1.0, Rout = 1.05, andλ = 14.92A.
article published by Hahn and Karger28 for the diffusion of spheres in a single-filetube structured by a periodic potential. They attribute this to the coupling betweenthe longitudinal and transverse degrees of freedom of the particles in the case of astructured tube, resulting in a particle velocity that only quasiperiodically varies withtime. In the derivation of eq. 4.10, these effects are not accounted for as a truly one-dimensional system is used. That the single-file behaviour is still observed in thesesystem can, according to these authors, be attributed to the random disturbance ofthe interactions with the tube by particle-particle interactions at random positions. Inthe present system, these particle-particle collisions and collisions with the tube wallare completely separated, and the latter interactions only result in the reversal of thevelocity in either the longitudinal or transverse direction. In this case, the interac-tions with the wall thus do not lead to a coupling between the degrees of freedom inthe transverse and longitudinal direction. Still, the occurrence of these collisions issufficient to observe the single-file behaviour in a system with interacting particles.
The present simulations clearly show that it is only the combined effect of bothparticle-particle and particle-pore wall interactions that determines the dependenceof the mean-square displacement on time. When interacting particles move in an un-structured tube, particle-particle collisions cause them to behave like random walkerswith a mean-square displacement proportional tot. The additional ability of the par-ticles to transfer linear momentum in the axial direction to (or from) the pore wallensures that single-file behaviour occurs, although these collisions themselves do not
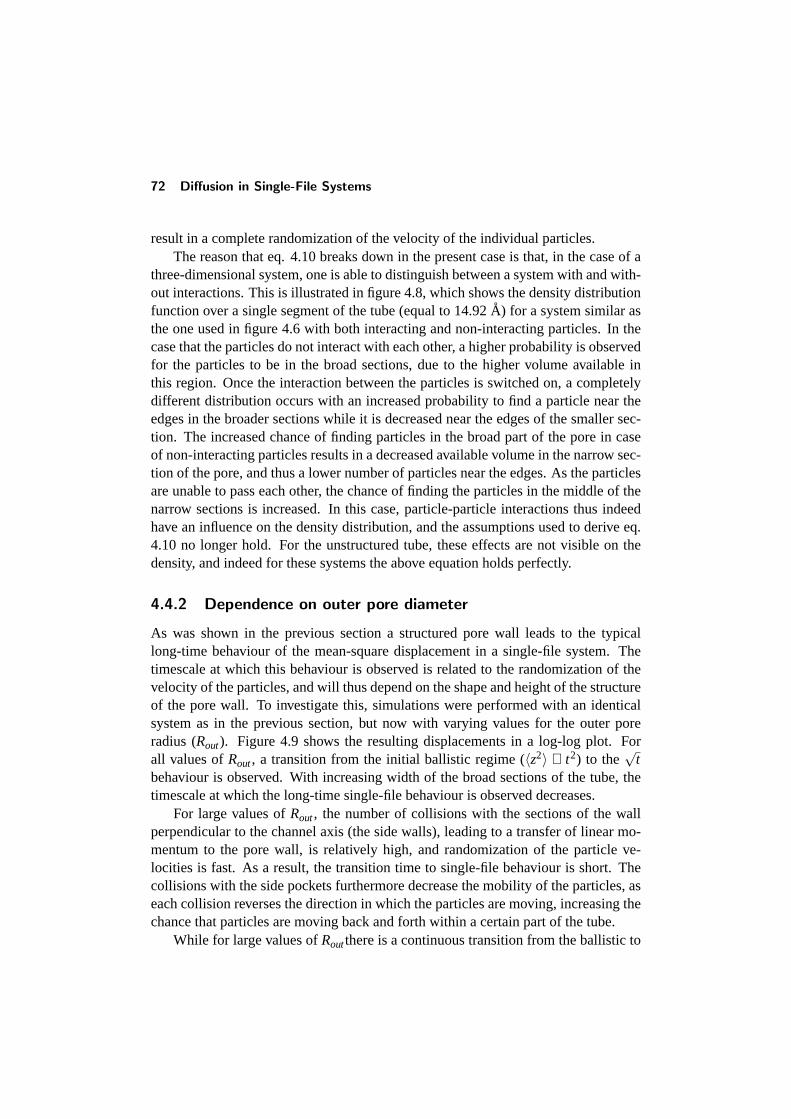
72 Diffusion in Single-File Systems
result in a complete randomization of the velocity of the individual particles.The reason that eq. 4.10 breaks down in the present case is that, in the case of a
three-dimensional system, one is able to distinguish between a system with and with-out interactions. This is illustrated in figure 4.8, which shows the density distributionfunction over a single segment of the tube (equal to 14.92A) for a system similar asthe one used in figure 4.6 with both interacting and non-interacting particles. In thecase that the particles do not interact with each other, a higher probability is observedfor the particles to be in the broad sections, due to the higher volume available inthis region. Once the interaction between the particles is switched on, a completelydifferent distribution occurs with an increased probability to find a particle near theedges in the broader sections while it is decreased near the edges of the smaller sec-tion. The increased chance of finding particles in the broad part of the pore in caseof non-interacting particles results in a decreased available volume in the narrow sec-tion of the pore, and thus a lower number of particles near the edges. As the particlesare unable to pass each other, the chance of finding the particles in the middle of thenarrow sections is increased. In this case, particle-particle interactions thus indeedhave an influence on the density distribution, and the assumptions used to derive eq.4.10 no longer hold. For the unstructured tube, these effects are not visible on thedensity, and indeed for these systems the above equation holds perfectly.
4.4.2 Dependence on outer pore diameter
As was shown in the previous section a structured pore wall leads to the typicallong-time behaviour of the mean-square displacement in a single-file system. Thetimescale at which this behaviour is observed is related to the randomization of thevelocity of the particles, and will thus depend on the shape and height of the structureof the pore wall. To investigate this, simulations were performed with an identicalsystem as in the previous section, but now with varying values for the outer poreradius (Rout). Figure 4.9 shows the resulting displacements in a log-log plot. Forall values ofRout, a transition from the initial ballistic regime (〈z2〉 ∝ t2) to the
√t
behaviour is observed. With increasing width of the broad sections of the tube, thetimescale at which the long-time single-file behaviour is observed decreases.
For large values ofRout, the number of collisions with the sections of the wallperpendicular to the channel axis (the side walls), leading to a transfer of linear mo-mentum to the pore wall, is relatively high, and randomization of the particle ve-locities is fast. As a result, the transition time to single-file behaviour is short. Thecollisions with the side pockets furthermore decrease the mobility of the particles, aseach collision reverses the direction in which the particles are moving, increasing thechance that particles are moving back and forth within a certain part of the tube.
While for large values ofRoutthere is a continuous transition from the ballistic to
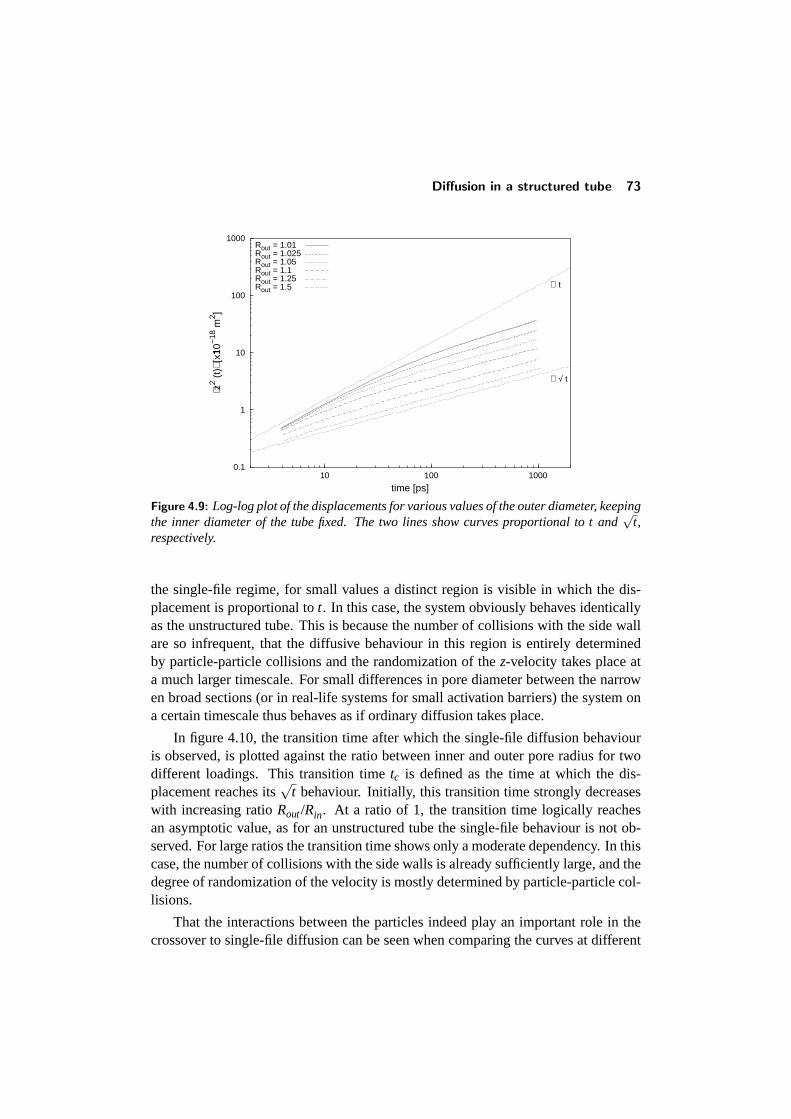
Diffusion in a structured tube 73
0.1
1
10
100
1000
10 100 1000
⟨z2 (
t)⟩ [
x10
�
−18
m2 ]
time [ps]
∝ t
∝ √ t
Rout = 1.01Rout = 1.025Rout = 1.05Rout = 1.1Rout = 1.25Rout = 1.5
Figure 4.9: Log-log plot of the displacements for various values of the outer diameter, keepingthe inner diameter of the tube fixed. The two lines show curves proportional to t and
√t,
respectively.
the single-file regime, for small values a distinct region is visible in which the dis-placement is proportional tot. In this case, the system obviously behaves identicallyas the unstructured tube. This is because the number of collisions with the side wallare so infrequent, that the diffusive behaviour in this region is entirely determinedby particle-particle collisions and the randomization of thez-velocity takes place ata much larger timescale. For small differences in pore diameter between the narrowen broad sections (or in real-life systems for small activation barriers) the system ona certain timescale thus behaves as if ordinary diffusion takes place.
In figure 4.10, the transition time after which the single-file diffusion behaviouris observed, is plotted against the ratio between inner and outer pore radius for twodifferent loadings. This transition timetc is defined as the time at which the dis-placement reaches its
√t behaviour. Initially, this transition time strongly decreases
with increasing ratioRout/Rin. At a ratio of 1, the transition time logically reachesan asymptotic value, as for an unstructured tube the single-file behaviour is not ob-served. For large ratios the transition time shows only a moderate dependency. In thiscase, the number of collisions with the side walls is already sufficiently large, and thedegree of randomization of the velocity is mostly determined by particle-particle col-lisions.
That the interactions between the particles indeed play an important role in thecrossover to single-file diffusion can be seen when comparing the curves at different
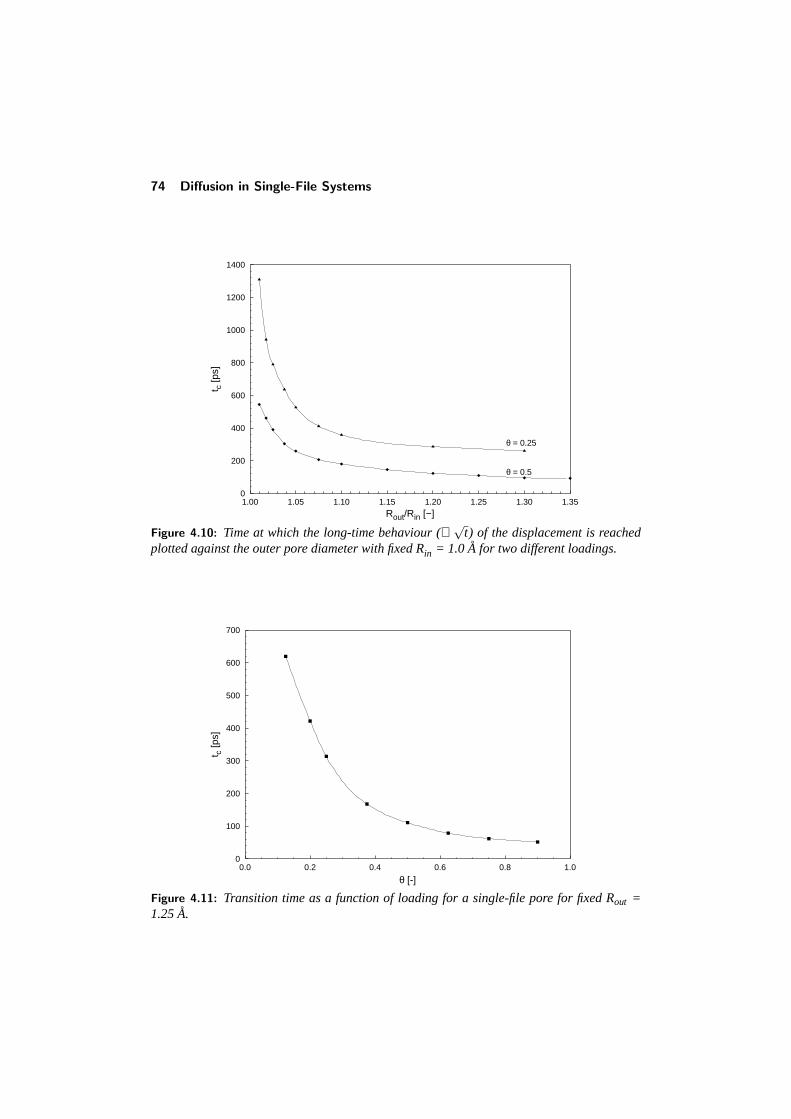
74 Diffusion in Single-File Systems
0
200
400
600
800
1000
1200
1400
1.00 1.05 1.10 1.15 1.20 1.25 1.30 1.35
t c [p
s]
Rout/Rin [−]
θ = 0.25
θ = 0.5
Figure 4.10: Time at which the long-time behaviour (∝√
t) of the displacement is reachedplotted against the outer pore diameter with fixed Rin = 1.0 A for two different loadings.
0
100
200
300
400
500
600
700
0.0 0.2 0.4 0.6 0.8 1.0
t c [p
s]
θ [-]
Figure 4.11: Transition time as a function of loading for a single-file pore for fixed Rout =1.25A.
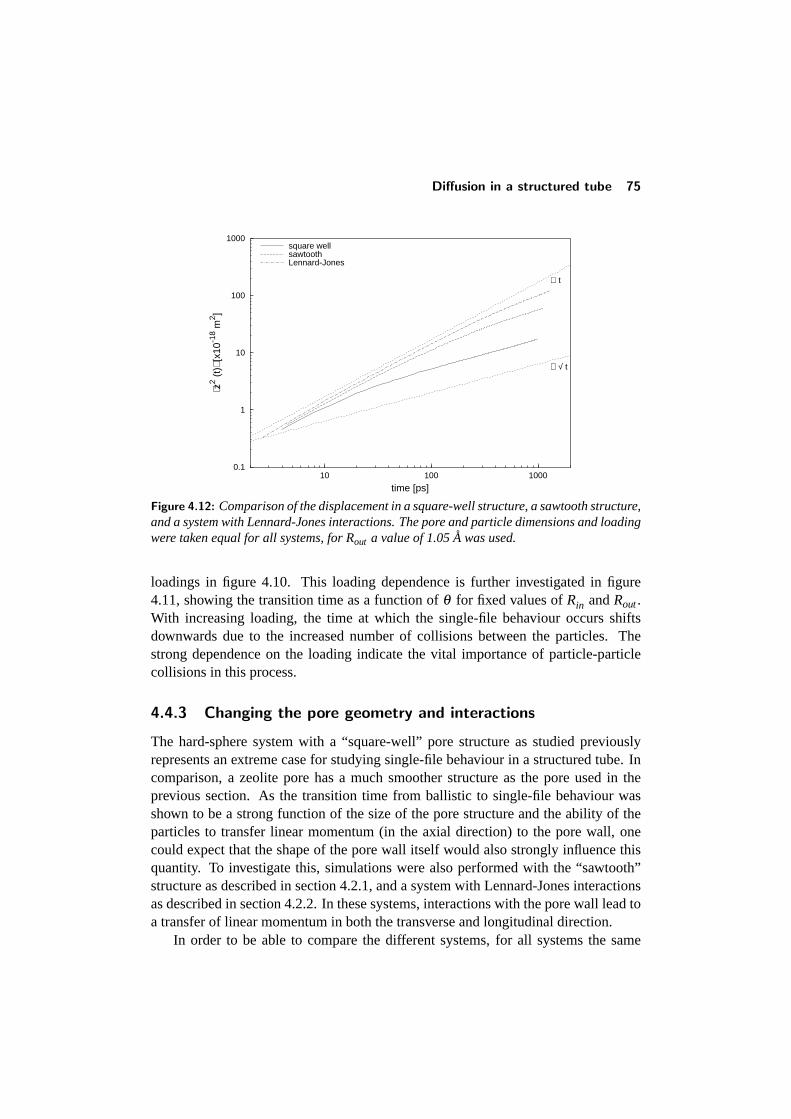
Diffusion in a structured tube 75
0.1
1
10
100
1000
10 100 1000
⟨z2 (
t)⟩ [
x10-1
8 m2 ]
time [ps]
∝ t
∝ √ t
square wellsawtoothLennard-Jones
Figure 4.12: Comparison of the displacement in a square-well structure, a sawtooth structure,and a system with Lennard-Jones interactions. The pore and particle dimensions and loadingwere taken equal for all systems, for Rout a value of 1.05A was used.
loadings in figure 4.10. This loading dependence is further investigated in figure4.11, showing the transition time as a function ofθ for fixed values ofRin andRout.With increasing loading, the time at which the single-file behaviour occurs shiftsdownwards due to the increased number of collisions between the particles. Thestrong dependence on the loading indicate the vital importance of particle-particlecollisions in this process.
4.4.3 Changing the pore geometry and interactions
The hard-sphere system with a “square-well” pore structure as studied previouslyrepresents an extreme case for studying single-file behaviour in a structured tube. Incomparison, a zeolite pore has a much smoother structure as the pore used in theprevious section. As the transition time from ballistic to single-file behaviour wasshown to be a strong function of the size of the pore structure and the ability of theparticles to transfer linear momentum (in the axial direction) to the pore wall, onecould expect that the shape of the pore wall itself would also strongly influence thisquantity. To investigate this, simulations were also performed with the “sawtooth”structure as described in section 4.2.1, and a system with Lennard-Jones interactionsas described in section 4.2.2. In these systems, interactions with the pore wall lead toa transfer of linear momentum in both the transverse and longitudinal direction.
In order to be able to compare the different systems, for all systems the same
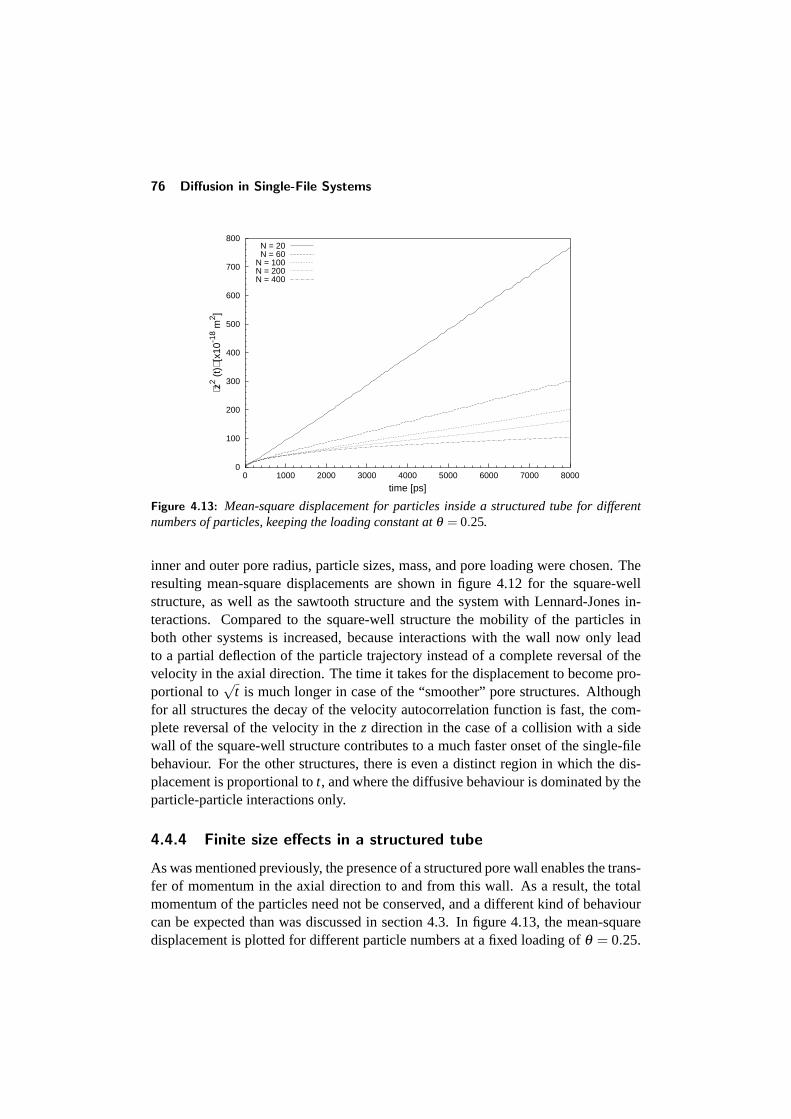
76 Diffusion in Single-File Systems
0
100
200
300
400
500
600
700
800
0 1000 2000 3000 4000 5000 6000 7000 8000
⟨z2 (
t)⟩ [
x10-1
8 m2 ]
time [ps]
N = 20N = 60
N = 100N = 200N = 400
Figure 4.13: Mean-square displacement for particles inside a structured tube for differentnumbers of particles, keeping the loading constant atθ = 0.25.
inner and outer pore radius, particle sizes, mass, and pore loading were chosen. Theresulting mean-square displacements are shown in figure 4.12 for the square-wellstructure, as well as the sawtooth structure and the system with Lennard-Jones in-teractions. Compared to the square-well structure the mobility of the particles inboth other systems is increased, because interactions with the wall now only leadto a partial deflection of the particle trajectory instead of a complete reversal of thevelocity in the axial direction. The time it takes for the displacement to become pro-portional to
√t is much longer in case of the “smoother” pore structures. Although
for all structures the decay of the velocity autocorrelation function is fast, the com-plete reversal of the velocity in thez direction in the case of a collision with a sidewall of the square-well structure contributes to a much faster onset of the single-filebehaviour. For the other structures, there is even a distinct region in which the dis-placement is proportional tot, and where the diffusive behaviour is dominated by theparticle-particle interactions only.
4.4.4 Finite size effects in a structured tube
As was mentioned previously, the presence of a structured pore wall enables the trans-fer of momentum in the axial direction to and from this wall. As a result, the totalmomentum of the particles need not be conserved, and a different kind of behaviourcan be expected than was discussed in section 4.3. In figure 4.13, the mean-squaredisplacement is plotted for different particle numbers at a fixed loading ofθ = 0.25.
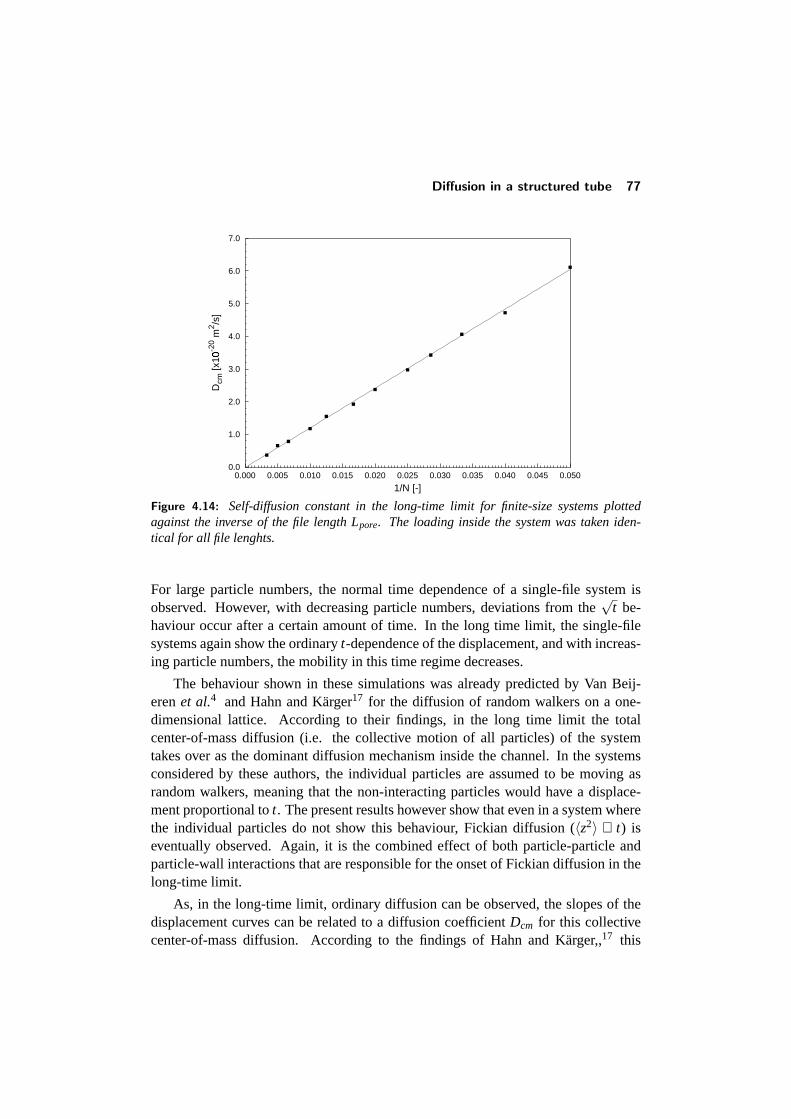
Diffusion in a structured tube 77
0.0
1.0
2.0
3.0
4.0
5.0
6.0
7.0
0.000 0.005 0.010 0.015 0.020 0.025 0.030 0.035 0.040 0.045 0.050
Dcm
[x10
� -20 m
2 /s]
1/N [-]
Figure 4.14: Self-diffusion constant in the long-time limit for finite-size systems plottedagainst the inverse of the file length Lpore. The loading inside the system was taken iden-tical for all file lenghts.
For large particle numbers, the normal time dependence of a single-file system isobserved. However, with decreasing particle numbers, deviations from the
√t be-
haviour occur after a certain amount of time. In the long time limit, the single-filesystems again show the ordinaryt-dependence of the displacement, and with increas-ing particle numbers, the mobility in this time regime decreases.
The behaviour shown in these simulations was already predicted by Van Beij-erenet al.4 and Hahn and Karger17 for the diffusion of random walkers on a one-dimensional lattice. According to their findings, in the long time limit the totalcenter-of-mass diffusion (i.e. the collective motion of all particles) of the systemtakes over as the dominant diffusion mechanism inside the channel. In the systemsconsidered by these authors, the individual particles are assumed to be moving asrandom walkers, meaning that the non-interacting particles would have a displace-ment proportional tot. The present results however show that even in a system wherethe individual particles do not show this behaviour, Fickian diffusion (〈z2〉 ∝ t) iseventually observed. Again, it is the combined effect of both particle-particle andparticle-wall interactions that are responsible for the onset of Fickian diffusion in thelong-time limit.
As, in the long-time limit, ordinary diffusion can be observed, the slopes of thedisplacement curves can be related to a diffusion coefficientDcm for this collectivecenter-of-mass diffusion. According to the findings of Hahn and Karger,,17 this
78 Diffusion in Single-File Systems
center-of-mass diffusivity should be inversely proportional to the pore lengthLpore
(or, equally, the system sizeN). The calculated diffusivities for the hard-sphere sys-tem are plotted in figure 4.14 versus this system sizeN. As can be seen from this plot,the predicted dependency is clearly met. The decreased mobility with increasing sys-tem size is due to the fact that a shift of the center-of-mass requires the particles tomove in a correlated fashion, which will be more difficult when the number of parti-cles in the system increases. Although in this case periodic boundary conditions areused instead of open systems, similar behaviour can be expected as a system with pe-riodic boundary conditions can be regarded as an open system which is in continuousequilibrium with the gas phase, and in which readsorption at the pore boundaries isinfinitely fast. The present results provide a strong proof for the conclusions of Nel-son and Auerbach18 that, in contrast to the suggestion made by MacElroy and Suh,34
the diffusivity in the long-time limit for finite systems is proportional to 1/N insteadof 1/
√N.
4.5 Implications and conclusions
Although the system of hard spheres in a narrow cylindrical pore itself is quite simple,the diffusion in these systems shows complex behaviour. The mean-square displace-ment, one of the important quantities to measure the mobility in a system, is stronglydetermined by the different parameters that make up the system. It is however dif-ficult to find a description of the dynamic behaviour due to the three-dimensionalnature of the problem, combined with the confinement of the particles in a restrictedgeometry. Therefore, the simulations presented here provide a useful way to investi-gate this.
If the pore wall is smooth, without any corrugations, Fickian diffusion is observedeven when the particles are unable to pass each other. Systems that are commonly re-ferred to as single-file systems (i.e. a system in which the particle order is conserved)thus do not necessarily have to show the typical
√t behaviour of the displacement in
the long-time limit. A characteristic feature of these systems is however the strongdependence on the concentration of particles in the pore due to the strong correla-tions between particles in the system. The characteristic loading dependence of thediffusivity associated with these systems,Ds ∝ (1−θ)/θ , is indeed observed in theunstructured tube and appears to be the most characteristic feature for systems inwhich particles cannot pass each other.
When the pore wall is corrugated, enabling the transfer of linear momentum in theaxial direction to the pore wall, the single-file behaviour of〈z2(t)〉 is indeed observedafter a certain amount of time. Although the predictions of single-file behaviour usu-ally assume that the individual particles in absence of particle-particle interactions
Implications and conclusions 79
move like random walkers, the present study shows that this is not necessary. Al-though a certain amount of decorrelation takes place due to collisions with the porewall, the particle velocity is not completely randomized by these events. What ap-pears to be essential for the observation of the characteristic
√t dependence is that
particles are able to transfer linear momentum in the axial direction to the pore wall.The combined effect of particle-particle and particle-wall interactions eventually isresponsible for single-file behaviour, while it is difficult to separate these two con-tributions. This is furthermore illustrated when comparing the density distributionfunctions of a system with interacting and one with non-interacting particles, wherethe structure combined with particle-particle interactions leads to a preference of theparticles to reside near the edges of the broad sections of the pore.
While in a tube without corrugations the dimensions of the pore are of little in-fluence to the mobility of the particles, in a structured tube the exact dimensions ofthe pore structure strongly affect the diffusivity. Both the mobility of the particles,as well as the time it takes to observe the single-file behaviour are strongly relatedto the ratio between the radius of the narrow and broad sections of the pore struc-ture. The ratio between these quantities determines the number of collisions withthe sections perpendicular to the pore axis, during which a transfer of linear momen-tum in thez-direction can take place. As a result, a larger chance of these collisionsresults in a more efficient transfer of momentum and an earlier transition to the
√t be-
haviour. When the number of collisions with these side walls is not too large (Rout isonly slightly larger thanRin) Fickian-type diffusion behaviour is visible over a longertimespan before the single-file behaviour sets in. That also the particle-particle inter-actions play a very important role in the transition to the
√t behaviour is shown by
the strong dependency of the transition time on the loading of the pore.
The influence of a finite pore length on the diffusive behaviour is again dependenton the exact geometry of the system. In the case of a cylindrical pore, the fact thatthe total linear momentum in the axial direction has to remain zero combined withthe limited amount of space available for the particles causes the displacement tobecome constant after a certain amount of time. This limiting value for the diffusivityis proportional to the number of particles in the system (or, as the loading remainsconstant, the length of the pore), in accordance with results found in previous studies.What is however interesting is the occurrence of oscillations in the displacement,which slowly decays until the limiting displacement is reached. As these oscillationsdisappear when the diameter of the pore decreases, these oscillations seem to berelated to the occurrence of non-central collisions. Possibly these type of collisionsresult in stronger correlations of the motion of the individual particles that slowlydecrease with time.
In a corrugated tube, the influence of periodic boundaries is completely different.
80 Diffusion in Single-File Systems
For finite system sizes, after a sufficient amount of time Fickian diffusion is againobserved. Again, the correlated motion of particles is responsible for this behaviour.In this case a shift of the total center-of-mass of the system is possible, as the totallinear momentum is no longer conserved due to collisions with the pore wall, and thecenter-of-mass diffusion becomes the dominant mechanism in the long-time limit.It is remarkable that although the isolated particles themselves do not show Fickianbehaviour, the entire system still shows this diffusive behaviour. This again indi-cates the importance of the combined influence of particle-particle and particle-wallinteractions. The center-of-mass diffusivity depends strongly on the system size, asthis mode of diffusion requires the particles to move collectively. In accordance withthe findings of Nelson and Auerbach,18 the diffusivity in this case is proportional tothe inverse of the system time, in contrast with the conclusions from MacElroy andSuh.34
Evidently, the present study shows that the observation of the long-time single-file behaviour of the displacement strongly depends on the timescale on which thisquantity is observed. For very small timescales, when particles do not yet interactwith each other, either ballistic motion or motion which is determined by the particle-wall interactions is observed. For systems in which the transfer of linear momentumto the pore wall is not too fast, a regime can then be observed in which the diffusionis essentially Fickian. After some time the long-time single-file behaviour, in which〈z2(t)〉 ∝
√t, finally sets in. The timescales at which this transitions take place all
strongly depend on the poreshape. For very smooth pore structures, the transition tosingle-file behaviour takes much longer. In general, one can expect the pore structureof zeolites to be quite smooth, and especially for the zeolites with larger pore sizes,the activation energies to be quite small. It is however difficult to directly relate thepresent results with the real world, as one cannot easily define energy barriers in thesystems used here. Furthermore, in real systems there is in additional contributionto the randomization of the particle velocities due to the thermal vibrations of thezeolite lattice.
In finite-size systems another transition takes place, after which Fickian diffusionis again observed. Again, the diffusivity in this regime is proportional to(1−θ/θ).The diffusivity in this regime furthermore strongly depends on the system size. Thisbehaviour is characteristic for the diffusion in single-file systems, and provides an-other way of showing its occurrence. As all zeolites in the real world are of finitelength, one should be able to study these effects using macroscopic experiments,for example by using the ZLC method or chromatographic experiments.35 If onewould thus be able to accurately control the size of the zeolite crystals (and the otherexperimental conditions), this would provide an indirect way of demonstrating thatsingle-file diffusion occurs in a certain system. On the other hand, these results show
References 81
that one should be careful with direct measurements of the displacement using PFG-NMR or QENS. Whether or not the single-file time dependency is observed dependson the timescale at which these measurements probe the displacement. If measure-ments are being performed on very short timescales in systems with moderate energybarriers, Fickian diffusion could in principle be observed. The same holds for mea-surements that take place on a longer timescale. The exact time regime in which the√
t dependency is indeed observed, strongly depends on the zeolite crystals used, andcan be furthermore complicated by imperfections in the crystals or similar effects.
4.6 References
1 E. J. Harris,Transport and accumulation in biological systems, Butterworths ScientificPublications, London (1960).
2 D. G. Levitt,Phys. Rev. A8(6), 3050–3054 (1973).3 P. A. Fedders,Phys. Rev. B17(1), 40–46 (1978).4 H. van Beijeren, K. W. Kehr, and R. Kutner,Phys. Rev. B28(10), 5711–5723 (1983).5 W. M. Meier and D. H. Olsen,Atlas of zeolite structure types, Butterworths-Heinemann,
London (1992).6 J. Karger, M. Petzold, H. Pfeifer, S. Ernst, and J. Weitkamp,J. Catal. 136, 283–299
(1992).7 J. Karger,Phys. Rev. A45(6), 4173–4174 (1992).8 J. Karger,Phys. Rev. E47(2), 1427–1428 (1993).9 V. Kukla, J. Kornatowski, D. Demuth, I. Girnus, H. Pfeifer, L. V. C. Rees, S. Schunk,
K. K. Unger, and J. Karger,Science272, 702–704 (1996).10 V. Gupta, S. S. Nivarthi, A. V. McCormick, and H. T. Davis,Chem. Phys. Lett.247,
596–600 (1995).11 K. Hahn, J. Karger, and V. Kukla,Phys. Rev. Lett.76(15), 2762–2765 (1996).12 H. Jobic, K. Hahn, J. Karger, M. Bee, A. Tuel, M. Noack, I. Girnus, and G. J. Kearley,J.
Phys. Chem. B.101(30), 5834–5841 (1997).13 H. J. K. Hahn and J. Karger,Phys. Rev. E59(6), 6662–6671 (1999).14 D. S. Sholl and K. A. Fichthorn,J. Chem. Phys.107(11), 4384–4389 (1997).15 H. L. Tepper, J. P. Hoogenboom, N. F. A. van der Vegt, and W. J. Briels,J. Chem. Phys.
110(23), 11511–11516 (1999).16 D. S. Sholl,Chem. Eng. J.74(1), 25–32 (1999).17 K. Hahn and J. Karger,J. Phys. Chem. B102(30), 5766–5771 (1998).18 P. H. Nelson and S. M. Auerbach,J. Chem. Phys110(18), 9235–9243 (1999).19 C. Rodenbeck and J. Karger,J. Chem. Phys.110(7), 1–11 (1999).20 D. S. Sholl and K. A. Fichthorn,Phys. Rev. Lett.79(19), 3569–3572 (1997).21 D. S. Sholl and C. K. Lee,J. Chem. Phys.112(2), 817–824 (2000).22 K. Hahn and J. Karger,J. Phys. A: Math. Gen.28, 3061–3070 (1995).23 D. Keffer, A. V. McCormick, and H. T. Davis,Mol. Phys.87(2), 367–387 (1996).24 J. M. Haile,Molecular dynamics simulation: elementary methods, John Wiley & Sons,
New York (1992).
82 Diffusion in Single-File Systems
25 S.-H. Suh and J. M. D. MacElroy,Mol. Phys.58(3), 445–473 (1986).26 K. K. Mon and J. K. Percus,J. Chem. Phys.112(7), 3457–3458 (2000).27 J. R. Henderson,Mol. Phys.99(10), 883–888 (2001).28 K. Hahn and J. Karger,J. Phys. Chem.100(1), 316–326 (1996).29 M. P. Allen and D. J. Tildesley,Computer simulation of liquids, Clarendon, Oxford
(1987).30 T. J. H. Vlugt, R. Krishna, and B. Smit,J. Phys. Chem. B103(7), 1103–1118 (1999).31 D. Frenkel and B. Smit,Understanding molecular simulation: from algorithms to appli-
cations, Academic Press, Inc., San Diego, 1 ed. (1996).32 J. L. Lebowitz and J. K. Percus,Phys. Rev.155(1), 122–138 (1967).33 M.-O. Coppens, A. T. Bell, and A. K. Chakraborty,Chem. Engng. Sci.53(11), 2053–2061
(1998).34 J. M. D. MacElroy and S.-H. Suh,J. Chem. Phys.106(20), 8595–8597 (1997).35 J. Karger and D. M. Ruthven,Diffusion in zeolites and other microporous solids, John
Wiley & Sons, Inc., New York (1992).
5Measurement and Simulation of
Binary Diffusion in Zeolites
The positron emission profiling technique is extremely well suited tostudy the diffusion of mixtures in zeolites on a macroscopic scale. By la-belling one of the components, the adsorptive and diffusive properties ofthat component can be determined. Although the diffusion in mixtures isan important topic, the amount of studies on this subject is rather limited.In this chapter, the PEP technique, together with a model to describe thetransport behaviour inside a packed bed reactor, is being used to studythe behaviour of a mixture of n-hexane and 2-methylpentane.
5.1 Introduction
Diffusion and adsorption of hydrocarbons in zeolites has received a lot of attention inthe last few decades.1, 2 Not in the least place, this is due to the vast number of appli-cations of these materials in the petrochemical industry, e.g. as catalysts in crackingand hydroisomerization processes, and as molecular sieves in separation processes.For all these applications, a thorough understanding of the diffusive and adsorptiveproperties of molecules inside these materials is of vital importance, as these greatlyinfluence the performance of the catalytic or separation processes. When used as forexample a catalyst or molecular sieve, at least two, or even more, species are present
†Reproduced in part from D. Schuring, A. O. Koriabkina, A. M. de Jong, B. Smit, and R. A. vanSanten, “Adsorption and Diffusion ofn-Hexane/2-Methylpentane Mixtures in Zeolite Silicalite: Exper-iments and Modeling”,J. Phys. Chem. B105(32), 7690–7698 (2001). 2001 American ChemicalSociety.
84 Measurement and Simulation of Binary Diffusion in Zeolites
inside the zeolite. Surprisingly, most studies are focused on the diffusion and adsorp-tion of single components only. In the first place, this results from the fact that mostconventional methods for studying mass transfer in zeolites, like the gravimetric andvolumetric methods, are intrinsically unable to distinguish between different typesof molecules. Furthermore, it is generally assumed that diffusion in multicomponentsystems can be predicted from single-component data.
Only in recent years, the number of investigations on multi-component mixturesis increasing. However, most of these studies are concerned with small moleculesonly, like methane/xenon,3, 4 ethane/ethene,5 andn-butane/methane,6 and the major-ity of these studies is focussed on the sorption thermodynamics, often making useof molecular simulations. Most experimental data are obtained with techniques likeNMR and quasi-elastic neutron scattering, and at relatively low temperatures. Amongthe few papers dealing with longer hydrocarbons are the work of Choudhary et al.(aromatics in ZSM-5),7 Niessen and Karge (xylene-benzene mixtures),8 and work oncyclic, branched, and linear hydrocarbons in silicalite membranes by Funke and co-workers.9 Recently, Masuda and co-workers10 reported results onn-heptane/n-octaneandortho- andmeta-xylene mixtures at elevated temperatures. They concluded that,while the diffusivity of the slow component with increasing amounts of the fast com-ponents remains constant, the diffusivity of the fast component decreases monoton-ically with the increasing fraction of slow components. This is in line with resultsobtained for the mixtures of smaller components.
A relatively new technique capable of studying adsorption and diffusion of multi-component mixtures is positron emission profiling (PEP), which makes use moleculeslabelled with a positron-emitting isotope. This technique is based on coincident de-tection of theγ photons resulting from the annihilation of a positron, emitted bythe radioactive isotope, with an electron from the chemical environment. Becausethe annihilation produces a pair ofγ photons travelling in (almost) opposite direc-tions, the exact location of the decay event can be determined by coincident detectionof these photons. Due to the high penetrating power of theγ-rays, a great advan-tages of this technique is the fact that in-situ measurements can be performed onordinary laboratory-scale reactors at normal reaction conditions. Furthermore, as la-belled molecules are used, one has the posibility of only labelling one componentin a mixture, thus making it possible to study only this component. The positronemission profiling technique has been described in detail in Anderson et al.,11, 12andwas already used succesfully for studying single-component diffusion in biporouspacked beds of zeolites.13 Recently, this technique has been extended to incorporatetracer exchange experiments.14 With these experiments, a continuous stream of la-belled molecules is injected into a steady-state feed stream. The rate at which theexchange between labelled and non-labelled molecules takes place is determined by
Experimental setup 85
the diffusion of the adsorbates inside the zeolite channels. By studying the exchangeprocess, information can be obtained about diffusion and adsorption inside the zeolitecrystals. The advantage of using tracer exchange experiments over transient experi-ments is that one is assured that the entire experiment is performed under steady-stateconditions, so that the true self-diffusion constant is measured.
In this chapter, the tracer-exchange positron emission profiling (or TEX-PEP)technique is being used to study the adsorption and diffusion ofn-hexane/2-methyl-pentane mixtures in zeolite silicalite. These systems were chosen because of theirpractical applications, the availability of other (theoretical) studies, and the peculiaradsorption behaviour observed for the single components.15 Using a constant totalpressure, the adsorptive and diffusive behaviour ofn-hexane and2-methylpentanehave been studied as a function of then-hexane/2-methylpentane ratio in the gasphase. The remaining of this paper will deal with the experimental details, the modelused for evaluating the experiments, and the results obtained.
5.2 Experimental setup
For the experiments conducted in this study, the same setup was used as was de-scribed earlier in the work of Schumacher et al.14 The positron-emitting11C isotopeis produced by irradiation of a nitrogen target with 12 MeV protons from the 30 MeVAVF Cyclotron at the Eindhoven University of Technology. The resulting11C is thentransfered as CO/CO2 to the setup for the production of labelled hydrocarbons. De-tails of the homologation process used for the production of labelledn-hexane and2-methylpentane can be found in Cunningham et al.16 After separation of the differ-ent products produced in this process, the desired labelled species is collected in asyringe.
Figure 5.1 shows a schematic diagram of the reactor system used in the TEX-PEPexperiments. During the tracer exchange experiments, a constant flow of non-labelledhydrocarbons in a hydrogen carrier stream was fed into the reactor. Then-hexane/2-methylpentane/hydrogen mixture was produced using a CEM (Controlled Evapo-rator and Mixer)-mixing unit consisting of two branches, each of which equipedwith a mass flow controller (MFC). Using these controllers for then-hexane and2-methylpentane branch, the composition of the mixture can be set. The total flowrateof hydrocarbons and carrier gas was set to a value of 80.2 ml/min.
For a tracer exchange experiment, a quantity of labeled molecules of eithern-hexane or2-methylpentane was produced and continuously injected into the feedstream using a syringe pump. The tracer exchange and tracer re-exchange processcould then be monitored using the PEP detector by either turning the tracer flowon or off. The PEP detector measures the concentration by reconstructing the posi-
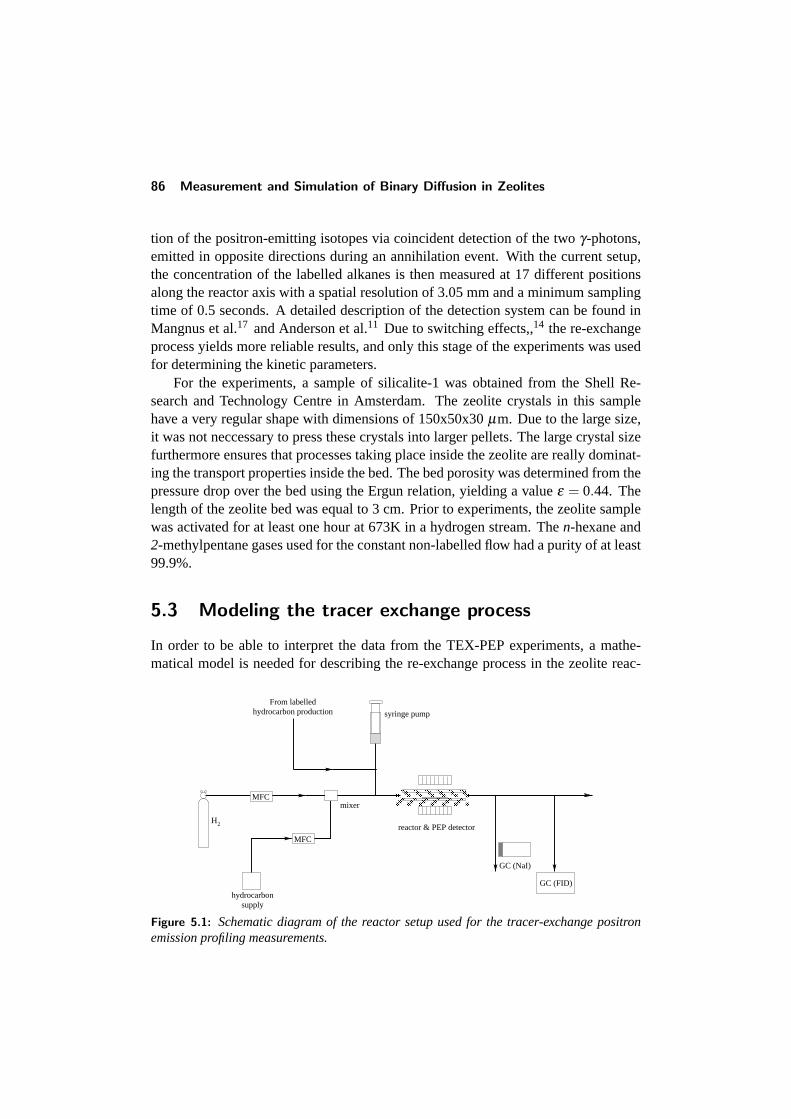
86 Measurement and Simulation of Binary Diffusion in Zeolites
tion of the positron-emitting isotopes via coincident detection of the twoγ-photons,emitted in opposite directions during an annihilation event. With the current setup,the concentration of the labelled alkanes is then measured at 17 different positionsalong the reactor axis with a spatial resolution of 3.05 mm and a minimum samplingtime of 0.5 seconds. A detailed description of the detection system can be found inMangnus et al.17 and Anderson et al.11 Due to switching effects,,14 the re-exchangeprocess yields more reliable results, and only this stage of the experiments was usedfor determining the kinetic parameters.
For the experiments, a sample of silicalite-1 was obtained from the Shell Re-search and Technology Centre in Amsterdam. The zeolite crystals in this samplehave a very regular shape with dimensions of 150x50x30µm. Due to the large size,it was not neccessary to press these crystals into larger pellets. The large crystal sizefurthermore ensures that processes taking place inside the zeolite are really dominat-ing the transport properties inside the bed. The bed porosity was determined from thepressure drop over the bed using the Ergun relation, yielding a valueε = 0.44. Thelength of the zeolite bed was equal to 3 cm. Prior to experiments, the zeolite samplewas activated for at least one hour at 673K in a hydrogen stream. Then-hexane and2-methylpentane gases used for the constant non-labelled flow had a purity of at least99.9%.
5.3 Modeling the tracer exchange process
In order to be able to interpret the data from the TEX-PEP experiments, a mathe-matical model is needed for describing the re-exchange process in the zeolite reac-
� � � � � � � � � �� � � � � � � � � �� � � � � � � � � �� � � � � � � � � �
MFC
MFC
hydrocarbonsupply
H2
From labelledhydrocarbon production
mixer
GC (NaI)
syringe pump
reactor & PEP detector
GC (FID)
Figure 5.1: Schematic diagram of the reactor setup used for the tracer-exchange positronemission profiling measurements.
Modeling the tracer exchange process 87
torbed. A common way to describe diffusion in packed beds is by using a systemof diffusion equations, describing the mass transport in the zeolite bed and insidethe crystals.1, 18, 19 The model used in this study basically is a modification of theequations used by Noordhoek et al.20 It is assumed that the transport of moleculesoccurs via convection and axial diffusion in the space between the crystals, adsorp-tion/desorption at the crystal surface, and diffusion inside the pores of the crystals.Furthermore, it is assumed that the crystals have a spherical shape. This approxima-tion is commonly made in literature, and has been shown to be quite reasonable.1
This is probably also due to the random orientation of the crystals inside the reactor,making it difficult to really explicitly account for the particle shape. As only onecomponent is detected during the experiments, single-component equations can beused to model its behaviour. The parameters describing the different processes in thebed will then be effective values for the transport of this component in the mixture.
5.3.1 The model equations
Transport in the fluid phase inside the packed bed takes place through convection,axial diffusion, and flow to or from the zeolite crystals. A mass balance for a smallvolume element of the bed results in the following equation for the concentrationCz
in the gas phase:∂Cz
∂ t= Dax
∂ 2Cz
∂z2 −vint∂Cz
∂z+
3(1− ε)εRc
Nc (5.1)
In this equation,z is the coordinate along the reactor axis,Dax is the axial diffusioncoefficient, andvint the interstitial velocity, which can be calculated from the gasflow speedvsup usingvint = vsup/ε. The axial diffusivity can be calculated from themolecular diffusion coefficient of the component. ForRc, the radius of the crystals,the equivalent spherical particle radiusRc is taken, defined as the radius of the spherehaving the same external surface area to volume ratio.1 For the crystal size used inthis study, this yields a value of 25µm.
The boundary conditions used for the bed equation are identical as the ones inNoordhoek et al.20 For the column entrance, a mass balance (and by neglecting thediffusional term just in front of the column) yields
∂Cz,0+
∂z=
vint
Dax(Cz,0+ −Cz,0−) (5.2)
in which Cz,0− andCz,0+ are the fluid phase concentrations just in front of and justafter the column entrance, respectively. For TEX-PEP experiments, concentrationjust in front of the packed bed is given by the Heaviside step function:
Cz,0−(t) = C0, t ≤ 0
Cz,0−(t) = 0, t > 0 (5.3)
88 Measurement and Simulation of Binary Diffusion in Zeolites
At the column exit, the diffusional term is neglected, turning eq. 1 into a first-orderequation which can be used as a boundary condition.
The termNc equals the mass flux through the boundary of the zeolite, and is de-termined by the rate-limiting step for adsorption/desorption at the crystal boundary.It is assumed that external mass transfer resistance due to the diffusion through thelaminar fluid film surrounding the particles can be neglected, as this process is muchfaster than diffusion inside the zeolite crystals. This has been confirmed by compar-ing simulations with and without this process included in the model, showing thatneglecting the external film mass transfer resistance does not influence the results.
The model of Nijhuis et al.19 explicitly accounts for adsorption/desorption at thecrystal boundary, assuming Langmuir adsorption kinetics. As the TEX-PEP experi-ments are conducted under steady-state conditions, this mechanism can be replacedby a simple first-order adsorption/desorption process:
Nc = kdCx(Rc,z, t)−kaCz(z, t) (5.4)
in which ka and kd are the adsorption and desorption constants in [m·s−1]. Thisequation furthermore has the advantage thatka andkd have the same dimensions, andthat there is no need to determine the number of adsorption sites.
Transport inside the zeolite crystals occurs through diffusion inside the zeolitepores. Although it is known that diffusion in zeolites is generally anisotropic,21 therandom orientation of the crystals inside the reactor justifies the approximation thatmicropore diffusion can be described as an isotropic process. A mass balance for thezeolite crystals yields for the adsorbed phase concentrationCx in the crystals:
∂Cx
∂ t= Dc
(∂ 2Cx
∂x2 +2x
∂Cx
∂x
)(5.5)
in which Dc is the intracrystalline diffusivity, andx the radial coordinate of the crys-tal. In principle, the value of the diffusion constant depends on the concentration ofboth components. However, during the experiments, the total concentration does notchange, andDc can thus be regarded as constant during a single measurement. Theboundary condition at the centre of the particle is obtained from symmetry reasons:
∂Cx
∂x
∣∣∣∣x=0
= 0 (5.6)
At the crystal boundary, the flow to the surface must be equal to the desorption rateat the crystal boundary atx = Rc:
Dc∂Cx
∂x
∣∣∣∣x=Rc
= kaCz(z, t)−kdCx(Rc,z, t) (5.7)
Modeling the tracer exchange process 89
The initial conditions can be found by realizing that at the start of a tracer re-exchange process, the system is in equilibrium. Assuming that the injected tracerconcentration initially is equal toC0, the initial conditions are given by:
Cz(z, t) = C0
Cx(x,z, t) = Ka×C0 (5.8)
in whichKa is the adsorption equilibrium constant, given byKa = ka/kd.
5.3.2 Solving the model
The equations described above have been solved using the numerical method oflines.22 This procedure has been described in detail in Noordhoek et al.20 In short,this is done by discretizing the spatial coordinates (and spatial derivatives), convertingthe system of partial differential equations into a set of ordinary differential equations(ODEs). These ODEs can then be solved using an ordinary numerical integration rou-tine. Solving the model yields values for the concentration at the each bed and crystalgridpoint. As the PEP detector measures the total concentration of labelled moleculesin a certain section of the catalyst bed, volume averaging has to be applied to simulatethe response of the PEP detector. The average microparticle concentration at positionz inside the reactor bed equals
〈Cx(z, t)〉=3R3
c
Rc∫0
Cx(x,z, t) ·x2dx (5.9)
As the crystal concentrationCx is only known at the gridpoints, this integral has to beevaluated nummerically. The total concentration at positionz can than be calculatedby averaging over the bed and crystal concentration:
〈Ctot(z, t)〉= ε ·Cz(z, t)+(1− ε) · 〈Cx(z, t)〉 (5.10)
Estimation of the different parameters, i.e. the adsorption/desorption and diffusionin the zeolite crystals, is done by fitting the modelled concentration profiles to themeasured ones, using a least-squares Levenberg-Marquardt algorithm.23 All the otherparameters were determined experimentally.
5.3.3 Adsorption/desorption at the crystal boundary
If adsorption and desorption at the outer surface of the zeolite crystallites is fast com-pared to the diffusion inside the pores of the zeolite, adsorption equilibrium can beassumed at the crystal boundary. This seems a reasonable approach, as the diffusion
90 Measurement and Simulation of Binary Diffusion in Zeolites
inside the micropores is usually quite slow. An advantage of this approach is thatthe parameters describing adsorption/desorption at the boundary can be replaced bya single equilibrium adsorption constantKa. This takes care of the problem that twoparameters need to be fitted which are not completely independent, as was alreadyreported by Nijhuis et al.19 In order to check if adsorption equilibrium can be safelyassumed, results for the model desribed previously can be compared with that from amodel assuming adsorption equilibrium.
On the assumption that adsorption/desorption is fast compared to diffusion in thezeolite micropores, the mass flux through the boundary of the zeolite is determinedby diffusion to the boundary of the crystal. Eq. 4 then has to be replaced by
Nc =−Dc∂Cx
∂x
∣∣∣∣x=Rc
(5.11)
The boundary equation at the crystal surface, eq. 7, can be replaced by a simpleequilibrium condition
Cx(x = Rc,z, t) = Ka×Cz(z, t) (5.12)
An estimate of the rate of adsorption can be obtained from kinetic gas theory.24 Thenumber of collisions between molecules and the surface can be calculated using thefollowing relation:
Φs =14
Cgas
√RgT2πM
(5.13)
which gives the collision rate per unit surface (in mol·m−2), with Cgas the concentra-tion of the gas phase,Rg the gas constant,T the temperature, andM the molar mass ofthe molecules. The rate constant for adsorption can be calculated from this by divid-ing this expression by the gas phase concentration. It should however be realized thatthe value calculated from eq. 13 gives an upper bound for the true adsorption rate,as not all collisions with the zeolite crystal surface will result in the adsorption of amolecule inside the micropores (i.e. there exists a “surface barrier” for adsorption,and the sticking coefficient is smaller than 1). Estimation of the sticking coefficientis not straightforward, and it might have values ranging from approximately one to10−3.
In order to check in which regime the models give similar results, a number ofsimulations have been performed. For the bed porosity, crystal radius, flowrate, andtemperature identical parameters were chosen as were used in the experiments. Forthe diffusion constant,Dc, a value of 5·10−11 m2·s−1 was chosen, which is the upperlimit of this parameter found experimentally. The adsorption equilibrium constantsfound for these systems are typically in the order of 300 to 1000, so a value of 500 waschosen. This value was furthermore used to fix the ratio between the adsorption and
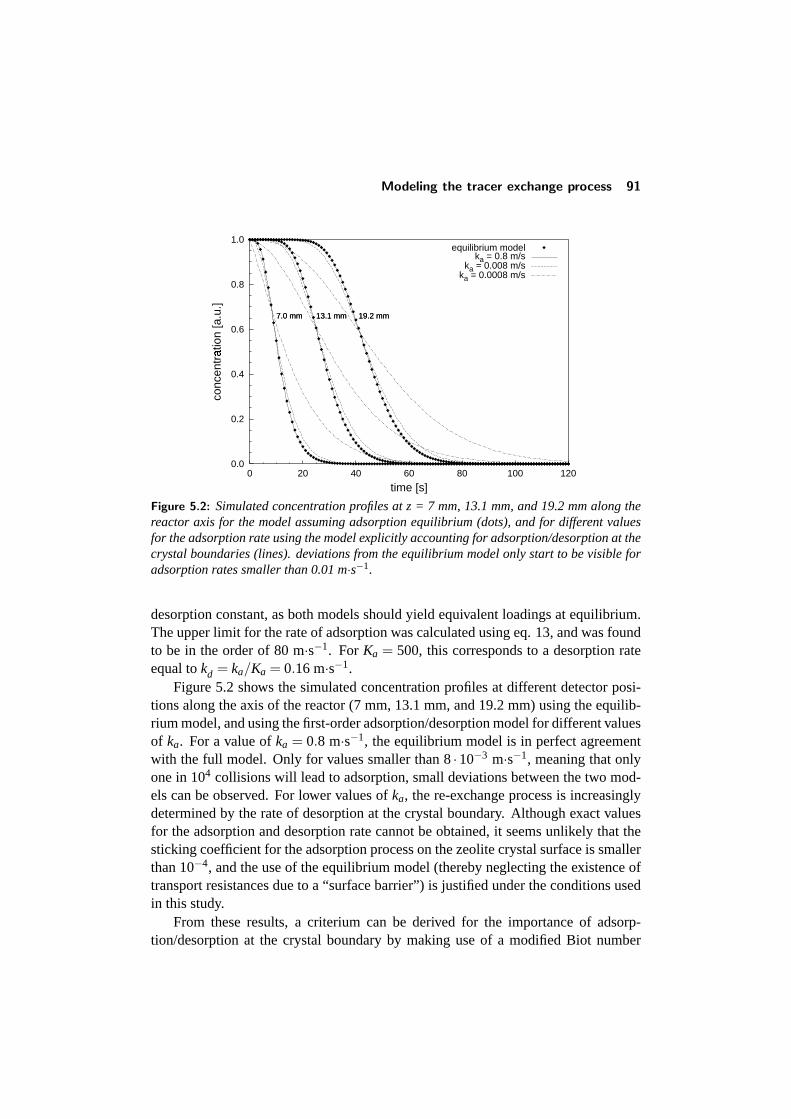
Modeling the tracer exchange process 91
0.0
0.2
0.4
0.6
0.8
1.0
0 20 40 60 80 100 120
conc
entr
atio
n [a
.u.]
�
time [s]
7.0 mm 13.1 mm 19.2 mm7.0 mm 13.1 mm 19.2 mm
equilibrium modelka = 0.8 m/s
ka = 0.008 m/ska = 0.0008 m/s
Figure 5.2: Simulated concentration profiles at z = 7 mm, 13.1 mm, and 19.2 mm along thereactor axis for the model assuming adsorption equilibrium (dots), and for different valuesfor the adsorption rate using the model explicitly accounting for adsorption/desorption at thecrystal boundaries (lines). deviations from the equilibrium model only start to be visible foradsorption rates smaller than 0.01 m·s−1.
desorption constant, as both models should yield equivalent loadings at equilibrium.The upper limit for the rate of adsorption was calculated using eq. 13, and was foundto be in the order of 80 m·s−1. For Ka = 500, this corresponds to a desorption rateequal tokd = ka/Ka = 0.16 m·s−1.
Figure 5.2 shows the simulated concentration profiles at different detector posi-tions along the axis of the reactor (7 mm, 13.1 mm, and 19.2 mm) using the equilib-rium model, and using the first-order adsorption/desorption model for different valuesof ka. For a value ofka = 0.8 m·s−1, the equilibrium model is in perfect agreementwith the full model. Only for values smaller than 8·10−3 m·s−1, meaning that onlyone in 104 collisions will lead to adsorption, small deviations between the two mod-els can be observed. For lower values ofka, the re-exchange process is increasinglydetermined by the rate of desorption at the crystal boundary. Although exact valuesfor the adsorption and desorption rate cannot be obtained, it seems unlikely that thesticking coefficient for the adsorption process on the zeolite crystal surface is smallerthan 10−4, and the use of the equilibrium model (thereby neglecting the existence oftransport resistances due to a “surface barrier”) is justified under the conditions usedin this study.
From these results, a criterium can be derived for the importance of adsorp-tion/desorption at the crystal boundary by making use of a modified Biot number
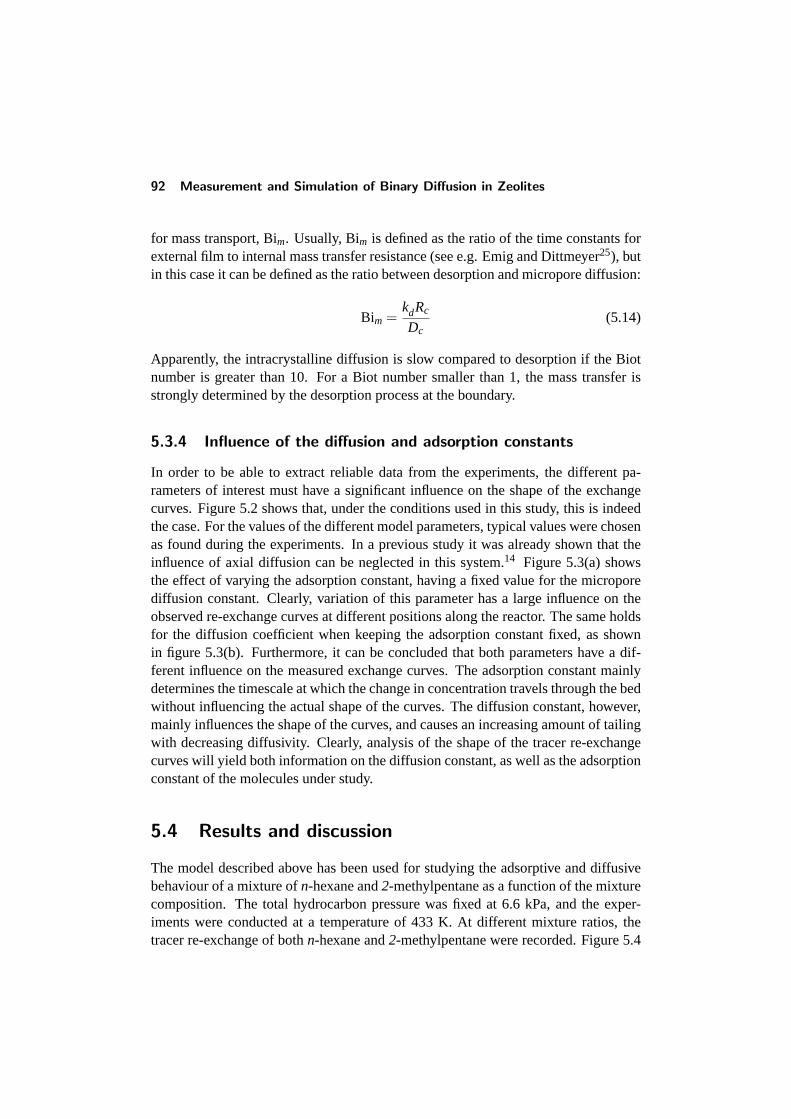
92 Measurement and Simulation of Binary Diffusion in Zeolites
for mass transport, Bim. Usually, Bim is defined as the ratio of the time constants forexternal film to internal mass transfer resistance (see e.g. Emig and Dittmeyer25), butin this case it can be defined as the ratio between desorption and micropore diffusion:
Bim =kdRc
Dc(5.14)
Apparently, the intracrystalline diffusion is slow compared to desorption if the Biotnumber is greater than 10. For a Biot number smaller than 1, the mass transfer isstrongly determined by the desorption process at the boundary.
5.3.4 Influence of the diffusion and adsorption constants
In order to be able to extract reliable data from the experiments, the different pa-rameters of interest must have a significant influence on the shape of the exchangecurves. Figure 5.2 shows that, under the conditions used in this study, this is indeedthe case. For the values of the different model parameters, typical values were chosenas found during the experiments. In a previous study it was already shown that theinfluence of axial diffusion can be neglected in this system.14 Figure 5.3(a) showsthe effect of varying the adsorption constant, having a fixed value for the microporediffusion constant. Clearly, variation of this parameter has a large influence on theobserved re-exchange curves at different positions along the reactor. The same holdsfor the diffusion coefficient when keeping the adsorption constant fixed, as shownin figure 5.3(b). Furthermore, it can be concluded that both parameters have a dif-ferent influence on the measured exchange curves. The adsorption constant mainlydetermines the timescale at which the change in concentration travels through the bedwithout influencing the actual shape of the curves. The diffusion constant, however,mainly influences the shape of the curves, and causes an increasing amount of tailingwith decreasing diffusivity. Clearly, analysis of the shape of the tracer re-exchangecurves will yield both information on the diffusion constant, as well as the adsorptionconstant of the molecules under study.
5.4 Results and discussion
The model described above has been used for studying the adsorptive and diffusivebehaviour of a mixture ofn-hexane and2-methylpentane as a function of the mixturecomposition. The total hydrocarbon pressure was fixed at 6.6 kPa, and the exper-iments were conducted at a temperature of 433 K. At different mixture ratios, thetracer re-exchange of bothn-hexane and2-methylpentane were recorded. Figure 5.4
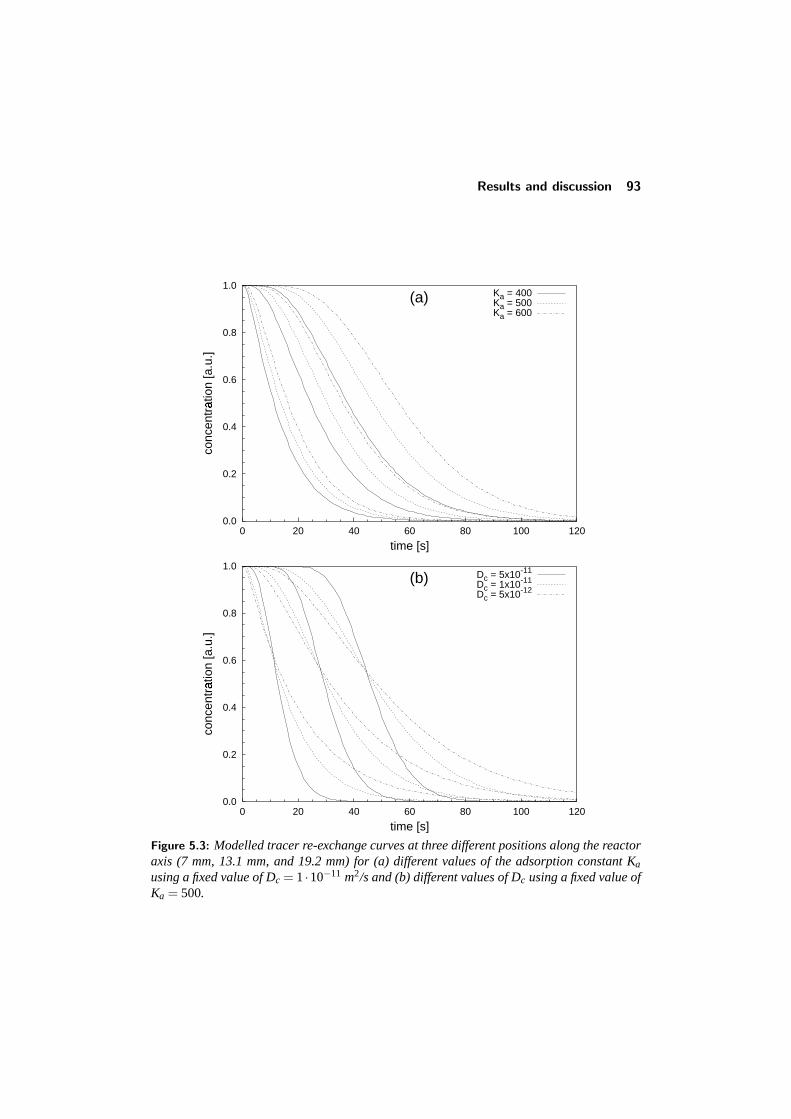
Results and discussion 93
0.0
0.2
0.4
0.6
0.8
1.0
0 20 40 60 80 100 120
conc
entr
atio
n [a
.u.]
�
time [s]
(a) Ka = 400Ka = 500Ka = 600
0.0
0.2
0.4
0.6
0.8
1.0
0 20 40 60 80 100 120
conc
entr
atio
n [a
.u.]
�
time [s]
(b) Dc = 5x10-11
Dc = 1x10-11
Dc = 5x10-12
Figure 5.3: Modelled tracer re-exchange curves at three different positions along the reactoraxis (7 mm, 13.1 mm, and 19.2 mm) for (a) different values of the adsorption constant Ka
using a fixed value of Dc = 1·10−11 m2/s and (b) different values of Dc using a fixed value ofKa = 500.
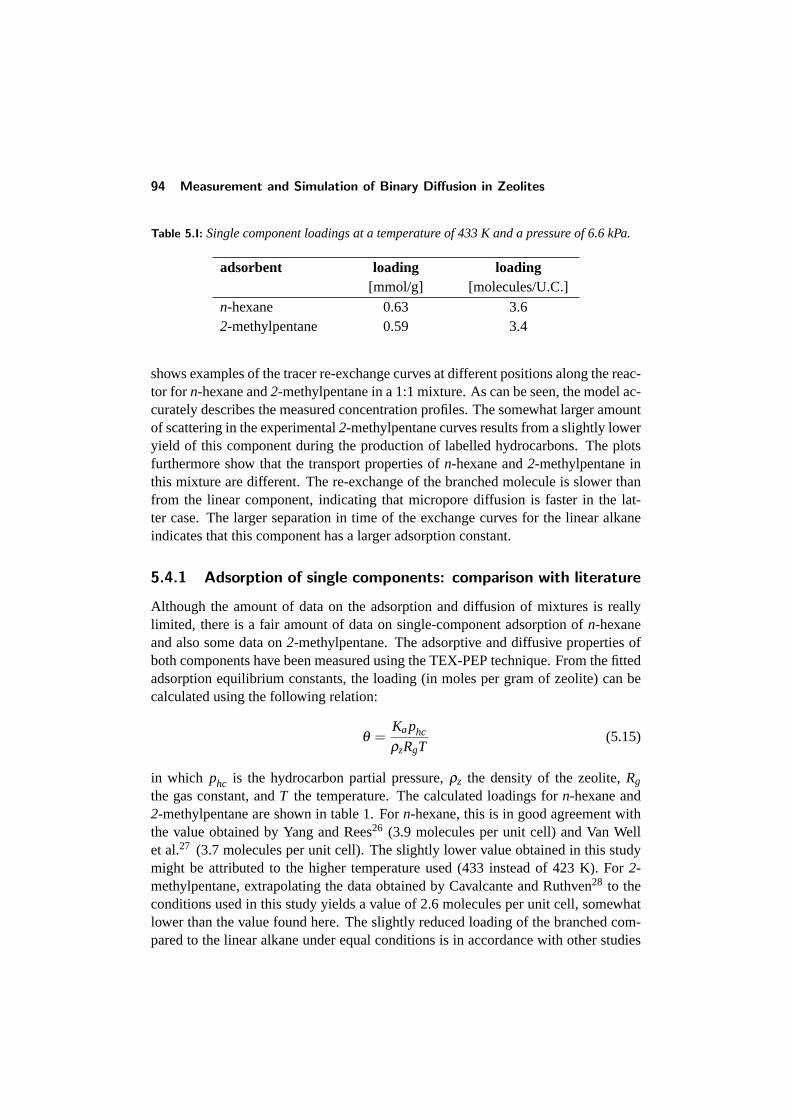
94 Measurement and Simulation of Binary Diffusion in Zeolites
Table 5.I: Single component loadings at a temperature of 433 K and a pressure of 6.6 kPa.
adsorbent loading loading[mmol/g] [molecules/U.C.]
n-hexane 0.63 3.62-methylpentane 0.59 3.4
shows examples of the tracer re-exchange curves at different positions along the reac-tor for n-hexane and2-methylpentane in a 1:1 mixture. As can be seen, the model ac-curately describes the measured concentration profiles. The somewhat larger amountof scattering in the experimental2-methylpentane curves results from a slightly loweryield of this component during the production of labelled hydrocarbons. The plotsfurthermore show that the transport properties ofn-hexane and2-methylpentane inthis mixture are different. The re-exchange of the branched molecule is slower thanfrom the linear component, indicating that micropore diffusion is faster in the lat-ter case. The larger separation in time of the exchange curves for the linear alkaneindicates that this component has a larger adsorption constant.
5.4.1 Adsorption of single components: comparison with literature
Although the amount of data on the adsorption and diffusion of mixtures is reallylimited, there is a fair amount of data on single-component adsorption ofn-hexaneand also some data on2-methylpentane. The adsorptive and diffusive properties ofboth components have been measured using the TEX-PEP technique. From the fittedadsorption equilibrium constants, the loading (in moles per gram of zeolite) can becalculated using the following relation:
θ =Kaphc
ρzRgT(5.15)
in which phc is the hydrocarbon partial pressure,ρz the density of the zeolite,Rg
the gas constant, andT the temperature. The calculated loadings forn-hexane and2-methylpentane are shown in table 1. Forn-hexane, this is in good agreement withthe value obtained by Yang and Rees26 (3.9 molecules per unit cell) and Van Wellet al.27 (3.7 molecules per unit cell). The slightly lower value obtained in this studymight be attributed to the higher temperature used (433 instead of 423 K). For2-methylpentane, extrapolating the data obtained by Cavalcante and Ruthven28 to theconditions used in this study yields a value of 2.6 molecules per unit cell, somewhatlower than the value found here. The slightly reduced loading of the branched com-pared to the linear alkane under equal conditions is in accordance with other studies
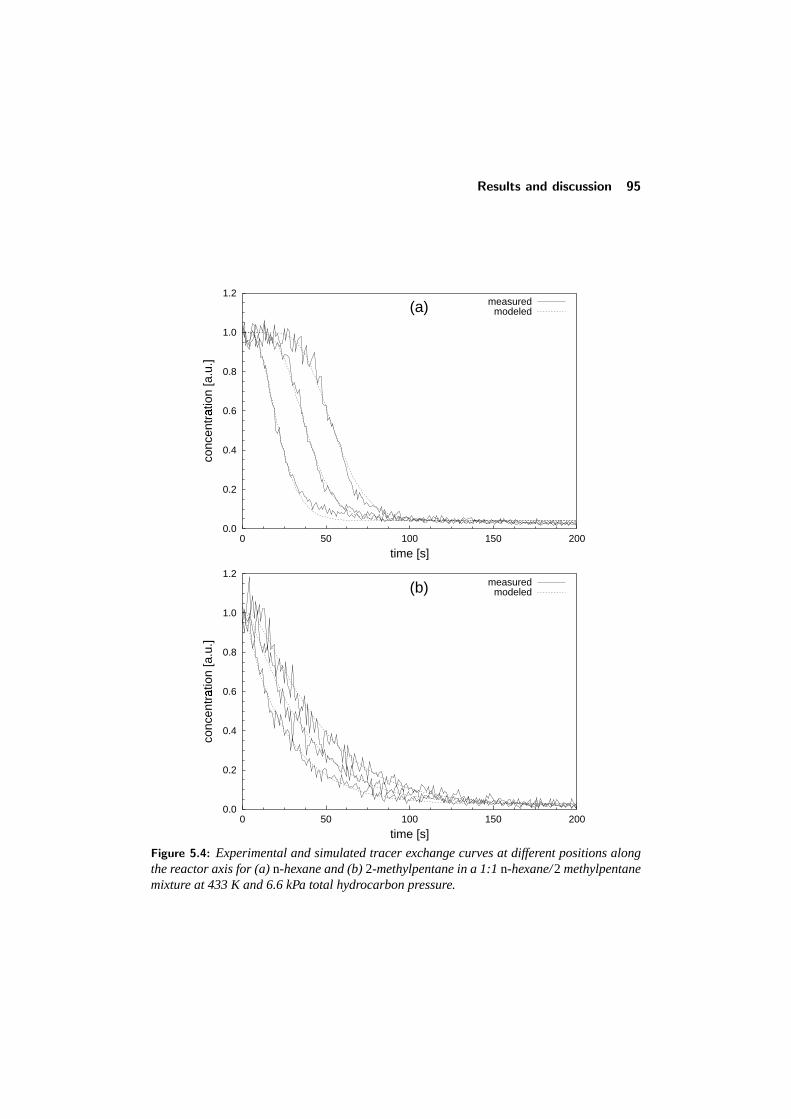
Results and discussion 95
0.0
0.2
0.4
0.6
0.8
1.0
1.2
0 50 100 150 200
conc
entr
atio
n [a
.u.]
�
time [s]
(a) measuredmodeled
0.0
0.2
0.4
0.6
0.8
1.0
1.2
0 50 100 150 200
conc
entr
atio
n [a
.u.]
�
time [s]
(b) measuredmodeled
Figure 5.4: Experimental and simulated tracer exchange curves at different positions alongthe reactor axis for (a)n-hexane and (b)2-methylpentane in a 1:1n-hexane/2 methylpentanemixture at 433 K and 6.6 kPa total hydrocarbon pressure.
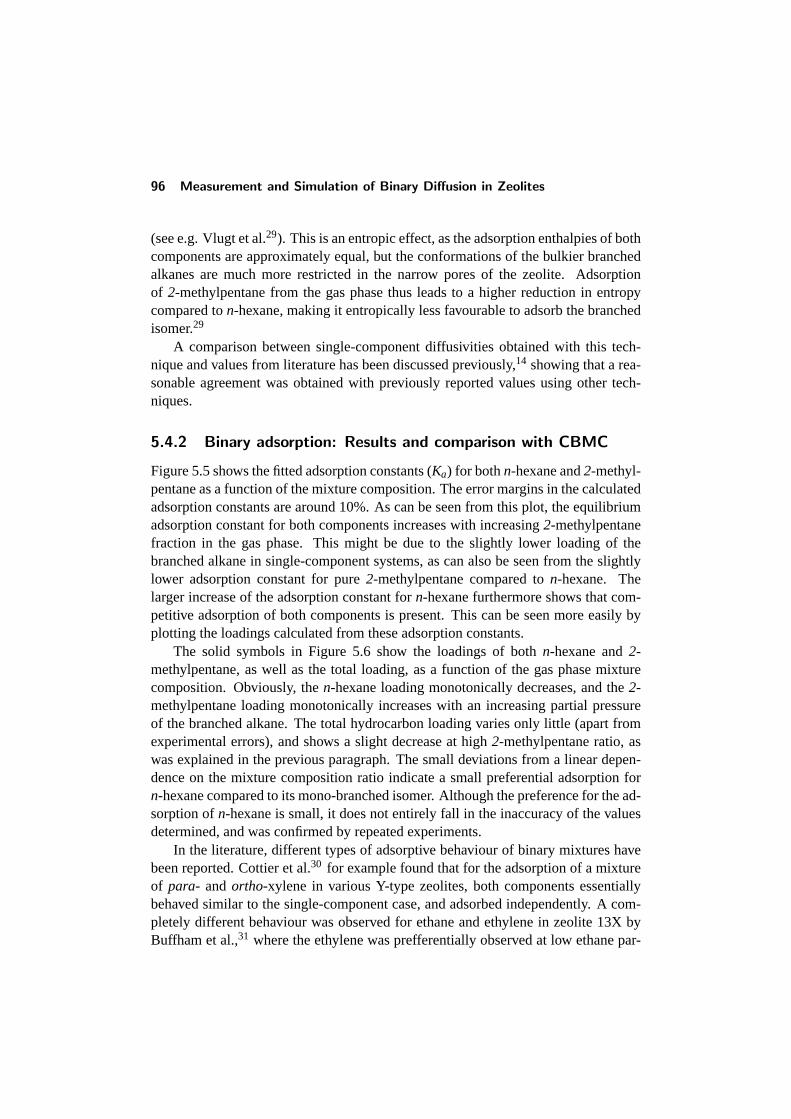
96 Measurement and Simulation of Binary Diffusion in Zeolites
(see e.g. Vlugt et al.29). This is an entropic effect, as the adsorption enthalpies of bothcomponents are approximately equal, but the conformations of the bulkier branchedalkanes are much more restricted in the narrow pores of the zeolite. Adsorptionof 2-methylpentane from the gas phase thus leads to a higher reduction in entropycompared ton-hexane, making it entropically less favourable to adsorb the branchedisomer.29
A comparison between single-component diffusivities obtained with this tech-nique and values from literature has been discussed previously,14 showing that a rea-sonable agreement was obtained with previously reported values using other tech-niques.
5.4.2 Binary adsorption: Results and comparison with CBMC
Figure 5.5 shows the fitted adsorption constants (Ka) for bothn-hexane and2-methyl-pentane as a function of the mixture composition. The error margins in the calculatedadsorption constants are around 10%. As can be seen from this plot, the equilibriumadsorption constant for both components increases with increasing2-methylpentanefraction in the gas phase. This might be due to the slightly lower loading of thebranched alkane in single-component systems, as can also be seen from the slightlylower adsorption constant for pure2-methylpentane compared ton-hexane. Thelarger increase of the adsorption constant forn-hexane furthermore shows that com-petitive adsorption of both components is present. This can be seen more easily byplotting the loadings calculated from these adsorption constants.
The solid symbols in Figure 5.6 show the loadings of bothn-hexane and2-methylpentane, as well as the total loading, as a function of the gas phase mixturecomposition. Obviously, then-hexane loading monotonically decreases, and the2-methylpentane loading monotonically increases with an increasing partial pressureof the branched alkane. The total hydrocarbon loading varies only little (apart fromexperimental errors), and shows a slight decrease at high2-methylpentane ratio, aswas explained in the previous paragraph. The small deviations from a linear depen-dence on the mixture composition ratio indicate a small preferential adsorption forn-hexane compared to its mono-branched isomer. Although the preference for the ad-sorption ofn-hexane is small, it does not entirely fall in the inaccuracy of the valuesdetermined, and was confirmed by repeated experiments.
In the literature, different types of adsorptive behaviour of binary mixtures havebeen reported. Cottier et al.30 for example found that for the adsorption of a mixtureof para- andortho-xylene in various Y-type zeolites, both components essentiallybehaved similar to the single-component case, and adsorbed independently. A com-pletely different behaviour was observed for ethane and ethylene in zeolite 13X byBuffham et al.,31 where the ethylene was prefferentially observed at low ethane par-
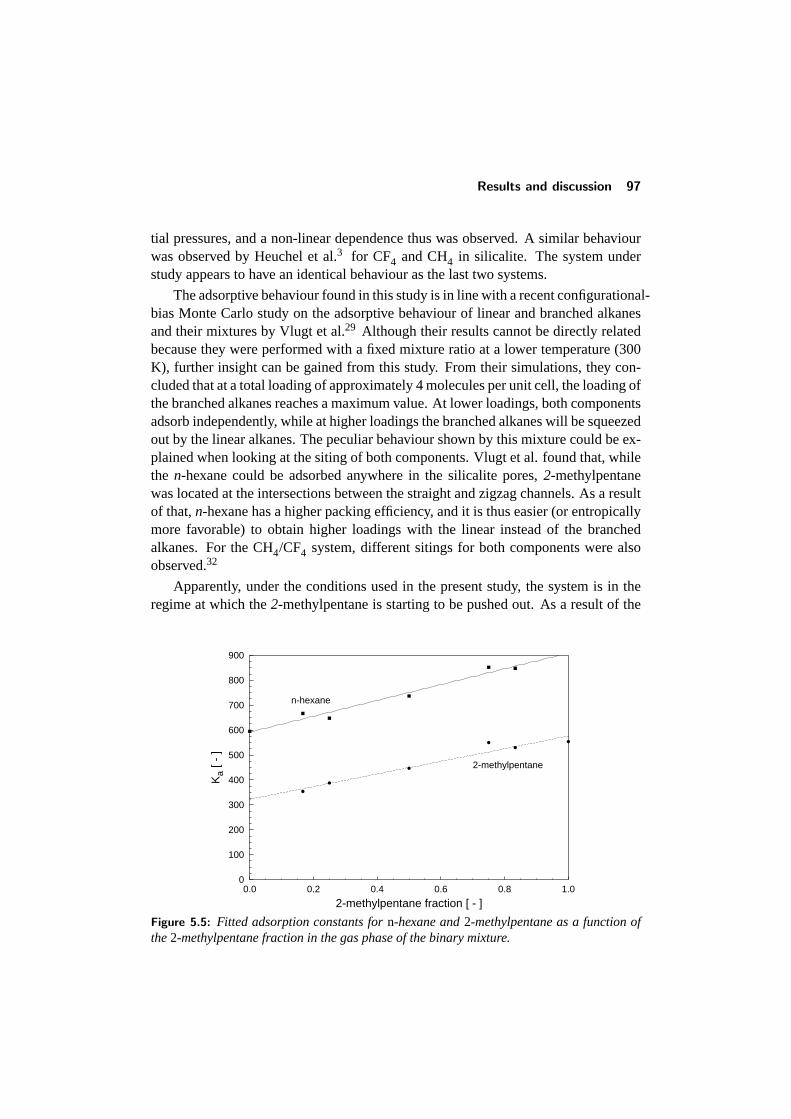
Results and discussion 97
tial pressures, and a non-linear dependence thus was observed. A similar behaviourwas observed by Heuchel et al.3 for CF4 and CH4 in silicalite. The system understudy appears to have an identical behaviour as the last two systems.
The adsorptive behaviour found in this study is in line with a recent configurational-bias Monte Carlo study on the adsorptive behaviour of linear and branched alkanesand their mixtures by Vlugt et al.29 Although their results cannot be directly relatedbecause they were performed with a fixed mixture ratio at a lower temperature (300K), further insight can be gained from this study. From their simulations, they con-cluded that at a total loading of approximately 4 molecules per unit cell, the loading ofthe branched alkanes reaches a maximum value. At lower loadings, both componentsadsorb independently, while at higher loadings the branched alkanes will be squeezedout by the linear alkanes. The peculiar behaviour shown by this mixture could be ex-plained when looking at the siting of both components. Vlugt et al. found that, whilethe n-hexane could be adsorbed anywhere in the silicalite pores,2-methylpentanewas located at the intersections between the straight and zigzag channels. As a resultof that,n-hexane has a higher packing efficiency, and it is thus easier (or entropicallymore favorable) to obtain higher loadings with the linear instead of the branchedalkanes. For the CH4/CF4 system, different sitings for both components were alsoobserved.32
Apparently, under the conditions used in the present study, the system is in theregime at which the2-methylpentane is starting to be pushed out. As a result of the
0
100
200
300
400
500
600
700
800
900
0.0 0.2 0.4 0.6 0.8 1.0
Ka
[ - ]
2-methylpentane fraction [ - ]
n-hexane
2-methylpentane
Figure 5.5: Fitted adsorption constants forn-hexane and2-methylpentane as a function ofthe2-methylpentane fraction in the gas phase of the binary mixture.
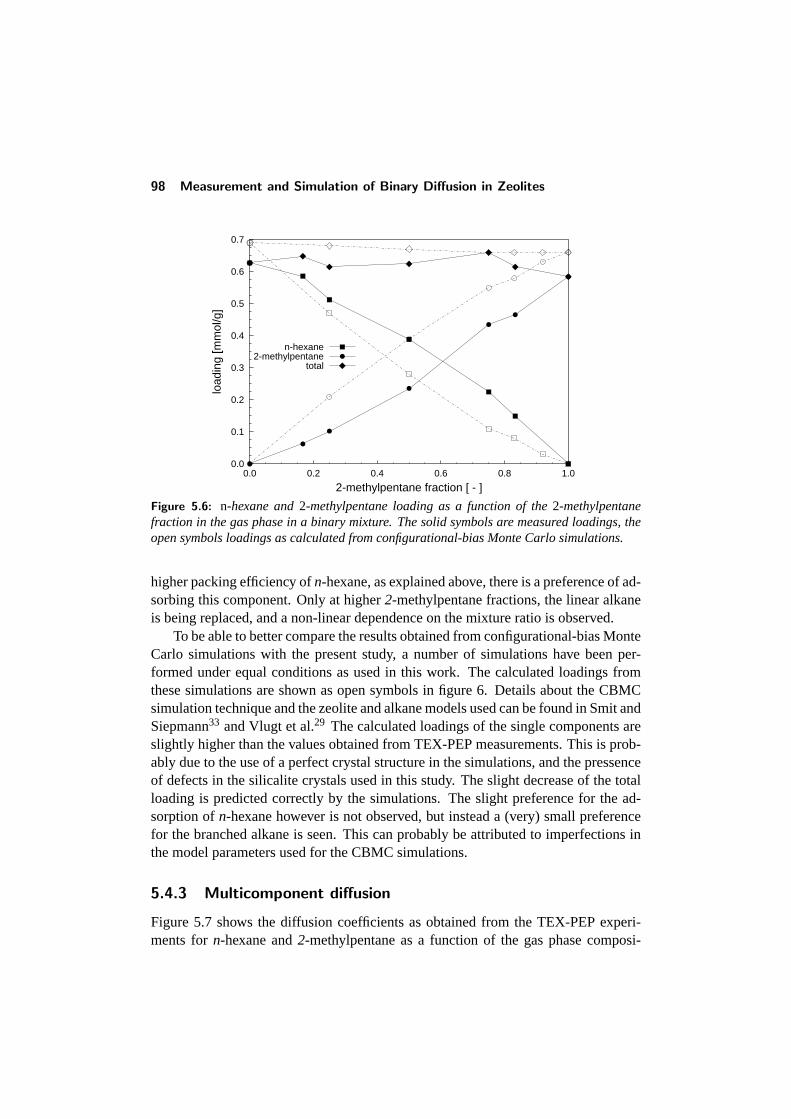
98 Measurement and Simulation of Binary Diffusion in Zeolites
0.0
0.1
0.2
0.3
0.4
0.5
0.6
0.7
0.0 0.2 0.4 0.6 0.8 1.0
load
ing
[mm
ol/g
]
�
2-methylpentane fraction [ - ]
n-hexane2-methylpentane
total
Figure 5.6: n-hexane and2-methylpentane loading as a function of the2-methylpentanefraction in the gas phase in a binary mixture. The solid symbols are measured loadings, theopen symbols loadings as calculated from configurational-bias Monte Carlo simulations.
higher packing efficiency ofn-hexane, as explained above, there is a preference of ad-sorbing this component. Only at higher2-methylpentane fractions, the linear alkaneis being replaced, and a non-linear dependence on the mixture ratio is observed.
To be able to better compare the results obtained from configurational-bias MonteCarlo simulations with the present study, a number of simulations have been per-formed under equal conditions as used in this work. The calculated loadings fromthese simulations are shown as open symbols in figure 6. Details about the CBMCsimulation technique and the zeolite and alkane models used can be found in Smit andSiepmann33 and Vlugt et al.29 The calculated loadings of the single components areslightly higher than the values obtained from TEX-PEP measurements. This is prob-ably due to the use of a perfect crystal structure in the simulations, and the pressenceof defects in the silicalite crystals used in this study. The slight decrease of the totalloading is predicted correctly by the simulations. The slight preference for the ad-sorption ofn-hexane however is not observed, but instead a (very) small preferencefor the branched alkane is seen. This can probably be attributed to imperfections inthe model parameters used for the CBMC simulations.
5.4.3 Multicomponent diffusion
Figure 5.7 shows the diffusion coefficients as obtained from the TEX-PEP experi-ments forn-hexane and2-methylpentane as a function of the gas phase composi-
Results and discussion 99
0.0
5.0
10.0
15.0
20.0
25.0
30.0
35.0
40.0
45.0
50.0
0.0 0.2 0.4 0.6 0.8 1.0
Dc
[x10
-12 m
2 /s]
2-methylpentane fraction [ - ]
n-hexane2-methylpentane
Figure 5.7: Self-diffusion constant as a function of2-methylpentane fraction in the gas phasefor n-hexane and2-methylpentane at 433 K and a hydrocarbon pressure of 6.6 kPa.
tion. Obviously, the diffusivity of puren-hexane is much higher as for the larger2-methylpentane molecules (approximately a factor of 9). For both components, adecrease in mobility is observed with an increasing fraction of the branched alkanein the gas phase. The2-methylpentane behaves essentially in a way one would ex-pect for a single-component system (see e.g. Schumacher and Karge,34 Schuring etal.35), whereby the diffusivity monotonically decreases with increasing loading ofthis component. The diffusivity of the fastern-hexane depends more strongly on thecomposition of the gas mixture. As the loading ofn-hexane decreases with increas-ing 2-methylpentane fraction, but the total loading remains approximately constant,this decrease in mobility must result from interactions with its branched isomer in thesystem. Most remarkable is the sudden drop in diffusivity above a2-methylpentanefraction of 0.75.
The diffusivity of molecules inside the zeolite lattice depends strongly on theloading of the zeolite crystal.35 The plot shown in figure 5.7 should therefore betreated with some caution, as the dependency of the diffusion constant on the gasphase composition is also influenced by the adsorbtive behaviour of the alkanes. Inthis case, however, the influence of adsorption is limited because the total loadingremains constant and there is only a small preferential adsorption forn-hexane. Theresults can therefore be directly related to MD studies from other authors, where onecommonly uses a fixed total loading and diffusivities as a function of the adsorbedphase fraction.
100 Measurement and Simulation of Binary Diffusion in Zeolites
For2-methylpentane fractions lower than 0.75, the behaviour found in this studyis essentially identical as that obtained in other studies.4, 10, 36 In all these systemsit was found that the diffusivity of the slow component is essentially unaffected bythe pressence of the fast component. The diffusive behaviour can be understood onthe basis of a simple jump diffusion model, in which diffusion is thought of as a se-quence of activated jumps from one site to another, as was already demonstrated byMasuda et al.10 Such a jump can only be succesful if the site to which the moleculejumps is empty. Although the jump frequency itself does not depend on the composi-tion of the mixture, the number of succesful jumps will. When the amount of slowlymoving molecules (2-methylpentane) increases, they will essentially block the chan-nel segments, and the number of succesful jumps of the fast component (n-hexane)will be determined by the rate at which an empty site is created by a jump of theslow component. At high2-methylpentane loadings, the diffusivity ofn-hexane willthus be strongly determined by the diffusion rate of its branched isomer. The depen-dency of the2-methylpentane diffusivity itself on mixture composition observed inthis study is mainly caused by the relatively high total loading at the conditions used.In this case, the interactions between the branched alkanes themselves play an impor-tant role and will seriously decrease the mobility of the slow-moving component athigher fractions in the gas phase. This was also observed in the work by Jost et al.,4
where the slow component (in this case xenon) showed an increasing dependency onthe mixture composition with increasing total loading of the zeolite.
The sudden drop in the diffusivity ofn-hexane at a ratio above 0.75 is due tothe perticular adsorptive properties of both components in silicalite. As was shownby Vlugt et al.,29 2-methylpentane preferentially adsorbs in the intersections betweenstraight and zigzag channels. When a large part of the intersections is occupied by theslowly diffusing branched alkanes, the entire pore system will essentially be blocked,and diffusion of the fast component will be totally determined by the hopping rate ofthe slow component moving from one intersection to another. This is strongly sup-ported by the fact that the sudden drop in diffusivity takes place at a2-methylpentaneloading of about three molecules per unit cell, meaning that 75% of the intersectionsis occupied as each unit cell of silicalite contains four channel intersections. A sim-ilar effect was observed in a system of methane and benzene in zeolite NaY37 andsilicalite.38 In NaY, the benzene molecules effectively block the windows of the su-percages for the faster methane. In zeolite silicalite, Forste et al.38 showed that thedecrease of methane diffusivity was also caused by blocking of the channel intersec-tions by benzene.
The results obtianed here emphasize the importance of the structure of the zeo-lite channels when looking at multi-component diffusion. The sudden drop in dif-fusivity of the fast component in this system is a direct result of the adsorptive be-
Conclusions 101
haviour of both components and the channel topology of the zeolite. This explainswhy a similar behaviour was not observed in previous studies. For example, forthe methane/Xenon4 and methane/tetrafluoromethane32 mixtures in silicalite, bothcomponents are preferentially sited in the interiors of the (straight and zigzag) chan-nels, causing the blocking by the slow components to be less dramatic. For then-butane/methane system,36 the fast component (methane) shows a slight preferencefor adsorption in the intersections, while the slow component resides in the channels.Although the results cannot be directly compared, an accelerated drop was indeedobserved, but only at much higher loadings.
The dependency of multicomponent diffusion on adsorption properties and zeo-lite topology has some important consequences for the description of mass transfer inbinary systems. Usually, the transport of these mixtures in a packed zeolite bed dur-ing transient experiments will be described by diffusion equations, using diffusionconstants which are independent of the loading. The current results show that thisis definitely not the case, as the diffusivity can be a strong function of the mixturecomposition. A more advanced approach for describing mass transfer is providedby the Maxwell-Stefan theory, which has been applied succesfully to diffusion andadsorption in zeolites.39, 40 In a recent study, Krishna showed that this theory couldindeed describe the behaviour as observed in MD simulations of methane/xenon,methane/CF4, and methane/n-butane.40 However, although the Maxwell-Stefan the-ory accounts for sorbate-sorbate interactions, it does not explicitly incorporate thepore structure and siting of the molecules, and will likely fail to describe the phe-nomena shown in this work. Whether or not the multi-component diffusivity can bepredicted from single-component diffusivities will thus depend on the particular sys-tem under study, and a general application of the Maxwell-Stefan theory should betreated with caution. Instead, more detailed model descriptions are needed to gaininsight in the diffusive behaviour. Among these descriptions are Monte Carlo latticedynamics simulations41, 42and percolation theory.43
Also for systems in which reactions take place, the behaviour observed here mighthave some important implications. Then-hexane/2-methylpentane mixture couldrepresent a reactant/product system. In that case, the mobility can become a strongfunction of the radial coordinate of the crystal. In extreme cases, reactants or prod-ucts could be piled up inside the crystals, essentially blocked by the slow componentspresent in the system, thus having a serious effect on the activity of the catalyst.
5.5 Conclusions
In this work, the tracer-exchange positron emission profiling (TEX-PEP) techniquehas been used for determining the adsorptive and diffusive properties of ann-hexane/2-
102 Measurement and Simulation of Binary Diffusion in Zeolites
methylpentane mixture at elevated temperatures (433 K). With this technique, the re-exchange of radioactively labelled molecules can be studied as a function of time andposition inside the reactor. By only labelling one of the components in the feed, themass transport properties of each individual component can be determined. Determi-nation of these properties is done by fitting a numerical model for mass transfer ina packed zeolite bed, accounting for convection, adsorption at the crystal boundary,and diffusion between and inside the crystals, to the measured concentration profiles.Under the conditions used in this study, the adsorption/desorption process at the crys-tal boundary does not have to be explicitly accounted for, as the diffusive process isthe rate-determining process at the crystal surface.
The system shows a slight preference for the adsorption ofn-hexane over2-methylpen-tane. This is due to the fact that it is entropically more favorable to adsorbthe linear alkane, as it can reside anywhere in the pore system, while the branchedalkane is preferentially adsorbed in the intersection between straight and zigzag chan-nels. This is in line with the conclusions obtained from CBMC simulations of Vlugtet al. at lower temperatures and a constant mixture ratio. CBMC simulations per-formed at similar conditions as in this work show a reasonable agreement, althougha slightly different behaviour is predicted by these calculations.
As was also observed in earlier studies, the diffusion of the fast-movingn-hexanemolecules is strongly influenced by the presence of the slowly diffusing2-methylpen-tane. The measurements however show a large drop in diffusivity at a large2-methylpentane fraction in the gas phase. Most likely, this is due to the blockingof the channel intersections by the slowly moving branched alkanes. This indicatesthat the adsorptive properties of the different components, together with the topologyof the zeolite pores plays an important role in the behaviour of multi-component sys-tems. Models based on mean field approximations of the diffusion, like Fick’s lawand Maxwell-Stefan diffusion, should therefore be treated with caution.
5.6 References
1 J. Karger and D. M. Ruthven,Diffusion in zeolites and other microporous solids, JohnWiley & Sons, Inc., New York (1992).
2 J. Karger,Determination of diffusion coefficients in porous media, in: Handbook of het-erogeneous catalysis, G. Ertl, H. Knozinger, and J. Weitkamp, eds., pp. 1253–1261, VCH,Weinheim (1997).
3 M. Heuchel, R. Q. Snurr, and E. Buss,Langmuir13, 6795–6804 (1997).4 S. Jost, N.-K. Bar, S. Fritzsche, R. Haberlandt, and J. Karger,J. Phys. Chem. B102(33),
6375–6381 (1998).5 L. F. Gladden, J. A. Sousa-Goncalves, and P. Alexander,J. Phys. Chem. B101(48),
10121–10127 (1997).
References 103
6 L. N. Gergidis, D. N. Theodorou, and H. Jobic,J. Phys. Chem. B104(23), 5541–5552(2000).
7 N. V. Choudhary, R. V. Jasra, S. G. T. Bhat, and T. S. R. P. Rao, in:Zeolites: Facts,figures, future, Proceedings of the 8th International Zeolite Conference, Amsterdam, TheNetherlands, July 10–14, 1989, P. A. Jacobs and R. A. van Santen, eds., vol. 49 ofStudiesin Surface Science and Catalysis, pp. 867–876, Elsevier, Amsterdam, The Netherlands(1994).
8 W. Niessen and H. G. Karge,Microporous Mater.1, 1–8 (1993).9 H. H. Funke, A. M. Argo, J. L. Falconer, and R. D. Noble,Ind. Eng. Chem. Res.36(1),
137–143 (1997).10 T. Masuda, Y. Fujikata, H. Ikeda, and K. Hashimoto,Microporous Mesoporous Mater.38,
323–332 (2000).11 B. G. Anderson, R. A. van Santen, and L. J. van IJzendoorn,Appl. Catal. A160, 125–138
(1997).12 B. G. Anderson, R. A. van Santen, and A. M. de Jong,Top. Catal.8, 125–131 (1999).13 B. G. Anderson, N. J. Noordhoek, F. J. M. M. de Gauw, L. J. van IJzendoorn, M. J. A.
de Voigt, and R. A. van Santen,Ind. Eng. Chem. Res.37(3), 815–824 (1998).14 R. R. Schumacher, B. G. Anderson, N. J. Noordhoek, F. J. M. M. de Gauw, A. M. de Jong,
M. J. A. de Voigt, and R. A. van Santen,Microporous Mesoporous Mater.35–36, 315–326(2000).
15 B. Smit and T. L. M. Maesen,Nature374, 42–44 (1995).16 R. H. Cunningham, A. V. G. Mangnus, J. van Grondelle, and R. A. van Santen,J. Molec.
Catal. A: Chem.107, 153–158 (1996).17 A. V. G. Mangnus, L. J. van IJzendoorn, J. J. M. de Goeij, R. H. Cunningham, R. A. van
Santen, and M. J. A. de Voigt,Nucl. Instr. and Meth. in Phys. Res. B99, 649–652 (1995).18 J. B. Rosen,J. Chem. Phys.20(3), 387–394 (1952).19 T. A. Nijhuis, L. J. P. van den Broeke, M. J. G. Linders, J. M. van de Graaf, F. Kapteijn,
M. Makkee, and J. A. Moulijn,Chem. Eng. Sci.54(4423–4436) (1999).20 N. J. Noordhoek, L. J. van IJzendoorn, B. G. Anderson, F. J. de Gauw, R. A. van Santen,
and M. J. A. de Voigt,Ind. Eng. Chem. Res.37(3), 825–833 (1998).21 U. Hong, J. Karger, R. Kramer, H. Pfeifer, G. Seiffert, U. Muller, K. K. Unger, H.-B.
Luck, and T. Ito,Zeolites11, 816–821 (1991).22 W. E. Schiesser,The Numerical Method of Lines: Integration of Partial Differential Equa-
tions, Academic Press, San Diego (1991).23 D. Marquardt,SIAM J. Appl. Math.11, 431–440 (1963).24 P. W. Atkins,Physical Chemistry, Oxford University Press, Oxford, United Kingdom, 5
ed. (1994).25 G. Emig and R. Dittmeyer,Handbook of heterogeneous catalysis, chap. Simultaneous
heat and mass transfer, 1209–1252, VCH, Weinheim (1997).26 Y. Yang and L. V. C. Rees,Microp. Mater.12, 117–122 (1997).27 W. J. M. van Well, J. P. Wolthuizen, B. Smit, J. H. C. van Hooff, and R. A. van Santen,
Angew. Chem. Int. Ed. Engl.34, 2543–2548 (1995).28 C. L. C. Jr. and D. M. Ruthven,Ind. Eng. Chem. Res.34(1), 177–184 (1995).29 T. J. H. Vlugt, R. Krishna, and B. Smit,J. Phys. Chem. B103(7), 1103–1118 (1999).30 V. Cottier, J.-P. Bellat, and M.-H. Simonot-Grange,J. Phys. Chem. B101(24), 4798–4802
104 Measurement and Simulation of Binary Diffusion in Zeolites
(1997).31 B. A. Buffham, G. Mason, and M. J. Heslop,Ind. Eng. Chem. Res.38(3), 1114–1124
(1999).32 R. Q. Snurr and J. Karger,J. Phys. Chem. B101(33), 6469–6473 (1997).33 B. Smit and J. I. Siepmann,J. Phys. Chem.98(34), 8442–8452 (1994).34 R. Schumacher and H. G. Karge,J. Phys. Chem. B103(9), 1477–1483 (1999).35 D. Schuring, A. P. J. Jansen, and R. A. van Santen,J. Phys. Chem. B104(5), 941–948
(2000).36 L. N. Gergidis and D. N. Theodorou,J. Phys. Chem. B103(17), 3380–3390 (1999).37 S. S. Nivarthi, H. T. Davis, and A. V. McCormick,Chem. Eng. Sci.50(20), 3217–3229
(1995).38 C. Forste, A. Germanus, J. Karger, H. Pfeifer, J. Caro, W. Pilz, and A. Zikanova,J. Chem.
Soc., Faraday Trans. 183(8), 2301–2309 (1987).39 F. Kapteijn, J. A. Moulijn, and R. Krishna,Chem. Eng. Sci.55, 2923–2930 (2000).40 R. Krishna,Chem. Phys. Lett.326, 477–484 (2000).41 M.-O. Coppens, A. T. Bell, and A. K. Chakraborty,Chem. Engng. Sci.53(11), 2053–2061
(1998).42 D. Paschek and R. Krishna,Phys. Chem. Chem. Phys.2, 2389–2394 (2000).43 D. Keffer, A. V. McCormick, and H. T. Davis,J. Phys. Chem.100(3), 967–973 (1996).
6The Influence of Siting onAdsorption and Diffusion
A number of different factors determine the behaviour of diffusing moleculesin zeolites. What is most important is the interaction between the differ-ent molecules. How strong they interact with each other is determinedby the pore topology and the siting of the molecules. The influence of thissiting is investigated using dynamic Monte Carlo simulations of a sim-ple 2-dimensional model of the zeolite pore system. Both the adsorptionand diffusion will be considered, and the influences of different modelassumptions will be investigated.
6.1 Introduction
As in many applications of zeolites as catalysts diffusion and adsorption in thesematerials occurs under varying concentrations and composition of the adsobents, abetter understanding of these processes in these materials is of practical importance.A number of different techniques have been applied to describe the diffusion in zeo-lites, ranging from microscopic simulations such as molecular dynamics1 and kineticMonte Carlo simulations,2 to phenomenological descriptions such as Fick’s law ofdiffusion3, 4 and Maxwell-Stefan theory.5, 6 Although molecular dynamics studieshave proven to be very useful in the study of diffusion on a microscopic level,7 thesesimulations are computationally rather demanding. As a result, their usefulness ismainly limited to species that move sufficiently fast through the zeolite, and mostefforts on simulating single-component and binary diffusion have been focussed onsmaller molecules.8–11 The phenomenological descriptions on the other hand are di-
106 The Influence of Siting on Adsorption and Diffusion
rectly applicable to describe the flow in laboratory-scale systems and are thus of greatpractical importance, but lack any intrinsic information about the specific structure ofthe zeolite and its interactions with the adsorbates. As a result, these methods oftenhave to rely on experimentally obtained information on the adsorptive and diffusivebehaviour of the adsorbates of interest in the specific zeolite.
One of the questions that has been raised by previous investigations12 is in whatway the diffusive behaviour is influenced by the specific siting (the place where themolecules are preferentially located) of the molecules in the pore system. Whilethe zeolite-alkane interactions determine the mobility of the individual species, thezeolite pore topology (i.e. the way in which the pores of the zeolite are connected)strongly determines how much hindrance these molecules experience from each other.This dependency is immediately clear when one considers zeolites with one-dimensio-nal pore structures compared to the three-dimensional systems. In the one-dimensionalcase, once the particles are adsorbed they are unable to pass each other,13 while inthe three-dimensional structure the particles are still able to overtake another by trav-elling via a different channel. A more subtle example of the structural dependencyis the exact position inside the pore system at which the different components in themixture reside. If a component strongly adsorbs in the intersections between differ-ent channels and essentially block the way for other molecules, a stronger influenceon the mobility can be expected than when these particles adsorb in the channels.
As the main interest is the influence of the pore topology and the siting of themolecules in these channels, a detailed model of the interactions between adsorbatesand the zeolite is not essential, and a less detailed type of simulation can be ap-plied. Dynamic (sometimes also referred to as kinetic) Monte Carlo simulations haveproven to provide useful insight in the influence of pore topology, strong adsorptionsites and concentration on the diffusivity.14–16 In these simulations, the zeolite poresare treated as a sequence of adsorption sites, whereby diffusion takes place by jump-ing from one site to another. As a result, these simulations are computationally muchless demanding than detailed molecular dynamics simulations. While in principleit is possible to construct a detailed model of the zeolite-sorbate system,17 the maininterest in this chapter is to get some feeling of the influence of the siting on theadsorptive and diffusive behaviour. Therefore, a much simpler approach is chosen,in which a 2-dimensional lattice model is used in which only some of the essentialfeatures observed in real systems is built in.
This chapter will start with a short discussion of the dynamic Monte Carlo tech-nique. Next, the lattice model used in this study will be discussed. For the construc-tion of this simulation lattice, the behaviour of alkanes in silicalite will be considered,and some of the essential features of these systems will be incorporated. The modelswill first be used to study the adsorptive and diffusive behaviour of single compo-
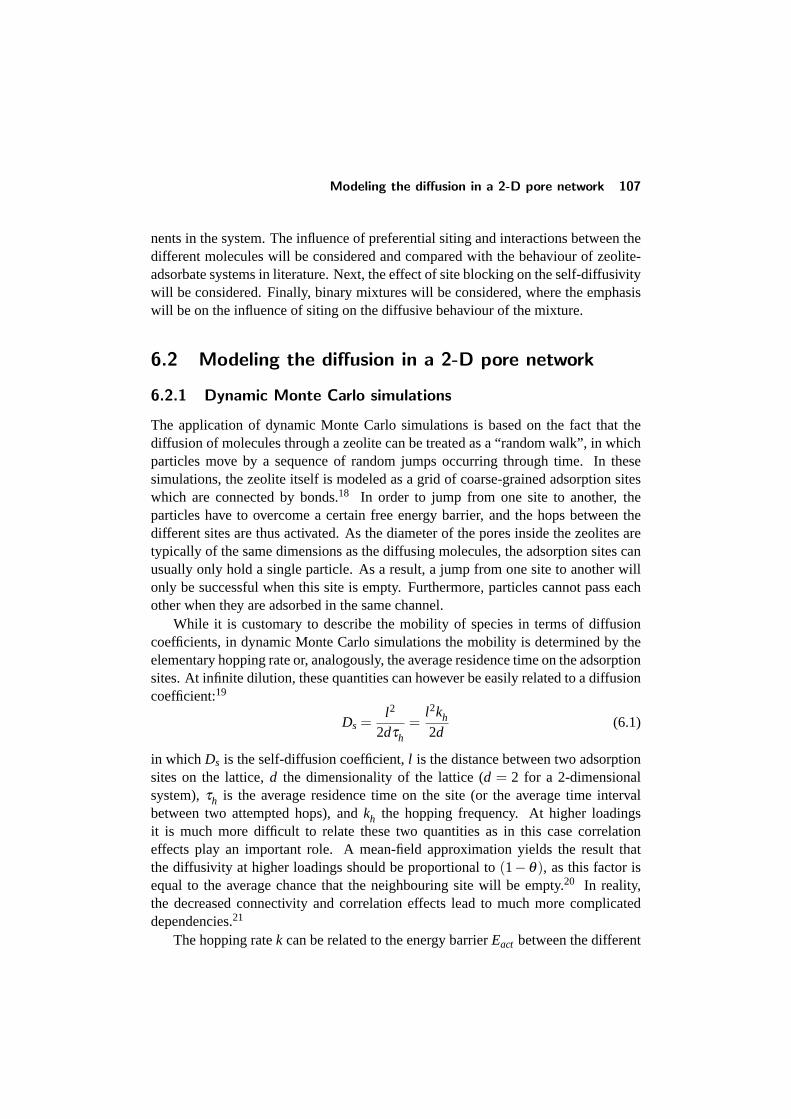
Modeling the diffusion in a 2-D pore network 107
nents in the system. The influence of preferential siting and interactions between thedifferent molecules will be considered and compared with the behaviour of zeolite-adsorbate systems in literature. Next, the effect of site blocking on the self-diffusivitywill be considered. Finally, binary mixtures will be considered, where the emphasiswill be on the influence of siting on the diffusive behaviour of the mixture.
6.2 Modeling the diffusion in a 2-D pore network
6.2.1 Dynamic Monte Carlo simulations
The application of dynamic Monte Carlo simulations is based on the fact that thediffusion of molecules through a zeolite can be treated as a “random walk”, in whichparticles move by a sequence of random jumps occurring through time. In thesesimulations, the zeolite itself is modeled as a grid of coarse-grained adsorption siteswhich are connected by bonds.18 In order to jump from one site to another, theparticles have to overcome a certain free energy barrier, and the hops between thedifferent sites are thus activated. As the diameter of the pores inside the zeolites aretypically of the same dimensions as the diffusing molecules, the adsorption sites canusually only hold a single particle. As a result, a jump from one site to another willonly be successful when this site is empty. Furthermore, particles cannot pass eachother when they are adsorbed in the same channel.
While it is customary to describe the mobility of species in terms of diffusioncoefficients, in dynamic Monte Carlo simulations the mobility is determined by theelementary hopping rate or, analogously, the average residence time on the adsorptionsites. At infinite dilution, these quantities can however be easily related to a diffusioncoefficient:19
Ds =l2
2dτh=
l2kh
2d(6.1)
in which Ds is the self-diffusion coefficient,l is the distance between two adsorptionsites on the lattice,d the dimensionality of the lattice (d = 2 for a 2-dimensionalsystem),τh is the average residence time on the site (or the average time intervalbetween two attempted hops), andkh the hopping frequency. At higher loadingsit is much more difficult to relate these two quantities as in this case correlationeffects play an important role. A mean-field approximation yields the result thatthe diffusivity at higher loadings should be proportional to(1− θ), as this factor isequal to the average chance that the neighbouring site will be empty.20 In reality,the decreased connectivity and correlation effects lead to much more complicateddependencies.21
The hopping ratek can be related to the energy barrierEact between the different
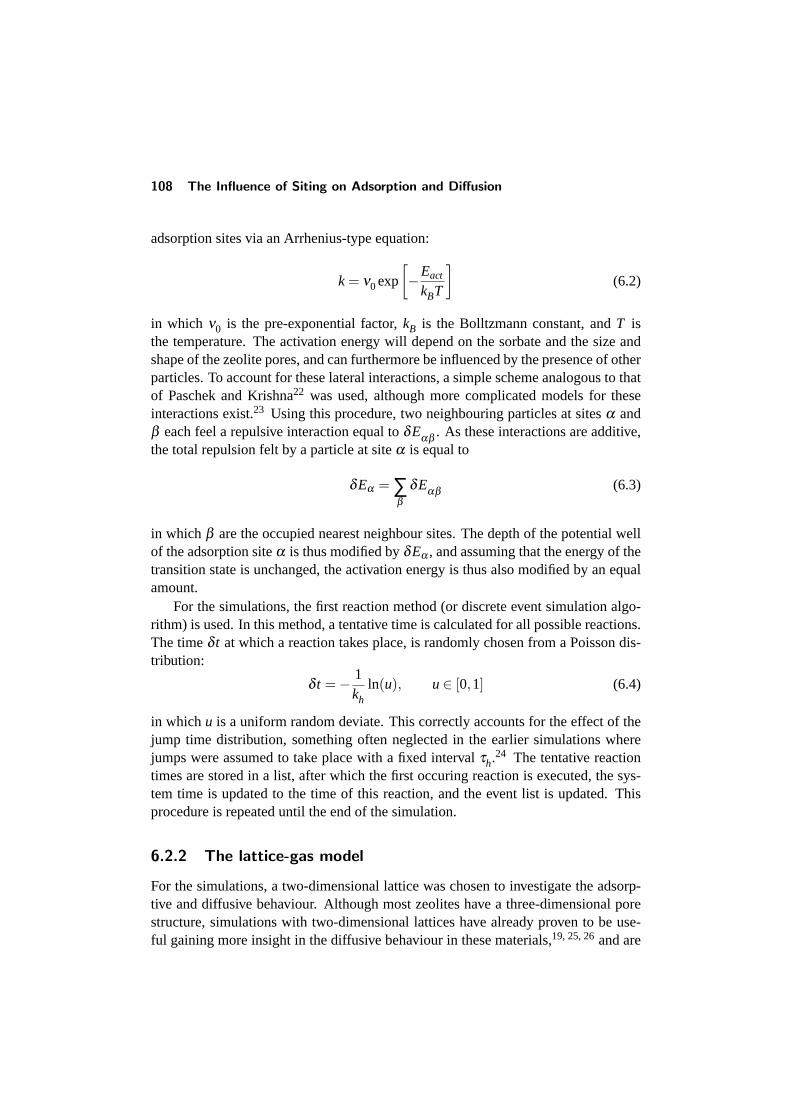
108 The Influence of Siting on Adsorption and Diffusion
adsorption sites via an Arrhenius-type equation:
k = ν0exp
[−Eact
kBT
](6.2)
in which ν0 is the pre-exponential factor,kB is the Bolltzmann constant, andT isthe temperature. The activation energy will depend on the sorbate and the size andshape of the zeolite pores, and can furthermore be influenced by the presence of otherparticles. To account for these lateral interactions, a simple scheme analogous to thatof Paschek and Krishna22 was used, although more complicated models for theseinteractions exist.23 Using this procedure, two neighbouring particles at sitesα andβ each feel a repulsive interaction equal toδE
αβ. As these interactions are additive,
the total repulsion felt by a particle at siteα is equal to
δEα = ∑β
δEαβ
(6.3)
in which β are the occupied nearest neighbour sites. The depth of the potential wellof the adsorption siteα is thus modified byδEα , and assuming that the energy of thetransition state is unchanged, the activation energy is thus also modified by an equalamount.
For the simulations, the first reaction method (or discrete event simulation algo-rithm) is used. In this method, a tentative time is calculated for all possible reactions.The timeδ t at which a reaction takes place, is randomly chosen from a Poisson dis-tribution:
δ t =− 1kh
ln(u), u∈ [0,1] (6.4)
in which u is a uniform random deviate. This correctly accounts for the effect of thejump time distribution, something often neglected in the earlier simulations wherejumps were assumed to take place with a fixed intervalτh.24 The tentative reactiontimes are stored in a list, after which the first occuring reaction is executed, the sys-tem time is updated to the time of this reaction, and the event list is updated. Thisprocedure is repeated until the end of the simulation.
6.2.2 The lattice-gas model
For the simulations, a two-dimensional lattice was chosen to investigate the adsorp-tive and diffusive behaviour. Although most zeolites have a three-dimensional porestructure, simulations with two-dimensional lattices have already proven to be use-ful gaining more insight in the diffusive behaviour in these materials,19, 25, 26and are
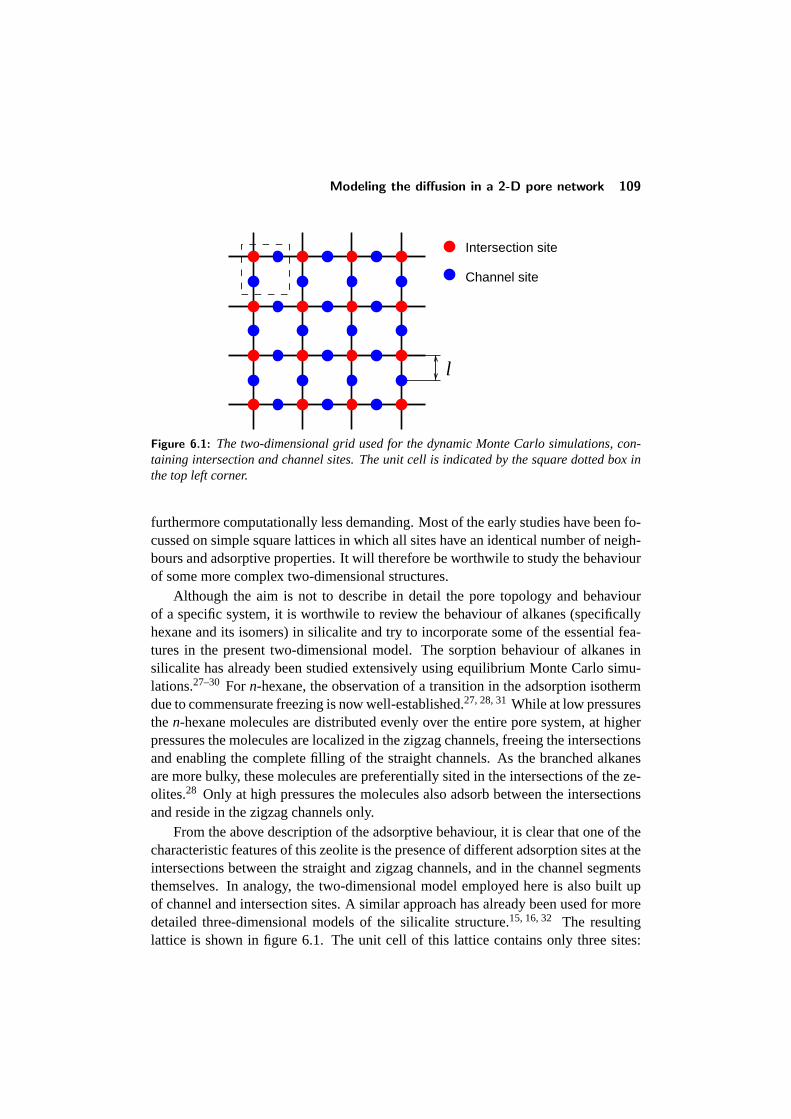
Modeling the diffusion in a 2-D pore network 109
Intersection site
Channel site
l
Figure 6.1: The two-dimensional grid used for the dynamic Monte Carlo simulations, con-taining intersection and channel sites. The unit cell is indicated by the square dotted box inthe top left corner.
furthermore computationally less demanding. Most of the early studies have been fo-cussed on simple square lattices in which all sites have an identical number of neigh-bours and adsorptive properties. It will therefore be worthwile to study the behaviourof some more complex two-dimensional structures.
Although the aim is not to describe in detail the pore topology and behaviourof a specific system, it is worthwile to review the behaviour of alkanes (specificallyhexane and its isomers) in silicalite and try to incorporate some of the essential fea-tures in the present two-dimensional model. The sorption behaviour of alkanes insilicalite has already been studied extensively using equilibrium Monte Carlo simu-lations.27–30 For n-hexane, the observation of a transition in the adsorption isothermdue to commensurate freezing is now well-established.27, 28, 31While at low pressuresthen-hexane molecules are distributed evenly over the entire pore system, at higherpressures the molecules are localized in the zigzag channels, freeing the intersectionsand enabling the complete filling of the straight channels. As the branched alkanesare more bulky, these molecules are preferentially sited in the intersections of the ze-olites.28 Only at high pressures the molecules also adsorb between the intersectionsand reside in the zigzag channels only.
From the above description of the adsorptive behaviour, it is clear that one of thecharacteristic features of this zeolite is the presence of different adsorption sites at theintersections between the straight and zigzag channels, and in the channel segmentsthemselves. In analogy, the two-dimensional model employed here is also built upof channel and intersection sites. A similar approach has already been used for moredetailed three-dimensional models of the silicalite structure.15, 16, 32 The resultinglattice is shown in figure 6.1. The unit cell of this lattice contains only three sites:
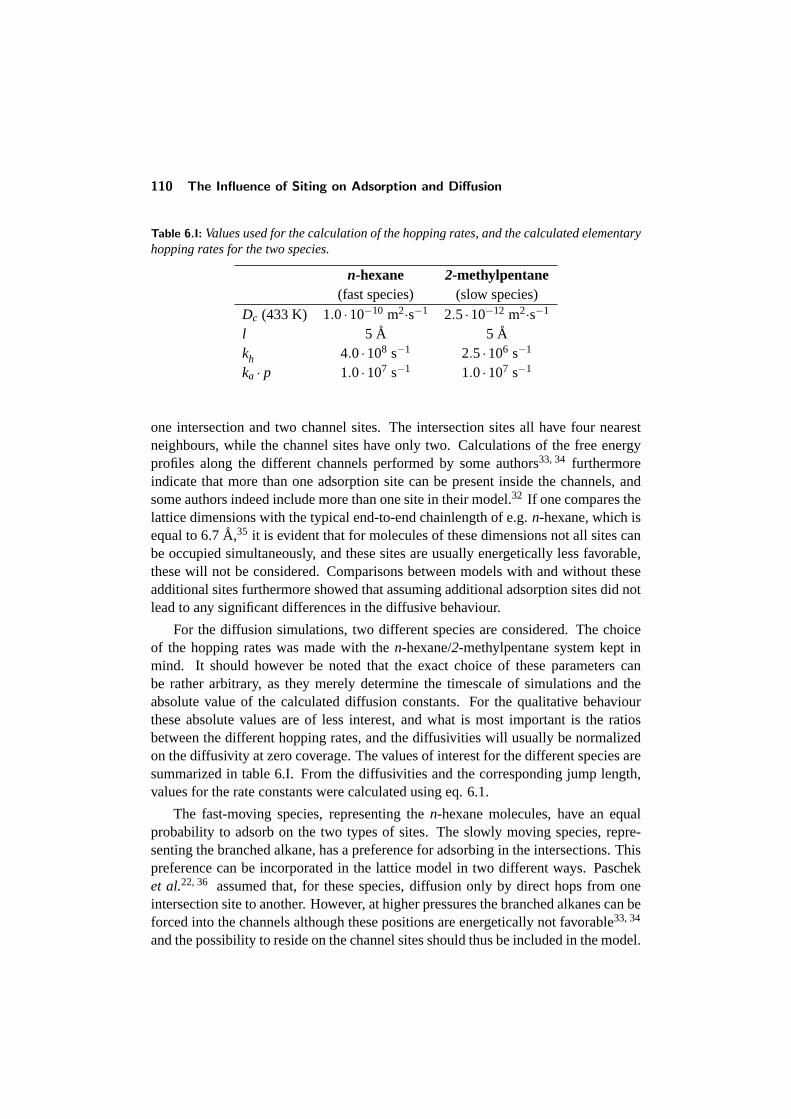
110 The Influence of Siting on Adsorption and Diffusion
Table 6.I: Values used for the calculation of the hopping rates, and the calculated elementaryhopping rates for the two species.
n-hexane 2-methylpentane(fast species) (slow species)
Dc (433 K) 1.0·10−10 m2·s−1 2.5·10−12 m2·s−1
l 5 A 5 Akh 4.0·108 s−1 2.5·106 s−1
ka · p 1.0·107 s−1 1.0·107 s−1
one intersection and two channel sites. The intersection sites all have four nearestneighbours, while the channel sites have only two. Calculations of the free energyprofiles along the different channels performed by some authors33, 34 furthermoreindicate that more than one adsorption site can be present inside the channels, andsome authors indeed include more than one site in their model.32 If one compares thelattice dimensions with the typical end-to-end chainlength of e.g.n-hexane, which isequal to 6.7A,35 it is evident that for molecules of these dimensions not all sites canbe occupied simultaneously, and these sites are usually energetically less favorable,these will not be considered. Comparisons between models with and without theseadditional sites furthermore showed that assuming additional adsorption sites did notlead to any significant differences in the diffusive behaviour.
For the diffusion simulations, two different species are considered. The choiceof the hopping rates was made with then-hexane/2-methylpentane system kept inmind. It should however be noted that the exact choice of these parameters canbe rather arbitrary, as they merely determine the timescale of simulations and theabsolute value of the calculated diffusion constants. For the qualitative behaviourthese absolute values are of less interest, and what is most important is the ratiosbetween the different hopping rates, and the diffusivities will usually be normalizedon the diffusivity at zero coverage. The values of interest for the different species aresummarized in table 6.I. From the diffusivities and the corresponding jump length,values for the rate constants were calculated using eq. 6.1.
The fast-moving species, representing then-hexane molecules, have an equalprobability to adsorb on the two types of sites. The slowly moving species, repre-senting the branched alkane, has a preference for adsorbing in the intersections. Thispreference can be incorporated in the lattice model in two different ways. Pascheket al.22, 36 assumed that, for these species, diffusion only by direct hops from oneintersection site to another. However, at higher pressures the branched alkanes can beforced into the channels although these positions are energetically not favorable33, 34
and the possibility to reside on the channel sites should thus be included in the model.
Modeling the diffusion in a 2-D pore network 111
The other method that can be applied to account for this behaviour is to assume thatthe rate of jumping from an intersection site to a channel site (ki→c) is much slowerthat the backward step (kc→i). This model reflects that, in the narrow channels, thebulky branched isomer is destabilized due to steric constraints, leading to a muchweaker adsorption and lower activation barriers for a jump to the intersections.33 Atlower loadings, an equilibrium will thus be reached, and the occupation of the inter-section sites compared to that of the channel sites will be equal to the ratio betweenthe forward and backward step.
Apart from diffusion, adsorption of molecules will also be considered. As the ad-sorption of molecules only takes place at the pore mouth, these processes are assumedto only occur at the edges of the lattice. The rate of adsorption can be estimated usinggas kinetic theory:37
ka =1
4α
s0p√2πmkBT
A (6.5)
in which p is the gas-phase pressure,s0 is the sticking coefficient at zero loading,A the surface area of the zeolite pore, andm the mass of the particle. The factorα
accounts for the fact that not all collisions will lead to a succesful adsorption, andthat adsorption might also take place due to surface diffusion effects.32 From thisequation, it can be seen that the rate of adsorption depends linearly on the gas-phasepressure. The value ofα is difficult to determine, but in general this factor seemsto be larger than one as the surface diffusion significantly enhances the adsorptionrate. For the rate of desorption it is assumed that no surface barrier exists for thisprocess, and the desorption rate is identical to the diffusion rate. Again, the exactvalues of these parameters are not important, as it is the ratio between the adsorptionand desorption rate which in the first place determines the equilibrium loading in thesimulation grid.
6.2.3 Computational details
The model described in the previous section provides a stochastical description forthe diffusion of molecules through a two-dimensional lattice. The time evolution ofsuch a system can be described by the chemical Master Equation (ME), which canbe solved numerically using dynamic Monte Carlo simulations.38, 39 A number ofdifferent Monte Carlo methods can be used, all yielding similar result but varyingin efficiency for different systems.40 In this study, the general-purpose Monte Carlocode Carlos41 was used. This program implements the first reaction method andthe variable step-size method, depending on the rate of the different reactions in themodel. A detailed description of the program and algorithms can be found in Segers40
and Lukkienet al.41
112 The Influence of Siting on Adsorption and Diffusion
At the start of the simulation, the lattice has to be defined. The number of siteswas chosen to be sufficiently large in order to reduce finite size effects. Simulationsconducted with different grid sizes showed that for lattices consisting of 100×100sites and more yielded identical results, and all lattices were taken equal to or greaterthan this size. When the adsorption of a species is simulated, the lattice is initiallyempty. The boundary of the pore network is then subject to a gas phase, after whichthe simulation is run for a certain amount of time. During this run, the loading of thelattice is regularly monitored, and the run is continued until an equilibrium is reachedafter which the loading is determined. The loading or coverageθ is defined as:
θ =Nads
Nmax(6.6)
in whichNads is the number of adsorbed particles, andNmax the maximum number ofparticles that can be adsorbed on a given lattice model. The coverage thus equals theratio between occupied sites and the number of sites that can be occupied at infinitepressure (which is not necessarily the total number of adsorption sites). In case ofsimulations in which the dynamic properties are of interest, the particles are randomlyplaced on the lattice until the desired loading is reached. In this case, adsorption anddesorption are not allowed, and periodic boundary conditions are applied. For theindividual particles, the position is determined at different times so that the mean-square displacement can be calculated. From this displacement the self-diffusioncoefficient (Dc) can then be calculated using the Einstein relation.
6.3 Adsorption of Single-component systems
Before binary diffusion and adsorption will be investigated, it is worthwile to examinethe single-component behaviour first. One of the interesting features present in theadsorption isotherms of single components is the inflection at certain loadings, as forexample observed for linear and branched alkanes in silicalite.42–44 The existence ofthese inflections seem to be strongly related to the positions inside the zeolite porenetwork at which the molecules are preferentially located.27, 45 As some of theseeffects can be easily incorporated in the Monte Carlo model, the influence on thecalculated adsorption isotherms can be studied.
6.3.1 Influence of preferential siting
Figure 6.2 shows the calculated adsorption isotherms for the lattice containing chan-nel and intersection sites using the parameters as discussed in section 6.2.2, both withand without preferential adsorption in the intersections. For the system without pref-erential adsorption, a simple langmuir-type adsorption isotherm is observed. In this
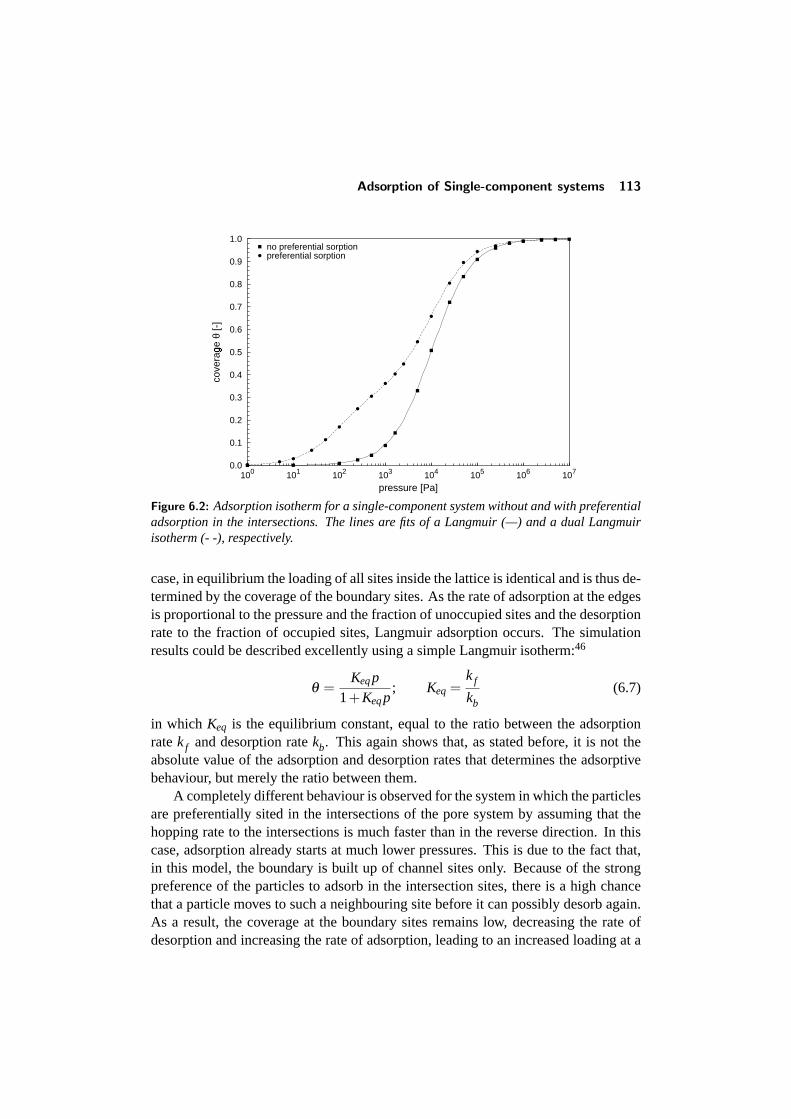
Adsorption of Single-component systems 113
0.0
0.1
0.2
0.3
0.4
0.5
0.6
0.7
0.8
0.9
1.0
100 101 102 103 104 105 106 107
cove
rage
�
θ [-
]
pressure [Pa]
no preferential sorptionpreferential sorption
Figure 6.2: Adsorption isotherm for a single-component system without and with preferentialadsorption in the intersections. The lines are fits of a Langmuir (—) and a dual Langmuirisotherm (- -), respectively.
case, in equilibrium the loading of all sites inside the lattice is identical and is thus de-termined by the coverage of the boundary sites. As the rate of adsorption at the edgesis proportional to the pressure and the fraction of unoccupied sites and the desorptionrate to the fraction of occupied sites, Langmuir adsorption occurs. The simulationresults could be described excellently using a simple Langmuir isotherm:46
θ =Keqp
1+Keqp; Keq =
kf
kb(6.7)
in which Keq is the equilibrium constant, equal to the ratio between the adsorptionratekf and desorption ratekb. This again shows that, as stated before, it is not theabsolute value of the adsorption and desorption rates that determines the adsorptivebehaviour, but merely the ratio between them.
A completely different behaviour is observed for the system in which the particlesare preferentially sited in the intersections of the pore system by assuming that thehopping rate to the intersections is much faster than in the reverse direction. In thiscase, adsorption already starts at much lower pressures. This is due to the fact that,in this model, the boundary is built up of channel sites only. Because of the strongpreference of the particles to adsorb in the intersection sites, there is a high chancethat a particle moves to such a neighbouring site before it can possibly desorb again.As a result, the coverage at the boundary sites remains low, decreasing the rate ofdesorption and increasing the rate of adsorption, leading to an increased loading at a
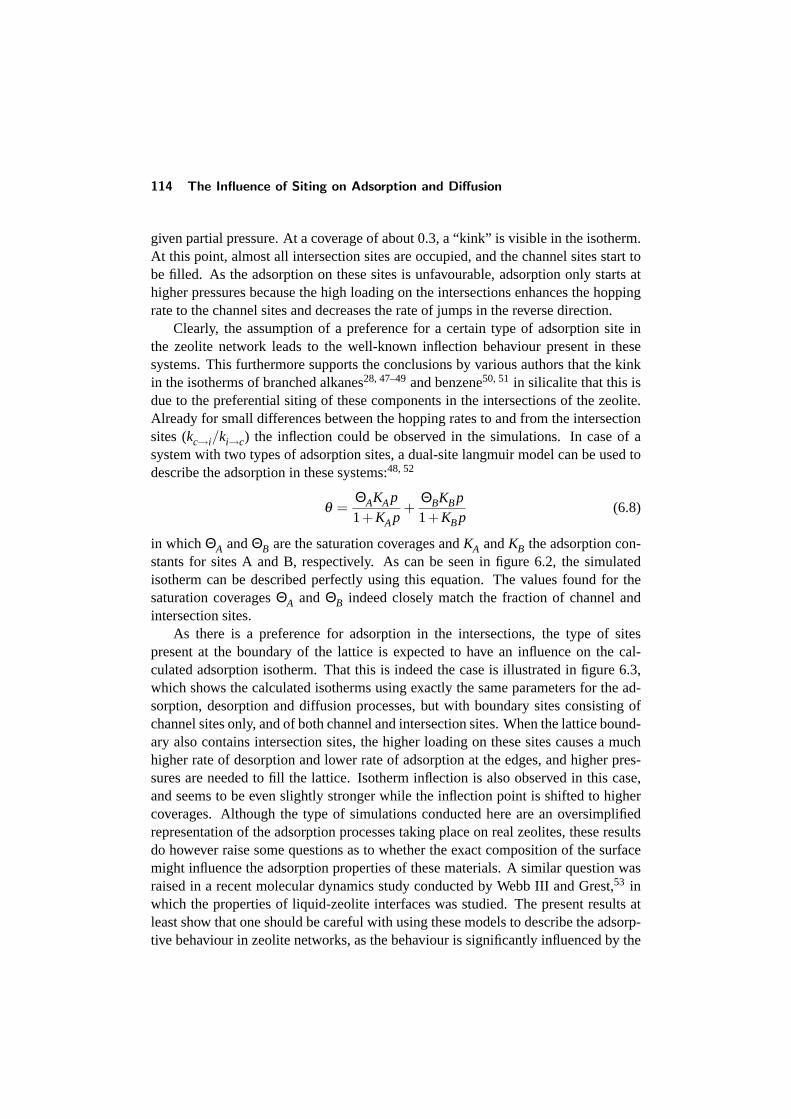
114 The Influence of Siting on Adsorption and Diffusion
given partial pressure. At a coverage of about 0.3, a “kink” is visible in the isotherm.At this point, almost all intersection sites are occupied, and the channel sites start tobe filled. As the adsorption on these sites is unfavourable, adsorption only starts athigher pressures because the high loading on the intersections enhances the hoppingrate to the channel sites and decreases the rate of jumps in the reverse direction.
Clearly, the assumption of a preference for a certain type of adsorption site inthe zeolite network leads to the well-known inflection behaviour present in thesesystems. This furthermore supports the conclusions by various authors that the kinkin the isotherms of branched alkanes28, 47–49and benzene50, 51 in silicalite that this isdue to the preferential siting of these components in the intersections of the zeolite.Already for small differences between the hopping rates to and from the intersectionsites (kc→i/ki→c) the inflection could be observed in the simulations. In case of asystem with two types of adsorption sites, a dual-site langmuir model can be used todescribe the adsorption in these systems:48, 52
θ =ΘAKAp
1+KAp+
ΘBKBp1+KBp
(6.8)
in which ΘA andΘB are the saturation coverages andKA andKB the adsorption con-stants for sites A and B, respectively. As can be seen in figure 6.2, the simulatedisotherm can be described perfectly using this equation. The values found for thesaturation coveragesΘA and ΘB indeed closely match the fraction of channel andintersection sites.
As there is a preference for adsorption in the intersections, the type of sitespresent at the boundary of the lattice is expected to have an influence on the cal-culated adsorption isotherm. That this is indeed the case is illustrated in figure 6.3,which shows the calculated isotherms using exactly the same parameters for the ad-sorption, desorption and diffusion processes, but with boundary sites consisting ofchannel sites only, and of both channel and intersection sites. When the lattice bound-ary also contains intersection sites, the higher loading on these sites causes a muchhigher rate of desorption and lower rate of adsorption at the edges, and higher pres-sures are needed to fill the lattice. Isotherm inflection is also observed in this case,and seems to be even slightly stronger while the inflection point is shifted to highercoverages. Although the type of simulations conducted here are an oversimplifiedrepresentation of the adsorption processes taking place on real zeolites, these resultsdo however raise some questions as to whether the exact composition of the surfacemight influence the adsorption properties of these materials. A similar question wasraised in a recent molecular dynamics study conducted by Webb III and Grest,53 inwhich the properties of liquid-zeolite interfaces was studied. The present results atleast show that one should be careful with using these models to describe the adsorp-tive behaviour in zeolite networks, as the behaviour is significantly influenced by the
Adsorption of Single-component systems 115
0.0
0.1
0.2
0.3
0.4
0.5
0.6
0.7
0.8
0.9
1.0
100 101 102 103 104 105 106 107
cove
rage
�
θ [-
]
pressure [Pa]
channel sites at boundaryboth sites at boundary
Figure 6.3: Adsorption isotherm for a single-component system on a lattice with only channelsites at the boundaries (—), and with both channel and intersection sites (- -).
model assumptions.
6.3.2 Influence of lateral interactions
For the inflection observed in the adsorption isotherms of certain linear alkanes (likeethane, hexane, heptane) in silicalite, an alternative explanation was originally for-warded by Smit and Maesen.27 According to these authors, at low pressures thesemolecules do not show any preference to reside in a certain part of the zeolite porenetwork, while at higher loadings a certain ordering takes place where the moleculesare preferentially located in the channels. The cause of this type of ordering must bedue to interactions between the molecules themselves, as they are obviously causedby the increased loading inside the zeolite. These lateral interactions were incorpo-rated in the model in two different ways. In the first model, it was assumed thatnearest-neighbours feel a repulsive interaction which decreases the activation barrierof the particles to hop to another site, as was already explained in section 6.2.1. Inthis case, it is still possible that two neighbouring sites are occupied, although thisis energetically not favourable. A second way to model this behaviour is by totallyexcluding the simultaneous occupation of two neighbouring sites.
The calculated isotherms using these models are shown in figure 6.4. For the firstmodel, a distinct kink in the isotherm is also observed, but at higher coverages thanthe previous simulations. At low coverages the particles are adsorbed evenly acrossthe entire lattice. With increasing loading the particles start to feel each others pres-
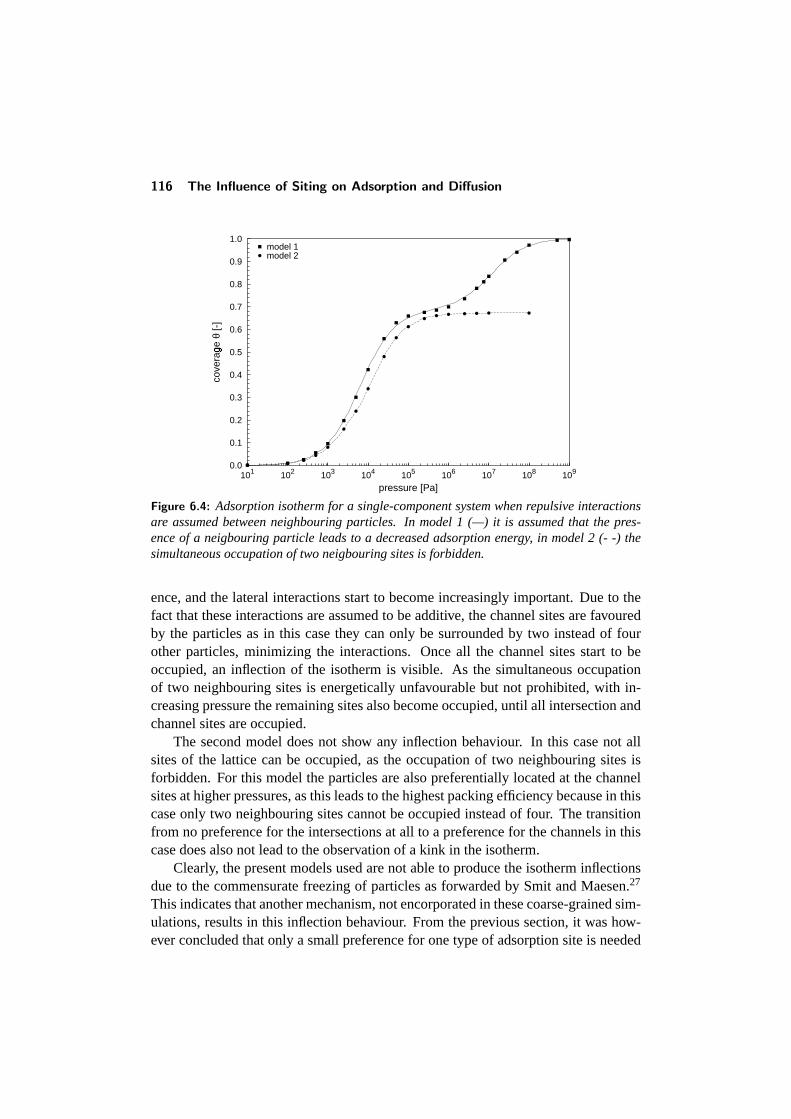
116 The Influence of Siting on Adsorption and Diffusion
0.0
0.1
0.2
0.3
0.4
0.5
0.6
0.7
0.8
0.9
1.0
101 102 103 104 105 106 107 108 109
cove
rage
�
θ [-
]
pressure [Pa]
model 1model 2
Figure 6.4: Adsorption isotherm for a single-component system when repulsive interactionsare assumed between neighbouring particles. In model 1 (—) it is assumed that the pres-ence of a neigbouring particle leads to a decreased adsorption energy, in model 2 (- -) thesimultaneous occupation of two neigbouring sites is forbidden.
ence, and the lateral interactions start to become increasingly important. Due to thefact that these interactions are assumed to be additive, the channel sites are favouredby the particles as in this case they can only be surrounded by two instead of fourother particles, minimizing the interactions. Once all the channel sites start to beoccupied, an inflection of the isotherm is visible. As the simultaneous occupationof two neighbouring sites is energetically unfavourable but not prohibited, with in-creasing pressure the remaining sites also become occupied, until all intersection andchannel sites are occupied.
The second model does not show any inflection behaviour. In this case not allsites of the lattice can be occupied, as the occupation of two neighbouring sites isforbidden. For this model the particles are also preferentially located at the channelsites at higher pressures, as this leads to the highest packing efficiency because in thiscase only two neighbouring sites cannot be occupied instead of four. The transitionfrom no preference for the intersections at all to a preference for the channels in thiscase does also not lead to the observation of a kink in the isotherm.
Clearly, the present models used are not able to produce the isotherm inflectionsdue to the commensurate freezing of particles as forwarded by Smit and Maesen.27
This indicates that another mechanism, not encorporated in these coarse-grained sim-ulations, results in this inflection behaviour. From the previous section, it was how-ever concluded that only a small preference for one type of adsorption site is needed
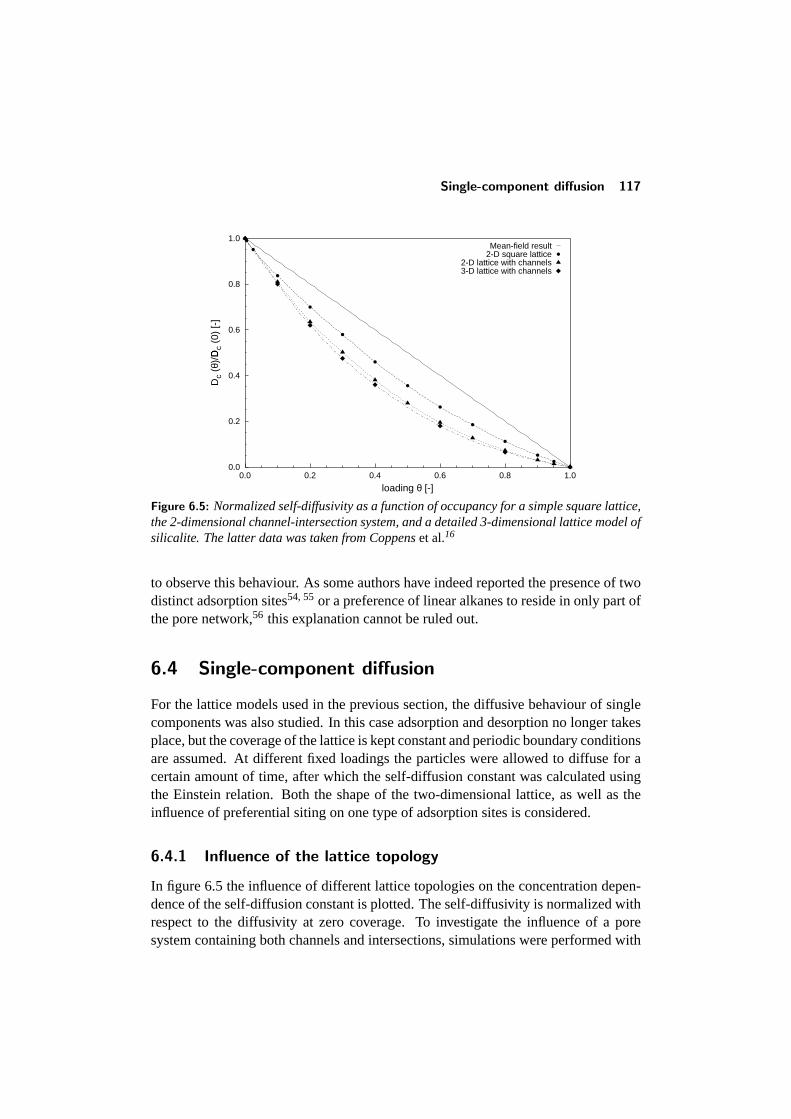
Single-component diffusion 117
0.0
0.2
0.4
0.6
0.8
1.0
0.0 0.2 0.4 0.6 0.8 1.0
Dc
(θ)/
D
� c (0
) [-
]
loading θ [-]
Mean-field result2-D square lattice
2-D lattice with channels3-D lattice with channels
Figure 6.5: Normalized self-diffusivity as a function of occupancy for a simple square lattice,the 2-dimensional channel-intersection system, and a detailed 3-dimensional lattice model ofsilicalite. The latter data was taken from Coppenset al.16
to observe this behaviour. As some authors have indeed reported the presence of twodistinct adsorption sites54, 55or a preference of linear alkanes to reside in only part ofthe pore network,56 this explanation cannot be ruled out.
6.4 Single-component diffusion
For the lattice models used in the previous section, the diffusive behaviour of singlecomponents was also studied. In this case adsorption and desorption no longer takesplace, but the coverage of the lattice is kept constant and periodic boundary conditionsare assumed. At different fixed loadings the particles were allowed to diffuse for acertain amount of time, after which the self-diffusion constant was calculated usingthe Einstein relation. Both the shape of the two-dimensional lattice, as well as theinfluence of preferential siting on one type of adsorption sites is considered.
6.4.1 Influence of the lattice topology
In figure 6.5 the influence of different lattice topologies on the concentration depen-dence of the self-diffusion constant is plotted. The self-diffusivity is normalized withrespect to the diffusivity at zero coverage. To investigate the influence of a poresystem containing both channels and intersections, simulations were performed with
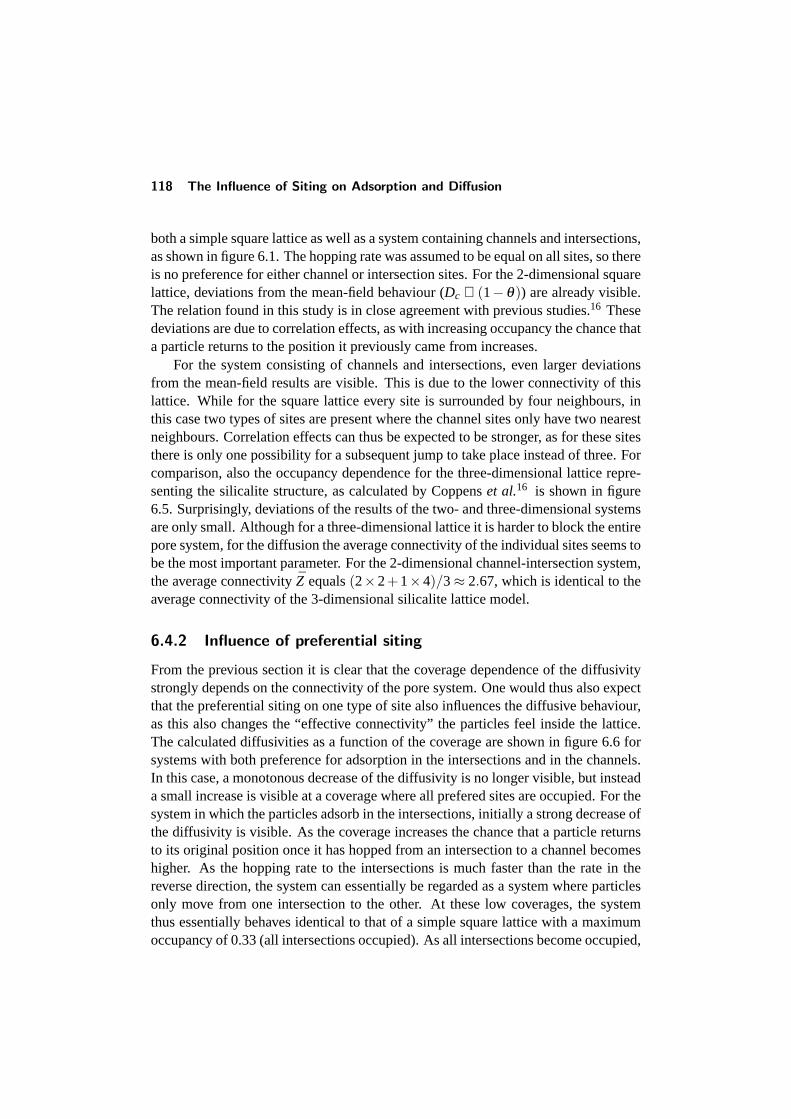
118 The Influence of Siting on Adsorption and Diffusion
both a simple square lattice as well as a system containing channels and intersections,as shown in figure 6.1. The hopping rate was assumed to be equal on all sites, so thereis no preference for either channel or intersection sites. For the 2-dimensional squarelattice, deviations from the mean-field behaviour (Dc ∝ (1−θ)) are already visible.The relation found in this study is in close agreement with previous studies.16 Thesedeviations are due to correlation effects, as with increasing occupancy the chance thata particle returns to the position it previously came from increases.
For the system consisting of channels and intersections, even larger deviationsfrom the mean-field results are visible. This is due to the lower connectivity of thislattice. While for the square lattice every site is surrounded by four neighbours, inthis case two types of sites are present where the channel sites only have two nearestneighbours. Correlation effects can thus be expected to be stronger, as for these sitesthere is only one possibility for a subsequent jump to take place instead of three. Forcomparison, also the occupancy dependence for the three-dimensional lattice repre-senting the silicalite structure, as calculated by Coppenset al.16 is shown in figure6.5. Surprisingly, deviations of the results of the two- and three-dimensional systemsare only small. Although for a three-dimensional lattice it is harder to block the entirepore system, for the diffusion the average connectivity of the individual sites seems tobe the most important parameter. For the 2-dimensional channel-intersection system,the average connectivityZ equals(2×2+1×4)/3≈ 2.67, which is identical to theaverage connectivity of the 3-dimensional silicalite lattice model.
6.4.2 Influence of preferential siting
From the previous section it is clear that the coverage dependence of the diffusivitystrongly depends on the connectivity of the pore system. One would thus also expectthat the preferential siting on one type of site also influences the diffusive behaviour,as this also changes the “effective connectivity” the particles feel inside the lattice.The calculated diffusivities as a function of the coverage are shown in figure 6.6 forsystems with both preference for adsorption in the intersections and in the channels.In this case, a monotonous decrease of the diffusivity is no longer visible, but insteada small increase is visible at a coverage where all prefered sites are occupied. For thesystem in which the particles adsorb in the intersections, initially a strong decrease ofthe diffusivity is visible. As the coverage increases the chance that a particle returnsto its original position once it has hopped from an intersection to a channel becomeshigher. As the hopping rate to the intersections is much faster than the rate in thereverse direction, the system can essentially be regarded as a system where particlesonly move from one intersection to the other. At these low coverages, the systemthus essentially behaves identical to that of a simple square lattice with a maximumoccupancy of 0.33 (all intersections occupied). As all intersections become occupied,
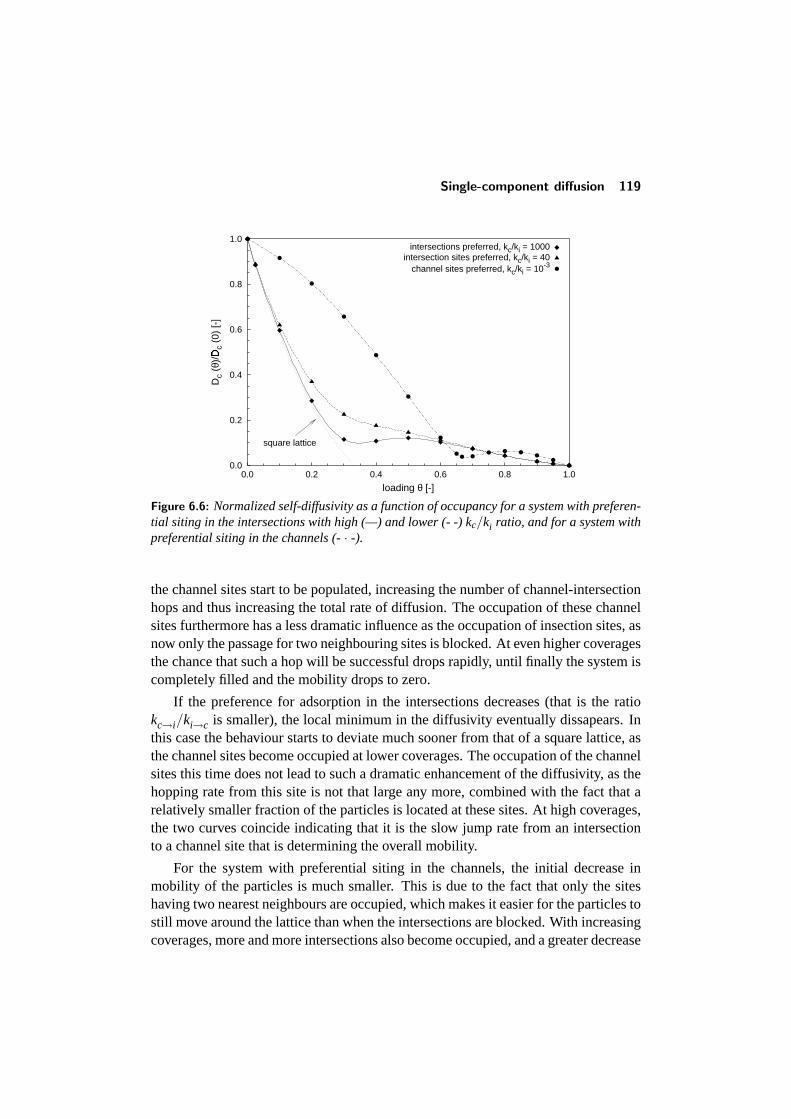
Single-component diffusion 119
0.0
0.2
0.4
0.6
0.8
1.0
0.0 0.2 0.4 0.6 0.8 1.0
Dc
(θ)/
D
� c (0
) [-
]
loading θ [-]
square lattice
intersections preferred, kc/ki = 1000intersection sites preferred, kc/ki = 40
channel sites preferred, kc/ki = 10-3
Figure 6.6: Normalized self-diffusivity as a function of occupancy for a system with preferen-tial siting in the intersections with high (—) and lower (- -) kc/ki ratio, and for a system withpreferential siting in the channels (-· -).
the channel sites start to be populated, increasing the number of channel-intersectionhops and thus increasing the total rate of diffusion. The occupation of these channelsites furthermore has a less dramatic influence as the occupation of insection sites, asnow only the passage for two neighbouring sites is blocked. At even higher coveragesthe chance that such a hop will be successful drops rapidly, until finally the system iscompletely filled and the mobility drops to zero.
If the preference for adsorption in the intersections decreases (that is the ratiokc→i/ki→c is smaller), the local minimum in the diffusivity eventually dissapears. Inthis case the behaviour starts to deviate much sooner from that of a square lattice, asthe channel sites become occupied at lower coverages. The occupation of the channelsites this time does not lead to such a dramatic enhancement of the diffusivity, as thehopping rate from this site is not that large any more, combined with the fact that arelatively smaller fraction of the particles is located at these sites. At high coverages,the two curves coincide indicating that it is the slow jump rate from an intersectionto a channel site that is determining the overall mobility.
For the system with preferential siting in the channels, the initial decrease inmobility of the particles is much smaller. This is due to the fact that only the siteshaving two nearest neighbours are occupied, which makes it easier for the particles tostill move around the lattice than when the intersections are blocked. With increasingcoverages, more and more intersections also become occupied, and a greater decrease
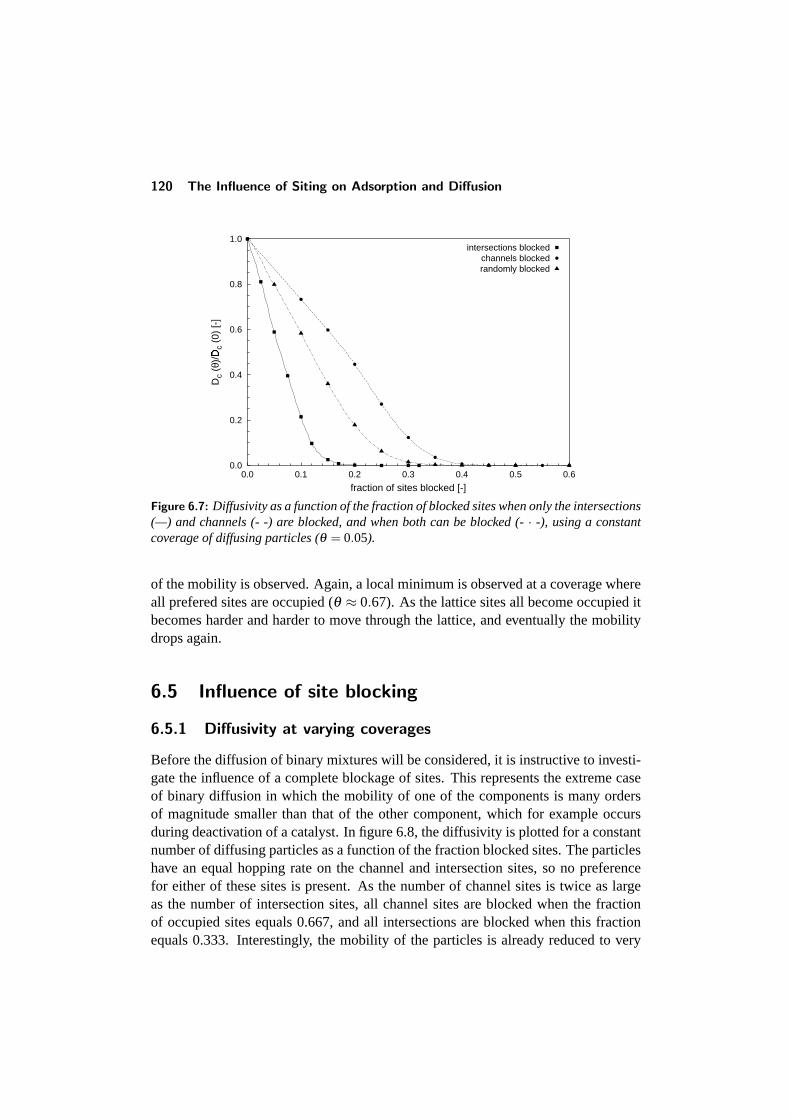
120 The Influence of Siting on Adsorption and Diffusion
0.0
0.2
0.4
0.6
0.8
1.0
0.0 0.1 0.2 0.3 0.4 0.5 0.6
Dc
(θ)/
D
� c (0
) [-
]
fraction of sites blocked [-]
intersections blockedchannels blockedrandomly blocked
Figure 6.7: Diffusivity as a function of the fraction of blocked sites when only the intersections(—) and channels (- -) are blocked, and when both can be blocked (-· -), using a constantcoverage of diffusing particles (θ = 0.05).
of the mobility is observed. Again, a local minimum is observed at a coverage whereall prefered sites are occupied (θ ≈ 0.67). As the lattice sites all become occupied itbecomes harder and harder to move through the lattice, and eventually the mobilitydrops again.
6.5 Influence of site blocking
6.5.1 Diffusivity at varying coverages
Before the diffusion of binary mixtures will be considered, it is instructive to investi-gate the influence of a complete blockage of sites. This represents the extreme caseof binary diffusion in which the mobility of one of the components is many ordersof magnitude smaller than that of the other component, which for example occursduring deactivation of a catalyst. In figure 6.8, the diffusivity is plotted for a constantnumber of diffusing particles as a function of the fraction blocked sites. The particleshave an equal hopping rate on the channel and intersection sites, so no preferencefor either of these sites is present. As the number of channel sites is twice as largeas the number of intersection sites, all channel sites are blocked when the fractionof occupied sites equals 0.667, and all intersections are blocked when this fractionequals 0.333. Interestingly, the mobility of the particles is already reduced to very
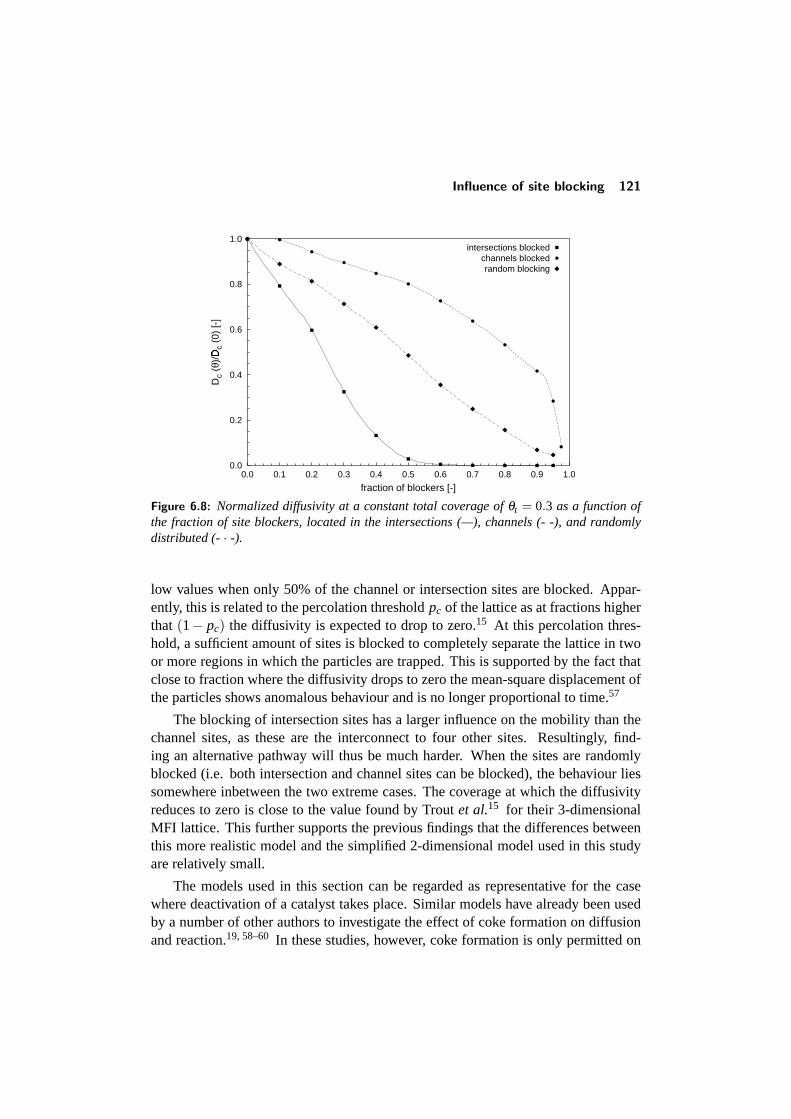
Influence of site blocking 121
0.0
0.2
0.4
0.6
0.8
1.0
0.0 0.1 0.2 0.3 0.4 0.5 0.6 0.7 0.8 0.9 1.0
Dc
(θ)/
D
� c (0
) [-
]
fraction of blockers [-]
intersections blockedchannels blockedrandom blocking
Figure 6.8: Normalized diffusivity at a constant total coverage ofθt = 0.3 as a function ofthe fraction of site blockers, located in the intersections (—), channels (- -), and randomlydistributed (-· -).
low values when only 50% of the channel or intersection sites are blocked. Appar-ently, this is related to the percolation thresholdpc of the lattice as at fractions higherthat (1− pc) the diffusivity is expected to drop to zero.15 At this percolation thres-hold, a sufficient amount of sites is blocked to completely separate the lattice in twoor more regions in which the particles are trapped. This is supported by the fact thatclose to fraction where the diffusivity drops to zero the mean-square displacement ofthe particles shows anomalous behaviour and is no longer proportional to time.57
The blocking of intersection sites has a larger influence on the mobility than thechannel sites, as these are the interconnect to four other sites. Resultingly, find-ing an alternative pathway will thus be much harder. When the sites are randomlyblocked (i.e. both intersection and channel sites can be blocked), the behaviour liessomewhere inbetween the two extreme cases. The coverage at which the diffusivityreduces to zero is close to the value found by Troutet al.15 for their 3-dimensionalMFI lattice. This further supports the previous findings that the differences betweenthis more realistic model and the simplified 2-dimensional model used in this studyare relatively small.
The models used in this section can be regarded as representative for the casewhere deactivation of a catalyst takes place. Similar models have already been usedby a number of other authors to investigate the effect of coke formation on diffusionand reaction.19, 58–60 In these studies, however, coke formation is only permitted on
122 The Influence of Siting on Adsorption and Diffusion
one type of site. Present results show that the occurrence of coke formation on theintersection sites has a much larger influence on the mobility of the species inside thenetwork, and will much sooner lead to a complete blocking of the pore network. Ob-viously, the formation of coke on the intersections will thus have a greater influenceon the reactivity of a catalyst. As the coke formation primarily takes place on thereactive centers of the zeolite, it would seem advantageous to be able to control theexact location of these sites, so that the influence of coking can be decreased.
6.5.2 Blocking at constant coverage
To be able to compare the results with the ones in the case that both componentsare moving, all simulations are performed at a fixed total coverageθtotal = θparticle+θblock = 0.3, while varying the fraction of immobile species. The total fraction ofoccupied sites thus remains constant. Figure 6.8 shows the calculated diffusivities asa function of this fraction for three different situations. For all models, a monotonousdecrease of the diffusivity is visible. For the case where only the intersection sites areblocked, the diffusivity again drops much faster, and the mobility effectively dropsto zero once the percolation threshold is reached. For the case that the channel sitesare blocked, a sudden drop in the diffusivity is observed when the fraction of siteblockers is greater than 90%. At this fraction, almost half of the channel sites areblocked, which is near the point that in figure 6.8 the diffusivity was reduced to verylow values. It is however surprising that in this case a sudden drop is observed, whilein the case of blocking of the intersections this is not the case. For the case that bothtypes of sites are blocked, the behaviour lies somewhere inbetween the two extremecases.
6.6 Binary diffusion
6.6.1 Diffusivity versus coverage
While the model in the previous section can be representative for the case where onespecies is essentially immobile, like for example in the case of catalyst deactivation,for most reaction mixtures the mobility of the different species lie closer to eachother. In this case, the slow particles are, on a short timescale, essentially blockingthe sites for the faster moving species. As the slowly moving species are still able tomove from one site to another, total blocking should only occur when the lattice iscompletely filled. To investigate this, the diffusion of a 1:1 mixture of two compo-nents was investigated as a function of the total coverage. The slowly moving speciesin the mixture have a preference for adsorption on the intersection sites. The otherspecies has an equal residence time on both types of sites.
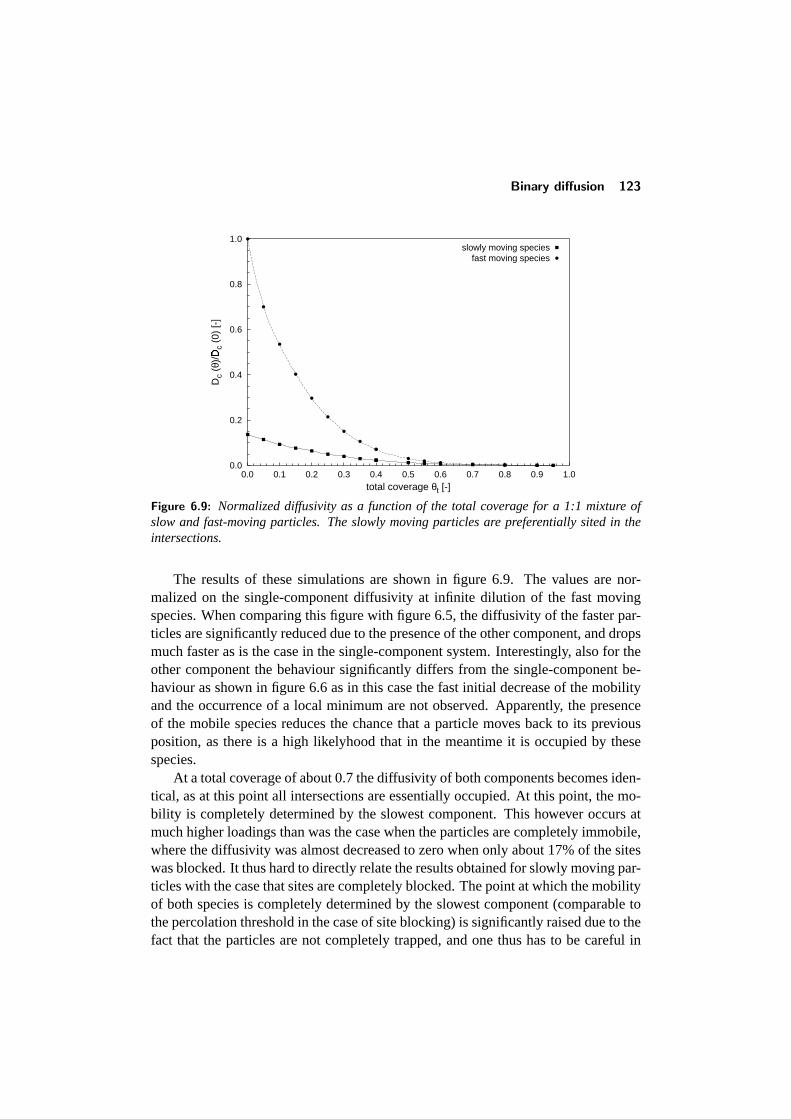
Binary diffusion 123
0.0
0.2
0.4
0.6
0.8
1.0
0.0 0.1 0.2 0.3 0.4 0.5 0.6 0.7 0.8 0.9 1.0
Dc
(θ)/
D
� c (0
) [-
]
total coverage θt [-]
slowly moving speciesfast moving species
Figure 6.9: Normalized diffusivity as a function of the total coverage for a 1:1 mixture ofslow and fast-moving particles. The slowly moving particles are preferentially sited in theintersections.
The results of these simulations are shown in figure 6.9. The values are nor-malized on the single-component diffusivity at infinite dilution of the fast movingspecies. When comparing this figure with figure 6.5, the diffusivity of the faster par-ticles are significantly reduced due to the presence of the other component, and dropsmuch faster as is the case in the single-component system. Interestingly, also for theother component the behaviour significantly differs from the single-component be-haviour as shown in figure 6.6 as in this case the fast initial decrease of the mobilityand the occurrence of a local minimum are not observed. Apparently, the presenceof the mobile species reduces the chance that a particle moves back to its previousposition, as there is a high likelyhood that in the meantime it is occupied by thesespecies.
At a total coverage of about 0.7 the diffusivity of both components becomes iden-tical, as at this point all intersections are essentially occupied. At this point, the mo-bility is completely determined by the slowest component. This however occurs atmuch higher loadings than was the case when the particles are completely immobile,where the diffusivity was almost decreased to zero when only about 17% of the siteswas blocked. It thus hard to directly relate the results obtained for slowly moving par-ticles with the case that sites are completely blocked. The point at which the mobilityof both species is completely determined by the slowest component (comparable tothe percolation threshold in the case of site blocking) is significantly raised due to thefact that the particles are not completely trapped, and one thus has to be careful in
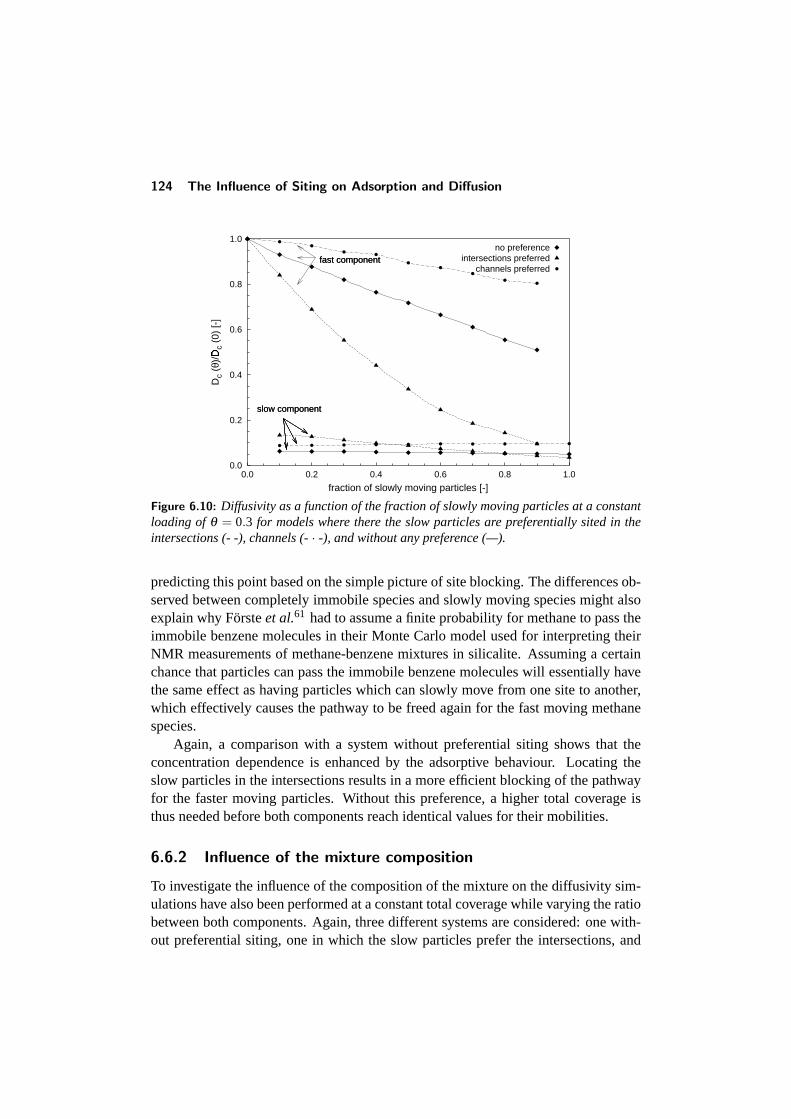
124 The Influence of Siting on Adsorption and Diffusion
0.0
0.2
0.4
0.6
0.8
1.0
0.0 0.2 0.4 0.6 0.8 1.0
Dc
(θ)/
D
� c (0
) [-
]
fraction of slowly moving particles [-]
fast component
slow component
fast component
slow component
no preferenceintersections preferred
channels preferred
Figure 6.10: Diffusivity as a function of the fraction of slowly moving particles at a constantloading ofθ = 0.3 for models where there the slow particles are preferentially sited in theintersections (- -), channels (-· -), and without any preference (—).
predicting this point based on the simple picture of site blocking. The differences ob-served between completely immobile species and slowly moving species might alsoexplain why Forsteet al.61 had to assume a finite probability for methane to pass theimmobile benzene molecules in their Monte Carlo model used for interpreting theirNMR measurements of methane-benzene mixtures in silicalite. Assuming a certainchance that particles can pass the immobile benzene molecules will essentially havethe same effect as having particles which can slowly move from one site to another,which effectively causes the pathway to be freed again for the fast moving methanespecies.
Again, a comparison with a system without preferential siting shows that theconcentration dependence is enhanced by the adsorptive behaviour. Locating theslow particles in the intersections results in a more efficient blocking of the pathwayfor the faster moving particles. Without this preference, a higher total coverage isthus needed before both components reach identical values for their mobilities.
6.6.2 Influence of the mixture composition
To investigate the influence of the composition of the mixture on the diffusivity sim-ulations have also been performed at a constant total coverage while varying the ratiobetween both components. Again, three different systems are considered: one with-out preferential siting, one in which the slow particles prefer the intersections, and
Binary diffusion 125
one in which the slow particles prefer the channels. The diffusivities of all simula-tions are normalized on the pure-component diffusivity of the fast compononent atthe given coverage. The results of these simulations are shown in figure 6.10 for atotal coverage ofθt = 0.3.
For all systems, a monotonous decrease of the diffusivity as a function of the mix-ture composition is observed. For the fast particles, the strongest decrease in mobilityis again visible for the system in which the slow particles are preferentially sited in theintersections. In this case, an increase of the fraction of slow particles also increasesthe amount of occupied intersection sites which, due to the high connectivity of thesesites, results in the most effective blocking of the pathway of the fast particles. Asthe fraction of slow particles is nearly one, these will occupy nearly all intersectionsites, and the rate at which these particles move to the next intersection will becomethe rate-determining step. Resultingly, the mobility of both components will becomeequal to each other. The slow particles in this system are also significantly retardedas the fraction of slow particles increases. This is due to a strong increase of the cov-erage of the intersections with at higher fractions of these particles. As a result, thechance that a particle hops to a next intersection site once it has moved to a channelsite is smaller. The decrease of the mobility of the slow particle is thus mainly due tointeractions with species of its own kind.
If the slow particles are preferentially located at the channel sites, the hindranceof the other particles is the least efficient. In this case, the mobility of the fast compo-nent is only moderately dependent on the mixture composition, and the differencesin mobility of both components is high. Interestingly, the diffusivity of the slowcomponent is now increasing when the relative occupancy of these species becomeshigher. Again, this can be related to the efficiency of blocking the pathway for otherspecies when adsorbed on the different sites in the lattice. With increasing fraction,in this case the relative amount of intersections that are blocked decreases. Now, anincrease of the relative amount of slow particles results in an increase of possibilitiesof particles to pass each other, and, resultingly, in an increase of the mobility of theslow component. This counteracts the effect that the slow particles have on the fastspecies, and thus only a moderate dependence on the composition is found for these.
When there is no preference for one of the types of sites, the behaviour of thesystem is somewhere in between the two extreme cases. In this case, a change ofthe mixture composition does not result in differences in the distribution of particlesover the different sites, and a change in the blocking efficiency will thus not occur.Changes in the diffusivity are in this case only the result of interactions betweenthe fast and slow species. As a result, the diffusivity of the slow component hardlychanges with the mixture composition, as the timescale at which the other particlesmove is much smaller than for these particles. A stronger decrease of the diffusivity
126 The Influence of Siting on Adsorption and Diffusion
of the fast component is indeed visible, but in this case these are not so efficientlyhindered as in the case of preferential siting on the intersections, and at this totalcoverage there is still a significant difference in the mobility of both components.
Clearly, the present results show that the preferential siting of molecules in cer-tain regions of the pore space has a distinct influence on the mobility of both species.As was expected, the fast component is influenced the most by changes in the mix-ture composition, and these species in all cases show a monotonous decrease of thediffusivity. The exact shape of this dependency seems to agree with simulations andexperiments performed by other authors.6, 11, 62 The distinct drop of the diffusivityat higher ratios of the slow component (i.e.2-methylpentane) as observed in then-hexane/2-methylpentane system is not observed for these systems. Probably, thecurrent models used are too simple to fully describe the behaviour of these systems.Recently, Krishna and Paschek63 showed that, using Maxwell-Stefan theory, this dropin the diffusivity could indeed be described. Simply assuming that one species residesin the intersections and the other on all sites is not sufficient, as although the influenceon the diffusivity is larger, the amount of intersections that are blocked by the slowparticles is gradually increasing.
If one compares the behaviour ofn-hexane/2-methylpentane mixtures in silicalitewith the simple lattice model, the complete behaviour of these components cannot betotally simulated. In the real system, for both single components inflection behaviouris observed. This could be reproduced when assuming that particles prefer one typeof sites above the other, but it is very hard to find a model describing the “commen-surate freezing” behaviour of the linear compound. The interactions between the twospecies in the Monte Carlo simulations are also extremely simplified, as there is onlya hard repulsion preventing two particles to reside on the same site on the lattice. Inthe realn-hexane/2-methylpentane system this behaviour is much more complicated,and one for example observes that at higher pressures the branched alkanes are beingpushed out by their linear counterparts.28 The observed drop in the diffusivity mightthus be related to a certain re-ordering of the two components which takes place in-side the pore network of silicalite due to intermolecular interactions. This could leadto a faster decrease of the diffusivity as the behaviour undergoes a change from asystem that looks more like one where no preference is observed to one where theintersections are preferred.
6.7 Conclusions
Kinetic Monte Carlo simulations have been applied to investigate the influence ofpreferential siting on the diffusion of single components and mixtures in a two-dimensional pore system consisting of channel and intersection sites. Although these
Conclusions 127
simulations are a coarse-grained model of the diffusivity of molecules in the poresof a zeolite, they provide an excellent way of determining the influence of differentparameters and assumptions on the behaviour of these systems. The complex interac-tions between the zeolite framework and the adsorbed molecules have to be reducedto a simple set of interactions and hopping rates between the particles.
Adsorption in zeolites takes place when, after a collision of a gas phase moleculewith the surface of the particle occurs, the molecule is able to enter the pore. Thiscan be simulated using dynamic Monte Carlo simulations by assuming a certain rateof adsorption on the outer lattice sites. When, for the two-dimensional lattice withchannel and intersection sites, the residence time of the particles is identical on alllattice sites the system shows a simple langmuir-type behaviour. This is different fora system in which one of the type of sites is preferred. In this case, the preferredsites will be filled first, after which the less favoured sites become occupied. Thisleads to an inflection in the adsorption isotherm, in accordance with the behaviourthat is observed for branched alkanes in silicalite. Although in all cases the inflec-tion behaviour is observed, the exact definition of the boundary of the lattice has alarge influence on the simulated adsorption isotherm. The presence of favoured sitesat the edges leads to a much higher concententrations on these boundary sites and,resultingly, much lower adsorption rates, shifting the isotherm to higher pressures.The choice of the model for the zeolite lattice thus strongly influences the adsorptivebehaviour one observes for these systems, and raises some questions in what sensethe adsorptive behaviour in real zeolites is influenced by the exact structure of thecrystal surface.
By assuming lateral interactions between nearest neighbours, the peculiar “com-mensurate freezing” behaviour of some linear alkanes in silicalite was tried to besimulated. Using these lateral interactions, this behaviour could indeed be observedas these indeed showed a shift from no preference to a preference for occupying thechannel sites at high coverages. This re-ordering itself does however not lead to aninflection in the adsorption isotherm. In the case that the simultaneous occupation oftwo neighbouring sites is excluded, a langmuir-type isotherm is observed, while fora system where there is a smaller repulsive interaction between neighbouring parti-cles an inflection is visible once nearest-neighbour sites have to be occupied. Thebehaviour as described by Smit and Maesen27 thus cannot be reproduced using thesesimple models.
Due to the decreased connectivity of the channel-intersection-type lattice, in thistype of lattice the self-diffusion constant depends much stronger on the diffusivity.Strong deviations from the mean-field concentration dependency can be observed,and deviations from a more detailed three-dimensional model of the silicalite poresystem (also with channel and intersection sites) are small. Obviously, the average
128 The Influence of Siting on Adsorption and Diffusion
connectivity of the sites is the most important parameter determining this depen-dency. When the particles are preferentially located at the intersections the initialdecrease in mobility is even higher. The system seems to behave essentially identicalto one where only jumps from one intersection site to another can take place. Oncethe intersections are almost occupied, the decrease in diffusivity becomes more grad-ual and, when the preference is sufficiently large, a local mininum in the diffusivityis even observed. This is due to the more even distribution over both types of sites,leading to a larger contribution of the faster jumps from the channels to the intersec-tions. When the channel sites are preferred, the mobility decreases much less than inthe previous case, as the particles are less hindered by each other when they resideon these sites. Again, a local minimum in the diffusivity can be observed.
The influence of site blocking is also strongly dependent on the location at whichthe site blockers are located. Again, placing these blockers on the intersection leadsto the fastest drop in the diffusivity, while placing them in the channels has the leastinfluence. In order to completely block the channel systems, only about half of therespective sites have to be occupied. This is in good agreement with predictions frompercolation theory. When the total coverage on the lattice was kept constant, a suddendrop in the diffusivity was visible at higher fractions of site blockers for the system inwhich the channel sites are blocked, while for the ohter systems the decrease is moregradual.
When a mixture of two moving compounds is used instead of having one im-mobile species, the largest influence on the mobility is visible for the faster-movingspecies. The changes in the diffusivity as a function of coverage at a fixed mixturecomposition is however much more gradual. The point at which both componentsstart moving at the same speed cannot be easily related to the point at which in thecase of immobile species the mobility is reduced to zero. When varying the mixturecomposition at a fixed total coverage, again the system in which the slow particles arepreferentially located in the intersections shows the largest dependency on the diffu-sivity, especially for the fast moving particles. The slow moving particles even showa slight increase in diffusivity with an increasing fraction of these particles for thecase that the channel sites are preferred. The sudden drop in de diffusivity of the fastmoving species for then-hexane/2-methylpentane mixture in silicalite could not bereproduced using the current models. Possibly, this is related to complex behaviourof the single components in this system, which could not be completely reproducedusing the present models. A more detailed description of the intermolecular interac-tions in the dynamic Monte Carlo simulations thus appears to be important, as theseseem to play an important role in the diffusive behaviour in zeolites.
The present simulations show that the diffusive behaviour of molecules insidea pore network is not only influenced by the way in which the separate adsorption
References 129
sites are connected, but also by the possible preferences particles have to adsorb ona certain type of site. When particles are preferentially located at the sites whichhave the highest number of nearest neigbours, they are much more effective in block-ing the pathway for other particles. This leads to a much stronger dependence ofthe diffusivity on the concentration, and, in the case of mixtures, also on the mix-ture composition. In order to predict these dependencies, some knowledge of theadsorptive behaviour inside the pores of the zeolites is thus also required. In order todescribe the diffusion on a reactor scale, some knowledge of the underlying micro-scopic mechanism of adsorption and diffusion inside the pores is thus required.
6.8 References
1 P. Demontis and G. B. Suffritti,Chem. Rev.97(8), 2845–2878 (1997).2 D. Paschek and R. Krishna,Langmuir17(1), 247–254 (2001).3 W. R. Qureshi and J. Wei,J. Catal.126, 126–146 (1990).4 J. Karger and D. M. Ruthven,Diffusion in zeolites and other microporous solids, John
Wiley & Sons, Inc., New York (1992).5 R. Krishna and J. A. Wesselingh,Chem. Eng. Sci.52(6), 861–911 (1997).6 R. Krishna,Chem. Phys. Lett.326, 477–484 (2000).7 F. J. Keil, R. Krishna, and M.-O. Coppens,Rev. Chem. Eng.16(2), 71–197 (2000).8 R. Chitra and S. Yashonath,Chem. Phys. Lett.234, 16–20 (1995).9 R. Q. Snurr and J. Karger,J. Phys. Chem. B101(33), 6469–6473 (1997).
10 L. N. Gergidis and D. N. Theodorou,J. Phys. Chem. B103(17), 3380–3390 (1999).11 S. Jost, N.-K. Bar, S. Fritzsche, R. Haberlandt, and J. Karger,J. Phys. Chem. B102(33),
6375–6381 (1998).12 D. Schuring, A. O. Koriabkina, A. M. de Jong, B. Smit, and R. A. van Santen,J. Phys.
Chem. B105(32), 7690–7698 (2001).13 J. Karger, M. Petzold, H. Pfeifer, S. Ernst, and J. Weitkamp,J. Catal. 136, 283–299
(1992).14 P. R. van Tassel, S. A. Somers, H. T. Davis, and A. V. McCormick,Chem. Eng. Sci.
49(17), 2979–2989 (1994).15 B. L. Trout, A. K. Chakraborty, and A. T. Bell,Chem. Engng. Sci.52(14), 2265–2276
(1997).16 M.-O. Coppens, A. T. Bell, and A. K. Chakraborty,Chem. Engng. Sci.53(11), 2053–2061
(1998).17 S. M. Auerbach, N. J. Henson, A. K. Cheetham, and H. I. Metiu,J. Phys. Chem.99(26),
10600–10608 (1995).18 B. Smit and R. Krishna,Curr. Opin. Solid St. M.5(5), 455–461 (2001).19 D. N. Theodorou and J. Wei,J. Catal.83, 205–224 (1983).20 R. M. Barrer and W. Jost,Trans. Faraday Soc.45, 928–930 (1949).21 Y. D. Chen and R. T. Yang,AIChE J.37(10), 1579–1582 (1991).22 D. Paschek and R. Krishna,Chem. Phys. Lett.342, 148–154 (2001).23 C. Saravanan, F. Jousse, and S. M. Auerbach,Phys. Rev. Lett.80(26), 5754–5757 (1998).
130 The Influence of Siting on Adsorption and Diffusion
24 K. A. Fichthorn and W. H. Weinberg,J. Chem. Phys.95(2), 1090–1096 (1991).25 L. J. P. van den Broeke, S. A. Nijhuis, and R. Krishna,J. Catal.136, 463–477 (1992).26 T. Masuda, Y. Fujikata, H. Ikeda, and K. Hashimoto,Microporous Mesoporous Mater.38,
323–332 (2000).27 B. Smit and T. L. M. Maesen,Nature374, 42–44 (1995).28 T. J. H. Vlugt, R. Krishna, and B. Smit,J. Phys. Chem. B103(7), 1103–1118 (1999).29 R. Krishna and D. Paschek,Phys. Chem. Chem. Phys.3, 453–462 (2001).30 R. Krishna, B. Smit, and S. Calero,Chem. Soc. Rev.31, 185–194 (2002).31 H. Morell, K. Angermund, A. R. Lewis, D. H. Brouwer, C. A. Fyfe, and H. Gies,Chem.
Mater.14(5), 2192–2198 (2002).32 L. F. Gladden, M. Hargreaves, and P. Alexander,Chem. Eng. J.74(1), 57–66 (1999).33 B. Smit, L. D. J. C. Loyens, and G. L. M. M. Verbist,Faraday Discuss.106, 93–104
(1997).34 T. J. H. Vlugt, C. Dellago, and B. Smit,J. Chem. Phys.113(19), 8791–8799 (2000).35 R. C. Runnebaum and E. J. Maginn,J. Phys. Chem. B101(33), 6394–6408 (1997).36 D. Paschek and R. Krishna,Phys. Chem. Chem. Phys.2, 2389–2394 (2000).37 S. J. Lombardo and A. T. Bell,Surf. Sci.245, 213–224 (1991).38 N. G. van Kampen,Stochastic processes in physics and chemistry, North-Holland, Ams-
terdam (1981).39 A. P. J. Jansen and J. J. Lukkien,Catal. Today53, 259–271 (1999).40 J. Segers,Algorithms for the simulation of surface processes, Ph.D. thesis, Eindhoven
University of Technology, Eindhoven (1999).41 J. J. Lukkien, J. P. L. Segers, P. A. J. Hilbers, R. J. Gelten, and A. P. J. Jansen,Phys. Rev.
E 58(2), 2598–2610 (1998).42 R. E. Richards and L. V. C. Rees,Langmuir3(3), 335–340 (1987).43 M. S. Sun, O. Talu, and D. B. Shah,J. Phys. Chem.100(43), 17276–17280 (1996).44 Y. Yang and L. V. C. Rees,Microporous Mater.12, 223–228 (1997).45 Z. Du, G. Manos, T. J. H. Vlugt, and B. Smit,AIChE J.44(8), 1756–1764 (1998).46 R. A. van Santen and J. W. Niemantsverdriet,Chemical kinetics and catalysis, Plenum
Press, New York, New York (1995).47 T. J. H. Vlugt, W. Zhu, F. Kapteijn, J. A. Moulijn, B. Smit, and R. Krishna,J. Am. Chem.
Soc.120(22), 5599–5600 (1998).48 W. Zhu, F. Kapteijn, and J. A. Moulijn,Phys. Chem. Chem. Phys.2(9), 1989–1995 (2000).49 W. Zhu, B. van der Linden, and J. A. Moulijn,Phys. Chem. Chem. Phys.3(9), 1755–1761
(2001).50 R. Q. Snurr, A. T. Bell, and D. N. Theodorou,J. Phys. Chem.98(19), 5111–5119 (1994).51 Z. Du, L. J. Dunne, G. Manos, and M. F. Chaplin,Chem. Phys. Lett.318, 319–324 (2000).52 A. Micke, M. Bulow, M. Kocirık, and P. Struve,J. Phys. Chem.98(47), 12337–12344
(1994).53 E. B. Webb III and G. S. Grest,J. Chem. Phys.116(14), 6311–6321 (2002).54 B. Millot, A. Methivier, and H. Jobic,J. Phys. Chem. B102(17), 3210–3215 (1998).55 W. J. M. van Well,Adsorption of alkanes in zeolites, Ph.D. thesis, Eindhoven University
of Technology, Eindhoven (1998).56 R. L. June, A. T. Bell, and D. N. Theodorou,J. Phys. Chem.94(4), 1508–1516 (1990).57 M. Sahimi, G. R. Gavalas, and T. T. Tsotsis,Chem. Eng. Sci.45(6), 1443–1502 (1990).
References 131
58 S. Sundaresan and C. K. Hall,Chem. Eng. Sci.41(6), 1631–1645 (1986).59 P. H. Nelson, D. M. Bibby, and A. B. Kaiser,Zeolites11, 337–344 (1991).60 X.-Y. Guo, Z.-W. Liu, and B. Zhong,Microporous Mesoporous Mater.23, 203–209
(1998).61 C. Forste, A. Germanus, J. Karger, H. Pfeifer, J. Caro, W. Pilz, and A. Zikanova,J. Chem.
Soc., Faraday Trans. 183(8), 2301–2309 (1987).62 L. N. Gergidis, D. N. Theodorou, and H. Jobic,J. Phys. Chem. B104(23), 5541–5552
(2000).63 R. Krishna and D. Paschek,Phys. Chem. Chem. Phys.4, 1891–1898 (2002).

7Concluding Remarks
A number of different techniques have been applied to study the diffusionin zeolites. A short overview will be given of the most important findingsin this thesis. From the results obtained, some general conclusions canbe drawn that are important for a better understanding of diffusion inzeolites.
In the previous chapters, a number of different techniques have been used to studythe diffusion in porous systems, and specifically in zeolites. Diffusion in zeoliteshas already been studied for many decades now, but a lot of questions still remainregarding this subject. From the work in this thesis, it will have become clear that thediffusive behaviour of adsorbates in these systems is often complex and even counter-intuitive. Although a number of different problems have been studied, some generalconclusions can be drawn from the obtained results. Before these will be considered,the results from the different chapters in this thesis will be reviewed.
7.1 Diffusion in zeolites: where do we stand now?
From the literature, a vast amount of experimental and also theoretical techniquesare available to study the diffusion in zeolites. Not only do these methods differ inthe methods employed, but also in the level of detail and the length- and timescaleat which they study the diffusive properties in zeolites. From a fundamental point ofview, methods that directly probe the microscopic mechanism of diffusion providethe most interesting information. From a practical point of view, however, thesemethods are of little use when the results obtained cannot be directly related to theproperties of these systems on a laboratory or even an industrial scale. The couplingof the results obtained with these methods therefore is an important topic nowadays
134 Concluding Remarks
addressed in zeolite research. The gap between these methods is still large, but due tothe technical advances in the experimental and computational field, they are slowlyclosing in on each other.
7.2 The results: an overview
7.2.1 Molecular dynamics: modeling on microscopic scale
With molecular dynamics simulations, an atomistic model of the zeolite-adsorbatesystem is built. Using this method, the motion of the individual molecules can be fol-lowed, and a microscopic picture of the diffusive process can thus be obtained. Thistechnique has the advantage that the conditions at which these simulations are con-ducted can be easily controlled, and all kinds of interactions can be readily calculated.In experimental techniques these conditions are much harder to control, and informa-tion about the interactions in the systems and the precise influence of changing theseconditions is much harder to extract. MD simulations are thus an excellent tool tostudy the influence of the concentration, zeolite structure and alkane chainlength onthe self-diffusivity.
As with almost every method, MD simulations only provide an approximativemodel of the real world. It thus remains important to compare the results with exper-imental data available in literature. Using the forcefields that have been optimizedto describe the adsorptive behaviour of zeolites, a reasonable agreement is obtainedwith the available literature. The single-file behaviour, which was expected for someof the zeolite structures, was however not observed in this study. This might be due tothe timescale at which these simulations are performed. For all systems considered inthis study, the self-diffusivity decreases monotonically with increasing pore loading.It is however interesting that the diffusivity for all system tends to decrease to aboutidentical values, irrespective of the shape of the diffusant or zeolite porestructure. Athigh coverages, it appears to be the intermolecular interactions which determine thediffusive behaviour instead of alkane-zeolite interactions. This change in mechanismis further supported by an increase of the activation energy of diffusion at higher cov-erages. For the mobility of the molecules as a function of chainlength, no generalrule seems to apply, as the behaviour strongly depends on the zeolite. An importantparameters in this respect seems to be the alkane chainlength compared to the lengthof the zeolite unit cell. When these two quantities closely match, resonant diffusionoccurs and an enhancement of the diffusivity is observed.
The present study also shows that the molecular dynamics technique also has itslimitations. Due to the computational demands of techniques, system sizes have to bekept small, and only relatively mobile species can be studied if computer resourcesare limited. The simulation of bulkier molecules, like branched alkanes, therefore is
The results: an overview 135
not feasible. Simulations at elevated temperatures can in this case be helpful, but theinterpolation of the results to relevant temperatures and the possibility of a differentdiffusion mechanism seriously reduced the reliability of the obtained results. Dueto the small system size, some care also has to be taken when choosing the initialconditions of the simulations, as only a few pores, instead of many thousands, areprobed. In the case of concentration dependence, a wrong definition of the startingconfiguration might seriously affect the results.
7.2.2 Single-file diffusion: simple systems with complex behaviour
From the MD simulations, it was already clear that single-file diffusion is not auto-matically observed when diffusion in a single-file pore is considered. To investigatethe fundamentals of this phenomenon, a detailed model is not required, but simplemodels of a cylindrical pore in which the particles are unable to pass each other aresufficient. That even in these extremely simple systems the behaviour is quite com-plex is illustrated by the obtained results.
One of the characteristic features of single-file diffusion is the√
t dependenceof the mean-square displacement in the long-time limit. This behaviour howeverdoes not necessarily have to be observed in cylindrical pores in which the particlescannot pass each other. Only when the particles are capable of transfering linearmomentum in the axial direction, the typical
√t dependence is observed. The indi-
vidual particles, however, do not have to behave like random walkers with a mean-square displacement proportional to time, as one is led to believe when reviewing theavailable literature on this subject. Instead, it appears to be the combined effect ofparticle-particle and particle-wall interactions which is most important. The time atwhich the
√t-dependence starts to set in, depends strongly on the interactions with
the zeolite wall. The smaller of smoother the interactions that enable the transfer ofenergy and momentum in the axial direction, the longer it takes before the single-filedisplacement is observed. For finite-size systems, a transition to ordinary diffusion(〈z2〉 ∝ t) can again be observed. For these systems, the concentration dependence isstill proportional to(1− θ)/θ , which seems to be the most fundamental behaviourfor systems in which particles are moving through a one-dimensional channel.
7.2.3 Diffusion in mixtures
An understanding of the behaviour of mixtures in zeolites is of practical importanceas many applications of zeolites involve the diffusion of more than one component.The TEX-PEP technique is an excellent tool to study this phenomenon, as one ofthe components can be selectively labelled, and the (re-)exchange of the labelledcomponents in a steady-state stream can be observed. Combined with a suitable
136 Concluding Remarks
model that describes the mass transfer in the zeolite bed, this metod can then be usedto determine the self-diffusion constants of the components in the mixture.
As a model system, the diffusion of a mixture ofn-hexane and2-methylpentanewas chosen, also because of their peculiar adsorptive behaviour. The experimentsare conducted at a constant total pressure while varying the composition of the mix-ture. The loading of the zeolite crystals slightly decreases with increasing fractionof the branched alkane in the gas phase. The diffusive behaviour as a function ofthe composition is characterized by a sudden drop of the diffusivity as the gas-phasecomposition consists of more than 75% of2-methylpentane. Blocking of the inter-sections by the slowly moving branched alkanes, as these are preferentially locatedin the intersections, seems to be the most likely explanation for this. The results il-lustrate that the exact shape of the pore system, as well as the siting of the moleculesinside the pores are important factors that determine the diffusive behaviour.
7.2.4 DMC: a coarse-grained model of diffusion
Using dynamic Monte Carlo simulations, it is possible to investigate the influenceof pore topology and preferential siting of molecules in the pore system. As thesesimulations use a coarse-grained model of the zeolite, computational demands arelimited, and larger systems can be considered. By using a simple, 2-dimensionalmodel containing intersection and channel sites, the influence of siting was studied.
Assuming preferential siting on one type of site was shown to lead to the obser-vation of an inflection in the adsorption isotherm of these models. This assumptionalso has a large impact on the single-component diffusivity, as this can lead to theoccurrence of a local minimum in the mobility of the particles. Another importantfactor is the average connectivity of the sites, which seems to be more determiningthan whether the system forms a two- or three-dimensional network. When sites areessentially blocked, the largest impact can be observed when this is only done withthe intersection sites, as this much more effectively limits the amount of escape routesfor the particles. For binary mixtures, when the slowly moving particle takes over therole of the blockers, the same conclusion holds, but the effects are less dramatic. Careshould thus be taken when treating the slow component of a binary mixtures as if itis essentially immobile.
7.3 The big picture
7.3.1 The importance of intermolecular interactions
One thing that is continuously returning throughout this thesis, is the importance ofthe intermolecular interactions for the diffusion in zeolites. As the molecules are
The big picture 137
moving inside the narrow pores of the zeolite, the interactions appear to be com-pletely dominated by the zeolite framework. While with increasing pore loadingthese interactions are quantitatively still dominating, the diffusive behaviour becomesmore and more determined by adsorbate-adsorbate interactions. The confinement ofthe molecules inside the pores of the zeolite lattice causes an enhancement of theseinteractions compared to the gas phase. This complex interplay between particle-particle and particle-wall interactions also appears to be the fundamental cause forthe peculiar
√t-behaviour of the mean-square displacement in single-file systems.
The same holds for the diffusion of an-hexane/2-methylpentane mixture in zeolitesilicalite, where the specific pore structure and the adsorptive behaviour of the com-ponents inside the pore systems cause the observed drop in diffusivity with increasing2-methylpentane fraction.
7.3.2 The limitations of DMC
Related to the above mentioned point is the limitations of dynamic Monte Carlo sim-ulations to simulate the diffusive behaviour in zeolites. Although this technique canprovide useful qualitative insight, this method usually reduces the intermolecular in-teractions to extremely simple hard repulsive interactions, in which no two particlescan occupy the same site. Therefore, the diffusivity in a completely filled system forexample becomes zero at high coverages, while in reality there is still a finite mobil-ity of the molecules. This might also be a possible explanation for the inability of themethod to correctly describe the behaviour of the previously mentioned mixture ofhexane isomers. A more suitable technique to study this system would be moleculardynamics, as the intermolecular interactions are more sophisticated, but due to thelow mobility of the branched alkanes this is computationally still not very feasible.
7.3.3 Macroscopic versus microscopic viewpoints
Using different methods which both look at diffusion on a microscopic as well as amacroscopic scale of course raises questions about how these worlds link together.For the experimental method on a macroscopic level employed in this thesis, TEX-PEP, discrepancies still exist with the microscopic results from literature and themolecular dynamics simulations. What has however become clear from the researchconducted in this thesis, is that an understanding of the processes taking place at amicroscopic level can certainly help in explaining what happens on a macroscopicscale. The strong concentration dependence observed with MD simulations can,for example, partially explain discrepancies between different methods regarding themagnitude of the diffusivities found. These furthermore showed that, with increasingcoverage, diffusivities of different species (linear and branched alkanes) come closer
138 Concluding Remarks
together. Often, microscopic mechanisms can have macroscopic consequences, asthe strong concentration and pore length dependence of the diffusivity in single-filesystems.
Linking macroscopic and microscopic results regarding the diffusion in zeoliteshas long been an important topic in this field of research. From the study on single-file diffusion, it can be concluded that the observed behaviour in this case is stronglydependent on the timescale at which it is observed. This conclusion might holdmore generally, as different diffusion mechanisms might be dominating on differ-ent timescales as well in the case of diffusion in other systems. The introduction ofnew experimental techniques and improvement of theoretical methods will possiblyprovide a definitive answer for this.
7.3.4 Theory versus experiment
In science, a study can be conducted either by using experimental or theoretical tech-niques. Often, these two disciplines exist next to each other, without having anyinteractions, apart from reading each others articles. One of the biggest challenges,however, is trying to combine both methods and put the pieces of the puzzle together.As experimental en theoretical metods each have their own advantages and disadvan-tages, both are needed for a better understanding of physics and chemistry in general,and specifically of diffusion in zeolites. Experimental techniques are needed to pro-vide us with an idea of how the real world is working, and enable us to check the the-ories we have developed. Experimental limitations however limit the regime in whichmeasurements can be performed. Furthermore, the underlying microscopic mecha-nisms are not always revealed, as these are masked by other processes contributingto the overall behaviour of the system. In theoretical methods, the conditions (likee.g. the concentration inside a zeolite pore) can be easily controlled, and the level ofdetail can be chosen, so that the parameters of interest can be directly studied. Dueto the complexity of the real system, these methods however have to rely on a greatlysimplified models.
From this thesis, it will have become clear that theory and experiment cannotlive without each other. Experimental data was used to check if the zeolite modelused in the MD simulations provides us with reasonable values of the diffusivity. Onthe other hand, the PEP measurements require the use of a model which can accu-rately describe the flow in the zeolite system in order to extract the data. This modelcan furthermore be used to predict the experimental conditions at which the processof interest, micropore diffusion, is dominating over other contributions to the masstransfer resistance. In addition to the fact that they need each other, they also com-plement each other in the sense that insights from one of these approaches can helpunderstand what is happening in the other, and provide ideas for new investigations
The big picture 139
in the other field.Even when choosing for either theory or experiment, further choices have to be
made regarding the technique to use. Each has its own advantages and disadvantages,and it is thus important to know what the exact question is that has to be answered,in which technique is most suitable to do so. Unfortunately, one is often limitedby the amount of resources available. Combining results from different methodsfurthermore often lead to additional complications, and it is thus tempting to stickto one or a small number of them. Notwithstanding these difficulties, however, acombination of different experimental and theoretical techniques seems to be theway to go in really tackling the different problems still present in zeolite science, andshould be one of the primary focusses of future research.

Summary
Zeolites are extensively used in industry as catalyst and/or catalyst support in a largerange of different processes. The diffusion in these microporous materials differsgreatly from diffusion in liquids and gases. As it determines the ease and speed withwhich reactants can reach the catalytically active centers and products can leave thepores, a thorough understanding of this process is not only important from a funda-mental, but also from a practical point of view. Although the industrial applicationsof these materials involve large time- and length scales, the mobility of the adsor-bates in the first place is influenced by the interactions occuring on a molecular scale.Theoretical methods are extremely suited to investigate these influences, as one caneasily build a model with the appropriate level of detail and the conditions can easilybe varied. In this thesis, the diffusive process is studied in order to gain insight in itsmicroscopic mechanisms and their consequences on a macroscopic scale. To accom-plish this, different methods have been applied, ranging from an atomistic approachusing molecular dynamics simulations, to the description of the flow in a laboratory-scale reactor by numerically solving the mass balances for the system.
Molecular dynamics simulations are capable of providing a detailed insight in themolecular mechanisms of diffusion. This method has been used to study the influ-ence of the zeolite structure, sorbate concentration, and chainlength on the diffusivityof alkanes. Using forcefields which are optimized for the alkane-zeolite system, afair agreement can be obtained with experimental data from PFG-NMR and QENSexperiments. A strong dependence on the sorbate concentration is observed, and thepresent results indicate that the alkane-alkane interactions become dominant in de-termining the mobility at high coverages. As a result, the diffusivities in the differentzeolite structures, and for different adsorbates, lie much closer to each other at highercoverage. The dependence on the chainlength is strongly non-linear, and is relatedto the structure of the pores (like e.g. the presence of side pockets) and also to thechainlength compared to the lattice periodicity, leading to the occurrence of “resonantdiffusion”.
Another interesting phenomenon, occurring in zeolites with a one-dimensionalpore structure, is single-file diffusion. Due to the fact that the particles are unable topass each other, the mobility is greatly reduced, and a characteristic time-dependenceof the mean-square displacement (〈z2(t) ∝
√t instead of∝ t) can be observed. Using
142 Summary
a simple model of a one-dimensional pore, it is shown that the occurrence of thisbehaviour is strongly influenced by the shape of the pore wall, and the length of thepore itself. It is the combined effect of both particle-particle and particle-wall interac-tions which is responsible for this time dependence. The type of behaviour is stronglydependent on the timescale at which the displacement is observed. For moderate acti-vation barriers and “soft” potentials the displacement is first proportional tot, beforethe typical single-file dependence sets in. At large timescales, single-file systems offinite length will always show a displacement which is proportional to time again, asis the case in ordinary systems. What however remains characteristic for single-filesystems, regardless of the behaviour of the displacement, is the strong concentrationdependence of the mobility of the particles in these systems.
That insight in the behaviour on a microscopic scale can help in interpreting ex-perimental results is shown in a study of the diffusion of an-hexane/2-methylpentanemixture in silicalite using the positron emission profiling technique. With this tech-nique, the concentration of radiochemically labelled species can be measured insidea zeolite packed-bed reactor. Using a numerical model of the mass transfer throughthe reactor, information can be obtained on the diffusivities of both components as afunction of the mixture composition. With an increasing fraction of2-methylpentanein the gas phase, a sudden drop in the diffusivity of the fast movingn-hexane speciesis observed. This is due to the fact that a significant fraction of the intersectionsbetween the different channels in the zeolite structure, where the branched alkanesare preferentially located, becomes occupied. The mobility of the slowly moving2-methylpentane is hardly affected by the presence of the linear alkane.
The results from the PEP experiments indicate that the diffusive behaviour mightalso depend on the specific siting of the molecules in the zeolite pore network. Thiswas investigated using dynamic Monte Carlo simulations, in which the zeolite ismodelled as a simple network of channel and intersection sites, where the moleculesmove by jumping to an empty neighbouring site. Both in the single- and multi-component case, large differences can be observed in the diffusive behaviour when apreference for adsorption on one type of site exists. Generally, a preferential sitingin the intersections leads to a much stronger concentration dependence. The resultsobserved experimentally however could not be reproduced using these simple simu-lations. Apparently, the interactions described in these Monte Carlo simulations areto simple to account for the real behaviour, and lateral interactions play an importantrole in the diffusive behaviour.
Samenvatting
Zeolieten worden veelvuldig gebruikt in de industrie als katalysatoren en/of drager-materialen voor een groot aantal verschillende processen. De diffusie in deze micro-poreuze materialen verschilt sterk ten opzichte van gasfase diffusie. Aangezien ditproces de snelheid en het gemak waarmee reactanten de katalytisch actieve centrakunnen bereiken en producten de porieen kunnen verlaten bepaalt, is het niet alleenvanuit wetenschappelijk, maar ook vanuit een praktisch oogpunt van belang om meerinzicht te krijgen in dit proces. Alhoewel in praktische toepassingen het transportplaatsvindt op grote tijd- en lengteschaal, wordt de mobiliteit van de molekulen inde eerste plaats beınvloed door interacties op moleculaire schaal. Theoretische meth-oden zijn uitermate geschikt om deze invloeden te bestuderen, aangezien hiermeeeenvoudig modellen gekozen kunnen worden met de juiste gedetailleerdheid, en de“experimentele” condities gemakkelijk kunnen worden gevarieerd. In dit proefschriftis het diffusie-process bestudeerd om meer inzicht te krijgen in de microscopischemechanismen en de consequenties hiervan op macroscopische schaal. Hiervoor zijndiverse methoden gebruikt, varierend van een atomistische benadering via molecu-laire dynamica simulaties, tot het beschrijven van de stroming door een katalytischereactor door het numeriek oplossen van de massabalansen voor het systeem.
Moleculaire dynamica simulaties geven gedetaileerde informatie over de molec-ulaire mechanismen van het diffusie-proces. Deze methode is gebruikt om de in-vloed van de zeoliet-structuur, concentratie van de adsorbaten, en ketenlengte tebepalen op de diffusie van alkanen. Door gebruik te maken van voor zeoliet-alkaansystemen geoptimaliseerde parameters voor de beschrijving van de krachten tussende atomen, kan een redelijke overeenstemming worden bereikt met experimentelegegevens. De diffusiviteit blijkt sterk af te hangen van de concentratie van de adsor-baten, en bij hoge beladingen blijken vooral alkaan-alkaan interacties de mobiliteitvan de moleculen te bepalen. Ten gevolge hiervan zijn de verschillen in de gevondendiffusie-constanten voor verschillende zeolieten en adsorbaten veel kleiner bij hogeconcentraties, en is er een sterke toename te zien van de activeringsenergie voor dif-fusie. The afhankelijkheid van de ketenlengte is sterk non-lineair, en is gerelateerdaan de poriestructuur (zoals bijv. de aanwezigheid van kooien) en de verhoudingtussen de ketenlengte en de periodiciteit van het zeoliet-rooster, wat kan leiden tothet optreden van “resonante diffusie”.
144 Samenvatting
Een ander interessant fenomeen, wat waarneembaar is zeolieten met een 1-dimen-sionale poriestructuur, is het optreden van single-file diffusie. Doordat de moleculenelkaar in de smalle porien niet kunnen passeren, wordt hun mobiliteit sterk gere-duceerd, en kan een karakteristieke tijdsafhankelijkheid worden waargenomen vande “mean-square displacement”, waarbij deze evenredig wordt met
√t in plaats van
t. Een eenvoudig model voor een 1-dimensionale porie is gebruikt om dit gedragte onderzoeken. Het al of niet optreden van de
√t-afhankelijkheid blijkt sterk af te
hangen van de vorm en de lengte van de porie. Verantwoordelijk voor dit gedragis een complex samenspel van interacties tussen deeltjes onderling en met de wand.Belangrijk is de tijdschaal waarop de verplaatsing gemeten wordt. Wanneer de inter-acties tussen zeoliet en adsorbaten niet al te groot zijn (de activeringsbarrieres zijnlaag), zal deze aanvankelijk evenredig zijn met de tijd, waarna pas na zekere tijd de√
t-afhankelijkheid kan worden waargenomen. Op grote tijdsschaal zal voor syste-men met eindige afmetingen altijd een evenredigheid mett worden waargenomen.
Dat inzicht in het microscopische gedrag helpt bij de interpretatie van experi-menten, is gebleken uit het bestuderen van de diffusie van eenn-hexaan/2-methylpen-taan mengsel in silicaliet met behulp van de positron emissie profilering techniek.Met deze techniek is het mogelijk om de concentratie van radio-actief gelabeldemoleculen in een zeoliet reactor te meten. Met behulp van een numeriek modelvoor de stroming door de reactor kan informatie worden verkregen over de diffusie-constanten van de componenten als een functie van de samenstelling van het mengsel.Hierbij bleek dat met een toenemende fractie van2-methylpentaan in het mengsel, ereen sterke afname te zien is in de mobiliteit van het snel bewegenden-hexaan. Ditis het gevolg van het adsorptiegedrag van beide componenten, aangezien de vertaktealkanen bij voorkeur in de kruispunten tussen de verschillende kanalen gaat zitten.Het langzaam bewegende2-methylpentaan ondervindt daarentegen nauwelijks hin-der van de lineaire alkaan.
Aangezien de hiervoor genoemde resultaten erop wijzen dat het diffusie-gedragook sterk bepaalt wordt door de plaatsen waar de moleculen zich in de porien hetliefste ophouden, is de invloed hiervan onderzocht met behulp van dynamische MonteCarlo simulaties. Bij deze simulaties wordt een zeoliet beschouwd als een eenvoudignetwerk van kruispunt- en intersectie-sites, waarbij de moleculen voortbewegen doornaar een naburige lege site te springen. De voorkeur voor adsorptie opeen typesite blijkt inderdaad een grote invloed te hebben op het diffusiegedrag, zowel voorenkele componenten alswel voor mengsels. Over het algemeen leidt een voorkeurvoor adsorptie op de kruispunten tot een veel sterkere concentratie-afhankelijkheid.Dat dynamische Monte Carlo simulaties niet tot in detail in staat zijn om het gedragin zeolieten te beschrijven, blijkt wel uit het feit dat het gevonden gedrag bij de PEPexperimenten met de huidige modellen niet kon worden gereproduceerd.
Dankwoord
Hij is af! Na vier jaar en-een-beetje ligt het resultaat van mijn promotie-onderzoekvoor je neus. En zoals het geval is met alle proefschriften, is het niet alleen de persoongenoemd op de kaft van ’t boekje die dit alles tot stand heeft gebracht. Vandaarook dat ik graag van de mogelijkheid gebruik wil maken om een aantal mensen tebedanken.
In de eerste plaats wil ik natuurlijk Rutger van Santen bedanken voor het biedenvan de mogelijkheid om binnen SKA een promotie-onderzoek te doen. Je enthou-siasme, suggesties en niet aflatende ideeenstroom heb ik altijd als zeer stimulerendervaren. Vooral de vrijheid en het vertrouwen om een eigen richting te geven aanmijn promotie hebben dit tot een erg leerzame ervaring gemaakt.
Dank ook aan Peter Hilbers, Berend Smit en Freek Kapteijn voor jullie bereid-heid om plaats te nemen in de kerncommissie. Peter, het feit dat je de problemenvaak net vanuit een iets andere invalshoek wist te bekijken heb ik als zeer nuttig er-varen. Berend, bedankt voor het gebruik van de software en de continue interactietussen de simulaties in jouw groep en onze experimenten, wat ons ook bij het onder-zoek beschreven in hoofdstuk 5 erg geholpen heeft. Freek, bedankt voor de nuttigesuggesties ter verfijning van dit proefschrift.
Gedurende mijn promotie heb ik het genoegen gehad om met een aantal mensenregelmatig te kunnen samenwerken en/of van gedachten te wisselen. Alina, bedanktvoor de experimentele gegevens waarop ik mijn simulaties kon loslaten en de moge-lijkheid om me toch nog met experimenten te kunnen bemoeien. Darek en Jeroen wilik graag bedanken voor de gelegenheid om me eens met een ander probleem bezigte houden. Ook de mogelijkheid om eens wat meer te weten te komen over NMR-metingen, en de diverse discussies die ik heb gehad met Pieter Magusin heb ik als erginteressant en nuttig ervaren. Emiel van Kimmenade wil ik ook graag bedanken voorverrichtte werkzaamheden als afstudeerder onder mijn hoede. En natuurlijk dank aanFrank de Gauw, Niels Noordhoek, Arthur de Jong, Tonek Jansen en Bruce Andersonvoor discussies en advies op wetenschappelijk gebied.
Werken als AiO in de vakgroep is uiteraard ook meer dan werken alleen. Dankdan ook aan iedereen die mijn vier-en-een-half-jarig verblijf tussen de chemici tot eenaangenaam geheel hebben gemaakt. In het bijzonder denk ik hierbij aan oud-collega’sRobin en Eric en de heren van de koffie-, lunch-, en virtuele forumtafel. De vele,
146 Dankwoord
wetenschappelijk uiterst verantwoorde, discussies en andere bezigheden waren voormij altijd een waar genoegen! Chretien en Xavier, bedankt voor de immer aanwezigekoffie zo vroeg in de ochtend! En natuurlijk dank aan de SKA borrelcommissie,die de vrijdagmiddag toch altijd weer een speciaal tintje wisten te geven. En natu-urlijk ook dank aan alle andere groepsleden die voor de nodige gezelligheid hebbengezorgd tijdens het werk, de diverse conferentie- en cursusbezoeken, en tijdens hetorganiseren van de TMR Summerschool in Dronten.
Rest mij nog om alle vrienden te bedanken die ook buiten het AiO-schap omhun bijdrage hebben geleverd door via stapavondjes, feestjes, Ardennenweekenden,MTB- en fietstochten en andere bezigheden voor de nodige afleiding te zorgen. Dankook aan de leden van Squadra, die ervoor gezorgd hebben dat ik in topconditie mijnlaaste promotie-jaar heb kunnen doorkomen, en op een uitermate gezellige manierkennis heb kunnen maken met de triathlon. Ruben, bedankt voor het feit dat je mealtijd weer een trainingsdoel geeft (mijn tijd komt nog wel ...), en alle anderen die alsprestatie-verhogende factor en trainingspartner hebben gefungeerd.
Als laatste (maar zeker niet als minste) wil ik graag Mirjam bedanken, niet alleenomdat je op het laatste moment nog optrad als spellingscorrector, maar ook voor hetdoorstaan van vooral de laatste fase van mijn promotie. Het zit erop!
Publications
• Imaging of hydrocarbon reactions in zeolite packed-bed reactors using positronemission profiling.B.G. Anderson, N.J. Noordhoek, D. Schuring, F.J.M.M. de Gauw, A.M. deJong, M.J.A. de Voigt, and R.A. van Santen;Catal. Lett.56, 137–144 (1998).
• n-Pentane hopping in zeolite ZK-5 studied with13C NMR.P.C.M.M. Magusin, D. Schuring, E.M. van Oers, J.W. de Haan, and R.A. vanSanten;Magn. Reson. Chem.37, S108–S117 (1999).
• Concentration and chainlength dependence of the diffusivity of alkanes in zeo-lites studied with MD simulations.D. Schuring, A.P.J. Jansen, and R.A. van Santen;J. Phys. Chem. B104(5),941–948 (2000).
• Adsorption and diffusion of n-hexane/2-methylpentane mixtures in zeolite Sili-calite: experiments and modeling.D. Schuring, A.O. Koriabkina, A.M. de Jong, B. Smit, and R.A. van Santen;J.Phys. Chem. B105(32), 7690–7698 (2001).
• Adsorption and diffusion of alkanes and their mixtures in silicalite studied withpositron emission profiling.A.O. Koriabkina, D. Schuring, A.M. de Jong, J. van Grondelle, and R.A. vanSanten; In:Studies in Surface Science and Catalysis, Vol. 135, A. Galarneau,F. Di Renzo, F. Fajula, and J. Vedrine (eds.), Elsevier, Amsterdam, 2001.
• In situ study of alkane conversion on Pt-loaded acidic zeolites.N.J. Noordhoek, D. Schuring, F.J.M.M. de Gauw, B.G. Anderson, A.M. deJong, M.J.A. de Voigt, and R.A. van Santen;Ind. Eng. Chem. Res.41(8),1973–1985 (2002).
• Influence of the acid sites on the intracrystalline diffusion of hexanes and theirmixtures within MFI-zeolites.A. O. Koriabkina, A.M. de Jong, D. Schuring, J. van Grondelle, and R.A. vanSanten,J. Phys. Chem. B106(37), 9559–9566 (2002).
148 Publications
• Diffusion of 3-methylpentane in silicalite: concentration dependence.A.O. Koriabkina, D. Schuring, A.M. de Jong, and R.A. van Santen, submittedto J. Phys. Chem. B.
• Properties of single-file systems: what determines the typical single-file be-haviour?D. Schuringand R.A. van Santen, submitted toJ. Phys. Chem. B.
• Adsorption assisted desorption of NH3 on γ-alumina studied with the positronemission profiling technique.D. Sobczyk, J.J.G. Hesen, J. van Grondelle, D. Schuring, A.M. de Jong, andR.A. van Santen, to be submitted toJ. Catal.
• Diffusion of n-hexane in MFI zeolites: anisotropy effects and the concentrationdependence.A.O. Koriabkina, A.M. de Jong, D. Schuring, E.J.M. Hensen, and R.A. vanSanten, to be published.
Curriculum Vitae
Danny Schuring werd geboren op 11 mei 1974 te Amersfoort. In 1992 behaaldehij het Atheneum diploma aan het Vallei College te Amersfoort, waarna hij aan deTechnische Universiteit Eindhoven begon aan een studie Technische Natuurkunde.Tijdens zijn studie liep hij enkele maanden stage bij Philips Lighting in Eindhoven,waar hij werkte aan een niet-destructieve methode voor de bepaling van de hoeveel-heid kwik in fluorescentielampen. Zijn afstudeeronderzoek werd uitgevoerd bij devakgroep Kernfysische Technieken onder leiding van prof.dr. M.J.A. de Voigt endr. L.J. van IJzendoorn. Tijdens dit onderzoek werkte hij aan hetin-situ metenvan transporteigenschappen en reactiekinetiek van alkanen in zeolieten met behulpvan Positron Emissie Profilering, en de interpretatie van deze metingen met behulpvan numerieke simulaties van de stroming en reacties in deze systemen. In maart1998 trad hij in dienst als AiO bij de vakgroep Anorganische Chemie en Katalyseonder leiding van prof.dr. R.A. van Santen. Tijdens zijn promotie-onderzoek hieldhij zich bezig met de bestudering van diffusie in zeolieten met behulp van diverse(voornamelijk theoretische) methoden, zowel op microscopische (moleculaire) alsmacroscopische (reactor) schaal. De resultaten van dit onderzoek zijn beschreven indit proefschrift.