digest of the annual survey - kingstonsmith.co.uk · digest of the annual survey despite the...
TRANSCRIPT

It comes as something of a pleasant surprise that amongst the recent chaos and uncertainty, the results of the Kingston Smith survey show that collectively the sector managed to produce one of the better sets of financial results that has been seen for a number of years. Of the eight sectors surveyed, all eight saw their profit margins increase despite modest declines in revenue in the advertising and marketing and sales promotion (MSP) sectors and significant uncertainty hanging over the industry and indeed the whole country in the second half of the year.
Despite the challenges we have seen the sector accelerated the growth in income that had been seen over the previous couple of years and, as a result, delivered a welcomed improvement in profit margins.
After the surprise of the Brexit vote the realisation that there would be a period of business as usual before any real change seems to have allowed brands to press on with projects and campaigns that were planned. The real question is whether going into 2018 that confidence is maintained or whether we start to see income stagnating.
In the Kingston Smith annual survey, we reviewed the financial performance of eight distinct sectors: six individual disciplines –
Introduction
Kingston Smith | Marketing Monitor | Winter/Spring 2018 1
advertising, branding & design, digital, marketing & sales promotion, media buying and public relations (PR), as well as the UK quoted and independent marketing services groups (whether individual or mixed discipline).
The accounts that are reviewed are those that were filed at Companies House on, or before, 30 September 2017 and, in the majority of cases, cover the calendar year to 31 December 2016. Six of the eight sectors managed to grow total fee income when compared with the results of the same agencies last year with advertising flat year on year and MSP declining slightly. Even more encouragingly growth was, for the same six sectors, at a faster rate than it had been in the previous years.
Once again specialist digital agencies led the way with fee growth of over 15% with the PR and media buying sectors backing up good growth in the previous year with another year of double digit increases.
One of the key ratios for any agency to monitor is the proportion of fee income spent on staff costs. The Kingston Smith target ratio has historically been 55%, although a more realistic target in the current climate including freelancers, would be 60%. The amount of fee income spent on staff costs actually reduced by half a percentage point from a record high across all
the sectors surveyed of 60.7%. That even this modest improvement was possible is more of a reflection of businesses being able to add revenue at a faster rate than staff costs have increased rather than any easing of the upwards pressure on salary costs caused by on-going skills shortages.
Across the Top 50 independent groups, spend on staff costs remained extremely high at 62.7% of fee income. However, they were not alone, as this was once again a key theme across many of the individual disciplines with six out of the eight sectors surveyed spending 60% or more of their fee income on staff costs albeit with only two sectors spending a higher proportion of their income on talent than they had in the previous year. The picture looked
DIGEST OF THE ANNUAL SURVEY
Despite the challenges we have seen the sector accelerated the growth in income that had been seen over the previous couple of years and, as a result, delivered a welcomed improvement in profit margins.
2 Winter/Spring 2018 | Kingston Smith | Marketing Monitor
Marketing Monitor
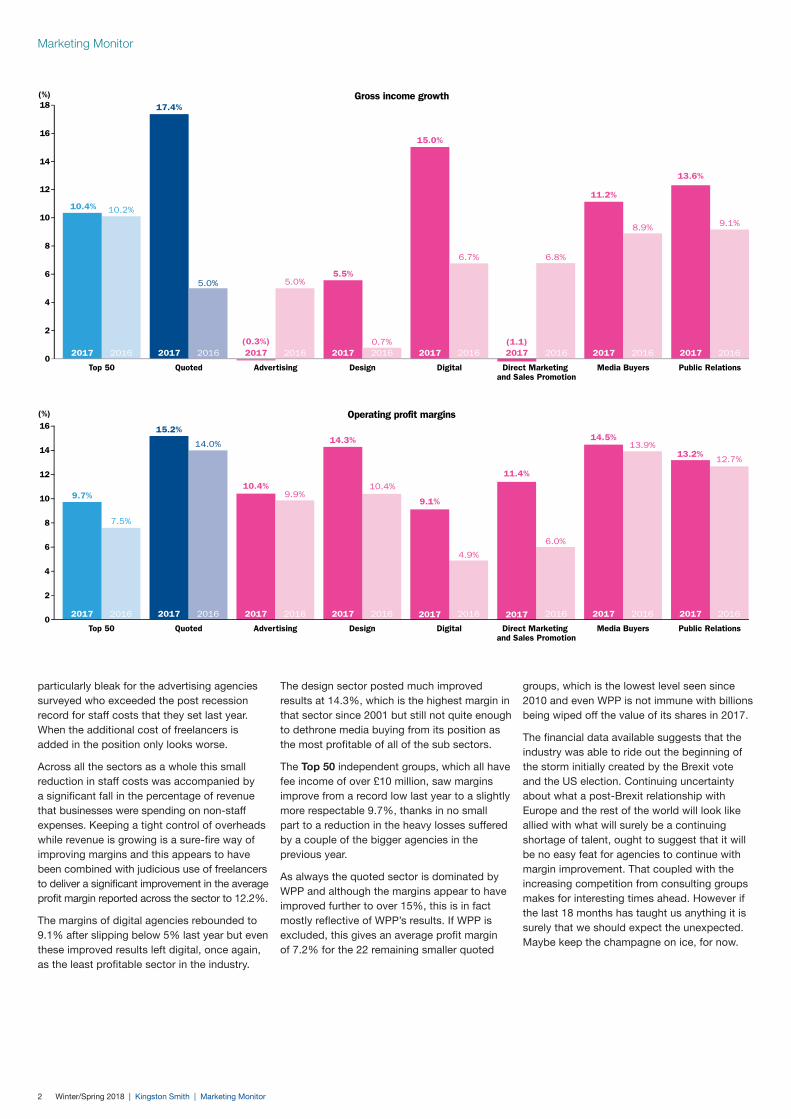
particularly bleak for the advertising agencies surveyed who exceeded the post recession record for staff costs that they set last year. When the additional cost of freelancers is added in the position only looks worse.
Across all the sectors as a whole this small reduction in staff costs was accompanied by a significant fall in the percentage of revenue that businesses were spending on non-staff expenses. Keeping a tight control of overheads while revenue is growing is a sure-fire way of improving margins and this appears to have been combined with judicious use of freelancers to deliver a significant improvement in the average profit margin reported across the sector to 12.2%.
The margins of digital agencies rebounded to 9.1% after slipping below 5% last year but even these improved results left digital, once again, as the least profitable sector in the industry.
The design sector posted much improved results at 14.3%, which is the highest margin in that sector since 2001 but still not quite enough to dethrone media buying from its position as the most profitable of all of the sub sectors.
The Top 50 independent groups, which all have fee income of over £10 million, saw margins improve from a record low last year to a slightly more respectable 9.7%, thanks in no small part to a reduction in the heavy losses suffered by a couple of the bigger agencies in the previous year.
As always the quoted sector is dominated by WPP and although the margins appear to have improved further to over 15%, this is in fact mostly reflective of WPP’s results. If WPP is excluded, this gives an average profit margin of 7.2% for the 22 remaining smaller quoted
groups, which is the lowest level seen since 2010 and even WPP is not immune with billions being wiped off the value of its shares in 2017.
The financial data available suggests that the industry was able to ride out the beginning of the storm initially created by the Brexit vote and the US election. Continuing uncertainty about what a post-Brexit relationship with Europe and the rest of the world will look like allied with what will surely be a continuing shortage of talent, ought to suggest that it will be no easy feat for agencies to continue with margin improvement. That coupled with the increasing competition from consulting groups makes for interesting times ahead. However if the last 18 months has taught us anything it is surely that we should expect the unexpected. Maybe keep the champagne on ice, for now.
10.2%10.4%
Gross income growth(%)
Top 50 Quoted Advertising Design Digital Direct Marketing and Sales Promotion
Media Buyers Public Relations
12
10
0
8
4
6
2
17.4%
5.0%
(0.3%)
5.0%5.5%
0.7%
15.0%
6.7%
(1.1)
6.8%
11.2%
8.9%
13.6%
9.1%
20162017 2017 2016 2017 2017 2017 2017 2017 20172016 2016 2016 2016 2016 2016
18
16
14
7.5%
9.7%
15.2%
10.4%9.9%
14.3%
10.4%
9.1%
11.4%
14.5%
13.2%14.0%
4.9%
6.0%
13.9%
12.7%
2016 2016 2016 2016 2016 20162016 20162017 2017 2017 2017 2017 2017 2017 2017
(%)
Top 50 Quoted Advertising Design Digital Direct Marketing and Sales Promotion
Media Buyers Public Relations
14
10
0
8
4
6
2
12
Operating profit margins16

Kingston Smith | Marketing Monitor | Winter/Spring 2018 3
Marketing Monitor
Launch of the Kingston Smith Annual Survey28 November 2017
Financial Performance Hall of Fame 2017Our ‘Financial Performance Hall of Fame’ recognises those agencies that are best in class in certain areas of financial performance.
In order to gain admittance and to share a stage with such an illustrious cohort, agencies must meet all of the stretch targets for our most important KPIs:
• Spending no more than 55% of fee income on employment costs
• Recording an operating profit margin of >20%
• Generating at least £120,000 of fee income per head
• Positive revenue growth
• Overhead cover of at least three months
For media buyers, we have increased the employment costs to fee income target ratio to 50%.
This year, there are 13 agencies that fulfilled those criteria as shown.
This years Hall of Fame is dominated by design agencies, with five represented.
It is also dominated by group-owned agencies this year, with just three independently-owned agencies meeting all the targets.
Size also proves to be no barrier to entry, with fee income of this years members’ ranging from £5.6 million up to £70 million – demonstrating that quality of offering is more important as economies of scale.
*Bulletproof Design Limited
*Fox IPL Limited
*Lousin Holdings Limited

4 Winter/Spring 2018 | Kingston Smith | Marketing Monitor
Marketing Monitor
Monitoring the MarketsThe Marketing Services Share Price (MSSP) Index tracks the share prices of UK listed marketing services groups, compared to performance of the FTSE 100.
Both broadly follow similar paths and over the last year we have seen growth in both. However, the highs and lows of the MSSP Index have been more extreme, closing at 48% above the FTSE 100 in December 2017 and 19% higher in December 2016.
Despite the difficult political environment, the FTSE 100 rose steadily over the last year, benefiting from the fall in sterling value, which has pushed up the earnings of companies with revenues overseas. More than two-thirds of the index’s profits came from overseas, so the sliding pound benefited them.
However, the MSSP Index outperformed the FTSE 100, achieving an all-time high in December 2017. This was despite it being a tough year for the market as advertisers announced substantial cutbacks in their marketing spend as well as increasing demands for greater media transparency and growing competition from consulting groups like Accenture and Deloitte.
However, it was helped by the international profile of many of those UK listed groups and as ever there were winners and losers.
Taptica closed 2017 at an all-time high on the back of impressive trading results driven by significant growth and international expansion. The year saw the mobile advertisers announce stellar profits, expanding into India, and making acquisitions.
XL Media’s growth was seemingly relentless following acquisitions in North America. Gaining control over comparison websites also increased their attractiveness to investors, and led their share price to peak in December 2017.
Huntsworth saw their share price more than double over the year. This was helped by acquisitions and improved half year results.
Crossrider nearly doubled also. This was sparked by improved results and acquisitions. The company has also continued to leverage its digital marketing platform to grow its customer user base.
However, not all enjoyed a stellar year on the stock market. The year was surprisingly
disappointing for WPP as their share price plummeted by around 25% to levels not seen since 2014; largely attributed to the sharp drop in consumer ads causing Sorrell to slash growth forecasts.
St Ives share price also declined. This followed an announcement of the loss of a significant client contract. A small amount of recovery has followed.
One real surprise this year was System1 Group (formerly BrainJuicer) which saw share prices jump at the beginning of the year, following a report of spectacular 2016 profits. The share price reached an all-time-high in April 2017 but then plummeted back down after reporting disappointing profits.
Matomy experienced issues as their core business (desktop & display advertising) plummeted in value with the rise of mobile and video advertising causing its share price to decrease by 38%.
All in all a year of mixed fortunes for UK listed marketing services companies. No doubt given how the start to 2018 has been it will be more of the same volatility.
March/April 2014Tensions in
Ukraine dampened performance.
May 2014 Performance bolstered by
positive company updates, takeovers and an improving
global ecomony.
August 2014Downgrading of US credit rating by Standard & Poor’s.
October 2014Slowdown in Eurozone puts market under pressure whilst US stock market suffers losses that impact on FTSE 100.
September 2015Mining shares fall, as
commodity prices continue to weaken as a result of the
Chinese economy slowdown.
February 2016Fears over the health of the global economy
increase, as global stocks fall into a bear market, triggered by significant losses in Hong Kong and continued oil price slide.
FTSE 100 reaches lowest level in 3½ years.
June 2016EU Referendum, 23 June 2016. Majority (51.9%) votes to leave the EU.
November 2016Donald Trump
beats Hillary Clinton in the US presidential election, 8 November
2016.
March 2017UK triggers article
50, 29 March 2017.
May 2017FTSE 100 hits new
peak as UK inflation jumps to 2.7%.
July 2017Chinese GDP data helped lift commodity prices and in turn mining shares, which pushed the FTSE 100 higher.
December 2017UK stock markets
climbed to new highs on the final day of trading for 2017.
Quoted Marketing Services GroupsFTSE 100
Kingston Smith Marketing Services Share Price Index vs FTSE 100
0%
-10%
-20%
-30%
10%
20%
30%
40%
50%
60%
70%
80%
90%
May-16
Jun-16
Jul-16
Aug-16
Sep-16
Oct-16
Nov-16
Dec-16
Jan-17
Feb-17
Mar-17
Apr-17
May-17
Jun-17
Jul-17
Aug-17
Sep-17
Oct-17
Nov-17
Dec-17
Apr-16
Mar-16
Feb-16
Jan-16
Dec-15
Nov-15
Oct-15
Sep-15
Aug-15
Jul-15
Jun-15
May-15
Apr-15
Mar-15
Feb-15
Jan-15
Dec-14
Nov-14
Oct-14
Sep-14
Aug-14
Jul-14
Jun-14
May-14
Apr-14
Mar-14
Feb-14
Jan-14
Kingston Smith | Marketing Monitor | Winter/Spring 2018 5
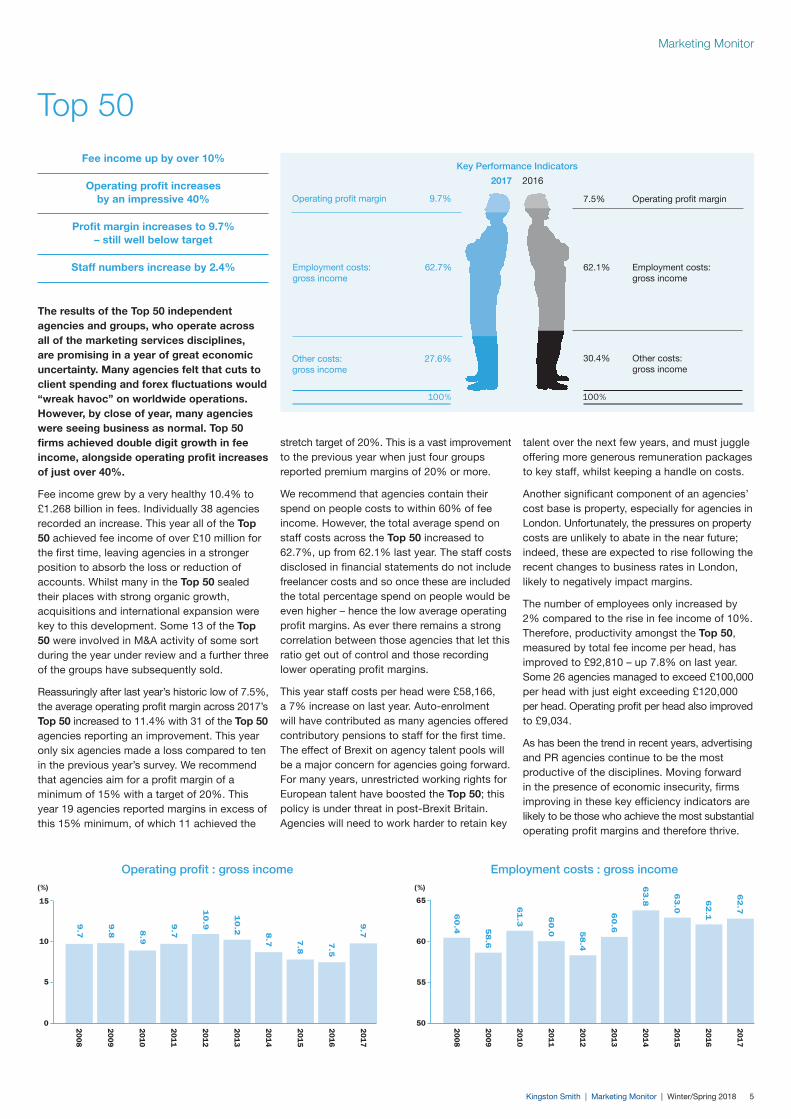
The results of the Top 50 independent agencies and groups, who operate across all of the marketing services disciplines, are promising in a year of great economic uncertainty. Many agencies felt that cuts to client spending and forex fluctuations would “wreak havoc” on worldwide operations. However, by close of year, many agencies were seeing business as normal. Top 50 firms achieved double digit growth in fee income, alongside operating profit increases of just over 40%.
Fee income grew by a very healthy 10.4% to £1.268 billion in fees. Individually 38 agencies recorded an increase. This year all of the Top 50 achieved fee income of over £10 million for the first time, leaving agencies in a stronger position to absorb the loss or reduction of accounts. Whilst many in the Top 50 sealed their places with strong organic growth, acquisitions and international expansion were key to this development. Some 13 of the Top 50 were involved in M&A activity of some sort during the year under review and a further three of the groups have subsequently sold.
Reassuringly after last year’s historic low of 7.5%, the average operating profit margin across 2017’s Top 50 increased to 11.4% with 31 of the Top 50 agencies reporting an improvement. This year only six agencies made a loss compared to ten in the previous year’s survey. We recommend that agencies aim for a profit margin of a minimum of 15% with a target of 20%. This year 19 agencies reported margins in excess of this 15% minimum, of which 11 achieved the
Top 50
Marketing Monitor
stretch target of 20%. This is a vast improvement to the previous year when just four groups reported premium margins of 20% or more.
We recommend that agencies contain their spend on people costs to within 60% of fee income. However, the total average spend on staff costs across the Top 50 increased to 62.7%, up from 62.1% last year. The staff costs disclosed in financial statements do not include freelancer costs and so once these are included the total percentage spend on people would be even higher – hence the low average operating profit margins. As ever there remains a strong correlation between those agencies that let this ratio get out of control and those recording lower operating profit margins.
This year staff costs per head were £58,166, a 7% increase on last year. Auto-enrolment will have contributed as many agencies offered contributory pensions to staff for the first time. The effect of Brexit on agency talent pools will be a major concern for agencies going forward. For many years, unrestricted working rights for European talent have boosted the Top 50; this policy is under threat in post-Brexit Britain. Agencies will need to work harder to retain key
Operating profit margin 9.7% 7.5% Operating profit margin
Employment costs: 62.7%gross income
62.1% Employment costs: gross income
Other costs: 27.6%gross income
30.4% Other costs: gross income
Key Performance Indicators
2017 2016
talent over the next few years, and must juggle offering more generous remuneration packages to key staff, whilst keeping a handle on costs.
Another significant component of an agencies’ cost base is property, especially for agencies in London. Unfortunately, the pressures on property costs are unlikely to abate in the near future; indeed, these are expected to rise following the recent changes to business rates in London, likely to negatively impact margins.
The number of employees only increased by 2% compared to the rise in fee income of 10%. Therefore, productivity amongst the Top 50, measured by total fee income per head, has improved to £92,810 – up 7.8% on last year. Some 26 agencies managed to exceed £100,000 per head with just eight exceeding £120,000 per head. Operating profit per head also improved to £9,034.
As has been the trend in recent years, advertising and PR agencies continue to be the most productive of the disciplines. Moving forward in the presence of economic insecurity, firms improving in these key efficiency indicators are likely to be those who achieve the most substantial operating profit margins and therefore thrive.
Fee income up by over 10%
Operating profit increases by an impressive 40%
Profit margin increases to 9.7% – still well below target
Staff numbers increase by 2.4%
Operating profit : gross income
0
15
5
10
(%)
2016
2015
2014
2013
2012
2011
2010
2008
2009
9.7
9.8 8
.9
9.7
10
.9
10
.2 8.7 7
.5
7.8
2017
9.7
Employment costs : gross income
50
65
55
60
(%)
20
16
20
15
20
14
20
13
20
12
20
11
20
10
20
08
20
09
62
.1
63
.0
20
17
62
.761
.3
60
.4 58
.6
60
.0 58
.4
60
.6
63
.8

6 Winter/Spring 2018 | Kingston Smith | Marketing Monitor
Fee income reported by the Top 50 advertising agencies declined slightly by 0.25% compared to their previous year’s results. These statistics set the tone for the advertising sector this year which has found that budgets are being squeezed and delayed in response to an uncertain economy on top of the historic issue of being able to charge properly for the services delivered.
Encouragingly, 28 of the Top 50 advertising agencies reported growth in fee income, with nine reporting increases of more than 15%. However, the significant growth reported by some was countered by some large decreases by others which meant an overall decrease.
As pitches become more competitive the pressure on fees within the advertising sector is fierce. Many agencies are agreeing to service more work for the same fee for existing clients and heavily discount rate cards for new ones. This behaviour isn’t sustainable in the long term and it’s those agencies that can separate themselves from the price competition that will deliver sustainable profits.
We suggest that a well run agency should aim to make an operating margin between 15% and 20% and the average operating profit margin of the Top 50 improved slightly from a low of 9.9% last year to 10.4%. This is some way off our target but encouragingly 17 agencies (13 last year) achieved our minimum target of 15%. The results were more polarised this year with
Advertising
a record number of standout performers but at the same time more loss making agencies.
Across the Top 50 advertising agencies, the spend on employment costs as a proportion of revenue/fee income ratio worsened to 61.3% from 60.4% last year which is another record high for the sector. The pressure on staff costs is unlikely to relent in the short term as specialist digital skills are required at a premium and so it will be those agencies that can balance their costs with revenues that will deliver great results. Of course, this 61.3% doesn’t include freelancer costs which are not reported in statutory accounts. Therefore once factored in the percentage spend on people costs is likely to be a lot more than our target of 60%, hence the low margins.
Productivity as measured by gross income per head increased to £111,476 as staff numbers decreased ahead of revenues. This is in line with our target for advertising agencies of between £100,000 and £120,000 per head and some 28 agencies met the target of £100,000, with 15 exceeding the upper range of £120,000.
As revenue growth opportunities become more pressured and talent is more expensive it is more difficult than ever to deliver good financials as our survey results confirm.
Unfortunately, 2018 looks to bring more of the same gloomy news for the advertising sector. With the majority of brands under pressure to deliver short term financial performance, longer term relationships and retainer fee arrangements are becoming increasingly rare. The threat of consultancies is also very real as in some cases they are offering creative services and content marketing along with their strategic and data analytics solutions. At the same time, the uncertainty around Brexit and the global economy are unlikely to help increase demand while adding pressure to staff costs. Those agencies that can adapt their offerings to combine creative excellence with strategic business solutions whilst managing their resources are the ones that will prosper.
Marketing Monitor
Fee income falls by 0.25%
Profit margins improve slightly to 10.4%
Amount spent on staff costs increases again to another all time high of 61.3%
A staggering 12 agencies reported losses
Key Performance Indicators
2017 2016
Operating profit margin 10.4% 9.9% Operating profit margin
Employment costs: 61.3%gross income
60.4% Employment costs: gross income
Other costs: 28.3%gross income
29.7% Other costs: gross income
Operating profit : gross income
8.8 7
.0
8.5 7
.0
13
.0 10.7
10.9
11.6
12.3
12
.6
11
.3
11.9
12
.1
11.2
10
.7 9.9
11.2
(%)
0
5
10
15
201
4
201
3
201
2
201
1
201
0
200
9
200
8
200
7
200
6
200
5
200
4
200
3
200
2
200
1
200
0
201
6
201
5
10.4
201
7
Employment costs : gross income
54.0
56.0
56.0
56.0
58.0
59.0
57.6
56.3
56.5
59.9
58.5
58.9
59.4
60.3
55.0
60.4
60.0
(%)
40
45
50
55
60
65
2014
2013
2012
2011
2010
2009
2008
2007
2006
2005
2004
2003
2002
2001
2000
2016
2015
61.3
2017

Kingston Smith | Marketing Monitor | Winter/Spring 2018 7
After two consecutive years with income growth of less than 1% the design sector has had a much improved year, with the Top 30 design agencies overall generating £398 million of fee income, an increase of £21 million (5%) on last year. This increase in fee income has transformed operating profits reported across the Top 30, with agencies reporting an increase in profits of just under 50%.
However, this growth was not spread evenly across the board. Individually, 13 of the Top 30 design agencies saw a fall in fee income, whilst 17 saw an increase, 12 of which grew by more than 10%. Those who have had a successful year attributed this to success in winning new clients, successful acquisitions (in some cases), and taking advantage of market conditions in the year or exchange rate gains as a result of a falling pound.
Encouragingly this growth in fee income has translated well into profitability. Operating profit has increased by nearly 50% across the sample. The really good news is that margins have also improved. Some 14 agencies met the recommended sector target of a 15% operating profit margin (compared to last year’s nine), and all but one of these reported a margin of over 20%. The overall effect is that the average margin for the Top 30 design agencies is the highest it has been since 2001 at 14.3%! Operating profit per head also increased dramatically to £14,600.
Whilst fee income went up employed staff numbers reduced slightly, which meant fee income per head increased by 6% to £102,112.
Branding and design
Marketing Monitor
Fee income increases by 5%
Operating profits increase by 49%
Employment costs to fee income improves to 60.5%
Profit margins improve dramatically to 14.3%
As in previous years, over half of agencies achieved over £100,000 per head and eight of those exceeded £120,000 of income per head.
Employment costs per head were around £62,000, representing an increase of about £3,000 per head on the previous year. Agencies also managed to control non-staff costs as well which saw a decrease in spend per head of nearly 10% – contributing heavily to the improved margins.
One key factor of profitability is also the ability of agencies to control the proportion of fee income spent on staff costs and this ratio is a factor the amount paid to employees and the fee income they generate per head. Overall the Top 30 design agencies spent 60.5% of fee income on staff costs, an improvement on last year’s 61.6%. Of course the design industry is also heavily reliant on freelancers and so once these are factored in, the spend on total people costs will be higher.
As always group-owned agencies lead the field in fee income generated per head, with £112,000 on average, compared to the £97,000 recorded by independent agencies, likely to be more of a reflection of their ability to charge a relatively
Key Performance Indicators
2017 2016
Operating profit margin 14.3% 10.4% Operating profit margin
Employment costs: 60.5%gross income
61.6% Employment costs: gross income
Other costs: 25.2%gross income
28.0% Other costs: gross income
high fee for the work they are doing. This also translated into profit margins where group-owned agencies faired better than independent agencies achieving over 20% operating profit margins compared to the 10% achieved by independents. That said, independents are growing at a rapid rate, and reported an 8% increase in fee income compared to less than 2% for group agencies.
It is clear, then, that the design industry as a whole has learned and adapted from last year, pushing hard for improved growth while controlling costs. This has resulted in growth in fees and margins being at their highest in nearly two decades. However, the sector seems to be fairly split with many companies reporting good levels of profit while some continue to really struggle. There were less companies “surviving” with a mediocre profit margin in the middle ground than there has been.
It appears as though there are very good profits to be made for those businesses that have a compelling offer that they are articulating and delivering to clients and that for those that don’t it will become harder and harder to make even a modest margin.
Operating profit : gross income
15.1
15.4
12.9
8.0 6
.7
7.2
9.0 8.5
9.5
9.9
6.7
9.5 8
.7
11.7
11.5
11.0
10.4
5
(%)
10
15
20
20
16
20
15
14.3
20
17
20
14
20
13
20
12
20
11
20
10
20
09
20
08
20
07
20
06
20
05
20
04
20
03
20
02
20
01
20
00
Employment costs : gross income
66.2
60.9
63.3
72.5 6
8.0 6
5.0 6
1.5 5
8.0
59.4
57.9
61.1 58.5
59.5
60.1
58.8
61.65
8.7
(%)
40
75
55
45
50
60
65
70
2016
2015
60.5
2017
2014
2013
2012
2011
2010
2009
2008
2007
2006
2005
2004
2003
2002
2001
2000

8 Winter/Spring 2018 | Kingston Smith | Marketing Monitor
Our review of the Top 30 digital agencies shows a growth in fee income of 15% to £757.4 million. This represents a substantial increase in growth compared with last year’s 6.7%, and is the largest percentage increase for gross income since 2012. For the first time since 2014, agencies managed to convert this top line growth into an increase in operating profit.
Individually, some 23 of the agencies reported an increase in fee income. Some 11 of these reported growth of over 20%, suggesting significant client wins. Seven of the Top 30 saw a decrease in their reported fee income this year.
The total operating profit margin in this year’s survey therefore improved significantly to 9.1% compared with 4.9% last year (the second lowest result we had ever seen for digital). The benchmark that we believe digital agencies should be aiming for is at least 15%. Therefore, the sector as a whole is far off meeting these margins. However more agencies this year met that 15% target – 14 compared with 12 last year. This year only five agencies made a loss compared to nine agencies in last year’s survey. Clearly many of those loss makers have dropped out of the Top 30 this year as their income levels have reduced, and this has contributed to the improved margins.
Employment costs are the most significant factor in controlling profit for all agencies; particularly London based ones where higher wages and property costs squeeze margins even tighter. In order to ensure a healthy bottom line, we recommend keeping employment costs below
Digital
Marketing Monitor
Fee income growth of 15.0%, the highest since 2012
Operating profit margin improves significantly to 9.1%
Group-owned agencies out performing independents in income growth
but not margins
Use of freelancers remains high
55% of fee income. For the Top 30 as a whole, employment costs contributed to 56.3% of fee income, another reduction from the 57.1% seen last year. However, once the heavy use of freelancers is included, the combined ratio for total people costs should be no more than 60% of fee income. The low profit margins, despite controlled staff costs, indicate that overhead costs include a high level of freelancers; the inclusion of these would inevitably increase the combined ratio for people costs to above 60%.
The total fee income per head across the Top 30 this year was £97,524, a slight decrease from last year’s £96,287. Our benchmark is £100,000, and so digital agencies are falling below this and if the full-time equivalent number of freelancers were factored in the true average for the digital agencies would be even lower. This year, 14 companies achieved our target benchmark of £100,000 fee income per head, up from 11 last year.
Total staff numbers rose in the sector by 15.8% this year which, as usual, closely tracks the increase in fee income.
Operating profit generated per employee increased this year after two years of decline, to £8,912. This still falls way short of our target
of £15,000, but at least represents a step in the right direction for the sector after years of decline. The digital sector historically has a lower operating profit per head in comparison to other marketing disciplines.
Growth this year has once again been impressive and outpaced the other sectors in the survey. This comes as no great shocks given the increasing percentage of marketing spend which is going in to digital.
After two years of declining operating profit margins, income growth has finally been translated into a significant improvement in margins, and there are also fewer agencies making losses. Despite this, margins in the sector are still lagging behind all other marking disciplines in our survey indicating that digital still hasn’t got it quite right.
Digital agency’s constant need to innovate and reinvent in order to stay ahead of the competition remains an on-going challenge. This is in the face of clients not paying properly for those services as they still don’t quite understand the ROI and think digital means “cheap” coupled with the high people costs including freelancers.
Key Performance Indicators
2017 2016
Operating profit margin 9.1% 4.9% Operating profit margin
Employment costs: 56.3%gross income
57.1% Employment costs: gross income
Other costs: 34.6%gross income
38.0% Other costs: gross income
Operating profit : gross income
5.7
10.0
8.79.5
9.0
7.5
4.7
11.0
8.2
4.96.0
9.6
0
12
2
4
6
8
10
(%)
20
05
20
06
20
07
20
08
20
09
20
14
20
16
20
15
9.1
20
17
20
13
20
12
20
11
20
10
Employment costs : gross income
59.658.6
59.2
63.0
64.7
61.9 61.9
57.8
62.1
59.8
57.1
58.8
(%)
20
05
20
06
20
07
20
08
20
09
20
14
20
16
20
15
56.3
20
17
20
13
20
12
20
11
20
10
54
56
58
60
62
64
66
Kingston Smith | Marketing Monitor | Winter/Spring 2018 9
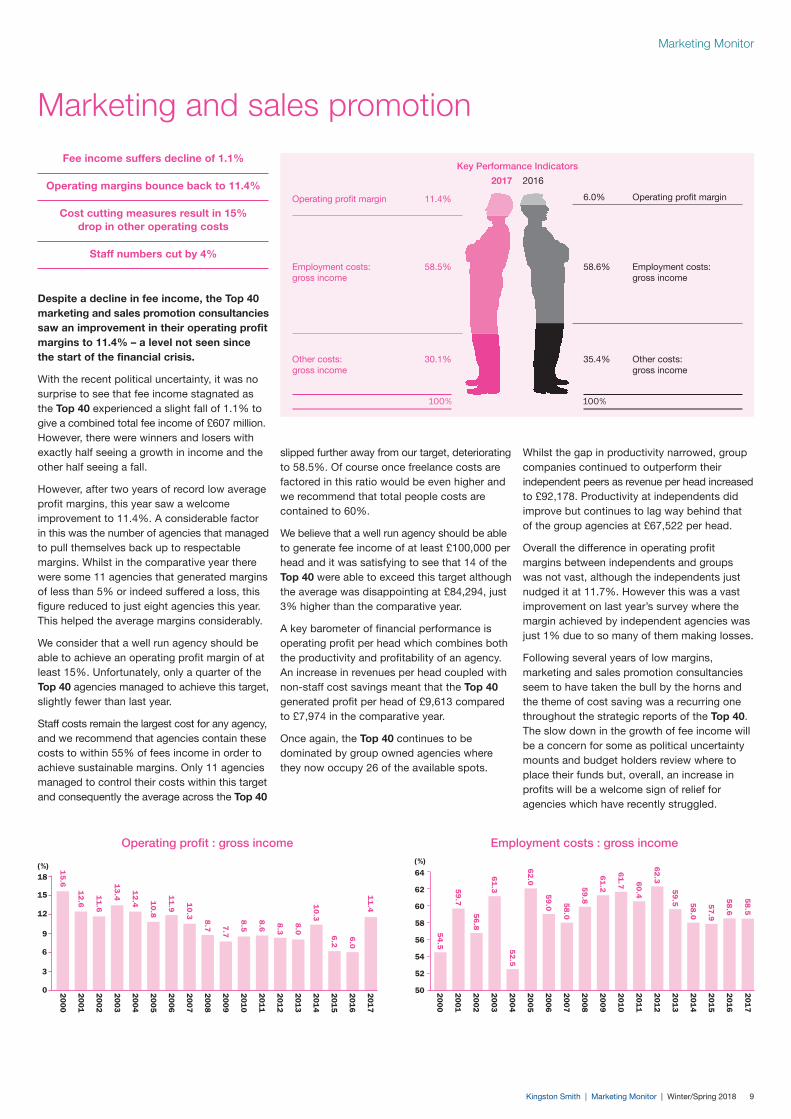
Despite a decline in fee income, the Top 40 marketing and sales promotion consultancies saw an improvement in their operating profit margins to 11.4% – a level not seen since the start of the financial crisis.
With the recent political uncertainty, it was no surprise to see that fee income stagnated as the Top 40 experienced a slight fall of 1.1% to give a combined total fee income of £607 million. However, there were winners and losers with exactly half seeing a growth in income and the other half seeing a fall.
However, after two years of record low average profit margins, this year saw a welcome improvement to 11.4%. A considerable factor in this was the number of agencies that managed to pull themselves back up to respectable margins. Whilst in the comparative year there were some 11 agencies that generated margins of less than 5% or indeed suffered a loss, this figure reduced to just eight agencies this year. This helped the average margins considerably.
We consider that a well run agency should be able to achieve an operating profit margin of at least 15%. Unfortunately, only a quarter of the Top 40 agencies managed to achieve this target, slightly fewer than last year.
Staff costs remain the largest cost for any agency, and we recommend that agencies contain these costs to within 55% of fees income in order to achieve sustainable margins. Only 11 agencies managed to control their costs within this target and consequently the average across the Top 40
Marketing and sales promotion
slipped further away from our target, deteriorating to 58.5%. Of course once freelance costs are factored in this ratio would be even higher and we recommend that total people costs are contained to 60%.
We believe that a well run agency should be able to generate fee income of at least £100,000 per head and it was satisfying to see that 14 of the Top 40 were able to exceed this target although the average was disappointing at £84,294, just 3% higher than the comparative year.
A key barometer of financial performance is operating profit per head which combines both the productivity and profitability of an agency. An increase in revenues per head coupled with non-staff cost savings meant that the Top 40 generated profit per head of £9,613 compared to £7,974 in the comparative year.
Once again, the Top 40 continues to be dominated by group owned agencies where they now occupy 26 of the available spots.
Whilst the gap in productivity narrowed, group companies continued to outperform their independent peers as revenue per head increased to £92,178. Productivity at independents did improve but continues to lag way behind that of the group agencies at £67,522 per head.
Overall the difference in operating profit margins between independents and groups was not vast, although the independents just nudged it at 11.7%. However this was a vast improvement on last year’s survey where the margin achieved by independent agencies was just 1% due to so many of them making losses.
Following several years of low margins, marketing and sales promotion consultancies seem to have taken the bull by the horns and the theme of cost saving was a recurring one throughout the strategic reports of the Top 40. The slow down in the growth of fee income will be a concern for some as political uncertainty mounts and budget holders review where to place their funds but, overall, an increase in profits will be a welcome sign of relief for agencies which have recently struggled.
Marketing Monitor
Fee income suffers decline of 1.1%
Operating margins bounce back to 11.4%
Cost cutting measures result in 15% drop in other operating costs
Staff numbers cut by 4%
Key Performance Indicators
2017 2016
Operating profit margin 11.4% 6.0% Operating profit margin
Employment costs: 58.5%gross income
58.6% Employment costs: gross income
Other costs: 30.1%gross income
35.4% Other costs: gross income
Operating profit : gross income
8.7 7
.7
8.5
8.6 8.3
8.0
10.3
6.0
6.2
10.3
15.6
12.6
11.6
13.4
12.4 1
0.8
11.9
0
18
9
12
3
6
(%)
15
2014
2013
2012
2011
2010
2009
2008
2007
2006
2005
2004
2003
2002
2001
2000
2016
2015
11.4
2017
Employment costs : gross income
62
.360
.4
61
.7
58
.0
54
.5
59
.7
56
.8
61
.3
52
.5
62
.0
59
.8
59
.5 58
.6
57
.9
58
.0
61
.2
59
.0
(%)
20
14
20
13
20
12
20
11
20
10
20
09
20
08
20
07
20
06
20
05
20
04
20
03
20
02
20
01
20
00
20
16
20
15
58
.52
01
7
50
52
54
56
58
60
62
64

10 Winter/Spring 2018 | Kingston Smith | Marketing Monitor
It was a good year for media buyers. Reported revenues, or fee income, for the Top 30 media buyers has for the first time exceeded £1 billion following growth of 11.1%. This suggests that, finally, the investment of recent years is delivering the growth the sector had hoped for. The growth in revenues was widespread with some 25 of the Top 30 seeing an increase.
The good news is that much of this growth fell to the bottom line with operating profits increasing by 17.15%. Therefore, the sector continued to recover with operating profit margins improving for the third year running to 14.5%, an improvement on the 2016 and 2015 surveys of 13.9% and 12.8%, respectively. Despite the upward trend, this margin is well below the 20% margin seen in our 2009 survey before the recession hit.
Some 21 agencies exceeded our minimum operating profit margin target of 20% with 15 exceeding our upper end target of 25%.
Staff costs make up a large proportion of overheads, and so the major contributory factor to the improved operating profit margin is the improvement in the staff costs: gross income ratio to 59.9% from 60.3%.
In recent years, media buying agencies have invested heavily in talent although this year staff numbers increased by just 4% which was
Media buyers
Marketing Monitor
Fee income rises by over 20%
The largest growth in fee income was achieved by mobile focused agencies
Operating profit margin improves to 14.5%
Prior year investment in technology and staff pays off as fee income per head increases to £107,909
much less than the growth in revenues. As a consequence fee income per head rose to £107,909, suggesting the investment of earlier years in staff and technology is paying off. This is also reflected in the improvement in operating profit per head of £15,642 compared to £13,889 last year.
Individually, 10 agencies achieved fee income per head in excess of our recommended target of £120,000.
Overall employment costs per head rose by 8.6%. This is likely a reflection of the continuing need for multi skilled staff who are able to command higher salaries. In our opinion, media buying agencies should aim to contain employee costs to within 50% of revenues, and as a maximum should not exceed 55%. This year only 10 companies achieved this target of 50%, which was the same as the comparative year. Historically, media buyers were able to do this but in recent years this has not been possible which has contributed to margins not yet recovering to pre-recessionary levels.
Independents have traditionally controlled their staff costs better – it was the same this year with the six independents in the Top 30 spending 54.8% of revenues on staff compared to 60.1% at the groups. This enabled the independents to deliver a ratio of operating profit to fee income of 18.9% compared to 14.3% for the groups. However, of course the effect of this higher margin amongst the independents gets swamped by the results of the group owned agencies in the overall sector averages.
As technology used within the media buying world advances, media buying agencies need to be constantly reviewing and assessing their business strategy. As machine learning becomes more capable of automating complicated parts of the media buying process and brands increasingly go direct to the media owners, agencies need to find new ways of adding value. Success or failure depends on their ability to predict trends and reinvent their business model to differentiate themselves from their competitors.
Key Performance Indicators
2017 2016
Operating profit margin 14.5% 13.9% Operating profit margin
Employment costs: 59.9%gross income
60.3% Employment costs: gross income
Other costs: 25.6%gross income
25.8% Other costs: gross income
Operating profit : gross income
0
(%)25
20
15
10
5
20
16
20
15
20
14
20
13
20
12
20
11
20
10
20
09
20
08
20
07
20
06
20
05
20
04
20
03
20
02
20
01
20
00
19
.2
18
.3 16
.1
17
.0
17
.1
17
.1
18
.4
19
.1
20
.8
22
.2
18
.0
18
.8
19
.5
14
.9
15
.9 13
.9
20
17
14
.512
.8
Employment costs : gross income
47
.8
49
.2
53
.0 50
.0
52
.0 49
.0
49
.0
50
.0
52
.4
47
.8
52
.0
54
.3 52
.6
57
.4
56
.9
60
.3
60
.4
(%)
40
65
55
45
50
60
20
14
20
13
20
12
20
11
20
10
20
09
20
08
20
07
20
06
20
05
20
04
20
03
20
02
20
01
20
00
20
16
20
15
59
.92
01
7
Kingston Smith | Marketing Monitor | Winter/Spring 2018 11
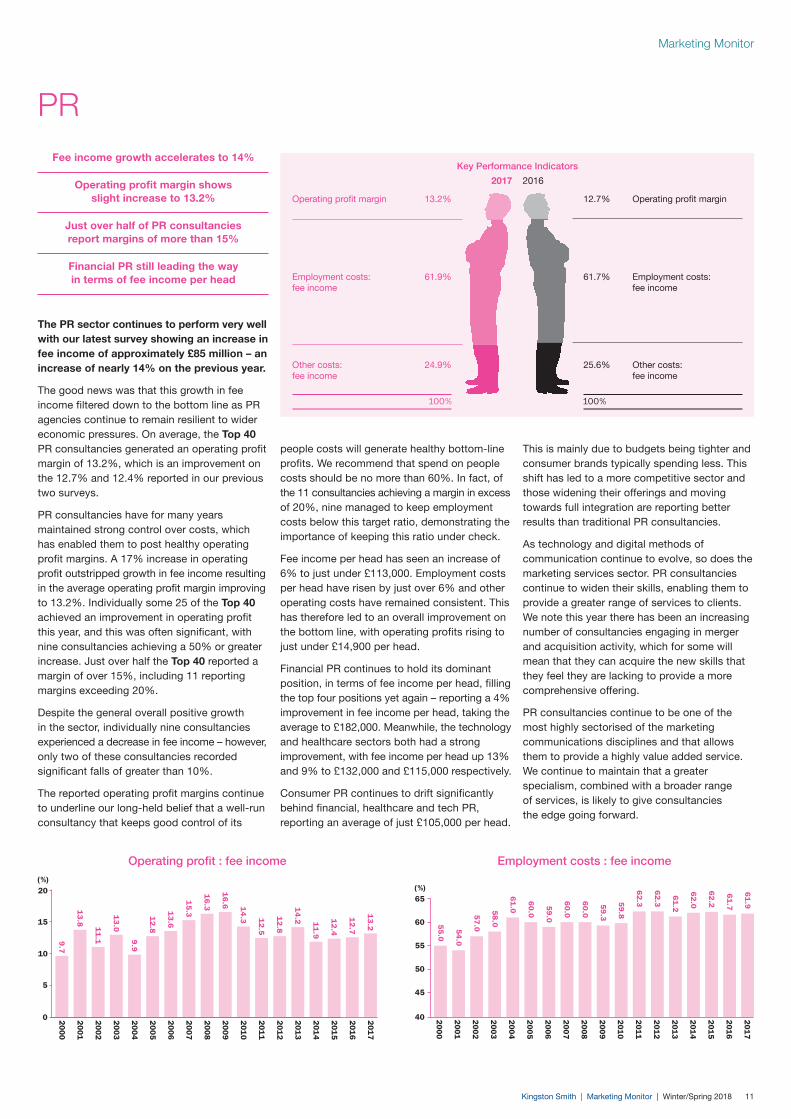
The PR sector continues to perform very well with our latest survey showing an increase in fee income of approximately £85 million – an increase of nearly 14% on the previous year.
The good news was that this growth in fee income filtered down to the bottom line as PR agencies continue to remain resilient to wider economic pressures. On average, the Top 40 PR consultancies generated an operating profit margin of 13.2%, which is an improvement on the 12.7% and 12.4% reported in our previous two surveys.
PR consultancies have for many years maintained strong control over costs, which has enabled them to post healthy operating profit margins. A 17% increase in operating profit outstripped growth in fee income resulting in the average operating profit margin improving to 13.2%. Individually some 25 of the Top 40 achieved an improvement in operating profit this year, and this was often significant, with nine consultancies achieving a 50% or greater increase. Just over half the Top 40 reported a margin of over 15%, including 11 reporting margins exceeding 20%.
Despite the general overall positive growth in the sector, individually nine consultancies experienced a decrease in fee income – however, only two of these consultancies recorded significant falls of greater than 10%.
The reported operating profit margins continue to underline our long-held belief that a well-run consultancy that keeps good control of its
PR
Marketing Monitor
people costs will generate healthy bottom-line profits. We recommend that spend on people costs should be no more than 60%. In fact, of the 11 consultancies achieving a margin in excess of 20%, nine managed to keep employment costs below this target ratio, demonstrating the importance of keeping this ratio under check.
Fee income per head has seen an increase of 6% to just under £113,000. Employment costs per head have risen by just over 6% and other operating costs have remained consistent. This has therefore led to an overall improvement on the bottom line, with operating profits rising to just under £14,900 per head.
Financial PR continues to hold its dominant position, in terms of fee income per head, filling the top four positions yet again – reporting a 4% improvement in fee income per head, taking the average to £182,000. Meanwhile, the technology and healthcare sectors both had a strong improvement, with fee income per head up 13% and 9% to £132,000 and £115,000 respectively.
Consumer PR continues to drift significantly behind financial, healthcare and tech PR, reporting an average of just £105,000 per head.
This is mainly due to budgets being tighter and consumer brands typically spending less. This shift has led to a more competitive sector and those widening their offerings and moving towards full integration are reporting better results than traditional PR consultancies.
As technology and digital methods of communication continue to evolve, so does the marketing services sector. PR consultancies continue to widen their skills, enabling them to provide a greater range of services to clients. We note this year there has been an increasing number of consultancies engaging in merger and acquisition activity, which for some will mean that they can acquire the new skills that they feel they are lacking to provide a more comprehensive offering.
PR consultancies continue to be one of the most highly sectorised of the marketing communications disciplines and that allows them to provide a highly value added service. We continue to maintain that a greater specialism, combined with a broader range of services, is likely to give consultancies the edge going forward.
Fee income growth accelerates to 14%
Operating profit margin shows slight increase to 13.2%
Just over half of PR consultancies report margins of more than 15%
Financial PR still leading the way in terms of fee income per head
Key Performance Indicators
2017 2016
Operating profit margin 13.2% 12.7% Operating profit margin
Employment costs: 61.9%fee income
61.7% Employment costs: fee income
Other costs: 24.9%fee income
25.6% Other costs: fee income
Operating profit : fee income
0
20
15
5
10
9.7
13
.8
11
.1
13
.0
9.9
12
.8
13
.6
15
.3
16
.3
16
.6 14
.3 12
.5
12
.8
14
.2 11
.9
12
.7
12
.4
(%)
20
14
20
13
20
12
20
11
20
10
20
09
20
08
20
07
20
06
20
05
20
04
20
03
20
02
20
01
20
00
20
16
20
15
13
.22
01
7
Employment costs : fee income
55
.0
54
.0
57
.0
58
.0
61
.0
60
.0
59
.0
60
.0
60
.0
59
.3
59
.8
62
.3
62
.3
61
.2
62
.0
61
.7
62
.2
(%)
40
65
55
45
50
60
20
14
20
13
20
12
20
11
20
10
20
09
20
08
20
07
20
06
20
05
20
04
20
03
20
02
20
01
20
00
20
16
20
15
61
.92
01
7

© Kingston Smith LLP is registered to carry on audit work and regulated for a range of investment business activities by the Institute of Chartered Accountants in England and Wales. Any opinions, views or comments contained in this document are intended for those clients and contacts of Kingston Smith LLP and associated companies to whom it has been distributed. No responsibility for loss occasioned by any person acting or refraining from action as a result of the material in this newsletter can be accepted by the firm. The investments or services mentioned in this document may not be suitable for all recipients or be appropriate for their personal circumstances. The information in this document is believed to be correct but cannot be guaranteed. Opinions or comments expressed constitute our judgement as of this date and are subject to change without warning. This document is not intended as an offer or solicitation to buy or sell any investment nor is it to be construed as a personal recommendation. Past performance is not necessarily indicative of future performance. If you do not wish to receive this publication or any other information in future, please e-mail us at [email protected].
If you would like to discuss any of the matters arising in this edition or how we can help you, please contact one of the Kingston Smith partners by email or on 020 7304 4646.
Kingston Smith Charlotte Building17 Gresse StreetLondonW1T 1QLT 020 7304 4646
Amanda Merron, Partner [email protected]
Esther Carder, Partner [email protected]
Graham Tyler, Partner [email protected]
Ian Graham, Partner [email protected]
Nicola Horton, Principal [email protected]
Peter Smithson, Partner [email protected]
Val Cazalet, Partner [email protected]
Contact us
Our corporate finance team is proud to have advised on the following media transactions in 2017:
Kingston Smith’s 2017 M&A Highlights
More information about Kingston Smith and our services to the media sector can be found at: www.kingstonsmith.co.uk/media
Management Consulting
Sale of Credo to Teneo
Transaction Tax
Media
Sale of MJ Media to Once Upon A Time
Lead Adviser & Transaction Tax
Leisure
AIM re-admission
Reporting Accountants
About Kingston Smith
Kingston Smith LLP is one of the UK’s Top 20 audit and advisory firms, and has been helping clients build their businesses for more than 90 years. We are a founding member of the international network Morison KSi, which allows us to offer our clients the strength and experience of 375 partner offices all around the world to support them globally.
Kingston Smith’s West End office, with its team of six partners and 80 staff, specialises in advising media businesses. As a multidisciplinary practice we are able to provide a full range of audit, tax, outsourcing and corporate finance services, as well as legal and business advisory services. Such specialist areas of advice include
employee incentive schemes, benchmarking, succession planning, exit planning, business valuations, profit improvement reviews, business plans, preparing for sale, pre sale tax planning, mergers and acquisitions.
Our clients are spread across the media sector, covering all the key disciplines within marketing services, TV and commercial production, theatre, media technology, publishing, consulting and music.
Our services have been developed to advise growing, successful businesses at every stage of their growth, with our clients ranging from start ups and sizeable independents through to multinationals and AIM listed groups.
International expansion is of increasing significance to our clients growth plans. At Kingston Smith, we support our clients as they move into new markets, providing commercial and timely advice throughout the transition and using our Morison KSi network to assist them locally. As part of our international focus, we are also commercial partners of the Creative Industries Council www.thecreativeindustries.co.uk, which works with the UK government to put creative businesses at the heart of the UK’s productivity and growth agenda.
For more information on Kingston Smith’s services to the media sector, visit www.kingstonsmith.co.uk