digestibility of starch fractions in wholegrain rolled oats
TRANSCRIPT

lable at ScienceDirect
Journal of Cereal Science 50 (2009) 61–66
Contents lists avai
Journal of Cereal Science
journal homepage: www.elsevier .com/locate/ jcs
Digestibility of starch fractions in wholegrain rolled oats
Suman Mishra*, John A. MonroNew Zealand Institute for Crop & Food Research Limited, Private Bag 11600, Palmerston North, New Zealand
a r t i c l e i n f o
Article history:Received 24 November 2008Received in revised form3 March 2009Accepted 6 March 2009
Keywords:Glycemic impactStarchOatsDigestibility
* Corresponding author. Tel.: þ64 6 356 8300; fax:E-mail address: [email protected] (S. Mishra).
0733-5210/$ – see front matter � 2009 Elsevier Ltd.doi:10.1016/j.jcs.2009.03.002
a b s t r a c t
A practical in vitro method was tested for measuring differences in rapidly digested starch (RDSmeasured at 20 min), slowly digested starch (SDS between 20 and 120 min) and inaccessible digestiblestarch (IDS as carbohydrate digested after homogenising at 120 min to release inaccessible starch anddigesting for a further 40 min) in wholegrain cereal samples retaining some grain structure, using in vitropancreatic digestion after a ‘‘gastric’’ pepsin–HCl pre-treatment. The persistence of digestive capacity, theinfluence of homogenising on digestive capacity, and the benefit of adding supplementary amyloglu-cosidase after 120 min digestion were tested as effects on capacity to digest a further 2.5 g portion offinely ground wholegrain added to selected 120 min digests. The results showed that sufficient digestivecapacity remained to digest the IDS released by homogenising the wholegrains after 120 min priordigestion. The method measured all fractions with good precision (CV < 6%), and was shown to becapable of measuring a wide degree of variation in starch fractions of differing digestibility in rolled oatsfrom an oat breeding population, so may be useful in detecting the effects of variations in grain structurethat influence the glycemic impact of wholegrain products.
� 2009 Elsevier Ltd. All rights reserved.
1. Introduction
There is growing evidence that acute post-prandial elevation ofblood glucose concentrations in response to consuming glycemiccarbohydrate directly damages the body (Guigliano et al., 2008),and it has been implicated in many of the diverse and diffusemedical complications associated with obesity, the metabolicsyndrome and diabetes (Brownlee, 2001), all of which are markedby glucose intolerance (Seidell, 2000). Consequently, there isa search for new cereal variants that exhibit low glycemic impact asa trait that survives in products derived from them, and which maybe used as a foundation for new foods and cultivars.
In order to identify variations in the glycemic impact ina breeding population of oat lines, as in this study, it is necessary touse a method that can economically analyse large numbers ofsamples, can measure starch fractions whose susceptibility todigestion depends on the interaction of grain structure and foodprocessing, and which avoids the enormous variability of in vivomeasurements (Wolever et al., 2003). Our current method for the invitro determination of glycemic impact (Mishra et al., 2008) can beeasily extended for such a purpose by including a measurement ofinaccessible, but otherwise digestible starch, so it becomes
þ64 6 351 7050.
All rights reserved.
a method that is highly relevant for analysing ‘‘whole’’ grains inwhich the concept of wholeness includes a degree of intactness.
It is well established that the most important factor determiningthe glycemic impact of starch is its rate of digestion, because thisdetermines the rate at which free glucose and maltose are releasedinto the gut for absorption (Jenkins et al., 1982), and there area number of in vitro digestion methods that measure rapidlydigested starch as a predictor of the glycemic impact of foods(Woolnough et al., 2008). Rapidly digested starch (RDS), defined asstarch digested during the first 20 min of in vitro digestion, hasbeen shown to significantly predict glycemic response to cerealfoods (Englyst et al., 1999; Germaine et al., 2008), and it closelymatches a 20 min post-prandial period, after a 10 min lag, duringwhich glycemic loading exceeds blood glucose disposal to cause anacute net increase in blood glucose concentrations – the glycemicresponse. Starch that is not RDS has been classified as slowlydigested starch (SDS) and resistant starch (RS), and both are ofnutritional importance. SDS is measured as starch digestedbetween 20 and 120 min of in vitro digestion (Englyst et al., 1992;Mishra et al., 2008). It provides carbohydrate energy, but at a slowerrate than RDS, so it exceeds the glucose disposal capacity of thebody less than RDS, and therefore evokes a lower blood glucoseresponse. The starch that remains undigested in the small intestinehas been termed resistant starch (RS) because it has resisteddigestion. RS passes into the colon where it is considered to bebeneficial, acting as a prebiotic by promoting the growth of

S. Mishra, J.A. Monro / Journal of Cereal Science 50 (2009) 61–6662
beneficial bacteria, such as Lactobacillus and Bifidobacterium(Brown and Tuohy, 2006; Topping et al., 2003).
In whole grains, such as rolled oats, food structure may bea significant impediment to digestive enzyme penetration into foodparticles, so that a substantial proportion of starch that is notintrinsically indigestible is slowly digested, or remains intact afterprolonged digestion. Starch that is resistant to digestion throughencapsulation in plant structure has been termed type 1 RS (RS1)(Sajilata et al., 2006). It is called inaccessible digestible starch (IDS)here, firstly because RS1 is not resistant starch at all, but isdigestible starch that has not been digested in vitro because of foodstructure and limited digestion time. Secondly it is called IDS alsobecause this study was not concerned with trying to exactlyreplicate the oral–colonic sequence of events, including chewing orspecific in vitro procedure that defines RS1 (Englyst et al., 1992), butmeasured the effect of the constraints of food structure in a set ofsamples that had been subjected to a standardised set of processingconditions, including a crushing (rolling) step. The sum of RDS, SDS,and IDS thus represented the total potentially digestible starch inthe samples and the distribution of the total between the fractionswas an indicator of the effects of residual food structure.
In this paper we test the suitability of an in vitro method thatuses timed sampling for analysis of starch digestibility in rolled oatsas their content of RDS, SDS, and the amount of inaccessibledigestible starch (IDS) that remains undigested because of grainstructure. The method has more general applicability in the anal-ysis of whole grains, for which structure is an important element intheir health benefits.
2. Materials and methods
2.1. Samples
Samples used in methods development were Harraways Tradi-tional Wholegrain Oats (Harraways and Sons Ltd., Dunedin, NewZealand). Rolled oats from the Crop and Food Research oat breedingprogramme were prepared in a laboratory scale-down of thecommercial process which involved steaming the oats for 45 min,baking at 80 � C with constant rotation, cooling, rolling and finallypackaging. For measuring sample recovery, a mixture consisting of2 g pre-gelatinised starch (BO11C pre-gelatinised starch, PenfordNew Zealand Ltd.), 0.25 g pre-dialysed pectin and 0.25 g celluloseper 2.5 g of sample was used.
2.2. Reagents
All reagents used were of standard laboratory quality. Amylo-glucosidase (AGMase) from A. niger (Megazyme, E-AMGDF;3260 U/mL) was used undiluted from the bottle. One unit ofAGMase releases 1 mM (0.180 mg) glucose from starch per minuteat pH 4.5, 55 � C. In 40 min, 0.1 mL AGMase will release0.1 mL � (3260 � 0.180) mg/mL per min � 40 min ¼ 2347 mgglucose.
Pancreatin was from porcine pancreas (Sigma, P7545; 8 � USPspecifications) and pepsin from porcine stomach mucosa (Sigma, P7000; 800–2500 U/mL).
2.3. Hydration of rolled oats
Samples of whole rolled oats (Uncle Toby’s and Harraways) wereweighed into pre-weighed test tubes, enough water added tocompletely immerse the grains, and the grains left to steep for 5, 10,30, 120 min and overnight. Unabsorbed water was aspirated fromthe tubes, and the tubes plus steeped grains reweighed. Waterabsorption was measured as grams of water content per gram of
oats soaked compared with an unsoaked control. All themeasurements were carried out in duplicate.
2.4. Adaptation of in vitro digestion method for glycemic analysis ofrolled oats
The in vitro analysis of rolled oats was based on an extension ofthe in vitro method for determining RDS and SDS (Mishra et al.,2008). RDS is determined as glycemic carbohydrate released after20 min digestion and RDS þ SDS after 120 min digestion. Themodified method involves homogenising the digesta after 120 mindigestion, and subsequently extending the digestion by 40 min toallow starch released by homogenisation, IDS, to be measured asthe increase in carbohydrate release between 120 and 160 min. Thefree sugars present in the digesta at 160 min represent the totalpotentially available starch (TPAS).
2.5. Testing the capacity of the in vitro method to digest IDS and TPAS
Before applying the in vitro method to the screening of rolledoats it was necessary to check the capacity of the digestion systemto digest starch released by homogenising at 120 min. The extent towhich homogenising destroys amylase activity, and the require-ment for additional AGMase after homogenising needed to beascertained. The digestion needed, in theory, the capacity to digesta sample that consisted entirely of IDS. Therefore an experimentwas conducted to answer the following questions:
(1) Is the capacity to digest IDS adequate?(2) How intact is enzyme activity after 120 min digestion?(3) Does homogenising reduce enzyme activity?(4) Does AGMase augment digestion if added after homogenising?(5) If so, how much AGMase should be added?
The experimental design to answer these questions is sum-marised in Table 1.
2.6. Final protocol for in vitro digestion of rolled oats
Oat samples (2.5 g) were digested in 70 mL specimen potsinserted to their full depth in a 15-place aluminium heating block,covered with a single insulating sheet, and placed on a 15-placemagnetic stirrer. The digestion consisted of a simulated gastricdigestion followed by an ileal digestion, with timed samplingduring the ileal phase. Thirty millilitres of water and 0.8 mL of 1 MHCl were added to the sample to attain pH 2.5 (�0.2), with pHadjustment if necessary. One millilitre of 10% pepsin dissolved in0.05 M HCl was added, and the mixture stirred slowly (130 rpm) for15 s every 15 s for 30 min at 37 �C to accomplish gastric digestion.The small intestinal phase was initiated by neutralising the gastricHCl with 2 mL of 1 M NaHCO3 and 5 mL of 0.1 M Na maleate bufferpH 6/0.2% Na azide/1 mM CaCl2. Starch digestion was started byadding, in quick succession, 0.1 mL AGMase (Megazyme E-AMGDF)and 5 mL of 2.5% pancreatin (Sigma P-7545) in maleate buffer(0.1 M, pH 6/0.2% Na azide/1 mM CaCl), and the pots were imme-diately filled to the 55 mL mark with distilled water. Digestaaliquots of 1.0 mL were removed before adding the AGMase–pancreatin (T ¼ 0) and at 20 and 120 min from the start of amy-lolysis, and were each added to 4 mL absolute ethanol in a tube andimmediately mixed thoroughly. After at least 30 min, the tubeswere centrifuged for 10 min at 1000 � g at 20 � C (centrifugeOmnifuge 2.0 RS Heraeus Sepatech) to clarify the supernatant priorto analysis of sugars released during digestion. Duplicate sampleswere digested. Starch measured in the 20 min supernatant was RDSand starch measured at 120 min was RDS þ SDS.

Table 1Experimental design for testing parameters of in vitro digestive analysis modified fordetermination of accessible and inaccessible digestible starch fractions in rolledoats.
Treatment Homogeniseprior to 120min initialdigestion
Prior 120 mindigestion
Homogeniseat 120 min
Add finesample (2.5 g)
Add AMGase(0.1 mL)
Ha þ þ � �1 � þ � � �2 � þ � þ �3 � þ � þ þ4 � þ þ � �5 � þ þ þ �6 � þ þ þ þ7 � þ þ þ þ(0.2 mL)*R � þ þ � �
Samples 1–7, 120 min pancreatic digestion of 2.5 g of wholegrain oats, not homo-genised. 1, Unhomogenised baseline, no additional oatmeal at 120 min – structuraleffects at 120 min digestion (1 minus H). 2, Activity of digesta after 120 min againstadditional starch added at 120 min (2 minus 1). 3, Activity of 120 min digesta sup-plemented with AGMase against additional starch added at 120 min: activity overbaseline (3 minus 1), effect of AGMase supplement (3 minus 2). 4, Inclusion of IDS byhomogenising at 120 min (4 minus 1). 5, Effect of homogenising on capacity todigest additional substrate added at 120 min (5 minus 2). 6, Effect of adding addi-tional AGMase (0.1 mL) after homogenising at 120 h (6 minus 5). 7, Effect of addingadditional AGMase (0.2 mL) after homogenising at 120 h (7 minus 6). R, recovery ofstarch tested using 2 g pre-gelatinised starch in 2.5 g sample, that is, 800 mg starchper gram sample.
a H, homogenised control – tissue disrupted prior to digestion, no structuraleffects.
700
800
H 14 R
S. Mishra, J.A. Monro / Journal of Cereal Science 50 (2009) 61–66 63
2.7. Inaccessible digestible starch (IDS) measurement
IDS was defined as digestible starch released by tissue disruptionat 120 min digestion. The digesta after 120 min digestion washomogenised using an Omni GLH-220 homogeniser, firstly witha 20� 195 mm saw tooth probe (setting 3, 15 s), followed bya 7 � 195 mm flat bottom probe (setting 3, 15 s), to release inacces-sible starch. Additional AGMase (0.1 mL) was added and the incuba-tion continued for 40 min, at the end of which a 1-mL aliquot wasremoved during vigorous stirring to a tube containing 4 mL ethanol,and the tube mixed. After at least 30 min the tubewas centrifuged andan aliquot of the ethanolic supernatant was removed for measure-ment of RDS þ SDSþ IDS. IDS was calculated as total starch digestedat 160 min after homogenising (RDSþ SDSþ IDS) minus starchdigested after 120 min (RDSþ SDS).
0
100
200
300
400
500
600
0 20 40 60 80 100 120 140 160 180Time (min)
Starch
d
ig
ested
(m
g/g
sam
ple)
SD
Sample 4 homogenised
Sample H homogenised
Fig. 1. Digestion of starch (mg/g original sample) in wholegrain rolled oats with andwithout homogenisation. H, homogenised prior to pancreatic digestion; 1, nothomogenised; 4, homogenised after 120 min pancreatic digestion; R, sample con-taining 80% pre-gelatinised starch. Sample codes are in Table 1.
2.8. Measuring sugars released during digestion
Sugars released during digestion were measured as mono-saccharides by a small-scale modification of the dinitrosalicylicacid colourimetric method (Englyst and Hudson, 1987) after anAGMase secondary digestion to complete depolymerisation ofstarch fragments to monosaccharides; a 0.05-mL aliquot of etha-nolic sample from the in vitro digestion above, or glucose standard(1 mg/mL glucose), was added to 0.25 mL of 1% AGMase (Mega-zyme E-AMGDF) þ 1% invertase concentrate (BDH 390203D) inacetate buffer pH 5.2 and incubated at 37 �C for 10 min. Reducingsugars were then measured by adding 0.75 mL DNS mixture(containing a 1:1:5 mixture of 0.5 mg/mL glucose:4 M NaOH:DNSreagent) and heating for 15 min at 95–100 �C. The tubes werecooled, 4.0 mL water added, mixed, and absorbances read at530 nm (Jenway 6100 UV-spectrophotometer). The DNS reagentconsisted of 10 g of 3,5-dinitrosalicylic acid dissolved in 1 L ofsolution containing 300 g Na-K tartarate and 16 g NaOH.
RDS was calculated from reducing sugar measured in the 20 minaliquot of digesta after the secondary digestion and SDS from
(RDS þ SDS), similarly measured in the digesta after 120 min, bysubtracting RDS. Inaccessible digestible starch (IDS) was measuredas the difference between RDS þ SDS and total digestible starch.Total digestible starch was measured as glucose � 0.9 in a samplethat had been homogenised prior to the start of pancreatic diges-tion (sample H, Table 1).
2.9. Statistical analysis
All data manipulations and statistical analyses were conductedin a Microsoft Excel spreadsheet (2006).
3. Results
3.1. Hydration of rolled oats
Hydration of the two rolled oat samples measured was rapid. Inboth samples about 85% hydration had occurred within 30 min ofsoaking (figure not shown). Since the duration of gastric digestionwas 30 min, the gastric digestion phase was also used as thehydration period.
3.2. Relative rates of digestion
The starch in the reference sample (R), which consisted of 2 gpre-gelatinised starch and 0.5 g dietary fibre, was almostcompletely digested at 40 min (Fig. 1). The plateau of almostcomplete digestion of the pre-gelatinised starch would have beenreached between 20 and 40 min digestion. All of the digestioncurves were similarly non-linear, with slopes decreasing with timebeyond the first measurement point at 20 min. Therefore, digestionat 20 min appears to provide an appropriate relative measure ofthe amount of rapidly digestible, accessible starch in a sample, theRDS value.

0
100
200
300
400
500
600
700
800A
0 20 40 60 80 100 120 140 160 180Time (min)
Starch
d
ig
ested
(m
g/g
sam
ple)
SD
123
HO
S. Mishra, J.A. Monro / Journal of Cereal Science 50 (2009) 61–6664
3.3. Retardation of starch digestion by oat kernel structure
Grain structure remaining in the wholegrain rolled oats greatlydepressed the rate and extent of starch digestion (Fig.1). Sample H washomogenised after gastric digestion, before adding pancreatin, so thestructural impediments to amylase digestion of starch had beenremoved, and it had by far the greatest rate of digestion of the oatsamples (Fig. 1). Sample 1, which had not been homogenised, wasdigested at about half the rate of sample H. After 120 min digestion, theunhomogenised sample had digested only 53% of the starch digestedfrom sample H in the same time (336.9 vs 624.7 mg/g sample) (Table 2).Furthermore, when an intact sample was finely dispersed by homog-enising after 120 min digestion, most of the inaccessible starch becamedigestible within 20–40 min (sample 4, Fig. 1).
The pre-homogenised oat sample (sample H) gave the oatdigestion curve that was most similar to that of the pre-extractedgelatinised starch (sample R), the digestion of which was notsubject to any physical constraints, suggesting that the homoge-nisation step was effective in removing inhibition of starch diges-tion by grain structure in the oats.
B
2.5 g oatmealinto 2, 3, and O
200
300
400
500
600
700
800
900
Starch
d
ig
ested
(m
g/g
sam
ple)
Additional portion of ground
456
71
3.4. Digestive activity remaining after 120 min digestion
Assuming that there was no IDS in the finely ground substrateadded at 120 min, the digestive capacity could be assessed, withoutthe influence of homogenisation on the enzymes, by subtractingRDS þ SDS (120 min) for unhomogenised sample 1 from totaldigested starch at 160 min (TDS160) for the unhomogenisedsamples to which 2.5 g finely ground oatmeal had been added at120 min without additional enzyme (sample 2) (Fig. 2A). Theresults show that there was sufficient activity remaining for thetotal amount of starch digested at 160 min (699.2; sample 2) to begreater than the total of the potentially digestible starch present ina single 2.5 g oat sample, which is given by the maximum (plateau)value of sample H (652.7) (Table 2 and Fig. 2A). This showed thatthe capacity to digest a 2.5 g sample was more than adequate. Anadditional 0.1 mL of amyloglucosidase at 120 min (sample 3) didnot greatly increase sugar release, suggesting that maltase activityto prevent end product inhibition was not necessary.
Table 2Digestive capacity remaining (milligrams sugar per gram original substrate) after120 min prior digestion of whole grain oats: effect of homogenising and amylo-glucosidase addition on digestion of additional substrate added at 120 min.
Sample RDSa SDSb DS120c
(RDS þ SDS)DS160d DS(160
� 120)e
Mean Range Mean Range Mean Range Mean Range Mean Range
H 312.6 20 312.1 36 624.7 16 652.7 14 28 21 142.5 16 194.4 13 336.9 28 380 27 43.1 22f 147.9 1 203.7 19 351.6 18 699.2 14 347.7 43f 150.4 4 204.3 27 354.7 23 759.9 16 405.2 394 167.3 3 211.7 22 356 19 590 5 234 255f 143.9 11 210 3 353.9 14 774 17 420.1 316f 159.1 4 211 26 370.1 30 799.5 5 429.4 257f 160.3 21 201.6 0 361.9 20 809.9 18 448 2R 480.9 15 213.8 31 694.7 16 707.5 9 12.8 25
Duplicate analyses. Sample details are given in Table 1.a RDS, sugars released after20 min digestion, RDS values show relative glycemic
impact as glycemic glucose equivalents per gram sample.b SDS, sugars released between 20 and 120 min digestion (DS120 � RDS).c DS120, digested starch after 120 min digestion (¼RDS þ SDS).d DS160, digested starch after 160 min digestion.e DS(160 � 120), sugars released between 120 and 160 min digestion.
DS(160 � 120) ¼ IDS when sample has been homogenised at 120 min (treatments 4and R).
f Finely ground oatmeal (2.5 g) added at 120 min; values for TPDS, IDS and RS3 forsamples 2, 3, 5, 6, 7 expressed per 2 g total substrate added.
0
100
0 20 40 60 80 100 120 140 160 180 200Time (min)
SD
oatmeal added to 5, 6 and 7
Fig. 2. Digestive capacity of enzyme (mg/g original sample). (A) Pancreatin (after120 min digestion). Additional 2.5 g finely ground oatmeal added at 120 min tosamples 2 and 3 (both not homogenised). Sample 1 is an unhomogenised controlwithout additional substrate. Sample H is the control sample homogenised beforedigesting (at T ¼ 0). Sample O shows glucose released when 2.5 g oatmeal was addedat 120 min to unhomogenised enzyme plus reagent incubated from T ¼ 0. All samplesexcept H not homogenised. Amyloglucosidase (0.1 mL) was added to sample 3 at120 min. (B) Amyloglucosidae (against finely ground oatmeal portion (2.5 g) addedafter homogenising at 120 min). 1, unhomogenised control, no additional oatmeal;4, homogenised, no additional oatmeal; 5, 6, 7, homogenised, additional oatmeal; 5, noadditional amyloglucosidase; 6, þ0.1 mL amyloglucosidase at 120 min; 7, þ0.2 mLamyloglucosidase at 120 min.
The amounts of digestion of the finely ground oatmeal samplesadded to digesta at 120 min (samples 2 and 3) or to the enzymeblank (sample O) were similar at 40 min after adding (i.e. atT ¼ 160 min), but slightly less than in the homogenised sample at40 min from the start (T ¼ 0), of digestion, which shows that thedigestive capacity had been largely maintained.

Table 3Precision of measurement of fractions RDS, RDS þ SDS, and SDS based on seven pairsof replicates in samples 1–7.
RDS RDS þ SDS SDS
Average of replicate means 153.1 358.3 205.2Average SD of replicates 9.3 15.4 11.1Average CV of replicates 3.9 4.3 5.4
S. Mishra, J.A. Monro / Journal of Cereal Science 50 (2009) 61–66 65
3.5. Effect of AMGase added at 120 min on digestion of extra substrate
The effect of adding AGMase at 120 min digestion was exam-ined for an unhomogenised sample (sample 3) and for homoge-nised samples (samples 6 and 7). All of these samples (3, 6, and 7)had an additional 2.5 g portion of finely ground oatmeal added at120 min (Table 1). An increase in digestive capacity as a result ofadding AMGase at 120 min would be detected as an increase inTDS160 minus (RDS þ SDS) for unhomogenised sample 2 (noAMGase) vs 3 (0.1 mL AMGase added), or for homogenisedsamples 5 (no AMGase) vs 6 (0.1 mL AMGase) and 7 (0.2 mLAMGase). The TDS160 � (RDS þ SDS) values for all samples areshown in Table 2, and the effects of AMGase addition on starchdigestion can be seen for samples 2 and 3 in Fig. 2A, and forsamples 5, 6 and 7 in Fig. 2B. The results for both sets of samplessuggest that adding AMGase may slightly accelerate starchdigestion, but the effect is small.
3.6. Effect of homogenising on in vitro digestive capacity
The effects of homogenising can be determined by comparingthe TDS160 values for samples 5 (homogenised) and 2 (nothomogenised), both of which had had 2.5 g of additional substrateadded at 120 min. Assuming that TDS160 for sample 1 providesa baseline value for sample 2 (unhomogenised and no additionaloatmeal) and that the TDS160 value for sample 4 (homogenised andno additional oatmeal) gives a baseline value for sample 5, the post-homogenising increase in starch digestion for sample 2 was304.6 mg (347.7 �43.1 mg) and for sample 5 was 186 mg(420.1 � 234 mg) (Table 2). These results suggest that homogenis-ing reduced the digestive capacity remaining at 120 min. However,the results (Fig. 2A,B) also show that there was more than enoughcapacity to digest the IDS released when a sample digested to120 min was homogenised and no additional oatmeal added at120 min.
Incubation of enzyme alone (sample H in Fig. 2A) for 120 min ina blank digestion did not reduce the rate at which it digested starchfrom 2.5 g oatmeal added at 120 min compared with homogenisedsample added to enzyme at T ¼ 0 (sample O in Fig. 2A).
3.7. Precision of measurement
As samples 1–7, all duplicated, had been subjected to the samedigestion up to 120 min, the values for RDS, RDS þ SDS, and SDS forsamples 1–7 allow the precision of the digestion method fordetermining RDS and SDS to be tested. The precision of the methodwas very good with coefficients of variation (CV) of about 6% or less(Table 3).
3.8. Recovery of pre-gelatinised starch as digestible starch
A 2.5 g portion of sample R was used for measuring starchrecovery. As the 2.5 g sample R contained 2.0 g of starch (and 0.5 gnon-starch polysaccharide), when the results are expressed ona per gram basis, as in Table 2, a 100% recovery of starch would berepresented by 800 mg. For sample R starch digestion at 160 minwas 707.5 mg/g sample, which is a recovery of 707.5 � 100/800 ¼ 88% as digestible starch. This recovery value does not includeany starch that remained undigested at 160 min, which may haveincluded type 3 amylase-resistant starch (retrograded), and doesnot include an adjustment for moisture due to equilibration withthe atmosphere.
3.9. Application of the method to a population of oats
The method was applied to determine the genetic variation instarch fractions in rolled oats from a breeding population of oats,and it showed substantial differences between the oat lines in eachof the starch fractions (Fig. 3). The variation in total starch was lessthan the variation in the individual fractions (mean 611 mg/g, SD30.4, range 536–691). Details of the results and their implicationswill be discussed in a later paper, but in the present paper they arepresented briefly to show that the method was able to detect thevariation sought.
4. Discussion
The method described in this paper allows the measurement ofdiscrete carbohydrate fractions that have been discriminatedbetween on the basis of susceptibility to amylase digestion and theinfluence of food structure. The durations of digestion defining RDS,SDS and IDS were based on the need to detect differences inwholegrain cereals that would be of nutritional importance, witha method that is practical enough to screen large numbers ofsamples, and which may indicate structural resilience as a trait.Thus RDS is a measure of readily accessible starch that is almostimmediately digested and available, and which has been shown topredict the glycemic response to cereal foods (Englyst et al., 1999).SDS is starch that is released at a relatively slow rate, so although itprovides carbohydrate energy (17 kJ/g), it is not highly glycemic foran individual without glucose intolerance.
The results (Fig. 1) confirmed that 20 min from initiation ofpancreatic digestion is a suitable time point at which tomeasure RDS, because the readily digestible and totally acces-sible starch in starch reference sample R was almost completelydigested between 20 and 40 min, and digestion rate wasdecreasing in all samples after 20 min. Furthermore, parallelresearch has shown that peak blood glucose responses to one,two, or three 50 g muesli bars containing rolled oats, alloccurred between 30 and 40 min after consuming the bars,with a 10 min lag and with the greatest positive slope in theblood glucose response curve (mmol/L per min) occurring atabout 20 min after ingesting the food (Monro et al., unpub-lished). RDS determined from digestion at 20 min thereforeseems appropriate to indicate the relative tendency of foods toproduce an acute glycemic response.
IDS is starch that would be available and provide carbohydrateenergy were it not for the effects of food structure restrictingdigestion. IDS measured after 120 min digestion is complemen-tary to RDS þ SDS, and so the sum of the three fractions iscarbohydrate that is digestible provided that it is accessible todigestive enzymes. By measuring IDS as intrinsically digestiblestarch remaining at 120 min, rather than after exhaustive diges-tion, the method described here is likely to be sensitive togenotypical differences in grain structure that affect rate ofdigestion, and which may be useful in plant breeding. If theRDS þ SDS digestion had been extended far beyond 120 min, as inmany resistant starch analytical methods (Monro, 2004), there
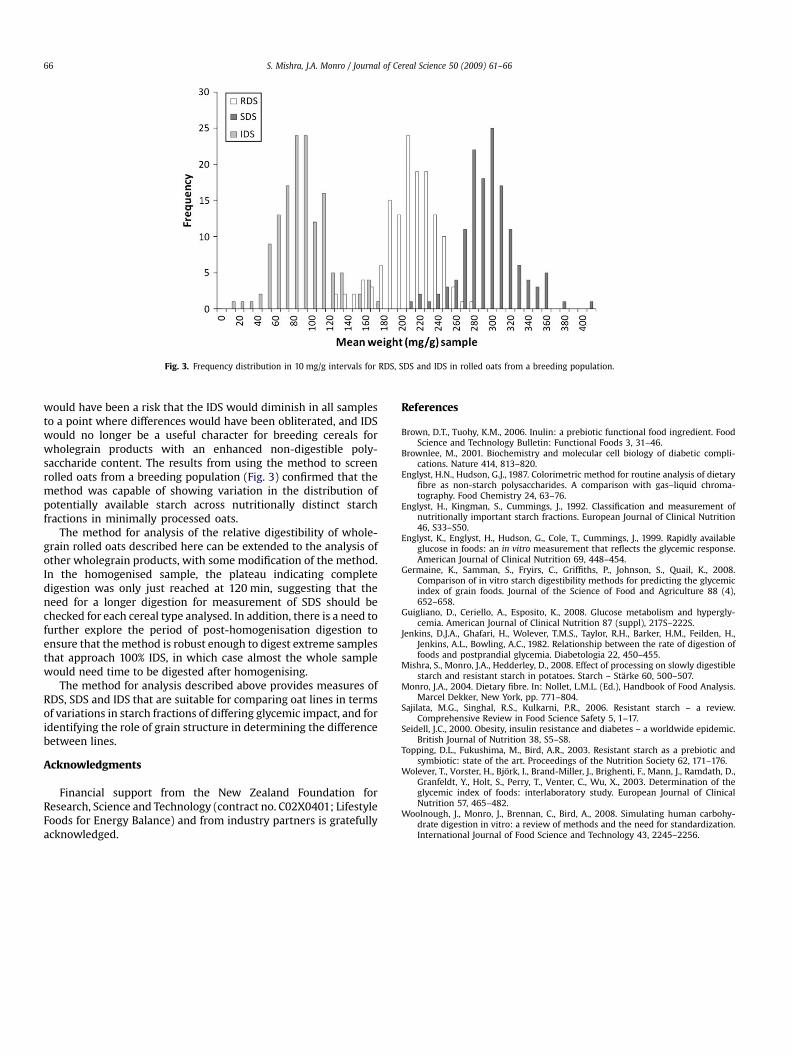
Fig. 3. Frequency distribution in 10 mg/g intervals for RDS, SDS and IDS in rolled oats from a breeding population.
S. Mishra, J.A. Monro / Journal of Cereal Science 50 (2009) 61–6666
would have been a risk that the IDS would diminish in all samplesto a point where differences would have been obliterated, and IDSwould no longer be a useful character for breeding cereals forwholegrain products with an enhanced non-digestible poly-saccharide content. The results from using the method to screenrolled oats from a breeding population (Fig. 3) confirmed that themethod was capable of showing variation in the distribution ofpotentially available starch across nutritionally distinct starchfractions in minimally processed oats.
The method for analysis of the relative digestibility of whole-grain rolled oats described here can be extended to the analysis ofother wholegrain products, with some modification of the method.In the homogenised sample, the plateau indicating completedigestion was only just reached at 120 min, suggesting that theneed for a longer digestion for measurement of SDS should bechecked for each cereal type analysed. In addition, there is a need tofurther explore the period of post-homogenisation digestion toensure that the method is robust enough to digest extreme samplesthat approach 100% IDS, in which case almost the whole samplewould need time to be digested after homogenising.
The method for analysis described above provides measures ofRDS, SDS and IDS that are suitable for comparing oat lines in termsof variations in starch fractions of differing glycemic impact, and foridentifying the role of grain structure in determining the differencebetween lines.
Acknowledgments
Financial support from the New Zealand Foundation forResearch, Science and Technology (contract no. C02X0401; LifestyleFoods for Energy Balance) and from industry partners is gratefullyacknowledged.
References
Brown, D.T., Tuohy, K.M., 2006. Inulin: a prebiotic functional food ingredient. FoodScience and Technology Bulletin: Functional Foods 3, 31–46.
Brownlee, M., 2001. Biochemistry and molecular cell biology of diabetic compli-cations. Nature 414, 813–820.
Englyst, H.N., Hudson, G.J., 1987. Colorimetric method for routine analysis of dietaryfibre as non-starch polysaccharides. A comparison with gas–liquid chroma-tography. Food Chemistry 24, 63–76.
Englyst, H., Kingman, S., Cummings, J., 1992. Classification and measurement ofnutritionally important starch fractions. European Journal of Clinical Nutrition46, S33–S50.
Englyst, K., Englyst, H., Hudson, G., Cole, T., Cummings, J., 1999. Rapidly availableglucose in foods: an in vitro measurement that reflects the glycemic response.American Journal of Clinical Nutrition 69, 448–454.
Germaine, K., Samman, S., Fryirs, C., Griffiths, P., Johnson, S., Quail, K., 2008.Comparison of in vitro starch digestibility methods for predicting the glycemicindex of grain foods. Journal of the Science of Food and Agriculture 88 (4),652–658.
Guigliano, D., Ceriello, A., Esposito, K., 2008. Glucose metabolism and hypergly-cemia. American Journal of Clinical Nutrition 87 (suppl), 217S–222S.
Jenkins, D.J.A., Ghafari, H., Wolever, T.M.S., Taylor, R.H., Barker, H.M., Feilden, H.,Jenkins, A.L., Bowling, A.C., 1982. Relationship between the rate of digestion offoods and postprandial glycemia. Diabetologia 22, 450–455.
Mishra, S., Monro, J.A., Hedderley, D., 2008. Effect of processing on slowly digestiblestarch and resistant starch in potatoes. Starch – Starke 60, 500–507.
Monro, J.A., 2004. Dietary fibre. In: Nollet, L.M.L. (Ed.), Handbook of Food Analysis.Marcel Dekker, New York, pp. 771–804.
Sajilata, M.G., Singhal, R.S., Kulkarni, P.R., 2006. Resistant starch – a review.Comprehensive Review in Food Science Safety 5, 1–17.
Seidell, J.C., 2000. Obesity, insulin resistance and diabetes – a worldwide epidemic.British Journal of Nutrition 38, S5–S8.
Topping, D.L., Fukushima, M., Bird, A.R., 2003. Resistant starch as a prebiotic andsymbiotic: state of the art. Proceedings of the Nutrition Society 62, 171–176.
Wolever, T., Vorster, H., Bjork, I., Brand-Miller, J., Brighenti, F., Mann, J., Ramdath, D.,Granfeldt, Y., Holt, S., Perry, T., Venter, C., Wu, X., 2003. Determination of theglycemic index of foods: interlaboratory study. European Journal of ClinicalNutrition 57, 465–482.
Woolnough, J., Monro, J., Brennan, C., Bird, A., 2008. Simulating human carbohy-drate digestion in vitro: a review of methods and the need for standardization.International Journal of Food Science and Technology 43, 2245–2256.