digging into the numbers beth walsh craig reed kristen kuebler may 16, 2011
TRANSCRIPT
Digging Into the Numbers
Beth Walsh
Craig Reed
Kristen Kuebler
May 16, 2011

NOVA

3
NOVA Move Mostly Positive
Household P40-49 P50-64 P65-990.0
0.5
1.0
1.5
2.0
2.5
3.0
1.6
0.7
1.3
2.11.9
0.9
1.5
2.6
2.2
1.2
1.8
2.5
NOVA HH/Demo Ratings
'09-10 '10-11 STD Wed 1Q11
HH/D
emo
AA%
• In the move from Tuesday to Wednesday, NOVA has seen ratings increases in 40-49 and 50-64, and a small decrease in 65+.
Source: Nielsen program ratings report

4
Prior to NOVA move, Tuesday primetime ratings were up for 65+, down for other demos
Tue 8-11 PM Tue 8PM T ue 9PM Tue 10PM Wed 8-11 PM
Wed 8PM Wed 9PM Wed 10PM-15%
-10%
-5%
0%
5%
10%
15%
20%
-3%
6%
-4%
-12%
-4%
-9%
-6%
3%
-5% -5%
-9%
-1%
-8% -9%
-13%
-1%
7%
11%
0%
13%
7%
4%6%
14%
Tues/Wed Year to Year Pre-Move
P40-49P50-64P65-99
% C
hang
e in
ratin
g
• Before NOVA’s move, Tuesday and Wednesday ratings were up, year over year for viewers 65+, but largely down for other key demos.
Source: Nielsen NPower Time Period Report
% Change in rating comparing Oct-Feb 2009-10 to Oct-Jan 11 10-11

5
Tuesday and Wednesday, all demos have benefitted from move
Tue 8-11 PM Tue 8PM T ue 9PM Tue 10PM Wed 8-11 PM
Wed 8PM Wed 9PM Wed 10PM0%
10%
20%
30%
40%
50%
60%
12%
28%
4% 4%
41%
19%
52% 52%
22%
38%
16%
9%
25%
14%
27%
39%
14% 15% 14% 13%
3%0%
7%4%
Tues/Wed Year to Year Post Move
P40-49P50-64P65-99
% C
hang
e in
Rati
ng
% Change in rating comparing Oct-Feb 2009-10 to Jan 19-Feb
23 2011
Source: Nielsen NPower Time Period Report
• Year over year ratings for Tuesday and Wednesday show both days benefited, particularly 40-49 and 50-64, with no loss among 65+
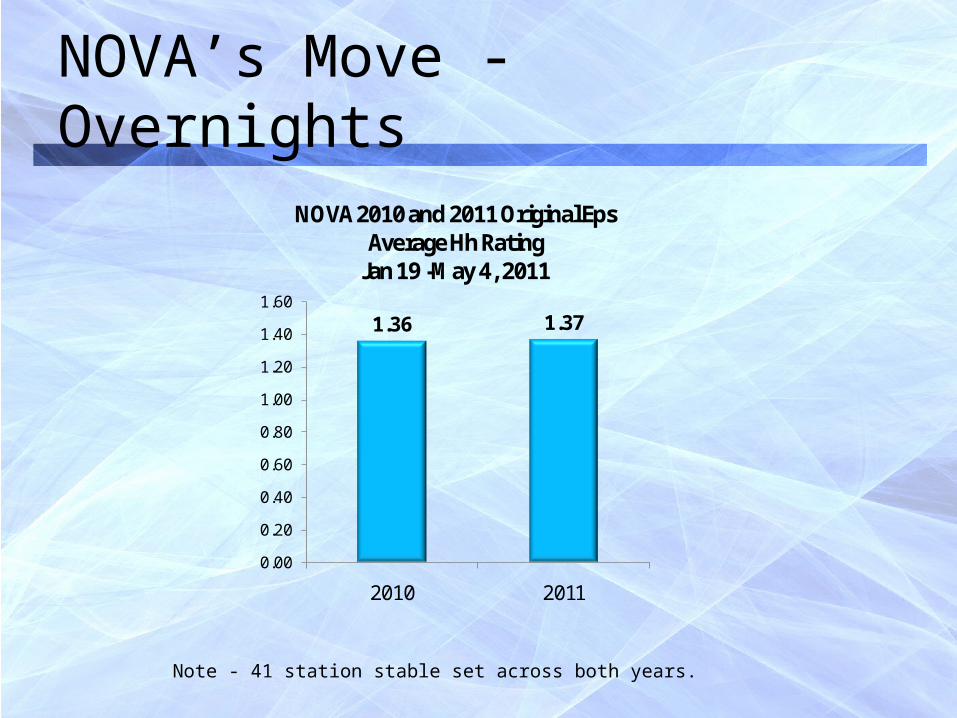
NOVA’s Move - Overnights
Note - 41 station stable set across both years.
1.36 1.37
0.00
0.20
0.40
0.60
0.80
1.00
1.20
1.40
1.60
2010 2011
NOVA 2010 and 2011 Original Eps Average Hh Rating
Jan 19 -May 4, 2011

NOVA performed the same as ‘10
January 19 - May 5, 2010 January 18 - May 4, 2011Hh Rtg Hh Rtg Diff
3703 The Sphinx 1.9 3810 Japan's Quake 2.4 0.53704 Machu Picchu 1.8 3805 Stuff: Smarter 1.5 -0.33702 Pharaoh's Ship 1.5 3804 Stuff: Cleaner 1.4 -0.13708 Edge-Space pt1 1.3 3803 Stuff: Smaller 1.3 0.03705 Cave Diving 1.3 3802 Stuff: Stronger 1.3 0.03709 Edge-Space pt2 1.2 3808 Venom 1.3 0.03706 Pluto Files 1.2 3806 Smart Machine 1.2 0.03710 Mt St Helens Back 1.1 3807 Flight 447 1.1 0.03707 Mind Over Money 0.9 3809 Power Surge 1.0 0.1
Average 1.4 Average 1.4 0.0

But together the nights are up
Note - 41 station stable set across both years.
0.951.08
0.00
0.20
0.40
0.60
0.80
1.00
1.20
1.40
2010 2011
Tuesday and Wednesday Average Hh Rating
Jan 19 -May 4, 2011

2011 Had More Popular Titles
Hh Rating
Hours Per Station
Household Ratings by Hours per StationTop Five Carried on Tues & Wed
0.0
0.2
0.4
0.6
0.8
1.0
1.2
1.4
1.6
1.8
2.0
0.0 2.0 4.0 6.0 8.0 10.0 12.0
2010
2011
Nova
Frontline
Civil War
Pioneers & Sci NowFaces of
America
Grt PerfNatl Parks

LA and Orlando…

LA long term trend
Monthly Prime Time GRPs in LA Since April 2006
0
100
200
300
400
500
600
Apr
-06
Aug
-06
Dec
-06
Apr
-07
Aug
-07
Dec
-07
Apr
-08
Aug
-08
Dec
-08
Apr
-09
Aug
-09
Dec
-09
Apr
-10
Aug
-10
Dec
-10
Apr
-11
KCET
KLCS
KOCE
KVCR
Avg Primary Stn

Prime time is up…
109
174
160
89
72
68
28
22
2011
2010KCET
KOCE
KLCS
KVCR
Average Monthly Prime Time GRPs January - April
Note: Total GRPs are 354 in 2010 and 369 in 2011.

Whole Week is not…
Average Monthly Whole Week GRPs January - April
Note: Total GRPs are 1550 in 2010 and 1238 in 2011.
408
860
435
285
279
294
116
111
2011
2010KCET
KOCE
KLCS
KVCR

Weekly reach is a problem
24
1415
18
0
5
10
15
20
25
30
KCET KOCE
2010
2011
Average Whole Week CumesJanuary & February

And then there’s Orlando
Monthly GRPs in Orlando Since April 2006
0
100
200
300
400
500
600
Apr
-06
Aug
-06
Dec
-06
Apr
-07
Aug
-07
Dec
-07
Apr
-08
Aug
-08
Dec
-08
Apr
-09
Aug
-09
Dec
-09
Apr
-10
Aug
-10
Dec
-10
Apr
-11
WBCC
WDSC
WMFE
Avg Primary Stn

Kids Shows

PBS Ranks 3rd among Kids M-F 7a-6p
17
NICK DSNY PBS Nick Jr TOON DXD SPRT NKTNS THE HUB
Kids 2 - 5
3.91614268299904
2.48885688639903
2.23188907490904
1.66496784253506
0.97981848369294
0.30422862668682
0.30029199052737
0.1579035317256
0.10870866566494
Kids 2 - 8
3.15860984706337
2.10774335243852
1.63296196010859
1.08474022352138
1.01086546610291
0.372238313602401
0.19345375964603
0.1822273299688
0.0886456603744805
LOH w/ K<3
1.03259565918755
0.97064714149003
1.03135995543599
0.58598931584417
0.27870925808575
0.0778801959490202
0.14133677052636
0.0351846821301
0.03699939192297
0.30.81.31.82.32.83.33.84.3 M-F 7a-6p AA Ratings by Demo
AA
% R
ating
s
• ‘10-11 Season-to-date, PBS Kids 2-5 daytime rating is a 2.2; Kids 2-8 is a 1.6 • Among Kids 2-5, PBS ranks 3rd, three-tenths of a point behind Disney• PBS tied with Nick and Disney among Ladies of the Household with Kids < 3 years-old (all 1.0)
Source: NTI Nielsen NPower, 2010-2011 Season-to-date Mon-Fri 7a-6p Time Period Live +7 AA Ratings

Nickelodeon Schedule with Half Hour Ratings, Kids 2-8
18
7:00 AM
7:30 AM
8:00 AM
8:30 AM
9:00 AM
9:30 AM
10:00 AM
10:30 AM
11:00 AM
11:30 AM
12:00 PM
12:30 PM
1:00 PM
1:30 PM
2:00 PM
2:30 PM
3:00 PM
3:30 PM
4:00 PM
4:30 PM
5:00 PM
5:30 PM
6:00 PM
6:30 PM
7:00 PM
7:30 PM
0.0
0.5
1.0
1.5
2.0
2.5
3.0
3.5
4.0
4.5
5.0
Feb 2011 Kids 2-8 AA% Ratings M-F 7am-8pm
½ H
our A
A %
Rati
ngs
Sp
on
geB
ob
Sq
uare
Pan
ts
Sp
on
geB
ob
Sq
uare
Pan
ts
Sp
on
geB
ob
Sq
uare
Pan
ts
S
pon
geB
ob
Sq
uare
Pan
ts
D
ora
th
e E
xp
lore
r
Dora
th
e E
xp
lore
r
G
o D
ieg
o,
Go!
Max a
nd
Ru
by
Bu
bb
le G
up
pie
s
Team
Un
izoom
i
Max a
nd
Ru
by
Bu
bb
le G
up
pie
s
D
ora
th
e E
xp
lore
r
Dora
th
e E
xp
lore
r
T
UFF
Pu
pp
y
Pen
gu
ins
of
Mad
ag
asc
ar
Sp
on
geB
ob
Sq
uare
Pan
ts
Sp
on
geB
ob
Sq
uare
Pan
ts
Vic
tori
ou
s
iC
arl
y
S
pon
geB
ob
Sq
uare
Pan
ts
S
pon
geB
ob
Sq
uare
Pan
ts
iC
arl
y
iCarl
y
iC
arl
y
Sp
on
geB
ob
Sq
uare
Pan
ts
• Peaks for Nick occur at 11am with Bubble Guppies and at 6:30 pm in the middle of back-to-back iCarly for Feb 2011
Source: NTI Nielsen Npower, February 2011 ½ Hour Live + 7 AA% Ratings for Kids 2-8, M-F 7am–8pm. Schedule is based on March 28, 2011 online listings.

Nick Jr Schedule with Half Hour Ratings , Kids 2-8
19
7:00 AM
7:30 AM
8:00 AM
8:30 AM
9:00 AM
9:30 AM
10:00 AM
10:30 AM
11:00 AM
11:30 AM
12:00 PM
12:30 PM
1:00 PM
1:30 PM
2:00 PM
2:30 PM
3:00 PM
3:30 PM
4:00 PM
4:30 PM
5:00 PM
5:30 PM
6:00 PM
6:30 PM
7:00 PM
7:30 PM
0.0
0.5
1.0
1.5
2.0
2.5
3.0Feb 2011 Kids 2-8 AA% Ratings M-F 7am-8pm
½ H
our A
A %
Rati
ngs
Litt
le B
ear
Litt
le B
ill
Fr
esh
Beat
Ban
d
Pin
ky D
inky
Doo
Jack
's B
ig M
usi
c S
how
Toot
& P
ud
dle
Fran
klin
Fran
klin
Mis
s S
pid
er'
s S
un
ny P
atc
h F
rien
ds
Mis
s S
pid
er'
s S
un
ny P
atc
h F
rien
ds
Li
ttle
Bear
Lit
tle B
ear
Yo G
ab
ba G
ab
ba
Jack
's B
ig M
usi
c S
how
Oliv
ia
O
livia
L
ittl
e B
ill
Li
ttle
Bill Wow
Wow
Wu
bb
zy
Yo
Gab
ba G
ab
ba
D
ino D
an
Ni H
ao K
ai-
Ian
Won
der
Pets
Fre
sh B
eat
Ban
d
D
ora
Th
e E
xp
lore
r
Go,
Die
go,
Go!
• Peaks for Nick Jr occur later in the day around 7pm with Dora The Explorer and Go, Diego, Go!
Source: NTI Nielsen Npower, February 2011 ½ Hour Live + 7 AA% Ratings for Kids 2-8, M-F 7am–8pm. Schedule is based on March 28, 2011 online listings.

20
Disney Schedule with Half Hour Ratings , Kids 2-8
7:00 AM
7:30 AM
8:00 AM
8:30 AM
9:00 AM
9:30 AM
10:00 AM
10:30 AM
11:00 AM
11:30 AM
12:00 PM
12:30 PM
1:00 PM
1:30 PM
2:00 PM
2:30 PM
3:00 PM
3:30 PM
4:00 PM
4:30 PM
5:00 PM
5:30 PM
6:00 PM
6:30 PM
7:00 PM
7:30 PM
0.0
0.5
1.0
1.5
2.0
2.5
3.0
3.5
4.0
Feb 2011 Kids 2-8 AA% Ratings M-F 7am-8pm
½ H
our A
A %
Rati
ngs
Tin
ga T
ing
a T
ale
s/ T
imm
y T
ime
Han
dy M
an
ny
M
icke
y M
ou
se
Jake
& t
he P
irate
s
Mic
key M
ou
se
Han
dy M
an
ny
B
ab
ar
& B
ad
ou
C
hu
gg
ing
ton
M
icke
y M
ou
se
M
icke
y M
ou
se
Mic
key M
ou
se
Jun
gle
Ju
nct
ion
Sp
eci
al A
gen
t
Im
ag
inati
on
Movers
Su
ite L
ife o
n D
eck
*
G
ood
Luck
Ch
arl
ie*
S
on
ny w
ith
a C
han
ce*
Wiz
ard
s-Pla
ce*
S
hake
It
Up
*
Su
ite L
ife o
n D
eck
*
Fi
sh H
ooks
Fi
sk H
ooks
G
ood
Luck
Ch
arl
ie*
Son
ny w
ith
a C
han
ce*
Wiz
ard
s-Pla
ce*
S
hake
It
Up
*
• The peak for Disney occurs at 8:30am with Jake & The Pirates
Source: NTI Nielsen Npower, February 2011 ½ Hour Live + 7 AA% Ratings for Kids 2-8, M-F 7am–8pm. Schedule is based on March 28, 2011 online listings.
*From 2pm to 8pm, Disney rotates the programs

Kids Block Stronger with Cat
Child 2-5 AA % Jan '10 Feb '10 Mar '10 Apr '10
Jan '11 Feb '11 Mar '11 Apr '11Avg W/S ‘10
Avg W/S ‘11
Cat In The Hat 4.6 5.3 5.1 4.7 -- 4.9Curious George 4.4 5.0 4.8 4.8 4.9 5.7 4.9 5.1 4.8 5.1Dinosaur Train 4.1 4.4 3.7 4.1 4.6 4.5 3.8 4.5 4.1 4.3Sid the Science Kid 2.7 3.2 2.9 3.0 2.9 --Super Why 3.7 4.1 3.4 3.8 4.3 4.8 4.3 4.7 3.8 4.5
Block Average 3.7 4.2 3.7 3.9 4.6 5.1 4.5 4.7 3.9 4.7
+22%
Wild Kratts is averaging 2.1 among kids 4-8, 38% above the average PBS Kids program for kids 4-8, and 30% above the Go! Program average with 4-8’s.
Source: Nielsen NPower national program ratings, January through April each year

New Kids Ratings by Week
0.00
0.10
0.20
0.30
0.40
0.50
0.60
0.70
0.80
0.90
9/2
7
10
/11
10
/25
11/8
11/2
2
12
/6
12
/20
1/3
1/1
7
1/3
1
2/1
4
2/2
8
3/1
4
3/2
8
Avg Program
Cat In Hat
Wild Kratt
Average Household Rating by Week Primary Play, Primary Station

Top 10 M-F Kids Series
% Diff08-09 09-10 10-11 v '09-10
Average Program 0.52 0.49 0.51 4%
Curious George 0.75 0.70 0.76 9%
The Cat in the Hat -- -- 0.69
Super WHY! 0.64 0.64 0.65 1%
Sesame Street 0.62 0.63 0.65 2%
Dinosaur Train -- 0.65 0.64 -3%
Arthur 0.62 0.55 0.60 10%
Martha Speaks 0.59 0.51 0.54 7%
Sid the Sci Kid 0.64 0.60 0.52 -12%
Wild Kratts -- -- 0.50
WordWorld 0.54 0.51 0.49 -3%
Average Household RatingsPrimary Play, M-F Daytime
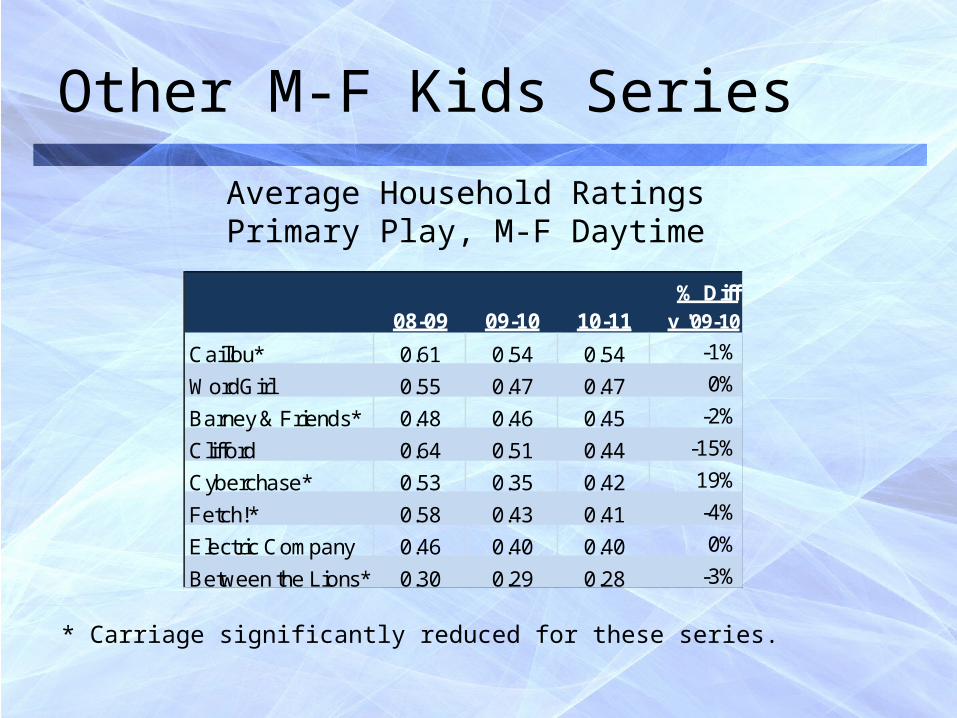
Other M-F Kids Series
Average Household RatingsPrimary Play, M-F Daytime
% Diff08-09 09-10 10-11 v '09-10
Caillou* 0.61 0.54 0.54 -1%
WordGirl 0.55 0.47 0.47 0%
Barney & Friends* 0.48 0.46 0.45 -2%
Clifford 0.64 0.51 0.44 -15%
Cyberchase* 0.53 0.35 0.42 19%
Fetch!* 0.58 0.43 0.41 -4%
Electric Company 0.46 0.40 0.40 0%
Between the Lions* 0.30 0.29 0.28 -3%
* Carriage significantly reduced for these series.

Local programming

Local is not just news
News/ Talk35%
Other Local65%
• For 5-11p M-F & 6a-11p Sa-Su, local is 8.2% of time.
• Contrary to system thinking, only about 1/3rd is news.

Other Local - % Local Time
5%
7%
8%
8%
18%
20%
Sports
Miscellaneous
How-to/Personal Improve
Arts (Art, Comedy, Drama, Music)
Factual (Nature, History, Science)
Local Ambience (Americana, Food, Travel)

2010 Top 10 Series
Rank Title Station Genre Avg HH Rtg Plays
1 Tennessee Crossroads WNPT Travel 3.10 92
2 Donnybrook...Your Turn KETC News 1.98 41
3 Donnybrook KETC News 1.53 88
4 Southwest Yard & Garden KNME How-To 1.44 38
5 Album KTCA News 1.37 2
6 Minnesota: A History of the Land KTCA History 1.36 2
7 Chicago Tonight WTTW News 1.30 289
8 Check, Please! WTTW Food 1.15 149
9 Making of Milwaukee WMVT History 1.00 9
10 Memphis Memoirs WKNO History 0.95 6
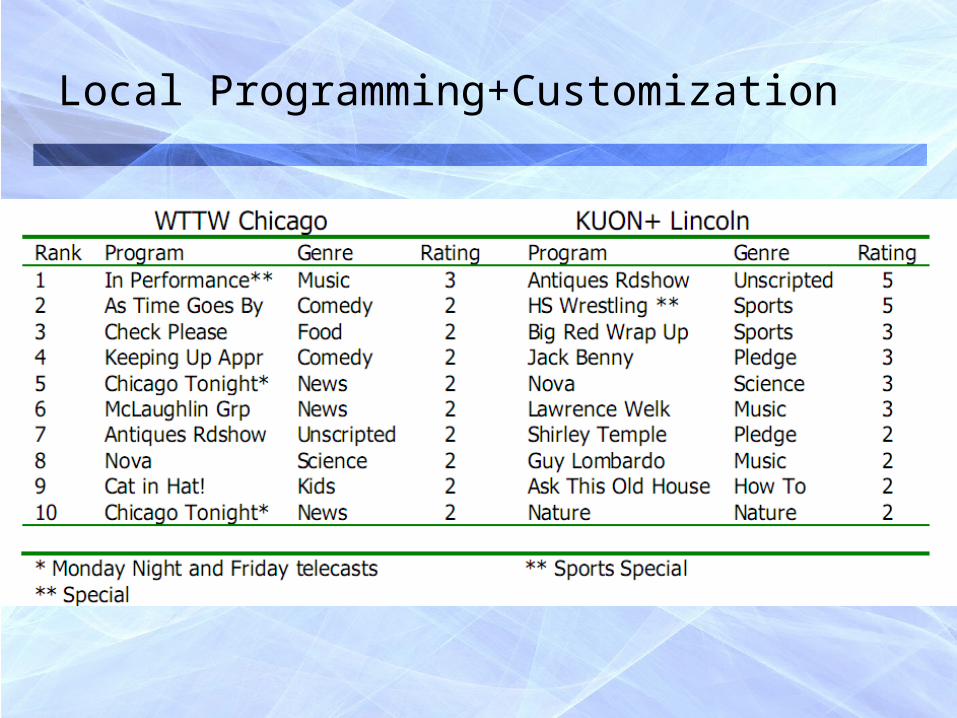
Local Programming+Customization

Beefing Up Your Schedule

Beefing Up Your Schedule
• What are your colleagues doing to improve their ratings?
• The top non-fed program list each day on the overnights can help us find out
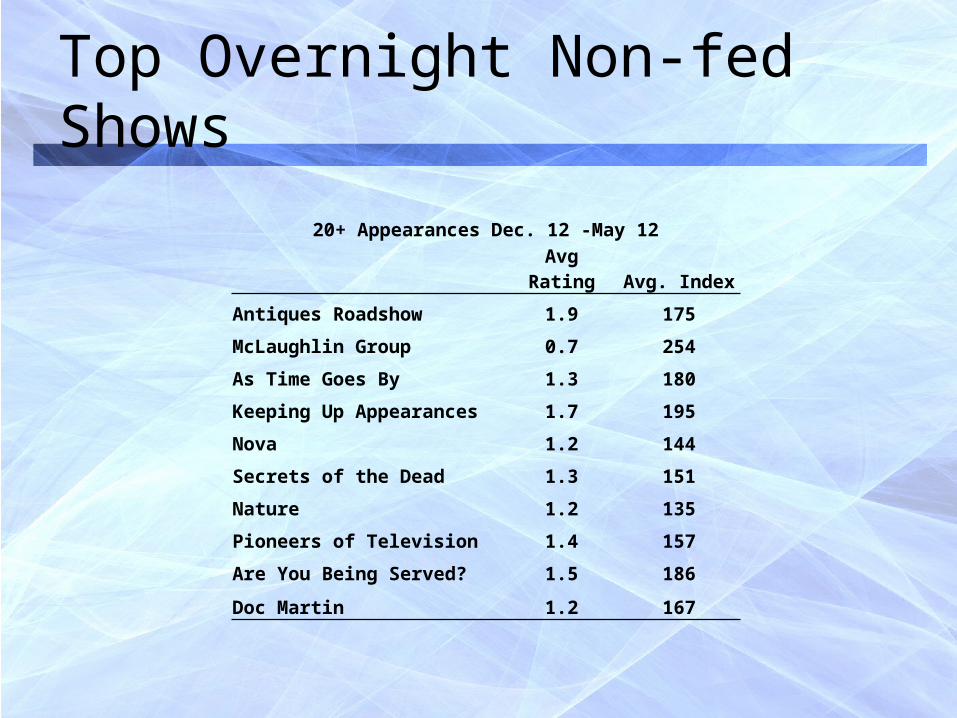
Top Overnight Non-fed Shows
20+ Appearances Dec. 12 -May 12
Avg Rating Avg. Index
Antiques Roadshow 1.9 175
McLaughlin Group 0.7 254
As Time Goes By 1.3 180
Keeping Up Appearances 1.7 195
Nova 1.2 144
Secrets of the Dead 1.3 151
Nature 1.2 135
Pioneers of Television 1.4 157
Are You Being Served? 1.5 186
Doc Martin 1.2 167

Top Overnight Non-fed Shows10-19 Appearances Dec. 12-May 12
Avg Rating Avg. IndexSherlock Holmes 1.5 140World War II in HD Colour 0.8 149Great Performances 0.6 156Masterpiece Classic 1.3 140Rick Steves' Europe 81.0 194The Best of Laugh In 1.5 172Lawrence Welk 1.1 209Waiting for God 1.1 130The Civil War 1.0 120This Old House Hour 1.8 181
Classic Gospel 1.64 186Lark Rise to Candleford 1.1 190American Experience 1.2 153American Masters 1.2 143Frontline 0.8 136Make 'Em Laugh: The Funny Business of America 1.4 146The Space Age: NASA's Story 1.1 149

Future Pairings? Title Ep # Episode
A Span in Time
A Story of Three Bridges
American Experience 1103 Hoover Dam
American Experience 2004 Grand Central
American Experience 2304 Panama Canal
Anywhere, Alaska 102 Dalton Highway: Natural Resources and Nature
Beyond the Light Switch 101
Blue Ridge Parkway: A Long and Winding Road
Blueprint America: Road to the Future
Bridge So Far: A Suspense Story
Building Alaska
California's Gold 407 Golden Gate Bridge
California's Gold 1006
California's Gold 13006 Old Wood
Chesapeake Bay Bridge
City of Bridges
Cornerstones: The Irish in Toledo
Covered Bridges of New England
Historic Bridges of Arkansas
Jungle Under Glass
Ken Burns American Stories
Ken Burns American Stories 104 Brooklyn Bridge
Liquid Assets: The Story of Our Water Infrastructure
Return to the Forest Where We Live
Saved From the Wrecking Ball
Spanning Time: America's Covered Bridges
The National Parks: America's Best Idea 106 The Morning of Creation (1946-1980)
Tracks Across the Sky
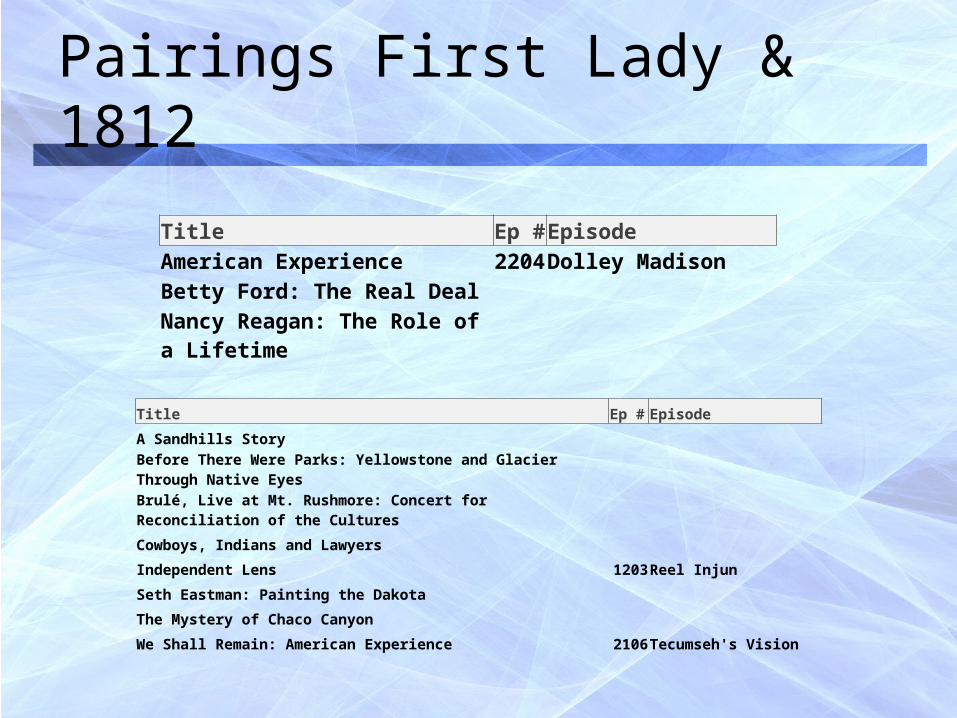
Pairings First Lady & 1812
Title Ep # EpisodeAmerican Experience 2204 Dolley MadisonBetty Ford: The Real DealNancy Reagan: The Role of a Lifetime
Title Ep # Episode
A Sandhills Story
Before There Were Parks: Yellowstone and Glacier Through Native Eyes
Brulé, Live at Mt. Rushmore: Concert for Reconciliation of the Cultures
Cowboys, Indians and Lawyers
Independent Lens 1203Reel Injun
Seth Eastman: Painting the Dakota
The Mystery of Chaco Canyon
We Shall Remain: American Experience 2106Tecumseh's Vision

Pairings Great Depression
Title Ep # Episode
American Experience 1009Riding the Rails
American Experience 2201Civilian Conservation Corps
American Masters 2104You Must Remember This: The Warner Bros. Story: Good War, Uneasy Peace (1935-50)
Between the Lines With Barry Kibrick 1110Ted Gup: A Secret Gift
Documenting the Face of America: Roy Stryker and the FSA/OWI Photographers
Great Lodges of the National Parks 104Lodges of the Pacific Northwest
Herbert Hoover: Landslide
Independent Lens 1021At Home in Utopia
Making of Milwaukee 105The Great Depression to the 21st Century
The Appalachians 103
The National Parks: America's Best Idea 105Great Nature (1933-1945)
Work Pays America

Scott’s Guaranteed Ratings List• Through a Dog’s eyes• Victory in the Pacific: American Experience• Adventure Lodges of North America• African American Lives• Alan Alda in Scientific American Frontiers• America’s Ballroom Challenge• American Masters: Warner Brothers• Conquistadors with Michael Wood• Faces of America• Frontline: From Jesus to Christ• Great Lodges of the National Parks• Ground War• In Search of Myths & Heroes with Michael Wood• Looking for Lincoln• Make ‘em Laugh• Perilous Fight: WWII in Color• Pioneers of Television• POV: Food, Inc.• Secret Files of the Inquisition• Story of India• WWII Behind Closed Doors• Beat the Devil• Charade• Father’s Little Dividend• His Girl Friday• My Man Godfrey• McLintock!• Penny Serenade• Royal Wedding• The Stranger
• 1421: The Year China Discovered America • American Masters: Carol Burnett• At Close Range with National Geographic• Bear Island• Blitz: London’s Longest Night• Bombing of Germany: American Experience• Botany of Desire • Buddha• Churchill• Cities of Light• City at War• David Suchet on the Orient Express• Final Hours: Amelia Earhart• Helen of Troy• In the Footsteps of Marco Polo• Jerusalem: Center of the World• Journey of Man• Kennedys: American Experience• Krakatoa• Lost Cave Temples• Marie Antoinette• Marines• Mark Twain Prize (Bill Cosby, George Carlin)• Medal of Honor• Mystery of Chaco Canyon• Niagara Falls• Paul McCartney: Gershwin Prize• Rape of Europa• Secrets of Shangri-La• Standard of Perfection: Show Cats

Nielsen slides

eNames
• PBS national ratings do not use eNames (anymore!)
• National ratings use a combination of PBS Content Code, station Final Distributor code and line-ups
• PBS preference for those not using eNames would be to have “not available” as opposed to old program titles

National Nielsen
• Nielsen completed monitoring of all PBS member stations in September 2010
• We learned that the bulk of the missing audience data was coming from non-metered markets not encoding (+53% after the monitoring was put in place)
• PBS national primetime average is a 1.4 household rating for all PBS stations
• Finally have a complete and accurate picture of the audience

Audience Insight Slides

PBS ratings trail off each night
8p 8:30p 9p 9:30p 10p 10:30p0
1
2
3
4
5
6
Primetime Rating for PBS & Selected Competition09-10 Season
CBS
NBC
PBS
DISC
HIST
Primetime Hour (M-Su)
HH
Rati
ng
42
• Other networks build ratings across the primetime hours, starting lowest at 8p, rising at 9pm and, often, into 10pm as well.
• On most nights, PBS’s ratings run counter to this, beginning strong at 8pm and falling each hour.
• The potential audience grows across the night, so the opportunity to grab more of them exists.
Source: Nielsen NPower time period ratings report, 09-10 season Mon-Sun 8p-11p

Nightly PBS minute-by-minute ratings reveal steep cliffs at programs’ end
0 5 10 15 20 25 30 35 40 45 50 55 60 65 70 75 80 85 90 95 100 105 110 115 120 125 130 135 140 145 150 155 160 165 170 175 180 0.0
1.0
2.0
3.0
4.0
5.0
6.0
7.0
8.0MONDAY (1/18/10)
P40-49P50-64P65+
43
0 5 10 15 20 25 30 35 40 45 50 55 60 65 70 75 80 85 90 95 100 105 110 115 120 125 130 135 140 145 150 155 160 165 170 175 180
0.0
0.5
1.0
1.5
2.0
2.5
3.0
3.5
4.0TUESDAY (1/19/10)
P40-49
P50-64
P65+
Antiques Roadshow: “Raleigh, NC” American Experience: “Influenza 1918” VARIOUS
NOVA: “Riddles of the Sphinx” Frontline: “A Death in Tehran” Independent Lens: “Copyright Criminals”
Source: Nielsen NPower time period ratings report

44
Programs drawing similar audiences not always co-located in the schedule
Sunday Monday Tuesday Wednesday Thursday Friday
Newshour Newshour Newshour Newshour Newshour
Nature AntiquesRoadshow
NOVA Great Performances
Secrets of the
Dead
This Old House Hour
Wash Week
Need to Know
Masterpiece American
Experience
History
Detectives
Frontline American Masters
AntiquesRoadshow
Masterpiece
Various Independen
tLens
P.O.V. Soundstage
Source: Nielsen NPower, ‘09-10 broadcast season, program ratings report, median age used.
60 or under, male 60 or under, female
Over 60, male Over 60, femaleKEY: BOLD = strong College 4+ skew

45
Viewers 65+: in for a pound
• Even among PBS-oriented 65+ viewers, some come only for one or two titles.
• Example: Many Frontline viewers watched other shows, but far fewer viewers of other shows also watched Frontline
Source: Nielsen NPower Duplication table, 09-10 Season, Primetime persons 65+
Persons 65+ PBS
NewsHourAmerican
ExperienceAmerican Masters
Antiques Roadshow Frontline
History Detectives Masterpiece Nature NOVA
Secrets of the Dead
PBS NewsHour
American Experience
American Masters
Antiques Roadshow
Frontline
History Detectives
Masterpiece
Nature
NOVA
Secrets of the Dead
= 60%+ duplication
= 40-60% duplication
= less than 40% duplication

Selected slides from Limited Series analyses

Pioneers of TelevisionP 50-64 Score Big compared to PBS Prime Average
• The 200-series out-performed the PBS Jan-Feb 2011 primetime for all demo groups• Persons 50-64 stand out with a 115% increase PBS primetime audience• P 40-49 earned a 1.1, on par with PBS primetime P 50-64 rating
Household Persons 40 - 49 Persons 50 - 64 Persons 65+0.0
0.5
1.0
1.5
2.0
2.5
3.0
3.5
1.4
0.5
1.1
2.42.4
1.1
2.3
3.1
Pioneers of Television 200-Series Avg & PBS Primetime
PBS Primetime PITV 200 Series
AA %
Rati
ngs
74%
116%
115%
29%
Source: NTI Nielsen Npower, Live +7 AA Ratings for PITV 200 Series and PBS Primetime 8-11pm M-Su by Demo group47

Pioneers of Television“Westerns” – Most Popular Episode of the 200 Series
• “Westerns” proved to be the most popular, scoring 90% above “Science Fiction” for P 65+.• Most audiences dropped during “Crime Dramas”; Persons 40-49 actually saw a 27% increase.• Aside from P 65+, ratings were relatively on par for episode 204 compared to episode 201
Ep 201 - "Science Fiction" Ep 202 - "Westerns" Ep 203 - "Crime Dramas" Ep 204 - "Local Kids' TV"0.5
1.0
1.5
2.0
2.5
3.0
3.5
4.0
4.5
Pioneers of Television – Episode AA Ratings by Demo Group
Household P 40 - 49 P 50 - 64 P 65+
AA %
Rati
ngs
Source: NTI Nielsen Npower, Live +7 AA Ratings for PITV 200 Series by Demo group & Episode 48

Pioneers of Television Ep. 201 Brought New Viewers to PBS Primetime
• 863,000 New Households watched Pioneers of Television that did not watch PBS the previous 2 weeks in January 2011
• While only 235,000 new P 40-49 viewers tuned in for Episode 201, this new audience comprised 35% of the total P 40-49 audience reach for #201
• 25% of Persons 50-64 viewers were new and 20% of Persons 65+ viewers were new
Household P 40 - 49 P 50 - 64 P 65+0
100
200
300
400
500
600
700
800
900
1,000
0%
5%
10%
15%
20%
25%
30%
35%
40%New Aud Reach (000) % of Audience that was New
PITV
New
Aud
ienc
e (0
00)
Percent of Demo G
roup that was N
ew Au
-dience
Source: NTI Nielsen Npower, Reach Duplication for PITV #201 and PBS Primetime (1/3/11-1/16/11) by Demo group 49

50
CircusTarget Demo Ratings Summary
P40-49 P50-64 P65+0.0
0.5
1.0
1.5
2.0
2.5
0.68
0.97
1.59
0.42
0.940000000000001
2.15
Circus Ratings in Target Demos
Circus PBS STD Prime Average
Rat
ing
(L
ive
AA
%)
• Ratings for persons 40-49 were up 51% compared to PBS prime.• Persons 65+ ratings were off 26%.

51
CircusMxM for P65+
01234567891011121314151617181920212223242526272829303132333435363738394041424344454647484950515253545556575859606162636465666768697071727374757677787980818283848586878889909192939495969798991001011021031041051061071081091101111121131141151161171181191200.0
0.5
1.0
1.5
2.0
2.5
3.0
0%
10%
20%
30%
40%
50%
60%
70%
80%
90%
100%Circus Wed 11/3 MxM Ratings P65+
P50-64 AA%
Cume Reach
Minute of Program
AA
%
Cu
mu
lati
ve
Re
ac
h
Few new P65+ viewers added in 2nd hour
Early strength dissipates quickly
• After 5-minutes, Circus 101 had already reached 40% of its total 65+ audience, typical of appointment viewing and a sign that promotional efforts may have worked for this group.
• Unfortunately, the audience tuned out steadily during the first hour.• After the 60-minute mark a lack of new viewers combined with tune-out brought
down ratings.

The Tenth Inning
The Tenth Inning vs. PBS Primetime (Sept 2010) Ratings
0.0
0.5
1.0
1.5
2.0
2.5
Ra
tin
g (
AA
%)
101 1.6 0.3 0.7 0.7 1.1 1.3 1.5
102 1.0 0.1 0.4 0.5 0.7 0.8 1.3
101/102 Series 1.3 0.2 0.5 0.6 0.8 1.0 1.4
PBS Avg* 1.3 0.1 0.2 0.5 0.8 1.0 2.2
%Diff (Series/PBS) -1% +42% +54% +25% +11% +4% -56%
Household P18-24 P25-39 P40-49 P40-64 P50-64 P65-99
*PBS TP Avg represents respective time period averages (excluding specials) for Sept 2010.
• Ratings for P 65+ were off 56% from PBS primetime average• Ratings 54% ahead of prime for P 25-39