"digical" innovation
TRANSCRIPT

INNOVATION, CREATIVITY and the ENTREPRENEUR
Michael Klemen11.06.2015
WEBSTER UNIVERSITY VIENNA

© FOR PRIVATE USAGE ONLY / MICHAEL KLEMEN JUNE 2015
….
…
…
KreislaufwirtschaftVerknappung strategischer Ressourcen
…….
Digital NativesDurchdringung & Vernetzung
des Alltags
…
…
…
…
Bionik in Technologie & Design
Schwarm-intelligenz
Vom Massen-markt zum Mikromarkt
BUSINESS ECOSYSTEMS
Entstehen vernetzter, intelligenter
Infrastrukturen
Durchbrüche bei künstlicher Intelligenz
& Robotik
Miniaturisierung & Nanotechnologie treiben
T.-Konvergenz
Neue Werkstoffe & Konstruktionsprinzipien
Dynamisierung & Flexibilisierung
der Arbeitsverhältnisse
Kollaborative Arbeitsformen
Digitale Vernetzung des Verkehrs
Global anwachsende Mobilität
Neue Wertschöpfungs-partnerschaften &
-netzwerke
Global fragmentierte & verteilteWertschöpfungskette
Volatile Ökonomie
Daten- & Wissensbasierte Wertschöpfung
(Big Data, Smart Data)Aufstieg Chinas und
Indiens zu Weltmächten
Multipolare Welt /Neue strategische
Allianzen
Individualismus als Massenphänomen
Wachsender Ressourcenverbrauch
NEW STAGES OF
INDIVIDUALISATION
DIGITAL CULTURE
CHANGE OF
WORK WORLD
KNLOWLEDGE BASED
ECONOMY
NEW MOBILITY
PATTERNS
CHANGE AT ENERGY &RESSOURCES
NEW POLITICALWORLDORDER
LEARNING
FROM NATURE
GLOBALISATION 2.0 / 3.0 / 4.0
NEW DISRUPTIVE TECHNOLOGIES /
TECHN.-CONVERGENCE
ALL PRESENT INTELLIGENCE
Geschäftsmodell- und Systeminnovationen
HOW TRENDS WILL SHAPE OUR FUTURE ….
11 JUNE 2015 PAGE 2
Source IMP 2015

© FOR PRIVATE USAGE ONLY / MICHAEL KLEMEN JUNE 2015
WHAT IS INNOVATION ?
11 JUNE 2015 PAGE 3
© FOR PRIVATE USAGE ONLY / MICHAEL KLEMEN JUNE 2015 4
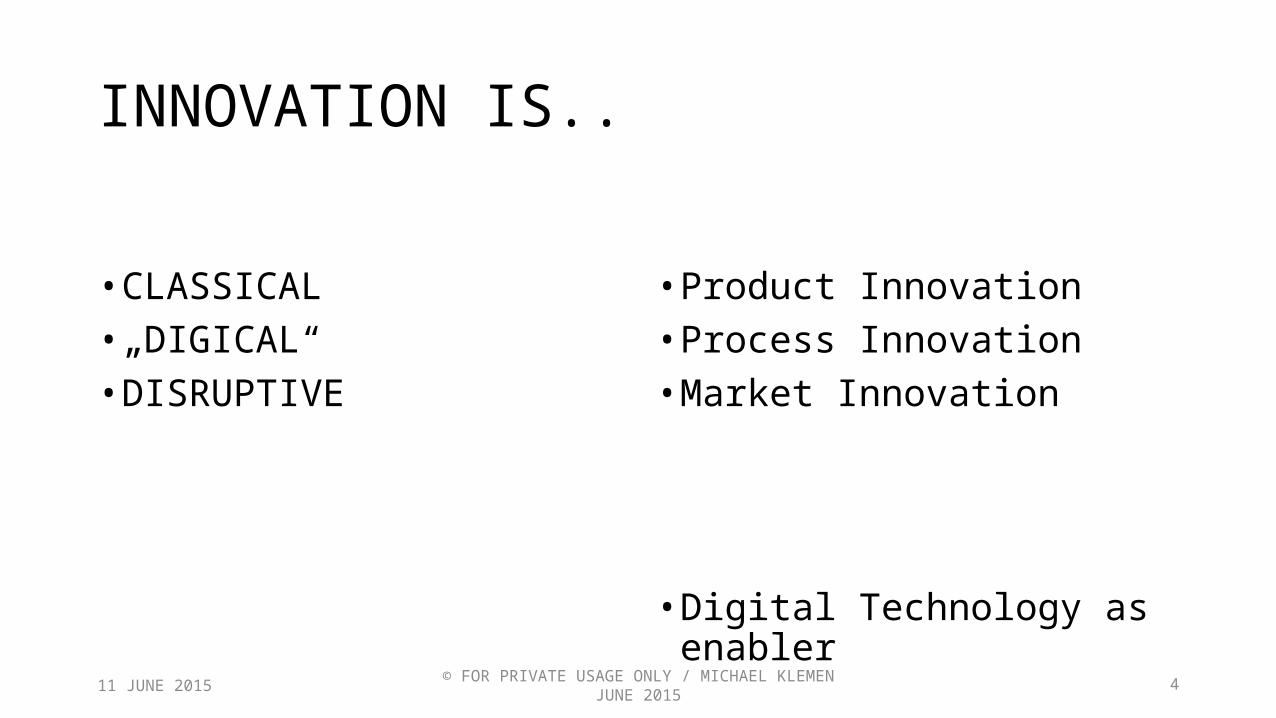
INNOVATION IS..
• CLASSICAL• „DIGICAL“• DISRUPTIVE
• Product Innovation • Process Innovation• Market Innovation
• Digital Technology as enabler
11 JUNE 2015

© FOR PRIVATE USAGE ONLY / MICHAEL KLEMEN JUNE 2015
CLASSICAL… not everything works…
11 JUNE 2015 PAGE 5

© FOR PRIVATE USAGE ONLY / MICHAEL KLEMEN JUNE 2015
CLASSICAL… not everything works…
11 JUNE 2015 PAGE 6
© FOR PRIVATE USAGE ONLY / MICHAEL KLEMEN JUNE 2015
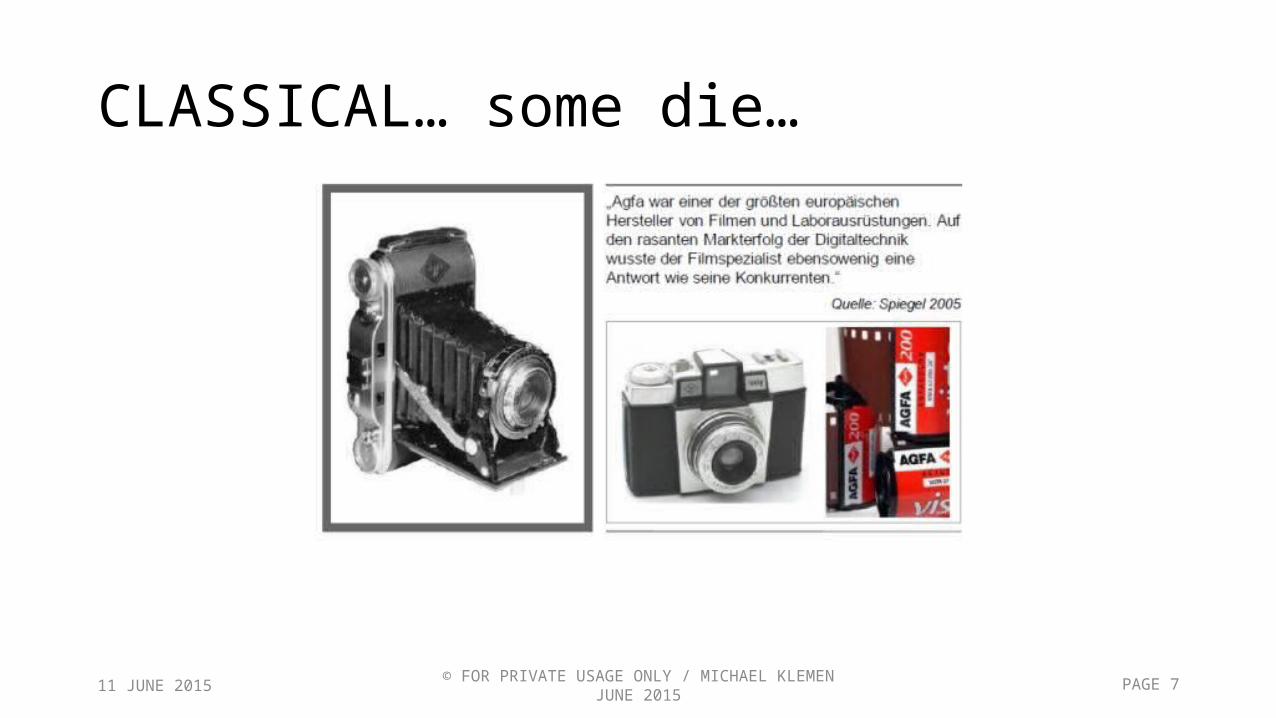
CLASSICAL… some die…
11 JUNE 2015 PAGE 7
© FOR PRIVATE USAGE ONLY / MICHAEL KLEMEN JUNE 2015
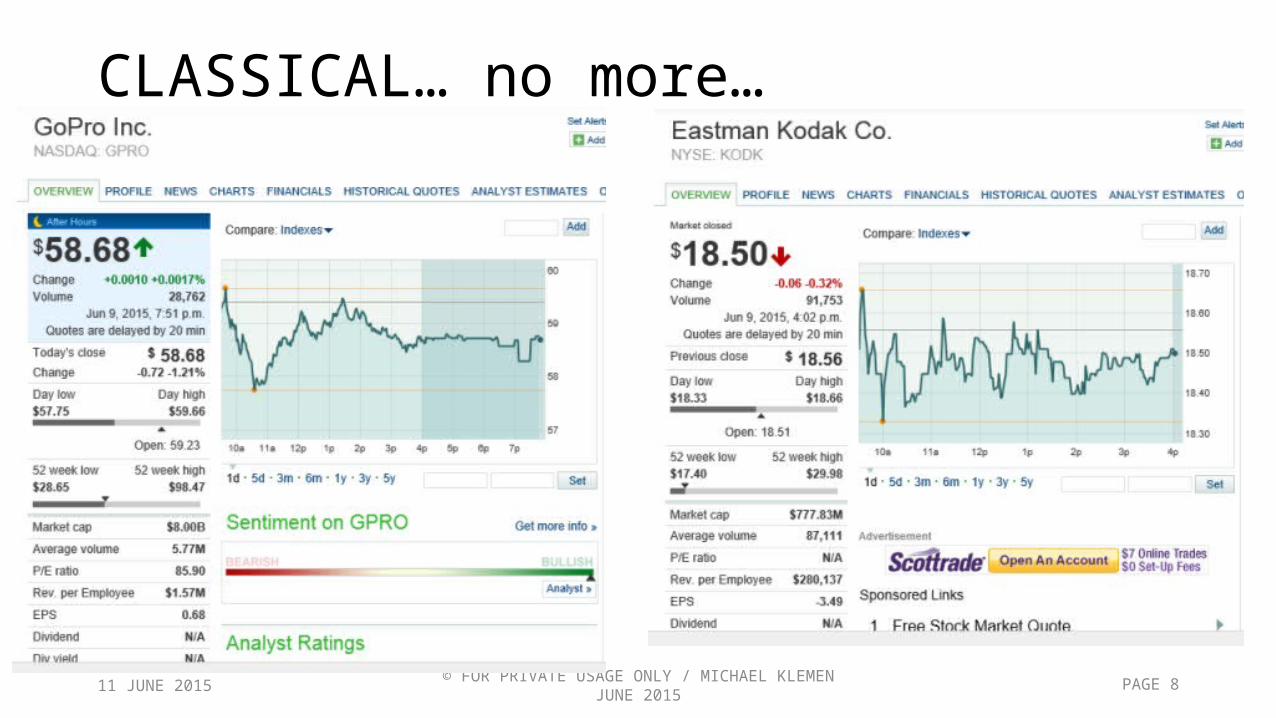
CLASSICAL… no more…
11 JUNE 2015 PAGE 8

© FOR PRIVATE USAGE ONLY / MICHAEL KLEMEN JUNE 2015
CLASSICAL ?
11 JUNE 2015 PAGE 9

© FOR PRIVATE USAGE ONLY / MICHAEL KLEMEN JUNE 2015 1011 JUNE 2015

© FOR PRIVATE USAGE ONLY / MICHAEL KLEMEN JUNE 2015 1111 JUNE 2015

© FOR PRIVATE USAGE ONLY / MICHAEL KLEMEN JUNE 2015 1211 JUNE 2015

© FOR PRIVATE USAGE ONLY / MICHAEL KLEMEN JUNE 2015
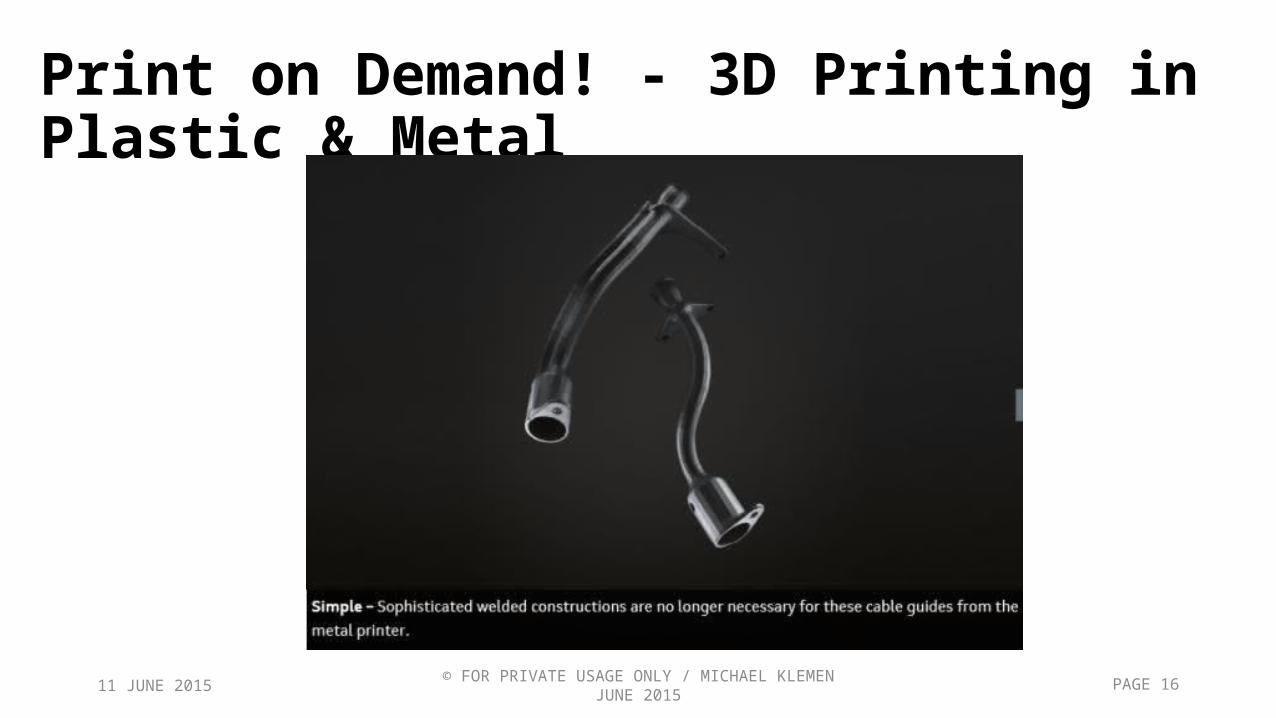
Print on Demand! - 3D Printing in Plastic & Metal
11 JUNE 2015 PAGE 13

© FOR PRIVATE USAGE ONLY / MICHAEL KLEMEN JUNE 2015
Print on Demand! - 3D Printing in Plastic & Metal
11 JUNE 2015 PAGE 14

© FOR PRIVATE USAGE ONLY / MICHAEL KLEMEN JUNE 2015
Print on Demand! - 3D Printing in Plastic & Metal
11 JUNE 2015 PAGE 15
© FOR PRIVATE USAGE ONLY / MICHAEL KLEMEN JUNE 2015
Print on Demand! - 3D Printing in Plastic & Metal
11 JUNE 2015 PAGE 16

© FOR PRIVATE USAGE ONLY / MICHAEL KLEMEN JUNE 2015
Print on Demand! - 3D Printing in Plastic & Metal
11 JUNE 2015 PAGE 17

© FOR PRIVATE USAGE ONLY / MICHAEL KLEMEN JUNE 2015
Print on Demand! - 3D Printing in Plastic & Metal
11 JUNE 2015 PAGE 18

© FOR PRIVATE USAGE ONLY / MICHAEL KLEMEN JUNE 2015
Print on Demand! - 3D Printing in Plastic & Metal
11 JUNE 2015 PAGE 19

© FOR PRIVATE USAGE ONLY / MICHAEL KLEMEN JUNE 2015 20
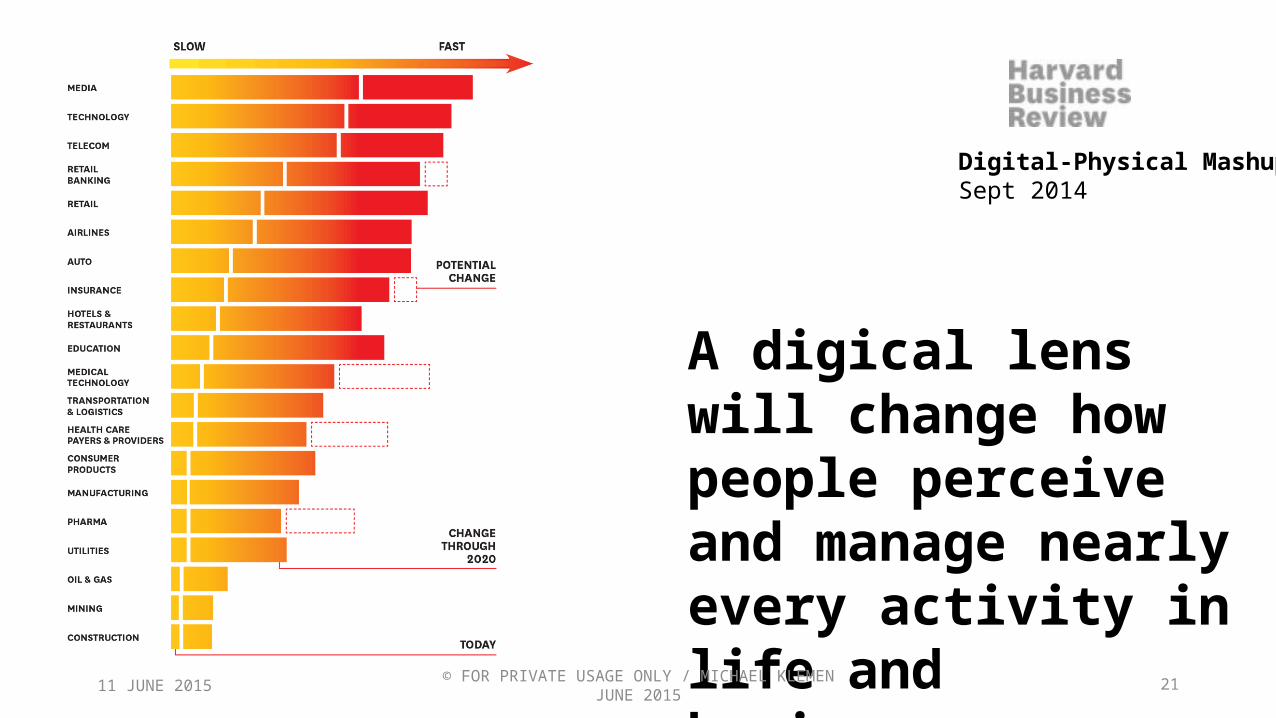
“DIGICAL” (combined digital and physical) innovations will hit some businesses much harder and faster than others
Digital-Physical MashupsSept 2014
11 JUNE 2015
© FOR PRIVATE USAGE ONLY / MICHAEL KLEMEN JUNE 2015 21
Digital-Physical MashupsSept 2014
A digical lens will change how people perceive and manage nearly every activity in life and business.
11 JUNE 2015
© FOR PRIVATE USAGE ONLY / MICHAEL KLEMEN JUNE 2015 PAGE 22
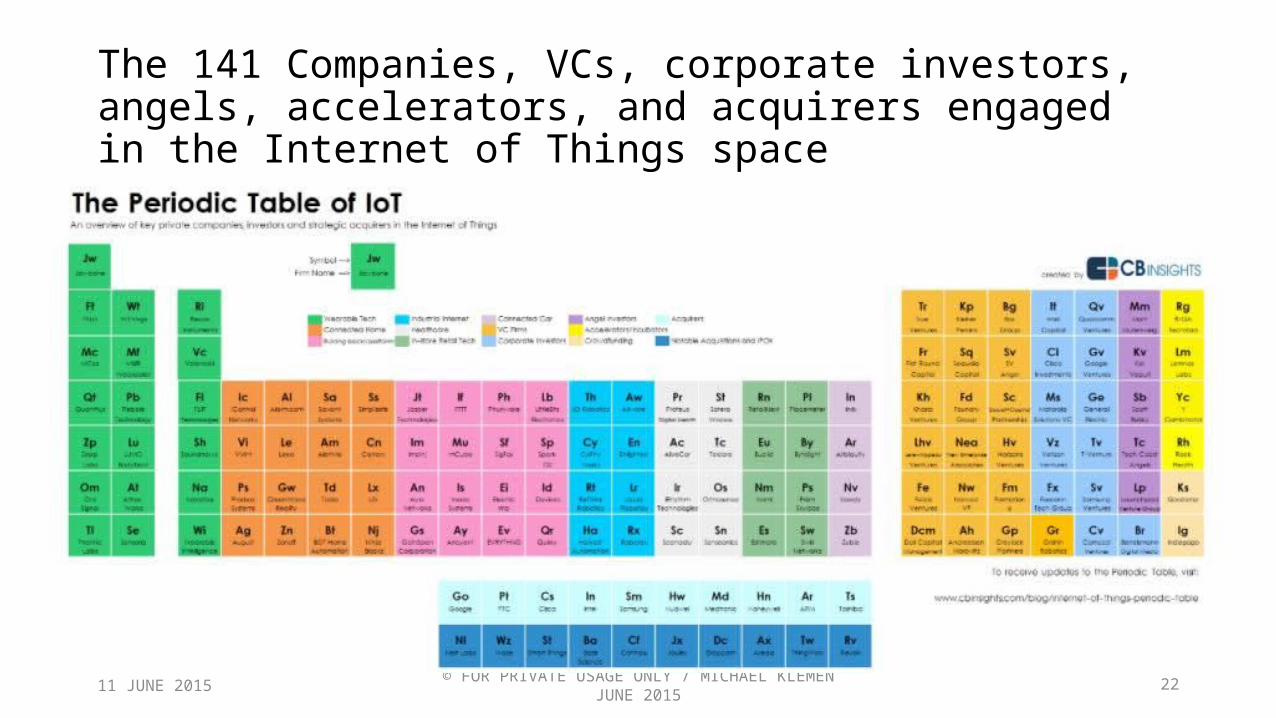
The 141 Companies, VCs, corporate investors, angels, accelerators, and acquirers engaged in the Internet of Things space
11 JUNE 2015

© FOR PRIVATE USAGE ONLY / MICHAEL KLEMEN JUNE 2015 23
DIGICAL & IoT Consists of M2M, M2P, and P2P Connections
Machine-to-Machine (M2M/IoT)• Data sent / received from one machine (thing)
to another• Often called the “Internet of Things”
Machine-to-Person (M2P)• Data sent / received from a machine (thing) to a
person• Often called “data and analytics”
Person-to-Person (P2P)• Data sent / received from one person to
another • Often called “collaboration”
IoE Value (2013-2022)
$7.4 Trillion
$4.6 Trillion
$7.0 Trillion
11 JUNE 2015
© FOR PRIVATE USAGE ONLY / MICHAEL KLEMEN JUNE 2015 24
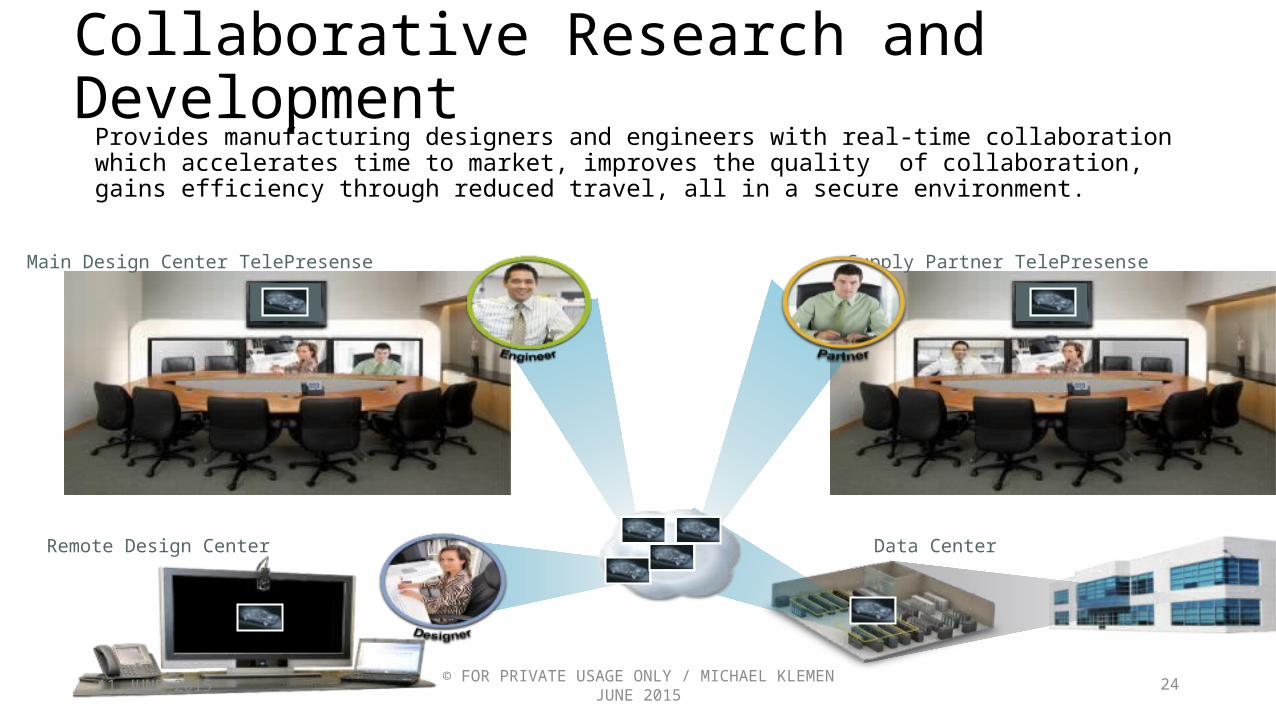
Collaborative Research and Development
Provides manufacturing designers and engineers with real-time collaboration which accelerates time to market, improves the quality of collaboration, gains efficiency through reduced travel, all in a secure environment.
Remote Design Center
Main Design Center TelePresense Supply Partner TelePresense
Data Center
11 JUNE 2015

High-end 3D visualization early in the design and engineering phases leveraging lifelike digital models

DESIGN VERIFICATION
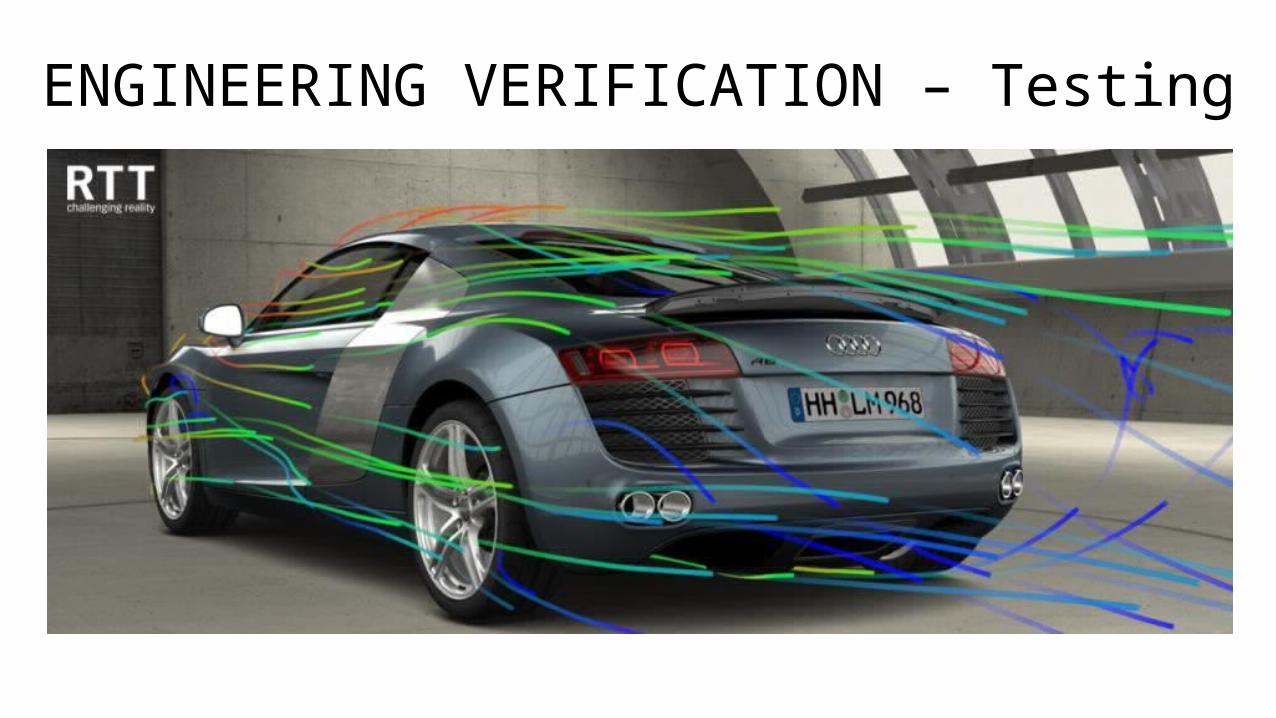
ENGINEERING VERIFICATION – Testing

COMPUTER GENERATED CONFIGURATION

AUDI CITY LIVE London,Peking,Berlin…Moscow

INTEGRATION of HIGH RES VIDEO & 3D VISUALISATION

DESKTOP

NO DIFFERENCE TO PHYSICAL PRESENCE

MONDAY FRIDAYTHURSDAYTUESDAY WEDNESDAY
ENER
GY
USE
HIGH
LOW
INDUSTRY 4.0 – CYBER PHYSICAL SYSTEMS

MONDAY FRIDAYTHURSDAYTUESDAY WEDNESDAY
ENER
GY
USE
HIGH
LOW
20-30% ENERGY COST SAVINGS
INDUSTRY 4.0 – CYBER PHYSICAL SYSTEMS

IoT INFRASTRUCTURE
Supply Chain
Mobile Control Rooms
Predictive MaintenanceWireless Machines
Traceability
$1.95 TRILLION IN POTENTIAL PROFITS IN MANUFACTURING FROM ALL IoT
© FOR PRIVATE USAGE ONLY / MICHAEL KLEMEN JUNE 2015 36
Video: ARENA2036http://www.youtube.com/watch?v=hIQ7FS4IxLc&list=PL1M-s3kFzGJsK8u5FwOcINo-MrMzNmOvG
11 JUNE 2015

© FOR PRIVATE USAGE ONLY / MICHAEL KLEMEN JUNE 2015 37
Audi Rethinks Production: Smart Faction
11 JUNE 2015
© FOR PRIVATE USAGE ONLY / MICHAEL KLEMEN JUNE 2015 38
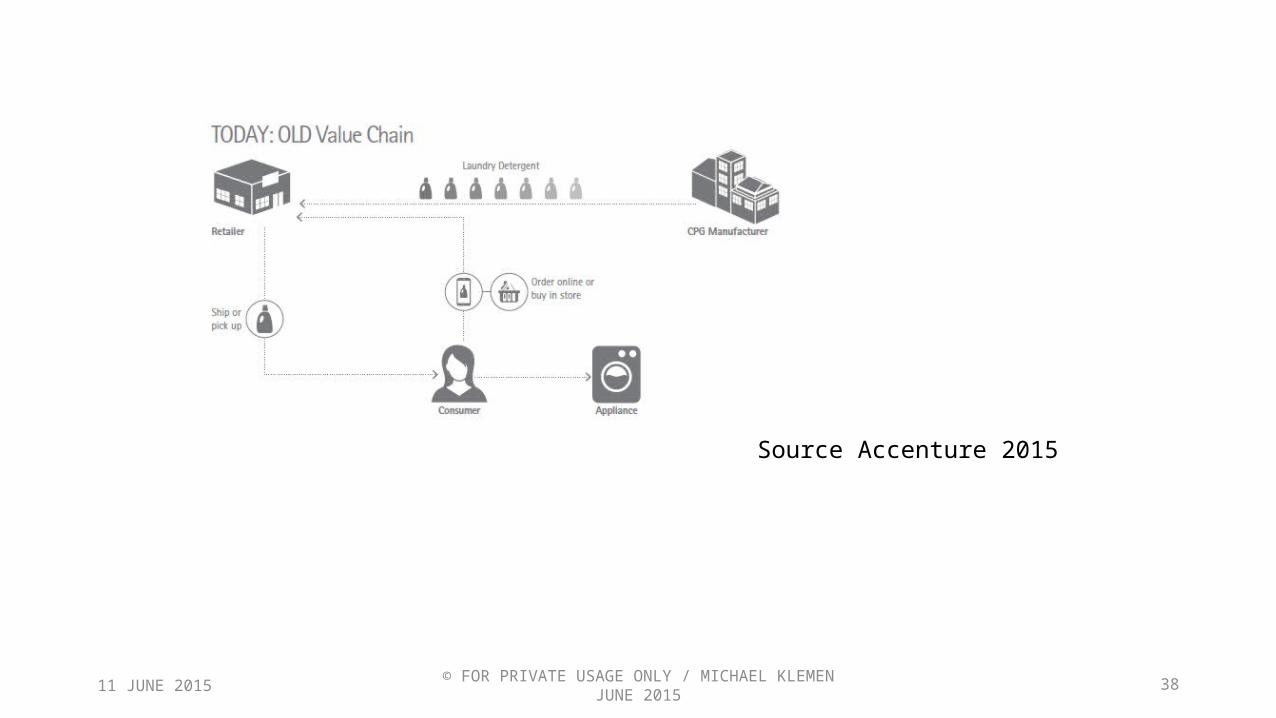
Source Accenture 2015
11 JUNE 2015
© FOR PRIVATE USAGE ONLY / MICHAEL KLEMEN JUNE 2015 39
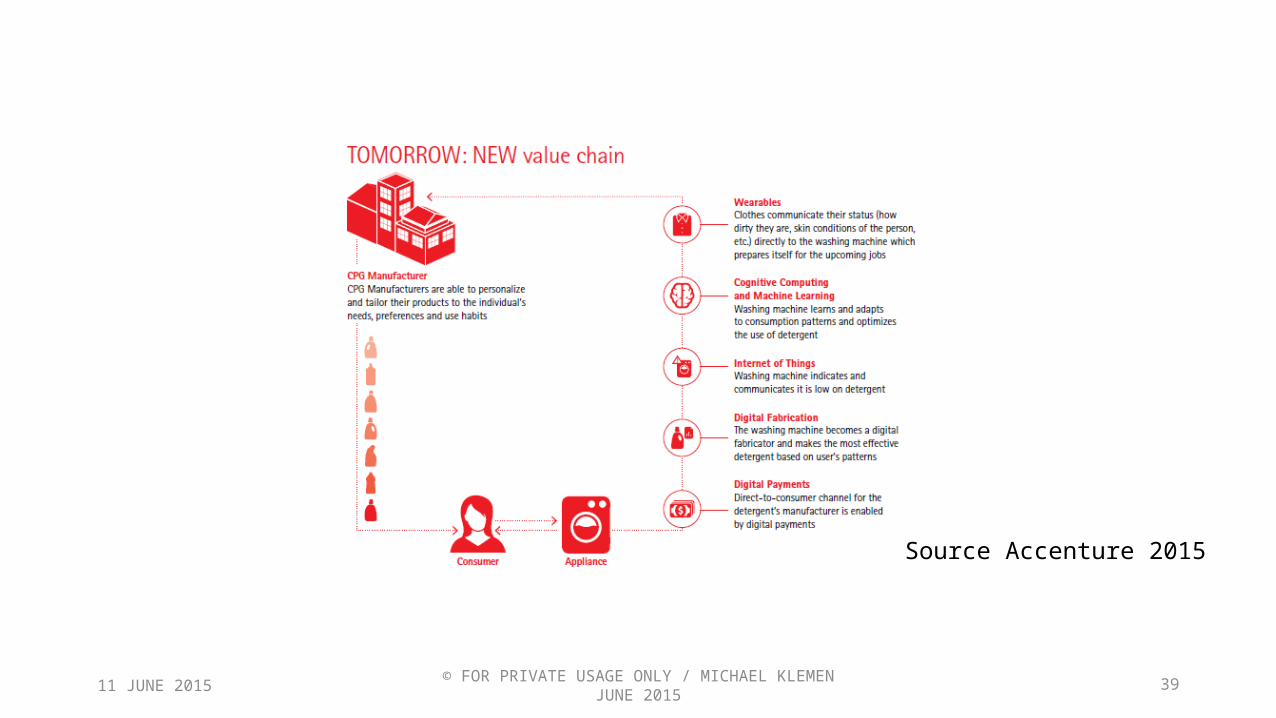
Source Accenture 2015
11 JUNE 2015

THE DATA AGGREGATION CHALLENGE1.1 Billion
Data points generated by sensors daily500 GigabytesData generated by an offshore oil rig weekly
1000 GigabytesData generated by an oil refinery daily1,000 Gigabytes
Data generated by a jet engine every 60 minutes
2.5 Billion GigabytesData generated worldwide daily
90% of the world’s dataHas been created in the last 2 years!

IoT REQUIRES NEW DISTRIBUTED COMPUTING
DEVICE
DATACENTER/CLOUD
IoT Computing Model(Data Volume, Security, Resiliency, Latency)
FOG
CLOUD CLOUDEDGE
STORE ANALYZE ACT NOTIFY

DISRUPTIVE

© FOR PRIVATE USAGE ONLY / MICHAEL KLEMEN JUNE 2015 4311 JUNE 2015


© FOR PRIVATE USAGE ONLY / MICHAEL KLEMEN JUNE 2015
UBER FACTS…
In its home town of San Francisco, 71 percent of rides expensed through Certify during the first quarter were for Uber; 29 percent used taxis. Uber also beat out all other forms of ground transportation in Dallas, accounting for 56 percent of the rides.
In Los Angeles and Washington D.C., Uber represented 49 percent of business travel rides. Taxis, limousines and airport shuttles still reigned in New York, Miami and Chicago where they took 79 percent, 77 percent and 75 percent of rides expensed, respectively
In London there are 12000 drivers currently
Source: 2015
11 JUNE 2015 PAGE 45
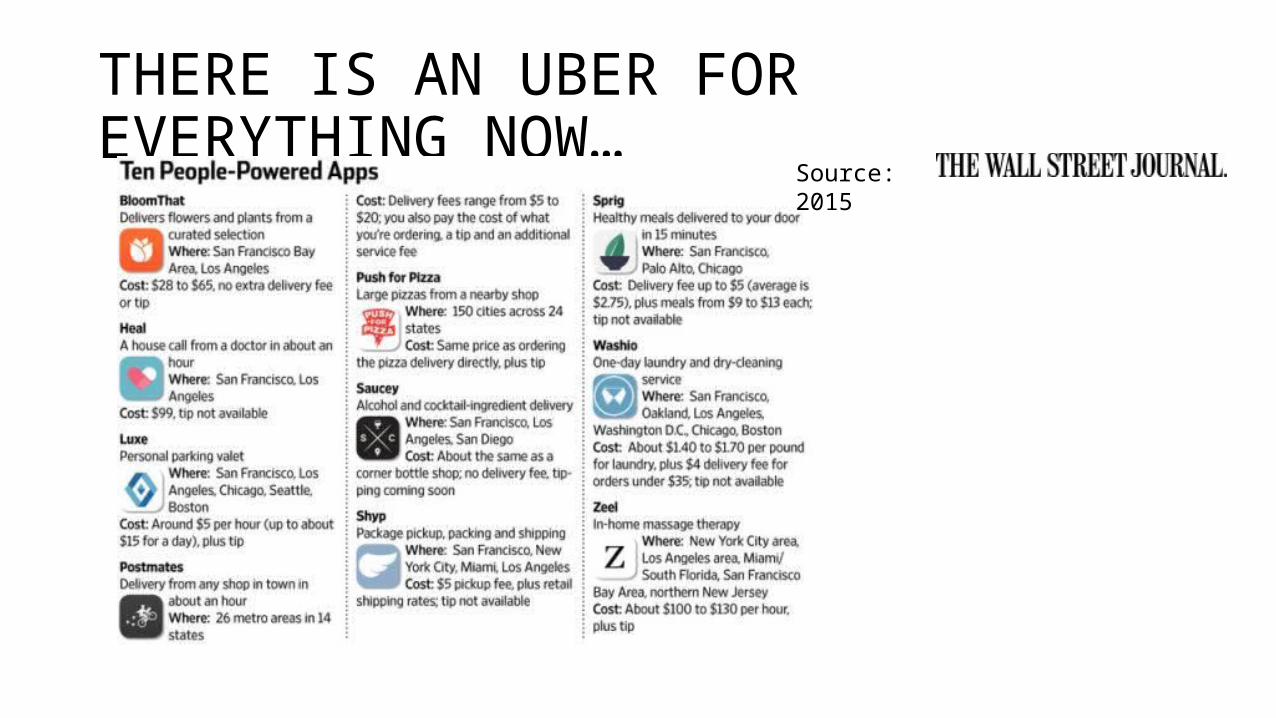
THERE IS AN UBER FOR EVERYTHING NOW…
Source: 2015

© FOR PRIVATE USAGE ONLY / MICHAEL KLEMEN JUNE 2015
THERE ARE FOUR BUSINESS MODELS :
• Asset Builders: These companies build, develop, and lease physical assets to make, market, distribute, and sell physical things. Examples include DAIMLER, REWE, and FedEx.
• Service Providers: These companies hire employees who provide services to customers or produce billable hours for which they charge. Examples include ERSTE BANK, Accenture, and JP Morgan.
• Technology Creators: These companies develop and sell intellectual property such as software, analytics, pharmaceuticals, and biotechnology. Examples include SAP, Oracle, and Amgen.
• Network Orchestrators. These companies create a network of peers in which the participants interact and share in the value creation. They may sell products or services, build relationships, share advice, give reviews, collaborate, co-create and more. Examples include eBay, Red Hat, and Visa, Uber, Tripadvisor, and Alibaba.
11 JUNE 2015 PAGE 47

© FOR PRIVATE USAGE ONLY / MICHAEL KLEMEN JUNE 2015
PERFORMANCE is …… ?
11 JUNE 2015 PAGE 48

© FOR PRIVATE USAGE ONLY / MICHAEL KLEMEN JUNE 2015
FEWER THAN 5% ARE NETWORK ORCHESTRATORS
• First, today’s network-based business models require new technologies and competencies. Most corporate leaders are skilled at building, owning, and managing their own physical assets or people. Network Orchestrators, however, rely on intangibles such as knowledge (Gerson Lehrman Group) or relationships (Facebook), or other people’s assets (Uber) as well as new “non-management” and “non-ownership” competencies related to facilitating a network of individuals and their individual assets and relationships.
• Second, Generally Accepted Accounting Principles (GAAP) categorize some assets as “assets” (plant property and equipment), others as expenses (people, training, and intellectual property) and ignores others (customers, sentiment, and networks) altogether, frequently resulting in the under-allocation of capital to intangible assets. This is especially problematic given that, today, intangible assets make up approximately 80% of corporate market value.
• Third, standard industry designations result in siloed thinking, leaving empty space where new business models can enter. For example, think back to the early 1990s. Most traditional retailers were slow to move into the online space because they didn’t consider themselves “technology companies.” The online market was left open, and in came a slew of new players such as Amazon, eBay, and Zappos, who gobbled up market share and changed the retail game. Today, the power of networks is creating a new cross-industry transformation. Consider what Uber and Lyft are doing to the taxi industry or how Airbnb is affecting the hotel industry.
• Finally, business models are tightly integrated into all parts of a company, and are therefore daunting to change. Changing business model requires changing capital allocation, but Research by McKinsey & Company shows that most companies follow the same allocation patterns year after year, despite dramatic changes in the business environment.
11 JUNE 2015 PAGE 49
© FOR PRIVATE USAGE ONLY / MICHAEL KLEMEN JUNE 2015
Viewed traditionally, Uber’s valuation might be confusing. And Uber’s position certainly isn’t set in stone. As it scales and carves out share in the transportation industry, it’s running into it’s fair share of problems. With regulatory issues, public relations nightmares, and safety questions, Uber has a long way to go before all is over.
But through the lens of disruption, it’s at least possible to grasp just how Uber could be worth so much.
Source: 2015
11 JUNE 2015 PAGE 50

© FOR PRIVATE USAGE ONLY / MICHAEL KLEMEN JUNE 2015
A FINAL WISH …
11 JUNE 2015 PAGE 51

© FOR PRIVATE USAGE ONLY / MICHAEL KLEMEN JUNE 201511 JUNE 2015 PAGE 52
STAY YOUNG STAY COURIOUS…

THANK YOU