digital finance plus readiness in tanzania: full version
TRANSCRIPT

CGAP Digital Finance +
Readiness Framework
and Assessment for
Tanzania

1
Agenda
Readiness framework
Access to and reach of mobile infrastructure
Adoption and reach of digital finance infrastructure
Role of the government and regulation
Sector analysis – water
Sector analysis – education
Sector analysis – energy
Sector analysis – health
Sector analysis – agriculture
2
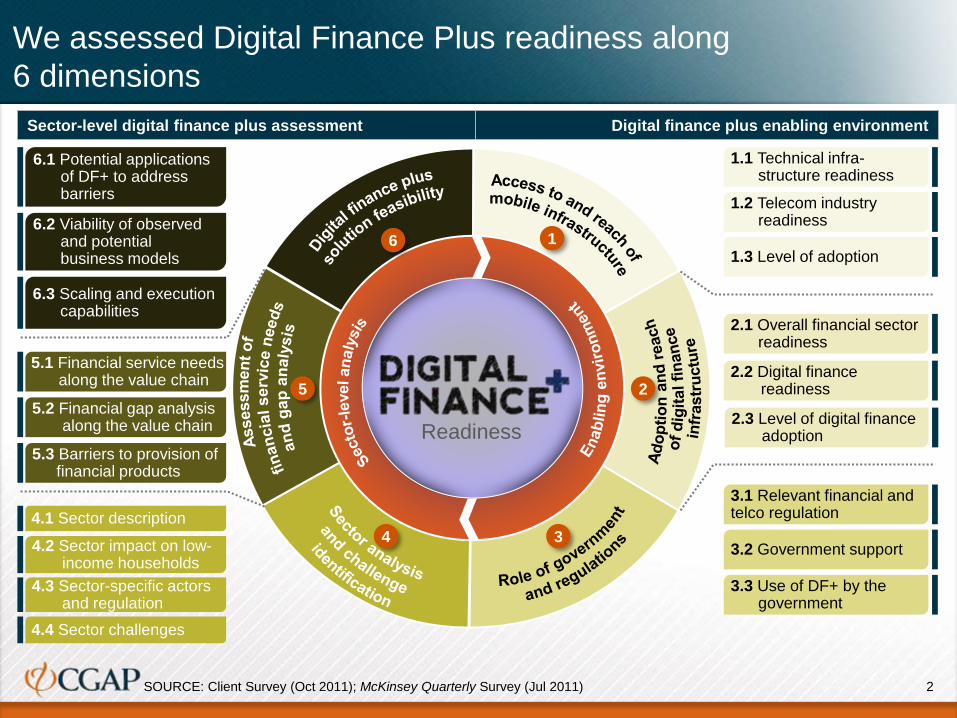
We assessed Digital Finance Plus readiness along
6 dimensions
SOURCE: Client Survey (Oct 2011); McKinsey Quarterly Survey (Jul 2011)
Digital finance plus enabling environmentSector-level digital finance plus assessment
4.1 Sector description
4.2 Sector impact on low-income households
5.1 Financial service needs along the value chain
5.2 Financial gap analysis along the value chain
5.3 Barriers to provision of financial products
4.3 Sector-specific actors and regulation
6.1 Potential applications of DF+ to address barriers
6.2 Viability of observed and potential business models
6.3 Scaling and execution capabilities
4.4 Sector challenges
6
5
4 3
2
1
Readiness
1.1 Technical infra-structure readiness
1.2 Telecom industry readiness
1.3 Level of adoption
3.1 Relevant financial andtelco regulation
3.2 Government support
3.3 Use of DF+ by the government
2.2 Digital finance readiness
2.3 Level of digital finance adoption
2.1 Overall financial sector readiness

3
Digital finance readiness assessment framework detail (1 of 6)
Questions Functional area
1. Access
to and
reach of
mobile
infra-
structure
1.1 Technical
infrastructure
readiness
1.2 Telecom
industry
readiness
Phase
How many nationwide mobile
phone providers exist and how is
the industry changing?
▪ Describe the industry’s structure (number and size of
national and regional players), competitive dynamics,
and where experts see the industry going
How much do mobile services
cost and how have these prices
changed?
▪ Evaluate cost information for a phone, SIM card, 1
SMS, 10 minutes of call time, 1 MB of mobile data,
and trends across geographies
▪ How ubiquitous is mobile
phone and internet coverage
in the country and how might
it change?
▪ What type of networks exist?
▪ What is their quality and how
reliable are they?
▪ Evaluate the percentage of people with coverage by
region and available network speed with a particular
focus on the differences between rural and urban
areas and projected changes over the next 2-3 years
Analyses to conduct
How much of the country actually
uses mobile services?
▪ Examine trends in the percentage of adults with
mobile phone subscriptions and mobile internet
access across regions with a focus on rural vs. urban
How often are these services
used?
▪ Examine frequency of use and types of plans
1.3 Level of
adoption

4
Digital finance readiness assessment framework detail (2 of 6)
Questions Functional area
2. Adoption
and reach
of digital
finance
infra-
structure
2.1 Overall
financial sector
readiness
2.2 Digital
finance
readiness
Phase
What products does the financial
sector offer?
▪ Describe products/services offered and their distribution
What types of digital finance
products exist?
▪ List digital finance products (distinguish between payment,
savings, credit, insurance etc.)
Analyses to conduct
2.3 Level of
digital finance
adoption
How many adults have adopted
digital finance products?
What are these products used for?
▪ Determine the percentage of adults using digital finance
products, the percentage of transactions (payment,
savings, insurance) done via them, and reasons for any
low levels of adoption
How many adults and businesses
would be open to using digital
finance products?
▪ Determine the percentage of adults and businesses
familiar with and open to using digital finance
▪ Evaluate this across regions with a focus on urban vs. rural
What is the competitive landscape
in the financial sector and how is it
changing?
▪ Describe the industry’s structure (number and size of
national and regional players), the role and reach of non-
traditional financial players, competitive dynamics, and
where experts see the industry going
What access to them do different
segments of the population have?
▪ Evaluate access to different financial products/services
across regions
How are these products distributed
and what are the minimum
requirements for use?
▪ Describe reach of typical distribution channel
What types of providers offer digital
finance products and how might the
landscape change over the next few
years?
▪ Map products to different types of providers (e.g.,
traditional financial institutions, telcos, microfinance)
▪ Describe major product, technology, and distribution trends

5
Digital finance readiness assessment framework detail (3 of 6)
Questions Functional area
3. Role of
the
govern-
ment and
regulation
3.1 Relevant
financial and
telco regulation
3.2 Government
support
Phase
What are government digital
finance regulations?
▪ Examine additional rules specific to digital finance entry,
operations, and end users; these include partnership
requirements to offer products, architecture
(interoperability requirements), e-payment, product
offerings, accounting practices, anti-money laundering,
who can act as agents, and KYC regulation
▪ Identify regulatory gaps and barriers preventing or
slowing the implementation of DF+
What are government regulations
around information tracking?
▪ Examine rules about what data digital finance providers
can keep, use, and sell
What are government finance
regulations?
▪ Examine the rules on who can offer what products and
how they must be sold, and the clarity of these rules
Analyses to conduct
Does the government help expand
mobile/digital payment
infrastructure?
▪ Research on budget and subsidies allocated to these
infrastructures
▪ Identify policies that would help the spread of DF+
Does the government take action
to increase the number of digital
finance players?
▪ Evaluate of awareness raising and budget allocated to
organizations for digital finance
▪ Form qualitative view of the encouragement of new
entrants and joint ventures
3.3 Use of DF+
by the
government
Does the government use digital
finance products?
▪ Identify government benefit programs/transfer schemes
that actively use DF+ (and other spending and salary
payments)

6
Digital finance readiness assessment framework detail (4 of 6)
Questions Functional area
4. Sector
analysis
and
challenge
identifi-
cation
4.1 Sector
description
4.2 Sector
impact on low-
income
households
Phase
4.4 Sector
challenges
What is the overall value chain
for the industry and structure at
each step?
▪ Describe actors and industry structure (number of
players, size, and competitive dynamics) for each
relevant step
What is the role of the
government in each step of the
value chain?
▪ Describe the role of public financing/provision,
subsidies, and relevant regulation
What is the significance of the
sector in the country’s economy?
▪ Determine the percentage of GDP accounted for by
sector, the percentage of workforce employed within
the sector, quality of services, productivity and
competitiveness accounting for regional variance and
international comparisons
What trends will shape the
sector?
▪ Describe relevant policy, technology, and macro
changes
What services are and are not
provided to low-income
households and what determines
access to these services?
▪ Describe actual services delivered to low-income
households and identify the variation in provision by
geography, income, and other attributes
What are the key challenges
in the sector?
▪ Overview of key shortcomings in the sector along the
value chain
Analyses to conduct
4.3 Sector-
specific actors
and regulation
What is the sector-specific
regulation affecting the delivery
of services?
▪ Describe sectors specific regulation, including
competitive regulation, product regulation , access
regulation, minimum service standards, customer
protection etc.

7
Digital finance readiness assessment framework detail (5 of 6)
Questions Functional area
5. Asses-
ment of
financial
service
needs and
gap
analysis
5.1 Financial
service needs
along the value
chain
5.2 Financial
gap analysis
along the value
chain
Phase
5.3 Barriers to
provision of
financial
products
What financial service gaps exist
at each step of the value chain?
▪ Evaluate financial service needs not being served at
all by current products or being served inadequately
across regions and provide a view of what existing
services are missing
How would the closing of each
gap increase accessibility and
affordability?
▪ Develop a perspective on which gap closings would
have the highest impact
What type of financial needs
exist for interactions across the
value chain?
▪ Evaluate financial product needed at each step
(payment access, financing, mediation, market
information, insurance, savings, etc.) and key
attributes of identified service (speed, simplicity,
timing, etc.)
What barriers to the provision of
the identified financial services
exist?
▪ Identify barriers, including a lack of physical financial
infrastructure (agent network/brick and mortar
financial institutions), information asymmetry between
actors, a lack of a cost-effective provision of the
financial service, etc.
Analyses to conduct

8
Digital finance readiness assessment framework detail (6 of 6)
Questions Functional area
6. Digital
finance
plus
solution
feasibility
6.1 Potential
applications of
DF+ to address
barriers
6.2 Viability of
observed and
potential
business
models
Phase
Is there a feasible business
model for the product?
▪ Evaluate if there could be a financially viable business
model for this product given sector dynamics
Is there a feasible go-to-market
model to introduce this product?
▪ Evaluate go-to-market model that could achieve
necessary scale
Could a digital finance product
address the market failure?
▪ Determine if an existing or novel digital finance
product could address the market gap and overcome
the identified barriers
Analyses to conduct
What capabilities would be
necessary for a business to
successfully implement this
model?
▪ Develop perspective on capabilities and distribution
network necessary for a company to implement go-to-
market model and business model
How do those capabilities
compare with those of existing
enterprises?
▪ Map current provider capabilities to required ones
Are there actors capable of scal-
ing the existing business model?
▪ Identify the landscape of the actors in the sector and
evaluate scaling efforts6.3 Scaling and
execution
capabilities

9
Agenda
Readiness framework
Sector analysis – agriculture
Sector analysis – health
Sector analysis – energy
Sector analysis – education
Sector analysis – water
Access to and reach of mobile infrastructure
Adoption and reach of digital finance infrastructure
Role of the government and regulation

10
Summary of mobile infrastructure readiness assessment
1.1 Technical infrastructure readiness
• Tanzania’s four nation-wide MNOs operate a series of networks and standards ranging from 2G to
3.5G networks
• The penetration of these networks ranges from selected cities on 3.5G networks to 85% of the
population on 2G networks
• All major MNOs have committed to and are in the process of making major capital investments in 4G
networks, while continuing to expand coverage of existing 2G networks
1.2 Telco industry readiness
• Tanzania’s telco industry features 4 main competitors, Vodacom, Airtel, Tigo, and Zantel, with the first
3 accounting for 90% of the subscriber base
• Strong four-way competition has led to competitive prices and continued product innovation, with all
players offering mobile money and selected players launching mobile savings and credit products
1.3 Level of adoption
• Mobile phone adoption in Tanzania currently stands at ~60% and, below the regional average of 74%
• However, penetration over the past 4 years has been growing at approximately 10-12% per annum
• The continued extension of network coverage, declining mobile phone costs and growing household
income are expected to raise penetration to 70-80% over the next 2-3 years

11
Tanzania has been rapidly extending mobile coverage,
which has allowed the country to rapidly catch up to its peers
1.1 TECHNICAL INFRASTRUCTURE READINESS
SOURCE: Telegeography; press
Percentage of population living in areas with mobile
phone coverage
%, 2013
Overall assessment
Percentage of population living
in areas with mobile phone
coverage
%, historically
… but coverage is quickly increasing
Tanzania’s mobile coverage is slightly lower
than that of its peers …
Type of network,
% of population
covered
Ethiopia
Ghana
Kenya
Nigeria
Rwanda
South Africa
Tanzania
Uganda
India
Bangladesh
Pakistan
Myanmar
• Tanzania lags its peers in mobile
phone coverage, with 15% of the
population living without access to
a mobile network
• At the same time, mobile coverage
has been growing at close to 20%
per annum over the past 3 years
• Mobile coverage is expected to
reach 90+ % of the population by
2016
99
99
99
95
95
95
90
90
87
85
60
35
85
75
60
50
1312112010 2016
90++19% p.a.
70
85
3G2G

12
Tanzania’s MNOs operate a series of networks covering 60
to 85% of the population, depending on network generation
1.1 TECHNICAL INFRASTRUCTURE READINESS
2G 3.5G 1G 3.5GGene-
ration
2.5G 2.5G 3G 2G 2.5G 2.5G 3G 3.5G 2.5G 2.5G 3G 3G2G 3.5G
Platform GSM GSM GSM W-CDMA W-CDMA ETACS GSM GSM GSM W-
CDMA
W-
CDMA
W-
CDMA
GSM GSM CDMA2000 CDMA2000 W-CDMA W-CDMA
Evolution None GPRS EDGE None HSDPA None None GPRS EDGE None HSPA+ DC-
HSPA+
None GPRS 1x 1xEV-DO None HSPA+
Frequency 900/1800 900/1800 900/1800 Unknown Unknown 900 900/
1800
900/
1800
900/
1800
- - - 900/1800 900/1800 800 800 Unknown Unknown
Launch Nov-01 Apr-06 Apr-06 Dec-08 Dec-08 Sep-94 Aug-00 Aug-06 Aug-06 Q1 2011 May-13 Sep-13 Aug-99 - Nov-06 Nov-06 May-12 May-12
Status Live Live Live Live Live Shut
down
Live Live Live Live Live Live Live Live Live Live Live Live
Network
Details
Jan-14:
~85%; Dec-
11: 65-70%
(est.)
Jan-14:
88%; Dec-
11: 65-70%
(est.)
Jan-14:
~75%; Dec-
11: 65-70%
(est.)
Jan-14:
70% (est.);
Sep-11: Dar
es Salaam
Jan-14:
~70% (est.),
Sep-11: Dar
es Salaam
- Jan-14:
85%
(est.);
Dec-11:
67%
(1,173
BTS);
Dec-10:
63%
(1,057
BTS);
Dec-09:
60%
Jan-14:
80%
(est.);
Dec-11:
62%
(est.);
Dec-10:
60%
(est.)
Jan-14:
50%
(est.);
Dec-11:
35%
(est.);
Dec-10:
30%
(est.)
Jan-14:
70%
(est.)
Jan-14:
~20
cities
and
towns
(est.)
Jan-14:
only
selected
city
centers
Jan-14:
70% (est.);
Dec-11:
60% (est.);
Sep-10:
50% (est.)
Jan-14:
~50% (est.),
main towns
and cities
only
Jan-14:
Zanzibar,
Pemba, and
Dar es
Salaam
Jan-14:
Zanzibar,
Pemba, and
Dar es
Salaam
Jan-14:
Zanzibar
only (plans
expansion
to Dar es
Salaam and
other cities)
Jan-14:
Zanzibar
only (plans
expansion
to Dar es
Salaam)
2G 4G2.5G 2.5G 3G 3.5G 3.5G
GSM GSM GSM W-
CDMA
W-
CDMA
W-
CDMA
LTE
None GPRS EDGE None HSDPA HSUPA None
900 900 900 2100 2100 2100 800/
1800
Jul-99 Apr-06 Jul-07 Feb-07 Feb-07 Feb-07 -
Live Live Live Live Live Live In
deploy-
ment
Jan-14:
85%-90
(est.);
Dec-11:
75.8%
Jan-14:
85%-
90%
(est.);
Dec-11:
75.8%
Jan-14:
>50%
(select-
ed towns
and
cities)
Jan-14:
70%
(est.);
available
in
around
40 towns
and
cities
Jan-14:
70%
(est.);
available
in
around
40 towns
and
cities
Jan-14:
70%
(est.);
available
in
around
40 towns
and
cities
Laun-
ched six-
month
trial in
Msasani
Penin-
sular
district of
Dar es
Salaam
with
NSN in
Jan-13
2G network at ~85% 2G network at ~85% 2G network at ~85% 2G network at ~70%
SELF-REPORTED FIGURES MIGHT BE OVERSTATED

13
93 7
The top four MNOs in Tanzania own 99% of the mobile
market (1/2)
1.2 TELECOM INDUSTRY READINESS
Assessment
Number of mobile phone providers in Tanzania
Growing number of providersHigh market shares of top three operators
2013
8
12
8
11
7
2010
7
Market share of top 3-5 players, %Number of MNOs1 No
84 15
93 7
83 17
100
1 Mobile network operator
SOURCE: WCIS
98
2
82 17
Tigo Tanzania 6,297
52
Zantel 1,803
8,996
Vodacom Tanzania 10,289
Benson Informatics
0
Smile Tanzania
0Telesis
Hits
1
3
Sasatel 4
TTCL
Airtel Tanzania
Number of subscribers
000s
100
55 24
1089
72 28
100
4
12
8
8
3
Ghana
Kenya
Nigeria
Rwanda
South Africa
Tanzania
Uganda
5
6
1Ethiopia
1
1
1
1
India
Bangladesh
Pakistan
Myanmar
Top 3
Top 4
Top 3
Top 3
Top 5
Top 3
Top 5
Top 3
Top 5
Top 3
Top 5
Top 3
Top 5
Top 1
Top 3
Top 3
Top 3
Top 1
Top 5
Top 5
Top 5
MNO
• Tanzania’s mobile phone industry is dominated
by 4 relevant players that control more than 99%
of the market; this consolidation is similar to that
observed in peer countries
• The number of providers has roughly stayed the
same over the past few years
• All major providers cover the key population
centers allowing for significant competition

14SOURCE: WCIS; Telegeography; BMI
Assessment
Airtel
Benson
Tigo
Zantel
Vodacom
Tanzania
Number of subscribers
000s; 2013
0
0
10,289
8,996
4
52
3
1
6,297
1,803
TTCL
Smile1
Description/history
Telesis
1 Smile is a wireless broadband operator, it does not offer voice services
Hits
Sasatel
Tanzania’s MNOs have taken different strategies to acquire and retain customers
• The Tanzanian mobile phone market
features strong competition with
incumbents and new entrants
actively competing for market share
• Players compete <_> diverse
strategies including innovative
service offering (Vodacom), network
coverage (Airtel), and low pricing
(Zanzibar Telecom)
• Ahead of competition on introducing innovative
services but only regains subscribers after
2011/2012 loss
• Substantial investments resulted in the widest
mobile broadband coverage, but high prices
limit service uptake
• Aggressively expanding coverage, low tariffs,
and promotions enable it to quickly gain
market share
• Owns modern infrastructure, capable of
providing fast data services, but reliance on
CDMA blocks smooth migration to LTE
• High prices and limited coverage prevent quick
customer uptake despite modern infrastructure
• Simple tariffs and affordable broadband
enable growth but lack of scale prevents fast
expansions
• 20 years of mobile experience in Tanzania
combined with developed infrastructure
enables it to maintain third place in the market;
recently aggressive in marketing
The top four MNOs in Tanzania own 99% of the mobile
market (2/2)
1.2 TELECOM INDUSTRY READINESS

15
Tanzania’s MNOs offer an advanced set of digital finance
products
SOURCE: GSMA “Mobile Money Tracker”; Operators websites
Similar services offered by playersSimple mobile payments offering
Rwanda
Ghana
Kenya
Tanzania
Uganda
0
1
1
2
3
3
3
4
4
4
4
7
0
0
1
1
0
0
0
1
1
3
3
0
Simple digital
payment
product1
Advanced
digital
payment
product2
Number of MNOs offering digital finance products Description of product offering for biggest telco providers
Airtel
MIC
Tanzania
Limited
Vodacom
Tanzania
Zantel
South Africa
India
Nigeria
Bangladesh
Pakistan
Ethiopia
Myanmar
Basic Advanced
1 Simple: operator offers only bill payments, airtime top up, domestic money transfers, bulk payments, merchant payments
2 Advanced: in addition to the above, operator offers services such as loan repayments, debit, insurance, other banking products
Assessment
• Vodacom leads
the digital financial
service innovation
in Tanzania
offering the
broadest digital
finance product
portfolio
• Tanzania’s telco
industry compares
favorably with
other countries
based on its
offering of digital
finance products
1.2 TELECOM INDUSTRY READINESS

16
Mobile phone access remains relatively expensive in Tanz-
ania, smaller players/new entrants provide lower price options
Assessment
5
10
11
6
5
14
70
50
45
54
50
47
6
6
5
5
4
3
Cost per
sec1
Cost per
SMS
Cost per 1
MB2
Airtel
Benson
Tigo
Zantel
Vodacom
Tanzania
New entrants and smaller players are providing lower cost
options
SOURCE: WCIS; company websites
TTCL
Smile3
1 For calls to other networks (off-net); 2 Based on monthly bundled plan of 5GB except Smile for which 3GB data plan was analyzed;
3 Smile Tanzania offers only mobile broadband services
n/a n/a
n/a4
5
7
8
10
11
13
14
Cost of comparable monthly prepaid access1
USD at PPP
n/a
n/a
n/a
n/a
South Africa
Tanzania
Uganda
Nigeria
Ethiopia
Kenya
Rwanda
Ghana
Pakistan
Bangladesh
India
Myanmar
Mobile phone access remains relatively expensive
in Tanzania
• Tanzania’s mobile
phone sector offers
a healthy set of
prices with new
entrants providing
low-cost
alternatives to
incumbents
1.2 TELECOM INDUSTRY READINESS
in TZS

17
Mobile phone penetration in Tanzania remains below peer
average, however penetration is rising quickly
1.3 LEVEL OF ADOPTION
12
27
58
60
63
67
69
70
72
73
109
138
2
3
1
1
2
2
1
1
9
n/a
n/a
n/a
Mobile pene-
tration1
% of population
Mobile
internet
penetration
% of population
1 Not adjusted for multi-SIMming, i.e., individuals may own more than one SIM card and be counted multiple times
60
55
50
42
201312112010
+12% p.a.
Overall assessmentGrowing mobile penetrationTanzania’s mobile penetration is similar to its peers
Ghana
Nigeria
South Africa
Tanzania
Kenya
Mobile penetration
% of population
SOURCE: Analyses Mason; WCIS
Uganda
India
Rwanda
Bangladesh
Ethiopia
Pakistan
Myanmar
2013
• Tanzania’s mobile phone
penetration is below its regional
peers
• Over the past 3 years, Tanzania
has added approximately 5% of its
population to the subscriber base
annually
• Often penetration does not fully
reflect true access of different
people within a household, leaving
some question as to female access
to services

18
Access to mobile phone for rural, unbanked, and low-income
households is substantially lower than middle-/high-income households
Tanzania’s mobile phone access differs by household groups
SOURCE: FITS household survey
2012
• A substantial gap in mobile
phone access exists
between the group of
rural/unbanked/low-income
households (55-57%) and
the group of middle-/high-
income households (76%)
Household
consumption
above$2/day
Rural
Unbanked
Household
consumption
below $2/day
76.0
57.0
58.0
55.0
63.0
Households
that have or
can borrow a
mobile phone
Assessment
Percentage of total households
1.3 LEVEL OF ADOPTION

19
Agenda
Readiness framework
Adoption and reach of digital finance infrastructure
Role of the government and regulation
Sector analysis – agriculture
Sector analysis – health
Sector analysis – energy
Sector analysis – education
Sector analysis – water
Access to and reach of mobile infrastructure

20
Summary of digital finance infrastructure readiness
assessment
2.1 Overall financial sector readiness
• Tanzania’s banking sector includes 50 licensed banks and a number of regulated and unregulated
microfinance institutions
• Despite the large number of licensed institutions, the formal banking sector serves only 14% of the
population, focusing predominantly on the urban salaried workers and commercial lending
• A number of attempts by large commercial banks to extend their products to the unbanked have
resulted in significant write-offs and their subsequent withdrawal from this segment
• Micro-finance institutions are the only players extending significant credit to low-income households,
credit procedures and collateral / guarantor requirements are however burdensome and constitute a
serious barrier to credit
2.3 Level of digital finance adoption
• Mobile money has experienced exponential growth over the past 5 years
• Starting from virtually no use in 2009, mobile money uptake has increased to over 11 million users in
2013, which equals 49% of the adult population
• Key uses of mobile money are sending and receiving money (predominantly from remittances
payments,) which account for almost 70% of all mobile money transactions
2.2 Digital finance readiness
• A notable barrier to mobile money adoption is still the lack of access to mobile phones for significant
parts of the population
• Rural penetration of mobile money remains relatively low and account activitiy while growing is still
low

21
10
14
19
40
50
Uganda
Rwanda
South Africa
Kenya
Tanzania
Tanzania’s banking sector includes 50 licensed banks, with the top 10
banks accounting for ~75% of lending and ~85% of deposits
Number of licensed banks
Assessment
255,553
303,036
319,813
399,950
413,818
438,583
491,904
654,446
1,354,770
1,806,865
444,562
313,715
556,359
686,711
700,927
886,162
1,291,335
2,288,263
2,582,328
3,918,095
20.6
15.4
7.5
5.6
5.0
4.7
4.6
3.6
3.5
2.9
23.4
15.4
13.7
7.7
5.3
4.2
4.1
3.3
2.7
1.9
2.1 OVERALL FINANCIAL SECTOR READINESS
…and market share is split among the leaders
M/s, %
Top 10 banks hold 73.3% of the loan market
Top 10 banks hold 83.6% of the deposit market
Top 10 banks in Tanzania by deposits, 2012
Top 10 banks in Tanzania by loans, 2012
Total loan volume in TSH millions
Total deposit volume in TSH millions
Tanzania has more banks than its peers…
• Tanzania has a diverse
banking sector with over 50
licensed players
• While the formerly state-
owned banks still dominate,
a number of regional and
international banks have
achieved considerable
market share
SOURCE: Bank of Tanzania

22
Tanzania’s banking sector has become more competitive,
but it still lags peer countries
0.56
0.30
0.10
0.35
0.47
0.27
0.11
0.19
Ethiopia
Kenya
Uganda
Bangladesh
Tanzania
Ghana
Nigeria
India
Rwanda
South Africa
n/a
2005 2010
0.59
0.36
0.31
0.29
0.27
0.24
0.22
0.16
0.15
0.15
• Tanzania’s
competitiveness
has substantial
improved over the
last couple of
years
• Compared to ist
regional peers
especially South
Africa and Rwanda
competitiveness
remains low
Top 3 banks’ market power (Lerner index) Assessment
2.1 OVERALL FINANCIAL SECTOR READINESS
SOURCE: Tanzania Banking Survey
23
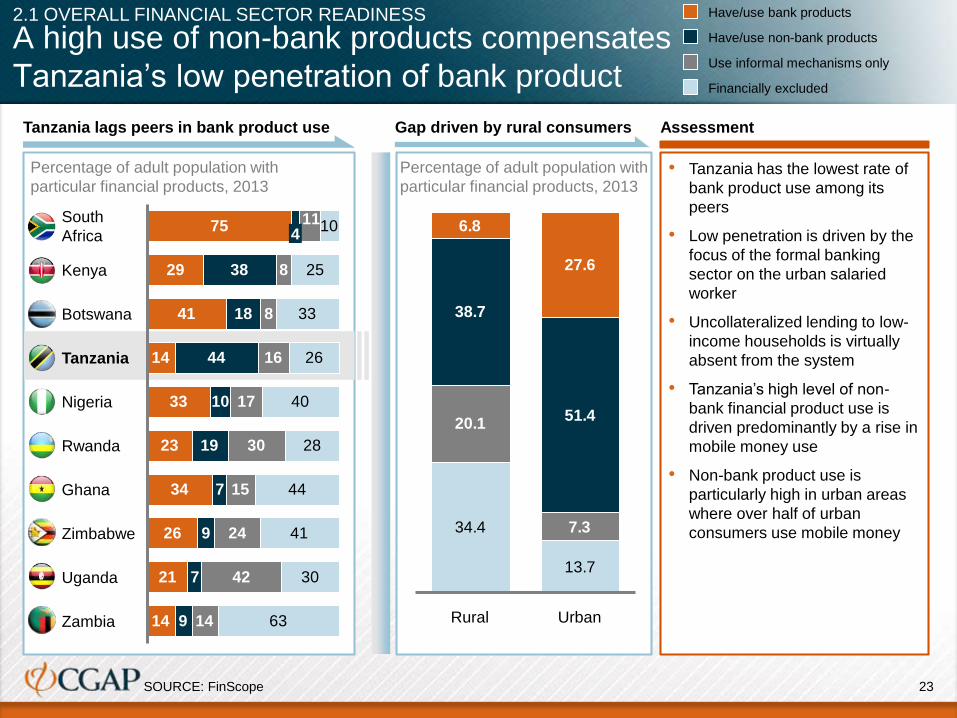
A high use of non-bank products compensates
Tanzania’s low penetration of bank product
Assessment
29
41
14
33
23
34
26
21
14
38
18
44
10
19
7
9
7
9
8
8
16
17
30
15
24
42
14
10
25
33
26
40
28
44
41
30
63
75 11
Rwanda
Nigeria
Zambia
Uganda
Zimbabwe
Ghana
South
Africa 4
Tanzania
Botswana
Kenya
Financially excluded
Use informal mechanisms only
Have/use non-bank products
Have/use bank products
34.4
13.7
20.1
7.3
38.7
51.4
6.8
27.6
Rural Urban
Tanzania lags peers in bank product use Gap driven by rural consumers
2.1 OVERALL FINANCIAL SECTOR READINESS
• Tanzania has the lowest rate of
bank product use among its
peers
• Low penetration is driven by the
focus of the formal banking
sector on the urban salaried
worker
• Uncollateralized lending to low-
income households is virtually
absent from the system
• Tanzania’s high level of non-
bank financial product use is
driven predominantly by a rise in
mobile money use
• Non-bank product use is
particularly high in urban areas
where over half of urban
consumers use mobile money
Percentage of adult population with
particular financial products, 2013
Percentage of adult population with
particular financial products, 2013
SOURCE: FinScope

24
MFIs are the only financial institutions extending significant credit to
low-income households
Tanzania market profile
MFIs Borrowers
AccessBank – TZA 15,819
Akiba 27,111
BRAC – TZA 104,225
ECLOF – TZA 5,051
Equity Bank Tanzania 7,176
FINCA – TZA 82,288
IDYDC -
K–Finance 572
MBF 2,478
Mbinga Community Bank 6,053
Mtoni 1,351
MuCoBa 5,601
Mwanga Community Bank 8,314
NMB -
Opportunity Tanzania 8,959
PRIDE – TZA 100,055
PTF 6,108
SEF – TZA 1,198
SELFINA 7,746
Tujijenge 8,265
Victoria Finance 155
VisionFund TZA 33,394
YOSEFO
Loans
USD
32,596,119
46,766,487
20,267,459
1,467,041
60,487,310
29,593,107
354,157
194,029
212,031
908,172
2,004,364
4,024,608
5,140,608
773,508,940
6,206,129
37,028,179
1,147,468
263,569
4,002,088
775,268
342,857
7,080,836
2,521,617 18,120
1. NGO MFI
(not regulated)
2. Microfinance companies
(regulated by BoT with lower capital
requirements than regular banks)
3. Commercial and community banks
(regulated by BoT)
4. Savings and credit cooperative
societies
(regulation limited to annual audit)
Tanzania recognizes 4 types of
microfinance institutions with
different levels of regulation
Lending to low-income households
requires:
- Significant collateral
- Multiple guarantors
- An involved application process
with often multiple visits
- rates vary between 30-80 p.a.
2.1 OVERALL FINANCIAL SECTOR READINESS
SOURCE: Tanzania Banking Survey

25
Tanzanian access to formal sector finance has increased in
recent years largely because of the adoption of mobile money
Adults served
by the
non-bank
formal sector
Banked adults
55.9
13.1
13.8
9.1 6.3
Insurance
13.0
49.0
1.1
Use mobile
money
4.5
MFI/SACCOS
member
4.4
Assessment
13.6m
2.8m
3.4m
1.9m
11.9m
0.2m
3.1m
1.3m
Percent
1.1m
1.0m
% of adults 2009% of adults 2013
This increase in non-bank service is driven
by mobile money
Growth has been driven by the non-bank
formal sector
2.2 LEVEL OF DIGITAL FINANCE ADOPTION
• The rise of mobile
money is driving
Tanzanians’ increased
financial access
• Banks and insurance
providers have also
played a substantial role
in this rise as each
industry increased users
by over 1 million
between 2009 and 2013
• MFI/SACCOS
membership remained
relatively constant,
suggesting enrollment
may have plateaued
SOURCE: FinScope

26
Approximately 70% of mobile money users predominantly
use the service to send or receive money
25.6
Pay bills,
fees, and
business
transactions
37.6
Save or store
money
33.1Send money
Receive money
9.9
Assessment
8.0
Percent
2.4
Uses of mobile money
2.2 LEVEL OF DIGITAL FINANCE ADOPTION
• While mobile money
has seen significant
growth, subscribers
predominantly use it
for sending and
receiving money
• Efforts to expand
usage to general
business transactions
are in early stages
11.9
Use mobile
money
9.1
6.2
SOURCE: FINSCOPE
Millions, in million Households, in
million

27
Use of mobile money differs substantially between
rural/unbanked/low-income and mid-/high-income households
Tanzania’s mobile money penetration
SOURCE: FITS household survey
• Tanzania’s mobile phone
penetration is in line with its
peers
• Over the past 3 years,
Tanzania has added
approximately 5% of its
population to the subscriber
base
• Often penetration does not
fully reflect the access of
different people within the
household, leaving some
question as to female access
to services
Household
consumption
above$2/day
Rural
Unbanked
Household
consumption
below $2/day
53.0
29.0
29.0
25.0
35.0
Mobile money
user in houshold
Assessment
2.2LEVEL OF DIGITAL FINANCE ADOPTION
2012, Percent

28
Of the non-users of mobile money, the majority quote the
lack of a mobile phone as the key barrier
Assessment
PercentFor products beyond payment, more fun-
damental product questions need to be
addressed first, not addressed in chart
The lack of a mobile phone is the main
barrier to mobile money adoption
2.3 DIGITAL FINANCE READINESS
• The lack of a mobile
phone remains a
serious obstacle to
adoption for mobile
payments
• For other mobile
products such as
insurance and credit,
knowledge of the
product itself is the key
barrier
• Digital finance can
address these problems
more effectively than
bricks and mortar
branches by using
mobile technology to
educate and reach
potential consumersHigh fees
Knowledge
about registration
4.5
8.3
Distance to mobile
money agent8.5
Don’t have
mobile phone60.4
4.8
5.6
Don’t know
product
Cannot
afford15.4
Does notknow howit works
Does notknow whereto purchase
64.2
Insurance
Credit product
8.0
Don’t know
product
Cannot
afford35.2
Does not
know where
to purchase
37.5
SOURCE: FinScope

29
Agenda
Readiness framework
Sector analysis – agriculture
Sector analysis – health
Sector analysis – energy
Sector analysis – education
Sector analysis – water
Role of the government and regulation
Access to and reach of mobile infrastructure
Adoption and reach of digital finance infrastructure

30
The telco industry is regulated by the Tanzanian Communication Regula-
tory Authority that is implementing a series of key regulatory initiatives (1/2)
Telco regulatory framework
• Tanzanian Communication
Regulatory Authority
• Provide effective
competition
• Protect consumer interest
• Regulate rates and
changes
• Manage radio frequencies
Stability • In place since 2003, and
has introduced significant
regulation
i. Interconnection fees regulation
Termination charge set by TCRA, TZS
• Significant focusing of lowering termination charges to
increase competition among mobile phone subscribers
• Introduction of rate schedule that is designed to reduce
termination charges from 112 TZS to 26.96 TZS by 2017
26.9628.5730.5832.4034.12
112.00
2017161514132012
Telco
Regulatory playing field Key regulatory initiatives
3.1 RELEVANT FINANCIAL AND TECLO REGULATION
Regulator
Task

31
The telco industry is regulated by the Tanzanian Communication Regula-
tory Authority that is implementing a series of key regulatory initiatives (2/2)
Telco regulatory framework
ii. Mobile SIM registration
Telco
Key regulatory initiatives
• Compulsory registration of all active SIM cards
nation-wide
• Hosted June 2009, final deadline postponed to 2013
• Disconnection of 650,000 subscribers for failure
to register
iii. Mobile number portability
• Regulatory initiative to enable the portability of
mobile numbers when switching MNOs
• Part overall reform package aimed at increasing
competition between MNOs
• Originally planned for 2013, postponed to 2014 to
allow for technical implementation
iv. Universal Service Access Fund
• Dedicated financing vehicle to increase mobile
connectivity in rural areas
• Bid-based tenders for subscribers to expand
coverage to underserved areas
• A number of contracts awarded in 2013 to all
four major MNOs
3.1 RELEVANT FINANCIAL AND TECLO REGULATION

32
The banking sector is regulated by the Bank of Tanzania
Banking regulatory framework
• Bank of Tanzania
• Prudential regulation
• Operational guideline and
regulation
• Sector-wide and player-
specific risk management
• Further financial inclusion
• Regulator for over 15 years
i. Credit bureau
• The BoT has recently licensed two credit bureaus to
compile data from all licensed banks and MFIs
• Credit bureaus are currently establishing reporting
relationships
Telco
Regulatory playing field Key regulatory initiatives
i. National ID card system
• Tanzania is introducing a national ID system that uniquely
identifies each citizen
• In conjunction with the credit bureau, this system is
expected to significantly raise credit provision
i. Agency banking
• The BoT has recently introduced a new agency banking
framework enabling the delivery of banking service through
licensed agencies
• Agency banking is expected to substantially lower cost and
widen access to financial services
Stability
Regulator
Task
3.1 RELEVANT FINANCIAL AND TECLO REGULATION

33
Agenda
Readiness framework
Sector analysis – agriculture
Sector analysis and challenge identification
Assessment of financial service needs and gap analysis
Digital finance plus feasibility assessment
Sector analysis – energy
Sector analysis – water
Sector analysis – health
Sector analysis – education
SOURCE: Source
Access to and reach of mobile infrastructure
Adoption and reach of digital finance infrastructure
Role of the government and regulation

34
Key takeaways: Agricultural sector analysis and challenge
identification
AGRICULTURE – SECTOR ANALYSIS AND CHALLENGE IDENTIFICATION
4.1 Sector description
4.3 Sector-specific actors and regulation
4.2 Sector impact on low-income households
4.4 Sector challenges
• The Agriculture sector suffers from low productivity, which can be understood by evaluating several drivers across the
value chain (land, inputs, mechanization, extension, aggregation, marketing), including
– Small average plot size per farmer relative to peers, lack of widespread access to improved seeds and fertilizer, weak
irrigation infrastructure, inadequate provision of extension services, low access to agronomic information, and low
producer prices due to lack of bargaining power and poor dissemination of market information
• The government has recently relaxed its regulation of the sector – farmers are able to circumvent the burdensome
(government-controlled) cooperative legislation to self-organize into free-enterprise associations. Export restrictions on
cereals have also been relaxed, enabling farmers to net higher incomes
• However, there is still inadequate public investment in the sector – the government has only dedicated 6% of the
national budget to the sector, falling short of its 10% commitment under the Maputo Declaration
• The great majority of farmers in Tanzania are smallholders – there are estimated to be more than 5 million farming
households in the country
• A majority of smallholders are subsistent agriculturalists – they consume a majority of what they produce and bring a very
small surplus to market
• Tanzania is highly dependent on agriculture for economic output and employment, as it constitutes 27% of GDP and
accounts for ~75% of employment
• Two out of three Tanzanian farmers produce food crops - 85% of cereal production consists of maize and rice (paddy),
which are the two most important crops
• The sector has several stakeholders – inputs (seeds, fertilizer, chemicals) are supplied by major international input
companies and local agro-dealers, production is mostly done by smallholder farmers, with a few large-scale commercial
farms for cash crops (e.g., horticulture, legumes), extension support is provided by the Ministry of Agriculture,
aggregation (where it exists) is done by producer associations, and marketing is done by traders; several local and
international NGOs also play along the value chain

35
Tanzania is highly dependent on agriculture for economic output
and employment, similar to other developing economies in Africa
SOURCE: World Bank (2010); CIA Factbook; team analysis
Other
75
5
20
Agriculture
100% =
2011
Industry
Services
25.59 million
employed
With a strong majority of the workforce employed by agriculture, this sector will be critical to reducing poverty
4.1 AGRICULTURE – SECTOR DESCRIPTION
Mozambique
5%
10%
15%
20%
25%
30%
35%
250 500 750 1,000 1,250 6,000 10,000 50,000
0%
-5%
0
Tanzania
Kenya
Uganda
Zambia
China
South
Africa
Brazil
USA
GNI/Capita
% of agriculture contribution in national GNI Workforce breakdown by sector, %

36
100
90
80
70
60
50
40
30
20
10
0
2020E2015E20102000
The majority of agricultural activity is focused on cereal
production
SOURCE: Kilimo Kwanza; ASDP; ASDS; CAADP Compact. CIA Factbook; FAO (2013)
Market value by
agricultural product
%
Area planted by crop
type
100% = 8.8 million ha
Area planted by
cereal type
100% = 5.8 million ha
70
16
10
4
Maize
Paddy
Sorghum
Millet
Wheat
2010
1
72
15
8
6
Crops
Livestock
Hunting and
forestry
Fishing
2010
100% =
TZS 4.1 trillion
66
11
11
7
Cereals
Pulses
Oil seeds &
oil nuts
Cash crops
Roots & tubers
Fruits &
vegetables
2010
31
Agriculture
Services
Manufacturing/Industry
Key takeaways
Real GDP by sector
%• Agriculture
contributes a
significant share to
GDP, although the
relative GDP
contribution is
projected to
decline over time
• Cereal production
comprises the
largest share of
agricultural
production, with
maize being the
most important
crop
4.1 AGRICULTURE – SECTOR DESCRIPTION

37
The Tanzanian agriculture sector suffers from low productivity
as evidenced by the poor yields in its major crop
SOURCE: Ministry of Agriculture; FAO (2013); FAOSTAT
Tanzania scores at the bottom of its peers in maize yields
Zambia 2,244
Uganda 2,686
Mozambique 854
Tanzania 1,366
Kenya 1,393
Malawi 1,650
Ghana 1,737
Ethiopia 2,137
749
1,667
2,193
1,240
1,871
3,059
2,655
2,499
2008 2012
CAGR
%
-2
4
9
2
7
5
-2
-3
Maize yield
Kg/ha
Key takeaways
• One of the major
impediments to agricultural
growth is the low
productivity of land and
labor
• Maize yields of 1.2 MT/ha
are ~40% lower than
peers’ average
• Tanzania’s maize
productivity has declined
even as peers have
registered large
productivity gains over a 5-
year period
• Key factors driving the
poor performance include
– Low public expenditure
on R&D, inadequate
financing, poor
production techniques,
underdeveloped
markets, poor rural
infrastructure
4.1 AGRICULTURE – SECTOR DESCRIPTION

38
Growth in the agricultural sector is hindered by a number of
bottlenecks along the value chain and beyond
▪ Small arable land
utilization: only
30% of potentially
productive area
under agricultural
production
▪ Limited average
plot size:
smallholders
control 0.9-3.0 ha
on average
▪ Onerous
administrative
procedures:15-
step process to
obtain a land title
▪ Inconsistently
enforced land
rights
▪ Low fertilizer
application: Only 9
kg/ha used, ~40%
lower than peer
average
▪ Weak demand for
improved seeds:
farmers are unable
to purchase even
limited offerings on
market, only
absorbing 40% of
stock
▪ Underdeveloped
capacity of agro-
dealers: lack of
business skills and
unattractive margins
to serve
smallholders
▪ Inefficient
government input
subsidies: late
payments and non-
functioning vouchers
▪ Farmer information
constraints:
inadequate agrono-
mic knowledge on all
aspects of production
▪ Inadequate
extension services:
too little staff with
inadequate resources
and underdeveloped
capacity
▪ Low level of
mechanization: only
24% use animal
traction and 13% use
mechanical power
▪ Budget constraints:
insufficient allocation
and late
disbursement of
funds by government
to extension works
▪ Heavy reliance on
natural elements:
predominantly rain-
fed agriculture is
highly susceptible to
adverse weather
conditions
▪ Unavailability of
long-term storage:
only 1% of farmers
have access, forcing
remainder to sell at
low prices to avoid
spoilage
▪ Cash flow
constraints:
farmers have urgent
need for cash so
can’t afford to hold
produce
▪ Underdeveloped
physical
infrastructure:
dearth of all-weather
roads in rural
regions
▪ Low level of
private investment:
smallholders and
enterprises lack
access to financing
▪ Weak market
linkages:
underdeveloped
relationships
between agro-
processors and
producers,
especially in value-
adding schemes
Ch
all
en
ge
s
▪ Low level of
commercialization:
majority of produce
consumed in the
home
▪ Non-consolidated
aggregation/off-
take: fragmented
producer base with
weak negotiating
power
▪ Poor price
discovery: non-
transparent
commodity pricing
▪ Weak market
linkages:
underdeveloped
relationships
between agro-
processors and
producers
1 432 65
1.1
1.2
1.3
1.4
2.1
2.2
2.3
2.4
3.1
3.2
3.3
3.4
3.5
4.1
4.2
4.3
5.1
5.2
5.3
5.4
6.1
6.2
4.4 AGRICULTURE – SECTOR CHALLENGES

39
Several actors are involved in the agricultural value chain
Private
sector
Govern-
ment
FBO
NGOs
Key value-chain focus
Stakeholder Examples Land Input
Prod-
uction
Sto-
rage
Marke-
ting
Pro-
cessingDescription
Seed and
input
companies,
agro-dealers
Mix of international and local companies
import/produce seed, fertilizer, and crop protection
products; distribution happens at the local level by
agro-dealers
Commercial
farms
Large scale, mechanized crop production and value-
added processing ; could also involve model plots
and outgrower schemes for and knowledge transfer
initiatives to involve smallholders
Traders Small-scale traders purchase commodities at the
farmgate and sell them on to agro-processors (e.g.,
mills, food processors)
Warehouse
receipt
program
Warehouse operators provide infrastructure and tools
for fumigation, storage; and packaging of
commodities. Collateral managers also provide
receipt verification, financing, and deposit insurance .
Development
institutions,
social
enterprises
Organizations provide support to farmers and fund
initiatives all along the value chain, including by
providing inputs, giving agronomic and business skill
training, and enhancing market linkages
Extension
agents
Free locally based government agents providing
farmers with training on an ad hoc basis, including
through field demonstrations and test plots
Farmer
cooperatives,
SACCOs
Producer associations whose objectives include
increasing access to improved inputs, extension
services and market; some organizations, like
SACCOs, have a long history of effectively providing
loans and facilitating access to capital
4.4 AGRICULTURE – SECTOR CHALLENGES

40
Currently, Tanzania is only utilizing
~30% of 37 million hectares of arable land
SOURCE: FAOSTAT
Non-arable
50.5 mil ha (53%)
11
15
20
30
31
41
48
65
Mozambique
Zambia
Kenya
Ghana
Tanzania
Ethiopia
Uganda
Malawi
Share of arable land used under agricultural
production, %
Total arable
land
Million ha
Total Tanzania land
100% = 88.5 million haArable land utilization
100% =
Non-arable
Arable
2011
88,580
58
42
5
14
36
37
16
27
23
49
1
4.4 AGRICULTURE – SECTOR CHALLENGES

41
Key takeaways
3
1
5
17
18
32
36
42
Uganda
Mozambique
Tanzania
Ethiopia
Ghana
Zambia
Kenya
Malawi
SOURCE: Ministry of Agriculture; FAO; FAOStats; IFPRI
8
9
22
29
49
28
30
2
Tanzanian farmers make negligible use of fertilizers on their plots
2007 2011
CAGR
%
-8
-7
11
13
7
15
29
10
Fertilizer usage
Kg/ha
Tanzania has very poor usage of inputs: fertilizer
4.4 AGRICULTURE – SECTOR CHALLENGES
• Although fertilizer use
in Tanzania has gone
up in the past few years,
Tanzanian farmers continue to
apply ~40% less fertilizer/ha
than their peers’ average
usage
• Low fertilizer usage is driven
by a few factors
– Poor access to credit:
both farmers and
importers/wholesalers
suffer from financing gaps
– Farmer information
constraints: inadequate
agronomic knowledge on
proper use of fertilizer for
specific crop types and
ecological conditions
Related to
financing gap2

42
…as they face several challenges in accessing and purchasing
them, despite their many benefits
83
17
100% =
2011
37.2 M ha
Planted area with improved seeds, %
With improved
seeds
Without improved
seeds
Tanzanian farmers make little use of
improved seeds …
SOURCE: FAOStats; team analysis
Tanzania has very poor usage of inputs:
improved seeds
• Demand for improved seed by Tanzanian farmers is diminished
because of number of factors, including
– Lack of smallholder pricing power: fragmentation of farmer
base inhibits negotiating power through bulk purchases
– Inadequate access to financing: credit provision for farmers
and agro-dealers is limited; banks do almost no lending to the
former, and do limited lending to latter via credit guarantees
– Poor government subsidy program administration:
government subsidy payments to agro-dealers are often late and
sometimes subsidy vouchers are not honored at point of
redemption
– Underdeveloped capacity of agro-dealers: low incentive to
serve smallholders because of the high cost of service and lack of
business skills to weather low-margin business
Related to
financing gap
4.4 AGRICULTURE – SECTOR CHALLENGES
2

43
67
33
100% = 5.8 M households
Households receiving extension
advice, %
Extension advice
received
Extension advice
not received
SOURCE: National Sample Census of Agriculture 2007/2008; Wageningen University and Research Center; IFPRI
… and even those receiving them face serious challenges in the
quality and efficacy of services provided
Relatively few smallholder households
have access to extension services…
Tanzanian farmers receive low-quality extension
services to assist them in their cultivation practices
• Extension services are essential to enhancing agricultural
productivity by teaching smallholders farm management skills
including, inter alia, correct land preparation, timely planting, pest and
disease control, and soil nutrient balancing
• Extension in Tanzania is almost entirely financed by the
government via the Ministry of Agriculture Food Security and
Cooperatives (MAFC)
• The provision of adequate extension services is limited by a few
factors, including
– Low budget allocation: insufficient funding to hire an adequate
number of personnel and provide them with resources to carry out
impactful demonstrations and field experiments
– Late budget disbursement: sporadic and often delayed
payments of extension workers and for tools
– Poor capacity: extension workers suffer from low education
levels and weak morale, thus limiting their ability to counsel
farmers
– Weak transport infrastructure: absence of reliable means
(roads, public transport, etc.) for extension workers to reach
farmers
Related to
financing gap
4.4 AGRICULTURE – SECTOR CHALLENGES
3

44SOURCE: National Sample Census of Agriculture 2007/2008; IFAD; Team analysis
1.8%
2.1%
Not stored 16.4%
In locally made traditional structure 33.6%
In sacks/open drum 44.5%
In airtight drum
In improved locally made structure
Few Tanzanian farmers have access to proper storage options …
Method of harvest storage
%
… due to the absence of infrastructure
and financing options
Although 90% of smallholders store their produce, most
use suboptimal conditions and put their commodities at riskRelated to
financing gap
Ideal storage
methods
• Having adequate access to storage
facilities is important because it enables
producers to maintain the integrity of
their surplus produce; post-harvest
losses range from 25 to 35% of yield in
areas where that lack proper facilities
• Storage is also crucial to enable farmers
to hold their post-harvest commodities to
take advantage pricing cycles
• However, a dearth of storage
infrastructure, a lack of access to
credit, and their immediate need for
cash prevents farmers from investing in
storage infrastructure and/or holding on
to their commodities for the desired
length of time
4.4 AGRICULTURE – SECTOR CHALLENGES
4

45SOURCE: National Sample Census of Agriculture 2007/2008; Team analysis
0%
1%
1%
1%
2%
3%
5%
5%
15%
67%
Government regulatory problems
Marketing problems
Cooperative problems
No buyer
Lack of market information
No transport
Crop market too far
Transport cost too high
No problem
Open market price too low
Low prices are the biggest driver of dissatisfaction for farmers
Several challenges remain in redressing
marketing gaps
Farmers experience various marketing
problems when selling their produceRelated to
financing gap
• Most households report that the open
market price for their produce is too low;
this is driven by a number of factors,
including
– Non-consolidated aggregation/off-
take: fragmentation of producer base
leads to weak negotiating power against
traders
– Poor price discovery: inadequate
farmer ability to discern market prices
and drivers
– Weak market linkages: few
relationships between farmers and agro-
processors/other end customers in high-
touch production and marketing
arrangements (e.g., outgrower schemes,
contract farming)
– Government policy: export bans on
staple crops prevent farmers from taking
advantage of higher prices in neighboring
countries
4.4 AGRICULTURE – SECTOR CHALLENGES
5

46SOURCE: Comprehensive Africa Development program (CAADP); TAFSIP
99
1
Share of agro-products processed, %
Not processedProcessed
Tanzania does negligible value addition
to its agro product The challenges to the agro-processing industry are manifold
The level of value addition through agro-
processing in Tanzania is very lowRelated to
financing gap
• Tanzania is exporting unprocessed agro-products when the
agro-processing industry cannot meet domestic demand
• Only an estimated 1% of Tanzania agricultural produce is
processed compared to between 20 and 70% for some
medium-level third-world countries
• The low capacity in agro-processing is driven by a number of
factors, including
– Poor physical infrastructure in rural areas, with a dearth
of all-weather roads
– Limited private-sector participation and a low level of
investment by farmers and agribusiness enterprises,
accentuated by the reluctance of banks to lend for
agricultural and agro-industrial investments
– Limited knowledge of value-adding opportunities and
innovative marketing approaches such as contract farming,
outgrower schemes, warehouse receipts, commodity
exchanges, options trading etc.
4.4 AGRICULTURE – SECTOR CHALLENGES
6

47
0
1,000
2,000
3,000
4,000
5,000
6,000
7,000
8,000
9,000
10,000
11,000
12,000
13,000
14,000
15,000
16,000
0%
1.0%
2.0%
3.0%
4.0%
5.0%
6.0%
7.0%
8.0%
9.0%
12-201311-1210-1109-1008-0907-08
% of the total budget
Total government budget
Total agriculture sector budget
Key takeaways
SOURCE: Calculations based on MAFAP public expenditure database for the URT
Comparison between agriculture sector
budget against total government budget,
TZS Billions
Government spending in agriculture and related services is low
Public expenditure in direct and indirect support
of the agriculture sector has lagged targets
1 Agricultural research, extension services, payment to producers, storage, training, inspection etc.
• The Comprehensive Africa
Agriculture Development program
(CAADP) targets 6% annual
growth in the agricultural real
GDP by allocating 10% of the
national budget to the
agricultural sector1
• However, this is not the case as
the agriculture sector has only
been getting an average of ~6%
of the national budget for the
past 6 years
• TBD
4.4 AGRICULTURE – SECTOR CHALLENGES
6

48
A number of stakeholders are driving several initiatives to
improve value chain dynamics
Description
Southern Agriculture
Growth Corridor for
Tanzania (SAGCOT)
• Facilitating the establishment of linkages between
smallholders and large commercial farms
• Modern irrigation system will increase productivity
Agricultural Sector
Development
Program (ASDP)
• Improvement of farm inputs accessibility
• Construction and rehabilitation of infrastructure
• Promotion of agricultural mechanization
Agro-dealer program
• Improved input use and increased output
• Increased number of traders involved in agribusiness
Marketing
Infrastructure, Value
Addition, and Rural
Finance (MIVARF)
• Kilimo Kwanza (Agriculture First) is an initiative aimed
at mobilizing all sectors of the economy to bring about
an agricultural revolution in Tanzania.
• The pillars of Kilimo Kwanza are: financing, policy,
and regulatory incentives for increased private sector
investments
Rural Micro, Small,
and Medium
Enterprise Support
Program (MUVI)
• Radio Stations used to spread the message regarding
the Muvi programs
• In rural areas, stations took the initiative to get the
local people to assist with the training to interview
people with the aim of covering issues/areas within
the Muvi program
Southern Highlands
Food Systems
Program (SHFS)
Main sponsor (s)
• The Southern Highlands Food Systems Project is
under implementation by FAO in Tanzania, with
funding from Germany
Type
• Improve productivity
and security in the
southern region
• Improve production
and productivity
• Enhance input
access and build
capability
• Increase financing
and development of
market
infrastructure
• Provide financing
services
• Enhance technical
support and
capacity building
4.4 AGRICULTURE – SECTOR CHALLENGES

49
Agenda
SOURCE: Source
Sector analysis – agriculture
Sector analysis and challenge identification
Assessment of financial service needs and gap analysis
Digital finance plus feasibility assessment
Readiness framework
Access to and reach of mobile infrastructure
Adoption and reach of digital finance infrastructure
Role of the government and regulation
Sector analysis – energy
Sector analysis – water
Sector analysis – health
Sector analysis – education

50
Key takeaways: Agriculture sector financial service need and
gap analysis
AGRICULTURE – FINANCIAL SERVICE NEEDS AND GAP ANALYSIS
5.1 Financial service need along value chain
5.2 Financial gap analysis along value chain
5.3 Barriers to provision of financial products
• Similar to many peer countries in SSA, there is a clear disconnect between the importance of agriculture to the Tanzanian economy
and general access to financing – although agriculture accounts for ~30% of the GDP, only ~10% of commercial lending goes to the
sector
• Even where financial products are offered to farmers, they are only available to a small niche relative to the wider smallholder base –
beneficiaries tend to belong to strong producer associations, grow horticultural or other types of cash crops and have strong relationships
with a monopsonic value chain actor (e.g., outgrower and contract farming schemes with agroprocessors)
• The needs of smallholders are only being met to a limited extent
– Loans: minimal access of credit to farmers; few national banks lend to select producer associations with extremely high collateral
requirements at market rates of 25%; MFIs (e.g., FINCA, Pride) also lend to producer associations, but at high rates of 50-200%,
while village-level moneylenders extend credit at extremely burdensome rates of up to 300%
– Insurance: extremely rare, except for nascent efforts within “closed loop” market ecosystems in which a partnership of value chain
actors (e.g., Sacau project by Monsanto, Yara, Barclays) provide weather-indexed crop insurance bundled with other financial
products (e.g., input credit) and collateralized with warehouse deposits, often only covering the value of inputs (not the entire harvest
value)
– Agronomic, weather, and market information: only 7,000 extension workers nationally, thus providing minimal frequency and
quality of agronomic support to farmers; however, there are a number of mobile-based applications (e.g., Tigo Kilimo by Tigo, by
Kilimo Salama by Snygenta Foundation), directly reaching farmers via helplines and SMS to provide advice on farm management,
weather forecasts, market price information, etc.
• Smallholder farmers and other players have a range of finance-related needs across the value chain, including
– Loans: short and long term lending for acquisition of inputs (seeds, fertilizer, agro nutrients), access to mechanization during plan-
ting (tractor rentals), harvesting once crops are ready (extra labor hire), to market based on pricing cycles
– Insurance: protection against extreme hydrological conditions (e.g., drought, excess rainfall) to recoup investment in inputs and
labor
– Agronomic, weather, and market information: knowledge on farm management best practices (e.g., input application, disease
control), localized weather forecasts, and market prices by crop and geography
– Smallholder farmers/SMEs in the agriculture sector are a low priority segment for most financial institutions due to the
unmanageable risk and high cost-to-serve, low presence of collateral, and variability of harvest performance

51SOURCE: IMF; Central Bank data
30
22
30
24
29
25
44
2831
144
68
101112
15
NigeriaKenyaMozam-
bique
Sub-
Saharan
Africa2
EthiopiaTan-
zania
Malawi GhanaUganda
Agriculture as a share of GDP and commercial bank lending, 20081 , in %
% Lending% GDP
1 2008 reflects latest available data
2 Commercial bank lending across SSA is estimated at <10%, with the exception of Malawi, Tanzania and Uganda
5.1 AGRICULTURE – FINANCIAL SERVICE NEEDS ALONG THE VALUE CHAIN
As in much of SSA, a clear disconnect exists between the importance of
agriculture to the Tanzanian economy and general access to financing
Key takeaways
• Agriculture is a
key driver of
the Tanzanian
economy,
contributing
28% of GDP
• The agriculture
sector has
limited access
to commercial
bank lending:
it receives on
average 2-3
times less
credit than its
fair share
based on GDP
contribution

52
Many of the value chain gaps are related to limitations in the
meeting of smallholder and other actors’ financing needs
The nature of the agricultural sector makes providing financing less desirable
• Unique risks
– High operational and price risks due to weather, disease/pests, makes it hard to
diversify for banks in many monoculture regions
– Seasonal and multiyear cycles
• Time inconsistency
– Lag exists between investment needs and expected revenues
– Need patient capital with a long horizon and a tolerance for risk
• High transaction costs
– Loans are often in small amounts
– Borrowers are often dispersed in remote/rural areas with no distribution access
• Informality leads to a lack of collateral and information
– Absence of land titles or registered assets
– No financial statements or credit score from credit bureau
• Low level of financial literacy
– Limited understanding of the benefits of financial services and products
• Governance
– Substantial government intervention is increasing uncertainty
– Subsidies and repeated debt forgiveness are creating a moral hazard
5.1 AGRICULTURE – FINANCIAL SERVICE NEEDS ALONG THE VALUE CHAIN

53
Financing for staple crops, which constitute the largest share of
Tanzanian production, is especially challenging
SOURCE: Expert interviews; literature review
Markets for staple
crops are often
highly politicized
Staple crops
require significant
economies of
scale to attract
financing
Lack of product
differentiation
makes it harder to
finance staple crop
value chains
• Small producers often compete with larger, more
efficient producers in the country/region
• Scale is often required to ensure quality (e.g.,
through mechanization, storage infrastructure)
• The presence of multiple traders and
intermediaries increases the risk of diversion and
side selling unlike in cash crops, which are more
integrated
• Food reserve purchasing by governments creates
unpredictability
• Legacy of government supply/subsidy of inputs
distorts the market but is hard to reform
5.1 AGRICULTURE – FINANCIAL SERVICE NEEDS ALONG THE VALUE CHAIN

54
Smallholder farmers and other value chain players have a range
of finance-related needs across the agricultural value chain
SH = smallholder
AD = agro-dealer
EA = extension agents
PS = other private sector
Gov = government
1 432 65
Fin
an
cin
g n
ee
ds
• PS: long-term
loans to private
enterprise to:
a) build agro-
processing plants;
and b) on-lend to
farmers
participating in
outgrower/contract
farming schemes
• SH: market
information
systems to enable
easy price
discovery
• SH: depository
accounts
(checking and
saving) to park
cash following
commodity sales
• SH: payment
receipt for
commodity
transactions
• SH: short-term
loans and credit
guarantees to
store commodities
until ideal market
period
• PS: long-term
loans to
rehabilitate
warehouses and
expand capacity
• PS: deposit
insurance to
protect stored
commodities from
fire, theft, etc.
• Gov: long-term
loans to
build/refurbish
roads and other
“last mile” rural
infrastructure
• SH: long-term
credit to
purchase/
lease/rent tractors
and other
advanced
equipment/
machinery
• SH: agronomic
information
transfer from
agricultural
professionals
• SH: weather-
indexed
insurance policy
to cover drought-
related losses
• EA:
salaries/payment
receipt to fund
transmission of
agronomic
expertise and
carrying out of
experiments with
farmers
• SH: short-term
loans to purchase
seeds, fertilizer,
and agro nutrients
• SH: third-party
credit guarantees
to procure inputs
• SH: payments to
facilitate
transactions with
suppliers
• SH: weather-
indexed
insurance policy
to indicate credit-
worthiness for
input purchases
• AD: short-term
loans to maintain
inventory and
extend credit to
SH
• SH: long-term
credit to expand
plot through lease
and/or purchase of
additional land
5.1 AGRICULTURE – FINANCIAL SERVICE NEEDS ALONG THE VALUE CHAIN

55SOURCE: Organization websites; press search; expert interviews; team analysis
A number of players meet the sector’s financing
needs to a very limited extent
Number/reach of existing initiatives
Minimal Moderate
LimitedN/A
Minimal but efforts underway
1 432 65
Information
Short term
Long term
Product/receive-ables finance
Credit
Value chain lending
Physical asset collateralization
Insurance
Credit guarantees
Savings
Payments
5.2 AGRICULTURE – FINANCIAL GAP ANALYSIS ALONG THE VALUE CHAIN
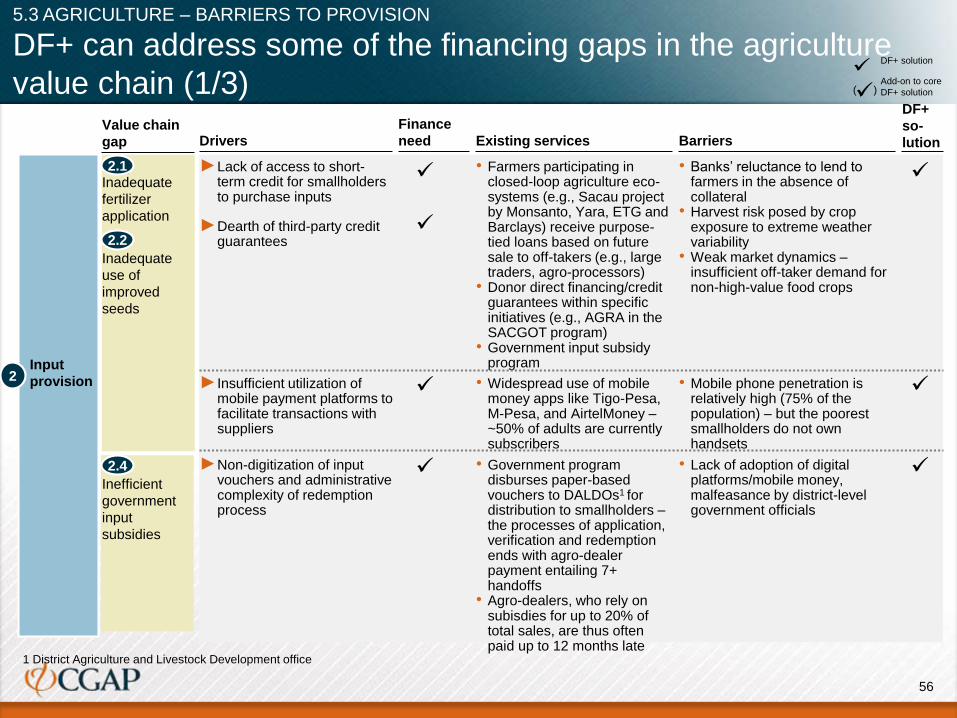
56
DF+ can address some of the financing gaps in the agriculture
value chain (1/3)
Input
provision2
1.1
Value chain
gap
DF+
so-
lutionDrivers
Finance
need Existing services Barriers
►Lack of access to short-term credit for smallholders to purchase inputs
• Farmers participating in closed-loop agriculture eco-systems (e.g., Sacau project by Monsanto, Yara, ETG and Barclays) receive purpose-tied loans based on future sale to off-takers (e.g., large traders, agro-processors)
• Donor direct financing/credit guarantees within specific initiatives (e.g., AGRA in the SACGOT program)
• Government input subsidy program
• Banks’ reluctance to lend to farmers in the absence of collateral
• Harvest risk posed by crop exposure to extreme weather variability
• Weak market dynamics –insufficient off-taker demand for non-high-value food crops
2.1Inadequate
fertilizer
application
2.2
Inadequate
use of
improved
seeds
►Dearth of third-party credit guarantees
►Insufficient utilization of mobile payment platforms to facilitate transactions with suppliers
• Widespread use of mobile money apps like Tigo-Pesa, M-Pesa, and AirtelMoney –~50% of adults are currently subscribers
• Mobile phone penetration is relatively high (75% of the population) – but the poorest smallholders do not own handsets
2.4
Inefficient
government
input
subsidies
►Non-digitization of input vouchers and administrative complexity of redemption process
• Government program disburses paper-based vouchers to DALDOs1 for distribution to smallholders –the processes of application, verification and redemption ends with agro-dealer payment entailing 7+ handoffs
• Agro-dealers, who rely on subisdies for up to 20% of total sales, are thus often paid up to 12 months late
• Lack of adoption of digital platforms/mobile money, malfeasance by district-level government officials
1 District Agriculture and Livestock Development office
DF+ solution
Add-on to core
DF+ solution)(
5.3 AGRICULTURE – BARRIERS TO PROVISION

57
DF+ can address some of the financing gaps in the agriculture
value chain (2/3)
Production3
1.1
Value chain
gap
DF+
so-
lutionDrivers
Finance
need Existing services Barriers
►Low levels of farmer education on agronomic best practices (e.g., land preparation, input application, disease diagnosis)
• Smallholders have very low levels of formal schooling and employ age-old tactics, not having adopted many modern techniques
• Infrequent and poor quality access to government extension services
• Mobile-based applications (e.g., TigoKilimo) are beginning to provide customized agronomic advice
• Lack of widespread training programs, demonstration plots, field trials etc.
• Remoteness and dispersion of farmsteads
• Infrequent use of mobile solutions even where subscribed
3.1Farmer
information
constraints
3.2
Heavy crop
and
economic
losses to
weather
variability
►Insufficient access to localized market information
►Crop exposure to extreme weather conditions without insurance protection
( )
( ) • Few widely accessible market price indices exist
• Mobile-based applications (e.g., TigoKilimo) are beginning to provide localized market data
• Farmer distance from physical markets
• Monopoly of information by traders
( )
( )
• Weather-indexed crop insurance plans are bundled with other financial products and available to farmers participating in closed-loop market ecosystems with major value chain actors
• Absence of deep microclimate data
• High insurance plan premiums • Exclusion of the majority of
smallholders from integrated value chain ecosystems
DF+ solution
Add-on to core
DF+ solution)(
5.3 AGRICULTURE – BARRIERS TO PROVISION

58
DF+ can address some of the financing gaps in the agriculture
value chain (3/3)
Storage
and
Distri-
bution
4
1.1
Value chain
gap
DF+
so-
lutionDrivers
Finance
need Existing services Barriers
►Insufficiently developed warehouse infrastructure
• The majority of smallholders currently sell their produce to small-scale traders at the farmgate immediately following harvest
• The value of crops can be up to 60% higher during times of peak market prices
• Warehouse Receipt Systems are being implemented in certain value chains –farmers deposit produce after harvest and receive a medium-term loan for a portion of crop value until the full balance is settled, with the ultimate sale occurring in more ideal market conditions
• Sparse presence of storage facilities
• Poor management and operations of warehouses
• Farmers’ immediate cash need after harvest
4.1Unavailability
of storage
warehouses
4.2Farmers’
post-harvest
need for
liquidity
►Farmers’ inability to hold on to crops until optimal market conditions
DF+ solution
Add-on to core
DF+ solution)(
5.3 AGRICULTURE – BARRIERS TO PROVISION OF FINANCIAL PRODUCTS

59
Agenda
Sector analysis – agriculture
Sector analysis and challenge identification
Assessment of financial service needs and gap analysis
Digital finance plus feasibility assessment
Readiness framework
Access to and reach of mobile infrastructure
Adoption and reach of digital finance infrastructure
Role of the government and regulation
Sector analysis – energy
Sector analysis – water
Sector analysis – health
Sector analysis – education

60
Key takeaways: Agriculture sector Digital Finance Plus solutions
feasibility
AGRICULTURE – DIGITAL FINANCE PLUS SOLUTION FEASIBILITY
6.1 Potential applications of DF+ to address barriers
6.3 Scaling and execution capabilities
6.2 Viability of observed and potential business models
• DF+ can play a positive role in helping to address several of the financing gaps faced by smallholders in
agriculture by facilitating financial linkages between value chain actors, decreasing transaction costs, promoting
transparency in the flow of commodities and financial products, powering the aggregation and analytics of
data (behavioral, agronomic, and market), and enhancing contract enforceability
• Consequently, several value chain actors are partnering to provide innovative applications that enhance farmer
access to financing and increase farmer incomes. The most noteworthy products already in operation and/or
under development for the near term include: i) Warehouse Receipt System based post-harvest credit provision; ii)
input loans through closed-loop agriculture ecosystems; iii) information portals for agronomic, weather, and market
data; iv) e-wallets for input subsidy administration; and v) weather-indexed crop insurance to protect against extreme
weather conditions
• The current landscape of DF+ solutions is mostly driven by value chain actors, including seed and fertilizer
companies (e.g., Monsanto, Yara) and agro-processors (e.g., ETG), with the notable exception of the most
successful agronomic information portal, which is primarily driven by Tigo, a telco company
• Financial institutions lend directly to producers or producer associations in extremely rare cases –
however, banks like NMB and Barclays are extending credit with heavy collateralization/security guarantee through
value chain actors
• Scaling of DF+ solutions is hampered by several non-finance-related challenges, including
– Producer organization and entrepreneurship: many farmers are not encompassed in market-based
associations and lack the business knowledge to self-organize and form enterprising collectives
– Supply/demand market dynamics: the provision of financing is closely linked with robust markets for
particular crops, consequently favoring producers of high-value crops with market for agro-processing and
export (e.g., white maize, sunflower, coffee)

61
The in-country interviews have generated new insights into the
agriculture sector (1/4)
“For all the efforts to make farmers
entrepreneurs and link them to
markets and such – we should
keep in mind that many
smallholders are simply not
attractive/eligible for such
enablement”
– Seed company executive
“Simply providing credit does not
address more fundamental
questions – is there a sustainable
growing demand for the crop being
grown by the farmer? And does the
farmer think, act, and manage his
farm like a business?”
– Seed company executive
Key insights Indicative quotesInterviews conducted
• Bill and Melinda Gates
Foundation (BMGF)
• East Africa Seed Co.
Ltd
• Faida Market Link
(Faida MaLi)
• Ministry of Agriculture
• Monsanto
• President’s Delivery
Bureau
• Syngenta
• Seed Co Tanzania
• Tujijenge
• Tanzanian
Horticultural
Association (TAHA)
• Tigo
• USAID
1. Supply/demand dynamics in the market, as well as the
entrepreneurial profile of farmers, are the fundamental
drivers of commercial viability of credit provision and
other financing support
• Credit is best targeted at particular types of farmers, with
characteristics including
– Entrepreneurial saavy and commitment: young, early
adopters who have already demonstrated a desire for
business improvement through installation of irrigation
systems, crop rotation, hybrid seed usage, etc.
– Ideal farm size/crop profile: farm sizes of 5-50ha, (not
too small, but not so big that they are commercial size
with access to “regular” credit from VC actors
and/financial institutions); produce horticultural, dairy,
white maize, etc.
– Demand-driven need for loan capital: Year-over-year
on demand growth for a crop that is not imported,
providing an impetus for farmers to grow their
businesses, for which they will need investment
2. Many of the new financial products being offered are only
available to a small niche of farmers relative to the wider
smallholder base
• Farmers who are eligible for input credit, crop insurance,
warehouse receipts, etc., usually: a) belong to a strong
producer collective; b) grow horticultural or other types of
cash crops; and c) have a strong relationship with a
monopsonic value chain actor (e.g., outgrower schemes to
supply a brewery with barley)
6.1 AGRICULTURE – POTENTIAL APPLICATIONS OF DF+ TO ADDRESS BARRIERS

62
The in-country interviews have generated new insights into the
agriculture sector (2/4)
Key insights Indicative quotesInterviews conducted
“We have had 40 years of
socialism in this country – we have
to teach farmers fundamental
things before we erase the
everything-is-for-free attitude and
the fundamental ignorance about a
capitalistic market system”
– Producer association
executive
“We can show great results for our
work – farmers whom we have
helped are demonstrably better off
- but we have barely scratched the
surface and expanding our efforts
requires donor financing”
– Producer association
executive
3. Organization, farmer education, and aggregation are
major prerequisites to providing input financing, linking
to markets, etc. The following interventions are generally
required
• Association: organizing farmers into formal associations with
a collective mission, constitution, negotiation power etc.
• Training: farmer education on use of inputs and collective
marketing; business and technical skills training including
“farming as business”
• Aggregation and storage: building/renovating storage
facilities and mobilized associations to implement WRS;
achieving certification by Tanzania Warehouse Licensing
Board
• Mindsets and behaviors: make farmers more entrepreneurial.
“We have had 40 years of socialism in this country, so many
still have some version of everything-is-for-free and the state-
takes-care-of-all attitudes”
4. Donor support is still key to enabling producer
supporting organizations
• Successful NGOs helping farmers to organize have
succeeded in achieving significant results in enhancing
farmer incomes – one succeeded in increasing farmer
income from for paddy from Tsh 200/kg to 450/kg by
facilitating building and management of warehouses
• However, donors heavily subsidize renovation of warehouses
and introduction of improved storage and management
practices – the NGO still relies on funds for financing its own
operational needs
• Bill and Melinda
Gates Foundation
(BMGF)
• East Africa Seed Co.
Ltd
• Faida Market Link
(Faida MaLi)
• Ministry of
Agriculture
• Monsanto
• President’s Delivery
Bureau
• Syngenta
• Seed Co Tanzania
• Tujijenge
• Tanzanian
Horticultural
Association (TAHA)
• Tigo
• USAID
6.1 AGRICULTURE – POTENTIAL APPLICATIONS OF DF+ TO ADDRESS BARRIERS

63
The in-country interviews have generated new insights into the
agriculture sector (3/4)
“We provide loans to farmers – but
our conditions are often highly
prohibitive, and our rates are
fundamentally unattractive”
– MFI executive
“It is ultimately good business for
us to enable farmers to buy higher
quality inputs – but we can’t go at it
alone”
– Seed company executive
“We have big plans for the future,
but first we have to get farmers
comfortable with us”
– Telco executive
Key insights Indicative quotesInterviews conducted
5. Most farmers have some access to credit – but it is often
through informal networks and entails extremely
burdensome terms
• Several actors lend money to farmers – local moneylenders,
who charge exorbitant rates (up to 300%) and MFIs whose
rates are also high (50-200%). A few banks (NMB, Stanbic)
also do extremely selective lending at reasonable rates (e.g.,
25%) but in highly controlled circumstances (e.g., with WRS
deposits as collateral and guaranteed off-takers)
6. Seedcos and other major input suppliers are willing to
participate in closed-loop marketing ecosystems in which
they contribute to farmer financing
• Syngenta, Yara, and other input suppliers have collaborated
with FIs like Barclays to launch pilot initiatives to help
“emerging farmers” secure comprehensive financing for
procuring inputs and selling produce directly to agro-
processors
• The objective is to ultimately create wider demand for their
own goods, as farmers who experience commercial success
buy hybrid seeds and fertilizer more frequently
7. Building farmer trust and fidelity is an essential
prerequisite to commercializing mobile solutions like agro
information apps
• Tigo enables farmers who sign on to its TigoKilimo to use
highly discounted services to prove its efficacy and build trust
before eventually moving onto higher profit generating
features
• Bill and Melinda
Gates Foundation
(BMGF)
• East Africa Seed Co.
Ltd
• Faida Market Link
(Faida MaLi)
• Ministry of
Agriculture
• Monsanto
• President’s Delivery
Bureau
• Syngenta
• Seed Co Tanzania
• Tujijenge
• Tanzanian
Horticultural
Association (TAHA)
• Tigo
• USAID
6.1 AGRICULTURE – POTENTIAL APPLICATIONS OF DF+ TO ADDRESS BARRIERS

64
Key insights Indicative quotesInterviews conducted
The in-country interviews have generated new insights into the
agriculture sector (4/4)
“We have nearly $100,000 in
unpaid vouchers from the
government from last year’s
harvest season”
– Agro-dealer executive
• Bill and Melinda Gates
Foundation (BMGF)
• East Africa Seed Co.
Ltd
• Faida Market Link
(Faida MaLi)
• Ministry of Agriculture
• Monsanto
• President’s Delivery
Bureau
• Syngenta
• Seed Co Tanzania
• Tujijenge
• Tanzanian
Horticultural
Association (TAHA)
• Tigo
• USAID
8. An E-wallet in which all of farmers’ financial transactions
are put in a virtual bank account and are facilitated by a
payment platform could have a tremendous impact on
making financial flows transparent and efficient
• SeedCos report that up to 20% of all revenue is driven by
government input subsidy schemes
• High degree of inefficiency in the issuing, circulation, and
processing of vouchers; a single batch of vouchers can pass
through 7 steps from issuance to redemption
• This leads to frequent cases of system corruption and
frequently late payments to agro suppliers
6.1 AGRICULTURE – POTENTIAL APPLICATIONS OF DF+ TO ADDRESS BARRIERS

65
DF+ can help in addressing some of the gaps
in the Agriculture value chain
6.1 AGRICULTURE – POTENTIAL APPLICATIONS OF DF+ TO ADDRESS BARRIERS
Detail
follows
Value chain segment ChallengesProduct
evaluation
Finance
as barrier
DF+
potential
No other
barriers
Assessment of applicability of DF+ solution
1.1 Small arable land utilization
1.2 Limited average plot size
2.1 Inadequate fertilizer application
2.2 Weak demand for improved seeds
2.3 Underdeveloped capacity of agro-dealers
2.4 Inefficient government input subsidies
3.1 Farmer information constraints
3.2 Weak extension services
3.3 Low levels of mechanization
3.4 Heavy exposure to weather variability
4.1 Unavailability of storage warehouses
4.2 Post-harvest need for liquidity
4.3 Underdeveloped rural infrastructure
5.1 Low levels of commercialization
5.2 Non-consolidated aggregation/off-take
5.3 Poor access to market information
5.4 Weak market linkages
6.1 Low level of private investment
Land
Input provision
Production
Storage & Distribution
Marketing
Processing
high low

66
Based on the analysis of the current state and barriers to scale,
we suggest 5 DF+ applications for your further consideration
Top challengesDescriptionDF+ product
Unavailability of storage
warehouses
4.1 1. Product financing
2. Storage facilities
3. Qualities and standards
4. Market price information availability
• Inventory-based credit
provision to farmers for
certified commodities held in
storage at warehouses
• Digital Warehouse
Receipt System-
based medium-term
loans
Addressed Agriculture sector
challenge
A
Post-harvest need for
liquidity
4.2
Inadequate fertilizer
application
2.1 1. Product financing
2. Farmer eligibility
3. Value chain actor coordination
4. Side-selling risk
• Post-harvest, off-take-linked
input loan for farmers in
agriculture value chain
ecosystems
• Input credit for small-
holders in closed-
loop ecosystem of
integrated value
chain actors
B
Inadequate usage of
improved seeds
2.2
Inefficient government input
subsidy program
2.4 1. Farmer education
2. Mobile phone penetration
3. Privacy
4. Product financing
• Mobile phone platform for
digital issuance, verification,
and redemption of input
vouchers
• E-wallet for
government input
subsidy
disbursement
C
D Heavy crop losses to
extreme weather
3.4• Insurance product to mitigate
the risk of extreme weather
events with digital purchase,
claims filing, resolution, and
payout
• Weather-indexed
crop insurance
enabled by digital
platform
1. Product financing
2. Weather condition and crop yield
correlation modeling
3. Depth of historical weather data
Farmer information
constraints 3.1• Digital portal for collection
and dissemination of
agronomic, weather and
market data, with extension
of financial products based
on detailed consumer profile
• Mobile system for
agriculture informa-
tion dissemination
and collection of
smallholder data
E 1. Primary information access
2. Usability of collected data
3. Marketing
4. Distribution
6.1 AGRICULTURE – POTENTIAL APPLICATIONS OF DF+ TO ADDRESS BARRIERS

67
Digital Warehouse Receipt System-based medium term-loans
(1/3)
Financial
instrument
Credit provision based on
warehouse crop deposits
Target
audience
Smallholders participating
in WRS
Product
provider
Financial institutions +
agro-processors
Value proposition Product details
Overall value proposition
• Providing farmers access to credit
based on deposited collateral
• Improving farmer income by allowing
choice on when to sell in the pricing
cycle
• Reducing post-harvest losses due to
poor storage conditions
• Smoothing the supply of produce and
price volatility in the market
• Helping to create commodity markets
that promote aggregation, competition,
and trade
Core product features
• Mechanism to mobilize credit to farmers by creating secure collateral for processors and
traders
• After harvest, the farmer deposits crop in a licensed warehouse and receives a certificate
verifying the quantity and quality grade of the commodities
• Based on the certified amount, the bank extends a short-term loan to the farmer for a
certain portion of the crops’ value (percentage of total commodity X average price of
commodity over benchmark period)
• Before the loan matures (6-to 9-month period), the farmer sells his crop to an agro-
processor or trader who pays the entire value of the crops into the WRS bank account
• The bank deducts the principal and interest owed, then deposits the balance into the
farmer’s mobile money account
Potential extensions
• Purpose-tied savings accounts: farmers may elect to leave a portion of post-harvest sales
in the mobile account for an interest-bearing savings account, which they can use to
procure inputs at the beginning of the next planting season
• Futures contracting: farmers and agro-processors can enter into agreements to produce
and trade commodities of a specified quantity, quality, price, and timing; the agreements
are considered completed once commodities are deposited into warehouse
DF+ specific value proposition
• Digital issuance of warehouse deposit
certificate
• Mobile money transfer by bank into
farmer account for interim credit and
final sale amount
Product summary
• Inventory-based credit provision to farmers for certified commodities held
in storage at warehouses
Financial needs addressed
• Farmers’ need for liquidity in the immediate aftermath of harvest
• Farmers’ option to sell produce at time of peak prices
A
6.1 AGRICULTURE – POTENTIAL APPLICATIONS OF DF+ TO ADDRESS BARRIERS

68
Digital Warehouse Receipt System-based medium term loans
(2/3)
Low High
Detailed impactFeasibility assessment: business model
Feasibility assessment: enabling
environment
Feasibility
• Moderately feasible: successful WRS
schemes have been implemented in
Tanzania, but widespread scaling is
hampered by the lack of a few key
enablers, including storage infrastructure
and quality and grading standards
Potential impact
• High impact: farmers net significantly
higher incomes (up to 65% for some
crops) when given access to
adequate storage facilities and short-
term liquidity to meet their immediate
cash needs
Government regulation
• GoT has developed
Warehouse Receipt Act laws
and a Warehouse Licensing
Board to facilitate WRSs
Telco
• Integrating new farmer WRS
accounts with a mobile money
platform is relatively easy
Product financing
• The upfront cost of renovating
and operationalizing warehouses
is high and may require donor
financing; in steady state, WRSs
can become commercially
viable/self-financing
• Net earnings per
kilogram through WRS
are 20-65% higher than
non-WRS subscribers –
e.g., for cashew, prices
through middlemen were
1,000 TShs/kg, whereas
prices through WRS
were1,300 TShs/kg; for
sunflower, prices were
450 TShs/kg through
middlemen and 650
TShs/kg through WRS
Storage facilities
• Famers who are members of producer associations or
cooperatives often have access to physical storage
infrastructure, although best-practice fumigation and
packaging, as well as professional management, are a
challenge
A
Qualities and standards
• Quality standards need to be specific enough to give
clear definitions of quality grades – Tanzania Bureau of
Standards currently has moderate capability in this area
Market price fluctuation and information availability
• General price increase in the harvest season is
essential enabler and present in Tanzania; however,
tracking prices for certain commodities can be a
challenge in the absence of location-specific indices
6.1 AGRICULTURE – POTENTIAL APPLICATIONS OF DF+ TO ADDRESS BARRIERS

69
Digital Warehouse Receipt System-based medium-term loans
(3/3)
Case examplesGo-to-market model
NMB Warehouse Receipt System
• NMB has implemented a WRS financing
system in Tanzania
• ~30 warehouses have been licensed, with
ownership by farmer associations as well as
private operators
• About 7 crops are covered under the scheme
(coffee, pigeon peas, cashew, paddy,
sunflower and sesame)
• Initiatives are underway to establish a
Commodity Exchange for efficient marketing
• In 2011, NMB conducted $73 million of
business through the WRS schemes
A
• Agro-processors and banks
consult with producer
organizations to develop
WRS based on buyer and
seller needs
• Banks and agro-processors
receive support from
development institution to
upskill and license existing
warehouses
• Operation and
management of
warehouses is conducted
by farmer organizations or
subcontracted to private-
sector players
6.1 AGRICULTURE – POTENTIAL APPLICATIONS OF DF+ TO ADDRESS BARRIERS

70
Input credit product for smallholders in closed-loop ecosystem of
integrated value chain actors (1/3)
Financial
instrument
Input loan by repayment
linked to harvest
Target
audience
Smallholders in integrated
market ecosystems
Product
provider
Input companies + off-
taker + warehouse
Value proposition Product details
Overall value proposition
• Provides farmers with access to
purpose-tied credit to purchase the
most critical production factors
• Improves yield (quality, consistency,
and volume output) of crops and
secures higher prices for farmer
produce
• Enhances sales of input suppliers –
virtuous cycle of farmers investing in
improved inputs
• Guarantees off-takers quality supply of
produce at a specified time and scale,
with pre-agreed price/pricing formula
Core product features
• A contract farming arrangement integrating smallholders with major value-chain market
actors to link them with financing, provide them with comprehensive agronomic support
and guarantee off-take at the end of harvest
• Highly organized, entrepreneurial group of “emerging farmers” (e.g., an “apex” comprising
200 farmsteads, each with minimum 5 ha and growing a horticultural crop) are included in
a closed-loop system of seed and fertilizer suppliers (e.g., Monsanto), a warehouse, an
off-taker (e.g., sunflower processor), and a financial institution
• Farmers receive SMS-based vouchers from FI for acquisition of fertilizer, seed etc., with
the primary risk born by the off-taker and secondary guarantee by input companies
• Post-harvest, farmer delivers harvest to off-taker on pre-agreed quantity, quality, and price
basis
• Off-taker deducts cost of input before depositing balance of payment to farmers’ mobile
account
Potential extensions
• Crop insurance: weather protection insurance could potentially be bundled with input, with
portion of premiums paid by input companies to incent farmer seed purchases
DF+ specific value proposition
• Convenient payment platform
eliminates need for paper vouchers
and cash
• VC actors can track the flow of funds
and better enforce repayment
Product summary
• Post-harvest, off-take-linked input loan for farmers in closed-loop
agriculture value chain ecosystems
Financial needs addressed
• Smallholder access to credit for input purchase
• Convenient tracking and facilitation of financial flows between VC actors
B
6.1 AGRICULTURE – POTENTIAL APPLICATIONS OF DF+ TO ADDRESS BARRIERS

71
Input credit product for smallholders in closed-loop ecosystem of
integrated value chain actors (2/3)
Low High
Detailed impactFeasibility assessment: business model
Feasibility assessment: enabling
environment
Feasibility
• Moderately feasible: successful cases of
integrated ecosystems have been
implemented, proving concept feasibility.
However, scaling to wider smallholder
base is inhibited by supply/demand
dynamics and farmer characteristics
Potential impact
• High impact: farmers with improved
access to inputs, complemented with
on-farm support, have grown yields of
major crops by up to 3 times
Government regulation
• No known government
policy constraints
Telco
• Widespread adoption of M-
Pesa, Tigo-Pesa, and other
mobile money providers;
building the user interface will
be the only additional effort
required
Product financing
• Value chain actors like input
companies and agro-
processors are willing to take
risk for FI credit provision, in
controlled circumstances as
outlined
• Improved access to
hybrid seeds in closed-
loop systems have led to
dramatic improvements
in yield – in white maize,
for example, yield has
jumped from 1-1.5
tons/ha, to 4 tons/ha
Value chain actor coordination
• Successful closed-loop system requires presence and
coordination of all major VC chain actors
• Pilot projects have proven coordination capability successful,
although only on a small scale so far
B
Side-selling risk
• Due to lack of legal enforcement mechanisms and the
volatility of prices on the open market, only monopsonic
off-takers are relatively protected from side-selling by
farmers
Farmer eligibility
• Smallholders have to be organized into associations, adopt
an enterprise mindset, have reasonably large landholdings,
and grow crops that off-takers desire (e.g., white maize,
sunflower) for value addition, among other requirements
• Currently, a relatively small share of farmers fulfill most of the
requirements above – the majority of farmers grow food
crops, have small plots, and are not effectively organized
6.1 AGRICULTURE – POTENTIAL APPLICATIONS OF DF+ TO ADDRESS BARRIERS
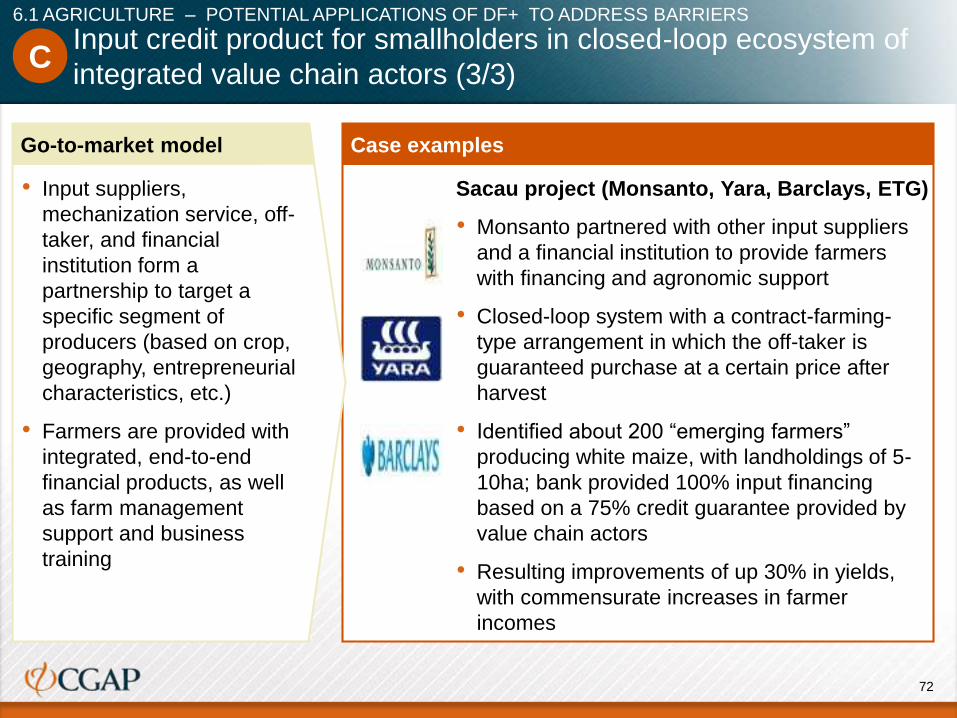
72
Input credit product for smallholders in closed-loop ecosystem of
integrated value chain actors (3/3)
Case examplesGo-to-market model
Sacau project (Monsanto, Yara, Barclays, ETG)
• Monsanto partnered with other input suppliers
and a financial institution to provide farmers
with financing and agronomic support
• Closed-loop system with a contract-farming-
type arrangement in which the off-taker is
guaranteed purchase at a certain price after
harvest
• Identified about 200 “emerging farmers”
producing white maize, with landholdings of 5-
10ha; bank provided 100% input financing
based on a 75% credit guarantee provided by
value chain actors
• Resulting improvements of up 30% in yields,
with commensurate increases in farmer
incomes
C
• Input suppliers,
mechanization service, off-
taker, and financial
institution form a
partnership to target a
specific segment of
producers (based on crop,
geography, entrepreneurial
characteristics, etc.)
• Farmers are provided with
integrated, end-to-end
financial products, as well
as farm management
support and business
training
6.1 AGRICULTURE – POTENTIAL APPLICATIONS OF DF+ TO ADDRESS BARRIERS

73
E-wallet for input subsidy disbursement and integrated hosting of
all farmer financial flows (1/3)
Financial
instrument
Digital wallet for input
subsidy voucher disbursal
Target
audience
Smallholders eligible for
input subsidies
Product
provider
Government + input
supplier + telco
Value proposition Product details
Overall value proposition
• Subsidies are used for their intended
purpose – minimal opportunity for
intermediate actors to misappropriate
• Reduces transaction cost: the current
process requires 7-different handoffs
between various government officials,
private sector actors, and farmers
• Encourages agro-dealers to meet seed
and fertilizer demand as they can
easily redeem vouchers
• Value chain actors have transparency
into the flow of inputs and funds in the
system
Core product features
• Eligible farmers receive a defined percentage government subsidy on a specific number of
bags of fertilizers and seeds on unique mobile accounts
• Electronic vouchers with unique PINs for the subsidy amounts are issued by Ministry of
Agriculture to farmers on SMS, which they receive based on their digital identity card
• At the agro-dealer site, the farmer presents voucher PIN and pays for the balance using
mobile money
• If the farmer is a participant in a Warehouse Receipt System (WRS) scheme, digital
account is used for payment upon deposit of harvest
• Participating agro actors are able to trace aggregated and sanitized data on flow of inputs
and funds in value chain
Potential extensions
• Post-harvest payments: WRS-linked farmers can conduct all financial transactions using
the same mobile money account
• Loan extension: over time, data collected on farmer usage of inputs and harvest
output/sale at the end of the agro cycle can be used to assess need and worthiness for
purpose-tied loans by financial institutions
DF+ specific value proposition
• Convenient payment platform
eliminates need for paper vouchers
and cash
• Unique digital tag identifies individual
farmers
Product summary
• Mobile phones platform to enable farmers to conduct basic
transactions and make payments for direct input access
Financial needs addressed
• High administrative expense of running input subsidy programs
• Frequent issues faced by agro-dealers in redeeming vouchers
• Misuse/misappropriation of government subsidies
C
6.1 AGRICULTURE – POTENTIAL APPLICATIONS OF DF+ TO ADDRESS BARRIERS

74
E-wallet for input subsidy disbursement and integrated hosting of
all farmer financial flows (2/3)
Low High
Detailed impactFeasibility assessment: business model
Feasibility assessment: enabling
environment
Feasibility
• Highly feasible: widespread
mobile phone ownership and
mobile money usage make
voucher system addition
relatively easy
Potential impact
• High impact: Smallholders will be able to
improve crop yields by having easier access
to improved seeds and fertilizer. Agro-
dealers will be able to redeem value of
government vouchers, and therefore
become more willing to meet farmer demand
Government regulation
• No known government policy
constraints
Telco
• Widespread adoption of M-
Pesa, Tigo-Pesa, and other
mobile money providers;
building the user interface will
be the only additional effort
required
Product financing
• The Government of Tanzania,
backed by the World Bank,
already runs a large input
subsidy program; funding
development of e-wallet
system easily paid for through
subsequent savings realized
• Agro-dealers estimate
that up to 20% of their
entire business is funded
through government
input subsidies; frequent
delays and the several
hand-offs required for
redemptions drastically
erode profit margins
• In the Nigerian pilot
program, a 2-year
program has reached 5
million farmers and is
estimated to have
enhanced the food
security of 25 million
people in rural farm
households
Mobile phone reach
• E-wallets require access to mobile technology by
smallholders; currently, Tanzania has a very high
penetration of mobile access, with ~60% of the
population having access, including the rural farmer
base
Farmer education
• Extension workers, NGOs, and other agriculture
actors will need to train farmers on usage of virtual
system, but this is a relatively easy task given high
levels of literacy and mobile phone usage
Privacy
• Collection of metadata may be non-objectionable,
but farmer-specific information has the potential for
misappropriation
C
6.1 AGRICULTURE – POTENTIAL APPLICATIONS OF DF+ TO ADDRESS BARRIERS

75
E-wallet for input subsidy disbursement and integrated hosting of
all farmer financial flows (3/3)
Case examplesGo-to-market model
Nigeria Ministry of Agriculture: E-Wallet
program
• The Nigeria Agro E-Wallet program has
achieved great success in reducing transaction
costs and addressing corruption in the
traditionally government controlled
procurement and distribution of seeds and
fertilizers
• Over a 2-year period, the program has
reached 5 million farmers and is estimated to
have enhanced the food security of 25 million
people in rural farm households
C
• Ministry of Agriculture
collaborates with telco to
create a farmer database
with biometric information
uniquely identifying each
individual
• At the beginning of crop
season, MoA deposits the
value of all input vouchers
distributed into its own
mobile money account
• Agro-dealers unlock access
to mobile funds by inputting
PIN codes sent to eligible
farmers via SMS
6.1 AGRICULTURE – POTENTIAL APPLICATIONS OF DF+ TO ADDRESS BARRIERS

76
Weather-indexed crop insurance product enabled by digital claims
processing and payment platform (1/3)
Value proposition Product details
Financial
instrument
Digital platform for purchasing of plan,
processing of claim, and disbursement of payout
Target
audience
Producers of eligible crops procuring inputs
from approved agro-dealers
Product
provider
Insurance + Seedco + Telco + development
institution
Core product features
• Weather-indexed insurance product to mitigate the risk of extreme weather events that is tacked onto
purchase of improved input and administered entirely via mobile phone and remote sensing
technology
• Premium is shared 50/50 between seedco and farmer and added onto purchase price
• Each purchased bag of seed/fertilizer/chemical contains a scratch card with a unique code, which is
logged into mobile application by farmer for official registration, with insurance details, including
policy numbers and terms and conditions
• Micro-climate-level hydrological data is continuously collected using satellites and automated
weather stations
• Claims process is automated – at the end of each year’s growing season, that year’s hydrological
condition is automatically assessed vs. historical indexes to determine the level of adverse variance;
farmer receives SMS with determination of payout
• If payout is determined to be necessary, fund is automatically disbursed via mobile payment solution
Potential extensions
• Linking with input credit: farmers can be extended loans and other financial products because of the
protection the enjoy
• Linking with agro-marketing scheme : processors and other off-takers can get into pre-contracted
sales
DF+ specific value proposition
• Digital sign-up for insurance policy by
farmer
• Remote hydrological data collection and
automated claim assessment by insurance
company
• Digital receipt of claim disbursement by
farmer
Overall value proposition
• Makes insurance more affordable by
reducing the transaction cost of
underwriting and claims assessment
• Drives farmers to invest in improved inputs
with security that losses will be mitigated
• Opens the door to farmer access to more
financing by value chain and FI actors
• Increases overall crop yields and farmer
incomes
Product summary
• Weather-indexed insurance product to mitigate the risk of extreme
weather events whose purchase, management, claims processing,
and payout is digital
Financial needs addressed
• Protection from the financial risk posed by extreme weather conditions
• Addressing the need for an affordable insurance product with
convenient plan management and payout disbursement options
D
6.1 AGRICULTURE – POTENTIAL APPLICATIONS OF DF+ TO ADDRESS BARRIERS

77
Weather-indexed crop insurance product enabled by digital claims
processing and payment platform (2/3)
Detailed impactFeasibility assessment: business model
Feasibility assessment: enabling
environment
• Where targeted insurance
products have been
applied, policyholders
have experienced
wholesome results in
catastrophic events
• Some of the positive
outcomes associated with
crop insurance coverage
include
– 19% increased
investments and
16% higher incomes
to uninsured
neighbors
– Nearly 100% of
participants were
able to secure other
types of financing
because they had
insurance
Establishing the relationship between weather and crop
yield
• The strongest correlations can be drawn where rainfall
deficit is the trigger, a single crop is concerned, and
there is a marked rainy season and no irrigation; the
absence of more complex variables like humidity, hail,
etc., make establishing relationships difficult
Depth of historical weather data
• Severe limitations in reliable access to long-term
hydrological data on which to base crop indices
• On average, 10-20 years of historical rainfall data is
required, which can be absent for large parts of
Tanzania
Scale
• Actuarial profitability through spreading of risk is driven
by coverage of the full spectrum of producer
populations, including farmers in areas of low
hydrological risk; may be difficult to convince farmers
facing low risk to pay insurance premiumsGovernment regulation
• No known government policy constraints
Telco infrastructure
• High mobile phone penetration, even
among the rural farmer base
Product Financing
• Development foundations and non-profit
actors (e.g., IFC, Syngenta Foundation)
have proven willing to fund part of the
plan development and underwriting cost
• Seedcos have shown willingness to
share cost of farmer payment of
premiums
• However, most insurers in this space
can only extend services to cover
farmers producing specific crops using
specific inputs, with the implicit risk-
sharing/financial support by value chain
players and development actors
Feasibility
• Feasible: value chain actors and development
institutions have proven technical ability and the
financial will to create the right types of
insurance products, although they are somewhat
inhibited by the absence of historical data
Potential impact
• High: successful cases of payouts have
encouraged farmers to invest in inputs and
farming best practices; however, certain types of
insurance only cover the value of input and not
the entire harvest
Low High
D
6.1 AGRICULTURE – POTENTIAL APPLICATIONS OF DF+ TO ADDRESS BARRIERS

78
Case examplesGo-to-market model
Weather-indexed crop insurance product enabled by digital claims
processing and payment platform (3/3)
• Development institution partners with
insurance company and seedco to define
a target farmer population and specific
crop types
• Consortium models risk by specific crop
type, develops crop indices, and secures
historical data
• Creates automated claims resolution
algorithm that will be triggered on an
annual basis
• Partners with national weather service to
capture data at weather stations in all
relevant districts
• Taps into seedco’s distribution network of
agro-input dealers; trains them on
marketing techniques and farmer
education on insurance benefits
• Telco builds weather insurance interface
into existing payment platform
Kilimo Salama – IFC, Syngenta
Foundation and Safaricom collaboration
• Weather index, area yield index, and
satellite-based index insurance schemes
against perils including drought, excess
rain, and disease
• Average cost of premium is 5-10% of the
value of insured inputs/harvest
• 185,000 farmers reached in Kenya,
Rwanda, Tanzania
• Total insurance portfolio of $25.4 million
and total payouts of $356,707
D
6.1 AGRICULTURE – POTENTIAL APPLICATIONS OF DF+ TO ADDRESS BARRIERS

79
Voice-enabled mobile information system for the dissemination of
agronomic information, market prices, and weather data (1/3)
Target
audience
All smallholders with mobile
telephone access
Financial
instrument
Product
provider
Farmer helpline for agronomic
information, market prices, and
weather forecast
Partnership includes development
institution, telco, and government
Value proposition Product details
E
Core product features
• Mobile-phone-based application with dual access points to agronomic, hydrological, and market
information
• First option is a weekday, business hours helpline, with real-time access to an agricultural expert for
complex queries (e.g., diagnosis of crop disease). English, Swahili, and local vernacular options. Allows
upload of images
• Second option is a 24-hour Audio Voice Recorder (AVR) dial-in number powered by a menu-based issue
resolution system for more routine queries (e.g., location of agro-dealer)
• Staffed with MSc graduates and database with content on land preparation, planting, pest management,
etc.
• SMS option for market- and commodity-specific information refreshed on a daily basis
• SMS option for 10-day weather forecasts with a tight focus on agriculture-pertinent variables and specific
to the relevant locale
• User profile is developed for each expert query, with location of farmstead, type of agronomy, size of farm
etc., logged
• Pricing: for SMS and AVR options, farmers pay regular airtime and data tariffs; for agro expert queries,
farmers pay a small premium in addition to regular tariffs
Potential extensions
• Credit risk assessment: the rich trove of passively and actively collected data on farmers and their
circumstances (plot sizes, crops planted, yield performance, time to market, propensity for disease, etc.)
can be used to assess smallholder need and worthiness for financial products like input credits, WRS
participation, and linkage with agro-processors, among other things
DF+ specific value proposition
• Enables the provision of high-quality,
reliable, timely, and affordable
information to the farmer directly via
his/her handheld device
• Decreases the transaction cost of
disseminating yield-enhancing
information
Overall value proposition
• Creates a two-way communication
channel between farmers and
agricultural experts to address the
information deficit and lack of
extension reach that smallholders
often face
• Helps farmers increase their post-
harvest income through improved
productivity, enhanced crop yields,
better understanding of demand, and
higher sale prices
Product summary
• Mobile-phone based information portal to enable the collection, storage, and
dissemination of agronomic information , localized market price information and ag-
specific weather forecasts to benefit smallholder yield outcomes
Addressed financial need
• Smallholders’ lack of awareness of cultivation and harvest best practices, insights
into hydrological conditions and commodity-specific market prices
• Credit profile and financial information absence on farmers
6.1 AGRICULTURE – POTENTIAL APPLICATIONS OF DF+ TO ADDRESS BARRIERS

80
Voice-enabled mobile information system for the dissemination of
agronomic information, market prices, and weather data (2/3)
Detailed impactFeasibility assessment: business model Feasibility assessment: enabling environment
Access to primary information
• Market and weather data has to be timely and location-
specific to be relevant to farmers; capability of market
information providers and national weather service has to
be built further
Marketing
• Radio, widely used in TZ, is the most effective channel for
reaching farmers, with peer-level testimonials of product
efficacy and demoing by “last mile” reach organizations
Distribution
• Language barriers (100+ tribal languages spoken), low
levels of literacy (67%), and format limitations (SMS has
character limits) could be a consideration; however, mobile
penetration is high and the majority speak Swahili
Privacy
• Collection of metadata may be non-objectionable, but
farmer-specific information has the potential for
misappropriationGovernment regulation
• No known government policy constraints
Telco infrastructure
• Tigo is a market leader through its
TigoKilimo platform; plans to reach more
than 2 million users
Product financing
• Development foundations and non-profit
actors (e.g., Rockefeller Foundation, GSMA
Foundation) have demonstrated willingness
to fund pilot versions and to establish the
commercial viability of model
• However, successful revenue generation
models (e.g., through user subscription fees,
population-level data vending to seedcos)
have to be developed further for private-
sector ownership
• Tanzania farmers
with cell phone
access (56% national
penetration) can be
beneficiaries of at
least the basic
offerings of the
service
• Tigo’s program in
Tanzania has already
covered 100,000;
plan to cover 2 million
farmers in the next 5
years
Feasibility
• Moderately feasible: a number of players
have proven the technical feasibility of
creating the service and spurring adoption;
however, ability to create profitable, self-
sustaining business models is still
uncertain; true commercial viability may
require more than 2 million users
Potential impact
• Given the wide reach of mobile technology and
adoption of the service (at steady state), the
number of farmers reached can be
tremendous; those who are informed on how to
best use the service will benefit greatly from it
Low High
E
6.1 AGRICULTURE – POTENTIAL APPLICATIONS OF DF+ TO ADDRESS BARRIERS

81
Voice-enabled mobile information system for the dissemination of
agronomic information, market prices, and weather data (3/3)
Case examplesGo-to-market model
M-Kilimo: GSMA, Development
Fund, mAgri, KenCall (Kenya)
• Farmer helpline initiative to prove
viability of agriculture mobile,
value-added service products
• Objectives are to set up fully
functioning informational service
and to understand farmer needs
• Service available to all Kenyan
farmers with a mobile phone,
irrespective of network affiliation
TigoKilimo: Tigo and Technoserve
collaboration
• Farmer helpline with agronomic,
market, and weather information
access, modeled after successful
M-Kilimo in Kenya
• Pilot of service completed in
Morogoro region, with 150
participating farmers
• Service to scale nationally in 2014
• Development institution (e.g., Technoserve)
partners with telco provider (e.g., Tigo) to create
and brand the mobile-based service, which
undertakes the following
– Defines knowledge scope, codifies required
agronomic information, creates static and
dynamic content management system, and
recruits and trains call center talent
– Creates link with MoA1 for automated sourcing
of price points for defined commodities in
location-specific markets
– Partners with government meteorological
service for automated sourcing of location-
specific reporting
– Establishes the helpline and develops the AVR
algorithm; pilots usage with a select group of
farmers
– Markets to the broader population by
advertising on the radio with farmer testimonials
and demoing through partnership with NGOs
and government extensions works
E
1 MoA …
6.1 AGRICULTURE – POTENTIAL APPLICATIONS OF DF+ TO ADDRESS BARRIERS

82
DF+ solutions have different impact … Key takeaways
Imp
act
High
Medium
Low
Low Medium High
Feasibility
• Agriculture is a moderately attractive sector for the
adoption of DF+ solution – currently, few players in
Tanzania are operating on a commercially viable
scale, mostly due to the challenges inherent in the
sector, including the high volatility of harvest, the
fragmentation of the producer-base, and the limited
credit knowledge of smallholders
• However, several players are addressing some of
the systemic challenges, by for example, helping
farmers to self-organize into entrepreneurial
associations (RUDI, Faida MaLi) and creating
mobile-based informational portals for farmer
education (TigoKilimo)
• Additionally, value chain and financial actors are
banding together to innovate products like input
financing (e.g., Monsanto, Yara and Barclays) and
WRS-based liquidity (e.g., ETG and NMB)
• Going forward, mobile phones are going to be
critical to decreasing the transaction cost of
providing farmers informational and financial
services, assessing the credit risk of loan product
applicant and helping farmers link to markets
• WRS-based
credit provision
• Input credit in
closed-loop
ecosystem
• Weather-
indexed crop
insurance
• E-wallet for
digitized
government
input subsidy
• Digital
agronomic info
dissemination
and gathering
for future DF+
application
AB
C
D E
Potential DF+ applications in agriculture can be categorized based
on their feasibility and potential impact
6.2 AGRICULTURE – VIABILITY OF OBSERVED AND POTENTIAL BUSINESS MODELS

83
Sector readiness dimension
Sector-rele-
vant mobile
infrastructure
reach and
adoption
Readiness of
financial and
digital
financial
infrastructure
65
4 32
1
65
4 32
1
Role of
government
and
regulation
6
54 3
2
1
Severity of
sector
challenges
65
4 32
1
Financial gap
in sector
65
4 32
1
DF+ business
models and
scaling
65
4 32
1
Reach
Reach of mobile
infrastructure
Adoption of mobile
technology
Financial product
offering to sector
Availability of
DF+ solutions
Sector-specific
regulation
Role of
government
Stakeholder
complexity
Non-financial chal-
lenges in sector
Execution and
scalling ability
Depth of financial
gap
Availability of DF+
business models
Sub-dimensions
Applicability of
DF+ solutions
DF+ readiness assessment – DF+ implementation in the
agriculture sector faces varying levels of constraints
▪ 85% of the country are covered by a 2G network, with some concern around the quality of service in the most rural areas
▪ High penetration, at ~60% of households, with some concern around ownership of handsets and proficient usage by poorest farmers
▪ Traditional financial institutions offer limited credit to farmers without value chain actor guarantees or crop deposit collateral; MFIs lend at annual rates of up to 100%
▪ Present but not scaled – WRS-based post-harvest credit provision, input credit in closed-loop ecosystems, and value chain payment facilitation
▪ No regulatory barriers – regulations on formation of producer associations and export controls have been relaxed
▪ Policy priority for the government; but public spending on the sector is below the target of the 10% of national budget
▪ Moderate complexity – several actors involved along value chain, but roles and interaction are relatively well-defined
▪ Severe non-financial challenges related to quality farmer education, organization, enterprise, and supply/demand dynamics
▪ The majority of farmers cannot access credit support for critical steps of input acquisition and post-harvest liquidity
▪ DF+ solutions can play a significant role by facilitating value chain actors’ market linkages, reducing transaction costs and financial transparency
▪ Value chain actors collaborate to share risk and create “closed loop” ecosystems to provide of DF+ enabled financial products in controlled circumstances
▪ Value chain actors have proven that they can successfully execute, but solutions still apply to small niche of “emerging farmers” meetings a set of selective criteria
6.2 AGRICULTURE – VIABILITY OF OBSERVED AND POTENTIAL BUSINESS MODELS
1
Binding constraint Readiness for scaling
2 3 54 Explanation

84
In the agriculture sector, DF+ solutions have been applied to
enable financing solutions with some success In
terv
en
tio
n
Discovery
Piloting
Scale
Application
Expansion &
differentiation
Global scaling
DF+ solution
maturity
• Growth financing/
subsidy
• Growth financing/
subsidy and
innovation
support
• Implementation
support
• Convene
stakeholders to
discuss
expansion
• Financial and
technical advice
during piloting
phase
• Best practice
sharing
• Operating model
development
activities
• DF+ has helped to address a number of the financing gaps faced by smallholders in agriculture, including by facilitating
virtual market linkages, decreasing transaction costs, and increasing the transparency of financial flows
• Value chain actors acting in concert, as well as a few telcos, have been the main drivers of DF+ solutions, with products
like WRS-based credit provision and off-take-linked input loans enabled by closed-loop ecosystems and risk-sharing
• Scaling and full commercial viability require more active financial institution involvement in the space, as well as improved
organization and entrepreneurship of producers, with development of market demand for more crop types
DF+ business
model in ideation
or early develop-
ment stage
Individual DF+
business models
are being piloted
in controlled
environments
DF+ business
models are rolled
out under market
conditions
Existing DF+
business models
are being
innovated and
differentiated
Successful DF+
business models
are scaling
nationally
6.3 AGRICULTURE – SCALING AND EXECUTION CAPABILITIES

85
Agenda
Sector analysis – agriculture
Sector analysis – health
Sector analysis and challenge identification
Assessment of financial service needs and gap analysis
Digital finance plus feasibility assessment
Readiness framework
Access to and reach of mobile infrastructure
Adoption and reach of digital finance infrastructure
Role of the government and regulation
Sector analysis – energy
Sector analysis – water
Sector analysis – education

86
Key takeaways: Health sector analysis and challenge
identification
HEALTH – SECTOR ANALYSIS AND CHALLENGE IDENTIFICATION
4.1 Sector description
4.3 Sector-specific regulations
4.2 Sector impact on low-income households
4.4 Sector challenges
• Across health outcomes, from targeted interventions to overall system health, low-income households fare worse than their wealthier
counterparts (~3X the difference in births attended by skilled personnel, 2X the difference in use of contraceptives)
• Government spend benefits the top quintile 2X more than bottom quintile because of the allocation of funds to facilities with lower low-income
house usage
• Low-income households also face substantially higher cost shocks because of healthcare spend
• Low-income households receive the majority of their care in facilities that are government-run or subsidized
• Government involvement in these facilities includes the provision of Rx through a centralized Medical Storage Department, payment of doctor
salaries, provision of subsidized Community Health Fund insurance schemes and offering of free maternal and under-5 care
• Private providers are a much smaller part of the Tanzanian health economy, as they are generally in urban areas; they access private supply
chain Rx/equipment and accept government-run formal sector health insurance (National Health Insurance Fund)
• A variety of health sector challenges affect the cost and quality of the care low-income households receive
• Facilities (particularly rural public ones) lack available Rx, functional equipment, basic utilities, and hospital beds
• The quality of care suffers from continuous Rx and equipment shortages, while medical staff often does not adhere to best practices
• Patients themselves have little knowledge of health problems and potential treatments, most low-income households face significant
logistical and financial challenge seeking care when they decide to do so
• Tanzania’s disease burden is heavily skewed toward communicable diseases (malaria and HIV make up >1/3 of the country’s disease
burden)
• The government spends less than peers on healthcare (lower half of peer countries), elevating the role of donors (providing 40% of funding)
who have focused on communicable diseases leading to divergent availability and quality of treatment for different conditions
• The role of donor- and government-focused efforts are evident in Tanzania’s strong targeted intervention results (e.g., 2nd highest measles
immunizations) but the overall system health is low (e.g., 2nd highest maternal mortality rate among peers)

87
Infectious diseases dominate Tanzania’s disease burden
48
21
17
18
8
10
7
13
8
4
9
6
11
8
8
10
14
14
10
23
16
15
5
4
7
6
5
6
4
5
6
7
14
7
13
7
5
6
6
5
4
4
5
3
5
Ethiopia
Rwanda
Senegal
Ghana
Nigeria
Kenya
South Africa
Uganda
Tanzania
SOURCE: Institute for Health Metrics and Evaluation
4.1 HEALTH – SECTOR DESCRIPTION
Key takeaways
Percentage of years of life lost (top 5 conditions)1
Ordered by percentage of communicable diseases
1 Year of life lost as calculated by WHO
Meningitis
Tuberculosis
Interpersonal violence
Preterm birth complications
Neonatal encephalopathy
Diarrheal diseases
Malaria
Lower respiratory infections
HIV/AIDS
Tanzania’s disease burden compared to its peers
• Tanzania has one of
the highest rates of
HIV/AIDS and
malaria (>1/3) among
its peers
• Donors focus on
communicable
diseases including
providing free HIV
drugs and malaria bed
nets and intervening
in the supply chain to
ensure delivery
• Almost 48% of
Tanzania’s disease
burden is accounted
for by other conditions
with >2% each -
suggesting broad
system improvements
are necessary to
comprehensively
address the country’s
health issues

88
Low per capita health expenditure is driven by comparatively low
government spending, which is only partially offset by high donor funding
Key takeaways
50
72
85
117
Rwanda 120
Nigeria 128
South
Africa915
Ethiopia
Kenya
Ghana
Tanzania 100
Senegal 111
Uganda
External health funding
Percentage of total health care spending
Government health spend
Percentage of total government spend
Per capita total expenditure on health
USD, PPP
SOURCE: WHO
36.1
Kenya 37.9
Tanzania 39.6
Rwanda
South
Africa2.2
Nigeria 8.7
Ghana
48.0
16.5
Senegal 18.4
Uganda 27.6
Ethiopia
23.3
10.8
Tanzania 11.1
Ghana 12.1
Senegal 12.1
South
Africa12.4
Ethiopia 13.7
Rwanda
5.7Nigeria
Kenya 5.9
Uganda
2013Tanzania’s health expenditure in comparison with its peers
• Tanzania’s lower per
capita spend is a
result of the
Tanzanian govern-
ment devoting a
smaller portion of
its national budget
to health care than
some of its peers
• Lack of spending is
evident in the
government-run
National Health
Insurance Fund for
public sector workers,
which does not spend
80% of the revenue
it collects from
payroll tax
• Almost 40% of total
health care
spending in
Tanzania comes
from external
donors; the majority
of these fund go
towards HIV and
Malaria
4.1 HEALTH – SECTOR DESCRIPTION

89
Tanzania performs well on selected and
very targeted interventions
38
36
32
26
25
25
19
19
Uganda
Ghana
Senegal
Kenya
Tanzania
Ethiopia
Nigeria
Rwanda
93
57
71
75
82
87
91
93
95
High
income
Ethiopia
Nigeria
Uganda
Senegal
Kenya
Ghana
Tanzania
Rwanda
16
22
22
26
28
29
31
35
Uganda
Senegal
Ghana
Tanzania
Nigeria
Rwanda
Ethiopia
Kenya
14
Nigeria
High
income
630
Tanzania 460
Senegal 370
Kenya 360
Ethiopia 350
Ghana 350
Rwanda 340
Uganda 310
Tanzania has good outcomes for targeted interventions, average outco-
mes for public health initiatives, but struggles in overall system strength
SOURCE: WHO 2013
2013
1 Unmet needs describe sexually active individuals not using any method of contraception who report not wanting any more children or
wanting to delay the next child; number used is average of male and female
Key takeaways
Measles immunization %
Tanzania produces average outcomes
on broader public health interventions
People’s use of condoms during high-risk sex%
Family health planning shortage1
%
Overall system health remains below
average
Maternal mortality ratioPer 100,000 births
• Targeted interven-
tions, many funded
by external donors,
have helped vault
Tanzania to the top
of its peers on
focused efforts
• Tanzania’s overall
public health results
have improved less
dramatic, reflecting
challenges with less
focused interventions
• Overall, the
Tanzanian health
system remains one
of the weakest
among its peers
4.1 HEALTH – SECTOR DESCRIPTION

90
Current government spending is relatively low and
disproportionately benefits wealthier Tanzanians
Government spending on healthcare
disproportionately benefits the rich1
18
11
20
17
21
37
36
29All 46
Inpatient 56
Outpatient 48
Primary 39
SOURCE: Left-hand side: WHO; Middle: IFC; Right: WHO
1 Benefit incidence compares the cost of providing services with the population who uses the services, as a means of identifying spending beneficiaries
Richest 5th
Poorest 5thPercentage of spend used by
population quintile
Government spending is low, leading to
a substantial private contribution
Percentage of health spend paid for by
government
Uganda 23.1 76.9
Nigeria 31.5 68.5
Tanzania 39.2 60.8
Kenya 40.2 59.8
South Africa 46.6 53.4
Ethiopia 52.9 47.1
Rwanda 54.8 45.2
Senegal 56.9 43.1
Ghana 58.2 41.8
Key takeaways
PrivateGovernment
2013
4.2 HEALTH – SECTOR IMPACT ON LOW-INCOME HOUSEHOLDS
• A disproportionate
share of Tanzania’s
healthcare is funded
by private spending,
resulting in a
structural
disadvantage for low
income households
• The disproportionate
benefit of government
spending for high-
income households is
due to high cost of
specialized hospitals
and teaching institutions
that are not accessible
geographically or
financially for many low -
income households

91
Across quality of care measures, poorer Tanzanians lag their
wealthier peers, health expenses pose a higher burden for them
SOURCE: WHO 2013
Key takeaways
2013
104
84
48
27
84
97
19
38
33
90
37
59
Bottom quintileTop quintile
Overall
infant
care
Public
health
Use of
system
Children under-5
stunted
DTP3 shot receipt (%)
Under-5 mortality (per
1,000)
Contraceptive
prevalence (modern
methods)
Percentage of births
attended by skilled
personnel
Antenatal care (at least
four visits)
Percentage of Non-food
spending on health1
Patients
1 Approximate numbers taken from WHO report where Extreme Poor are defined as being below food poverty line
2 Statistic calculated by examining what income would be in absence of health expenses
Poorer Tanzanians have worse health outcomesPayment is harder for them too
2
Extre-
mely
poor
Poor
Non-
poor
9
19
8
603617
5
4
10047 2816
7039
Over 5% Over 20%
Over 30%Over 10%
• Low-income
households show
systematically lower
health outcomes
across a group of
indicators
• At the same time
health expenditure
constitutes a
significantly larger
share of household
spending for low-
income households
than for high income
households, thus
increasing the risk of
poverty further
• Health spending
accounts for 4.2% of
the nation’s poverty
count2
4.2 HEALTH – SECTOR IMPACT ON LOW-INCOME HOUSEHOLDS

92
Build desire to accessAbility to
access
The Tanzanian health sector includes, government entities,
informal private actors and formal private actors
4.3 HEALTH – SECTOR-SPECIFIC REGULATION
1 In 2010, 17.5% of facilities were ADDOs and 29.9% were traditional DLDBs. The Pharmacy Council of Tanzania now states that ADDO implementation
has been countrywide meaning only a small number of DLDBs exist.
Govern-
ment role
Informal
private
• ~47.5% Accredited
Drug Dispensing
Outlets (certified
informal duka la
dawa baridis)1
• Medical Storage
Department run by
the government
provides Rx and
equipment to public
facilities
• Government
negotiates
discounted rates
with equipment and
Rx providers
• 32% of pharmacies
are public
• Dispensaries ~4,700 (68% public) have nurses conduct
normal deliveries and basic curative care
• Health centers ~500 (71% public) include minor
surgeries, augment coverage with outreach
• District hospitals ~85 are first level of referral, have
inpatient and diagnostic services
• Regional hospitals ~20 offer specialized secondary
care, have surgeons
• National referral hospitals ~5 provide some tertiary
care, have research and educational training
• 41% of hospitals are government-run
• In rural areas, faith-based-organizations often control
the majority of care
• ~80,000 traditional healers
• Full government
financing of basic
services to all
providers (though
73% pay for free
maternal services)
• National Health
Insurance Fund for ~2
million public sector
workers and family
• Community Health
Fund insurance
available to 90% of
Tanzanians in the
informal sector but
little uptake; 1.7
million members;
does not include
catastrophic care
• The government
leads these
campaigns, many
funded via external
sources (e.g.,
Global Fund,
PEPFAR) with
earmarked purpose
(thus the
government uses
little discretionary
funds)
Formal
private
• ~13K
pharmaceutical
dispensaries
• Other dispensaries
are private, not-for-
profit, and faith-
based facilities
(~14%) and retailers
(8%)
• Global Fund ~1/5 of
HIV/AIDS
expenditures
• PEPFAR and UNICEF
also fund
• Ability to access also
determined by
transport and
accommodations
• NGOs (e.g., GIZ) in
collaboration with
the government run
informational
campaigns on
reproductive health,
maternity, HIV
• Medical schools
produce ~2,000
graduates/year in
5-year programs
• Government
subsidizes ~50% of
medical student
tuition costs
Labor
Provision of care
Infra-
structure
Rx/
equipment
Input production/distribution
Rx and
equipmentMedical training
1 2 3 4

93
The Tanzanian government has launched several national health
efforts including a multifaceted eHealth initiative
eHealth initiatives Key government efforts
Health Sector Strategic Plan III
• Outlines priorities from 2009-2015 with a focus on MDGs
• Focus areas include increasing access to referrals hospitals,
better maternity and child care, primary care strengthening, and
public-private partnerships
• Pay for performance initiatives reward districts and facilities for
meeting quality outcomes for the populations that they see;
facilities then distribute these funds to their health workers as
they see fit
Implementation
• Regional administration and local government (PMO-RALG)
monitor, supervise, and coordinate implementation
• 2009 National Public-Private Partnership Policy outlines a
regulatory and institutional framework for expanding private
provision of public services (formal arrangements were formerly
uncommon)
Going Forward
• Tanzania has publicly stated it will meet the Abuja Declaration-
recommended level of spend (15% of government budget on
health), which would require a significant increase in funding
• Current government efforts are focused on
three categories
– Health informatics (basic data collection)
– eLearning (using technology for knowledge
exchange)
– Telemedicine
• Attempting to implement basic computer
systems in facilities and use for management
• Decentralized roll-out on district-and facility-
levels, with regional and national governance
structures providing support
• No clear agenda for digital payment adoption,
as plan was formalized before widespread
adoption of mobile payments
• Facilities are late adopters of digital payments;
thus while the government focuses on mobile-
enabled information products, mobile-enabled
financial products are largely neglected
4.3 HEALTH – SECTOR-SPECIFIC REGULATION
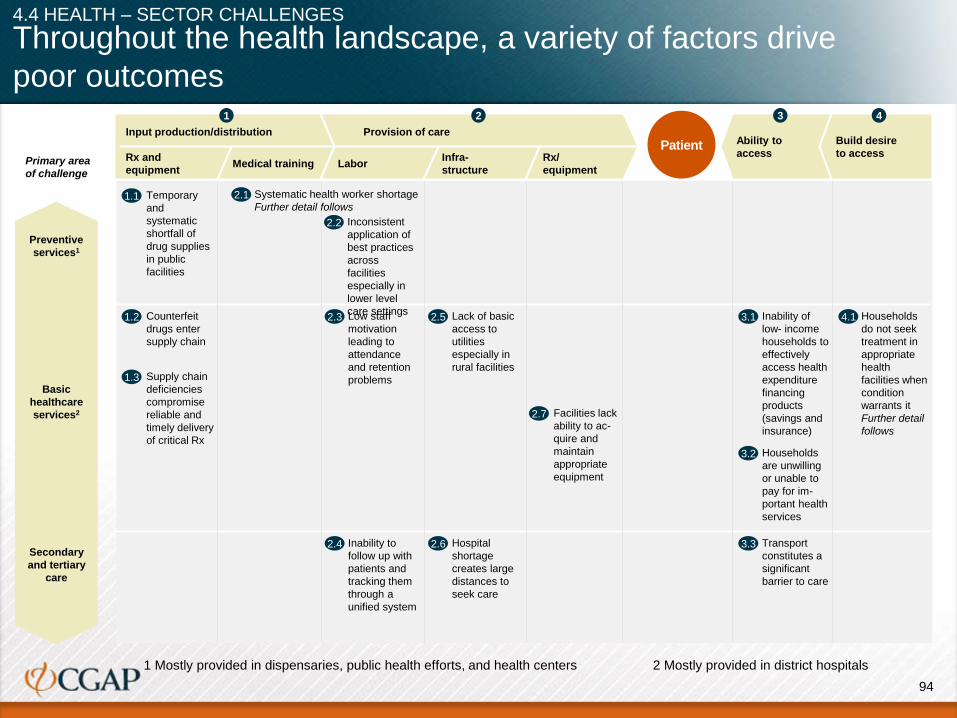
94
3.3 Transport
constitutes a
significant
barrier to care
2.4 Inability to
follow up with
patients and
tracking them
through a
unified system
2.6 Hospital
shortage
creates large
distances to
seek care
2.7 Facilities lack
ability to ac-
quire and
maintain
appropriate
equipment
4.1 Households
do not seek
treatment in
appropriate
health
facilities when
condition
warrants it
Further detail
follows
Low staff
motivation
leading to
attendance
and retention
problems
2.3 2.5 Lack of basic
access to
utilities
especially in
rural facilities
Counterfeit
drugs enter
supply chain
1.2
Supply chain
deficiencies
compromise
reliable and
timely delivery
of critical Rx
1.3
1.1 Temporary
and
systematic
shortfall of
drug supplies
in public
facilities
2.1 Systematic health worker shortage
Further detail follows
2.2 Inconsistent
application of
best practices
across
facilities
especially in
lower level
care settings
Households
are unwilling
or unable to
pay for im-
portant health
services
3.2
Inability of
low- income
households to
effectively
access health
expenditure
financing
products
(savings and
insurance)
3.1
Throughout the health landscape, a variety of factors drive
poor outcomes
4.4 HEALTH – SECTOR CHALLENGES
1 Mostly provided in dispensaries, public health efforts, and health centers 2 Mostly provided in district hospitals
Ability to
access
Build desire
to accessLabor
Provision of care
Infra-
structure
Rx/
equipment
Input production/distribution
Rx and
equipmentMedical training
1 2 3 4
Primary area
of challenge
Patient
1.3
1.2
Secondary
and tertiary
care
Preventive
services1
Basic
healthcare
services2

95
Poor Rx distribution leads to low Rx availability
Drug availability continues to be a challenge in Tanzania
SOURCE: WHO 2013; Kaur et al, A Nationwide Survey of the Quality of Antimalarials in Retail Outlets in Tanzania, Plos (2008)
1 WHO collects metric that is “Median availability of selected generic medicines in public and private sectors (%); South Africa data not available for public facilities
Key takeaways
Public facility selected drug availability1
2013, %
Private facility selected drug availability
2013, %
18
20
23
26
38Kenya
Nigeria
Ghana
Uganda
Tanzania
36
45
48
72
72
80Uganda
Nigeria
Ghana
Tanzania
South Africa
Kenya
• Drug availability across Tanzania is below that of
regional peers
• Drug availability in public facilities is systematically
lower than than in private facilities
• Low drug availability in public facilities is driven by a
number of challenges:
– While government can procure Rx and equipment
at discounted prices, it only adjusts delivery on a
quarterly basis
– Counterfeit drugs pose a significant challenge -
one study found 12.2% of oral antimalarial tablets
were of poor quality, though the government has
cracked down on the illicit counterfeit market
– Insufficient Cold chain storage, facility
capabilities, and data collection make it hard to
manage drug availability effectively
1.1-
1.3
4.4 HEALTH – SECTOR CHALLENGES

96
The number of doctors and nurses in Tanzania is far
below its peer countries
It is particularly bad in rural areasLow level of overall medical personnel
Distribution of doctors
2012, %
Doctors per 1,000 inhabitants
2013
0.1
0.3
0.6
0.6
0.9
1.2
1.8
4.0
High income 27.1
Tanzania
Ethiopia
Rwanda
Senegal
Ghana
Uganda
Kenya
Nigeria
2.4
2.5
4.2
6.9
7.9
High income 72.4
Tanzania
Ethiopia
Senegal
Rwanda
Kenya
Ghana 10.5
Uganda 13.1
Nigeria 16.1
SOURCE: Left-hand side: WHO 2013; Right-hand side: TSPS, 2006; MOHSW; Touch Foundation; interviews; team analysis,
MHSW Human Resource for Health Country Profile 2013
Key takeaways
2.1
Nurses per 1,000 people
% of health spend paid for by gov., 2013
50
18
31
73
9
20
Other urban
Dar es
Salaam
Rural
Distribution
of population
Distribution
of doctors
• Tanzania has 3 times
less doctors than any
other peer
• This problem is further
exacerbated in rural
areas as less than 1/3
of Tanzanian doctors
work in these areas
while over 70% of the
population is rural
• MOHSW stated
educational institutions
had a 74 percent
shortage of staff at
already limited
teaching facilities
• Medical education
costs are prohibitively
expensive for most
Tanzanians
• Many graduates
cannot find jobs in
Tanzania
84Public Private16
4.4 HEALTH – SECTOR CHALLENGES

97
Staff management challenges and a low level of medical
expertise further hurt Tanzania’s health system
• A 2012 survey reported that only 13% of
health facilities realized best practice of
having a supervisor visit monthly
• While health workers report their activities to
the government, they rarely, if ever, have
the quality of their clinical work checked or
receive guidance and coaching
Lack of knowledge
• Provision of Artemisinin-based Combination
Therapy (ACT) in the case of uncomplicated
malaria is a clearly outlined national best
practice, yet a 2013 study found that less
than 60% of patients with uncomplicated
malaria in facilities with ACT were given
it
• A 2012 study in Northwest Tanzania found
that while most health workers knew
cervical cancer existed, very few were
cognizant of its cause or the existence of the
HPV vaccine
• This lack of knowledge echoes anecdotal
evidence of health workers providing
outdated and incorrect care
SOURCE: 2.5: Manzi et al. Human Resources for Health 2012, 10:3
Lack of supervisors
Inconsistent application of best practices
• Health workers have reported job
dissatisfaction because of difficulties
multitasking in an environment of staff
shortages, a desire for more structured and
supportive supervision from managers, low
wages, and improved transparency in
career development opportunities
• This dissatisfaction produces problems as
primary care worker absenteeism rates are
often around 40%
• In 2012, doctors held several extended
strikes expressing their dissatisfaction with
their pay and working conditions
Job dissatisfaction
Low staff motivation2.32.2
Provider-provider communication
Provider-patient communication
• Patient health records are maintained on
paper and given to the patient, making it
difficult for different care centers to
determine a patient’s medical history during
their visit and track their health afterwards
• Anecdotal reports indicate different care
centers rarely communicate one another
• Health workers reported in focus groups
that they lacked knowledge of appropriate
referral paths owing to a lack of
communication with other facilities
• Only 10% of those with hypertension
receive ongoing treatment, creating a
status quo where only 1% of those with
hypertension have controlled cases
Inability to track patients2.4
2.2-
2.4
4.4 HEALTH – SECTOR CHALLENGES

98
Facilities lack
equipment2.7Lack of basic access to utilities
Regular water supply1
%
Regular electricity supply (or generator)2
%
Emergency capabilities – Basic components3
%
2.5
Health workers practices in facilities that lack basic resour-
ces and are inadequately size for the population they serve
SOURCE: Left-hand: MOHSW, TSPS 2006; Right-hand: WHO 2013
1 Year-round water supply in facility, or within 500 m of facility ; 2 Electricity routinely available during service hours, or a back-up generator
with fuel
3 At least 2 qualified personnel assigned for facility, observed duty schedule, overnight beds, 24 hr emergency communications
24334142475057
Private
for-profit
Govern-
ment
Dispen-
saries
Health
centres
Hos-
pitals
Faith-
based
organiza-
tion
Para-
statal
22304656677082
Hos-
pitals
Govern-
ment
Dispen-
saries
Faith-
based
organiza-
tion
Health
centres
Private
for-profit
Para-
statal
001521404462
Hos-
pitals
Private
for-profit
Faith-
based
organiza-
tion
Govern-
ment
Dispen-
saries
Health
centres
Para-
statal
Key takeawaysHospital shortage2.6
Hospitals beds per 10,000
population
5.0
7.0
9.0
High
income56.0
Uganda
Tanzania
Ghana
Kenya 14.0
Ethiopia 63.0
• Tanzania has
only ~1 bed per
1,000 people and
>50% of these beds
are in hospitals
that lack basic
unitilies
• Anecdotal evidence
suggests that the
lack of amenities
and scarcity of these
facilities is more
severe in rural areas
• Poor facility
capabilities are a
large source of
worker
dissatisfaction
• The lack of
amenities leads to
unnecessary
referrals and
misdiagnoses
• There is a systemic absence
of functional diagnostic
equipment, particularly in
public facilities. One study
found that only 13% of X-ray
units in facilities were not
defective Donor equipment is
often not suited for facility
(e.g., voltage required
different from that in facility or
facility lacks labor and/or
access to spare parts to repair
machine)
2.5-
2.7
?
4.4 HEALTH – SECTOR CHALLENGES
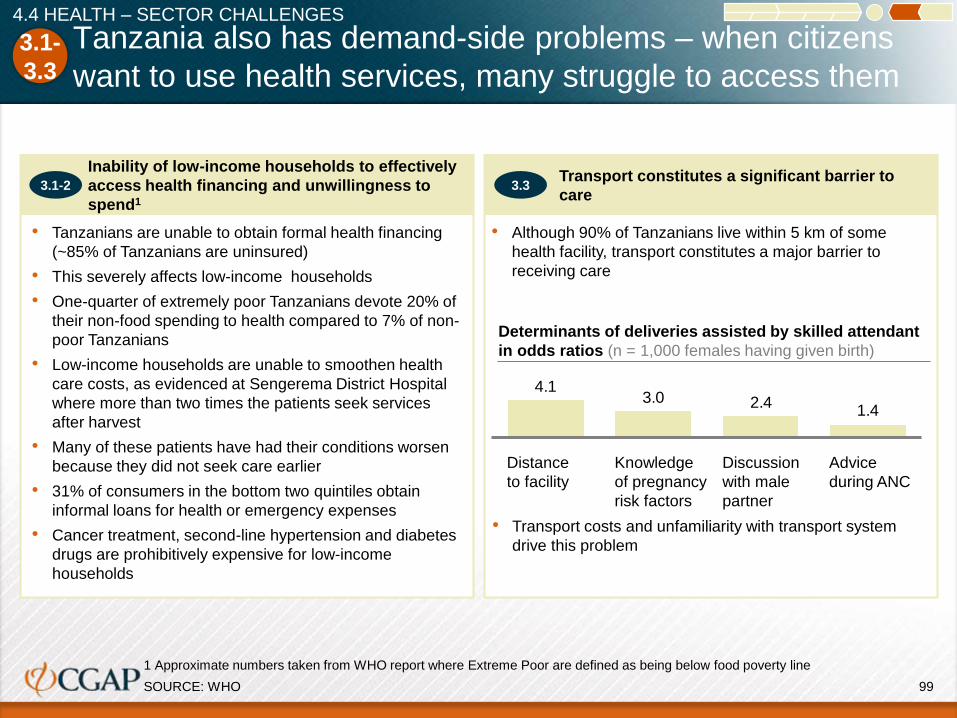
99
Tanzania also has demand-side problems – when citizens
want to use health services, many struggle to access them
Inability of low-income households to effectively
access health financing and unwillingness to
spend1
Transport constitutes a significant barrier to
care
1.42.43.0
4.1
Advice
during ANC
Discussion
with male
partner
Knowledge
of pregnancy
risk factors
Distance
to facility
3.33.1-2
1 Approximate numbers taken from WHO report where Extreme Poor are defined as being below food poverty line
SOURCE: WHO
• Transport costs and unfamiliarity with transport system
drive this problem
Determinants of deliveries assisted by skilled attendant
in odds ratios (n = 1,000 females having given birth)
• Tanzanians are unable to obtain formal health financing
(~85% of Tanzanians are uninsured)
• This severely affects low-income households
• One-quarter of extremely poor Tanzanians devote 20% of
their non-food spending to health compared to 7% of non-
poor Tanzanians
• Low-income households are unable to smoothen health
care costs, as evidenced at Sengerema District Hospital
where more than two times the patients seek services
after harvest
• Many of these patients have had their conditions worsen
because they did not seek care earlier
• 31% of consumers in the bottom two quintiles obtain
informal loans for health or emergency expenses
• Cancer treatment, second-line hypertension and diabetes
drugs are prohibitively expensive for low-income
households
• Although 90% of Tanzanians live within 5 km of some
health facility, transport constitutes a major barrier to
receiving care
3.1-
3.3
4.4 HEALTH – SECTOR CHALLENGES

100
Demand for healthcare services is often
low due to a lack of general health knowledge
Tertiary hospital
8Self-medication
or none10
Dispensary 19
Herbalist/
traditional healer21
District
hospital
42
Non-hospital facility
Hospital facility
1 For ages 15-24
SOURCE: WHO; cancer organizations; WHO; East African Journal of Public Health; BBC; ORCI
Right knowledge of HIV/AIDS1
Lack of knowledge of health
problems
Institutions visited by cancer patients in their first
care-seeking attempt
% (n = 330 cancer patients)
Lack of knowledge of optimal health practice and
appropriate resources Key takeaways
28
28
29
31
35
46
49
51
Nigeria
Senegal
Uganda
Kenya
Ethiopia
Ghana
Tanzania
Rwanda
• >50% of Tanzanians lack
basic HIV/AIDS
knowledge or knowledge
of the health system/ best
practice (as going to a
district hospital would
provide better, relatively
inexpensive care)
• Late cancer treatment is
usually related to lack of
awareness (more than
60% of cancer patients do
not think of cancer when
they first seek treatment)
• The perceived low quality of
health system and long wait
times lead many to self-
treat at ADDO where staff
is untrained and
diagnostic materials and
referrals are unavailable
Patients do not reach appropriate facilities until late
cancer stages given initial care-seeking behaviour
• 70-80% of all cancer patients at ORCI (Ocean Road)
arrive at late/incurable stages
• 90% of all cervix cancer patients arrive at stages IIb,
III, or IV
4.1EXAMPLE
4.4 HEALTH – SECTOR CHALLENGES

101
Agenda
Sector analysis – agriculture
Sector analysis – health
Sector analysis and challenge identification
Assessment of financial service needs and gap analysis
Digital finance plus solution feasibility
Readiness framework
Access to and reach of mobile infrastructure
Adoption and reach of digital finance infrastructure
Role of the government and regulation
Sector analysis – energy
Sector analysis – water
Sector analysis – education

102
Key takeaways: Health sector assessment of financial service
needs and gap analysis
HEALTH – ASSESSMENT OF FINANCIAL SERVICE NEEDS AND GAP ANALYSIS
5.1 Financial service needs along the value chain
5.2 Financial gap analysis along the value chain
5.3 Barriers to provision of financial products
• Financial institutions are not providing needed financial products for low-income households as credit and insurance products are
unattractive due to high collection costs, unmanageable adverse selection (especially for catastrophic insurance products) and a high-cost
to serve low-income households
• Tanzanian health facilities do not have access to credit, due to reservations in the financial sector to lend to individual hospitals, at the
same time hospital management often lacks an effective mandate to seek credit and improve the facilities
• The financial products that would widen low-income access are largely unavailable: financial institutions in Tanzania do not offer
purpose-driven savings products and short-term credit for low-income consumers
• An exception is health insurance that covers primary care in public health facilities, which is available to low-income consumers through
the government-subsidized Community Health Fund, but suffers from low uptake and poor quality of care
• Pilots of private provider insurance are limited to small groups, and they currently focus on attractive risk groups
• Financial products that would enable facilities to upgrade care provision are unavailable: there is a severe lack of credit for facilities
• Quality of care issues are further exacerbated by government not adjusting wage payments based on performance
• Various financial service needs exist across the health value chain affecting patients’ ability to access services and the quality and quantity
of services facilities can provide
• Low-income households patients are often informal agricultural workers with volatile cash flows; to resolve liquidity constraints and enable
health treatment at the optimal time, consumers need some combination of savings products or primary care insurance, catastrophic
insurance, and short-term credit
• To provide higher-quality treatment to low-income consumers, facilities need credit to purchase Rx and equipment maintenance,
further government subsidy of doctors’ wages, and the ability to make performance-based payments to increase staff attendance
• Other actors have finance needs that could help improve care at facilities: increased donor financing could allow government purchasing of
more expensive drugs and equipment, and loans for medical education facilities and students could allow expansion of the medical
workforce

103
A number of challenges along the value chain are driven
predominantly by unmet financial needs
5.1HEALTH – FINANCIAL SERVICE NEEDS ALONG THE VALUE CHAIN
1.1 Temporary
and
systematic
shortfall of
drug supplies
in public
facilities
2.2 Health
workers often
deviate from
best practice
in care
provision
3.3 Transport
constitutes a
significant
barrier to care
2.4 Providers
have
difficulties
following up
with patients
and tracking
them through
system
2.6 Hospital
shortage
creates large
distances to
seek care
Households
are unwilling
or unable to
pay for im-
portant health
services
3.2
2.7 Facilities lack
ability to
acquire and
maintain
appropriate
equipment
Supply chain
deficiencies
compromise
certain Rx
1.3
4.1 Households
do not seek
treatment in
health facilities
when
condition
warrants it
Inability of
low-income
households to
effectively
access health
expenditure
financing
products
(savings and
insurance)
3.1Facilities have
counterfeit
drugs
1.2 Staff are often
unmotivated
leading to low
attendance
and retention
2.3 2.5 Facilities lack
basic access
to utilities
1 Mostly provided in dispensaries, public health efforts, and health centers; 2 Mostly provided in district hospitals
PatientAbility to
access
Build desire
to accessLabor
Provision of care
Infra-
structure
Rx/
equipment
Input production/distribution
Rx and
equipmentMedical training
1 2 3 4
Primary area
of challenge
2.1 System has
health worker
shortage
Secondary
and tertiary
care
Preventive
services1
Basic
healthcare
services2
BOLD: Challenges with
financial need as a key driver

104
There are low levels of finance provision in
the Tanzanian health sectorMinimal ModerateLimitedN/A
Number/reach of existing financial products
Minimal but efforts underway
Finance for
country's
purchase of Rx
and equipment
Finance for
medical students
Finance for
facilities to hire,
pay, and
incentivize labor
Finance for facility
infrastructure
improvement and
expansion
Finance for
purchasing of
Rx/equipment by
facility
Finance for patients
to pay for desired
health services
Financing for health
education and
demand generation
High
Ability to
access
Build desire
to accessLabor
Provision of care
Infra-
structure
Rx/
equipment
Input production/distribution
Rx and
equipmentMedical training
1 2 3 4
Patient
Dir
ect
len
din
gIn
su
ran
ce
Sav
ing
s
Payment
Routine
expenses
Catastro-
phic
expenses
Short term
Long term
Specific
type of
expenses
All health
expenses
Donor
financing
Facilities outside referral hospitals are unable to get credit from traditional providers
CHF and TIKA cover basic
medical expenses and are
available to all Tanzanians for low
subsidized prices; though overall
insurance covers <15% of
population
Traditional bank
administration
of small
accounts Is
unprofitable
and end
consumer travel
to make small
deposits has
high opportunity
cost
Donor focus on communicable diseases – HIV, etc.
Lump-sum payments required for treatment as no way exists to enforce payment post-treatment
Under current model
economics do not
justify banks
determining credit-
worthiness of
patients
CCBRT transfers funds to ambassadors who provide information about maternity complications and facilitate proper care
Flexible payment plans allowed by teaching facilities
Some NGOs build and operate their own care facilities
CHF does not cover most secondary or tertiary care while National Health Insurance Fund is accepted at most secondary and tertiary providers
5.2 HEALTH – FINANCIAL GAP ANALYSIS ALONG THE VALUE CHAIN

105
Certain health sector challenges are driven by
financial gaps, some of which DF+ can address (1/3)
Input
production/
distribution1
1.1 Temporary
and systematic
shortfall of
drug supplies
in public
facilities
Value chain gap
► Poor facility-level forecasting of drug demand
• None
► Poor MSD supply chain leads to slow response to requests
• None
DF+ so-
lutionDrivers
Finance
need Existing services Barriers
► National budget allocation insufficient to procure sufficient drug supplies
• Donor fin-ancing/pri-vate contri-butions
• Donor financing focused on a limited number of high-profile interventions
• Significant private drug expenditure
• Donor financing insufficient to compensate completely for insufficient budget allocation
( )► Public facilities lack liquidity to purchase drugs from private suppliers
• Short-term loan/liquidity
• Minimal commercial credit available especially for low-level public facilities
• Commercial banks do not view facilities as credit-worthy
• Lack of a business case for purchase of drugs (free provision)
• Facilities lack entrepreneurial management
1.1
• Government funds a set number of medical posts
• Hospitals have insufficient ability to co-finance additional medical personal
• Lack of profitable business model for providing additional care
• Government funding limitations
• Additional wage subsidy
► Demand-side: Insufficient funding across public and private facilities to hire doctors
• Facilities allow for flexible payment periods/installments but absence of unsecured lending to students
• Given low wages and lack of job availability, medical students are risky loan recipients
• Educational loans
► Demand-side: Medical education prohibitively expensive (demand-side)
• No► Supply-side: Lack of qualified instructors
• Long-term lending to expand education
• Informal arrangement with government but expansion requires commercial lending to facilities
• Without government subsidy, demand unlikely
• Lack of entrepreneurialism• Lack of credit-worthiness
► Supply side: Insufficient educational capacity
2.1
• Current lump-sum salary payments with no performance measurement productivity pay
• Ability to track performance• Ability to differentiate payment based on
performance
• No► Lack of productivity-based salary differentiation
• No► Private care settings offer more attractive pay/working conditions
• No► Unclear career path/progression, especially in rural facilities
• n/a► Unfavorable working conditions because of other drivers (capacity constraints, lack of Rx/equipment and training)
• No► Lack of effective supervision, especially in rural settings
2.1 System has
health worker
shortage
2.3 Staff are
often
unmotivated
leading to low
attendance and
retention
Provision of
care2
2.1
2.3
5.3 HEALTH – BARRIERS TO PROVISION OF FINANCIAL PRODUCTS

106
Certain health sector challenges are driven by
financial gaps, some of which DF+ can address (2/3)
Provision of
care2
2.7 Facilities
lack ability to
acquire and
maintain
appropriate
equipment
Value chain gap
DF+ so-
lutionDrivers
Finance
need Existing services Barriers
2.7
2.1
3.1 Inability of
low-income
households to
effectively
access health
expenditure
financing
products
(savings and
insurance)
Ability to
access3
• No► Receipt of donor equipment that does not match facility capabilities
• Inability to hire maintenance workers • Facilities lack cashflow to attract technical workers with the capability to operate machines, particularly in rural areas
• Adequate salaries for maintenance workers
► Lack of skilled maintenance personnel to service existing equipment
► Inability to finance capital purchase from regular cash flows
• Investment lending product
• Lack of equipment loans means full upfront payment required leading to donor dependence; lease-and-own product that allows gradual payment
• Commercial banks do not view facilities as credit-worthy
► Supply: Effective lack of savings products for medical expenses
• Health savings accounts
• No institutional health savings accounts for low-income households
• Low-margin products and unattractive customer group for traditional financial service providers
► Demand: Unfamiliarity with personal health risk management
• No
► Demand: Expectation to receive free care for core medical services
• No
Lack of primary care insurance
• No► Demand: Low willingness to pay for health insurance because of the poor quality of care record
• No► Demand: Unfamiliarity with insurance products and personal health risk management
• State sub-sidized insurance
• Limited pilots combining private insurance with state/donor financing
• Sufficient donor/state financing• Public-private partnerships
► Demand: Prohibitive cost of insurance for low-income households
► Supply: Limited private provision due to adverse selection problems
• Limited pilots typically for group-based and salaried workers
• Fix sum health insurance for hospital expenses based on large group telco subscribers
• Risk-spreading group insurance products
• Inability to sign up attractive risk groups
• Digital pre-mium pay-ment/policy renewal
• Individual microinsurance players evaluating digital premium payment/ policy renewal options
• MNOs offering top-up fixed sum insurance through mobile money accounts
► Supply: High cost of provision due to collection of premium and on-the-ground administration
Lack of health savings accounts3.1
5.3 HEALTH – BARRIERS TO PROVISION OF FINANCIAL PRODUCTS

107
3.3 Transport constitutes a significant barrier to care
3.1 Inability of low-income households to effectively access health expenditure financing pro-ducts (savings and insurance)
3.2 Citizens are unwilling or unable to pay for important health servi-ces, parti-cularly for non-donor favored conditions
• Short-term liquidity
• Commercial banks find it hard to cost-effectively serve segment
• Donors find it difficult to transfer funds needed for transport before event
• Informal community financing and pilots of cash transfers for transport
► Liquidity constraint prevent access to high-level care especially in rural areas
► Unfamiliarity with transport leads to avoidance of use
• No
Certain health sector challenges are driven by
financial gaps, some of which DF+ can address (3/3)
Value chain gap
DF+ so-
lutionDrivers
Finance
need Existing services Barriers
Ability to
access3
3.1
► Lack of catastrophic insurance products available
• Private cata-strophic in-surance
• Only national health insurance and private insurance schemes for the wealthy cover these expenses
• Adverse selection• Risk
► Lack of understanding of value proposition of catastrophic insurance
• No
Lack of catastrophic health insurance
► Lack of available credit for medical expenses
• Medical credit
• Very rare lending to low-income consumers
• Collection costs exceed small revenue
► Desire impactful health product or treatment but price point is prohibitively expensive
• No • Donor providing full or partial subsidies for certain segments to purchase certain products
• Identifying target segments• Ensuring subsidies used for desired
purpose• Funding for subsidies
► Lack of understanding of why service is important leads to low demand
• No • Donor piloting of demand generation through ambassador education
• Recruiting ambassadors• Incentivizing ambassadors
3.3
Desire to
access
3.2
4.1 Households lack awareness of symptoms and proper treatment for common health conditions
4.1
4 ► Unaware of local health facilities and way to access them
• No
► Unaware of existence and basic symptoms of prevalent health conditions
• No
• No► Discomfort accessing health facilities
• Community agents incentivized to educate community members and facilitate their health system access
• Recruitment of community agents and outcome-based payment
• Funding for payments
5.3 HEALTH – BARRIERS TO PROVISION OF FINANCIAL PRODUCTS

108
Agenda
Sector analysis – agriculture
Sector analysis – health
Sector analysis and challenge identification
Assessment of financial service needs and gap analysis
Digital finance plus solution feasibility
Readiness framework
Access to and reach of mobile infrastructure
Adoption and reach of digital finance infrastructure
Role of the government and regulation
Sector analysis – energy
Sector analysis – water
Sector analysis – education

109
Key takeaways: Health sector digital finance plus solutions
feasibility
HEALTH – DIGITAL FINANCE PLUS SOLUTION FEASIBILITY
6.1 Potential applications of DF+ to address barriers
6.3 Scaling and execution capabilities
6.2 Viability of observed and potential business models
• In Tanzanian health, DF+ is limited to small pilot projects at different stages of the value chain
• These pilots both enhance previously offered payments and financial products through DF+ or offer newly enabled products
• Based on the finance gaps and the ability of DF+ to overcome different barriers, we have identified 6 DF+ products that have the
potential to deliver significant impact e.g.:
– DF+ can enable a more effective system of financial flows through supporting a payment system that incentivizes
community ambassadors to generate demand for health services and a payment system that enables subsidy
transfers to target segments for targeted health interventions
– DF+ can enable an effective new type of payment through a system that ties doctors’ salaries to performance
– DF+ can also aid in the provision of finance products as its use makes existing private insurance and lease-and-own
equipment models more effective while also making a novel maternity savings product possible
• Current DF+ efforts in Tanzania have been implemented only for a limited number of providers but lessons for viability have emerged
• The success of enhancing payments through DF+ (demand generation schemes and subsidy distribution) in various NGO pilots
for single conditions/products suggests a broader applicability to other conditions
• DF+-enabled pay for performance and maternity savings products have shown encouraging results in limited pilots
• The viability of digital private provider insurance and lease-and-own equipment remains to be tested
• Major scaling barriers exist in Tanzania given low system performance, the large role the government plays, patient’s lacking
understanding of financial products (especially insurance), and the lack of management capabilities
• Individual DF+ solutions are unlikely to have a compelling value proposition as a comprehensive reform package is necessary to
address the sector’s core problems
• Scaling of any DF+ solution will require government buy-in given that it directly controls and funds the vast majority of facilities and
medical personnel; limited pilots could be rolled-out in cooperation with the faith-based providers

110
Product
evaluation
Not all identified challenges are caused by a financial barrier or
can be addressed through a DF+ application
6.1 HEALTH – POTENTIAL APPLICATIONS OF DF+ TO ADDRESS BARRIERS
Finance as barrier DF+ potential No other barriers
Medical training2.1 System has health worker shortage
Rx and equipment
1.1 Temporary and systematic shortfall of drug supplies in
public facilities
Counterfeit drugs enter supply chain1.2
Supply chain deficiencies compromise certain Rx1.3
Labor2.2 Inconsistent application of best practices across facil-
ities, especially in lower level care settings
Low staff motivation leading to attendance and
retention problems
2.3
Infrastructure
Inability to follow up with patients and tracking them
through a unified system
2.4
2.5 Facilities lack basic access to utilities
2.6 Hospital shortage creates large distances to seek care
Rx and equipment2.7 Facilities lack ability to acquire and maintain
appropriate equipment
Ability to access
Inability of low-income households to effectively
access health expenditure financing products (savings
and insurance)
3.1
Households are unwilling or unable to pay for im-
portant health services
3.2
3.3 Transport constitutes a significant barrier to care
Desire to access4.1 Households do not seek treatment in appropriate
health facilities when condition warrants it
Inp
ut
pro
du
cti
on
Pro
vis
ion
of
care
Dem
an
d f
or
care
Detail
follows
Value chain segment Challenges
)(
Assessment of applicability of DF+ solution
High Low

111
Top implementation challengesDescriptionDF+ product
Staff are often unmotivated,
leading to low attendance and
retention
2.3 1. Government buy-in
2. Fraud
3. Technical execution
4. Funding
5. Perverse incentives
• Incentive payment to primary
care healthcare worker for each
patient seen paid digitally based
on patient SMS confirmation
• DF+ enabled
performance
payments
2.7 Facilities lack ability to acquire
and maintain appropriate
equipment
1. Receptiveness to rural jobs
2. Absence of parts
3. Government buy-in
4. Technical capabilities
• Medical equipment leased to a
facility that works with a qualified
technician to collect cost-sharing
to pay back machine value
• DF+ enabled
Lease-and-own
PPP equipment
model
4.1 Citizens do not seek treatment
in health facilities when
condition warrants it
1. Ambassador education
2. Provider buy-in
3. Operations
4. Village education
• Incentive payment for
community ambassadors to
identify and refer emergency
cases, combined with payment
to cover transport for patient
• DF+ enabled
demand
generation
Inability of low-income
households to effectively
access health expenditure
financing products (savings
and insurance)
3.1 1. Quality
2. Demand generation
3. Operational implementation
4. Financing
• Time-bound, purpose-tied, DF+-
enabled savings products based
on incremental cash transfers
into dedicated account
• DF+ enabled
Maternity
savings product
Inability of low-income
households to effectively
access health expenditure
financing products (savings
and insurance)
3.1 1. Product understanding
2. Facility quality
3. Financial capabilities
4. Operations
• DF+ enabled insurance that
entitles the beneficiary to a full
suite of primary and maternity
care at a local private health
facility
• DF+ enabled
insurance
administration
3.2 Citizens are unwilling or
unable to pay for important
health services
1. Supply coordination
2. Facility adoption
3. Auditing
4. Adoption
• Subsidy payment to private
providers to enable purchase of
essential health products /
service by low income
households
• DF+ enabled
targeted subsidy
programs
Addressed health sector challenge
A
B
C
D
E
F
Based on our analysis of the current state and barriers to scale,
we suggest 6 DF+ applications for further consideration
6.1 HEALTH – POTENTIAL APPLICATIONS OF DF+ TO ADDRESS BARRIERS

112
DF+ could enable a new pay for performance system for
providers to increase productivity (1/3)
A
Financial
instrument
Target
audience
Product
provider
Digitally enabled incentives
performance payments
Primary healthcare workers
Organizations overseeing
multiple private providers
(e.g., faith-based providers)
Value proposition Product details
Core product features
• After seeing a patient, the doctor gives the patient his identification code and asks the
patient to send a free SMS with that code to a centralized database
• The database receives the text message and confirms that it originated from a unique
number not previously used for that identification code
• The provider makes a quick and seamless mobile payment to the associated doctor
making the incentive immediately tangible and more powerful
• The incentive is paid end of week, based on the number of patients seen
• The provider gathers data and tracks patient throughput on a real-time basis
Potential extensions
• Government implementation of this process would allow achievement of scale (84% of
doctors are paid by the government)
• This process could also be implemented for other doctor types by tracking procedure
codes and issuing differentiated payments for them
• SMS follow-ups could be enabled through connecting a patient’s phone number with
the procedure that patient received
• A feedback function that provides basic performance data on doctors
DF+ specific value proposition
• Enables instant payments making
incentives immediate and tangible
• Tracks patient history that could support
care coordination and customized health
information sharing
Overall value proposition
• Increases labor supply in public clinics
by decreasing absenteeism
• Ability to solicit clinic help in service
demand generation as medical
personnel can increase their salary
through encouraging patients to see
them
• Increased capacity per existing facility
Product summary
• Incentive payment to primary care health workers for each patient seen paid
digitally based on SMS confirmation by patient
Addressed financial gap
• Primary health care worker lack incentives to see more patients which often
leads to high variability in productivity and absenteeism that in-turn,
increases patients’ perception that facilities are poor quality
6.1 HEALTH – POTENTIAL APPLICATIONS OF DF+ TO ADDRESS BARRIERS

113
DF+ could enable a new pay for performance system
for providers to increase productivity (2/3)
A Low
High
Feasibility assessment: Enabling
environment Feasibility assessment: Operating model Impact assessment
Technical execution
• Once the database is populated with
identification codes and payment accounts,
the system is only required to check for
duplicate senders
Feasibility
• Product implementation will likely
require government adoption and a
national identification scheme to
prevent fraud
Potential impact
• High impact: Effective electrification of up
to 5 million households (30 million people)
possible
Government buy-in
• Scale requires government buy-in as key
employer, no current signs of uptake
Fraud
• Given the low cost of SIM cards, an individual
could switch mobile phone numbers; ID or
biometric requirements could alleviate fraud risk
Perverse incentives
• While this may encourage providers to spend
less time with patients, quality is likely to
increase overall as more patients are seen
Additional funding
• Likely requires additional funding to finance new
performance bonus
Financial infrastructure
• Continuation of low-cost mobile
payments necessary to ensure
model works
Mobile infrastructure
• High penetration of mobile
money to necessary or else
doctors without mobile phones or
reception will be unfairly
disadvantaged
• Women cell phone access will
need to increase as they are
often the household member
seeking care
Government regulation
• National identification scheme
will likely be necessary to verify
the mobile accounts into which
payments should be made
Reach
• Labor shortage is one of Tanzania’s
biggest problems (0.1 doctor and 2.4
nurses per 1,000 people are the
lowest levels among peer countries)
• 60% of care is received in the public
sector with long wait times and poor
quality
• Absenteeism rates of primary care
providers are nearly 40%
Impact on Problem
• Anecdotal evidence suggests
payment incentives could greatly help
increase service provision and career
attractiveness
• May be the most effective way to
address this problem, given that
recent medical graduates have
struggled to find jobs in Tanzania
because of funding shortages
6.1 HEALTH – POTENTIAL APPLICATIONS OF DF+ TO ADDRESS BARRIERS

114
DF+ could enable a new pay for performance system for
providers to increase productivity (3/3)
A
Case examplesGo-to-market model
Population Services International
has implemented this model for its community health
workers
• PSI has its community health workers (each with a unique
ID) tell the people they provide medical care/advice to, to
text their ID number to PSI’s central server.
• PSI counts unique phone numbers to determine how many
people the worker provided services to and provides
proportional incentive payments
• This process also registers patients’ mobile numbers in
PSI’s system, allowing it to provide customized information
to these patients
• Begin with a pilot in a small number
of manageable facilities (a set of
faith-based providers, specific
geographic area)
• Build database that can verify if the
mobile number has sent an SMS
with a specific identification code
before and provide payment
appropriately
• Educate doctors about the shift and
help them establish mobile money
accounts
• Audit service in initial implementation
to ensure doctors are being
rewarded appropriately
Catholic Relief Services helped implement a model as part
of Project LEAD in which health workers were paid
according to how many HIV/AIDS patients they got back
on treatment
• Paid a 2,500 TZS incentive for return of patients to facilities
who had stopped treatment and not been seen for 90 days
• Verified when patient entered a unique identifier code at the
clinic
6.1 HEALTH – POTENTIAL APPLICATIONS OF DF+ TO ADDRESS BARRIERS

115
Lease-and-own equipment through public-private
partnerships could increase service access and quality (1/3)
B
Financial
instrument
Target
audience
Product
provider
Secured lease-and-own
facility
Hospitals and technical
graduates
Partnership incl. equipment
manufacturers and financial
and educational institutions
Value proposition Product details
Product summary
• Medical equipment leased to a facility on a lease-to-own basis
• Facility works with qualified technician to ensure upkeep
Addressed financial gap
• Hospitals lack cash flow to invest in modern medical equipment
• Hospitals’ equipment often remains unused because of basic maintenance
issues as revenue obtained from equipment usage cross-finances general
facility operations
• Equipment-dependent services become a bottleneck in care delivery
• Equipment malfunction causes unnecessary and costly referrals to higher-
level facilities
Core product features
• Equipment provided to specified facility that partners with a technical graduate to
service the machine
• The graduate operates the equipment in a public-private partnership in which he
charges for the patients’ use of the machine and receives part of the user fees
• The provider places the other funds collected from the user fees in a separate digital
account devoted to paying back the lease
• The equipment is used as collateral
• Upon full payment, the facility owns the machine and can continue to operate it
Potential extensions
• Payment via mobile money for the equipment-enabled services could ensure an
automatic contribution toward the lease
DF+ specific value proposition
• Enables smaller, more frequent
payments to lease-provider without
requiring geographical proximity to
make payments
Overall value proposition
• This product increases the presence of
care equipment in facilities while
properly locating and incentivizing
trained technicians to operate and
repair the machines
6.1 HEALTH – POTENTIAL APPLICATIONS OF DF+ TO ADDRESS BARRIERS

116
Lease-and-own equipment through public-private
partnerships could increase service access and quality (2/3)
B
Feasibility assessment: Enabling environment Feasibility assessment: Operating model Impact assessment
Low High
1 Diagnostic X-ray facilities as per quality control performances in Tanzania, Yesaya Y. Sungita,1 Simon S.L. Mdoe,1 and Peter Msaki
2 Tanzania Atomic Energy Commission
Technical capabilities
• While technical institutions train
graduates to operate older machines,
newer machine operation often
requires company-specific training
Technical capabilities
• 59% of X-ray machines are operated in
private sector hospitals even though only
15% of hospital are private
• Improvement of public sector equipment
would increase affordability of services
and access, particularly for those in rural
areas lacking private-sector alternatives
• A 2006 study found that only 13% of X-
ray units in facilities were in use (53%
not in use, 34% out of order)
• Equipment is often not suited for the
facility (wrong voltage) which lacks the
ability to repair it
• This problem is also driven by the
inability to access spare parts1
Mobile infrastructure
• Mobile phone and mobile money
available for most clinics
Government regulation
• Subsidiary government institutions
would become creditors, meaning
default and liability rules would have to
be clarified
Financial infrastructure
• No financing institutions are currently
offering these products
• Given the lack of willingness to extend
financing to medical facilities, the model
would likely need an equipment
manufacturer or donor to offer product
and guarantee loan
• Limited effective collection procedure in
case of default (re-owning machine is
costly and ethically hard to execute)
Absence of parts
• Increased risk for leaser and
entrepreneur as maintenance times
may be severely limited by
shortcomings in the equipment supply
chain
Receptiveness to rural jobs
• Many technicians are unlikely to
agree to live in most rural areas,
constraining the scope of the effort
Government buy-in
• Although the government may allow
PPPs, its active encouragement will
likely be necessary for scaling
Impact
• Model addresses clear system need
though impact would be maximized
through a combined effort to increase the
supply of spare parts
Feasibility
• This model could spread to older
equipment pieces in urban areas but
it would need to be promoted by the
government and offer unique
incentives for rural technicians to
truly reach scale
6.1 HEALTH – POTENTIAL APPLICATIONS OF DF+ TO ADDRESS BARRIERS

117
Lease-and-own equipment through public-private
partnerships could increase service access and quality (3/3)
B
Case examplesGo-to-market model
• Partner with technical
institutions to ensure
graduates trained to
operate and maintain high-
demand machines
• Work with health care
facilities, financial service
providers and technical
training institution to build
cooperation agreement and
determine lease terms
• Identify potential equipment
needs and help kick-start
pilots
Bugando Medical Centre is a leading referral
hospital in Mwanza often at the cutting-edge
of service provision
• Facility is seeking partners to provide
equipment on a lease-and-own basis though it
would operate it with existing staff
• Cooperation with local technical colleges are
being evaluated
6.1 HEALTH – POTENTIAL APPLICATIONS OF DF+ TO ADDRESS BARRIERS

118
DF+ can enable a purpose-tied maternity savings
product to improve maternal care (1/3)
C
Financial
instrument
Target
audience
Product
provider
Purpose-tied, short-term savings
product
Pregnant women in low-income
households
Partnership incl. MNOs, financial
service provider, and health sector
organization
Value proposition Product details
Potential extensions
• Third party (government) matching contributions tied to the attainment of minimum
saving targets
• Additional provider discounts tied to the savings target
• Maternal advice or diagnostic service via phone for participating households
• Integrated low-cost insurance products to protect against common complications
Product summary
• Time-bound, purpose-tied, DF+- enabled savings products based
on incremental cash transfers into dedicated saving account
Addressed financial need
• Lack of low-cost savings product and financial infrastructure to
provide the financial product in rural areas
• Inability to adequately motivate/inform target group about savings
purpose and progress toward savings target
Core product features
• Time-bound savings account with a fixed pay-in period of 6-9 months; no option of
early disbursement apart from pre-natal visits
• Regular text-based update on saving targets and receipt of potential government
contributions
• Platform for comprehensive maternity health information at relevant stages of
pregnancy
• Purpose-tied disbursement ensured through a direct transfer to a medical service
provider (unique identifying ID)
• Interest-bearing account to encourage early pay-ins
Overall value proposition
• Enables long-term financial planning
and financial commitment for household
in volatile cash flow environment
• Encourages low-income households to
seek adequate maternal care treatment
DF+ specific value proposition
• Enables incentives via 3rd party
matching contributions
• Enables convenient and frequent low-
volume pay-ins at a manageable cost
Enables coverage in under-banked
areas
• Enables monitoring the savings targets
• Reduces risk of fraud through purpose-
tied disbursement/elimination of cash
6.1 HEALTH – POTENTIAL APPLICATIONS OF DF+ TO ADDRESS BARRIERS

119
DF+ can enable a purpose-tied maternity savings
product to improve maternal care (2/3)
C
Feasibility assessment: Enabling environment Feasibility assessment: Operating model Impact assessment
Low
High
1 Winani et al, 2007: Study was not randomized control trial and unclear if hygiene education or kit presence drove impact
Reach
• 1.75 million births/year in Tanzania
• 51% of births in Tanzania are not
attended by skilled personnel,
• 8,050 deaths/ year, worldwide 15% of
those are due to infection
• In Tanzanian study, newborns whose
mothers used kit had 13.1 times less
cord infections and women kit-users had
3.2 times less puerperal sepsis1
Impact on Problem
• Addresses two leading determinants of
the decision on where to deliver
• Distance to facilities largest driver
Savings product changes decision
calculus as no additional cost required
for transport
• Risk factor knowledge is 2nd leading
determinant of birth location
• Educational component of sales may be
most impactful helping establish skilled
delivery as a community norm
Mobile infrastructure
• Product availability depends on mobile
money adoption, especially for women
in households
• Telco most likely actor to offer product
in bid to retain customers as
operational costs would be lowest
Government regulation
• Maternity care is by law provided for
free
Financial infrastructure
• No DF+ savings products currently
offered, M-Power just launched in the
month
Financing
• Pilot funding is likely to be readily
available from various donors
• Scaling would require sustained
state budget allocation
Operational implementation
• Requires coordinating many
actors and establishing call center
and verification systems
Quality
• The low quality of health facilities
remain the single biggest deterrent
to save for maternity care
Education
• Education on the benefits of
delivery with skilled personnel is
challenging in rural areas
• Health workers and community
leader are the best positioned
educational agents
Potential impact
• Product can help change community
norms and alter cost calculus, but a large
increase in BoP use of skilled delivery
likely depends on education and perceived
facility quality improvements
Feasibility
• This product will likely find willing
funders, meaning it can be created;
the chief challenge will be scaling by
creating demand and ensuring
savings used as intended
6.1 HEALTH – POTENTIAL APPLICATIONS OF DF+ TO ADDRESS BARRIERS

120
DF+ can enable a purpose-tied maternity savings
product to improve maternal care (3/3)
C
Case examplesGo-to-market model
• Sign-up of households through
health centers during initial visit
• Secure 3rd-party co-pay
contribution to incentives
uptake
• Design simple text-based
system mirroring M-Pesa/Tigo-
Pesa / M-Shwari to increase
ease of use and uptake
• Integrated payment system
across health providers to
enable secure and proposed
tied usage of funds
Mamakiba, launched in Kenya in 2008, offers
maternity savings products as part of a pilot
program
• Includes a savings calculator that created easy
targets for consumers
• Initial trust issue
Changamka, established in 2008 in Kenya,
operates a similar model through a smart card
• A 2012 USAID study at one Kenyan provider found
that
– 75% of users said the card helped them save
money by not letting them spend it on other
things
– 15% of users said the card helped by
preventing their families from spending the
money on other things
6.1 HEALTH – POTENTIAL APPLICATIONS OF DF+ TO ADDRESS BARRIERS

121
Microinsurance for private primary care could help end
avoidance of important care (1/3)
D
Financial
instrument
Target
audience
Product
provider
Insurance product for
primary care at private facility
Low-income households
Partnership incl. providers
and MFI/donor providing
insurance
Value proposition Product details
DF+ specific value proposition
• Seamless collection of premiums
decrease operating costs by up to 10%
through lowered administrative costs
• Enables monthly payments, which
represent a switch from the current use of
annual payments
• Enables an automatic premium deduction
to ensure payment
Overall value proposition
• Enables better BoP financial planning in a
volatile cash flow environment
• Enables better provider financial planning
as inflows move from unpredictable, out-
of-pocket expenses to monthly capitation
payments
• Encourages BoP households to seek
adequate care treatment in typically
better quality facilities
Core product features
• Insurance product for the use of a local private health facility funded through automatic
monthly payments
• Enrollees are entitled to unlimited care provision at designated facilities
• Insurer pays the facility a capitated payment for each enrollee but does not reimburse the
provider for services rendered
• Premium payments made monthly with an annual commitment and SMS reminders
Potential extensions
• The insurer could consider adding additional secondary care benefits that would increase
premium costs by ~50%
• The insurer could help the private provider improve financial management and care quality
in an effort to increase consumer desire to seek care at a private facility
• The product could be introduced with a simultaneous quality improvement effort at the
facility
• Private insurance programs could be combined with the Community Health Fund effort in a
public-private partnership
Product summary
• Microinsurance product enabled through monthly digital premiums entitling the
beneficiary to a full suite of primary care and maternity services at a local
private health facility
Addressed financial need
• Inability of BoP consumers to smooth expenditures, resulting in harmful care
avoidance when they need care
• Difficult for providers to predict and manage cash flow given inconsistent, out-
of-pocket payments
6.1 HEALTH – POTENTIAL APPLICATIONS OF DF+ TO ADDRESS BARRIERS

122
Microinsurance for private primary care could help end
avoidance of important care (2/3)
D
Feasibility assessment: Enabling environment Feasibility assessment: Operating model Impact assessment
Low
High
Financial capabilities
• They provider would need the ability
to model the product to determine
appropriate pricing
Product understanding
• Cultural barrier to a product in which
payments are made but services may
not be received
Quality
• Perceived low quality of health facility
will make the product less attractive
Operations
• Automatic deduction feature is
essential to ensure consistent
payment but it must be built into M-
Pesa account
• Cost of 25,000 TSh per household per
annum is prohibitive for very low-
income households
Financial infrastructure
• No traditional financing institutions currently
offer insurance to low-income households
• PharmAcess pilot and CHF indicate that the
product will require subsidy
Mobile infrastructure
• Those without mobile money and reception
would be excluded from the product
• Telcos could offer the product as an
extension of existing fixed sum insurance
products
Government regulation
• Joined public-private insurance schemes
require coordination and government buy-in
and financial commitment
• 85% of Tanzanians do not have health
insurance, leading to health shocks for them
and a lack of consistent and predictable
income for facilities
• Consistent and predictable premium
payments would allow better financial
planning for health facilities
• Improved and stable facility funding would
reduce staffing shortages (lack of jobs for
medical graduates is a leading cause of
Tanzania’s 0.1 doctors per 100,000 people)
• Improved and stable facility funding would
enable the purchase of Rx/equipment (only
48% of private facilities have basic generic
drugs)
• To achieve scale, integration with the
government-sponsored Community Health
Fund will be necessary
Feasibility
• This product could be implemented and
priced appropriately, but it faces severe
scaling difficulties because of potential
customers’ perceptions that health
facilities lack quality and their
unfamiliarity with insurance products
Potential impact
• This product could help hospitals address
some of their largest issues (lack of
Rx/equipment, staff shortages, etc.) contingent
on implementation of better management
practices
6.1 HEALTH – POTENTIAL APPLICATIONS OF DF+ TO ADDRESS BARRIERS

123
Microinsurance for private primary care could help end
avoidance of important care (3/3)
D
Case examplesGo-to-market model
• Identify private facilities that
community members recognize
as providing high-quality care
• Calculate appropriate capitation
rate and necessary premium
rate to support the product
• Convene key community
members to present value
proposition for private
insurance product and have
them promote product and sign
up members
• Ensure diverse risk pool
through targeted marketing
• Could include simultaneous
quality of care improvements
through technical assistance
PharmAccess offers a private
health insurance product in Moshi
• Offered to a group of coffee farmers, resulting in a
relatively diverse risk pool
• Participating providers also undergo quality
transformation from partnering with PharmAccess
advisers
• This product has achieved widespread adoption at
a price point subsidized by 60%
• Anecdotal experience in Kenya suggests
customers would pay ~50% more for the inclusion
of secondary care
6.1 HEALTH – POTENTIAL APPLICATIONS OF DF+ TO ADDRESS BARRIERS
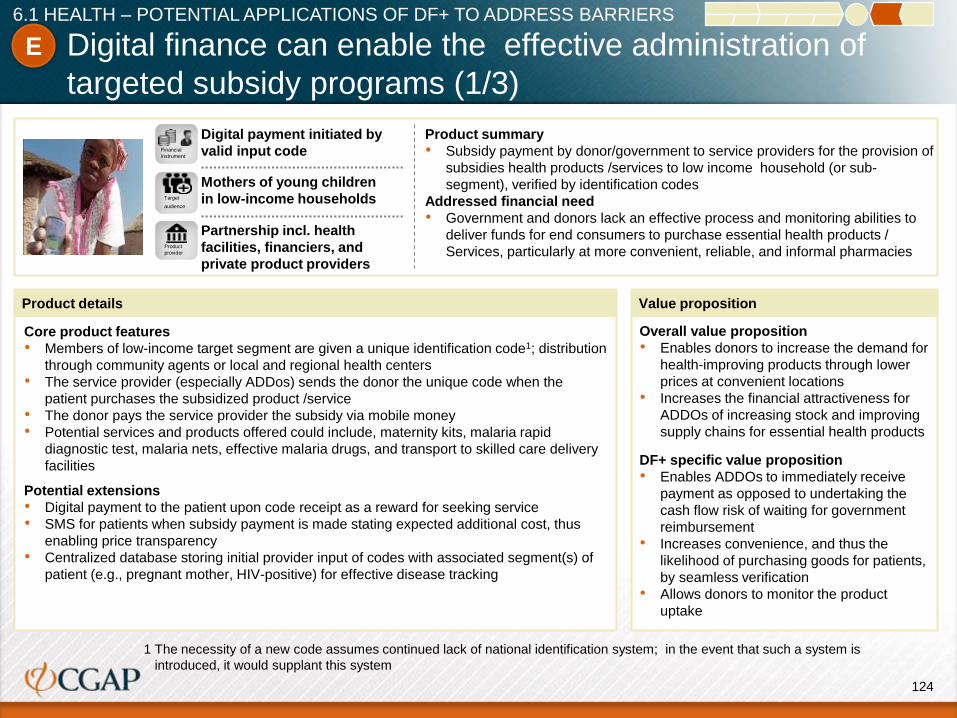
124
Digital finance can enable the effective administration of
targeted subsidy programs (1/3)
E
Financial
instrument
Target
audience
Product
provider
Digital payment initiated by
valid input code
Mothers of young children
in low-income households
Partnership incl. health
facilities, financiers, and
private product providers
Value proposition Product details
1 The necessity of a new code assumes continued lack of national identification system; in the event that such a system is
introduced, it would supplant this system
Product summary
• Subsidy payment by donor/government to service providers for the provision of
subsidies health products /services to low income household (or sub-
segment), verified by identification codes
Addressed financial need
• Government and donors lack an effective process and monitoring abilities to
deliver funds for end consumers to purchase essential health products /
Services, particularly at more convenient, reliable, and informal pharmacies
Core product features
• Members of low-income target segment are given a unique identification code1; distribution
through community agents or local and regional health centers
• The service provider (especially ADDos) sends the donor the unique code when the
patient purchases the subsidized product /service
• The donor pays the service provider the subsidy via mobile money
• Potential services and products offered could include, maternity kits, malaria rapid
diagnostic test, malaria nets, effective malaria drugs, and transport to skilled care delivery
facilities
Overall value proposition
• Enables donors to increase the demand for
health-improving products through lower
prices at convenient locations
• Increases the financial attractiveness for
ADDOs of increasing stock and improving
supply chains for essential health products
DF+ specific value proposition
• Enables ADDOs to immediately receive
payment as opposed to undertaking the
cash flow risk of waiting for government
reimbursement
• Increases convenience, and thus the
likelihood of purchasing goods for patients,
by seamless verification
• Allows donors to monitor the product
uptake
Potential extensions
• Digital payment to the patient upon code receipt as a reward for seeking service
• SMS for patients when subsidy payment is made stating expected additional cost, thus
enabling price transparency
• Centralized database storing initial provider input of codes with associated segment(s) of
patient (e.g., pregnant mother, HIV-positive) for effective disease tracking
6.1 HEALTH – POTENTIAL APPLICATIONS OF DF+ TO ADDRESS BARRIERS

125
Digital finance can enable the effective administration of
targeted subsidy programs(2/3)
E
Feasibility assessment: Enabling environment Feasibility assessment: Operating model Impact assessment
Low
High
Facility adoption
• Registering target segments after the
initial treatment requires an additional
effort that may only be triggered by
incentives or a government
requirement
Auditing
• Occasional monitoring to ensure an
actual sale when the subsidy is used
should deter scamming if the
consequence is ADDO exclusion from
program
Education
• Regional managers could inform
ADDOs about the program and
ensure facilities provide information
on participating ADDOs to patients
Supply coordination
• Requires significant supply chain
coordination to ensure that ADDOs
have sufficient supply of subsidies
product
Financial infrastructure
• Existing mobile money system need to be
integrated with service verification system
Mobile infrastructure
• Without high penetration of mobile money
and reception, certain consumers will be
excluded from the product
• Vodafone has already indicated willingness
to partner on these efforts and install
service where necessary
Government regulation
• n/a
• Mobile subsidy provision could be used for a
variety of health products
• To ensure widespread availability of these
products/services, a certain level of scale
would be necessary to generate sufficient
demand
• Potential products to subsidize include
maternity kits, malaria rapid diagnostic test,
malaria nets, effective malaria drugs, and
transport to skilled care delivery facilities
• Currently ~10% of those taking malaria drugs
actually have malaria, increasing internal and
community resistance to drugs
Impact
• Entirely contingent upon the product chosen,
though the approach has shown the ability to
scale if part of a comprehensive effort
Feasibility
• Product implementation will require
initial help supplying ADDOs and
continued incentives to facilities to
participate, but this product could
eventually reach substantial scale
6.1 HEALTH – POTENTIAL APPLICATIONS OF DF+ TO ADDRESS BARRIERS

126
Digital finance can enable the effective administration of
targeted subsidy programs (3/3)
E
Case examplesGo-to-market model
• Educate facilities and
ADDOs about the effort and
the subsidized products
• Introduce the identification
code system at health
facilities
• Increase the adoption of
mobile payments among
ADDOs
• Develop outreach materials
for different patient
segments encouraging the
use of appropriate
subsidies
• Develop an auditing system
to ensure the proper use of
funds by ADDOs
National Net Program is a multilateral effort
including many donor organizations
• Bed net vouchers enabled 6,400 retail
outlets to sell 3 million nets annually (3X
2001 sales)
• Part of a more comprehensive effort to
create demand and improve supply chains; it
is unclear if the voucher on its own would
have the same effect
6.1 HEALTH – POTENTIAL APPLICATIONS OF DF+ TO ADDRESS BARRIERS

127
Demand and access generation could increase
essential service care (1/3)
F
Product summary
▪ An incentive payment for community ambassadors to identify and refer
undertreated conditions, combined with payment, to cover transport for
patient
Addressed financial need
▪ Many patients with emergency conditions do not understand their condition
and face significant transport cost barriers to seeking treatment
Financial
instrument
Target
audience
Product
provider
Digital payment to community
ambassador for travel
Community members with
undertreated conditions
Partnership incl. donors/
government, health facilities,
community members
Value proposition Product details
Core product features
• Immediate transfer of transportation costs for designated patients and incentive
payments for community ambassadors generating demand
– The community ambassador phones the call center to report case
– The donor/government transfers funds to pay the for patient’s transportation to
community agent
– The ambassador assists the patient with transport utilization (typically bus)
– A taxi picks up the patient at the bus station and transports to hospital
– The doctor confirms the community ambassador’s diagnosis with the call center
and treats the patient
– The call center triggers the incentive payment to the community ambassador via
mobile money
Potential extensions
• Adoption of tele medicine call centers that ambassadors can leverage to increase the
accuracy of diagnoses
• Complex training for ambassadors to enable more accurate diagnoses
DF+ specific value proposition
• Low-cost digital payments enable
remote transport subsidy
• Incentive payments to rural community
agents require digital payment solution
Overall value proposition
• Free or subsidized services often go
unused through a lack of knowledge
about the service, condition, or logistics
• An ambassador with strong community
presence and potential to diagnose
conditions and coordinate travel
arrangements
6.1 HEALTH – POTENTIAL APPLICATIONS OF DF+ TO ADDRESS BARRIERS

128
Demand and access generation could increase
essential service care (2/3)
F
Feasibility assessment: enabling environment Feasibility assessment Impact assessment
Low
High
1 Number determined through averaging minimum and maximum ranges of cataract births throughout the world as no Tanzania-specific
numbers are available; delay in presentation to hospital for surgery for congenital and developmental cataract in Tanzania – J Mwende, A
Bronsard, M Mosha, R Bowman, R Geneau,and P Courtright
Provider buy-in
• Hospital receptiveness to
increased demand will depend on
capacity, capability, and
management
Village education
• Local government meetings can
be leveraged for initial program
information
Ambassador education
• Inability of non-medically trained
personnel to correctly identify
more complex conditions will limit
model applicability
Operations
• Scale will need to be quickly
achieved to justify call center
staffing, but coordination is
executable
Mobile infrastructure
• Mobile infrastructure exists
Government regulation
• No explicit government buy-in required
Financial infrastructure
• Automated integration of verification
system (call center) with payment
system desirable after pilot phase,
initially call center makes payments
manually through M-Pesa
• Potential applications of the model include
cataract, cleft lip, and cervical cancer as
community ambassadors should be able to
diagnose symptoms
• Tanzanian study found median delay for
services was 18 months, causing major
complications and driven in part by distance
from facility and socio-educational status
• ~1,000 births with cataracts annually1
• Prevalence of cleft lip is ~300 annually
• Cervical cancer is the most prevalent cancer
among women, with a high mortality rate
(4,355 in 2010) because of late diagnosis
Impact
• Ambassador diagnosis abilities limit the
program’s reach but it can have a major
impact on the conditions that affect a small
number of Tanzanians
Feasibility
• Although the program operations
are not complex, finding conditions
with an ambassador diagnosis and
system capacity capabilities will be
difficult
6.1 HEALTH – POTENTIAL APPLICATIONS OF DF+ TO ADDRESS BARRIERS

129
Demand and access generation could increase
essential service care (3/3)
F
Case examplesGo-to-market model
Provider runs demand generation program
for fistula patients with Vodacom
Foundation
• Writes letters to regional medical officers and
attend district meetings
• Sends 6-7 staff to the field to create
awareness (15 weekends annually)
• Solicits recommendations for ambassadors
(could be health worker, community leaders,
taxi driver)
• 80% of fistula patients treated last year
came through a program for three partnering
hospitals (514 women at CCBRT)
• Have found that village meeting awareness
can’t just be an ambassador
• Pays ambassadors $6/case
• Attend local
government/(district or
village-level) meeting to
raise awareness of service
and seek recommendations
for community
ambassadors
• Train community
ambassadors to diagnose
symptoms and spread
information
• Establish call center to
liaise with ambassadors,
confirm diagnoses, and
transfer funds
6.1 HEALTH – POTENTIAL APPLICATIONS OF DF+ TO ADDRESS BARRIERS

130
DF+ solutions have different impacts … Key takeaways
Imp
act
High
Medium
Low
Low Medium High
Feasibility
A
B
D
C
F Demand
generation
E Subsidy
delivery
Pay for
performance
Lease-and-own
equipment
Insurance
product admin-
istrative tool
Maternity
savings
product
Requirements for scale
• Government buy-in is necessary given its role as a
funder of the majority of doctors and facilities
• Facility buy-in is necessary given that most mobile
solutions require doctor and administrator data input
• Improved health system quality to increase patient
system use; increased use will improve business model
feasibility and subsidy redemption rates
• Thus a government-led reform effort focused on quality
improvement is necessary to maximize DF+ impact
Steps to facilitate DF+ in health
• Focus initially on engaging the private sector to
implement DF+ solutions with sustainable business
models (lease-and-own equipment, maternity savings,
insurance administrative tool)
• Engage donor organizations to encourage the
implementation of more demand generation and subsidy
delivery efforts
• Encourage collaboration among stakeholders to
implement the solutions that will have the most impact at
scale
Potential DF+ applications in health can be categorized based on
their feasibility and potential impact
6.2 HEALTH – VIABILITY OF OBSERVED AND POTENTIAL BUSINESS MODELS

131
DF+ implementation in the health sector faces varying levels of
constraints
• 85% of the country is covered by 2G networks, though selected rural areas remain a problem
Sector readiness dimension
Sector-rele-
vant mobile
infrastructure
reach and
adoption
Readiness of
financial and
digital
financial
infrastructure
65
4 32
1
65
4 32
1
Role of
government
and
regulation
6
54 3
2
1
Severity of
sector
challenges
65
4 32
1
Financial gap
in sector
65
4 32
1
DF+ business
models and
scaling
65
4 32
1
• High penetration at ~60% of households, with some concern over female access to mobile phone within HH as they seek most child care
• Low level of private lending, savings, or insurance products for low-income HHs, with low-utilized government-subsidized insurance as the exception
• Donor organizations adopting technology for limited pilots, but there is a lack of pilots with business models or providing financial products
• Free care creates low willingness to pay for necessary services and low supervision leads to sub-optimal care practice
• The government has played a neutral role in DF+ implementation; donors are driving development
• Complex stakeholder landscape with a mix of public, private (incl. faith-based) providers and active donors
• Severe non-financial challenges related to the quality of care, availability of medical staff, and awareness of illnesses among population
• The majority of low-income households do not use any form of finance products in health; access to financing for providers is limited
• DF+ solutions can address selected issues within the health sector though major change will require comprehensive reform
• Most pilots and solutions are subsidy-based, though a few potential unexplored business models exist
• No clear sign of scaling – given large government role, scaling will require its explicit support
Reach
Reach of mobile
infrastructure
Adoption of mobile
technology
Financial product
offering to sector
Availability of
DF+ solutions
Sector-specific
regulation
Role of
government
Stakeholder
complexity
Non-financial chal-
lenges in sector
Execution and
scalling ability
Depth of financial
gap
Availability of DF+
business models
Sub-dimensions
Applicability of
DF+ solutions
1
Binding constraint Readiness for scaling
2 3 54 Explanation
6.2 HEALTH – VIABILITY OF OBSERVED AND POTENTIAL BUSINESS MODELS

132
In the Health sector, DF+ solutions are nascent but growing
Discovery
Piloting
Scale
Application
Expansion and
differentiation
Global scaling
DF+ solution
maturity
• DF+ solutions in
ideation or early
development stage
• Individual DF+
solutions are being
piloted in controll-
ed environments
by selected actors,
especially donors
• Smaller players
have implemented
DF+ into
operations across
conditions
• Some DF+
solutions begin to
be used by large
health system
players (e.g.,
MSD, MOH public
facilities, large
private providers)
• DF+ becomes an
essential
component of the
provision of care
and proposed
health system
reform
• Growth
financing/
subsidy
• Growth
financing/
subsidy and
innovation
support
• Implementation
support
• Convene
stakeholders to
discuss
expansion
• Financial and
technical advice
during piloting
phase
• Best practice
sharing
• Operating model
development
activities
• The health sector lags other sectors in the adoption of mobile payments
• Donor organizations are piloting subsidy-based demand and access generation for a limited set of products
• The use of DF+ is unlikely to be a tipping point in financial product availability to facilities or BoP consumers
• However, unexplored business models do exist for maternity savings, insurance, and lease-and-own equipment
• The scaling of DF+ solutions will depend on government incorporation into comprehensive reform
6.3 HEALTH – SCALING AND EXECUTION CAPABILITIES
Inte
rve
nti
on

133
CGAP‘s impact model for health could focus on shaping the
public discourse and potentially advising on a pilot
Questions
• Perspective on challenges and opportunities
for DF+ in the health sector with specific
reference to the Tanzanian case
• Given the complexity of the
stakeholder environment,
the subsidy-based model,
and fundamental obstacles
in the health sector, how
much can CGAP affect the
progress of DF+ solutions?
• Does CGAP want to
participate in the early stage
product development and
piloting, given the
substantial risk in the
process?
Public
discourse
Advisory
Publication
Conference
contribution
Country-specific
policy dialogue
Organizer of pilot and
guarantor/lender
Sector-specific
policy dialogue
Convener and
matchmaker
Individual
technical advisory
Health-specific impact model
• Identification of a health sector partner
(donor) and a detailed product development
and implementation plan for Tanzania
Spectrum of impact options
6.3 HEALTH – SCALING AND EXECUTION CAPABILITIES
134
Agenda
Sector analysis – energy
Sector analysis and challenge identification
Assessment of financial service needs and gap analysis
Digital finance plus solution feasibility assessment
Readiness framework
Sector analysis – agriculture
Sector analysis – health
Role of the government and regulation
Access to and reach of mobile infrastructure
Sector analysis – water
Sector analysis – education
Adoption and reach of digital payment infrastructure

135
Key takeaways: Energy sector analysis and challenge
identification
ENERGY – SECTOR ANALYSIS AND CHALLENGE IDENTIFICATION
4.3 Sector-specific regulation
• TANESCO, the national utility, exercises a near monopoly on the distribution, transmission, and retailing of electricity in Tanzania
• With only ~1,500 MW of installed capacity nationally, a large portion of the Tanzanian population does not have access to electricity – only
18% of households are connected to the grid; rural households, which comprise ~70% of the population, are particularly underserved, with
only 7% enjoying access to the national grid
• Although TANESCO, the state utility monopoly, is moving forward with ambitious plans to drastically add capacity and grow national
electrification to 30% by 2017, this still leaves a large portion of the country’s households without access
▪ In the absence of adequate on-grid connectivity, a number of innovative actors are moving into off-grid solutions, mostly based on solar
power, to meet the energy needs of an estimated 5 million rural households with demand for off-grid solutions
4.2 Sector impact on low-income households
• Rural areas, where the majority of low-income households live, are particularly affected, with only 7% of households connected to the gird
• Even where connections exist, the per capita consumption is a low 92 KWh, (compared to ~160 KW in neighboring Kenya, for example) with
service being characterized by frequent power outages and inconsistent voltage transmission
• Consequently, low-income households use environmentally non-sustainable and relatively more expensive energy options like kerosene
lamps, with an average spend of up to USD 12/month
• The regulatory framework and policy environment are relatively conducive to private investment, as the government has emphasized the
sector as a policy priority, written a comprehensive legislation, and undertaken significant deregulation
• Off-grid energy enterprises can take special advantage of this, as developers with less than 100 Kw of project capacity experience a
minimum of government interference
• Moreover, the government created two agencies, Energy and Water Utilities Regulatory Authority (EWURA) and Rural Energy Agency
(REA), to regulate, promote, and facilitate investment in the off-grid sector
• Both the on- and off-grid value chains face significant bottlenecks to providing accessible and affordable energy, including
– On-grid: input shortages, low installed capacity, suboptimal network operation, poor revenue collections and non-cost-reflective consumer
pricing
– Off-grid: absence of energy enterprises, inadequate enterprise working capital and consumer financing, weak “last mile” reach, high capital
cost of device, and poor on-site technical support
4.4 Sector challenges
4.1 Sector description

136
Poor electricity access is a challenge
• Tanzania ranks poorly
among peer countries in
energy provision, with a low
electrification rate of 18%
• Rural areas in particular
suffer from almost non-
existent access to the
national grid, with only 7%
receiving access to often
poor quality service
• The short- and long-term
implications of constrained
energy access are dire,
hampering the economic
growth of the country and
diminishing the quality of
life of urban and rural
populations
Access to electricity, Percentage of population, 2011
Key takeaways
Have
access
Do not
have
access
Much of the Tanzanian population does not have access
to electricity
72
20
7
15
18
19
22
23
Uganda
Mozambique
Tanzania
Kenya
Malawi
Zambia
Ethiopia
Ghana
SOURCE: World Bank
71
93
29
7
Urban
100
Rural
100
4.1 ENERGY – SECTOR DESCRIPTION

137
Electrification rate varies by region, and 7 regions remain
disconnected from the national grid
SOURCE: Power System Master Plan
Significant portions of the country have very little access to the grid
• The rate of electrification is
relatively high in a few regions
of the country, including
Arusha, Pwani and
Kilimanjaro
• In rural states, both the
electrification rates and total
consumption are extremely
low, with Kigoma and Rukwa
having the lowest access
• There is not an adequate
national strategy or
wherewithal to scale on-grid
access to address the
significant electrification and
consumption gaps
Key takeaways
Electricity reach and consumption
2012Lake Victoria
Lake
Tanganyika
Lake
Nyasa
PembaManyara (24, 36%)
Mara
(58, 22%)
Kilimanjaro
(138, 31%)
Arusha
(282, 12%)
Tanga (197, 20%)
Zanzibar
Lindi (15, 44%)
Mtwara (29, 36%)Ruvuma (21), 35%
Iringa
(95, 30%)
Morogoro
(182, 17%) Pwani
(112, 13%)
Dar Es Salaam
(2,090, 5%)
Dodoma
(92, 33%)
Singida
(22, 40%)
Rukwa & Katavi
(17, 54%)
Mbeya (144, 26%)
Kigoma
(12, 35%)
Tabora (85, 14%)
Shinyanga (287, 6%)
Kagera
(46, 35%)
Mwanza
(217, 13%)
0-5% electrification
5-10% electrification
10-15% electrification
Not connected to national grid
GWh consumed(x)
(%) Domestic consumption as %
of total consumption
>15% electrification
4.1 ENERGY – SECTOR DESCRIPTION

138
Tanzanian households do not enjoy adequate access
to electricity
40
80
Ethiopia
Tanzania
Kenya 148
Ghana 257
Mozambique 449
Zambia 686
Energy consumption per capita is low and growing at a slow pace
• Although Tanzania has grown
its per capita access to power,
it still significantly
underperforms its peers
• Even those who have access
to electricity often receive low-
quality supply
– Outages are frequent and
can be prolonged, with
some days witnessing as
much as 12 hours of
outage
– Fluctuations in voltage are
frequent because of to
generation constraints and
network operation issues
• Poor quality supply is
particularly harmful to
industrial users, causing
disruptions in production
schedules and increasing the
costs of conducting business
2007 2011 CAGR
-3%
0%
8%
1%
4%
7%
Key takeaways
52
92
599
155
344
447
SOURCE: World Bank; team analysis
Electric power consumption
KWh/capita
4.1 ENERGY – SECTOR DESCRIPTION

139
Hydropower is the primary source of electricity generation
but requires supplemental support from other energy sources
Hydro generates the
largest share of power
SOURCE: World Bank; Power System Master Plan
Although installed capacity has been growing
slightly, much of it was in emergency generation ▪ TBDKey takeaways
• The country’s installed
capacity has been growing,
but it has not kept pace with
annual GDP growth of ~7%
• Hydropower comprises the
majority of installed
capacity, but shortages in
rainfall and increased water
usage in dam catchments
have contributed to
declining output
• TANESCO has thus been
unable to meet ~30% of
existing demand,
necessitating capacity
addition of 325 MW at peak
load by way of expensive
diesel emergency power
generation
30.7
100%
Fossil fuel
Gas
Hydro
2012
1,438 MW
30.3
39.1
292 292 295 295 292
226 208 252 252 259
562 562562 562 562
325212
2009
1,061
2012
1,438
2011
1,320
2010
1,108
2008
1,079
Independent power producerTANESCO
TANESCO thermalEmergency Power Producer
Generation sources
%
Evolution of installed capacity
MW
4.1 ENERGY – SECTOR DESCRIPTION

140
EPP generation cost is 2.5 times above average tariff,
undermining the sector’s financial viability
SOURCE: TANESCO; UPEDA African Tariff Comparison
100
200
0
700
300
5,0004,5004,0003,5003,0002,5002,0001,5001,0005000
400
600
500
800
X2.5
TANESCO thermal IPP
TANESCO isolated EPP
TANESCO hydroGeneration cost, excluding transmission and distribution cost, TZS/kWh
GenerationGWh
Average tariff
• Emergency power
generators powered by
isolated diesel stations
have stepped in to fill the
shortfall in installed
capacity
• However, the high price
of fossil fuels and lack of
scale in the fragmented
generation entails 2.5X
the cost of hydropower
generation
• Moreover, tariffs for end-
users are not reflective of
the heightened EPP
costs, which hurt long-
term investment in
regular grid expansion
and rehabilitation
• Thus, this highlights the
potential for more cost-
effective, and cleaner,
off-grid solutions
Key takeawaysThe cost of generation is extremely high for emergency diesel power generation
4.1 ENERGY – SECTOR DESCRIPTION

141
Key takeaways
High demand for off-grid lighting
energy solutions
Total off-grid households
Millions
Many innovative players are serving
BoP households across the country
▪ “We are using mobile money to sell
solar power as a daily service at an
affordable price – with more than
14,000 homes taking up the service
so far. As fast as systems are
manufactured, they are off to
customers”
Off-Grid Electric
▪ “The Cluster Projects have resulted
in approximately 40,000 new rural
solar home systems annually,
providing quality and affordable
electricity to rural households”
Camco
▪ “We are connecting 10,000 private
households with electric energy
through Solar Home Systems
(SHS) in Arusha, Manyara,
Kilimanjaro, and Mwanza regions ”
Mobisol Tanzania Limited
Based on
households
currently
making
capital and
operating
expen-
ditures on
paraffin
lamps with
glass covers
• 90% of the Tanzania population
resides in rural areas, making on-
grid energy provision costly and in
many cases un-economical
• Even with the government’s
aggressive targets to increase
installed capacity on the grid, a
significant portion of the
population will not obtain access
to energy in the short term
• Decentralized energy is likely to
be the only viable near-term
solution for many rural residents
• Declining technology costs,
innovative energy enterprises, and
improved financing schemes are
enabling the adoption of off-grid
energy solutions in rural settings
• Still, non-grid proliferation is often
considered as a pre-electrified
option, with many communities
still aspiring to long-term grid
connectivity
Off-grid electricity is increasingly becoming an attractive option to
provide energy, particularly to rural households
2.82
2011
7.06
4.24
SOURCE: World Bank; IFC
Unlikely off-
grid solution
adopters
Likely off-
grid solution
adopters1
4.1 ENERGY – SECTOR DESCRIPTION

142
Assumptions
…making about ~4 million additional households eligible for
solar off-grid solutions
There will be ~3 million total electrified households by 2017
according to current plans…
The estimated total addressable market for off-grid power
solutions is ~4 million households
SOURCE: Rural Energy Agency; Power System Master Plan; IFAD Rural Poverty Portal
1,250
3,093
1,728
115
Planned
TANESCO grid
connections
(by 2017)
Electrified
households
(2012)
Total electrified
households
(2017)
Planned non-
solar OG
connections
(by 2017)
3,093
3,566
4,146
10,805
Potential off-grid
market (2017)
Households
below poverty
line (2017)
Electrified
households
(2017)
Total
households
(2017)
• 9.6 million
households
• 18%
electrif-
ication
• TANESCO
plans
250,000
new
connections/
year
• Planned
100 MW
capacity
• ~860 W
capacity/
household
• Planned
100 MW
capacity
• ~860 W
capacity/
household
• 3% annual
population
growth
• On + (non-
solar) off-
grid
additions
• 33% of
population
below
poverty line
4.1 ENERGY – SECTOR DESCRIPTION

143
SAO Hill Energy
Several off-grid enterprises have come online in the past few years, adding
~80 MW of capacity
1 Some of the companies provide solutions across multiple levels of scale
Biomass
Energy source
Estimated total
capacityExample projects Location
Iringa
TPC Moshi Sugar
CogenMoshi
20 MW
Hydro
MufinidiMwenga Hydro
Mapembasi Hydro Ruhidji
50 MW
Solar Off-grid Electric
EGG-energy
Mobisol
Dar, Iringa, etc.
Arusha, Moshi, etc.
Arusha, Moshi, etc.
5 MW
4.1 ENERGY – SECTOR DESCRIPTION

144
There are three types off-grid energy delivery models
to the household in Tanzania today
DescriptionExample company1Model Description
Household-
level systems
Power generated at the
household level
provides electricity for
most or all domestic
energy needs
Community-
level systems
Power generated in
isolated, low-voltage
distribution grid and
provides electricity to a
collection of house-
holds in a community
EGG-energy
1 Some of the companies provide solutions across multiple levels of scale
• Products typically consist of home solar systems, with small
panels that are installed on rooftops and generate electricity to
light multiple rooms, charge mobile phones, and power electrical
appliances
• Most models typically extend financing support to customers,
whereby they pay an initial down payment or installation fee,
and pay off the cost of systems and/or service over an extended
period
• Biomass, hydro, and solar powered distributed generation to
provide electricity to communities
• Products typically consist of a connection to the mini- or micro-
grid, with flexible optionality of devices and appliances
• Usage is for households, enterprises, and public good providers
(e.g., schools), as well as kiosks for mobile charging
Device-based
Power generated at the
household level or
offsite to provide
electricity for select
domestic energy needs
(lamp & charger)
• Products typically consist of a modular solar lamp and a mobile
phone charger, powered by a rechargeable battery
• Shop-owners become micro-franchise, initially owning the solar
panel and charging the consumer for daily battery recharge
• In the leasing model, the consumer takes ownership of the
panel after a specified period and becomes solar independent
4.1 ENERGY – SECTOR DESCRIPTION

145
The distribution, transmission, and retailing market is dominated
by the national utility, TANESCO
SOURCE: Global Data report on Tanzania; African Energy; EWURA; Frost; team analysis
Regulatory framework
• Generation is the only non-monopolistic part of the
energy value chain with private sector presence
– Mixed generation model (with independent
power producers, IPPs, and emergency power
producers, EPPs) since 2002/2011
– Public generators, IPPs, and EPPs receive
generation licenses from sector regulator
EWURA and conclude PPAs with the incumbent,
vertically integrated state power utility TANESCO
– The national gas supply company TPDC
supplies gas to TANESCO, which supplies fuel
to both its own and most IPP plants
• Transmission and distribution lines belong wholly
to incumbent TANESCO, not unbundled
– Transmission charges and end-user tariffs are
regulated by EWURA
– On-going discussion exists about splitting
TANESCO into multiple Gx and/or Dx entities
• Privatization of any TANESCO assets is unlikely in
the next 3-5 years
Sector structure
Genera-
tion
Trans-
mission
Distribu-
tion
Sector configurationSegment
TANESCO
Transmission
PPAs
EPPsIPPsTANESCO
Generation
Consumer end-
users
Industrial end-
users
TANESCO
Distribution
4.3 ENERGY – SECTOR-SPECIFIC ACTORS AND REGULATION

146
The regulatory and policy framework in Tanzania is conducive to
private investment in off-grid generation
The master policy
framework is
comprehensive
• The national energy sector legislation was revised in 2001, allowing for the
privatization of electricity generation, transmission, and distribution, with the
option of sale to TANESCO for retailing
• Standardized Power Purchase Agreements (SPPAs) were also formulated to
minimize negotiations between energy developers and the utility, as well as
expediting financing and contracting hydro, biomass, and solar projects
• Enterprises are further categorized into three segments, with progressively
lower regulatory burdens with smaller size
– Consequently, enterprises with a total capacity of less than 100 KW are
almost entirely unregulated, unless more than 10% of customers lodge an
official complaint with authorities
A number of
government
agencies are
mandated with
supporting the
sector
• Two government agencies were created in 2006 and 2008, respectively, with
mandates to regulate and facilitate the off-grid energy space
– Energy and Water Utilities Regulatory Authority (EWURA): tasked with
the technical and economic regulation of the energy sector
– Rural Energy Agency (REA): tasked with promoting, coordinating, and
facilitating private sector initiatives and entrepreneurship in rural
energy supply
Off-grid energy
developers are
fast emerging
• The supportive regulatory and policy environment has thus seen a number of
biomass and hydro mini- and micro-grid projects, as well as a host of solar
enterprises mostly providing household-based generation
4.3 ENERGY – SECTOR-SPECIFIC ACTORS AND REGULATION

147
Significant challenges exist for both the on- and off-grid value
chains constraining access to and affordability of energy (1/2)
4.4 ENERGY – SECTOR CHALLENGES
▪ Water shortages:
Drought and rain pattern
conditions limit supply
▪ Gas supply
inconsistency:
Infrastructure has
reached maximum
capacity
▪ Thermal expense:
Imported fuel has high
price points
▪ Low installed capacity:
Less than 20% of the
country is electrified, with
a number of districts
totally off the grid
▪ Poor supply quality:
Frequent outages (up to
12hrs/day) and voltage
fluctuations
▪ High auxiliary
generation cost: IPPs’
and EPPs’ contracts
involve high capacity and
energy charges
▪ Insufficient
infrastructure: Power
line density and reach
does not encompass
many new plants and
customers
▪ Sub-optimal
operations: Aged and
unstable networks and
substations, overheating
lines, and conductor
sizing lead to high
transmission loss (~8%)
and technical and
commercial distribution
loss (~17%)
▪ Poor revenue
collection: High
customer default and
low collection
efficiency
▪ Non-transparency
into peak usage:
Consumers unaware
of periods of highest
demand to modulate
consumption
▪ Non-cost-reflective
consumer pricing:
EPP tariffs cost 2.5X
regular generation,
but are not passed
onto consumer
1 2 3 4
On-grid
Limited application for DF+Focus of DF+
applications
1
.
14.1
1
.
14.2
1
.
14.3
Ch
all
en
ges
in
th
e e
ne
rgy s
ec
tor
1
.
11.1
1
.
11.2
1
.
11.3
1
.
12.1
1
.
12.2
1
.
12.3
1
.
13.1
1
.
13.2

148
1 High initial capital outlay is prohibitive across all scales of off-grid generation given that end-users are always low-income households
Promotion and retailing of
energy products
Purchase, installation, and operation of
energy product(s) and/or service by BoP
households
Routine care for and
refurbishing of energy
product(s)
Research, development , and
refinement of technology
Manufacture/importing of
generator and/or device by
energy enterprise
Off-grid
D EA B C
Challenges
4.4 ENERGY – SECTOR CHALLENGES
Significant challenges exist for both the on- and off-grid value
chains constraining access to and affordability of energy (2/2)
B1 C1 Insufficient working
capital finance
Lack of working capital
finance for energy enter-
prises to finance setup of
distribution network, initial
marketing campaign and
purchase of SHS (that
amortize over 2-3 year
period through usage fee)
Insufficient distribution
reach
Energy enterprises need to
establish costly distribution
network to reach beyond
large population centers
C3
C4 Insufficient consumer
risk management
experience / tools Energy
enterprises lack
experience and tools to
assess and manage credit
risk of potential customers
Device-based
Household-level
Community-level
D1 Insufficient consumer lending to
low-income households Low income
households have little or no access to
short-term bank lending to finance
energy device
Insufficient consumer lending to
low-income households Low income
households have little or no access to
medium-term bank lending to finance
SHS
D2
Usage modulation: Insufficient ability
to match supply with demand,
especially in peak usage periods
D6
Complex payment administration
Unavailability of cashless and cost-
effective payment instruments to
operate installment-based finance
see above
E2 Insufficient upgrade
financing
Battery replacement
changes (every ~3 years)
for solar systems too costly
for one-time payments
Lack of effective
maintenance Inadequate
technical capacity and
poor infrastructure limit
maintenance provision
E1
Unavailability of
protection against theft
or destruction of
equipment
No insurance tool to
protect against theft,
damage, destruction of
generation devices
E3
A1 Insufficient business
development financing
Lack of early stage / seed
financing especially for
local companies
Insufficient product
financing
Lack of working capital to
finance initial production,
assembly
Insufficient consumer
awareness
Rural population
insufficiently informed
about benefits of off-grid
solutions
C2
A2 Insufficient local
research and
development capacity:
Limited domestic
technical infrastructure
and talent to develop
products that are tailored
to the domestic market
(all products foreign
developed)
D3
D4 Unavailability of liquidity facility
Low income households do not have
access to liquidity facilities to
smoothen consumption
see above
see above
D4
D3
D1/2

149
Agenda
Sector analysis – energy
Sector analysis and challenge identification
Assessment of financial service needs and gap analysis
Digital finance plus solution feasibility assessment
Readiness framework
Sector analysis – agriculture
Sector analysis – health
Role of the government and regulation
Access to and reach of mobile infrastructure
Sector analysis – water
Sector analysis – education
Adoption and reach of digital payment infrastructure

150
Key takeaways: Energy sector – assessment of financial service
needs and gap analysis
• On-grid finanial service needs exist around mobile payment and billing integration as well as dynamic usage pricing
• A number of financial service needs exists along the off-grid energy value chain including energy enterprises access to
long-term credit for product development, manufacturing, and/or bulk import of solar home systems as well as substantial
working capital to stock inventory and provide some form of financing to their end-consumers
• Off-grid energy consumers also have a variety of financing needs, including access to short to medium-term credit to
make capital-intensive energy system purchases, savings products to financing periodic equipment upgrades, and a
payments platform for convenient payment of utility service bills and loan servicing
ENERGY – ASSESSMENT OF FINANCIAL SERVICE NEEDS AND GAP ANALYSIS
• Formal financial institutions currently provide limited lending to any off-grid energy actors, given a low base of
experience in the sector. MFIs have a somewhat mixed record, but they are hampered by of low levels of managerial
capacity, a high cost-to-serve, and a reluctance to invest time and resources required to serve the sector
• Energy enterprises currently meet their significant working capital needs through a combination of equity fund-raising
rounds, mostly impact investors, but also increasingly for-profit investment funds, (e.g., Solar City, Vulcan Capital, etc.) and
government/donor-sponsored grants, credit guarantees, and refinancing facilities (e.g., TEDAP fund capitalized by the
World Bank and administered through REA and TIB, AECF fund capitalized by DIFID, BMGF, and IFAD)
• For consumers, affordability by itself is not an insurmountable challenge. Consumers are willing to pay if they are
convinced of the energy product’s efficacy, and if an installment based payment option exists.
• The inability and/or reluctance of financial institutions to extend commercial loans to energy enterprises or provide
consumer financing to households is driven by several factors, including, their lack of knowledge about the sector and its
unique needs, an unwillingness to extend uncollateralized loans to low-income households and a high-cost to serve to
serve rural, low-income households
5.2 Financial gap analysis along the value chain
5.3 Barriers to provision of financial product
5.1 Financial service needs along the value chain

151
Significant financing needs exist across the off-grid
value chain (1/2)
5.1 ENERGY - FINANCIAL SERVICE NEEDS ALONG THE VALUE CHAIN
1 2 3 4
On-grid
Fin
an
cin
g/i
nfo
rma
tio
n n
ee
ds
• Payment instrument
Pre- or post-service
payment portal for
account settlement
linked to consumer
meter reader
• Informational
instrument
Communication of
system energy demand
and differential tariffs to
household/enterprise
consumers, or
electronically linked to
end-devices for
adjustment
1
.
14.1
1
.
14.2

152
Significant financing exist needs across the off-grid
value chain (2/2)F
ina
nc
ing
/ i
nfo
rma
tio
n n
ee
ds
Off-grid
5.1 ENERGY - FINANCIAL SERVICE NEEDS ALONG THE VALUE CHAIN
Promotion and retailing
of energy products
Purchase, installation, and
operation of energy product(s)
and/or service by BoP households
Routine care for and
refurbishing of energy
product(s)
Research, development ,
and refinement of
technology
Manufacture/importing of
generator and/or device by
energy enterprise
D EA B C
B1 C1 Working capital finance
Energy enterprises require
medium-term working
capital facilities to
purchase products and
finance distribution and
marketing organization
C4 Consumer risk
management tools
Energy enterprises require
financial risk assessment
tools or 3rd party risk
management tools
Device-based
Household-level
D1 Short- to medium -term consumer
lending to low-income households:
Short- to medium term consumer
loans matching household income and
expenditure
Digital, cost –effective payment
system Digital (remote) payment
instrument integrated with SHS on a
consumption or lease basis
D3
Liquidity facilities for low-income
households: Short-term liquidity
product to smoothen energy
consumption and help households
manage unequal income flows
D4
E2 Upgrade financing: Short
to medium-term consumer
loans tied to the purchase
of SHS- upgrades /
replacements / repairs
Technical support:
Remote diagnostic and
device information system
that identifies maintenance
issues and triggers
necessary instructions for
self-service or
maintenance agents
E1
Device insurance P&C
insurance product tailored
to SHSs and needs of low-
income households
E3
A1 Seed financing
Early stage start-up
financing to enable
product and business
model development
Product financing
Product financing loans for
energy enterprise to fund
the production of 1st
generation products
D2 Medium -term consumer lending to
low-income households : 2-3 year
household loan designed to finance
SHS, collateralized and secured
through shut-off ability and SHS
Community-level
D3
D4
D2 See above
See above
See above

153SOURCE: Organization websites, press search; expert interviews; team analysis
The finance-related needs of the off-grid energy
sector are being met to a limited but improving extent Minimal Moderate
LimitedN/A
Number/reach of existing initiatives
Financial
instrument
Payments
Credit
Grants/subsidies
Information
Short term
Long-term
Lease and own
Lease
Loan servicing
Pay-as-yougo/pre-paid
Equity
Leasing
Persistent Energy Partners,
SolarCity SunFunder, Vulcan Capital
TEDAP (by World Bank, Rural Energy Agency), USAID, SIDA
AECF (by DIFID, IFAD,
BMGF), USAID, SIDA
TIB and CRDB (with WB
refinancing)
Bank of Africa, TIB, and CRDB (with WB refinancing)
REA REA
Karibu
Solar
Mobisol, EGG -energy
Off-Grid
Electric Devergy
Karibu
Solar
Mobisol, EGG-energy, OGE
Devergy
Devergy Mobisol, Off-Grid Energy
Mobisol, Devergy
Persistent Energy Partners
Off-grid
D EA B C
Device-
based
HH-level
system
Com.-
level syst.
i ii iii
Mobisol, EGG-energy, OGE
5.2 ENERGY - FINANCIAL GAP ANALYSIS ALONG THE VALUE CHAIN

154
Certain off-grid energy sector challenges are driven by
financial gaps, some of which DF+ can address (1/3)
Market-
ing and
distribu-
tion
C
1.1
Value chain
gapDF+
solutionDrivers
Finance
need Existing services Barriers
►Commercial lending is scarce for the off-grid energy sector
• Banks only lend to energy enterprises with significant 3rd party guarantees/donor backing (e.g., World Bank -sponsored TEDAP loan refinancing facility at Tanzania Investment Bank)
• Energy enterprises meet significant working capital needs through equity funds raised from investors
• Banks have little understanding of the OG energy sector
• Banks perceive insufficient collateral to justify risk
• The duration of energy enterprises’ capital needs extends beyond banks’ depository obligations
C1
Insufficient
working
capital
finance
1.1Insufficient
consumer
awareness
C2
1.1Insufficient
distribution
reach
C3
►Rural populations are not educated about/convinced of the benefits of off-grid energy solutions
►Time and resource-intensity of establishing points of sale and training agents
1.1C4
Insufficient
risk mana-
gement
experience
/ tools
►Absence of data points on income, cash flow, behavior, etc. on low-income consumers
►Unavailibity of effective risk management tools
• No credit bureaus in the market – financial institutions and energy enterprises have few data points to assess consumer risk profiles
• Energy enterprises with advanced data capture capabilities are beginning to analyze usage and payment behavior for risk profiling
• Lack of low-income household participation in the formal financial system
• TBD
)( )(
DF+ solution
Add-on to core
DF+ solution)(
5.3 ENERGY – BARRIERS TO PROVISION OF FINANCIAL PRODUCT

155
Certain off-grid energy sector challenges are driven by
financial gaps, some of which DF+ can address (2/3)
Usage
and
gen-
eration
D
1.1
Value chain
gap
Finance
need Existing services
►Financial institutions do not provide uncollateralized loans to low income households
►Financial institutions are unfamiliar with the off-grid energy sector
• Energy enterprises offer implicit financing to consumers through lease-to-own/lease/pay-per-use options for solar home systems
• Such financing is not available at scale because of the enterprises’ limitations in securing commercial lending for working capital
• Banks have little understanding of the OG energy sector
• Lack of credit information on the consumer
• Perceived difficulty of securing collateral
• High cost to serve
D1/2
Insufficient
consumer
lending to
low-income
households
1.1D3
Complex
payment
adnmin-
istration
►Traditionally paper-based payment for services required physical presence
• Legacy energy enterprises (e.g., ENSOL) required physical payment by customers at retail locations
• Newer solar players (e.g., Off-Grid Energy, Mobisol) use mobile money solutions to wholly digitize payments
• Mobile phone access and mobile money adoption –penetration of both is high in Tanzania, but not ubiquitous
1.1D5
Weak cons-
umption
mo-dulation
on micro
grids
►Where several households are connected, the communal grid may become unstable because of excess usage by some to the detriment of others
• Traditional biomass/hydro micro-grids have minimal ability to modulate individual consumption
• New solar micro-grid players (e.g., Devergy) have ability to regulate individual usage remotely
• Smart grids are technologically complex to implement
)( )(
DF+ solution
Add-on to core
DF+ solution)(
DriversDF+
solutionBarriers
5.3 ENERGY – BARRIERS TO PROVISION OF FINANCIAL PRODUCT
1.1D4 ►Financial institutions do offer short-term liquidity facilities to households
• Vodacom and CBA have recently launched a M-Pawa as a first liquidity solutions
• Lack of credit information on the consumer
• Perceived difficulty of securing collateral , lack of enforcement mechanisms ( e.g. credit bureau)
Insufficient
liquidity
facilities

156
Certain off-grid energy sector challenges are driven by
financial gaps, some of which DF+ can address (3/3)
Mainten-
anceE
1.1
Value chain
gap
Finance
need Existing services
►Small number of maintenance experts
• Most innovative energy enterprises use a combination of self-help enablement through SMStechnology, remote diagnostic support through call centers, and deployment of a mobile force of technicians where high-touch intervention is required
• Economic infeasibility of staffing, training, and maintaining a large group of technicians
• Distance/dispersion of rural households from central points of service
E1Lack of
effective
mainten-
ance
1.1E2
Insufficient
of upgrade
financing
1.1E3
Unavaila-
bility of
protection
against
theft or
damage of
equipment
)( )(
►Difficulty of two-way communication between customers and enterprise
• Batteries powering solar home systems – which require costly replacement every 2-3 years – are financed by the consumer or in part by the energy enterprise
• Banks have little understanding of the OGenergy sector
• Lack of credit information on the consumer
• Perceived difficulty of securing collateral
►Financial institutions do not lend to low-income house-holds on an uncollateralized basis
• Owners of solar panels do not currently have any option to purchase insurance coverage for their expensive hardware – energy enterprises do selective insurance of their inventory
• Low-income household market insufficient understood by mainstream insurance companies
• Low-income households already expend substantial income on SHS system –paying additional premiums for insurance is prohibitive
• High cost to serve
►Financial institutions do not serve the low-income household P&C market
)( )(
DF+ solution
Add-on to core
DF+ solution)(
DriversDF+
solutionBarriers
5.3 ENERGY – BARRIERS TO PROVISION OF FINANCIAL PRODUCT

157
Agenda
Sector analysis – energy
Sector analysis and challenge identification
Assessment of financial service needs and gap analysis
Digital finance plus solution feasibility assessment
Readiness framework
Sector analysis – agriculture
Sector analysis – health
Role of the government and regulation
Access to and reach of mobile infrastructure
Sector analysis – water
Sector analysis – education
Adoption and reach of digital payment infrastructure

158
6.1 Potential applications of DF+ to address barriers
Key takeaways: Energy sector – Digital finance plus solution
feasibility
ENERGY – DIGITAL FINANCE PLUS SOLUTION FEASIBILITY
6.3 Scaling and execution capabilities
• The off-grid energy space in Tanzania includes several players (6-8 notables companies, including Mobisol, Off.Grid :Electric, Devergy and EGG-energy), many of whom have integrated DF+ as an essential enabler of their business models. The se energy enterprises have modest scale, with each player serving ~1,000 to ~20,000 households today
• For the majority of these players, DF+ facilitates mobile payments (pre-paid, pay-as-you-go, and post-paid schemes for energy services and/or energy hardware leasing and/or ownership), allows remote regulation (enabling/disabling energy provision through a control box, providing network maintenance), and enables two-way communication with customers (SMS alerts for payments, maintenance, consumption modulation).
• Thus, DF+ encourages energy enterprises to offer products and financing by enabling contract enforcement, cutting the cost of customer service, driving scale, and providing scope for additional services
• The successful solar enterprises have identified winning technologies, built low-cost and effective distribution networks with “last mile” reach, and deployed capital productively by acquiring creditworthy customers and providing them with financing, thereby fortifying a loyal and growing customer base, as well as establishing credibility with investors
• With payback periods of up to 2 years by customer, many of the nascent players, mostly having entered the market around 2010, are beginning to turn profits on their first wave of customers
• Given the solar enterprises are proving commercial viability, investors are expressing enthusiasm to fundraising new equity, with many rounds being oversubscribed; however, securing commercial loans without donor support continues to be a challenge
• Today, there are estimated to be 50,000-100,000 total off-grid connections in Tanzania. Depending on the business model, “true scale” (profitable including over-head) for a single energy enterprise can range from 20,000 customers (household solar systems) to 80,000 connections (solar micro-grids); for nation-wide operations “true scale” number of off-grid customers to be closer 1 million households
• For the off-grid sector and individual businesses to attain scale, there are a few key areas of focus, including financing through commercial lending, awareness-creation in rural populaces about the benefits of OG solutions, and the establishment of wide, efficient, and cost-effective networks for sales and user support
6.2 Viability of observed and potential business models

159
DF+ can help in addressing some of the gaps
in the off-grid energy value chain
Value chain segment ChallengesProduct
evaluation
Finance
as barrier
DF+
potential
No other
barriers
Assessment of applicability of DF+ solution
)(
)(
A2
B1
C1
C2
C3
C4
D1/2
D3
D4
E1
E2
E3
A1 Insufficient business development financing
Insufficient local research and development capacity
Insufficient product financing
Insufficient working capital finance
Insufficient consumer awareness
Insufficient distribution reach
Insufficient consumer risk management experience and tools
Insufficient consumer lending to low-income households
Complex payment administration
Unavailability of liquidity facility
Lack of effective maintenance
Insufficient upgrade financing
Unavailability of protection against theft or destruction of equipment
)(
)(
DF+ solution
Add-on to core
DF+ solution)(
6.1 ENERGY – POTENTIAL APPLICATIONS OF DF+ to ADDRESS BARRIERS
Product
development
Manufacture and
Assembly
Marketing and
Distribution
Usage and
Generation
Maintenance
High Low

160
Top challengesDescriptionDF+ product
Lack of consumer financingD1/2 1. Product financing
2. Customer awareness
3. Distribution reach
4. Maintenance and repairs
• Payment tool that enables
lease-to-own/lease/pay-per-
use financing models for
solar home systems by
facilitating remote access
and incremental payments
• Digital payment-
enabled enterprise
consumer
financing for solar
home system
Addressed energy sector
challenge
A
1. Product financing
2. Credit risk assessment
3. Effectiveness of collateral
4. Usability of collected customer data
• Digitally-enabled loan
provided by a traditional
financial institution and sold
through solar enterprise
• Dedicated,
unsecured digital
household loan to
purchase solar
home system
B
1. Product financing
2. Smart grid technology
3. Distribution reach
• Remote grid maintenance
and network regulation
platform for micro-grids
driven by SIM-enabled
machine-to-machine
communication
• Digital micro-grid
maintenance and
administration
system
C
Lack of consumer financing 1. Product financing
2. Credit risk assessment
3. Effectiveness of collateral
4. Usability of collected customer data
• Pre-paid solar energy and
appliance leasing service for
households facilitated by
mobile payment platform
• Energy appliance
leasing bundled
with utility service
D
Insufficient consumer risk ma-
nagement experience / tools
C4
Insufficient upgrade
financing
E2
Complex payment
administration
D3
1. Consumer cash flow volatility
2. Government regulation
3. Moral hazard
4. Product financing
• Automated overdraft facility
to provide short-term loan
and usage payment relief for
SHS-owning households with
volatile cash flows
• Short-term Solar
Home System
(SHS) enterprise-
administered
overdraft facility
E
Based on our analysis of the current state and barriers to scale,
we suggest 5 DF+ applications for your further consideration
6.1 ENERGY – POTENTIAL APPLICATIONS OF DF+ to ADDRESS BARRIERS
D1/2
Lack of consumer financingD1/2
Insufficient upgrade
financing
E2
Complex payment
administrationD3
Inability to modulate
consumption on micro-grids
D5
D5 Lack of effective maintenance
Complex payment
administration
D3
D3 Unavailability of liquidity
facility

161
Financial
instrument
Lease-to-own/lease/pay-per-use digital
payment tool for SHS
Target
audience
Low-income households with
insufficient capital to purchase SHS
Product
provider
Solar enterprise
Product summary
• Payment tool that enables lease-to-own/lease/pay-per-use
deployment of solar home systems by facilitating
remote/incremental payments
Addressed financial need
• Inability of households to afford upfront capital expenditure
and/or access to financing to purchase a solar home system
Value proposition Product details
Core features
• Solar home system with 50 W – 200 W capacity typically consists of a roof-installed solar
panel, battery, control unit, and a number of integrated direct current household
appliances – e.g., CELL phone charger, LED lights, TV
• Three basic financing models 1) lease-to-own; 2) lease and, 3) pay-per-use are used to
break capital expenditure into daily, weekly or monthly payments by household
• Payment is enabled through digital payment
• Energy access is controlled either by an embedded machine-to-machine communication
capability or prepaid code entry
• The lease-to-own payment schedule is structured to transfer the ownership of the system
to the household after a fixed period
Overall value proposition
• Enables incremental electrification of
low-income households in remote off-
grid areas
• Makes the acquisition of a capital-
intensive solar energy system
affordable for low-income households
• Introduces low-income households to
loan-like financial products
DF+ specific value proposition
• Enables lease-to-own / lease / pay-
per-use financing models by
dramatically lowering payment
transaction costs
• Enables effective enforcement through
the remote control of the system
Potential extensions
▪ Liquidity tool, allowing the customer to delay payment while continuing to consume
energy
▪ Comprehensive maintenance and service guarantees
▪ Discount features: consumer unit price per KwH progressively decreases to incent
maximum usage
Lease-to-own/lease/pay-per-use financing for solar home
systems are enabled through digital payment application (1/3)A
6.1 ENERGY – POTENTIAL APPLICATIONS OF DF+ to ADDRESS BARRIERS

162
Lease-to-own/lease/pay-per-use financing for solar home
systems are enabled through digital payment application (2/3)A
Low
High
Feasibility
• Highly feasible: Established business
models have successfully reached scale
of 10,000 + households; financing,
distribution, demand, and service and
maintenance networks are capable of
delivering continued scaling
Potential impact
• High impact: Effective electrification of up to 5
million households (30 million people) is
possible
Feasibility assessment: Business model
Distribution reach
• Existing players have established effective distribution networks based on
existing retail structures (motorcycle garages) and dedicated salaried staff
Maintenance and repairs
• A number of players have established clear service levels and potent service
organized according to their distribution network
Customer awareness
• Word of mouth, dedicated marketing campaigns, and a commission-based
sales network have been able to generate significant demand for the product
Scale
• Significant overhead and distribution/service network cost requires scale of
50,000 – 80,000 households; a number of incumbents aim to reach this level
in the short to medium term
Detailed impact
• In the medium term,
5 million households
in Tanzania will
remain off the
national grid
• SHS and mini-grid
present a cost-
effective approach
to electrification of
off-grid areas
• Relatively low
system investment
costs and the
availability of
differentiated sizes
of systems (10 W –
200 W) enable
solutions tailored to
the financial
capabilities of
different levels of
low-income
households
Feasibility assessment: Enabling environment
Telco infrastructure
• Several mobile money players, many
of whom charge minimal rates per
transaction (e.g., Vodacom charges
0.165% of transaction value)
Government regulation
• Energy sector: Highly amenable, as
enterprise is under 100 KW total
capacity and thus essentially
unregulated
• Financial sector: Government places
no restrictions on unsecured loans
Product financing
• Energy enterprises provide a range
of digitally enabled payment options,
with a small down payment at the
initial system purchase, and follow-
on options of pre-paid or pay-as-
you-go models based on KwH usage
and/or defined time limits
Enterprise financing
• Equity: Enterprisers with proven business models have raised up to $7 million
in their 2nd and 3rd fundraising rounds (e.g., Solar City)
• Grants: Donor funds of ~$50,000-$500,000 are available for seed capital (e.g.,
Africa Enterprise Challenge Fund) and/or with proof of household connection
• Debt: Tanzanian banks are reluctant to lend; however, some are willing to
extend a credit line if backed by donor guarantee funds (e.g., African
Development Bank , 80% guarantee for CRDB loans)
6.1 ENERGY – POTENTIAL APPLICATIONS OF DF+ to ADDRESS BARRIERS

163
Lease-to-own / lease / pay-per-use financing for solar home
system enabled through digital payment application (3/3)A
Case examplesGo-to-market model
• Distribution typically done
through a mix of
commission-based sales
agents (district- and village-
level consumer goods
retailers) and dedicated
salesforce administrators
• Expansion follows regional
patterns, based on
regional/district patterns
with the objective of
maximizing penetration
levels in districts
• Solar enterprise typically
offers a comprehensive
package, including
installation, financing, and
maintenance/service
Mobisol offers a 3-year lease-to-own SHS
• 50 – 200 W SHS with embedded SIM card
(two-way communication)
• Fixed monthly lease payment through digital
finance
• Full service provision during a 3-year period
• Transfer of the ownership of device after 3
years
EGG-energy offers a 1-year lease-to-own
model
• Two sets of “d.light” solar home systems,
with a combination of lights, chargers, and a
solar panel
• Initial upfront payment, with daily mobile
payments over a 1-year period, after which
the customer owns the SHS
6.1 ENERGY – POTENTIAL APPLICATIONS OF DF+ to ADDRESS BARRIERS

164
Dedicated, unsecured digital household loan to purchase
solar home system (1/3)B
Product details
Core features
▪ A medium-term loan with a similar structure as the existing lease-and-own system
▪ The loan is sold by the solar enterprise acting as a banking agent
▪ The bank is responsible for the credit risk assessment leveraging the solar enterprise
sales infrastructure
▪ Risk management
– Willingness to pay: Controlled through remote energy access; requires integration
between the digital loan system (bank side) and the remote energy access system
(solar enterprise); default results in the removal of the solar panel
– Ability to pay: Credit check in partnership between the bank and the solar
enterprise
– Loans disbursement directly from the bank to the solar enterprise
▪ Once the loan is approved and disbursed, the customer makes the initial down
payment using mobile payment, as well as monthly loan servicing
Value proposition
Overall value proposition
▪ Enables the scaling of the current solar
enterprise business models by effectively
injecting working capital into the sector
through HH-level loans
▪ Households are able to own solar panels
with affordable financing
▪ The solar enterprise is relieved of balance-
sheet risk
▪ The bank expands its customer base by
providing branchless service to a
potentially attractive group
▪ Financial inclusion of low-income
households in the formal financial sector
DF+ specific value proposition
▪ Remote access control effectively serves
as collateral
▪ Digitally administered and serviced loans
reduce the cost of service delivery
Potential extensions
▪ Cross-selling through customer data: user-generated energy consumption and
payment data can be used to build detailed consumer profiles, with the ability to offer
additional financial products (e.g., savings, consumer loans)
Financial
instrument
Digitally administered, unsecured bank
loan for solar household system
Target
audience
Low-income households
Product
provider
Partnership between a financial
institution and a solar enterprise
Product summary
▪ Digitally-enabled loan provided by a traditional financial
institution and sold through solar enterprise
Addressed financial need
▪ Insufficient working capital finance for a solar enterprise to
scale operations
▪ Unavailability of unsecured lending to low-income
households
6.1 ENERGY – POTENTIAL APPLICATIONS OF DF+ to ADDRESS BARRIERS

165
Dedicated, unsecured digital household loan to purchase
solar home system (2/3)B Low
High
Feasibility
▪ Moderately feasible: Energy enterprises
can point to their own success in
recouping financing expense to end-
customers to help convince banks of
acceptable riskiness
Potential impact
▪ High impact: Effective electrification of up to 5
million households (30 million people) is
possible
Feasibility assessment: Business model Detailed impact
▪ In the medium term,
5 million households
in Tanzania will
remain off the
national grid
▪ SHS and mini-grid
present a cost-
effective approach
to the electrification
of off-grid areas
▪ Relatively low
system investment
costs and the
availability of
differentiated sizes
of systems (10 W-
200 W) enable
solutions tailored to
the financial
capabilities of
different levels of
low-income
households
Feasibility assessment: Enabling environment
Loan provision
▪ The banking sector has little experience
extending unsecured loans to individual
households; however, given the ability to
remotely shut off power provision, and the
ultimate option of asset seizure, in which
up to 70% of the loan’s value can be
redeemed (10% customer upfront
payment, 60% value of solar panel), the
bank is likely to become more willing to
accept the risk
Telco infrastructure
▪ Several mobile money players are active in
Tanzania, many of whom charge minimal
rates per transaction (e.g., Vodacom
charges 0.165% of the transaction value)
Government regulation
▪ Energy sector: All enterprises under 100
KwH of capacity are essentially
unregulated
▪ Financial sector: The government places
no restrictions on unsecured loans
Credit risk assessment
▪ Local sales agents with community knowledge pre-screen potential
customers; the bank’s proprietary credit assessment creates an
additional layer of verification
Effectiveness of collateral
▪ Once accustomed to energy consumption, customers highly value the
product/service, making disconnection an easily enforceable and
effective threat
Usability of collected customer data
▪ A rich set of data has been collected on customer usage and payment
behaviors, but concrete, monetized opportunities are still in the early
stages
6.1 ENERGY – POTENTIAL APPLICATIONS OF DF+ to ADDRESS BARRIERS

166
Dedicated, unsecured digital household loan for purchase of
solar home system (3/3)B
Case examplesGo-to-market model
No known examples • The solar enterprise forms a
partnership with a low-income
household-focused financial
service provider
• Customer acquisition continues to
be driven by the solar enterprise;
the banking network can serve as
an extension of the sales network
• The financial service provider
designs and operates the mobile
loan infrastructure and conducts
the credit risk assessment
• The existing solar enterprise sales
network can be leveraged for the
credit risk assessment (especially
the ability-to-pay assessment,
home visit)
• The financial service provider can
use gathered financial data to
cross-sell other financial products
6.1 ENERGY – POTENTIAL APPLICATIONS OF DF+ to ADDRESS BARRIERS

167
Micro-grid maintenance and system administration driven by
machine-to-machine digital communication (1/1)C
Value proposition Product details
Core features
▪ Solar, hydro, or biomass powered household micro-grid connection; control box at every
connection site has an embedded SIM card, transmitting data to a remote server
▪ The energy enterprise has a real-time data feed of network health and operation, with
granular insights on demand, consumption, breakage, etc. on a household level
▪ Technicians can remotely isolate singular households without disrupting the entire network
(e.g., shut off transmission to single hut experiencing faults until the issue is addressed or
physical technicians are dispatched)
▪ Dynamic load management – ability for the network to incent customers’ consumption
modulation through SMS alerts or remotely limit service notifications during times of peak
usage
▪ Customers are able to track their rate of energy usage; with a daily summary of Kwh
consumption and daily balance accrued
Overall value proposition
▪ The developer can maintain the health of
the distribution network and minimize
maintenance cost
▪ The supply of power in the system is
closely matched with demand, allowing
the modulation of household
consumption and enabling surge pricing
▪ The convenient payment of usage fees
enables the enterprise to recoup
operators expenses easily of OpEx, and
thus incents lending by the financial
institution
DF+ specific value proposition
▪ Enables the energy enterprise to have an
effective, low-cost lever of control
▪ Enables customers to have real-time
transparency into their energy
consumption
Potential extensions
▪ Monetization of user data: Energy consumption patterns and payment habits of users can be
analyzed to tailor credit and other financial products to customers, as well as forecast demand
for upgrading to higher levels of energy service
Financial
instrument
Digital platform for network
maintenance and regulation
Target
audience
Households in villages that
are connected to micro-grids
Product
provider
Energy enterprise + telcos +
bank
Product summary
▪ Digital grid maintenance and network regulation platform for micro-grids
powered by distributed generation sources (solar, hydro, biomass)
▪ Control box at each customer equipped with SIM card for 24/7 data feed
Addressed financial need
▪ High cost of staffing and deploying technicians for network maintenance
▪ Quality and consistency of energy consumption by households
▪ Absence of credit-building information on low-income households customers
6.1 ENERGY – POTENTIAL APPLICATIONS OF DF+ to ADDRESS BARRIERS

168
Energy appliance leasing bundled with utility service enabled
by mobile pre-payments (1/3)D
Value proposition Product details
Financial
instrument
Consumer electronic leasing service
bundled with digitally enabled utility service
Target
audience
BoP households in villages with enterprise
sales agent coverage
Product
provider
Venture-backed solar enterprise as primary
provider, with telco as payment enabler
Product summary
▪ Pre-paid solar energy and appliance leasing service for households,
facilitated by a mobile payment platform that enables incremental
payments
Addressed financial need
▪ Large block payments to own consumer electronics (e.g., radios,
TVs)
▪ Lengthy time and resource commitment to pay down and own solar
systems
Overall value proposition
• Customer access to consumer electronics
without high capital outlay
• Gives customers flexibility to upgrade
levels of service and expand the offering of
electronic appliances as they become
ready for them
• Incentives for high utilization of energy – no
scarcity mentality, encouraging customers
to consume the amount of energy required
for a good quality of life
DF+ specific value proposition
• Enables users to make convenient
incremental payments for electronics
ownership
• Facilitates communication, including for
maintenance help, between service
provider and customers
Potential extensions
• Overdraft feature: FI-sponsored small credit line for customers to gain access to additional services
without immediate charge
• Higher-end equipment: Partnerships to bundle other electronic equipment and services (e.g., Roku
streaming)
Core features
• A utility business model with packages including LED lights, electronic appliances, and mobile
phone charger; powered by long-lasting lithium batteries and efficient devices
• Leasing model: Customers never buy or finance the energy system – they pay for the services
provided
• Three levels of service: The highest level is 12V battery with television, Roku streaming, and DVD
player
• Potential to upgrade to higher levels of service at any time
• Pre-payment model: Customers pay a small installation fee upfront; weekly top-up of energy credit
based on usage levels allows purchasing of energy in small amounts
• Digital payment platform: Customers have unique reference tags and use cell phones to pay on a
weekly basis
• Call centers for customers to receive maintenance support and for sales agents to resolve
acquisition queries
6.1 ENERGY – POTENTIAL APPLICATIONS OF DF+ to ADDRESS BARRIERS

169
Energy appliance leasing bundled with utility service
enabled by mobile pre-payments (2/3)D Low
High
Feasibility
▪ Moderately feasible: Energy utility
leasing service has experienced
success, but bundling electronics
requires additional capital and
potentially complex partnerships with
electronic retailers
Potential impact
▪ Moderate impact: Only the highest end
segments of low-income households have a
demand for consumer appliance at this time;
impact on the quality of life is significant but
lower than initial impact of access to energy
Feasibility assessment: Business model Detailed impact
▪ Product bundling can
potentially introduce
modern appliances to
currently 50.000 –
100.000 owner of SHSs
▪ In the long-term over 4
million off-grid
households in Tanzania
could potentially benefit
from appliance leasing
Feasibility assessment: Enabling environment
Product financing
▪ Different financing models are possible
including
– a working capital financed lease
offering (requires significant working
capital depth of energy enterprise or
partner)
– or a consumer loan based purchase
model (requires financial institutions
willing to lend to low-income
households)
Telco regulation
▪ No known barriers
Government regulation
▪ Energy sector: All enterprises under
100,000 wH of capacity are essentially
unregulated
Enterprise financing
▪ A leasing service requires significant working capital depth to
finance the investment payback period of 1-3 years
▪ Equity financing of up to several million dollars is available
from venture funds and impact investors (e.g., SolarCity,
Vulcan Capital) for the most successful enterprises
▪ Commercial debt remains hard to raise in local debt markets,
with proven commercial viability of the business model access
to working capital loans should become easier
Distribution network
▪ Sourcing attractive customers through a well-structured and
effectively trained sales agent network is critical to “last mile”
reach and driving of scale ; existing energy enterprise
distribution networks can be leveraged
Maintenance support
▪ This lease model requires a high degree of customer support
with rapid troubleshooting of technical issues; electronic
equipment is likely to sustain damage from usage, exposure to
elements, etc. ; existing energy enterprise maintenance
networks can be leveraged
Electronic retailer partnerships
▪ Partnerships with importers/manufacturers of TV sets,
streaming media services, etc. are necessary and potentially
complex to negotiate
6.1 ENERGY – POTENTIAL APPLICATIONS OF DF+ to ADDRESS BARRIERS

170
Energy appliance leasing bundled with utility service enabled
by mobile pre-payments (3/3)D
Case examplesGo-to-market model
• The energy enterprise
establishes a partnership
with a consumer electronic
retailer for direct current
appliances (e.g. low energy
TV, fridge etc.)
• The enterprise offers a
bundled product, combining
its high-end solar home
system with a electronics
lease
• The customer pays for
energy and makes a
substantial down payment on
electronics at the time of
installation
• The customer pays for utility
service and electronics lease
concurrently
Off-grid Electric (M-Power)
• Solar leasing company with 10,000 customers
• Financed through a combination of private
investor equity and development institution
grant
• Has built a strong network of distributors and
plans to drive scale through proven customer
acquisition model
• Planning a new, high-end offering by bundling
consumer electronics like the Roku streaming
service and a TV set with their high-end solar
home system
6.1 ENERGY – POTENTIAL APPLICATIONS OF DF+ to ADDRESS BARRIERS

171
Short-term enterprise-sponsored overdraft facility for SHS
customers (1/3) E
Value proposition Product details
Financial
instrument
Short-term overdraft facility
Target
audience
SHS customers with seasonal income
variations (e.g., farmers)
Product
provider
Solar energy enterprise
Product summary
▪ Automated overdraft facility to provide short-term loan and
usage payment relief for SHS-owning households with volatile
cash flows
Addressed financial need
▪ Cash flow volatility of low-income households
▪ Smoothing of household consumption curve
Overall value proposition
• Allows households to continue
enjoying energy service even in times
of cash flow variability
• Enables the energy enterprise to build
customer loyalty
• Reduces the enterprise/bank’s
transaction cost of pursuing/attempting
to settle arrears
DF+ specific value proposition
• Enables automated approval of
overdraft eligibility and disbursal
• Enables remote disconnection of
service if the negative balance exceeds
a pre-defined temporal limit
Potential extensions
• Link to savings: A portion of the overdrawn balance can be withdrawn from the user’s
mobile savings account
Core features
• An energy enterprise-sponsored overdraft facility for customers with bank-financed solar
household systems
• Eligible customers are allowed to miss scheduled principal and usage payments over a
short-term period (e.g., 1-2 months) based on their income flow
• Eligibility is established once the user has built a track record of successful payments
over a medium term (~6-8 months)
• The energy enterprise finances the facility from working capital – once the customer
misses a payment, the enterprise will make the portion of payment owed to financial
institution for capital financing good, and it will temporarily absorb the usage fee portion of
payment
• At the end of the specified period, the customer pays back the value of arrear with an
additional interest charge
6.1 ENERGY – POTENTIAL APPLICATIONS OF DF+ to ADDRESS BARRIERS

172
Short-term enterprise-sponsored overdraft facility for SHS
customers (2/3)E Low
High
Feasibility
▪ Moderately feasible: The
relatively small amounts involved
don’t impose high balance-sheet
risk on enterprises; but cash flow
forecasting and government
regulation could be challenging
Potential impact
▪ Moderate impact: May allow wider
base of consumers to be more willing
to adopt SHS, but for customers who
are already connected to DF+ enabled
systems, payment default is not a
significant issue
Feasibility assessment: Business model Detailed impact
▪ 5% of current users
are reported to make
late payments;
however, more users
may become first-
time customers of
the enterprise with
the knowledge of
flexibility afforded by
the overdraft feature
Feasibility assessment: Enabling
environment
Financial infrastructure
▪ Traditional financial institution do not
currently offer liquidity facilities to
low –income households
▪ With the introduction of M-Pawa the
first universally available liquidity
product exist, other players might
follow
Telco infrastructure
▪ No known barriers
Government regulation
▪ Energy enterprises may not be able
to charge interest on overdraft as
they are not officially licensed as
lending institutions
Overdraft financing
▪ Different financing models are possible:
– A working capital-financed overdraft facility
(requires significant working capital depth of
energy enterprise)
– A bank partnership providing the overdraft facility
administered by the energy enterprise (requires
financial institutions willing to lend to low-income
households)
Risk management
▪ Significant difficulties exist in predicting the cash flows
and credit worthiness of income groups like farmers;
established payment history and ability to remotely
turn-off the device can serves as effective risk
management tools
6.1 ENERGY – POTENTIAL APPLICATIONS OF DF+ to ADDRESS BARRIERS

173
Short-term enterprise-sponsored overdraft facility for SHS
customers (3/3)E
Case examplesGo-to-market model
• The solar enterprise the
segment of customers with
variable income streams
• The enterprise defines a
probationary period to
determine the long-term
viability of defined customers
• The enterprise introduces a
mobile feature for a pre-
cleared overdraft limit with
easy activation in times of
need
• The energy enterprise forms
a partnership with a financial
institution to provide over
draft facility
• Regular SMS reminders at
time of full repayment
No known models
6.1 ENERGY – POTENTIAL APPLICATIONS OF DF+ to ADDRESS BARRIERS

174
Potential DF+ applications in energy can be categorized based on
their feasibility and potential impact
DF+ solutions have different impacts Key takeaways
Imp
act
High
Medium
Low
Low Medium High
Feasibility
• The off-grid energy space in Tanzania is beginning to witness
several innovative players
• Companies provide solutions that focus on mobile energy
generators for individual devices, household-based generation
systems for multi-purpose usage as well as mini- and micro-
grid services with solar, biomass, and hydro distributed
generation
• Further opportunities exist in providing services, such as
distribution, salesforce management and maintenance, for the
solar energy enterprises
• Many of the innovations integrate mobile technology and end-
consumer financing as fundamental enablers of their business
models (e.g., Off-Grid Energy, Mobisol)
• Although the innovative players have enjoyed success on
relatively localized levels, scaling to regional and national levels
has been a challenge given limited capital, weak distribution,
and lack of customer awareness
• To spur further innovation and scaling, the focus of enabling
stakeholders should be on providing debt and equity financing
to promising enterprises, creating awareness of off-grid
solutions in rural areas, educating the financial sector, and
providing financing to households
• Digital payment
enabled
consumer
financing for SHS
• Remote micro-
grid admin. and
regulation
• Short-term
overdraft facility
for SHS
customers
• Energy appliance
leasing bundled
with utility service
• Unsecured
digital
consumer bank
loan for SHS
6.2 ENERGY – VIABILITY OF OBSERVED AND POTENTIAL BUSINESS MODELS
AB
C
D
E

175
▪ 85% of the country is covered by a 2G network, with some concern
about the quality of service in the most rural areas
▪ High penetration, at ~60% of households, with some concern about
the ownership of handsets and proficient usage by poorest
households
▪ Lending to consumers and enterprises by banks and MFIs is minimal.
Robust equity financing for enterprises by VC actors and other
investors
▪ Several innovative energy enterprises are using DF+ to deploy
different financing solutions to consumers
▪ Highly conducive – existing solar enterprises are almost entirely
unregulated given their capacity is less than 100kw capacity
▪ The government is involved through two agencies n/a EWURA
regulates and REA facilitates – both are conducive to off-grid energy
development
▪ Little complexity – primary actors are energy enterprises and
households with demand for electricity access
▪ Moderate – a poor rural infrastructure inhibiting “last mile” reach and
lack of consumer knowledge of off-grid benefits are most notable
▪ Somewhat deep – almost all energy enterprises provide financing
support to consumers, but their own access to working capital is
limiting
▪ Highly applicable – allows enterprises to cut transaction costs,
enhance contract enforcement, and provide additional services
▪ Successful enterprises have identified winning technologies, built low-
cost, effective distribution networks, and established a loyal base of
customers
▪ Currently, SHS reach is 50,000-100,000 households. “True scale” of
1million + will be reached with the introduction of commercial lending,
consumer education and the expansion of distribution networks
DF+ implementation in the energy sector faces varying levels of
constraints
6.2 ENERGY – VIABILITY OF OBSERVED AND POTENTIAL BUSINESS MODELS
Sector readiness dimension
Sector-rele-
vant mobile
infrastructure
reach and
adoption
Readiness of
financial and
digital
financial
infrastructure
65
4 32
1
65
4 32
1
Role of
government
and
regulation
6
54 3
2
1
Severity of
sector
challenges
65
4 32
1
Financial gap
in sector
65
4 32
1
DF+ business
models and
scaling
65
4 32
1
Reach
Reach of mobile
infrastructure
Adoption of mobile
technology
Financial product
offering to sector
Availability of
DF+ solutions
Sector-specific
regulation
Role of
government
Stakeholder
complexity
Non-financial chal-
lenges in sector
Execution and
scalling ability
Depth of financial
gap
Availability of DF+
business models
Sub-dimensions
Applicability of
DF+ solutions
1
Binding constraint Readiness for scaling
2 3 54 Explanation

176
In the Energy sector DF+ is enabling the application of successful busi-
ness models; full commercial viability and scaling are challenging
Discovery
Piloting
Scale
Application
Expansion and
differentiation
Global scaling
DF+ business
model maturity
DF+ business
model in ideation
or early develop-
ment stage
Individual DF+
business models
are being piloted
in controlled
environments
DF+ business
models are rolled
out under market
conditions
Existing DF+
business models
are being
innovated and
differentiated
Successful DF+
business models
are scaling
nationally
Energy
Best practice
sharing
Business plan
development
activities
Financial and
technical advice
during piloting
phase
Business and
implementation
support
Growth financing
and innovation
support
Growth financing
• Several innovative players have demonstrated successful application of innovative financing and off-grid energy solutions
• Most solutions are solar-based household generation systems or communal mini-grids that power a range of devices
• Mobile-enabled consumer financing options include pay-as-you-go, lease-to-own, and direct lending, among others
• Scaling and full commercial viability of innovative financing-enabled enterprises is challenging given the high risk-bearing
burden by non-financial actors, insufficient reach of distribution networks, and lack of consumer awareness
6.3 ENERGY – SCALING AND EXECUTION CAPABILITIES PRELIMINARY
Inte
rve
nti
on

177
Agenda
Sector analysis – energy
Sector analysis – education
Sector analysis and challenge identification
Assessment of financial service needs and gap analysis
Digital finance plus feasibility assessment
Sector analysis – health
Sector analysis – agriculture
Readiness framework
Access to and reach of mobile infrastructure
Adoption and reach of digital payment infrastructure
Role of the government and regulation
Sector analysis – water

178
Key takeaways – Education sector analysis and challenge
identification
• Low-income households must spend a higher proportion of their income on education expenses
• Parents are not always able to afford the school fees; where education is free, they are unable to afford the cost of books, uniform,
and food for their children
• As a result, educational outcomes are generally better for students from higher income sections of the population
• The majority of schools (~95%) in Tanzania are public schools
• The Ministry of Education and Vocational Training sets education policies and monitors adherence to rules and regulations
• Funding in the education system is provided by the government, donor organizations and households
• Household spending on education is on hidden costs such as uniforms and equipment as well as other expenses like extra classes
to supplement poor instruction in schools
• Across the delivery chain, major challenges are seen in the quality of instruction provided in schools that is driven by low morale
among teachers
• Teacher absenteeism reduces the effective learning time for students and disproportionately affects low-income students
• Teachers lack adequate training and resources to provide effective instruction; additionally, their per diems often go unpaid
• The major push on enrollment has also led to high pupil-teacher ratios, especially in primary schools
• Low-income parents struggle to make lump sum fee payments at the beginning of the term, leading to more missed days among
poorer students
4.2 Sector impact on low income households
4.3 Sector-specific players and regulation
4.4 Sector challenges
4.1 Sector description
• Education has been a top priority for the government of Tanzania, with a focus on enrollment in primary schools
• Both enrollment and quality remain challenges in secondary schools
• Although enrollment has steadily increased in primary schools, the quality of instruction still needs to be improved as evidenced by
decreasing pass rates in national exams
• Tanzania lags many other Sub-Saharan African countries on key metrics such as Gross Enrollment Rate and Pupil-Teacher Ratio
EDUCATION – SECTOR ANALYSIS AND CHALLENGE IDENTIFICATION

179
Second-
ary
1
10
8
8
0
2
20
Primary
8
8
0
Second-
ary
Primary
Education has been a top priority for Tanzania over the past
10 years resulting in significant improvements in enrollment
PublicPrivate
41
16
16
1
5
31
Primary
16
15
0
Second-
ary
4
Primary Second-
ary
37
92
24
97
Primary Second-
ary
Second-
ary
Primary
11
55
7
53
Second-
ary
Primary Primary Second-
ary
PublicPrivate
SOURCE: Tanzania Ministry of Education and Vocational Training, 2012; team analysis
No. of students
Millions
No. of schools
Thousands
Key takeawaysKey metricsPrimary education
Secondary education
Net enrollment rate1
%
Net completion rate2
%
1 Total number of pupils of official grade age who are enrolled at that level, as a percentage of corresponding school-age population
2 Number of pupils/students enrolled in a final grade of a given level of education expressed as a percentage of school-age population of that grade
• Enrollment has been
particularly strong in
primary education as
the government
endeavored to reach
the MDG of universal
primary education
• Going forward, the
focus should be on
improving enrollment
rates in secondary
schools by addressing
challenges faced in
financing
• Despite the positive
enrollment trajectory, a
similar improvement is
yet to be seen in the
quality of teaching and
the level of skills
acquired by students at
both the primary and
the secondary levels
• 7 years of education covering ages
7-14 years
• Primary education is compulsory
and tuition free with additional
costs shared between the
government and parents
• Swahili is the main language of
instruction
• On completion of primary school,
students take the Primary School
Leaving Examination (PSLE)
• Composed of 2 levels: Ordinary
secondary for 4 years and
advanced secondary for 2 years
• Enrollments are significantly lower
in the advanced level
• An option also exists for 2-year
vocational education post-primary
• Secondary education is not
compulsory and is tuition-based
• English is the language of
instruction
• On completion, students take the
Certification of Secondary
Education Examination (CSEE) 2008 2012
2008 2012 2010 2012
2010 2012
4.1 EDUCATION – SECTOR DESCRIPTION

180
Key takeawaysGross enrollment rate1 Pupil-teacher ratio Enrollment and pass rate
Primary, %
Secondary, %
Primary, %
Secondary, %
However, Tanzania still lags many other Sub-Saharan African
countries on key metrics
7.6
7.8
8.0
8.2
8.4
8.6
0
20
40
60
80
100
PrimaryenrollmentMillions
PSLE2 pass ratePercent
2011100908072006
PSLE/CSEE pass rateEnrollment
0
0.5
1.0
1.5
2.0
0
20
40
60
80
100
SecondaryenrollmentMillions
CSEE3 pass ratePercent
2011100908072006
SOURCE: BEST 2012; BEST 2010; World Bank databank; team analysis
84
85
93
Senegal
Nigeria
Tanzania
SSA avg. 100
Uganda 110
Ghana 110
Rwanda 134
32
35
41
44
45
58
Rwanda
Tanzania
Senegal
Nigeria
SSA avg.
Ghana
32
32
38
46
47
48
54
59
Senegal
Ghana
Nigeria
Tanzania
Kenya
Uganda
Ethiopia
Rwanda
18
23
26
27
30
33
40
Ghana
Rwanda
Tanzania
Senegal
Kenya
Nigeria
Ethiopia
1 Total enrollment regardless of age as a percentage of the total population of students in the eligible age range; can exceed 100% because of the
inclusion of over- and under-age students in each grade
2 Primary School Leaving Examination; 3 Certification of Secondary Education Examination
• The drive to increase
enrollment has driven the pupil-
teacher ratio upwards,
especially in primary schools
• There has also been an
accompanying decrease in
pass rates for students in
national examinations
• The increased number of
students has grown ahead of
the capacity of a system in
which there has been limited
additional investment on the
supply side
• Future interventions should aim
to improve learning outcomes
by tackling the challenges
related to both student and
teacher absenteeism
4.1 EDUCATION – SECTOR DESCRIPTION

181
Total enrollment in teachers colleges by education levelPass rates in Teachers colleges
examinations (ATCE and DSEE)
Diploma Grade A
Key takeaways
25.6
12.4
4.2
1.1 0.10
11
7.1
0.30.8
0
13.7
0
21.9
2008 2012
43.3
0
37.7
24.0
11.6
1.60.5 0
10
36.6
18.4
14.7
3.1
0.5
0
09
35.4
23.9
9.3
2.2
Certificate (Pre-Service)
Diploma Pre-Service
Grade A
Diploma In-Service
Certificate Special Education
In-Service Grade B/C - A76
67
70
90
98
2011
10
09
08
2007
98
95
98
98
98
SOURCE: BEST 2012; team analysis
Enrollment in Teachers Colleges has increased in the Past 5 years;
however examinations’ pass rates have decreased
• Similar challenges in
enrollment and
outcomes are seen in
teacher training
• Although enrollment
has risen, pass rates
in teachers colleges
have decreased,
contributing to the
high pupil-teacher
ratios
• Additionally, the
teaching profession
is not given much
respect in Tanzanian
society, leading to
low morale
4.1 EDUCATION – SECTOR DESCRIPTION

182
Additionally, high teacher absenteeism rates reduce effective
learning time for children
ObservedScheduled
05:12
-58%
02:11
100
Norm
+89%
189
Effective
SOURCE: World Bank Service Delivery Indicator Survey; team analysis
Learning time for
children per day
Hours:minutes
Teacher absence rate
Percent
53
23
From
classroom
From
school
Implied cost effect on teacher
s’ salaries
Index
Key takeaways
• One of the key
challenges to the
quality of education is
teacher absenteeism
• Even when teachers
are present, they may
provide sub-par
instruction during
official school hours
to drive demand for
the extra classes that
they privately offer
• As a result, poor
students are
disproportionately
affected as they are
unable to afford these
extra classesBased on survey results,
derived from
unannounced visits to the
schools, 23% of teachers
are not in school and 53%
are not in the classroom
The teacher absenteeism
data and classroom
observations suggest that
the effective learning time
for children is less than
half of the scheduled time
The effective learning time
suggests that Tanzania’s
effective cost of teachers is
89% higher than the salary
paid because of teacher
absenteeism
4.1 EDUCATION – SECTOR DESCRIPTION

183
The Tanzanian government has invested heavily in education
in recent years
Education
spend
USD billion2
Education
spend
as a percent-
age of GDP
%
Education
spend
per capita
USD
+15% p.a.
1.51.31.21.10.8
21.72.1
1.1
Tanzania Benchmarks, 2011
5.86.36.25.85.3
+3% p.a.
6.06.74.4
3531302822
10092008 11
+12% p.a.
2012
5359
435
SSA
avg
Kenya South
Africa
1 Government spend includes some ODA, which is provided as budget support; this overlap is not reflected
2 Conversion rates used for USD/TZS: 1.304 before 2009; 1.420 for 2010; 1.563 for 2011; and 1.562 for 2012
SOURCE: BEST 2012; World Bank, DFID; team analysis
71
24
Official
development
assistance (ODA)
5
Government1
Household
Estimated distribution of
education spend, 2012
%
Key takeaways
• Government spend
accounts for the
largest share of
spend in education
• Education spend per
capita still lags other
comparator countries
in Africa
• Despite the fact that
primary education is
free, private
expenditure on
education is
equivalent to ~32%
of public spending
• Additionally, the
distribution of public
resources is
unequal, with the
10% most educated
students benefiting
from 47% of public
education resources
4.1 EDUCATION – SECTOR DESCRIPTION

184
Food at school
0.07
0.23School fees
School uniform, equipment, books
0.01
Other in kind expenses 0.03
Other expenses (extra classes/tuition) 0.02
Hhold
Govt.2
ODA
71
24
5
A high proportion of education spend is still borne by private
households
Distribution of education
spend, 2012
%
Key takeawaysHousehold expenditure
Household education expenses per capita per 28 days
USD1
SOURCE: International Growth Centre working paper, November 2010
1 Government spend includes some ODA, which is provided as budget support; this overlap is not reflected
2 Exchange rate used is $1 to 1,650TShs
• Even where tuition is
free, parents are
responsible for
additional expenses
such as books,
uniforms,
transportation to
school, and food
• Few primary schools
provide feeding
programs, so poor
students are often
undernourished and
unable to focus
4.1 EDUCATION – SECTOR DESCRIPTION

185
StudentCurriculum
developmentTeacher training
Learning facility
Labor InfrastructureBuild desire to accessAbility to access
Overview of the education delivery chain in Tanzania
Key
players
Supply Demand
• Ministry of Education
and Vocation Training
leads policy formation,
quality control and
assessment, standard
setting, etc.
• Curriculum
development is done
by the Department of
Curriculum and
Examination
• Local government
authorities are
responsible for the
management and
delivery of education
services in their areas
• School Inspectorate
ensures adherence
of schools to policies
and regulations
• Ministry of Education
and Vocation Training
• NGOs that monitor
teacher performance
• The management of
each school is done
by the head teacher
or Principal
• Government/NGOs
• Private actors and
households
• Transport companies
• Food providers
• School supply
companies
• Textbook companies
• Uniform makers
• Government/NGOs
• Parents
• Employers
• Schools recruiting
students
• Teacher colleges
• Teaching higher
education institutions
1 2 3 4 5
• Primary curriculum is
composed of 12
subjects; secondary of
7 subjects
• Teachers are
evaluated by head
teachers on a daily
basis, with an annual
evaluation for
promotion
• Inspectors are
expected to visit
schools regularly
• A teacher’s workload
averages 24 periods
of 40 minutes each
per week
• In 2012, there were
181,000 primary
teachers and 65,000
secondary teachers
• Teachers are paid
according to fixed
scales, with an allow-
ance for housing
• ~95% of schools are
public, where the
government is
responsible for
maintaining and
improving
infrastructure
• Private schools are
often better
equipped, but they
are more expensive
• Especially in
government schools,
parents often make
in-kind contributions
to supplement
government
spending
• A major barrier to
attendance is the
lack of a school
nearby
• 22% of children in
rural areas live over
5 km away from the
nearest school
• Retaining poor
students in primary
schools and
transitioning them to
secondary schools is
difficult given the
increased expense
and lower number of
secondary schools
• Students’ desire to
attend school is driven
by their perception of
the benefits – i.e.,
ability to get a job after
school
• Teacher training
ranges from
2-7 years post-
secondary school
Descrip-
tion
4.3 EDUCATION – SECTOR-SPECIFIC PLAYERS AND REGULATION

186
Potential problems across the education value chain
▪ Difficult to recruit
and retain
teachers as
teaching is not a
well-respected
career choice
2.1
▪ Difficult to
provide follow-on
instruction for
teachers to
ensure
continued high-
quality instruction
2.2
▪ Teachers may
find hour-by-hour
curriculums most
helpful but often
are not trained in
how to use them
1.1
▪ Poor
communication
between parents
and teachers on
student
performance
3.2
▪ Standardized
tests are poorly
administered
and may not test
the most critical
skills
3.3
▪ Teachers’ per
diems claims
often go unpaid
for long periods
3.4
▪ Lack of sufficient
head teacher
training given
financial
constraints
3.5
▪ Low morale
among public
school teachers
leading to high
levels of
absenteeism
3.1 ▪ Difficult for
schools to
project
enrollment and
plan accordingly
3.6
▪ Some schools
lack the basic
infrastructure
and resources,
such as
chalkboards and
lavatories, that
help create a
conducive
learning
environment
3.7
▪ A shortage of
teacher housing
at both the
primary and the
secondary levels
also contributes
to teacher
absenteeism
and low morale
3.8
▪ Lump-sum
payments
required at the
beginning of the
term for private
and secondary
schools
4.1 ▪ Students lack
effective
motivation and
commitment to
education
5.1
▪ Prohibitive text
book costs;
logistical
challenges
inherent in
delivering books
to remote areas
also limits
availability
4.2
▪ Inadequate
employment
opportunities for
first-time job
seekers
5.2
▪ Difficult for
government and
donors to track
attendance
4.4
▪ Low-income
students face
additional hurdles
such as distance
traveled to school
and lack of food
4.5
▪ Parents lack
insights into
students’
performance
making it difficult
to oversee their
education
5.3
▪ A lack of an
effective delivery
mechanism of
donor subsidies
to students
4.3
StudentCurriculum
developmentTeacher training
Learning facility
Labor Infrastructure
Build desire
to accessAbility to access
Challen-
ges in
Edu-
cation
Supply Demand
1 2 3 4 5
4.4 EDUCATION – SECTOR CHALLENGES

187
Agenda
Sector analysis – education
Sector analysis and challenge identification
Assessment of financial service needs and gap analysis
Digital finance plus feasibility assessment
Readiness framework
Access to and reach of mobile infrastructure
Adoption and reach of digital payment infrastructure
Role of the government and regulation
Sector analysis – water
Sector analysis – energy
Sector analysis – health
Sector analysis – agriculture

188
Key takeaways – Education sector assessment of financial
service needs and gap analysis
5.2 Financial and information gap analysis along the value chain
• There is a lack of formal lending products that help parents manage the stress on their finances from making lump-
sum payments and meeting the many hidden costs of education
• Parents must therefore turn to friends and family to manage this lack of liquidity, which can often be unreliable
• Low morale and performance among teachers can also be addressed by providing financial products that
encourage the desired behaviors
5.3 Barriers to provision of financial products
• Financial institutions are not providing helpful financial products for education because these are low margin
products that are unattractive given the high collection costs
• Additionally, customers who would most benefit from these products are often in remote areas that are difficult to
service
• Donors usually give to the government rather than directly to the beneficiaries because there is a lack of systems to
target specific segments and ensure that funds are used for the intended purpose
5.1 Financial service needs along the value chain
• Various financial service needs exist across the education value chain affecting the students’ ability to obtain the full
benefit of their education
• Chief among these are an inability to make the lump-sum payments required at the beginning of each term
• Additionally, even when tuition is free, parents face many hidden costs in the form of textbooks, uniforms, extra
classes, and in-kind contributions to their children’s education
EDUCATION – ASSESSMENT OF FINANCIAL SERVICE NEEDS AND GAP ANALYSIS

189
Potential solutions to finance and information
challenges in the delivery chain
▪ Continued training
for teachers
through interactive
e-learning
modules, daily
teaching tips, and
forums to share
experiences
2.1
▪ Monetary teacher
of the month
awards published
digitally and
shared with entire
community
3.1
▪ SMS-based
communication
system between
teachers and
parents to track
student
attendance and
performance
3.2
▪ Digital claims and
payment system
for per diems
3.4
▪ A pay-for-
performance
digital bonus
scheme based on
test scores and
teacher
attendance
3.1 ▪ Pay-as-you-go
daily/weekly
payments for
school as opposed
to lump-sum fees
paid via mobile
4.1 ▪ Reward students
to do well on
tests – (e.g.,
mobile games, job
opportunity
postings unlocked
by performance
on exams)
5.1
▪ Mobile textbook/
learning material
rental or purchase
4.2
▪ E-learning
modules to lower
number of days
required to be
physically present
4.5
▪ Digital cash
transfer accounts
that can only be
redeemed for
specific services -
e.g., school
feeding program,
transportation –
with text message
code
4.3
StudentCurriculum
developmentTeacher training
Learning facility
Labor InfrastructureBuild desire to accessAbility to access
Financial
service
needs
/gaps
Supply Demand
1 2 3 4 5
▪ Purpose-tied
education savings
product
4.1
5.1 EDUCATION – FINANCIAL SERVICE NEEDS

190
Agenda
Sector analysis – energy
Sector analysis – education
Sector analysis and challenge identification
Assessment of financial service needs and gap analysis
Digital finance plus solution feasibility
Sector analysis – health
Sector analysis – agriculture
Readiness framework
Access to and reach of mobile infrastructure
Adoption and reach of digital finance infrastructure
Role of the government and regulation
Sector analysis – water

191
Key Takeaways
6.2 Viability of observed and potential business models
• With the majority of identified products and business models in the pilot phase, their viability is yet to be seen
• However, some of the major challenges to implementation include educating consumers on how the products work and ensuring
that schools, parents, and teachers have the requisite equipment to access the product
• Additionally, several of these products have the potential for fraud; as such, it will be critical to implement appropriate checks and
balances and refine the business models over time
6.3 Scaling and execution capabilities
• Major scaling barriers in Tanzania are due to the large role the government has in the education systems and the lack of
understanding of financial products among low-income consumers
• To scale many of these products, entrepreneurs and donors will have to work with the Ministry of Education and Vocational
Training, which is already spread thin with its current responsibilities
• Given the lack of financial products for low-income consumers, a high-touch approach will be required to educate parents and
schools on the products’ usage
6.1 Potential applications of DF+ to address barriers
• Applications of DF+ to addressing challenges in education are mostly in the discovery and piloting phase in Tanzania
• These pilots are using DF+ to incentivize desired behaviors in teachers and to help parents manage the burden of educational
expenses
• We have identified 5 DF+ products that have the potential to address the major financial and informational gaps in the value chain
– DF+ can enable a pay-for-performance product that ties a portion of the teachers’ salaries to their performance as evidenced
by attendance and student exam results
– A pay-as-you-learn product enables parents to make smaller weekly/monthly payments on school fees using mobile money
– A purpose-tied savings product will provide a forcing mechanism to help parents make longer-term plans for educational
expenses
– Digital text book rental, enabled by 3G, allows students to rent or purchase portions of textbooks and other learning materials
when they need them
– DF+ can facilitate the administration of conditional cash transfers for use on educational expenses
EDUCATION - DIGITAL FINANCE+ SOLUTION FEASIBILITY

192
DF+ can be used to varying extents to address the challenges
in the education delivery chain (1/2)
Supply
2.2
3.1
3.3
3.5
3.6
3.8
Curriculum development
Teacher training
Labor
Infrastructure
3.7
3.4
2.1
3.2
1.1 Teachers may find hour-by-hour curriculums most helpful but often
are not trained in how to use them
Difficult to provide follow-on instruction for teachers to ensure
continued high-quality instruction
Low morale among public school teachers leading to high levels of
absenteeism
Standardized tests are poorly administered and may not test the
most critical skills
Lack of sufficient head teacher training given financial constraints
Difficult for schools to project enrollment and plan accordingly
A shortage of teacher housing at both the primary and the
secondary levels also contributes to teacher absenteeism and low
morale
Some schools lack the basic infrastructure and resources, such as
chalkboards and lavatories, that help to create a conducive
learning environment
Teacher per diem claims often go unpaid for long periods
Difficult to recruit and retain teachers since teaching is not a well-
respected career choice
Poor communication between parents and teachers on student
performance
6.1 POTENTIAL APPLICATIONS OF DF+ TO ADDRESS BARRIERS
DF+ solution
Add-on to core
DF+ solution)(High Low
Product
evaluation
Finance
as barrier
DF+
potential
No other
barriers
Assessment of applicability of DF+ solution

193
DF+ can be used to varying extents to address the challenges
in the education delivery chain (2/2)
Demand
4.1
4.3
4.4
5.1
5.3
Ability to access
Build desire to access 5.2
4.2
4.5
Lump-sum payments required at the beginning of the term for
private and secondary schools
A lack of an effective delivery mechanism of donor subsidies to
students
Difficult for government and donors to track attendance
Students lack effective motivation and commitment to education
Parents lack insights into their students’ performance making it
difficult to oversee their education
Inadequate employment opportunities for first-time job seekers
Prohibitive text book costs; logistical challenges inherent in
delivering books to remote areas also limits availability
Low-income students face additional hurdles such as distance
traveled to school and lack of food
6.1 POTENTIAL APPLICATIONS OF DF+ TO ADDRESS BARRIERS
DF+ solution
Add-on to core
DF+ solution)(High Low
Product
evaluation
Finance
as barrier
DF+
potential
No other
barriers
Assessment of applicability of DF+ solution

194
Top implementation challengesDescriptionDF+ product
• A pay-for-
performance
digital bonus
scheme based
on test scores
and teacher
attendance
1. Education
2. Operational implementation
3. Financing
• Salary payments tied to
individual teacher and school-
level performance
• Pay-as-you-go
daily/weekly
payments for
school as
opposed to
lump-sum fees
paid via mobile
1. Education
2. Operational implementation
3. Financing
• Time-bound, purpose-tied, DF+
enabled savings product
• Purpose-tied
education
savings product
1. Logistics
2. Pricing
3. Financing
4. Operations
• Short-term rental of physical or
digital textbooks
• Mobile textbook
/learning
material rental
or purchase
Addressed education sector
challenge
A
B
C
D
• Digital cash
transfer
accounts that
can only be
redeemed for
specific services
E
• Pay-as-you-go school fee
payment plan
• Purpose-tied cash transfer to
parents that can only be used on
certain educational expenses
▪ Public school teachers feel
unappreciated and are often
unmotivated and may miss
classes
3.1
▪ Lump-sum payments required
at the beginning of the term for
private and secondary schools
4.1
▪ Textbooks are often expensive
and the logistics of getting
books to schools are
complicated
4.2
▪ Donors want to transfer funds
for families to pay expenses
but they lack certainty that the
funds will be used as intended
4.3
▪ Lump-sum payments required
at the beginning of the term for
private and secondary schools
4.11. Infrastructure requirements
2. Operational implementation
3. Desirability
4. Financing
1. Education
2. Provider network
3. Financing
PRELIMINARY
Based on the analysis of the current state and barriers to scale,
we suggest 5 DF+ applications for your further consideration
6.1 POTENTIAL APPLICATIONS OF DF+ TO ADDRESS BARRIERS
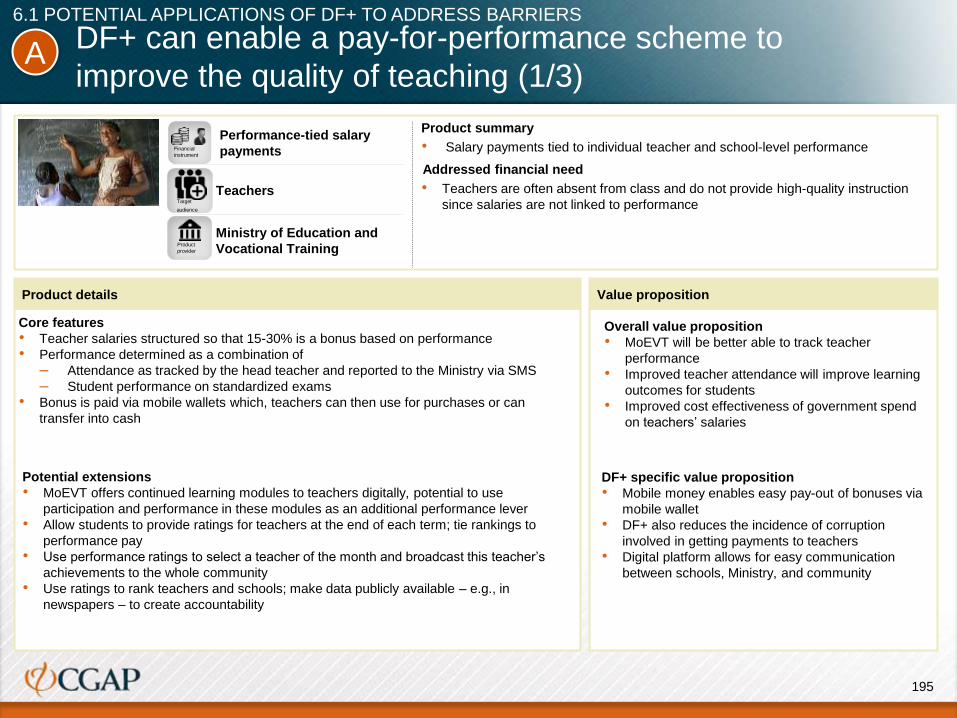
195
DF+ can enable a pay-for-performance scheme to
improve the quality of teaching (1/3)
Performance-tied salary
payments
Teachers
Financial
instrument
Product
provider
Target
audience
Ministry of Education and
Vocational Training
Product details Value proposition
Overall value proposition
• MoEVT will be better able to track teacher
performance
• Improved teacher attendance will improve learning
outcomes for students
• Improved cost effectiveness of government spend
on teachers’ salaries
DF+ specific value proposition
• Mobile money enables easy pay-out of bonuses via
mobile wallet
• DF+ also reduces the incidence of corruption
involved in getting payments to teachers
• Digital platform allows for easy communication
between schools, Ministry, and community
Potential extensions
• MoEVT offers continued learning modules to teachers digitally, potential to use
participation and performance in these modules as an additional performance lever
• Allow students to provide ratings for teachers at the end of each term; tie rankings to
performance pay
• Use performance ratings to select a teacher of the month and broadcast this teacher’s
achievements to the whole community
• Use ratings to rank teachers and schools; make data publicly available – e.g., in
newspapers – to create accountability
Core features
• Teacher salaries structured so that 15-30% is a bonus based on performance
• Performance determined as a combination of
– Attendance as tracked by the head teacher and reported to the Ministry via SMS
– Student performance on standardized exams
• Bonus is paid via mobile wallets which, teachers can then use for purchases or can
transfer into cash
Product summary
• Salary payments tied to individual teacher and school-level performance
Addressed financial need
• Teachers are often absent from class and do not provide high-quality instruction
since salaries are not linked to performance
A
6.1 POTENTIAL APPLICATIONS OF DF+ TO ADDRESS BARRIERS

196
DF+ can enable a pay-for-performance scheme to
improve the quality of teaching (2/3)
Feasibility assessment: operating model Impact assessment
Reach
• The product will be rolled out to all schools
• ~200,000 teachers across the country
• Likely to be more effective in public schools, which
make up 95% of schools
Impact on the problem
• Targeted reduction in teacher absenteeism from
20% to 15%
• May not directly translate to improvements in the
quality of teaching
Education
• All teachers and school administrators will have to
be trained on how the system works and on the
usage of mobile money accounts. May be difficult
to do remotely
Operational implementation
• May be difficult to reach areas with poor or no
mobile phone coverage
Financing
• Major investment costs will be developing the
platform and providing mobile devices to schools
that lack them. Donor funding can be used to
cover some of these costs
• Government spend on salary will remain the same
or be lower depending on teacher performance
Feasibility
• Financially feasible product
• Majority of challenges will be
involved in educating teachers
about the new payment structure
and ensuring that the process
remains simple
Potential impact
• Intervention is scalable if all
teachers and administrators have
mobile hardware. Following pilot
programs, the program can be
rolled out to all schools
Low High
A
6.1 POTENTIAL APPLICATIONS OF DF+ TO ADDRESS BARRIERS

197
DF+ can enable a pay-for-performance scheme to
improve the quality of teaching (3/3)
Case examplesGo-to-market model
CU@School project was piloted in Uganda by SNV
Netherlands Development Organization
• The project uses mobile phones to monitor teacher
and student attendance in 100 primary schools
• At the end of each week, head teachers upload
attendance data onto a pre-loaded form on their
phones and send it to district officials
• The data are also made publicly available via radio
and newsprint
• The software is developed by Makerere University
using open source software, which enables the
forms to be sent via GPRS instead of SMS at cost
of $1 per 2,000 messages
• Impact: TBD
• Development of simple
attendance reporting platform
for head teachers
• Simple transparent formula for
calculating pay
• Head teachers and inspectors
will have to be provided with a
compatible phone if they do not
already own one
• Communication of new
compensation structure to
schools and teachers
• All teachers will need to have
mobile wallets to receive
payments
• Third-party audits of head
teacher reports to avoid fraud
A
6.1 POTENTIAL APPLICATIONS OF DF+ TO ADDRESS BARRIERS

198
Pay-as-you-go fees will enable parents to better manage
their finances and maximize student attendance (1/3)
Parents with students in
private and secondary schools
Installment payment of school
feesFinancial
instrument
Product
provider
Target
audience
Partnership: Schools and
financial institutions
Product summary
• Pay-as-you-go school fee payment plan
Addressed financial need
• For secondary and private primary schools, fees must be paid in
a lump sum at the beginning of each term; students cannot attend
classes until payment is received in full
Product details Value proposition
Core features
• Parents make weekly payments from mobile wallets directly to schools
• Students are then allowed to attend for that week or until the next payment is
made
• Banks provide loans to schools to cover any upfront costs
• Schools repay loan as parents make payments
Overall value proposition
• Low-income parents are able to send their
children to school since the payment schedule
more closely matches their income
• When parents are unable to make a payment,
students will only miss a few days of school
until the payment is made
DF+ specific value proposition
• Mobile money makes it more convenient for
smaller frequent payments to be processed
• Digital statements can help parents keep track
of their progress to their goal
Potential extensions
• Similar products can be extended to parents to pay for other educational inputs
such as textbooks, uniforms, etc.
B
6.1 POTENTIAL APPLICATIONS OF DF+ TO ADDRESS BARRIERS

199
Pay-as-you-go fees will enable parents to better manage
their finances and maximize student attendance (2/3) Low High
Feasibility assessment: operating model Impact assessment
Reach
• The target market would be parents of students in all
secondary schools and in private primary schools
• Assuming 2-parent homes with an average family size
of 4.8:3 students per household
• ~2 million students in target schools
• ~670,000 families
• 34% (~230,000) of these families are below the national
basic needs poverty line
Impact on problem
• Addresses student absenteeism as it relates to parents
ability to pay
• The solution is most effective for parents who have a
regular income but minimal savings
• It is less effective for parents who do not have a regular
income as students may end up missing as much or
more school as without the product
• The product could cause on-again, off-again attendance
for students, which could negatively affect their school
work
Infrastructure requirements
• Schools will have to invest in mobile money accounts
Operational implementation
• Schools may not have the operational bandwidth to
design and operate these programs
• The government could take on the role of negotiating
favorable loan terms that public schools can access
through local bank branches
Desirability
• Parents likely meet this need currently by borrowing
from friends and family at a lower interest rate
Financing
• To provide this service to parents, schools will need to
structure financing agreements with banks to cover
their upfront costs
• Upfront financing for schools could potentially be
provided via government funding
• This could raise the overall cost of school fees that
parents pay
Feasibility
• Relatively straightforward to imple-
ment. The main challenge will be
in how schools cover upfront cost
at the beginning of terms without
revenue from parent fee payments
Potential impact
• Parents likely have access to
informal products to make a bulk
payment. However, a formal product
will be less variable and will enable
better financial planning
B
6.1 POTENTIAL APPLICATIONS OF DF+ TO ADDRESS BARRIERS

200
Pay-as-you-go fees will enable parents to better manage
their finances and maximize student attendance (3/3)
Case examplesGo-to-market model
Omega Schools in Ghana uses a pay-as-you-
learn model with daily school fees
• Daily fee of ~$0.65 includes tuition, hot lunch,
uniforms, and mid and end of term assessments
• Students use a cashless daily payment voucher,
which is sold within their community
• The schools have custom lesson plans, work
books, assessments, and a proprietary student
and staff management system
• Schools are open 7 hours a day with lessons
taught by secondary school graduates
• Currently, it is operating 38 schools with 20,000
students across Ghana
• Schools work with banks to
access loans at the beginning
of the term
• Structure parent payments to
match loan terms, offering a
range of loan periods to
match parents’ ability to pay
• Longer payment periods will
necessitate higher interest
rates
B
6.1 POTENTIAL APPLICATIONS OF DF+ TO ADDRESS BARRIERS
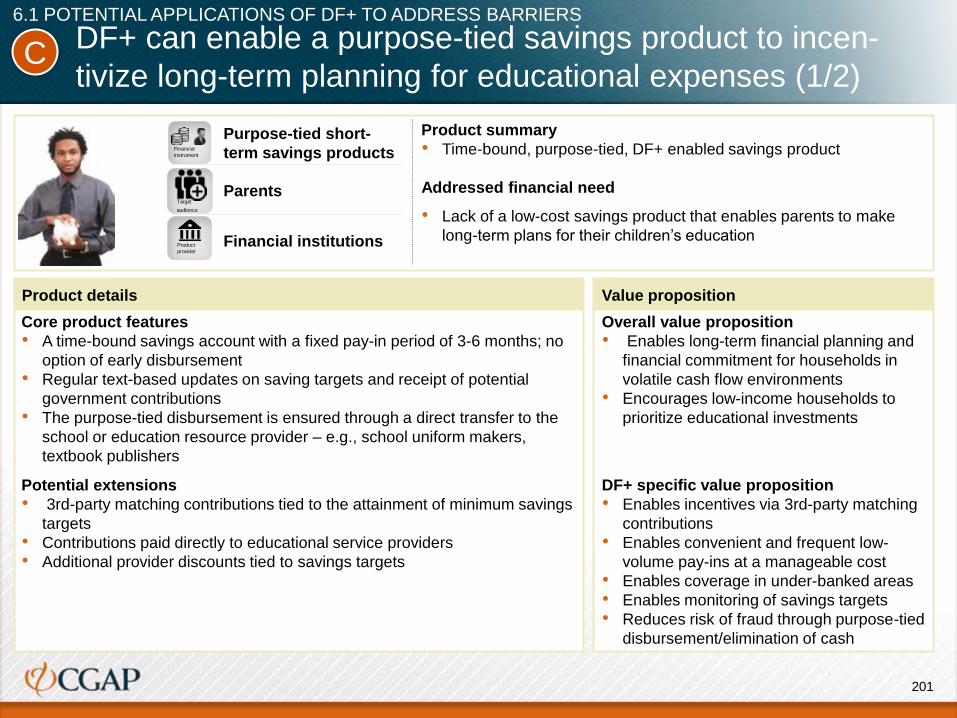
201
DF+ can enable a purpose-tied savings product to incen-
tivize long-term planning for educational expenses (1/2)
Purpose-tied short-
term savings products
Parents
Financial
instrument
Product
provider
Target
audience
Financial institutions
Product summary
• Time-bound, purpose-tied, DF+ enabled savings product
Addressed financial need
• Lack of a low-cost savings product that enables parents to make
long-term plans for their children’s education
Product details Value proposition
Core product features
• A time-bound savings account with a fixed pay-in period of 3-6 months; no
option of early disbursement
• Regular text-based updates on saving targets and receipt of potential
government contributions
• The purpose-tied disbursement is ensured through a direct transfer to the
school or education resource provider – e.g., school uniform makers,
textbook publishers
Overall value proposition
• Enables long-term financial planning and
financial commitment for households in
volatile cash flow environments
• Encourages low-income households to
prioritize educational investments
DF+ specific value proposition
• Enables incentives via 3rd-party matching
contributions
• Enables convenient and frequent low-
volume pay-ins at a manageable cost
• Enables coverage in under-banked areas
• Enables monitoring of savings targets
• Reduces risk of fraud through purpose-tied
disbursement/elimination of cash
Potential extensions
• 3rd-party matching contributions tied to the attainment of minimum savings
targets
• Contributions paid directly to educational service providers
• Additional provider discounts tied to savings targets
C
6.1 POTENTIAL APPLICATIONS OF DF+ TO ADDRESS BARRIERS

202
DF+ can enable a purpose-tied savings product to incen-
tivize long-term planning for educational expenses (2/2)Low
High
Feasibility
• Savings products currently exist on
amobile platform. Parents may prefer to
use these existing products if they are
deterred by the purpose-tied feature
Potential impact
• Enables long-term financial planning
and reduces the variability in school
attendance
Feasibility assessment: Operating
model Impact assessment Go-to-market model
Reach
• The target market would be parents of
students in all primary and secondary
schools
• Assume 2-parent homes with an average
family size of 4.8:3 students per
household
• ~10 million students in target schools
• ~3.3 million families
• 34% (1 million) of these families are below
the national basic needs poverty line
Impact on problem
• Will help parents avoid the rush to find
funds at the beginning of each term
reducing the number of missed school
days
• Students will also be able to access more
of the critical learning materials they need
to be successful
Education
• Parents will have to be educated on
how the product works and the
associated restrictions
Operational implementation
• Savings products will be offered on
mobile phones making then easy
for parents to use
Financing
• Donors may be willing to pay for
3rd-party co-pay.
• With an already overtaxed budget,
it is unlikely that the government
can make the co-pays or effectively
manage the system
• Allow parents to sign up as
they register their students
at school or at other
education service providers
in the community
• Significant 3rd party co-pay
contribution to incentives
uptake
• Simple text-based system
mirroring M-pesa/TIGO-
Pesa/M-shwari to increase
the ease of use and uptake
• Integrated payment system
across education providers
to enable secure and
proposed tied usage of
funds
C
6.1 POTENTIAL APPLICATIONS OF DF+ TO ADDRESS BARRIERS

203
Digital textbook rental will improve the accessibility
and affordability of books (1/3)
Product details Value proposition
Financial
instrument
Product
provider
Target
audience
Installment payment to
rent or purchase textbooks
Parents
Textbook providers,
students
Core features
• Rental or purchase of digital version of books enabled by 3G; students can
purchase specific pages or chapters as needed
• Provide students with simple tablets or e-book readers so they can access
digital text books and other learning materials
Overall value proposition
• Smooth out textbook expenses since students
do not have to pay for the entire book at once
• Reduced overall spending on books if students
only have to pay for the times when they use
the books
• Digital versions of textbooks addresses the
challenge of delivering books to schools
DF+ specific value proposition
• Automatic deduction of rental fees when book is
in use
• Digital platform allows immediate access to books
Potential extensions
• E-learning modules that can be purchased when students miss the lesson in
class or would like to review
• Test prep materials can also be offered on these tablets
Product summary
• Short-term rental or purchase of digital textbooks
Addressed financial need
• Textbooks are often too expensive for parents
• Additionally, the logistics of getting books to school are often
complicated and rife with corruption
D
6.1 POTENTIAL APPLICATIONS OF DF+ TO ADDRESS BARRIERS

204
Digital textbook rental will improve the accessibility
and affordability of books (2/3)
Feasibility assessment: Operating model Impact assessment
Reach
• Students in primary and secondary schools across
Tanzania where the cost of text books is not included
in tuition
• ~10 million students
Impact on problem
• Students will be able to access text books only for
those periods when they are in use, reducing the cost
to parents
Feasibility
• Daily physical textbook rental with
mobile money is relatively simple to
implement. Providing digital books
requires that students have the requisite
hardware to access these books
Impact
• Successful implementation of the
program will address one of the key
barriers to effective learning, greatly
improving student outcomes
Logistics
• Logistics required to get hardware to communities can be
designed to avoid the process inefficiencies and budget
restrictions inherent in textbook delivery
Pricing
• The pricing of daily rentals will have to be such that it does
not eventually cost more than simply purchasing the book
at the beginning of the term
Financing
• The initial investment in books and hardware can be made
by the government and schools, with the investment
recouped over time as students rent these books
Operations
• The program can be offered through schools or via 3rd-
party vendors
Low High
D
6.1 POTENTIAL APPLICATIONS OF DF+ TO ADDRESS BARRIERS

205
Digital textbook rental will improve the accessibility
and affordability of books (3/3)
Case examplesGo-to-market model
Kytabu textbook subscription is in development in
Kenya
• Textbook subscription application which is provided
on a low-cost tablet
• Digitized versions of all the textbooks used in the
Kenyan curriculum currently exist with publishers
and these will be pre-loaded onto the tablet
• The product is targeted toward parents, schools,
and the government
• Students will be able to use mobile money to rent
the books on an hourly, daily, or monthly basis or
can purchase portions of the book
• The application is still in development but is
expected to lower the original cost of textbooks by
~72%
• Work with textbook publishers
to digitize all required text-
books in a format that is
compatible with simple tablets
and e-readers
• Design and distribute basic e-
reader dedicated to textbook
and learning materials
• Ensure that parents and
students know how to use
mobile wallets to access these
products
C
6.1 POTENTIAL APPLICATIONS OF DF+ TO ADDRESS BARRIERS

206
Purpose-tied cash transfers to parents for use on
educational expenses (1/3)
Product details Value proposition
Conditional cash transfers
Parents and service
providers
Financial
instrument
Product
provider
Target
audience
Donors and NGOs
Overall value proposition
• Parents face many hidden costs even when tuition
is free
• Parents will receive assistance in paying for these
costs
• Effectiveness of donor interventions improved
DF+ specific value proposition
• Facilitates the transfer of funds and ensures that
they are only used for the specified purpose
• Helps reduce the high administration costs that are
related with operating a conditional cash transfer
scheme
Potential extensions
• Fund school feeding programs using these cash transfers
• Train community members to build and run programs, creating additional
employment opportunities in the community
Core features
• Donors provide mobile coupon codes to parents that can be redeemed for
specific services – e.g., uniforms, food at school, transportation
• Service providers will also need to register to be part of the program and be
allowed to access funds
Product summary
• Purpose-tied cash transfer to parents that can only be used on certain
educational expenses
Addressed financial need
• Donors want to transfer funds for families to pay expenses, but they lack
the certainty that funds will be used as intended
E
6.1 POTENTIAL APPLICATIONS OF DF+ TO ADDRESS BARRIERS

207
Purpose-tied cash transfers to parents for use on
educational expenses (2/3)
Feasibility assessment: Operating model Impact assessment
Feasibility
• Might be difficult to achieve scale
among providers to make this
product financially feasible
Impact
• Directly addresses the challenge
of being able to restrict the use of
funds
Reach
• Low-income households in Tanzania that cannot
afford the hidden education costs
• Given the high-touch approach necessary to recruit
providers, students in most remote areas will be
difficult to reach
Impact on problem
• Directly addresses the challenge of being able to
restrict the use of funds
• Research suggests that cash transfers are one of
the most effective interventions to address the
needs of the poor
• Both conditional and unconditional transfers are
effective to varying degrees
Education
• Parents and service providers will have be
educated on how the system works. This may be
difficult to do remotely, adding to the time and
resource cost to launch the program
• Recipients may balk at having the use of funds
restricted too tightly
Provider network
• A network of providers will have to be established
in each community
Financing
• There is appetite among donors to be able to give
directly to the people who need assistance to
make ends meet
Low High
E
6.1 POTENTIAL APPLICATIONS OF DF+ TO ADDRESS BARRIERS

208
Purpose-tied cash transfers to parents for use on
educational expenses (3/3)
Case examplesGo-to-market model
Give Directly allows donors to transfer money
directly to the poor
• Donations are made through the organization’s
webpage and are then sent electronically to poor
households in Kenya and Uganda that have pre-
enrolled
• All recipients are thoroughly audited by field staff
and educated on how the program works
• Households that do not own a phone are provided
with one, along with a SIM card
• Donations are transferred via mobile money, which
recipients can then redeem for cash
• Households receive $1,000 over 1-2 years or an
average of $200 per household member
• Independent evaluation finds that uses of these
donations range from buying food to investing in
assets and children’s education
• Donors work with technology
companies to develop an
appropriate platform
• Coupon codes provided to
parents via SMS for redemption
at approved providers
• community providers registered
to be able to receive payments
from parents via coupon codes
• Funds transferred directly into
the providers’ accounts
• Parents educated on how to
use the system
E
6.1 POTENTIAL APPLICATIONS OF DF+ TO ADDRESS BARRIERS

209
DF+ education products can be categorized based
on impact, feasibility, and barriers
DF+ solutions have different impacts … Key takeaways
Imp
act
High
Medium
Low
Low Medium High
Feasibility
Requirements for scale
• Given the large role the government plays in education,
scaling will require collaboration with the Ministry of
Education and Vocational Training
Steps to facilitate DF+ in education
• Initial focus on engaging the private sector to implement
DF+ solutions with sustainable business models
• Engage donors and MFIs to encourage more impactful
solutions
• Pay-for-
performance
digital bonus
scheme
• Pay-as-you-go
payments for
school
• Purpose-tied
education
savings product
• Mobile textbook/
learning
material rental
or purchase
A
B
C
D
• Digital cash
transfer
accounts
E
6.2 EDUCATION – VIABILITY OF OBSERVED AND POTENTIAL BUSINESS MODELS

210
DF+ implementation in the education sector faces varying levels
of constraints
▪ 85% of the country is covered by a 2G network; selected rural areas remain a problem
▪ High penetration at ~60% of households, with some concern about female access to mobile phone within the household
▪ Low level of private lending and savings for education as BoP consumers are considered unattractive
▪ The government drives reform in the sector and is currently not focused on DF+
▪ Regulation neither helps nor hinders growth of DF+
▪ The government is a major player in the sector and has not adopted technologies
▪ Government adoption would affect 95% of the students in public schools
▪ Severe non-financial challenges are related to absenteeism, quality of instruction, pupil:teacherratio
▪ The majority of low-income households do not use any form of finance products for education
▪ DF+ solutions can play a part in improving attendance, increasing the ability to pay for school and access textbooks
▪ While models are impactful, they largely have unclear business models
▪ Execution and scaling would need to be undertaken largely by government actors
6.2 EDUCATION – VIABILITY OF OBSERVED AND POTENTIAL BUSINESS MODELS
Sector readiness dimension
Sector-rele-
vant mobile
infrastructure
reach and
adoption
Readiness of
financial and
digital
financial
infrastructure
65
4 32
1
65
4 32
1
Role of
government
and
regulation
6
54 3
2
1
Severity of
sector
challenges
65
4 32
1
Financial gap
in sector
65
4 32
1
DF+ business
models and
scaling
65
4 32
1
Reach
Reach of mobile
infrastructure
Adoption of mobile
technology
Financial product
offering to sector
Availability of
DF+ solutions
Sector-specific
regulation
Role of
government
Stakeholder
complexity
Non-financial chal-
lenges in sector
Execution and
scalling ability
Depth of financial
gap
Availability of DF+
business models
Sub-dimensions
Applicability of
DF+ solutions
1
Binding constraint Readiness for scaling
2 3 54 Explanation

211
In the education sector, DF+ solutions are limited, typically
donor driven, and in a piloting stageIn
terv
en
tio
n
Discovery
Piloting
Scale
Application
Expansion and
differentiation
Global scaling
DF+ solution
maturity
• DF+ solutions in
ideation or early
development stage
• Individual DF+
solutions are being
piloted in controll-
ed environments
by selected actors,
especially donors
• Large player(s)
show openness to
DF+ by beginning
to adopt a solution
into their
operations
• Large player(s)
begin adopting a
variety of DF+
solutions and
differentiating
them
• DF+ becomes an
essential
component of the
delivery of
education
• Growth
financing/
subsidy
• Growth
financing/
subsidy and
innovation
support
• Implementation
support
• Convene
stakeholders to
discuss
expansion
• Financial and
technical advice
during piloting
phase
• Best practice
sharing
• Operating model
development
activities
• A large number of potential DF+ applications exist across the education sector, ranging from pay for perfor-
mance, to digitally educational content purchase and delivery, to incentive payments to student and households
• However the applications of DF+ to the Tanzania education sector are limited, potential initiatives are donor-
driven and require substantial subsidies
• The availability of self-sustaining business models remains to be proven
6.3 EDUCATION – SCALING AND EXECUTION CAPABILITIES

212
Agenda
Sector analysis – education
Sector analysis – water
Sector analysis and challenge identification
Assessment of financial service needs and gap analysis
Digital finance plus feasibility assessment
Readiness framework
Access to and reach of mobile infrastructure
Adoption and reach of digital payment infrastructure
Role of the government and regulation
Sector analysis – energy
Sector analysis – health
Sector analysis – agriculture

213
Tanzania has low overall access to improved water, specifically
in rural areas
9
4
20
4
43
5
18
69
9
Access to piped water
Percentage of total
Improved water access1
%
SOURCE: WHO/UNICEF Joint Monitoring Programme
Ethiopia 49
Tanzania 53
Nigeria 61
Kenya 61
Rwanda 66
Senegal 73
Uganda 75
Ghana 86
South
Africa91
Key takeaways
▪ At 53% Tanzania
has one of the
lowest rates of
improved water
access among its
peers
▪ Tanzania’s low-
income population
that lives in rural
areas is
disproportionately
affected by the lack
of access to
improved water
▪ Access to piped
water is even
lower at less than
10%
4.1 WATER – SECTOR DESCRIPTION
2011
Water access in Tanzania
1 Improved access refers to piped water, protected wells, and protected springs as opposed to unprotected wells, rivers,
streams, ponds, lakes, and dams
39
47
54
66
59
72
80
79
44
Rural improved water access
%

214
Tanzania’s budgeted water sector financing is
among the highest in Sub-Saharan Africa
Planned public investment, USD millions/year
Budgeted per capita investments are
considerably higher than many other Sub-
Saharan African nations
Per capita investment, USD
7
22
33
41
48
79
151
Ghana
Kenya
Mozambique
Tanzania
Uganda
Ethiopia
Congo
SOURCE: MoW; EUWI; UNDP
A significant amount of water financing is available in Tanzania
7
23
33
42
46
63
73
Uganda
Kenya
Tanzania
Ethiopia
Congo
Mozambique
Ghana
4.1 WATER – SECTOR DESCRIPTION

215SOURCE: MoW
However progress is held up by a backlog in projects
Although sizeable investments totaling
USD 153 million have been committed to
developing rural water supply…… only 50% of the planned projects were realized
by 2013 Budget allocation, USD millions
8 9 9 9 8
17
6
25
38
23
2012
3234
09
15
2008
25
10 11
47
Government
Donor partners
701
1,361
-48%
Proposed
projects
Actual completion
(by Dec 2013)
7.8 million
targeted
beneficiaries
3.8 million
actual
beneficiaries
4.1 WATER – SECTOR DESCRIPTION PRELIMINARY

216
Poor access to water and sanitation negatively
affects Tanzanians on many levels
Key takeawaysNegative effects of unimproved water
Opportunity cost of
gathering water
Negative health outcomes
from unimproved water
Both could get even worse over the
next decade
53 47
Rural Tanzanians with an
improved source of water
within 30 mins
%
Have access
Do not have access
Children
26,500
18,500
Annual deaths due
to diarrhea1
1,000
1,200
1,400
1,600
1,800
2,000
Available water per capitaCubic meters
20252012
-30%Water stress
1 Nearly 90% of these deaths are attributable to poor water sanitation and hygiene
SOURCE: World Bank Water and Sanitation Program, 2012
• The lack of access
to clean water is a
major factor driving
poor health
outcomes, most
notably causing
~25,000 annual
diarrhea death
• Given current
population growth
the shortage of
clean water is
forecasted to
substantially
worsen
• The need for near-
ly half Tanzania’s
rural population to
walk over 30
minutes for water
contributes to low
school attendance,
especially for girls
1,700
4.1 WATER – SECTOR DESCRIPTION PRELIMINARY

217
Despite government efforts to improve rural water access,
access to improved water remains low
4.2 WATER – IMPACT ON THE LOW-INCOME HOUSEHOLDS
Rural access to waterRole of government in increasing rural access
5
3Other tap
2
30
11
Surface water
14
Rainwater covered
cistern / tank
21
11
Boreholes
Protected wells3
House connections
other
Public tap
Unprotected wells
Improved
water
Percent • Large donor funding for Water Sector
Development Program co-financed by the
government, ADB, World Bank, KfW, GIZ, the
Dutch Government, AFD, and others valued at
about USD 950 million (World Bank financing
earmarked for rural water supply and
sanitation)
• Implemented at the ministry and local
government level
• Traditional government and donor models
provided free water to communities with brief
training and faced problems with community
management and maintenance
• As a result many water points in rural areas
are actually managed by local entrepreneurs;
these water points are often open wells with
sub-optimal health qualities given nearby pit
latrines

218
There are many different actors in the Tanzanian water system
across the value chain
Private
players
A
Extraction/sourcing PurificationDispensing and
storage
Bottom of the pyramid
consumption and
billing
• Community
pumps/wells are
funded by donor
organizations
• Households purchase
rainwater collection
devices
• Various systems of
filtration from utility
to at-home
• Donor
organizations (e.g.,
PSI) sell fast-
moving, consumer-
good filters in
stores
• Utility companies
and local NGOs are
involved in on-grid
distribution through
pipes
• Community pumps
require travel to
point of access
• Private providers
bringing in tanks of
water
Govern-
ment role
• Utility companies and local NGOs from
central water source (DAWASCO is the
major distributor in Dares Salaam and is
owned by the government
• Governments may prevent private
companies from distributing in poor areas as
they do not want them to profit from the poor
• Policy set by, Ministry of Water and Irrigation
• No national water and
sanitation company
but 20 Urban Water
and Sanitation
Authorities
• 8,394 rural water
committees
• Regulations to define
ownership and use by
Energy and Water
Utilities Regulatory
Authority (EWURA)
• Other countries
regulate if mobile
network operator
fees for payments
can be charged to
the consumer but
EWURA does notB
Detail
follows
4.3 WATER – SECTOR-SPECIFIC PLAYERS AND REGULATION

219
Fairly badly
0%4%
29%
34%
32%
Don’t know;
have not
heard enough
Very well
Very badly
Fairly well
Roles
Central
government
Regional
govern-
ment
District
councils
Local
engineers
Water
associations
& villages
heads
▪ Co-develops
solutions with
the federal
government
▪ Monitors
water supply
systems
▪ Implement
projects and
programs
▪ Own water
infrastructure
▪ Contribute
capacity
▪ Provide
technical
support
▪ Fix leakages
▪ Monitor and
assess dis-
functional
infrastruc-
tures
▪ Co-develops
solutions
▪ Builds, but
does not own
water
infrastructure
▪ Upon
completion,
hands over
infra to local
authorities
(districts and
villages)
▪ Submit project
requests
▪ Maintain
facilities
▪ Collect tariffs
▪ Replace
degraded
infrastructure
Citizens’ view
of government
performance
How is the current
government handling
providing water and
sanitation services?
Key takeaways
• Citizens believe the
government is doing
a poor job in water
and sanitation
• Implementation occurs
on a regional level,
indicating that poor
services are a problem
across different bodies
• Water provision
improvement will
require the
coordination between
different layers of
government
Many different elements of the Tanzanian government are
involved in water policy and provision
SOURCE: MoW
4.3 WATER – SECTOR-SPECIFIC PLAYERS AND REGULATION

220
Extraction/sourcing Purification Dispensing and storage Bottom of the pyramid consumption
and billing
High opportunity cost of household
travel to obtain water1.5
Household
produced water
Rain collection tasks used have
sub-optimal health qualities1.4 Consumers have low demand
and willingness to pay for filters2.2
Consumers that do purchase
filters often do not replace them
when necessary
2.3
Water treatment is sub-optimal2.1
Billing process is inefficient for
providers and consumers4.1On network
utility piped
water
Limited availability of a reliable
water source, particularly in
specific geographic areas
1.1
Competition between sectors for
water resources1.2
Lack of a business model to
increase distribution to rural
areas
3.1
Poor management and
planning capabilities3.2
Private traveling
water vendors
Private provider water is sold at
infrequent times with varying
pricing and quality
4.3
Community
wells and
purification
Lack of financing for community
well and sanitation plant
construction
1.3 Slow and unreliable
maintenance process for
broken infrastructure
4.2
Across Tanzania’s water value chain, a variety of factors drive
poor outcomes
4.4 WATER – SECTOR CHALLENGES

221
Manyara
63%
Mara
51%
Kilimanjaro
73%
Arusha
58%
Tanga
60%
Lindi
41%
MtwaraRuvuma
60%
Iringa
66%
Morogoro
62%Pwani
65%
Dodoma
50%
Singida
50%
Rukwa
55%Mbeya
60%
Kigoma\
60% Tabora
43%
Shinyanga
50%
Kagera
56%Mwanza
58%
49%
Dar es Salaam
66%
The degree of water access varies significantly between
regions
Legend
<51% Water coverage
>61% Water coverage
Water body
51-60% Water coverage
Population without clean or treated
water, thousands
1.1
641
1,800
901
583
1,200
511
Tabora
Dodoma
Shinyanga
Lindi
Mtwara
Singida
SOURCE: MoW
4.4 WATER – SECTOR CHALLENGES

222
Tanzania’s per capita water resources
will fall below the scarcity benchmark
Per capita accessible water, m3/yr
1,000
1,500
2,2912,467
Benchmark
for Scarcity
25072006
+50%
Future population growth is expected to aggravate the
scarcity in some areas …
69
61
52
42
36
2621
1613
10
20504030201020009080701960
Population surge is increasing the scarcity
of water resources
Rural population,
Millions
There is a pressing need to ensure a sufficient water
supply to meet the expected population growth
SOURCE: Ministry of Planning, Economy and Empowerment’s NSGRP; FAO
4.4 WATER – SECTOR CHALLENGES
1.1

223
In rural Tanzania, domestic water users have to compete
with agriculture and livestock which are large water users …
Types of water
usage
Water demand
Thousands m3/day
919
1,820,000
1,029
# Units
36.5 million rural
population
Over 90 million
livestock, swine,
and poultry for
grazing
280,000 hectares
of irrigated farm
lands
SOURCE: MoW, Worldbank, Mississippi State University (Pub. 2480), tanzania.go.tz/livestock
4.4 WATER – SECTOR CHALLENGES
1.2

224
… and their demand is expected to increase significantly,
which will further reduce the supply of drinking waterWater demand by sector, Millions m3/year
117
324
79
120
586
69 37
316 316
1,548 1,548
329
2015’s demandSupply2 Demand
1
1 Average livestock weights at 600 Ib
2 Considering current supply meets irrigation and livestock needs
SOURCE: MoW; Mississippi State University (Pub. 2480); tanzania.go.tz/livestock
Other
non-domestic
Irrigation
Domestic
Livestock
4.4 WATER – SECTOR CHALLENGES
1.2

225
Inefficient delivery hinders the completion of programs
Addressing weaknesses in district levels requires human capacity building
“Appropriate training should be provided to build up human capital capacities at District Levels; these include training for
filling up procurement documentations, monitoring of projects using computerized tools, systematic record keeping using
Excel sheet and Coordinated Funds management aligned with Ministry’s Financial Accounts”
– MoW, February 2013
Non-compliance with procurement proceduresa
Non-compliance with grant terms, MoU, laws and regulation, and
other statutory obligations
b
Ineffectiveness of council’s internal audit functionc
Not performing regular monitoring and evaluation activitiesd
Delay or non-submission of procurement plane
Poor record keepingf
Lack of adequate staff in terms of number and relevant education
to staff discharge activities in the water sector development program
g
Common weaknesses are noticed in the regional and district levels Underperforming districts
SOURCE: MoW, Technical Final Technical Audit Report, 2011
4
5
6
9
15
22
22
4.4 WATER – SECTOR CHALLENGES
3.2

226
Degradation of existing water infrastructure worsens the
current water coverage in rural Tanzania
Dysfunctional water supply systems are common
in rural Tanzania
Number of degraded rural water supply systems
Across 13 regions, 35% of water supply systems are no
longer functional
There is a pressing need to rehabilitate the
existing infrastructure to ensure sustainable
clean water supply reaches the rural populace
360
Boreholes
(Gensets)9,206
Hand pumps 9,983
Gravity 17,120
TOTAL 36,929
Others 42
Windmill 54
Play pumps 164
Rope pumps
Dysfunctional
Functional
Need repair
Types of technologies
4,345 cases of dysfunctional
submersible borehole
pumps
3,661 hand-pumps are no longer in
working condition
4,818 cases of dysfunctional
Gravity Systems
SOURCE: MoW
4.4 WATER – SECTOR CHALLENGES
4.2

227
Agenda
Sector analysis – education
Sector analysis – water
Sector analysis and challenge identifcation
Assessment of financial service needs and gap analysis
Digital finance plus feasibility assessment
Readiness framework
Access to and reach of mobile infrastructure
Adoption and reach of digital payment infrastructure
Role of the government and regulation
Sector analysis – energy
Sector analysis – health
Sector analysis – agriculture

228
There are low amounts of access to finance
across all types of water provision Minimal ModerateLimitedn/a
Number/reach of existing financial products
Minimal but efforts underway High
Financial
instrument.Extraction/sourcing Purification Dispensing and storage
Bottom of the pyramid
consumption and billing
Financing available for the
production of improved water
Financing available for water
purification
Financing available for the
distribution and storage of water
Financing available for the
purchase of water
Pay-as-you-
go
Liquidity
Long term
Savings
Donor
financing
Lease-and-
own
These loans are provided by certain MFIs
Subsidized model operated by GrundfosLIFELINK in Kenya
Lending to connect to the water grid is more prevalent in other countries
Payment
Lending
Other financial products No business model for well implementation without subsidy
Increased use of mobile payment usage with DAWASCO adoption
5.2 WATER – FINANCIAL GAP ANALYSIS ALONG THE VALUE CHAIN

229
Certain water sector challenges are driven by
financial gaps, some of which DF+ can address (1/2)
Value chain gap Drivers
Finance
need Existing services and gap Barriers DF+ solution
3.1 Lack of a
business model
to increase
distribution to
rural areas
3.2 Poor
management
and planning
capabilities
• No
• Long-
term
lending to
expand
grid
• Without government
subsidy, demand unlikely
• No► Low management training for staff
• See 3.2
and 4.1
► Administrative difficulties (e.g., monitoring for theft, usage tracking, billing) are exacerbated in areas with less personnel
• No► Low population density results in unfavorable on-grid economics
► Inability to track and monitor water flow and usage
• No► Low staff motivation
► Grid expansion is costly
• Ad hoc in-person reporting on
water flow and usage does not
provide sufficient data for flow
optimization, leakage and theft
detection
• Lack of a cost-effective way
to monitor the system
• Hiring staff to monitor is
frequently prohibitively
expensive
4.1 Billing
process is
inefficient for
providers and
consumers
• Mobile
payment
• Mobile
payment
► Providers incur significant costs for billing centers
► Consumer travel to and waiting times at billing branches have a high opportunity cost
• Pay-as-
you-go
liquidity
product
► Consumers have no payment flexibility beyond a monthly lump sum
• Many consumers are only able
to pay water bills at designated
billing centers
• On-grid providers feel that
they lack other payment
collection options
• Many consumers can only pay
water bills on a monthly basis
• Monthly payments
maximizes efficiency for
providers under branch-
based model
• Billing centers are a relatively
inefficient method of revenue
collection
• Adequate digital payment
solution (rollout started)
On network
piped water
5.3 WATER – BARRIERS TO PROVISION OF FINANCIAL PRODUCTS
4.1
3.1
3.2

230
Certain water sector challenges are driven by
financial gaps, some of which DF+ can address (2/2)
Drivers
Finance
need Existing services & gap Barriers DF+ solution
1.3 Lack of
financing for
community well
and sanitation
plant
construction
4.2 Slow and
unreliable
maintenance of
broken
infrastructure
• No
• Lending
for
construc-
tion
• Only ad hoc donor financing
available
• Without subsidy, the
business model is
untenable Lack of
accountability when
completely donor-financed
• Difficulty tracking usage
and collecting payments
• No► Repair process is bureaucratic and slow
• No► Unclear enforcement mechanism for non-payment
► Low level of private sector lending to low-income households
► Lack of skilled technicians
• No► Lack of incentive to fix malfunctioning equipment
► Community/households lack excess cash to fund the effort themselves
2.2 Consumers
have low
demand and
willingness to
pay for filters
• No► Lack of education about benefits of filters
• Loans for
filter
purchase
► Lack of financing to purchase filters
• A few MFIs provide these
products in limited geographic
areas
• Lack of a clear enforcement
mechanism
Community
wells and
purification
plants
Household
produced
water
• See 4.2► Maintenance/upkeep difficulties discourage donor financing
• No on-the-ground actor
incentivized financially to
repair many donor-funded
wells
• Lack of financial incentives
for a local actor to
coordinate maintenance
• Often the community does
not collect enough revenue
from the well to afford
maintenance charges
Value chain gap
5.3 WATER – BARRIERS TO PROVISION OF FINANCIAL PRODUCTS
1.3
4.2
2.2

231
Agenda
Sector analysis – education
Sector analysis – water
Sector analysis and challenge identification
Assessment of financial service needs and gap analysis
Digital finance plus feasibility assessment
Readiness framework
Access to and reach of mobile infrastructure
Adoption and reach of digital payment infrastructure
Role of the government and regulation
Sector analysis – energy
Sector analysis – health
Sector analysis – agriculture

232
Extraction/Sourcing
Dispensing and storage
3.1 Lack of a business model to increase distribution to
rural areas
3.2 Poor management and planning capabilities
Water treatment is sub-optimal2.1Purification
Bottom of the pyramid
consumption and billing
Billing process is inefficient for providers and
consumers
4.1
Lack of financing for community well construction1.3Extraction/sourcing
Bottom of the pyramid
consumption and billing
4.2 Slow and unreliable maintenance process for broken
infrastructure
Bottom of the pyramid
consumption and billing
Private provider water is sold at infrequent times with
varying pricing and quality
4.3
1.4 Rain collection tanks used have sub-optimal health
qualities
High opportunity cost of household travel to obtain
water
1.5
Not all identified challenges are caused by a financial barrier or
can be addressed through a DF+ application
6.1 WATER – POTENTIAL APPLICATIONS OF DF+ TO ADDRESS BARRIERS
Finance
as barrier
DF+
potential
No other
barriers
On
netw
ork
pip
ed
wate
rC
om
mu
nit
y w
ells
an
d p
uri
ficati
on
Detail
follows
Value chain segment Challenges
Assessment of applicability of DF+ solution
1.1 Limited availability of a reliable water source,
particularly in specific geographic areas
Competition between sectors for water resources1.2
Product
evalua-
tion
2.3 Consumers that do purchase filters often do not
replace them when necessary
Consumers have low demand and willingness to pay
for filters
2.2
)(
Ho
useh
old
pro
du
ced
wate
r
Extraction/sourcing
Purification
High Low

233
Top implementation challengesDescriptionDF+ product
1. Obtaining donor financing
2. Technical capability nearby
3. Education on benefits, proper use, and
maintenance
• Consumer pre-pays for desired
amount of water at the local
water pump
• Code input system at the pump
also tracks consumption and
automatically dispatches
maintenance after a period of
prolonged inactivity
• Funded by collected digital
payments
• Lease-to-own
community wells
with pay-as-you-
go consumption
tracking
1. Education on benefits of filters
2. Enforcement of loans
3. Distribution of filters so that they are
available for purchase
• Loan of funds that requires
digital payment proof that the
funds were used for filters with
flexible payment options
• Unsecured loans
for filter
purchase
Addressed water sector challenge
A
B
Lack of financing for
community well construction1.3
Consumers have low
demand and willingness to
pay for filters
2.2
1. System installation
2. Government enthusiasm for large
player adoption
3. Maintenance of tracking devices
4. Effective system to analyse and act on
data generated
• Mobile device embedded in the
pipe/dispensing unit that tracks
levels of flow
• Reports flows on a daily basis to
key of stakeholders
• Data helps indentify consumption
patterns /maintenance issues
• Water usage
and flow
monitoring
system
D Poor management and
planning capabilities3.2
1. Technological capabilities
2. Maintenance capabilities
3. Installation costs
• Flexible payment plans so that
consumers can align the billing
schedule with income
• Consumer receives bill on
phone with various payment
options
• Mobile billing for
piped water
C Billing process is
inefficient for providers
and consumers
4.1
Based on the analysis of the current state and barriers to scale,
we suggest 4 DF+ applications for your further consideration
6.1 WATER – POTENTIAL APPLICATIONS OF DF+ TO ADDRESS BARRIERS

234
A pay-as-you-go well payment system could help create
feasible business models for rural provision of improved water
Pay-as-you-go payment system
Donor organizations
Rural BoP communities
Potential go-to-market modelOpportunitiesProduct description
Overall
feasibility
USER
A
• A though this product requires initial donor financing, its role in solving maintenance and corruption issues
should help attract meaningful donor financing
Key attributes
• Consumer pre-pays for an amount of water via
mobile phone and receives text message code
enabling the redemption of the purchased amount
at the local water pump
• Payments stored digitally in an account in which
funds can only be withdrawn for maintenance
• A code input system at the pump also tracks
consumption and automatically dispatches
maintenance after a period of prolonged inactivity
DF+ value proposition
• Digital payments help avoid rent-seeking middle
men and enable individuals to consume water in
whatever quantities are desirable and affordable for
them
• Increase consistent access to
improved water in rural areas
(where 56% of Tanzanians
currently lack it) by presenting
a feasible business model for
provision that enables
increased revenues through
enhanced flexibility around
consumption size and
decreased rent-seeking
• Requires catalyzing of demand
for water in rural areas
• Mobile payment fees must be
affordable for the bottom of the
pyramid consumers (current
digital water payment fees in
Tanzania are not)
• <__> provider must develop a
feasible maintenance model
• Auditing is required to ensure no
rent-seeking at the point of
delivery
Addressed financial need
• Communities often lack funds (either because of poor
management or low revenue collection) to build or maintain wells
• Consumers lack a transparent payment mechanism, creating
opportunities for rent-seeking and only allowing larger payments
for pre-defined amounts of waterPROVIDER
PRODUCT
6.1 WATER – POTENTIAL APPLICATIONS OF DF+ TO ADDRESS BARRIERS

235
This pay-as-you-go model has been used successfully
by two different enterprises
Grundfos LIFELINK
Grundfos Lifelink operates through
initial donor provision of a clean water
borehole coupled with a digital payment
model that ensures fund collection from
community use for maintenance
• Started in 2008 in Kenya
• The grundfos LIFELINK system is a
submersible pump into a borehole with
clean drinking water operated by solar
panels
• Smart card with water credit used for
payment
• Surveillance unit used for remote
monitoring
• Community takes responsibility for the
service contract with a local service team
• Price determined by a water committee
Sarvajal
Sarvajal is a social enterprise that
processes water at large filtration plants
and distributes it to local water ATM
franchises
• Founded in mid-2008; focuses on India
• Company claims digital finance is
essential for monitoring ATM functionality
and better adjusting supply distribution to
demand projections
• Company as a whole is not profitable,
though franchises are making money
• Management claims the company will
begin to be profitable after reaching 800
franchises
• This model is currently most applicable in
areas with dense populations
• The use of a pre-paid water card has
created social status around
withdrawing water from ATMs, making it
a predominantly male activity
A
6.1 WATER – POTENTIAL APPLICATIONS OF DF+ TO ADDRESS BARRIERS

236
DF+ could enable the provision of unsecured household water
filter loans
Unsecured installment loan
MFI, NGO/Government
BoP household
Potential go-to-market modelOpportunitiesProduct description
Overall
feasibility
USER
PRODUCT
PROVIDER
Key attributes
• The loan is contingent upon proof that funds were
used for filter acquisition
• The loan has flexible payment options designed to
be consistent with the income receipt pattern of the
consumer
DF+ value proposition
• DF+ makes small, frequent payments economically
viable for both consumers and financial institutions
• DF+ enables donors to ensure that designated
funds are used for filter purchase
• Increased availability of filters
could decrease the 56% of
rural Tanzanians who lack
access to improved water
• The loan product would also
help filter company sales
• MSABI has sold ~1,200
locally produced pot filters at
~25,000 TZs
• Consumers can obtain
microfinancing for these
purchases via YOSEF
• Determine loan interest rate that
creates sustainable product
economics
• Develop different payment plans
consistent with the income
cycles of various local industries
• Generate demand for filters and
improved water access
(leveraging mobile for
advertising)
• Create awareness on the need
to replace filters
• Product could be effective in increasing access but may require subsidies to generate substantial demand
Addressed financial need
• Consumers cannot make large upfront payments for filtration
systems ($20-70)
• Under the traditional branch-based banking model, the cost of
loan evaluation, provision, and payment collection greatly
outweighed revenue from small loan
B
6.1 WATER – POTENTIAL APPLICATIONS OF DF+ TO ADDRESS BARRIERS

237
A mobile billing system could help increase on-grid access, as well as and
worker and company productivity
Mobile payment product
Telco and Utility
On-grid water consumers
Potential go-to-market modelOpportunitiesProduct description
Overall
feasibility
• Mobile payments have a high potential for impact, as all players in the system benefit from them and they have
been proven implementable; a coordinated campaign to increase use will be necessary to ensure optimal
impact
Key attributes
• Bill issued on mobile phone with flexible payment
options aligned with local consumers’ income
receipt patterns
• Proof of payment issued via SMS after payment
DF+ value proposition
• Digital payment enables consumers to avoid long
commutes and waits in their payments, and utilities
to avoid operating of billing center
• Creates a viable business model for utilities to
collect smaller payments
• Increases the feasibility of
grid expansion further from
existing payment centers and
enables more people to pay
bills with a flexible payment
structure
• Marketing campaign to increase
sign-up (currently, only 1% of
the piped water consumers in
Dar es Salaam who have the
option to pay via mobile do so)
• Expand the mobile payment
system to on-grid areas outside
Dar es Salaam
• Develop a SMS receipt system
that company officials view as
reliable and consumers view as
an adequate substitute to a
paper receipt
Addressed financial need
• Method for bill collection that does not require the upkeep of an
expensive billing center
• A method of payment that does not require long travel and wait
times to pay bills and allows consumers to pay water bills in
smaller amounts rather than large monthly sumsPROVIDER
USER
PRODUCT
C
6.1 WATER – POTENTIAL APPLICATIONS OF DF+ TO ADDRESS BARRIERS

238
A digitally enabled tracking system could ensure better donor and
on-grid management
Reporting system of water flow
and consumption
Telcos and technology
companies
Water providers
Potential go-to-market modelOpportunitiesProduct description
Overall
feasibility
USER
PRODUCT
PROVIDER
Key attributes
• Mobile device embedded in pipe/dispensing unit
that tracks levels of water flow
• The device reports flows on a daily basis to a
variety of stakeholders
DF+ value proposition
• The tracking mechanism is enabled through mobile
and is a necessary part of a pay-as-you-go payment
system
• The immediacy of reporting mechanism is only
possible through mobile
• This product ensures that multiple stakeholders,
including donors, will see original reports
• … • Educational outreach to on-grid
providers and donors
• Construction of mobile monitors
• Establishment of reporting
system for monitors
• Already available product could improve the efficiency of on-grid water provision while increasing donor efficacy
through superior maintenance coordination
Addressed financial need
• Donors often are unable to monitor real-time whether the wells
from their projects are being used and where repairs are
necessary
• On-grid providers lack centralized information to identify
leakages, theft, and optimal allocation of water
D
6.1 WATER – POTENTIAL APPLICATIONS OF DF+ TO ADDRESS BARRIERS

239
This type of monitoring product has already been
implemented successfully in a variety of contexts D
MSABI
MSABI’s work in rural
Tanzania includes
providing maintenance
insurance implemented
through mobile monitoring
• Monthly premiums of
~USD4 for service
• A maintenance worker
visits every 2 weeks and
as problems arise
(notified by mobile phone)
• Able to immediately order
necessary parts via
smartphone
• Smartphone use could
help payment adherence
as MSABI has found it
makes maintenance
workers appear more
legitimate to communities
M4Water
M4Water works in rural Uganda,
using mobile technology to provide
information to multiple stakeholders
Currently in 7 districts monitoring
150,000 water points and uploading
data to a customized District Water
Management Information System
(DWMIS) accessible to all
stakeholders
• Data collected includes baseline,
fault reporting, and sanitation
information
• Reporting faults: Any member of the
community can report a fault to the
system by sending a coded SMS
with the ID of the water source and
problem
• Sanitation information: Health
assistants carry out inspections and
input results
USAID - Kenya
In Kenya, USAID helped
fund the implementation of
95 public meters in
compounds
• Landlords had previously
rationed water as they
could not control or track
amount consumed
otherwise
• The ATM model allows pre-
payment for fixed amount
of water, making rationing
unnecessary
• Consumers pre-pay for
water at a rate 70% lower
than they had paid outside
vendors to obtain water
• After observing pilot results,
NAWASSCO, the local
Kenyan utility, was inspired
to obtain financing to
expand the use of these
meters
6.1 WATER – POTENTIAL APPLICATIONS OF DF+ TO ADDRESS BARRIERS

240
DF+ water products can be categorized based on impact,
feasibility, and barriers
DF+ solutions have different impacts … Key takeaways
Imp
act
High
Medium
Low
Low Medium High
Feasibility
Requirements for scale
• A large donor base is necessary for lease-and-own
community wells
• The implementation of digital unsecured filter loans will
likely need to begin with MFI pilots
• Education for water providers and facilitated
collaboration with technological providers are needed to
encourage them to further adopt mobile billing and water
usage tracking
Steps to facilitate DF+ in water
• Focus initially on engaging the private sector to
implement DF+ solutions with sustainable business
models (mobile billing, water usage tracking)
• Engage donors and MFIs to encourage solutions that will
have a greater impact
▪ Mobile billing for
piped water
C
▪ Water usage and
flow monitoring
system
D
▪ Lease-to-own
community wells
with pay-as-you-
go consumption
tracking
A
▪ Unsecured loans
for filter purchase
B
6.2 WATER – VIABILITY OF OBSERVED AND POTENTIAL BUSINESS MODELS

241
DF+ readiness assessment – DF+ implementation in the
water sector faces varying levels of constraints
Sector-rele-
vant mobile
infrastructure
reach and
adoption
Readiness of
financial and
digital
financial
infrastructure
6
5
4 3
2
1
6
5
4 3
2
1
Role of the
government
and
regulation
6
5
4 3
2
1
Severity of the
sector’s
challenges
6
5
4 3
2
1
Financial gap
in the sector
6
5
4 3
2
1
DF+ business
models and
scaling
6
5
4 3
2
1
Reach
Reach of mobile
infrastructure
Adoption of mobile
technology
Financial product
offering to sector
Availability of DF+
solutions
Sector-specific
regulation
Role of the
government
Stakeholder
complexity
Non-financial chal-
lenges in sector
Execution and
scaling ability
Depth of financial
gap
Availability of DF+
business models
Applicability of
DF+ solutions
▪ 85% of the country is covered by a 2G network; selected rural areas remain a problem
▪ High penetration at ~60% of households, with some concern about female access to mobile phone within the household
▪ Low level of financial sector lending for well construction or filter purchase
▪ Mobile payments have been adopted by DAWASCObut other products have yet to be adopted
▪ The government has supported DAWASCO adoption of mobile billing
▪ Complex decentralized stakeholder landscape as many different levels of government are involved
▪ Severe non-financial challenges related to corruption, lack of management capabilities, countrywide water shortage
▪ Majority of low-income households do not use any form of finance products in water consumption
▪ DF+ solutions can play a part in lowering the cost of delivery, increasing efficiency and expanding access to water
▪ Clear business case for mobile billing and monitoring though lease-and-own wells, and filter loans require subsidy
▪ If parts of large donor financing were redirected toward these impactful solutions, scaling should be possible
▪ Water is a highly politicized topic and the government has indicated it might prevent companies from distributing it to low-income households if it thinks they are profiting from the poor
6.2 WATER – VIABILITY OF OBSERVED AND POTENTIAL BUSINESS MODELS
Sector readiness dimension Sub-dimensions 1 2 3 54 Explanation

242
In the water sector, DF+ solutions are beginning to be
applied at scaleIn
terv
en
tio
n
Discovery
Piloting
Scale
Application
Expansion and
differentiation
Global scaling
DF+ solution
maturity
• DF+ solutions in
ideation or early
development stage
• Individual DF+
solutions are being
piloted in controll-
ed environments
by selected actors
especially donors
• Large player(s)
show openness to
DF+ by beginning
to adopt a solution
into their
operations
• Large player(s)
begin adopting a
variety of DF+
solutions and
differentiating
them
• DF+ becomes an
essential
component of
water provision
and improvement
efforts
• Growth
financing/
subsidy
• Growth
financing/
subsidy and
innovation
support
• Implementation
support
• Convene
stakeholders to
discuss
expansion
• Financial and
technical advice
during piloting
phase
• Best practice
sharing
• Operating model
development
activities
• DAWASCO’s adoption of mobile payments should set a precedent for smaller players
• Other DF+ solutions are still being discovered and have the potential to increase on-grid and donor efficiency and
extend off-grid water access
• Although mobile billing and monitoring have clear business cases for implementation, lease-and-own wells and filter
loans may require donor subsidy
6.3 SCALING AND EXECUTION CAPABILITIES

243
Advancing financial inclusion to improve the lives of the poor
www.cgap.org