digital flood maps - kentuckywater.ky.gov/floodplain/documents/riskmap/viewing and using...
TRANSCRIPT

DIGITAL FLOOD MAPS How to View and Use Digital FIRMs
August 2017
Abstract
This booklet gives you a comprehensive overview of how to view and utilize Digital Flood Insurance Rate Maps (DFIRMs) using internet web browsers, mobile apps, ArcMap, and Google Earth.

2
Questions? Comments? Contact Kentucky Risk MAP at [email protected].
Table of Contents
I. Introduction ……………………………………………………………………………. 2
II. Internet Browsers ……………………………………………………………………. 3
III. Mobile Applications …………………………………………………………………. 5
IV. ArcMap ……………………………………………………………………………………. 8
V. Google Earth …………………………………………………………………………… 12
Introduction Digital Flood Insurance Rate Maps, or DFIRMs, have a wide range of users. Citizens use the maps to see if their home is located in the floodplains. Community officials use these products to administer floodplain management regulations and mitigate flood damage. Lending institutions and federal agencies use the products to locate properties and buildings to determine whether flood insurance is required when making loans or providing grants for the purchase or construction of buildings. Because we live in a digital age, and because of the proliferation of data available, there are many ways that you can view and use digital floodplain maps. This booklet is designed to help you understand some of the available mapping options, how to use these digital map services effectively, and to understand some of their limitations. The following pages give a brief overview of how to find, utilize, and/or download DFIRMs for the Commonwealth. Your use of these mapping services may depend on several factors such as what are you trying to see using the flood maps, your internet connection, the capabilities of your computer, and which programs you have downloaded to your computer as well as which programs you have access to. For help using the National Flood Hazard Layer in these programs or for more information about digital resources, please contact the Kentucky Division of Water (KDOW) State NFIP Coordinator [email protected] or the KDOW Risk MAP team [email protected].

3
Questions? Comments? Contact Kentucky Risk MAP at [email protected].
Internet Browsers (Internet Explorer, Google Chrome, Mozilla Firefox, Apple Safari, etc.)
There are several web based services available to floodplain coordinators for viewing and using the most up to date flood hazard maps available. These web based services require nothing more than and web browser and an internet connection.
**Note: Several of the online resources do not work well in Internet Explorer at this time. Use an alternate web browser for best results.
Kentucky RiskMAP Portal One such service is the Kentucky RiskMAP Portal. This service allows you to find your area of interest, searching by street address, location, or by Latitude & Longitude for any location in Kentucky. It allows you to view the floodplain maps anywhere in the state, gives you the panel number for the Flood Insurance Rate Maps (FIRMs), and tells you the effective date of the most recent FIRMs for your area. The Portal also shows Base Flood Elevations (BFEs) and Floodways on the map in AE Zones. For certain areas in the state (shown in green on the website) additional services and data are available. Within these counties, you can get ‘Approximate Base Flood Elevations’ in A Zones by clicking the stream center line (circled below in GREEN). From this results box, you can click the ‘Download Model’ (circled in ORANGE).
This gives you the option of downloading models, the shapefiles for ArcMap, Hydraulic and Hydrology Reports, and the Flood Insurance Study (FIS) for your area of interest. This information is being periodically added, so if your county is not currently available, check back in the near future. The Kentucky RiskMAP Portal is available at: http://watermaps.ky.gov/RiskPortal/.
FEMA Flood Map Project Updates The Kentucky Division of Water (KDOW) is FEMA’s Cooperating Technical Partner (CTP) in the Risk MAP process. The Risk MAP process combines flood hazard identification (mapping), flood risk assessment, and hazard mitigation planning activities, to create a holistic view of flood risks in communities across the Commonwealth. As this Risk MAP process nears completion, preliminary flood maps are available for community members and community elected officials to review. Once maps are adopted and made final, effective map information can be viewed on the RiskMAP Portal The FEMA Flood Map Project Updates maps are available by visiting http://kygis.maps.arcgis.com/apps/PublicGallery/index.html?appid=765cb92638634695924fae440ef11ba4.

4
Questions? Comments? Contact Kentucky Risk MAP at [email protected].
FEMA’s GeoPlatform FEMA’s GeoPlatform service is an online ArcMap program showing FEMA’s National Flood Hazard Layer data. The GeoPlatform allows users who do not have access to an ArcMap program to utilize the most current effective data online to make flood hazard determinations. FEMA’s GeoPlatform is available at: https://www.arcgis.com/home/item.html?id=cbe088e7c8704464aa0fc34eb99e7f30. To open ArcMap in your internet browser, click the ‘Open in Map Viewer’ button as shown below.
FEMA’s Map Service Center The Map Service Center (MSC) allows you to search by address, location, or Latitude & Longitude for an area of interest. From here, you have access to all effective products, preliminary products, and historic products such as FIRM Panels, FIS Reports, Letters of Map Change, etc. The FIRM Panels provided here are the same panels that are available with your local floodplain administrator. The MSC allows you to download all of the community’s effective, preliminary, and historic products. Start by searching for your community in the search bar. In the search results click the ‘Show all products for this area’ button shown below. From there select the products you wish to download. Notice you can select the ‘DL ALL’ button, shown in GREEN, and download all the products at once.
The MSC also shows you how to read a FIRM, how to locate products on the site, and allows you to set up email notifications for specified places & areas. These notifications can be customized to notify you of any pending or effective changes to the flood maps. FEMA’s Map Service Center is available at: https://msc.fema.gov/portal.

5
Questions? Comments? Contact Kentucky Risk MAP at [email protected].
Mobile Applications
The Division of Water has developed a mobile friendly application called the ‘Stream Maintenance App’ that is designed to assist industry professionals and ordinary citizens in determining when a Floodplain Permit, Water Quality Certification, or a Dam Construction Permit is required. This App is designed to work on both computer and mobile devices like phones and tablets, as shown at the bottom of this page. The Stream Maintenance App allows mobile users out in the field to make real time determinations such as “Am I in a floodplain?”, “Am I near a special use water?”, or “Are there any dams near me?”
Both the mobile and desktop applications will allow the user to easily find their current location. Simply hit the ‘Zoom to my location’ button, shown on the following page, and the app will automatically detect the user’s location and zoom the map to it. Other tools include the ability to measure distances and areas for project sites, finding Lat/Longs of areas of interest, and links to additional information.
The floodplains shown in the application are designed to help people identify if their structures or properties are located in identified floodplain areas; however, the Base Flood Elevation (BFE) for their locations should still be obtained using the Kentucky Risk MAP Portal or FEMA’s Map Service Center. See pages 3 and 4 for more information on these services. To use the App or Web map, visit https://arcg.is/2wU1cL0 on your computer or mobile device.
Mobile App Desktop Version
6
Questions? Comments? Contact Kentucky Risk MAP at [email protected].
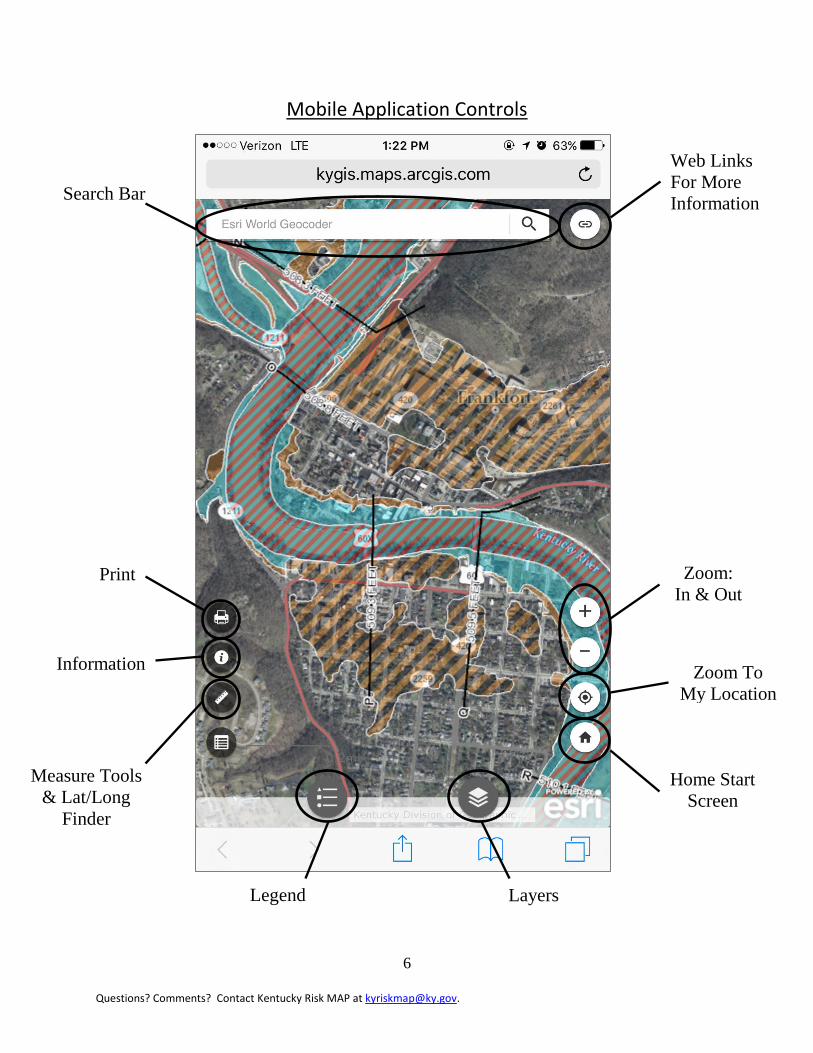
Mobile Application Controls
Web Links
For More
Information
Zoom:
In & Out
Zoom To
My Location
Home Start
Screen
Layers Legend
Measure Tools
& Lat/Long
Finder
Information
Search Bar

7
Questions? Comments? Contact Kentucky Risk MAP at [email protected].
The Search Bar
allows the user to
search by physical
address, Lat/Long,
or Location.
All features
included are
selectable for
additional
information as
shown for the
stream to the right.
Users are able to
zoom to their
location, select areas
they are interested
in, and find the
Lat/Long for the
areas they clicked.
The Lat/Long is used
as part of permit
determinations,
permit applications,
and map updates.
The Web Links
button next to
the search bar
takes users to
the 401 Water
Quality,
Floodplain, and
Dam Safety
web pages for
additional
information and
resources.
The Measure
Tool allows users
to measure
floodplain
widths, buffer
zones, stream
distances, and
setbacks in any
units you desire.
You can also
measure the area
of your project
site or of a
wetland.

8
Questions? Comments? Contact Kentucky Risk MAP at [email protected].
ArcMap / ArcGIS
For floodplain managers with access to GIS software, there is a REST service available that brings FEMA’s National Flood Hazard Layer (NFHL) data into your GIS program. It’s a “live” layer accessed from the web, so when FEMA updates on their end, the updates show up on yours too. This allows you to have access to the most up-to-date floodplain maps, LOMA’s and LOMR’s, FIRM Panels, Base Flood Elevations, stream lines, and many other useful layers. A high speed internet connection is required when using the Rest Service.
To add this data layer to your ArcMap project, follow the six steps below. Step 1) Open the ArcMap project where you would like to add the NFHL. Click the ‘Add Data’ button.
Step 2) In the dropdown box at the top of the popup, select ‘GIS Servers’
You then select the ‘Add ArcGIS Server’. Then click ‘Add’.

9
Questions? Comments? Contact Kentucky Risk MAP at [email protected].
Step 3) Select the ‘Use GIS services’ and click ‘Next’.
Step 4) Type the URL provided below into the popup box. Click ‘Finish’
The address for the rest service is: https://hazards.fema.gov/gis/nfhl/rest/services

10
Questions? Comments? Contact Kentucky Risk MAP at [email protected].
Step 5) A new server has been automatically added to your list of GIS Servers. Select this new server
and click ‘Add’.
Step 6) Open the ‘public’ folder. Select the ‘NFHL’ file and click ‘Add’.
Congratulations! You have now added the National Flood Hazard Layer Rest Service to your ArcMap project. Once you have the NFHL layer added, be sure to save your project to ensure that this layer will be available to you going forward.

11
Questions? Comments? Contact Kentucky Risk MAP at [email protected].
ArcMap Scale Reference
Below is a breakdown of the scale range that your ArcMap needs to be at to display the associated
layers. Your scale, or ratio, can be found in the ‘Standard’ tool bar in ArcMap, generally located at the
top of your program.
Out Beyond 1:250,000 NFHL Availability
1:250,000 and Greater LOMRs
LOMAs
FIRM Panels
Base Index
Topological Low Confidences Areas
River Mile Markers
Datum Conversion Points
Coastal Gages
Gages
Nodes
High Water Marks
Station Start Points
Profile Baselines
Water Lines
CBRS Areas
Political Jurisdictions
Hydrologic Reaches
Submittal Information
Alluvial Fans
1:100,000 and Greater PLSS Boundaries
Coastal Transects
Sub-basins
1:50,000 and Greater Transect Baselines
Limit of Moderate Wave Action
Levees
General Structures
Primary Frontal Dunes
Flood Hazard Boundaries
Flood Hazard Zones (labels greater than
1:10,000)
Water Areas
1:24,000 and Greater Cross-sections
Base Flood Elevations

12
Questions? Comments? Contact Kentucky Risk MAP at [email protected].
Google Earth
NOTE: Google Earth SHOULD NOT be used when making official floodplain determinations!! These files are only updated every 2-3 years. Official Determinations should be done using the Risk MAP Portal, the GeoPlatform, the Map Service Center, or the NFHL layer in ArcMap only.
Before You Start You must have the Google Earth viewer software installed on your computer. To install Google Earth on your computer, visit http://earth.google.com/ and click the button circled in RED below. Your computer also must have access to high-speed internet connection. Information about system requirements needed by your computer to run the software is available through http://earth.google.com/support/.
Opening the National Flood Hazard Layer Step 1) Download the National Flood Hazard’s .kmz file for use in Google Earth by visiting
https://hazards.fema.gov/femaportal/wps/portal/NFHLWMSkmzdownload. The file is titled ‘FEMA NFHL v#.#.# kmz’ (Note: the file name will have numbers in place of # on the website). The webpage and the file’s location on the website are shown on the following page. You will note that this web page has two Google Earth files available for download: ‘Stay Dry’ and ‘FEMA NFHL’. The Stay Dry file, while showing the flood maps, is a very rudimentary version. It does not show hazard zones, floodways, or Letter of Map Change determinations. The ‘FEMA NFHL’ file provides you all of the hazard information including: Flood Hazard Zones & labels, Floodways, community boundaries & community names, Base Flood Elevations, cross sections & their labels, flood control structures (i.e. levees, floodwalls, etc.), river miles markers, and Flood Insurance Rate Map (FIRM) boundaries & panel numbers. Each of the layer names

13
Questions? Comments? Contact Kentucky Risk MAP at [email protected].
are also a hyperlink to a description of the layer and to other FEMA websites relating to that layer.
Step 2) Double click the ‘FEMA NFHL .kmz’ file you downloaded to your computer. Google Earth will
open and display the FEMA NFHL, which includes a map overlay showing the status of coverage. You should see something similar to the image below. Every county shown in RED has the flood map information digitally available for it. All communities in Kentucky are digitally available.
14
Questions? Comments? Contact Kentucky Risk MAP at [email protected].
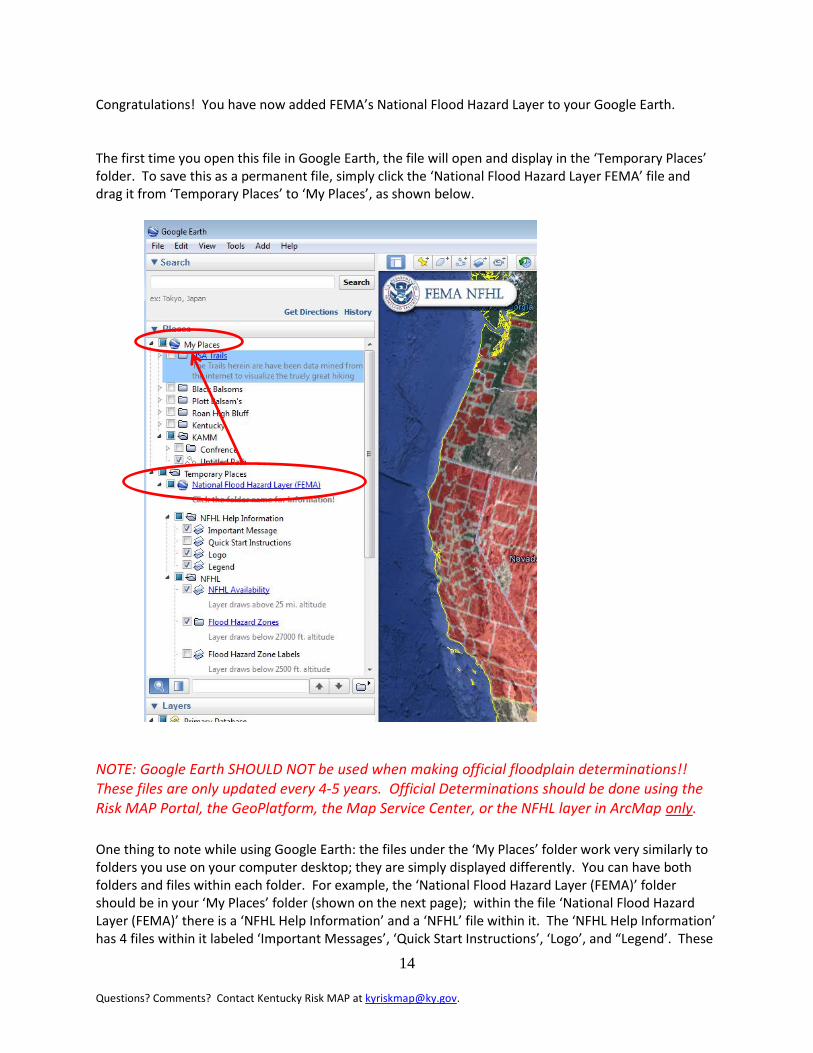
Congratulations! You have now added FEMA’s National Flood Hazard Layer to your Google Earth. The first time you open this file in Google Earth, the file will open and display in the ‘Temporary Places’ folder. To save this as a permanent file, simply click the ‘National Flood Hazard Layer FEMA’ file and drag it from ‘Temporary Places’ to ‘My Places’, as shown below.
NOTE: Google Earth SHOULD NOT be used when making official floodplain determinations!! These files are only updated every 4-5 years. Official Determinations should be done using the Risk MAP Portal, the GeoPlatform, the Map Service Center, or the NFHL layer in ArcMap only.
One thing to note while using Google Earth: the files under the ‘My Places’ folder work very similarly to folders you use on your computer desktop; they are simply displayed differently. You can have both folders and files within each folder. For example, the ‘National Flood Hazard Layer (FEMA)’ folder should be in your ‘My Places’ folder (shown on the next page); within the file ‘National Flood Hazard Layer (FEMA)’ there is a ‘NFHL Help Information’ and a ‘NFHL’ file within it. The ‘NFHL Help Information’ has 4 files within it labeled ‘Important Messages’, ‘Quick Start Instructions’, ‘Logo’, and “Legend’. These

15
Questions? Comments? Contact Kentucky Risk MAP at [email protected].
files and folders can be moved in the same way you move folders on your computer. You can drag and drop them into other folders. As long as those folders are not within the ‘Temporary Places’ folder, they will be available to you every time you use Google Earth.
You should also be aware that Google Earth allows you to turn files ‘On’ or ‘Off’ to customize your viewing experience. You will note that in the picture below, each file and folder has a box to its left (circled in GREEN). The boxes showing a check mark or a blue square are turned on and visible on the map. This allows you to set which files you wish to see. For example, unless I’m specifically interested in a map panel number or a panel’s effective date, I will often turn the ‘FIRM Panels’ layer off to make viewing the map easier. You can also collapse folders so that you no longer see their contents to make finding your files easier. To do this, click the gray arrows next to the opened folders (circled below in ORANGE).
Settings and Controls There are several things you can do to enhance your Google Earth user experience. First, for those of you who are mainly interested in a particular area of the Commonwealth, Google Earth allows you to set your start location. You can do this by zooming to the area where you are interested. Once there you

16
Questions? Comments? Contact Kentucky Risk MAP at [email protected].
click ‘View’ tab at the top of the page and select the ‘Make this my start location’ option. In addition to setting your start location, you should also set your Latitude and Longitude to ‘Decimal Degrees’ for easy use. To do this, simply click the ‘Tools’ tab at the top of the page and select ‘Options’. You should then get a pop-up box like the one shown below. To change your Lat/Long, make sure you are in the ‘3D View’ tab; you then click the box for ‘Decimal Degrees’. Once done, click ‘OK’.
You should also make yourself familiar with the Google Earth’s controls shown below.
A) This is the ‘View Wheel’. Google Earth is designed as a 3D viewer, so the closer you get to the surface, the more the screen will want to tilt. Use the View Wheel to adjust your view up and down. You can also click the ‘N’ to orient your view North & South.
B) This is Google Earth’s ‘Pan Wheel’. This wheel allows you to move your map to find your area of interest. You can also do this by left clicking your mouse and dragging the image.
C) The Orange Man icon is Google’s Street View.
You can use this to get a street level view of areas you’re interested in simply by clicking and dragging the icon to a city street. The streets where this feature is available will appear in Blue.
D) This is the ‘Slider Bar’. This feature allows you to
zoom in and out of the map. You can do this by clicking and dragging the slider or by clicking the ‘Plus’ and ‘Minus‘ buttons.
A
B
C
D

You can also control the transparency of the ‘National Flood Hazard Layer (FEMA)’ files. To do this, we first need to select the file we are interested in changing. In the example below, I have selected the ‘Flood Hazard Zones’ file. Next, we click the ‘Opacity’ icon (circled in ORANGE). Once there, click the slider (circled in GREEN below) and drag it left and right to change the transparency.
Changing the transparency of the files, makes the map easier to read and understand. See the images below for an example showing different transparencies.
Google Earth also enables you to change the aerial imagery to see changes over time. Once you are zoomed in to an appropriate scale, an image of a clock with a year will appear in the bottom left hand side of your map, as shown below.

18
Questions? Comments? Contact Kentucky RiskMAP at [email protected].
If you click this image, Google Earth will open a slider bar at the top left of your screen that allows you to change the age of the aerial imagery you are viewing. You will note that the oldest imagery available is the year that appears in the previous icon. You should also note several white lines in the slider bar; these are the years when new imagery was collected. Simply click and drag your slider back and forth to change your Google Earth map. See the images below for an example.
September 2010 September 2014
This feature is particularly useful when trying to establish the age of a structure or in trying to see when a particular development occurred. In the example above, this structure in the floodplain was demolished somewhere between Sept. 2010 and Sept. 2014. Mobile Use
Google Earth has a mobile application available for both Apple and Android devices. The Google Earth application is available for download in the iTunes Store or through Google Play. To install the NFHL layers on your mobile device, simply follow the steps listed above. Users should also be aware that using the Google Earth mobile applications still require an internet connection to function properly. You should also be aware that there is no easy way to save the files to your mobile application. It is possible but it may require more technical knowhow to accomplish. It is strongly recommended that mobile users use the mobile application discussed on page 5 of the booklet to make floodplain determinations in the field.

19
Questions? Comments? Contact Kentucky RiskMAP at [email protected].
[This page is intentionally left blank]

Kentucky Division of Water 300 Sower Boulevard, 3rd Floor
Frankfort, KY 40601 (502) 564-3410 [email protected]