digital inclusion and mobile media in remote sarawak - apo · digital inclusion and mobile media in...
TRANSCRIPT

Digital Inclusion and Mobile Media in Remote Sarawak
Swinburne University of Technology, Melbourne, Australia & Swinburne University of Technology Sarawak Campus, Malaysia

CONTENTS
Introduction 1
Key Findings 2
Acknowledgements 2
Part I: Background 3
1.1 Rural ICT in Malaysia 3
1.2 Fieldwork Area 4
1.3 Research Methods 7
1.4 Participant Demographics 9
Part II: Infrastructure and Capacities 11
2.1 Infrastructure 11
ICT connectivity 11
2.2 Livelihoods and Capacities 14
Mobility and place of residence 15
Government benefits 16
Part III: ICT Practices 17
3.1 Devices 17
Affordability 18
Device use 19
3.2 Use of the Internet 19
Frequency of use and sites of use 20
Skills 21
Social networks, apps, and platforms 23
Online activities 24
Languages 27
3.3 Non-use 27
Part IV: Discussion 31
Part V: Conclusion 33
Glossary and Acronyms 34
References 35
Suggested citation: Horn, C., Rennie, E., Gifford, S., Riman, R.M., Wee, G.L.H., Digital Inclusion and
Mobile Media in Remote Sarawak, 2018, Swinburne University of Technology, Melbourne. DOI:
0.4225/50/5a5e751012e2e.

1
Introduction
“Digital inclusion” is the ability to access, and benefit from, online opportunities. Decades of
research on the digital divide has found that digital exclusion can result from lack of connectivity,
as well as more complex factors including abilities, affordability and attitudes, or a combination of
these (Helsper, 2008; Helsper, 2012; Van Deursen et al, 2017; Van Deursen & van Dijk, 2014; Van
Dijk, 2005).
People living in remote regions have historically been more likely to face digital exclusion, due to a
lack of internet access in these areas. The cost of building and maintaining telecommunications
infrastructure for small populations based in isolated areas often rules out market-based solutions
to this problem. In response, many governments have developed market design mechanisms that
transfer some of the consumer surplus from one group into an implicit subsidy for another group, a
practice known as Universal Service Provision (USP) or Universal Service Obligations (USO).
While the Malaysian government seems to have comprehensive USP policies and programs, some
regions have partially or wholly missed out on communications infrastructure. New efforts by the
State Government of Sarawak, in east Malaysia, on the island of Borneo, promise to address these
gaps. In this report, we examine the prospects for digital inclusion in remote Sarawak, assessing
both existing infrastructure needs and the potential social benefits of improved infrastructure.
The research presented in this report took place in 11 remote villages located along the Baram
River (see Figure 1, page 5), a region characterised by a general lack of infrastructure and services,
and with limited road, river, or air access. We found that internet adoption in this region is still very
low: 64 per cent of people living in these communities were not accessing the internet, compared
with 22 per cent of Malaysians overall (MCMC, 2016a). Given that connecting to the internet
requires significant effort for people living in these villages (including, in some instances, travel to
other locations), this result is unsurprising. However, even within this environment of scarce
connectivity, many people were making the best of their circumstances, and using low-bandwidth
applications to coordinate individual and group activities where possible.
Most of our study participants (82 per cent) owned a device such as a mobile phone or
smartphone. People in villages without connectivity used their devices whenever they visited the
city, or an area where access was possible. Many also used their device for offline activities when
no internet was available. Younger participants, in particular, were able to creatively solve a range
of challenges they experienced where internet connectivity was absent or unreliable; they were
confident in their skills across a range of practices, and shared new practices with each other. Older
participants struggled at times to use more sophisticated practices, but many emphasised the
importance of ICTs for connecting with children and other family members. Participants identified
a range of ways in which the presence and reliability of internet infrastructure would improve their
lives, including economic and social development, as well as cultural maintenance.
Our research suggests the single most effective strategy for achieving digital inclusion in Sarawak is
to provide remote villages with reliable, affordable, publicly accessible internet infrastructure.

2
The research underpinning this report involved a qualitative examination of the context of internet
use in remote Sarawak, in order to better understand internet use in relation to other resources
and capacities. Because the region where the research took place has not been included in
national-level surveys, we also administered a face-to-face survey in 11 villages in order to
generate basic data on internet access and use.
This research was conducted as part of the Cultural Enterprise Through Mobile Media Project, and
took place between 2015 and 2017. The broader project aimed to ascertain whether the use of
mobile media technologies and the internet can lead to sustainable cultural enterprise in remote
villages in Sarawak. Because digital inclusion is a precondition of sustainable online enterprise, this
report focuses primarily on how this inclusion might be achieved.
Key Findings
Almost two thirds of study participants were not using the internet. Connectivity appears
to be the main barrier for many non-users. A small number of people cannot afford to use
the internet, despite the availability of low-cost mobile devices and payment plans.
People used the internet more often when they were in a city or town where mobile
broadband was available.
Of those participants who were internet users, the majority (84 per cent) accessed the
internet using their own mobile device and data.
The majority of participants (82 per cent), including those who did not use the internet,
owned a mobile phone or smartphone. Almost one third of participants owned both types
of device. However, ownership of non-smartphones does not necessarily indicate non-use
of the internet. People select devices based on quality of available service.
Older people were more likely to face digital exclusion.
The most popular uses of ICTs were messaging applications (apps) and participation in
social media platforms. The most popular apps were those that allowed people to
communicate intermittently when in areas with coverage. These apps were used to keep in
touch with family and friends, and also to coordinate transport and for trade purposes.
Acknowledgements
This project was carried out by researchers at Swinburne University of Technology in Kuching,
Sarawak (Malaysia), and in Melbourne, Victoria (Australia), with funding provided by both
campuses (Malaysia and Australia). The Melbourne-based project team included Dr Christine Horn,
Associate Professor Ellie Rennie, Professor Sandy Gifford, and Dr Rowan Wilken (who was involved
in the early phase of the project). The Sarawak-based project team included Mr Gregory Wee Lik
Hoo, Mr Wilson Moses Suai, Ms Raine Melissa Riman, Dr Anthony Cahalan (who was also involved
only in the project’s early stages), and Mr Simpson Njock Lenjau. Thanks to Mr Matthew Farrugia
and Ms Liss Ralston for their statistical assistance, and to research assistants Ms Patricia Nayoi, Ms
Aurelia Liu Mei Ying, and Ms Adeline Lusat. We would like to acknowledge the contributions of the
ketua kampung and people in Long San, Long Silat, Long Mekaba, Long Jeeh, Long Moh, Long
Sela’an, Long Semiang, Long Tungan, Lio Mato and Long Banga, and other villages we visited. Ethics
approval was granted by the Swinburne University Human Research Ethics Committee.

3
Part I: Background
1.1 Rural ICT in Malaysia
The Malaysian Multimedia and Communications Commission (MCMC) publishes regular figures on
Malaysia’s progress in regard to internet and mobile phone connectivity (MCMC, 2015a, 2015b,
2016b), as does the Pew Research Center (Wike & Oates, 2014), Groupe Spéciale Mobile
Association (GSMA) (GSMA, 2013), and the International Telecommunication Union (ITU, 2013).
The figures released by these organisations are encouraging. For example, MCMC reports a
national broadband penetration rate of 77.9 per cent in the third quarter of 2016, with 141.6
mobile phone subscriptions per 100 inhabitants (MCMC, 2016b). Mobile internet use is particularly
high, with 89.3 per cent of internet users going online via their smartphone, and 87.3 per cent of
internet users accessing the internet through mobile broadband in 2015 (MCMC, 2016a).
However, as researchers in the field have noted, these figures mask wide differences between
Malaysia’s urban centres and the country’s rural and remote areas (Gill, Talib, Khong, &
Kunasekaran, 2015; Hashim et al, 2011; Mohamed et al, 2012; Salman et al, 2011). The ways in
which data on internet and ICT use is collected and reported needs to be taken into account when
reading digital inclusion reports. Researchers from the Pew Research Center, for example, note
that 7 per cent of Malaysia’s population lives in hard-to-access areas, and this cohort is excluded
from the sample population for internet research in this country (Wike & Oates, 2014). MCMC
approaches sampling by selecting randomised participants through the Mobile Station
International Subscriber Directory Number (MSISDN) system (MCMC, 2016a). This approach is
useful because it does not rely on landline telephones, which are not commonly used in remote
areas. However, this sampling method only includes participants who own a mobile phone and are
located in an area with access. The most excluded are therefore not counted.
Compared with neighbouring countries, Malaysia has done much to improve internet and
telecommunications availability, starting with the transition from a single state-owned
telecommunications provider to a competitive telecommunications market in the late 1980s to
early 1990s (Salazar, 2007). In 2002, the Federal Government implemented a Universal Service
Provision (USP) policy, intended to provide marginalised groups with at least a basic level of
service. Under this policy, commercial telecommunications providers are required to pay 6 per cent
of their profits annually into a dedicated fund, overseen by Malaysia’s Communication and
Multimedia Commission (MCMC) (GSMA, 2013). Telecommunications providers may then submit
tenders to access the funds, on the basis that the money will be used to provide services to
underserved areas. MCMC’s USP policies have led to several programs under which rural and
remote areas are supplied with basic services, including free Village Wi-Fi, internet centres,
netbooks for students, femtocells (small cellular base stations), and Very Small Aperture Terminal
(VSAT) telecommunications systems and payphones. MCMC considers an area to be “remote” if it
has a population density of 80 persons per square kilometre or less1 (MCMC, 2014).
1 For this project, communities were considered to be “remote” if they were more than four hours’ drive from a city, and also lacked infrastructure such as tar-sealed roads, grid electricity, and treated water. All the villages included in this study fell into this category.

4
While Malaysia’s adoption of USP programs has produced benefits for many towns and villages,
others have missed out. Several elements of the policy appear to be contributing to this
unevenness. Firstly, local politicians in Sarawak told us they were expected to put a proposal
forward in order for their locality to be considered for telecommunications infrastructure. This
approach relies not only on village headmen lobbying local MPs to submit proposals, but also on
these individuals having the knowledge to request services and prioritise them against other
infrastructure needs. Our assessment is that this process could also potentially politicise
infrastructure provision. Secondly, while the USP includes a commitment to build towers, which
are then made available to telecommunication providers to install services, some villages seem to
be receiving the towers but not the necessary cell equipment (or at least not in a timely manner),
which creates false expectations amongst village residents. Thirdly, while some providers have
established small cell services (using satellite backhaul), some of them have fallen into disrepair.
We were unable to ascertain from MCMC which of these services were funded from USP funds,
and which were installed at the companies’ own initiative. Moreover, we were unable to obtain
clear information on whether maintenance obligations were attached to these services.
In 2016, the late former Chief Minister of Sarawak urged MCMC to address the rural–urban digital
divide, noting that many rural and remote areas still lacked access to communication infrastructure
and the internet, and pointing to the existence of non-functioning telecommunications towers due
to installation and servicing faults (Ling, 2016). Sarawak’s current Chief Minister recently
announced an ambitious push for improved communications, initiating the formation of the
Sarawak Multimedia Authority (SMA), the Sarawak Digital Economy Corporation (SDEC), and the
Development Bank of Sarawak (DBOS), along with a strategic plan to develop digital economy
initiatives. The State Government has pledged to invest US$254 million (RM1 billion) to improve
Sarawak’s connectivity infrastructure in both urban and rural areas (Singh, 2017), and launched its
Sarawak Digital Economy Strategy (SDES) plan in December 2017. The research presented in this
report took place prior to these strategies being implemented, yet remains relevant to these policy
aims insofar as it identifies current uses and potential benefits.
1.2 Fieldwork Area
Our fieldwork took place in Sarawak’s fourth division (see Figure 1, overleaf). The largest city in the
region is Miri, with a population of about 300,000 inhabitants, according to Malaysia’s 2010 census
(DOSM, 2011). Regional government offices, hospitals, and other facilities are all located in Miri.
The city also provides employment for the surrounding region, including offshore work in the oil
and gas industry, and jobs in hospitality, construction, and many other sectors. Marudi and Long
Lama are smaller towns in the region.
The government district office is located in Marudi, with a sub-district office in Long Lama. Marudi
and Long Lama have grid electricity, are linked to Miri by a sealed road, and have good digital
infrastructure and mobile coverage from Malaysia’s three main service providers: Celcom, Digi, and
Maxis. Another small town in the region is Lapok, located on the main road near the bridge
crossing the Tinjar River. At the time of our research, Lapok had access to mobile phone networks,
but lacked access to treated water or grid electricity.

5
Figure 1: Fieldwork area: remote villages and key infrastructure, Sarawak
From Lapok onwards, the roads to the remote villages are unsealed. Many of these roads are built
and maintained by companies working in local logging concessions, and oil palm or pulp and paper
plantations in the region. The roads are dangerous during adverse weather such as rain, fog, or
extended dry periods, and are shared with heavy logging trucks and other industrial vehicles (see
Figure 2, below). Plane access is via small airports located in Long San and Long Banga. Flights from
Miri and Marudi to these two villages are scheduled several times a week.
Figure 2: Logging road in remote Sarawak

6
Most of the people in in these villages identify as Kenyah, one among several Indigenous groups
collectively known as Orang Ulu. The term “Orang Ulu” means “people from upriver” in Bahasa
Malaysia, the national language, and refers to groups who have traditionally lived in the upper
reaches of the area’s large river systems. Villages are mostly distributed along waterways, which
were once the main means of transport. Many villages maintain their traditional longhouse
structure, and are built near the river bank. While some villages still have wooden longhouses,
many have built brick-and-mortar longhouses, while in other settlements people live in several
smaller longhouses or individual homes within the village area (see Figure 3, below).
Figure 3: Village longhouse
Most Kenyah traditionally practiced subsistence agriculture, with rice as the main crop, and also
cultivate cash crops, along with fishing and hunting for food. As discussed in Section 2.2 of this
report (page 14), many people in the villages told us they still practiced agriculture, but also
engaged in a variety of other economic activities, as there are few local employment options
available. In most of the villages included in our research, many younger people had migrated to
the city to find work, and only returned to the village during holidays or on special occasions.

7
1.3 Research methods
This report presents qualitative and quantitative data that was collected using a mix of methods,
including a face-to-face survey, in-depth interviews, group discussions, and observation. Data was
collected during multiple visits to each community. Smaller villages were visited once or twice,
while larger villages were visited on multiple occasions to collect observations and conduct in-
depth interviews. The data collection strategy for our survey involved field visits of between two to
five days to each village, during which the investigators and a team of local research assistants
gathered information using a range of methods. The team also took photographs of the types of
ICT infrastructure in each village, and held informal discussions about the infrastructure and
services located there.
With no available information on village population sizes or distribution across the area, and no
maps of the villages commercially available, the researchers used a convenience sampling
approach, trying to survey all residents who were present in the village when they visited. After
arriving in each village, researchers held a communal introduction, led by the headman, to inform
villagers about the research and explain their presence in the community. The researchers and
local research assistants then conducted surveys throughout the day, and in particular during
evenings, when people came back from their daily activities (see Figure 4, below). After completing
the survey, each participant was given a RM5 mobile phone recharge voucher. The survey took
between 10 and 30 minutes, and was conducted in the participant’s preferred language – either
Bahasa Malaysia, one of the Kenyah dialects, or English. The researchers surveyed a total of 331
individuals across 11 villages.
Figure 4: Young people learning about the project
The research team administering the survey included people with local knowledge in order to
ensure that questions were relevant to participants’ experiences. For example, some participants
were unsure about the difference between mobile phones and smartphones, until one person
explained: “The smartphone is the one where you swipe your finger, like when you are putting lime
on a daun sireh.” Many people in the region consume areca nut, known as pinang, with daun sireh

8
(betel leaf), a locally grown leaf from a vine of the Piperaceae family. They coat the leaf in calcium
hydroxide, or slaked lime, which is sold as a white paste. People cut off a chunk of the nut, smear
the lime on the leaf with a forefinger, wrap the nut in the lime-covered leaf, and chew the bundle.
This is a mild stimulant. This explanation for the difference between mobile phones and
smartphones was useful for participants, and in particular helped the older people distinguish
between the two types of device.
The research also included in-depth interviews with people in the villages. Participants included
headmen and headwomen (Ketua Kampung). We also explained our research to the region’s
Temenggong (regional leader and community representative) in order to seek approval. Our
interviewees included two state assemblymen from the region, along with local shop owners and
transport providers, local teachers, and staff in the medical clinic. We also interviewed men and
women from the villages, most of whom worked locally as subsistence farmers or held other
community roles, for example as school janitors or security. Other participants included a range of
people present in the village when we visited, including housewives, off-shore workers visiting
home, students, and people with a range of other occupations.
The researchers employed local research assistants from the field sites who spoke the local
languages and were familiar with the region (see Figure 5, below). The surveys were administered
on iPads using Qualtrics, a data collection application, and local research assistants were trained in
how to administer the survey (see Figure 6, overleaf). Analysis was carried out using SPSS, a
software program for statistical analysis. The qualitative interviews were audio recorded and fully
transcribed. Some interviews were conducted in English, where this was the participant’s first
choice of language. Most, however, were conducted in Bahasa Malaysia, and a few were carried
out in the local Kenyah dialects. All interviews were translated and transcribed into English, then
thematically coded using NVIVO, a qualitative data analysis software.
Figure 5: Village residents taking part in the survey

9
Figure 6: Using iPads to conduct surveys
1.4 Participant Demographics
Most of the people living in the region where our study was conducted identify as Kenyah. Of the
331 survey participants, more than two thirds (68 per cent) said they were Kenyah. This included
several subgroups, such as Sebup, Lepo’ Keh, Lepo’ Anan, Lepo’ Agak, Lepo’ Tau, Lepo’ Ngkau,
Lepo’ Jengan, Kenyah Tepuan, Morek, Jamuk, and Badeng. The other participants identified as
Iban, Bidayuh, Kayan, Malay, Kelabit, Penan, or Chinese. Some participants (17 per cent) said they
did not belong to any single group, but had a mixed heritage. Some participants had lived in the
area their whole lives, while others said they had moved to the villages to work as teachers or
government servants, or were married to locals (see Table 1, below).
Table 1: Ethnicity*
Ethnic background of respondent n (%)
Kenyah (Please specify) 224 (68%)
Others, or mixed (Please specify) 56 (17%)
Iban 15 (5%)
Bidayuh 11 (3%)
Malay 9 (3%)
Penan 8 (2%)
Kayan (Please specify) 6 (2%)
Chinese 2 (1%)
Total n=331 (100%)
*Due to rounding, some totals may not correspond with the sum of the separate figures.
More women than men took part in the survey. In total, 187 respondents (or 56 per cent) were
women, and 145 respondents (or 44 per cent) were men. This may reflect the fact that some men
move to the city temporarily to look for work, but may also reflect men’s absence from the village
for other task-related reasons. Participants’ ages ranged from 15 years to 82 years. The median age
was 44 years (see Table 2, overleaf).
10
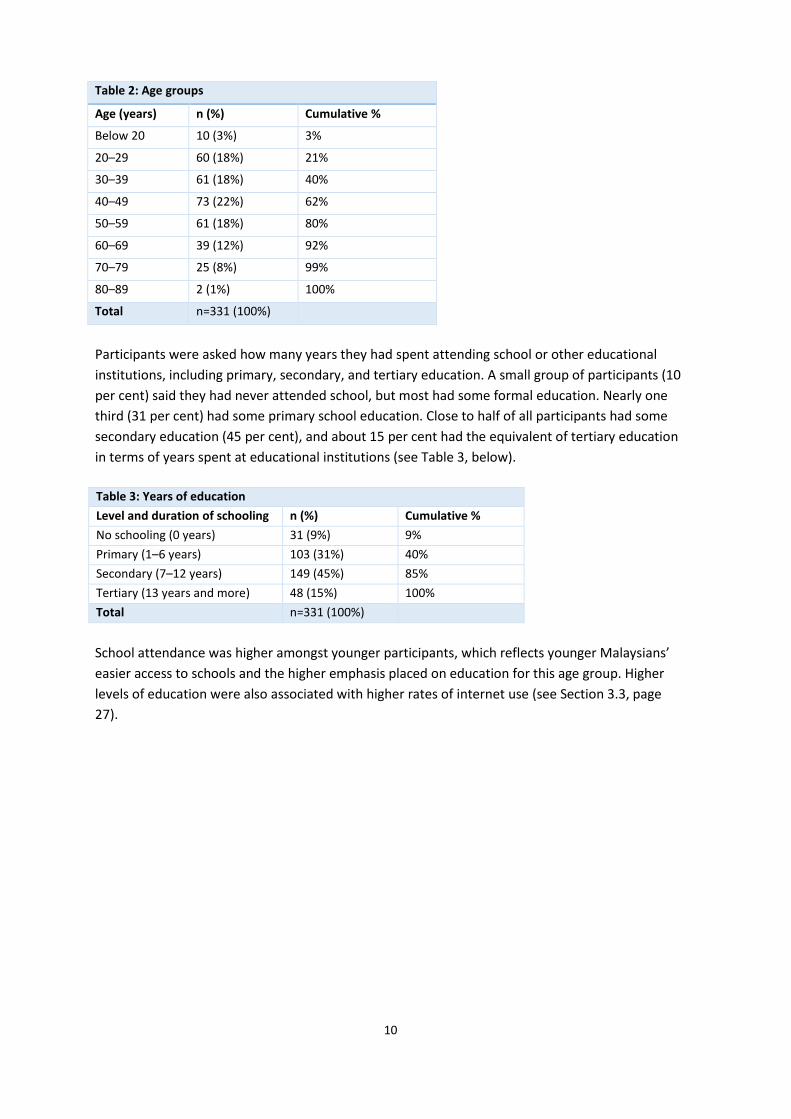
Table 2: Age groups
Age (years) n (%) Cumulative %
Below 20 10 (3%) 3%
20–29 60 (18%) 21%
30–39 61 (18%) 40%
40–49 73 (22%) 62%
50–59 61 (18%) 80%
60–69 39 (12%) 92%
70–79 25 (8%) 99%
80–89 2 (1%) 100%
Total n=331 (100%)
Participants were asked how many years they had spent attending school or other educational
institutions, including primary, secondary, and tertiary education. A small group of participants (10
per cent) said they had never attended school, but most had some formal education. Nearly one
third (31 per cent) had some primary school education. Close to half of all participants had some
secondary education (45 per cent), and about 15 per cent had the equivalent of tertiary education
in terms of years spent at educational institutions (see Table 3, below).
Table 3: Years of education
Level and duration of schooling n (%) Cumulative %
No schooling (0 years) 31 (9%) 9%
Primary (1–6 years) 103 (31%) 40%
Secondary (7–12 years) 149 (45%) 85%
Tertiary (13 years and more) 48 (15%) 100%
Total n=331 (100%)
School attendance was higher amongst younger participants, which reflects younger Malaysians’
easier access to schools and the higher emphasis placed on education for this age group. Higher
levels of education were also associated with higher rates of internet use (see Section 3.3, page
27).
11
Part II: Infrastructure and Capacities
2.1 Infrastructure
The 11 villages included in this research were Long Loyang, Long Sobeng, and Long Aton (on the
Tinjar River, a tributary of the Baram River); Long Moh, Long Semiang, Long Sela’an, Long Tungan,
and Lio Mato (on the main Baram River); and Long Banga, Long Beruang, and Long Peluan (in the
headwaters of the Baram River) (see Figure 1, page 5). Four of these 11 villages had no ICT
infrastructure: Long Moh, Long Loyang, Long Sobeng, and Long Aton. After our fieldwork was
completed, new telecommunications towers were installed in Long Aton and Long Sobeng (see
Table 4, below).
Table 4: Publicly accessible infrastructure
No. Village name Infrastructure at time of research
1 Long Moh None
2 Long Semiang Small cell tower, only working in the evening (mobile phone & mobile internet)
3 Long Sela’an Small cell tower, fully working
4 Long Tungan Small cell tower, only working in the evening (mobile phone & mobile internet)
5 Lio Mato Small cell tower, working (mobile phone & mobile internet)
6 Long Banga Full mobile phone tower, but usually without mobile internet (3G only)
7 Long Beruang Full mobile phone tower, but usually without mobile internet (3G only), Program
Pusat Internet 1Malaysia (internet centre)
8 Long Peluan Full mobile phone tower, but usually without mobile internet (3G only)
9 Long Aton None during fieldwork; tower installed after our research concluded
10 Long Sobeng None during fieldwork; tower installed after our research concluded
11 Long Loyang None during fieldwork; Kampung Tanpa Wayar (Village Wi-Fi) not working since
2013
ICT connectivity
While seven out of the 11 villages had some ICT infrastructure, there were persistent issues with
connectivity. For example, participants in one village said they had a Kampung Tanpa Wayar
(Village Wi-Fi), provided by MCMC, but it broke during flooding in 2013 and was never repaired
(see Figure 7, overleaf). Since that time the village had not had any ICT access, and to make phone
calls villagers had to cross the river by boat, then walk or drive several kilometres to the nearest
accessible area with mobile phone connectivity. In another village, the Village Wi-Fi was accessible
only in the evening during good weather, and only in one small area in the village, where chairs and
benches had been set up for users to check messages. In several villages the mobile phone
infrastructure had broken down, and in two villages, mobile phone connectivity was only available
during the evenings, and only within a 150-meter radius (see Figure 8, overleaf).
In four villages, the school and the medical clinic were the only places with internet access, and it
was only available for school and clinic staff, who used Wi-Fi to submit reports and access
professional online platforms. However, school teachers and clinic staff explained that the
connection was often slow, and some teachers said that they had to travel to Miri to submit
students’ reports. As one rural headmaster said:

12
“[Teachers have to submit reports on issues] like the attendance of the students,
we have to send in before 9[am], for every morning. This is [done] throughout
the nation, the attendance, that’s the most important thing. Of course there is a
monthly written [report] to the Ministry also… Sometimes the teachers have to
work hard and find time whenever they are free [to send the report]. If they
couldn’t make it on time, they have to come back again, and send it again… But
if the weather changes already, then what to do? Maybe we’ll send it later, or
send it after 9am… The best thing to do is to come at midnight [to send your
data]. No traffic, less traffic. Come at midnight.”
Figure 7: Kampung Tanpa Wayar (Village Wi-Fi)
Figure 8: Cell “tower” (mobile phone infrastructure) in Long Tungan
The Wi-Fi in schools and medical clinics was password protected, and staff kept the password
secret to ensure they could use the internet for work. While teachers and clinic staff were reluctant
to share Wi-Fi access, they sometimes sent messages out in emergency situations, becoming the
de facto emergency contacts for people in the village.

13
In the four villages where no ICT infrastructure was available at all, people relied on the local-
language radio station to receive information from the outside world. For example, when visitors
from the city planned to travel to the village, they called the radio station first to send an on-air
message to their family. As one participant explained:
“I have to call the radio station. Sometimes I can’t get through. When I get
through, I say: I will come up on Saturday to this village. Please send a boat to
this place to pick me [up]. Then I hope that they are listening to the radio, so
that someone will come to find me.”
In villages with small cell towers, access to mobile phone networks was available, but was subject
to frequent interruptions. Villagers reported that the towers were often struck by lightning, and it
could take weeks for them to be fixed. Even when the towers were functional, the quality of the
connection was often patchy, according to one participant:
“It’s hard that communication is an issue here. We could do everything if
communications were easier. Easier to keep contacts. For instance, yesterday I
wanted to contact my children. I want to use Maxis [a local mobile phone
service provider], but I have to wait for the connection to be stable, then only I
can call out. It’s because it was raining yesterday. Also if it’s cloudy the
connection is lost. If the weather is good, on a nice day, the line is better.”
Our survey included a section for participants to give comments or feedback. In this section, 211
participants left comments, mostly related to ICT connectivity in their village; 177 participants (84
per cent) requested upgrades for existing mobile phone towers, the installation of towers, or
internet infrastructure such as Village Wi-Fi or internet centres. Comments included the following:
“The internet service needs to be improved, especially in the remote areas, as
there are many jobs that need [people to go] online.”
“Internet and telephone lines are needed to connect with the outside world.”
“It is hard for us to not have telephone coverage. If there [was] any it would be
much easier and make our life a bit better.”
“I want to have a phone line to make it easier to call my children. Just waiting
for [local-language service on] the radio alone is very hard.”
“Network connection is very much needed in this village. Depending on the
school Wi-Fi alone is not helping. Also, it will disturb the teachers’ work.”
“Please provide us in the village [with] the communication tower so we can
communicate with family members and to share news, be it good or bad.”
These responses suggest study participants in villages with no connectivity felt isolated and left
behind. Even in villages with mobile phone access, problems often persisted. Responses included:
“Stable, faster and wider coverage needed. Phone call and internet
communication is a necessity nowadays.”
14
“[Connectivity] here is not good enough. How many months already no line, only
[between] 5pm–9am only.”
Similar comments on service quality and reliability were the most common type of feedback here.
2.2 Livelihoods and Capacities
Understanding digital inclusion requires thinking through the kinds of choices people face when
deciding to access the internet, as well the contextual factors that influence whether they are able
to pursue the opportunities on offer. Agency and structure are central to this approach (Donner,
2015; Kleine, 2011). Our research set out to understand digital inequalities and repertoires in
contexts where internet access was extremely limited, but also in relation to people’s capacity to
take advantage of online opportunities given other resource constraints.
Traditionally, the main livelihood of people in the Baram region was subsistence farming,
supplemented by hunting and fishing (Metcalf, 1974; Ngau, 1966). Many people still plant rice,
while also cultivating cash crops and undertaking other income-generating activities. Some people
follow entrepreneurial strategies to generate income, or find salaried positions where available.
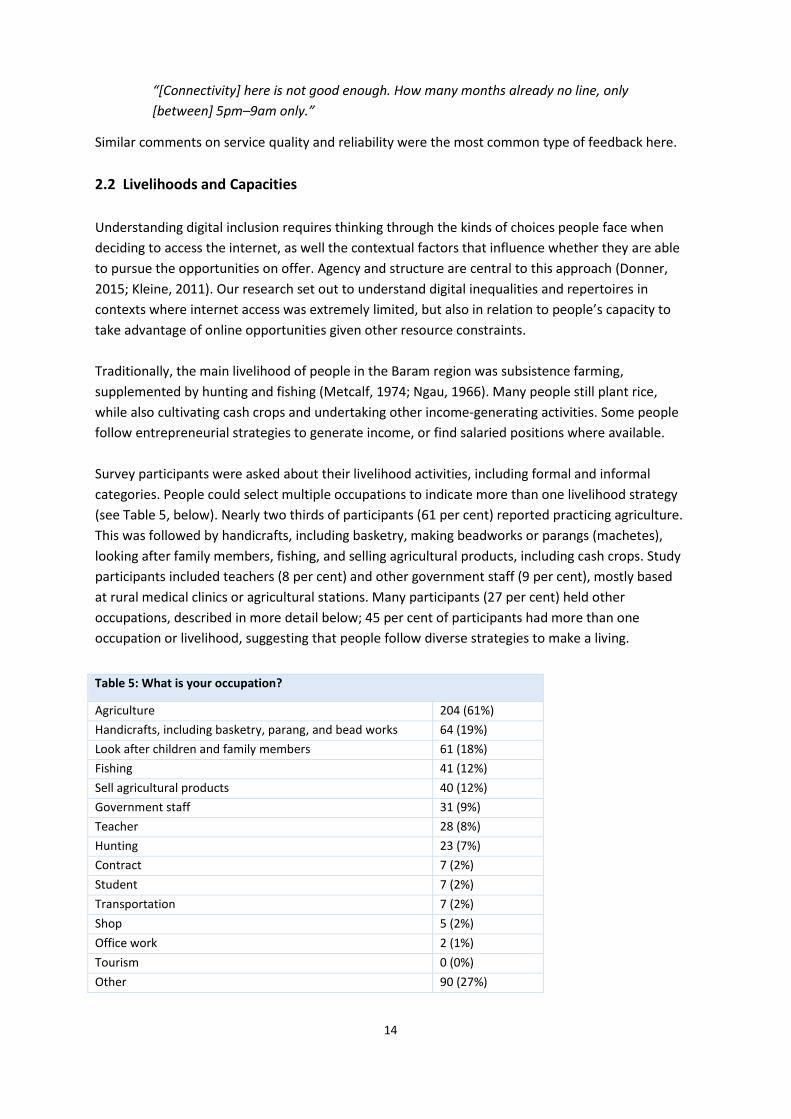
Survey participants were asked about their livelihood activities, including formal and informal
categories. People could select multiple occupations to indicate more than one livelihood strategy
(see Table 5, below). Nearly two thirds of participants (61 per cent) reported practicing agriculture.
This was followed by handicrafts, including basketry, making beadworks or parangs (machetes),
looking after family members, fishing, and selling agricultural products, including cash crops. Study
participants included teachers (8 per cent) and other government staff (9 per cent), mostly based
at rural medical clinics or agricultural stations. Many participants (27 per cent) held other
occupations, described in more detail below; 45 per cent of participants had more than one
occupation or livelihood, suggesting that people follow diverse strategies to make a living.
Table 5: What is your occupation?
Agriculture 204 (61%)
Handicrafts, including basketry, parang, and bead works 64 (19%)
Look after children and family members 61 (18%)
Fishing 41 (12%)
Sell agricultural products 40 (12%)
Government staff 31 (9%)
Teacher 28 (8%)
Hunting 23 (7%)
Contract 7 (2%)
Student 7 (2%)
Transportation 7 (2%)
Shop 5 (2%)
Office work 2 (1%)
Tourism 0 (0%)
Other 90 (27%)

15
The high number of participants practicing agriculture or fishing, or producing handicrafts, reflects
the traditional lifestyle of people in the region, but also suggests that few other types of livelihood
are available. This suggestion was backed up by the number of people who noted their occupation
as “Other”, which included oil palm plantation and offshore work, school security or cleaner or
auxiliary work, rearing livestock, and a small-time entrepreneur selling cakes. The “Office work”
category included only two participants, and no participants worked in tourism-related roles.
Mobility and place of residence
Most survey participants were full-time residents in their village. The remainder either lived both in
the village and elsewhere, or had a different place of residence. Among those living elsewhere,
some were based in a city, some lived mainly in their farmhouse located outside the village, some
lived or worked in another village, and some resided at a boarding school (see Table 6, below).
Table 6: Main place of residence
Where do you mostly live? n (%)
I live mostly in the village 277 (84%)
I mostly live elsewhere 8 (2%)
Not sure, or other (please specify) 4 (1%)
I live both in the village and elsewhere 42 (13%)
Total n=331 (100%)
This suggests that our study participants were mostly full-time residents in their village. If their
village had no ICT access, this meant they were unable to access the internet at all, since the village
was their main place of residence. This was supported by data about how often study participants
travelled to a bigger town or city: a high proportion (44 per cent) only travelled to a town or city a
few times a year, while others travelled to the city less frequently. Only a small number travelled
every week (5 per cent), or several times a month (9 per cent) (see Table 7, below).
Table 7: Frequency of participants’ travel to a town or city
How often do you travel to town/city? n (%)
Every week 15 (5%)
Few times every month 28 (9%)
Few times a year 147 (44%)
Once a month 50 (15%)
Very rarely 91 (28%)
Total n=331 (100%)
*Due to rounding, some totals may not correspond with the sum of the separate figures.
Very few services were available in our fieldwork sites. People had to visit a larger city if they
needed to visit a bank, shop for most goods, attend government offices, see a healthcare specialist,
and many other activities. For most remote villagers the trip was expensive, with no public
transport available, and took many hours. Few residents owned a car. A one-way trip from Long
San to Miri cost RM80, and this price rose for more remote villages such as Long Jeeh, Long
Mekaba, or Lio Mato. A one-way trip from Lio Mato cost RM150. This was expensive for people
who mainly practice subsistence farming and have few other means of earning income. As one
participant explained:

16
“If I want to go to the city to go to the bank, first I have to pay to go down. Then
I have to stay overnight, if I can’t come back straight away. Then I also have to
buy food there. It is very expensive to go, and I don’t go often.”
Government benefits
Many rural and remote villages in Sarawak have high levels of disadvantage, despite the fact that
promoting rural development is high on the government’s agenda (Mohamed & Xavier, 2015).
Opportunities to generate income are few, and many people experience poverty (Martin, Boily, &
Lariviere, 2015). Among our survey participants, 61 per cent received support through one of
several government benefit and welfare schemes (see Table 8, below). Respondents could indicate
more than one kind of support.
Table 8: Government benefits
Type of benefit(s) received n (%)
No, I don’t receive government benefits 125 (39%)
BR1M 140 (44%)
Child benefit 10 (3%)
Aged benefit 3 (1%)
Handicapped benefit 2 (1%)
Poverty assistance 1 (0.3%)
Others 24 (8%)
Not sure 12 (4%)
One third of participants received BR1M, or Bantuan Rakyat 1Malaysia. This is a scheme through
which all Malaysians with an individual income below RM2000, or a household income of below
RM4000, receive an annual payment (Borneo Post Online, 2017). Several study participants who
lived in a village without mobile phone or internet access said it was difficult to apply for BR1M,
because signing up for the scheme required travel to the city, and the trip itself cost more than the
money paid out in benefits. One participant said many people in his village did not find it
worthwhile to apply:
“[Those people who applied for it] had fill in the forms, for the BR1M back then
to receive it for the second time...had to inform again. [It was necessary to] re-
do the steps needed once again. Some had contacted [the office to ask], “How
can we go there? How can we keep going back and forth to fill in the forms each
time? The payments are not sufficient to keep going back and forth like that”…
In 2013, I received RM400 only. They gave it. Then I needed to fill in the form
again. They instructed to, what was it, re-inform them once again. So that
they’ll know that we’re still alive, that’s what they’ve been saying. Need to re-
inform. If not, then we’ll no longer be receiving it.”
Many Malysian government websites offer online information and portals for digital transactions
(Ghani, Said, & Nasir, 2012). However, due to a lack of internet access, these websites are often
unavailable to people living in remote areas. Further, only 238 of our study participants (or 72 per
cent), said they had a bank account, while 92 participants (or 28 per cent) said they did not.

17
Part III: ICT Practices
3.1 Devices
Study participants were asked about the kinds of devices they owned, including mobile phones,
smartphones, laptop computers, desktop computers, and tablets.
The most popular device category was mobile phones, closely followed by smartphones. Many
participants owned both types of device (31 per cent). Only a minority of participants (18 per cent)
did not own either a smartphone or a mobile phone (see Table 9, below). It is important to note
that while more than half of participants owned a smartphone, almost two thirds of total
participants said they did not use the internet at the time of the survey (see Section 3.3, page 27).
While the high number of (non-internet-enabled) mobile phones – a device type owned by more
than half of participants – could suggest low levels of digital literacy, there are other explanations
for this. Of those people who owned only mobile phones, many reported that they preferred
mobile phones because they were better at picking up reception in areas of low connectivity.
Table 9: Only mobile phone, only smartphone, or both?*
Type of mobile device owned n (%)
Only mobile phone 89 (27%)
Only smartphone 82 (25%)
Both mobile phone and smartphone 102 (31%)
None 58 (18%)
Total n=331 (100%)
*Due to rounding, some totals may not correspond with the sum of the separate figures.
Some participants owned more than one device because they wanted to use multiple SIM cards to
access different networks, or to take advantage of cheap calls to friends using the same provider.
We therefore conclude that the high proportion of non-internet-enabled mobile phones is an
indicator of “making do”, as opposed to lack of digital ability, and could even be construed as
technological savviness.
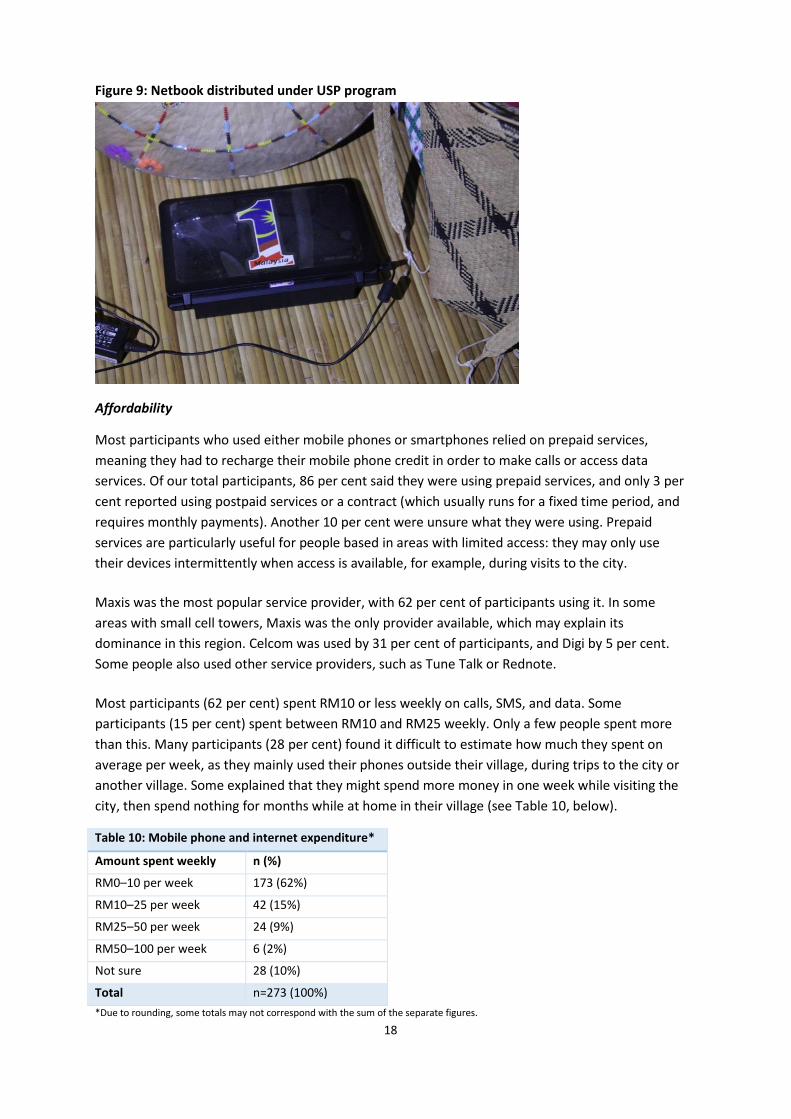
Of our total 331 participants, 22 per cent owned a laptop computer (Figure 9, overleaf). Other
devices were less popular. Only 4.5 per cent of participants owned desktop computers. Most likely,
this is because desktop computers require stable electricity. Only 13 per cent owned a tablet.
Three quarters of the people who said they owned neither a smartphone nor a mobile phone lived
in villages without mobile phone access. Of the 58 participants who owned neither a smartphone
nor a mobile phone, 38 people (or 65.5 per cent) were female, and 20 people (or 34.5 per cent)
were male.
18
Figure 9: Netbook distributed under USP program
Affordability
Most participants who used either mobile phones or smartphones relied on prepaid services,
meaning they had to recharge their mobile phone credit in order to make calls or access data
services. Of our total participants, 86 per cent said they were using prepaid services, and only 3 per
cent reported using postpaid services or a contract (which usually runs for a fixed time period, and
requires monthly payments). Another 10 per cent were unsure what they were using. Prepaid
services are particularly useful for people based in areas with limited access: they may only use
their devices intermittently when access is available, for example, during visits to the city.
Maxis was the most popular service provider, with 62 per cent of participants using it. In some
areas with small cell towers, Maxis was the only provider available, which may explain its
dominance in this region. Celcom was used by 31 per cent of participants, and Digi by 5 per cent.
Some people also used other service providers, such as Tune Talk or Rednote.
Most participants (62 per cent) spent RM10 or less weekly on calls, SMS, and data. Some
participants (15 per cent) spent between RM10 and RM25 weekly. Only a few people spent more
than this. Many participants (28 per cent) found it difficult to estimate how much they spent on
average per week, as they mainly used their phones outside their village, during trips to the city or
another village. Some explained that they might spend more money in one week while visiting the
city, then spend nothing for months while at home in their village (see Table 10, below).
Table 10: Mobile phone and internet expenditure*
Amount spent weekly n (%)
RM0–10 per week 173 (62%)
RM10–25 per week 42 (15%)
RM25–50 per week 24 (9%)
RM50–100 per week 6 (2%)
Not sure 28 (10%)
Total n=273 (100%)
*Due to rounding, some totals may not correspond with the sum of the separate figures.

19
People in remote villages faced higher prices, because recharge cards were sold in the villages at a
higher price than in the city. In the village most goods cost more, as they must be brought in by car.
A recharge card sold for RM10 in the city cost RM12 or RM13 in our fieldwork sites.
The issue of affordability was somewhat unclear in our data. Around 20 per cent of non-users said
they found using the internet too expensive, even though Malaysian mobile phone service
providers offer a variety of cheap options. However, when asked whether they would use the
internet if they had the financial resources to do so, 38 per cent of non-users said they would. This
difference in results may indicate that some people do not necessarily think the internet is
expensive compared to other resources, but that they are still precluded from participating due to
lack of income. The results do suggest that the component of the USP that provides a level of free
data through Village Wi-Fi remains an important strategy for digital inclusion.
Device use
Internet users were asked what they used their device for. The most common use was to make
phone calls (98 per cent), and many used their device to write SMS (89 per cent). This data aligns
with the overall argument that people mainly use digital devices for communication purposes.
Many participants also used other functions not directly related to communication, such as taking
pictures and recording video (87 per cent), or listening to music (86 per cent). Nearly three
quarters of participants used their device to access apps (76 per cent), while over half used their
device to play games (62 per cent) (see Table 11, below).
Table 11: Mobile device uses
Reason for using mobile device n (%)
Make personal calls to friends and family members 116 (98%)
Write SMS 106 (89%)
Take pictures and video 104 (87%)
Listen to music 102 (86%)
Use applications 90 (76%)
Play games 74 (62%)
Others 12 (10%)
Note: n=119 people who reported using the internet at the time of the study.
3.2 Use of the Internet
The survey asked respondents whether they were currently using the internet; 36 per cent (n=119)
said they were using the internet, and 64 per cent said they were not. Questions in this section of
the report were asked only of participants who said they were currently using the internet. Table
12 (overleaf) gives figures for how long study participants had been using the internet.
At the outset, a few participants were unsure exactly what it meant to be using the internet. Most
were aware that they needed to use the internet in order to access a website, but some were
unsure whether using a messaging app like WhatsApp or Facebook Messenger, or the Facebook
platform itself, also constituted use of the internet. Before participants began the survey, the local
research assistants explained these details, but some confusion remained (see Figure 10, overleaf).

20
Table 12: How long have you used the internet?*
Duration of internet use n (%) Cumulative %
Less than a year 9 (8%) 8%
Between 1–2 years 14 (12%) 19%
Between 2–5 years 34 (29%) 48%
Between 6–10 years 30 (25%) 73%
More than 10 years 31 (26%) 99%
Not sure 1 (1%) 100%
Total n=119 (100%)
*Due to rounding, some totals may not correspond with the sum of the separate figures.
Figure 10: Chatting to a village resident
Frequency of use and sites of use
To gauge the frequency with which people used the internet, we first asked participants how often
they used the internet within their village (for villages with internet access), followed by how often
they used the internet in the city, or in an area where a good connection was available. Most
internet users said they used the internet daily in the village (where internet access was available),
but this figure rose by nearly 20 per cent when participants had good access.
A small number of current users said they never used the internet in the village, but everyone who
reporting having used the internet at all said they did so when visiting the city, at least occasionally.
These figures suggest that a lack of connectivity presented the main obstacle to using the internet
when people were in their village (see Table 13, overleaf).

21
Table 13: Frequency of internet use*
How often internet used
How often do you use
internet in the village?
How often do you use internet in the
city or elsewhere with good access?
Daily 82 (69%) 105 (88%)
2–3 times a week 14 (12%) 7 (6%)
Once a week 3 (3%) 0 (0%)
2–3 times a month 3 (3%) 1 (1%)
Once a month 2 (2%) 2 (1%)
Less than once a month 1 (1%) 4 (3%)
Never, or no connection 14 (12%) 0 (0%)
Total n=119 (100%) n=119 (100%)
*Due to rounding, some totals may not correspond with the sum of the separate figures.
Study participants were asked how they accessed the internet in their village, and were given
several possible responses, including “mobile internet”, “free Wi-Fi”, “school or educational
institution”, and “internet centre”, even though some of these options were not available in all
villages. Most people used their own mobile data plan to access the internet (see Table 14, below).
Table 14: Types of internet access
How internet accessed n (%)
Mobile internet with your own device 100 (84%)
Free Wi-Fi 57 (48%)
At school or educational institution 54 (45%)
Internet centre 10 (8%)
Note: n=119
The only internet centre available in our research field sites was in Long Beruang. Only two villages
had Village Wi-Fi: Long San and Long Loyang. However, the Wi-Fi in Long Loyang had not been
functional since flooding in 2013, and the Wi-Fi in Long San was frequently not working.
Correspondingly, most participants (84 per cent) said they used their own mobile device to access
the internet. However, since the school Wi-Fi is also free to use, some participants may have given
a positive response to this answer, while also reporting that they used the internet at a school or
educational institution.
Skills
In our survey, participants were asked to self-assess their internet skills. Self-assessment of
internet use is not considered a reliable measure of ability (DiMaggio, Hargittai, Celeste, & Shafer,
2004), but it does provide an indicator of an individual’s confidence in using the internet. Three
categories were given: 1) Using forums and social media; 2) Finding information you are looking
for; and 3) Using software and applications. Five responses were available. Table 15 (overleaf)
displays the results of how participants who used the internet rated their internet skills.

22
Table 15: Internet skills self-assessment*
Self-assessed skill level Using forums and
social media
Finding information
you’re looking for
Using software and
applications
n (%) n (%) n (%)
Excellent (I can do anything) 23 (19%) 24 (20%) 17 (14%)
Quite good 53 (44%) 36 (30%) 43 (36%)
I sometimes struggle 35 (29%) 43 (36%) 44 (37%)
I am not that good 6 (5%) 14 (12%) 13 (11%)
I am not good, or have little
experience
2 (2%) 2 (2%) 2 (2%)
Total n=119 (100%) n=119 (100%) n=119 (100%)
*Due to rounding, some totals may not correspond with the sum of the separate figures.
To understand this data better, we grouped the responses into three categories: Good, Average,
and Low. “Good” included the responses “Excellent” and “Quite good”; the “Average” category
included the response “I sometimes struggle”; and the “Low” category included the responses “I
am not that good” and “I am not good or have little experience”.
The graph below (Figure 11) shows that most participants were quite confident, and thought they
had good skills across the three skill categories. Across those three categories, a higher number of
participants said they were good at using forums and social media, which is a very popular use of
digital devices in this region. Responses for the two other categories were similar to each other.
Note: n=119
One participant explained that he first began using the internet when social networks started to
become popular:
“Since the Facebook first came out…. That one I have to learn how to use it,
Facebook, at first. So maybe I can find my friends up here.”
However, the same participant said his skills in using other kinds of ICT were low, and that he
needed help from others to engage in any more complex practices:
0
10
20
30
40
50
60
70
80
Skills in using forums andsocial media
Skills in finding informationyou are looking for
Skills in using software andapplications
Figure 11: Self-assessed internet skills
Good Average Low

23
“I’m not very good [at finding information]. Only thing I know is that, a friend
WhatsApp me, I see the Facebook. Downloads? I find someone who is good to
do it for me… I try to do that some time, I try to find information for flights,
sometimes I do that, but the rest, I am not that good for it… I can speak English,
I can read, but I don’t know how to use it.”
In cases where people expressed a lack of ability, devices had sometimes been given to them by
relatives who lived in the city. For example, older children gave their parents mobile phones to
enable them to stay in touch. People from the older generation often struggled to use the more
sophisticated devices. As one older man explained:
“I have a smartphone, but I don’t know how to use it. I can read the message, but when I
want to reply I don’t know how.”
Another woman said:
“I have a phone but I can’t use it in the village because we have no access. When
I bring it to the city, I struggle to use it. I had it in my bag one time when it
suddenly rang. I took it out of the bag, but I didn’t know what to do. Which
button to press? I looked at my friend who was with me – she also didn’t know.
So I just put it back in my bag!”
Social networks, apps, and platforms
The survey included questions about popular social networks, applications (apps), and websites or
platforms. Different kinds of social networks, apps, and platforms were listed in order to assess
what types of practices were popular amongst participants (see Figure 12, overleaf).
Amongst internet users the most popular social network, app, or platform was WhatsApp, which
almost everyone in this group used. This finding was in line with comments made about WhatsApp
use during interviews. The second most popular social network, app, or platform was Facebook,
and the third most popular was YouTube. WeChat was also popular. Google Plus was used by 45
per cent of this participant group, and Instagram was used by 39 per cent. Other platforms and
networks such as Twitter or LinkedIn were less popular (see Table 16, below).
Table 16: Social networks, apps, and platforms
App/site/platform n (%)
WhatsApp 112 (94%)
Facebook 107 (90%)
YouTube 90 (76%)
WeChat 77 (65%)
Google Plus 54 (45%)
Instagram 46 (39%)
Twitter 16 (13%)
LinkedIn 3 (3%)
Note: n=119
24
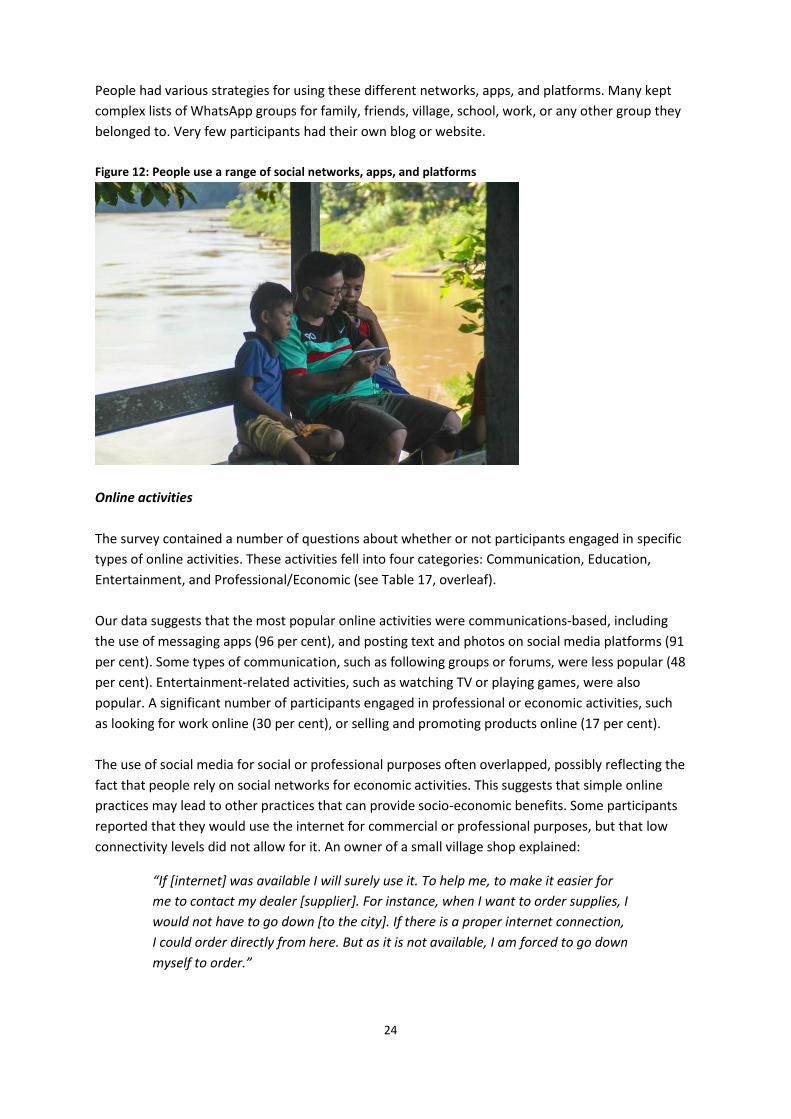
People had various strategies for using these different networks, apps, and platforms. Many kept
complex lists of WhatsApp groups for family, friends, village, school, work, or any other group they
belonged to. Very few participants had their own blog or website.
Figure 12: People use a range of social networks, apps, and platforms
Online activities
The survey contained a number of questions about whether or not participants engaged in specific
types of online activities. These activities fell into four categories: Communication, Education,
Entertainment, and Professional/Economic (see Table 17, overleaf).
Our data suggests that the most popular online activities were communications-based, including
the use of messaging apps (96 per cent), and posting text and photos on social media platforms (91
per cent). Some types of communication, such as following groups or forums, were less popular (48
per cent). Entertainment-related activities, such as watching TV or playing games, were also
popular. A significant number of participants engaged in professional or economic activities, such
as looking for work online (30 per cent), or selling and promoting products online (17 per cent).
The use of social media for social or professional purposes often overlapped, possibly reflecting the
fact that people rely on social networks for economic activities. This suggests that simple online
practices may lead to other practices that can provide socio-economic benefits. Some participants
reported that they would use the internet for commercial or professional purposes, but that low
connectivity levels did not allow for it. An owner of a small village shop explained:
“If [internet] was available I will surely use it. To help me, to make it easier for
me to contact my dealer [supplier]. For instance, when I want to order supplies, I
would not have to go down [to the city]. If there is a proper internet connection,
I could order directly from here. But as it is not available, I am forced to go down
myself to order.”

25
Table 17: Online activities
Activity n (%) Category
Use text-based messaging apps such as WhatsApp, Google
Hangout, or Facebook Messenger
114 (96%) Communication
Post pictures or videos on your social media accounts 108 (91%) Communication
Check social media accounts 106 (89%) Communication
Write texts or posts for your social media account 100 (84%) Communication
Look for information on topics of interest 100 (84%) Education
Watch TV or videos 99 (83%) Entertainment
Downloading music and films 95 (80%) Entertainment
Read the news 90 (76%) Education
Read and send emails 75 (63%) Professional/Economic
Training, tutorials, or learning new skills from YouTube or
other sources
73 (37%) Education
Communicate for work 70 (59%) Professional/Economic
Play games 69 (58%) Entertainment
Read and chat about current social and political issues 69 (58%) Communication
Organise transport 64 (54%) Professional/Economic
Using maps and navigation 59 (50%) Professional/Economic
Chat about language, culture, and traditions with others 59 (50%) Communication
Follow groups and forums to chat 57 (48%) Communication
Make calls using Skype or other apps 47 (40%) Communication
Access e-government sites to pay fines or bills, or look for
information
43 (36%) Professional/Economic
Buy products online 36 (30%) Professional/Economic
Look for work 36 (30%) Professional/Economic
Online banking and financial transactions 36 (30%) Professional/Economic
Sell or promote products online 20 (17%) Professional/Economic
Note: n=119
While the need to communicate was a primary concern for most participants, those who engaged
in entrepreneurial activities also felt that better ICT connectivity could provide them with economic
advantages. Where no connectivity was available, many people commented on the way this
affected their business. Lack of connectivity was particularly difficult for local entrepreneurs who
needed to buy or order supplies from the city, due to the geographical distances and cost of travel.
The villages in our field site were not only remote, but also difficult to access. Logging roads require
4WD transport and are dangerous under certain weather conditions, such as rain, fog, or
prolonged hot and dry weather, all of which are common in the region. Local people rely on private
transport providers who charge passengers per kilogram for transporting goods to and from the
city. This presented an obstacle to socio-economic development within the region, because it
made everyday transactions more difficult, according to one participant:

26
“It’s like this. If I need to order things, say we want to build a house, we need to
order some materials from the store in Miri to be transported here. We have to
order cement, bricks, that’s difficult to do. You can’t order materials. And to go
down to Miri to bring the things up takes time.”
This issue was felt strongly by local entrepreneurs, particularly in areas with no connectivity at all.
However, in areas with relatively reliable mobile phone and mobile internet access, it became clear
that entrepreneurs had learned to use ICT practices for economic purposes. One local transporter
often travelled to the city where access was available, and used this opportunity to sell products
from his village to people in the city:
“I just post to my friends, ”You want to buy fish?”... Sometimes, you post
something [like], ‘I got the wild boar, do you need it? Inbox me.’ That’s how I
promote my products sometimes.”
The sale of wild meat is prohibited, and this practice suggests that even if the use of ICTs brings
new opportunities for entrepreneurship, it could also lead to new issues and challenges, such as
conserving biodiversity. However, people also engage in a range of legal and sustainable socio-
economic activities, including some cottage industry ventures, local crafts, and the sale of cash
crops or locally grown fruit and vegetables.
Another local transporter and entrepreneur used Facebook to sell and promote products made in
the region. His village shop buys craft items from surrounding villages, which he then re-sells to
buyers in the city and elsewhere. His main product is parangs, locally produced machetes made
from a piece of car spring with a carved wooden handle and sheath:
“I sell parangs to people using my Facebook. I put the picture online, and people
can order from me. They buy from West Malaysia and also from overseas. Last
time I posted one to Latin America somewhere… I bring them down to the city
and then package them, and post them by mail.”
Local shops supply basic goods like toothpaste, washing powder, noodles, and other items. Shop
owners often worked as transporters, travelling between their villages and the city, using social
media to coordinate rides and fares for other people. As no specific platforms exist for these
“sharing economies”, generic social media and messaging apps fulfil an important economic
function.
Only 30 per cent of internet users were engaging in online banking. There are various possible
reasons for this: people may not have the necessary identity papers required to establish bank
accounts, or may not earn the kind of income that would justify paying bank fees. Importantly,
there are no cash machines in the region, and digital cash transfers and transactions are unreliable.
We can assume that the cash and barter economy will continue to dominate until digital
infrastructures can support peer-to-peer electronic payments. The low adoption of online banking
is an area that requires further research.

27
Languages
Many people in the region speak multiple languages. Most speak their own Indigenous language or
dialect, as well as Bahasa Malaysia, which is taught at school. Many also speak English, in particular
the older generation who were taught in the English medium at school. These patterns were
reflected in the languages participants used online. Most said they often used Bahasa Malaysia (88
per cent), but over half reported often using their local language or dialect online (57 per cent) (see
Table 18, below).
Table 18: Language used on the internet
Language used Often Sometimes Rarely Never Total
Local language or dialect 68 (57%) 23 (19%) 7 (6%) 21 (18%) n=119 (100%)
English 41 (35%) 31 (26%) 25 (21%) 22 (19%) n=119 (100%)
Bahasa Malaysia 105 (88%) 13 (11%) 1 (1%) 0 (0%) n=119 (100%)
Chinese 0 (0) 5 (4%) 3 (3%) 111 (93%) n=119 (100%)
Few websites are written in local languages, so most online use of these languages occurs in social
media platforms or messaging apps. In practice, people often use a mix of languages, rather than a
single language on its own. However, the use of local languages is significant, as these are rarely
written down systematically, and no dictionaries, transcriptions, or textbooks exist for many of
them. Thus, for most participants, this online use of local languages and dialects represents a rare
opportunity to use the written form of their local tongue. As one participant explained, with no
formalised dictionary available, people invent the spelling of words as they go along:
“At the moment there is nobody [who] determines as to how it should be
spelled. At the moment there is none. But there are some people who now try to
write the dictionary for Kenyah, they use, when they spell it, it should be spelled
like this, they do make a dictionary like that.”
3.3 Non-use
Our sample of 331 participants included 119 people who said they were using the internet, and
212 who said they were not using the internet. The group of non-users was generally older, with a
median age of 50.5 years, compared to 44 years for the whole sample. Of these non-users, 127
were women (60 per cent), and 85 were men (40 per cent). Of the non-users, 37 people (17 per
cent) said they had used the internet before but were not using it now, and 175 people (83 per
cent) said they had never used it. The subgroup of non-users who had never used the internet was
older, with a median age of 53.5 years.
Non-users were asked why they did not use the internet. Participants could give more than one
answer to this question. Most non-users (69 per cent) said they did not know how, and were
confused by the technology. Many also said it was because they did not have an internet
connection (44 per cent). Other reasons were that they were not interested, did not have a
computer or other device, or because the cost was too high (see Table 19, overleaf).

28
Table 19: If you are not using the internet, why not?
Reason for not using the internet n (%)
I do not know how, am confused by the technology 146 (69%)
I do not have an Internet connection 94 (44%)
I do not have a computer or other device 52 (25%)
Too expensive 43 (20%)
Not interested 24 (11%)
Others 17 (8%)
No time; too busy 11 (5%)
Note: n=212
In open-ended survey questions, requests for training were the second most frequent response (7
per cent) after connectivity issues (84 per cent). While this suggests that connectivity was a greater
concern, the high number of participants struggling with the technology indicates that people
found it difficult to learn the skills necessary to use the internet, or digital devices more generally
(Figure 13, below). Inability to use the internet due to a lack of skills may be related to the person’s
age, literacy and education, lack of familiarity with devices and services, or the unavailability of
other people who could teach them how to use it. These responses correspond to the answers
from non-users who were asked under which conditions they would consider using the internet.
Responses were either “Maybe,” “Maybe not”, or “Not sure.”
Table 20 (overleaf) shows responses for participants who said they might use the internet. Three
quarters of respondents said they might use the internet if training was available. Most non-users
also said they might use the internet if local services and access were better. Financial resources
and device ownership would encourage more than half of respondents to use the internet.
Figure 13: Researcher (left) and resident (right)

29
Note: n=212
A comparison of schooling levels for internet users and non-users suggested non-users were likely
to have fewer years of education. The non-user group included all participants with no schooling at
all, and a large percentage of participants with only primary schooling. The non-users also included
many participants with secondary education (56 per cent), but only a few participants with
schooling equivalent to tertiary education (see Figure 14, below). Thus, non-users tended to be
older, and with lower education levels. However, it is important to note that over half of non-users
(61 per cent) lived in villages without internet or mobile phone access (see Table 21, below).
Table 21: Village of residence for non-users of the internet
Name of village n (%) Cumulative %
Long Loyang (no mobile phone or mobile internet) 40 (19%) 19%
Long Moh (no mobile phone or mobile internet) 33 (16%) 35%
Long Sobeng (no mobile phone or mobile internet) 30 (14%) 49%
Long Aton (no mobile phone or mobile internet) 26 (12%) 61%
Long Semiang 25 (12%) 73%
Lio Mato 19 (9%) 82%
Long Sela’an 15 (7%) 89%
Long Tungan 11 (5%) 94%
Long Banga 9 (4%) 98%
Long Beruang 4 (2%) 100%
Total n=212 (100%)
0
10
20
30
40
50
60
70
80
90
100
no information No schooling (0years)
Primary (1-6 years) Secondary (7-12years)
Tertiary (13 yearsand more)
Figure 14: Schooling (in years) amongst internet users and non-users
Non-users Internet users
Table 20: Would you use the internet…
Condition n (%)
If computer training was available (“Maybe”) 158 (75%)
If the service and access in your area was better (“Maybe”) 145 (68%)
If you had the financial resources to use the internet (“Maybe”) 126 (59%)
If you had a computer or other device (“Maybe”) 125 (59%)

30
Importantly, of those people who did not use the internet, many still owned devices – in particular, mobile phones (41 per cent), but also smartphones (18 per cent), or both types of device (15 per cent). Less than one third of the non-user group did not own a mobile or smartphone (27 per cent). Some non-users also owned laptop computers (6 per cent), tablets (2 per cent), or desktop computers (1 per cent) (see Table 22, below).
Table 22: Device ownership among non-users of the internet
Only mobile phone 86 (41%)
Only smartphone 38 (18%)
Both mobile phone and smartphone 31 (15%)
Laptop computer 12 (6%)
Tablet 4 (2%)
Desktop computer 3 (1%)
Total n=212 (100%)
The rate of device ownership amongst non-internet users suggests that even when the internet or
data services are not used, these devices still provide an important service for people living in
remote areas. They may use these devices for activities that do not require an internet connection,
for example taking photos, listening to music or, in the case of laptop computers, using software
applications (see Figure 15, below). Some villages have mobile phone access but not mobile
internet access, meaning mobile phone owners can still use their phones to make calls or u SMS.
People also use devices when they visit an area that has access, for instance Lapok or Miri.
Figure 15: Even when they had no internet access, people still used digital devices

31
Part IV: Discussion
This research has revealed many obstacles to digital inclusion faced by people living in remote
villages in Sarawak. These obstacles include limited infrastructure, and limited or unreliable access
to mobile and internet connectivity. However, our research also reveals that people use many
innovative strategies to deal with these limitations and engage with online opportunities.
The high number of internet non-users we encountered (almost two thirds of study participants)
demonstrates that significant obstacles to digital inclusion persist in the region. However, the high
rates of device ownership amongst our participants point to local people’s readiness to engage
with new technologies. In particular, the high ownership rate for both mobile phones and
smartphones (31 per cent of participants) suggests that people adopt the kinds of technologies
that most suit their circumstances.
Participants were adept at practices appropriate to low-connectivity environments. For example,
they shared files and apps between phones off-line, shared information and skills with each other,
were well-informed about the cheapest data offers and the way local connectivity fluctuated
according to weather or time of day, and knew about the best places to get a connection.
Frequency of internet use rose significantly when people visited areas with good connectivity.
While participants’ internet practices were mainly focused on communications – in particular, the
use of social media platforms and messaging apps – they also engaged in more sophisticated
activities, such as accessing training materials, reading up on the news, or buying and selling goods.
In addition, people’s social networking practices sometimes included economic transactions, or the
sharing of skills and knowledge. We therefore conclude that people in the region are using ICTs to
enact various strategies that contribute to their personal wellbeing and socio-economic
development.
The relatively low rates of internet use within our study region, compared to the figures nationally
and in more urban parts of Sarawak, show that local people are not yet participating equally in the
use of ICTs and the internet. Our data suggests that two main factors play a role here.
The first obstacle to internet use in the villages we visited is lack of access. While some form of
mobile phone access was available in seven out of 11 villages, connectivity in those villages was
often patchy and unreliable, and in some areas internet services were not available at all. Under
these circumstances people often had to make a number of attempts before being able to
successfully make a call or send a message. In some instances, messages could only be sent at night
when fewer people were using the network. While the fact that these communities have any
degree of access may be seen as a step in the right direction, in reality the unreliability of access
presents a barrier, particularly to users who are less experienced, who struggle to learn ICT skills or
engage with these services. The effects of unreliable access are also evident where ICTs are used
for professional or economic purposes, and where an interruption in service can lead to delays and
complications.
The second obstacle to internet use in the region relates to low skill levels, particularly amongst
older participants. With many younger people migrating to the city, the younger generation may

32
be less available to help their parents and grandparents gain ICT skills. Low skills levels may also
reduce people’s ability to engage in more sophisticated practices, such as using government
websites or online banking, which hold potential benefits for people in remote areas. This may
indicate a need to develop online content that is more appropriate to low-connectivity
environments, and better suits a user base with low language or literacy skills. Creating such
content may encourage remote users with low literacy and skill levels to use government websites
and banking services.
Malaysia’s USP programs include the establishment of internet centres in rural communities,
where users can access the internet and attend classes to gain ICT skills. However, these internet
centres were not available in our fieldwork region. The situation was similar for free Village Wi-Fi,
which was also set up under the government’s USP programs: free Wi-Fi was only available in one
of the 11 villages we visited, and in that village the system was often not working. While these two
schemes could potentially help remote areas address connectivity issues and lack of skills, neither
was effectively available in the region where our fieldwork took place.
For the people living in our fieldwork sites, the lack of reliable access was a main concern. Our data
suggests that providing reliable access to mobile phone and mobile internet services would
contribute greatly to digital inclusion and participation in the region, and would allow users to
develop ICT strategies and practices to suit their requirements and match their specific needs.

33
Part V: Conclusion
While many remote villages in our fieldwork area had access to the internet through mobile phone
and smartphones, the lack of reliable access was the main barrier to ICT use in remote Sarawak.
Users are ready to engage with ICTs, and where possible, are already doing so in a variety of ways.
Most study participants owned digital devices such as smartphones and mobile phones, but could
not use them where access was patchy or unreliable. In some areas, the presence of mobile phone
networks without internet access limited the kinds of practices people could engage in. In these
cases, people primarily used their devices when visiting areas with better connectivity, and while at
home were restricted to such functions as the phone camera or music player.
Nevertheless, a range of emerging practices in the region point to some potential ways in which
ICTs can solve issues related to geographic remoteness and lack of infrastructure. These practices
include the use of extended social networks for economic purposes – for example, to promote or
sell products – and the use of messaging apps to share information about road conditions. While
many older people struggled to use some features and functions of their devices, they often owned
their own devices and used them to the best of their abilities, in particular to communicate with
children and other family members.
Comments provided by participants, and data from our observations, suggest that people in the
region are actively taking part in digital opportunities, but are often frustrated by the lack of good
quality internet access. If connectivity can be improved, more people are likely to engage in more
sophisticated practices such as online banking, e-health or e-government services, which promise
tangible benefits for remote communities.

34
Glossary and Acronyms
Bahasa Malaysia: Malaysia’s national language and main medium of instruction in school
ICT: Information and Communications Technology, in this context including interactive
technologies and related devices, but excluding broadcast technologies such as radio and TV
Kampung Tanpa Wayar (Village Wi-Fi): free Wi-Fi installed in some rural villages under MCMC’s
Universal Service Provision (USP) programs
Kenyah, Kayan, Kelabit, Penan, Iban, Bidayuh: local ethnic groups
Longhouse: traditional village structure of Kenyah people, in which the whole village lives in one
building built near the riverbank
MCMC: Malaysian Communications and Multimedia Commission, the Federal Government
institution that oversees Universal Service Provision (USP) programs and funds
Netbook 1Malaysia: a program that distributes free netbooks to rural schools and students from
low-income families under one of MCMC’s Universal Service Provision (USP) programs
Pemancha: community representative who ranks above the Penghulu
Penghulu: community representative who is responsible for several villages, and ranks above the
Ketua Kampung
Pusat Internet 1Malaysia: rural internet centres built under one of MCMC’s Universal Service
Provision (USP) programs
Ringgit (RM): Malaysian currency, corresponding to $AU0.32 (as at January 2018)
Temenggong: paramount leader and community representative of a region
Tua Kampung/Ketua Kampung: village headman or headwoman; village representative and point
of contact for outsiders and government agencies
USP: Universal Service Provision, a policy program intended to ensure the provision of services to
rural, remote, and otherwise underserved groups and areas in Malaysia

35
References
Borneo Post Online (2017, March 8). “Those with Household Income of Less than RM4000 Eligible
for BR1M.” Borneo Post Online. Retrieved 15 January 2018, from
www.theborneopost.com.
DiMaggio, P., Hargittai, E., Celeste, C. & Shafer, S. (2004). “From Unequal Access to Differentiated
Use: A literature review and agenda for research on digital inequality.” In Neckerman, K. &
Shafer, S. (Eds.), Social Inequality (355–400).New York: Russell Sage Foundation.
Donner, J. (2015). After Access: Inclusion, development, and a more mobile Internet. MIT Press.
DOSM (2011). “Population and Housing Census, Malaysia 2010.” Department Of Statistics
Malaysia, Putrajaya, Wilayah Persekutuan. Retrieved 15 January 2018, from
http://www.dosm.gov.my
Ghani, E.K., Said, J., & Nasir, N.M. (2012). “E-government in Malaysia: A decade after.” In K.J.
Bwalya & F. C. Zulu (eds). Handbook of Research on E-Government in Emerging Economies:
Adoption, e-Participation, and legal frameworks (290–306). IGI Global.
Gill, S.S., Talib, A., Khong, C.Y., & Kunasekaran, P. (2015). “Exploring the Role of Resources in Ethnic
Minorities’ Adoption of Information and Communication Technology in Preserving their
Cultural Identity in Malaysia.” Asian Culture and History, 8(1), 69.
GSMA. (2013). Universal Service Fund Study. GSMA, London: UK. Retrieved 15 January 2018, from
www.gsma.com
Hashim, R., Idris, K.S., Baharud-din, Z., & Ustadi, Y.A. (2011). Assessing Digital Literacy Among the
Semai Tribe of Perak, Malaysia. Paper presented at the third International conference on
Computer Research and Development (ICCRD).
Helsper, E. (2008). Digital Inclusion: An analysis of social disadvantage and the information society.
Department for Communities and Local Government. London, UK.
Helsper, E. (2012). “A Corresponding Fields Model for the Links between Social and Digital
Exclusion.” Communication Theory, 22(4), 403–426.
ITU (International Telecommunication Union) (2013). Universal Service Fund and Digital Inclusion
For All Study. Paper presented at the Global Symposium for Regulators 2014.
Kleine, D. (2011). “The Capability Approach and the ‘Medium of Choice’: Steps towards
conceptualising information and communication technologies for development.” Ethics
and Information Technology, 13(2), 119–130.
Ling, S. (2016). “MCMC Urged to Narrow Digital Gap.” The Star Online, retrieved 15 January 2018,
from www.thestar.com.my
Martin, F.P., Boily, M.-H., & Lariviere, S. (2015). “Assessing the Performance of Poverty and
Inequality Reduction Programs: The cases of Malaysia and Sabah and Sarawak states.”
Poverty, Inequality, and Evaluation: Changing perspectives (195–208). Washington, DC:
World Bank Group.
MCMC (2014). Universal Service Provision Annual Report. Suruhanjaya Komunikasi dan Multimedia
Malaysia/Malaysian Communications and Multimedia Commission, Cyberjaya, Selangor.
Retrieved 17 June 2018, from www.mcmc.gov.my
MCMC (2015a). Malaysian Multimedia and Communications Commission Annual Report.
Suruhanjaya Komunikasi dan Multimedia Malaysia/Malaysian Communications and
Multimedia Commission, Cyberjaya, Selangor. Retrieved 3 March 2017, from
www.mcmc.gov.my

36
MCMC (2015b). Universal Service Provision Annual Report. Suruhanjaya Komunikasi dan
Multimedia Malaysia/Malaysian Communications and Multimedia Commission, Cyberjaya,
Selangor. Retrieved 17 August 2017, from www.mcmc.gov.my
MCMC (2016a). Internet Users Survey 2016 – Statistical Brief No. 20. Suruhanjaya Komunikasi dan
Multimedia Malaysia/Malaysian Communications and Multimedia Commission, Cyberjaya,
Selangor. Retrieved 14 June 2017, from www.mcmc.gov.my
MCMC (2016b). Q3 2016 Pocket Book of Statistics. Cyberjaya, Selangor Darul Ehsan: Suruhanjaya
Komunikasi dan Multimedia Malaysia/Malaysian Communications and Multimedia
Commission, Cyberjaya, Selangor. Retrieved 22 April 2017, from www.mcmc.gov.my
Metcalf, P. (1974). “The Baram District: A survey of Kenyah, Kayan and Penan peoples.” Sarawak
Museum Journal, 22, 29–40.
Mohamed, H., Judi, H.M., Nor, S.F.M., & Yusof, Z.M. (2012). “Bridging the Digital Divide: A study on
ICT literacy among students in Malaysian rural areas.” Australian Journal of Basic and
Applied Sciences, 6(7), 39–45.
Mohamed, M.Z., & Xavier, J.A. (2015). “Poverty Alleviation Strategies and New Economic Model in
Malaysia. International Academic Research Journal of Economics and Finance, 3(4), 17–31.
Ngau, P. (1966). “Kenyahs in the Baram.” The Sarawak Gazette. 31 March 1966, Kuching, Malaysia.
Salazar, J.F. (2007). “Indigenous People and the Communication Rights Agenda: A global
perspective.” New Media Worlds: Challenges For Convergence, 87–101.
Salman, A., Choy, E.A., Mahmud, W.A.W., & Latif, R.A. (2013). “Tracing the Diffusion of Internet in
Malaysia: Then and now.” Asian Social Science, 9(6), 9–15.
Singh, K. (2017). “‘Enough is Enough!’ Sarawak Introduces Slew of Digital Economy Initiatives.”
Digital News Asia, retrieved 15 January 2018, from www.digitalnewsasia.com
Van Deursen, A., Helsper, E., Eynon, R., & van Dijk, J. (2017). “The Compoundness and Sequentiality
of Digital Inequality.” International Journal of Communication, 11, 452–473.
Van Deursen, A.J., & van Dijk, J.A. (2014). “The Digital Divide Shifts to Differences in Usage.” New
Media & Society, 16(3), 507–526.
Van Dijk, J.A. (2005). The Deepening Divide: Inequality in the information society. Sage Publications.
Wike, R., & Oates, R. (2014). “Emerging Nations Embrace Internet, Mobile Technology: Cell phones
nearly ubiquitous in many countries.” Pew Research Center, Washington DC. Retrieved 23
January 2018, from www.pewglobal.org.