digital landscape vietnam 2013
TRANSCRIPT
Vietnam Digital Landscape
2013 current
Last updated 16 September 2013
Contents
Vietnam in a global context
Population profile by urban penetration & by age
Internet subscribers
Online activities
Leading websites
Social network sites
Online video
Telephone subscribers
Online advertising expenditure
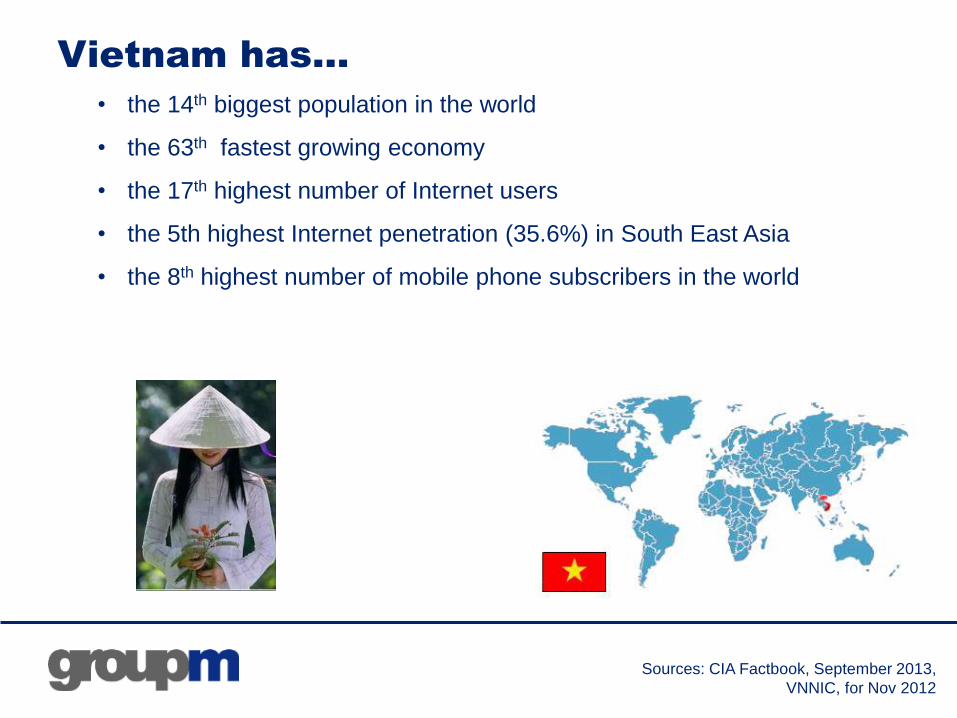
Vietnam has…
• the 14th biggest population in the world
• the 63th fastest growing economy
• the 17th highest number of Internet users
• the 5th highest Internet penetration (35.6%) in South East Asia
• the 8th highest number of mobile phone subscribers in the world
Sources: CIA Factbook, September 2013,
VNNIC, for Nov 2012
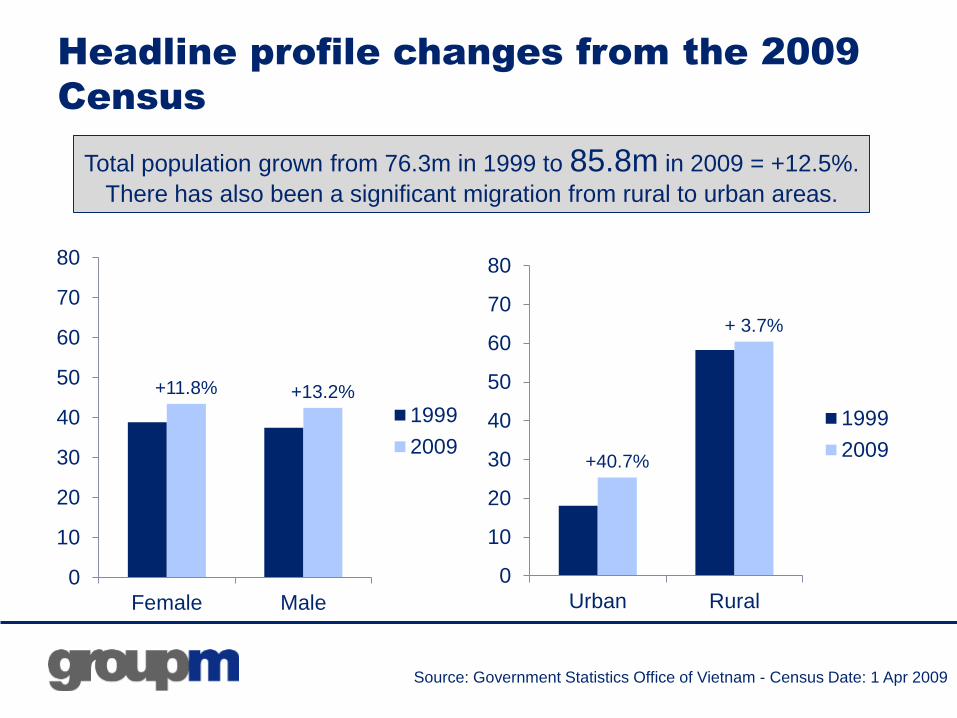
Headline profile changes from the 2009
Census
+11.8% +13.2%
0
10
20
30
40
50
60
70
80
Female Male
1999
2009+40.7%
+ 3.7%
0
10
20
30
40
50
60
70
80
Urban Rural
1999
2009
Total population grown from 76.3m in 1999 to 85.8m in 2009 = +12.5%.
There has also been a significant migration from rural to urban areas.
Source: Government Statistics Office of Vietnam - Census Date: 1 Apr 2009
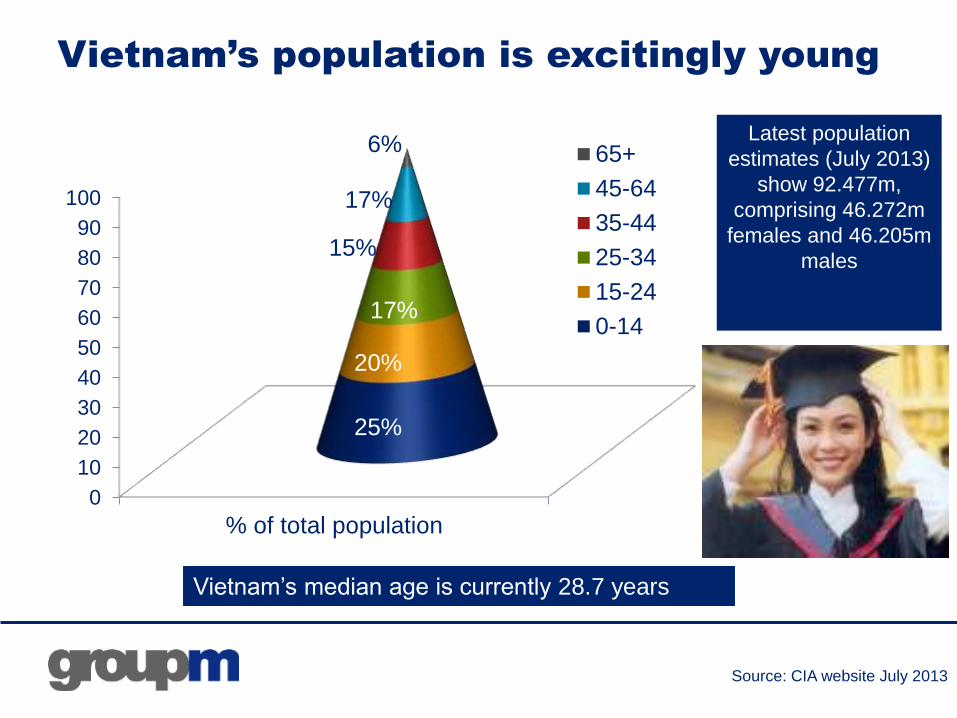
Vietnam’s population is excitingly young
0
10
20
30
40
50
60
70
80
90
100
% of total population
25%
20%
17%
15%
17%
6% 65+
45-64
35-44
25-34
15-24
0-14
Vietnam’s median age is currently 28.7 years
Source: CIA website July 2013
Latest population
estimates (July 2013)
show 92.477m,
comprising 46.272m
females and 46.205m
males
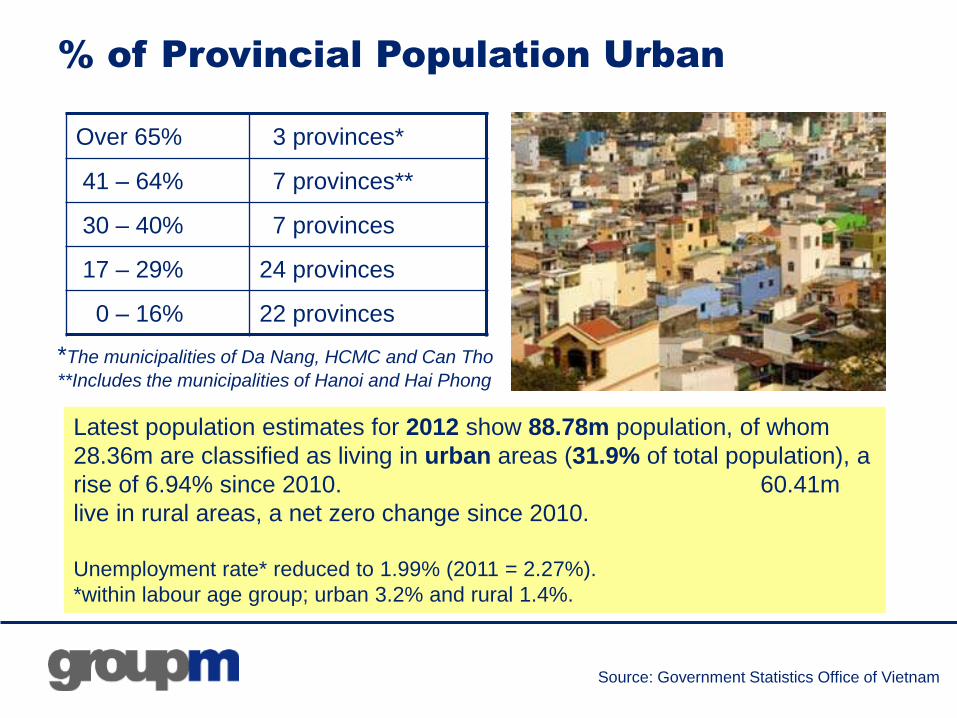
% of Provincial Population Urban
Over 65% 3 provinces*
41 – 64% 7 provinces**
30 – 40% 7 provinces
17 – 29% 24 provinces
0 – 16% 22 provinces
Source: Government Statistics Office of Vietnam
Latest population estimates for 2012 show 88.78m population, of whom
28.36m are classified as living in urban areas (31.9% of total population), a
rise of 6.94% since 2010. 60.41m
live in rural areas, a net zero change since 2010.
Unemployment rate* reduced to 1.99% (2011 = 2.27%).
*within labour age group; urban 3.2% and rural 1.4%.
*The municipalities of Da Nang, HCMC and Can Tho
**Includes the municipalities of Hanoi and Hai Phong
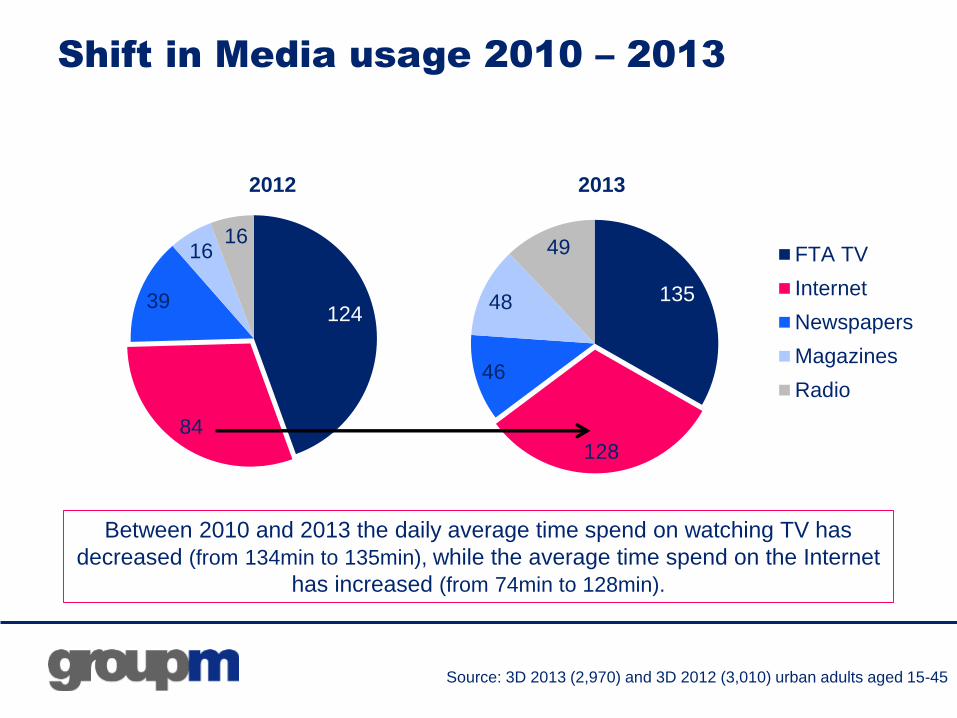
Shift in Media usage 2010 – 2013
124
84
39
1616
FTA TV
Internet
Newspapers
Magazines
Radio
2012 2013
Between 2010 and 2013 the daily average time spend on watching TV has
decreased (from 134min to 135min), while the average time spend on the Internet
has increased (from 74min to 128min).
Source: 3D 2013 (2,970) and 3D 2012 (3,010) urban adults aged 15-45
135
128
46
48
49

Internet Subscribers
Vietnam
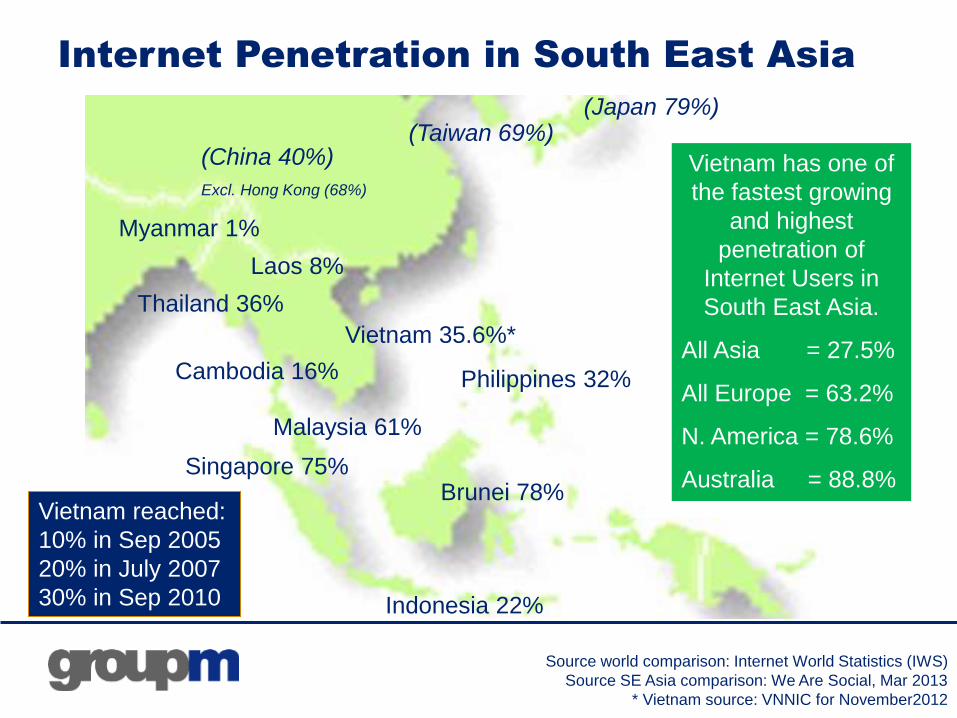
Internet Penetration in South East Asia
(China 40%)
Excl. Hong Kong (68%)
Brunei 78%
Vietnam 35.6%*
Thailand 36%
Malaysia 61%
Singapore 75%
Indonesia 22%
Philippines 32%
Vietnam has one of
the fastest growing
and highest
penetration of
Internet Users in
South East Asia.
All Asia = 27.5%
All Europe = 63.2%
N. America = 78.6%
Australia = 88.8%
Laos 8%
Cambodia 16%
Myanmar 1%
(Japan 79%))(Taiwan 69%)
Vietnam reached:
10% in Sep 2005
20% in July 2007
30% in Sep 2010
Source world comparison: Internet World Statistics (IWS)
Source SE Asia comparison: We Are Social, Mar 2013
* Vietnam source: VNNIC for November2012
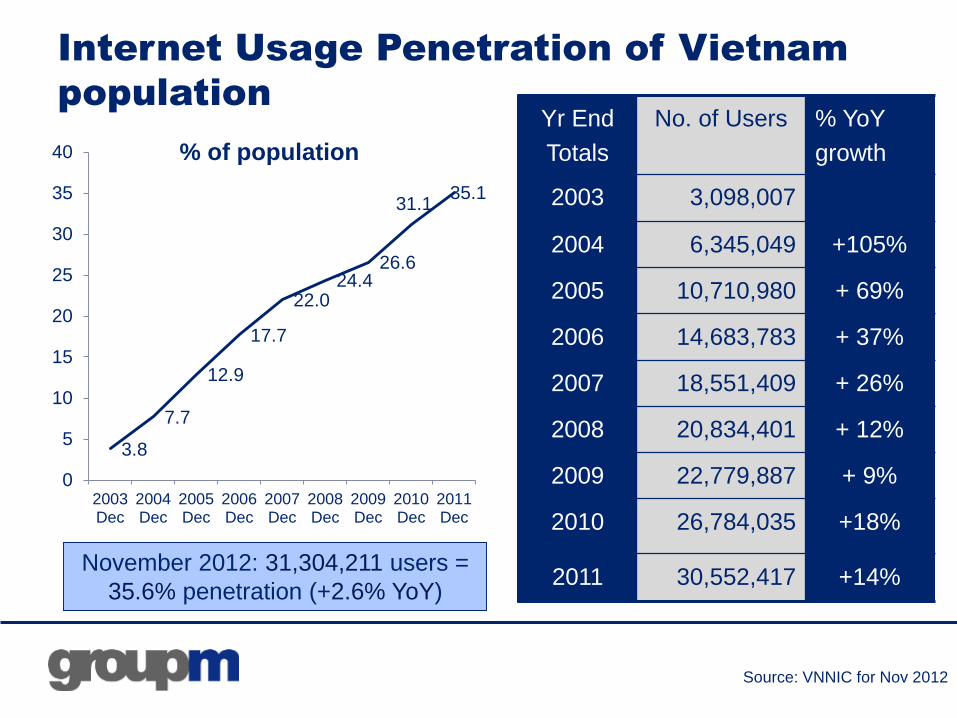
Internet Usage Penetration of Vietnam
population
3.8
7.7
12.9
17.7
22.024.4
26.6
31.135.1
0
5
10
15
20
25
30
35
40
2003Dec
2004Dec
2005Dec
2006Dec
2007Dec
2008Dec
2009Dec
2010Dec
2011Dec
% of population
Yr End
Totals
No. of Users % YoY
growth
2003 3,098,007
2004 6,345,049 +105%
2005 10,710,980 + 69%
2006 14,683,783 + 37%
2007 18,551,409 + 26%
2008 20,834,401 + 12%
2009 22,779,887 + 9%
2010 26,784,035 +18%
2011 30,552,417 +14%November 2012: 31,304,211 users =
35.6% penetration (+2.6% YoY)
Source: VNNIC for Nov 2012
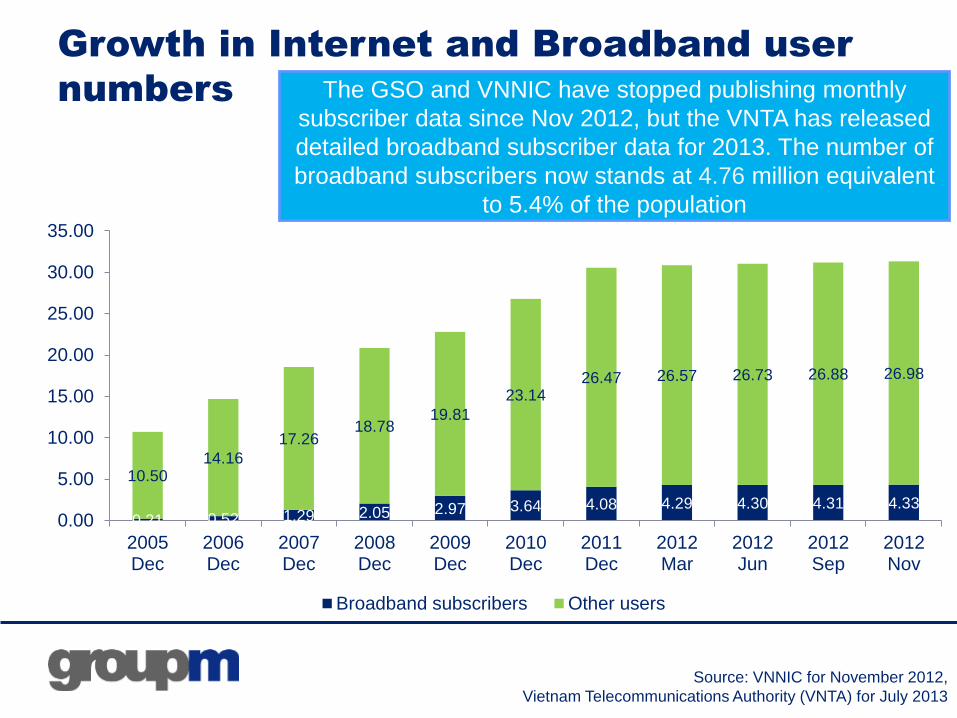
Growth in Internet and Broadband user
numbers
0.21 0.52 1.29 2.05 2.97 3.64 4.08 4.29 4.30 4.31 4.33
10.5014.16
17.2618.78
19.81
23.1426.47 26.57 26.73 26.88 26.98
0.00
5.00
10.00
15.00
20.00
25.00
30.00
35.00
2005Dec
2006Dec
2007Dec
2008Dec
2009Dec
2010Dec
2011Dec
2012Mar
2012Jun
2012Sep
2012Nov
Broadband subscribers Other users
Source: VNNIC for November 2012,
Vietnam Telecommunications Authority (VNTA) for July 2013
The GSO and VNNIC have stopped publishing monthly
subscriber data since Nov 2012, but the VNTA has released
detailed broadband subscriber data for 2013. The number of
broadband subscribers now stands at 4.76 million equivalent
to 5.4% of the population
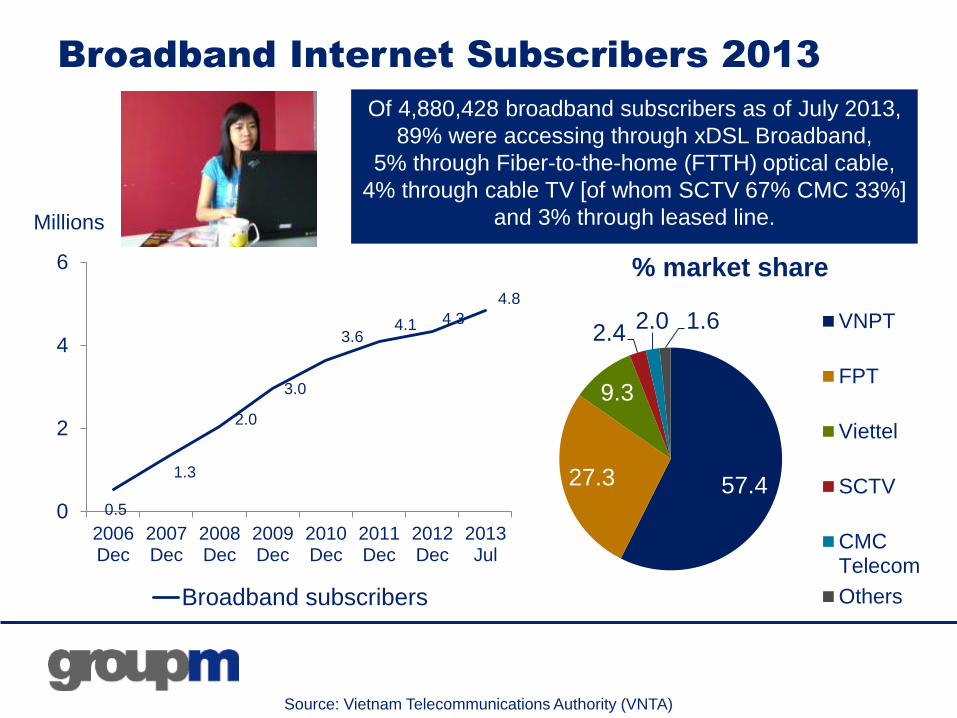
Broadband Internet Subscribers 2013
0.5
1.3
2.0
3.0
3.64.1 4.3
4.8
0
2
4
6
2006Dec
2007Dec
2008Dec
2009Dec
2010Dec
2011Dec
2012Dec
2013Jul
Broadband subscribers
57.427.3
9.3
2.42.0 1.6
% market share
VNPT
FPT
Viettel
SCTV
CMCTelecom
Others
Source: Vietnam Telecommunications Authority (VNTA)
Millions
Of 4,880,428 broadband subscribers as of July 2013,
89% were accessing through xDSL Broadband,
5% through Fiber-to-the-home (FTTH) optical cable,
4% through cable TV [of whom SCTV 67% CMC 33%]
and 3% through leased line.
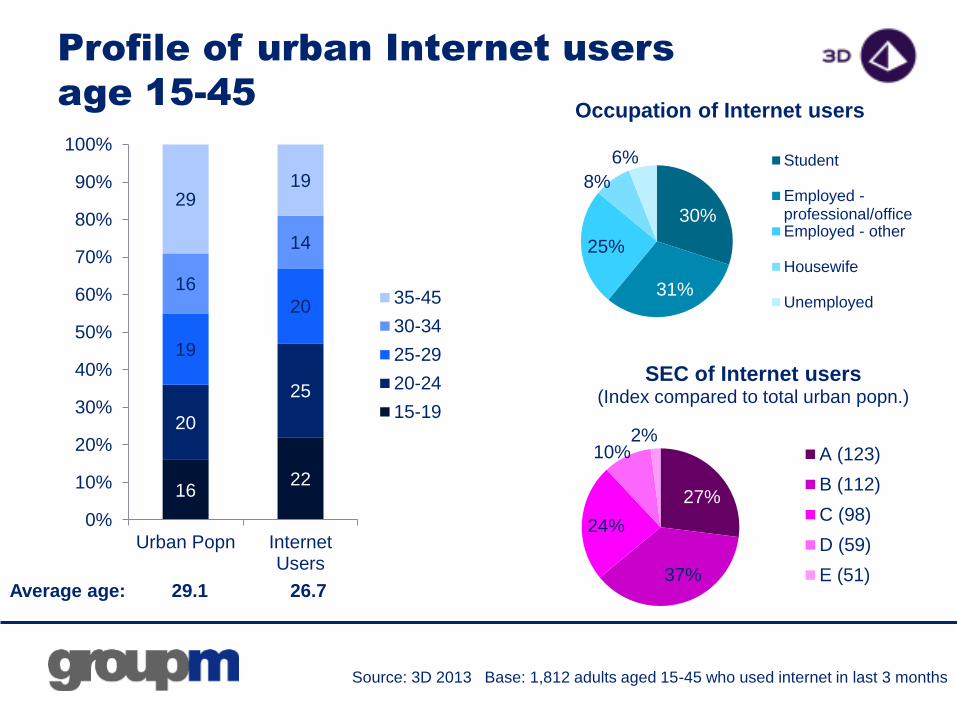
Profile of urban Internet users
age 15-45
1622
20
25
19
20
16
14
2919
0%
10%
20%
30%
40%
50%
60%
70%
80%
90%
100%
Urban Popn InternetUsers
35-45
30-34
25-29
20-24
15-19
Source: 3D 2013 Base: 1,812 adults aged 15-45 who used internet in last 3 months
27%
37%
24%
10%2%
SEC of Internet users(Index compared to total urban popn.)
A (123)
B (112)
C (98)
D (59)
E (51)
30%
31%
25%
8%
6%
Occupation of Internet users
Student
Employed -professional/officeEmployed - other
Housewife
Unemployed
Average age: 29.1 26.7
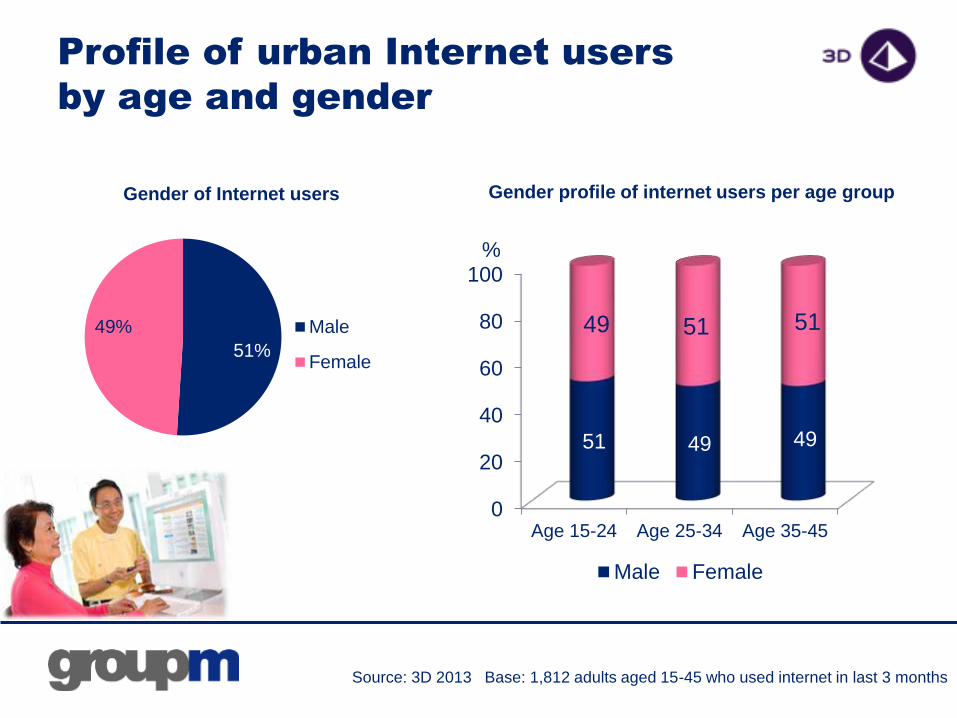
Profile of urban Internet users
by age and gender
0
20
40
60
80
100
Age 15-24 Age 25-34 Age 35-45
51 49 49
49 51 51
Male Female
51%
49%
Gender of Internet users
Male
Female
Gender profile of internet users per age group
Source: 3D 2013 Base: 1,812 adults aged 15-45 who used internet in last 3 months
%
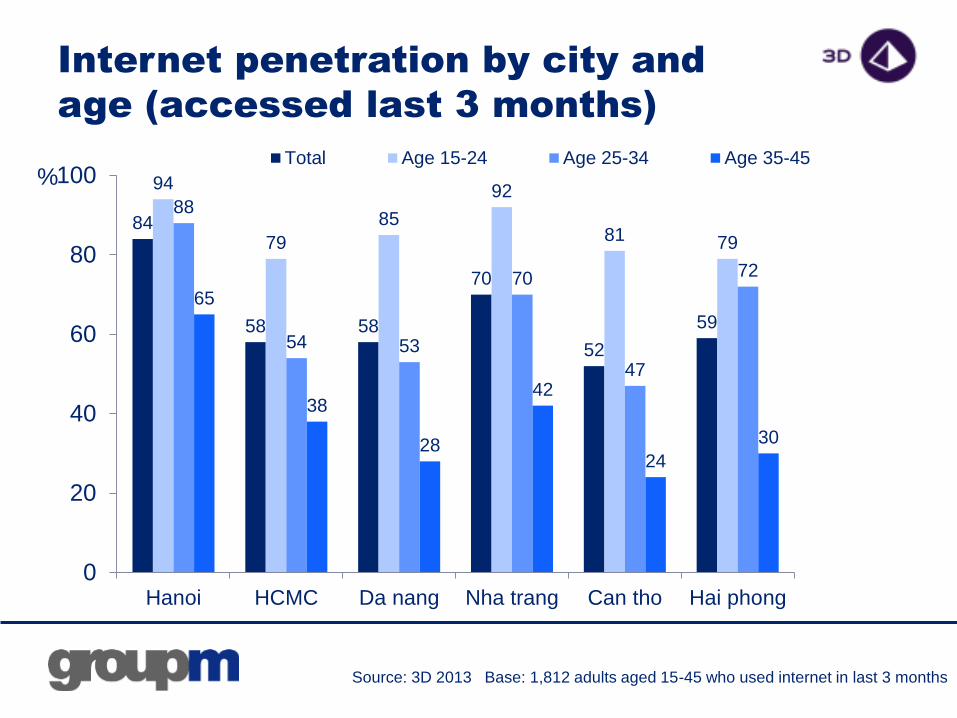
Internet penetration by city and
age (accessed last 3 months)
%
Source: 3D 2013 Base: 1,812 adults aged 15-45 who used internet in last 3 months
84
58 58
70
52
59
94
79
85
92
81 79
88
54 53
70
47
72
65
38
28
42
24
30
0
20
40
60
80
100
Hanoi HCMC Da nang Nha trang Can tho Hai phong
Total Age 15-24 Age 25-34 Age 35-45
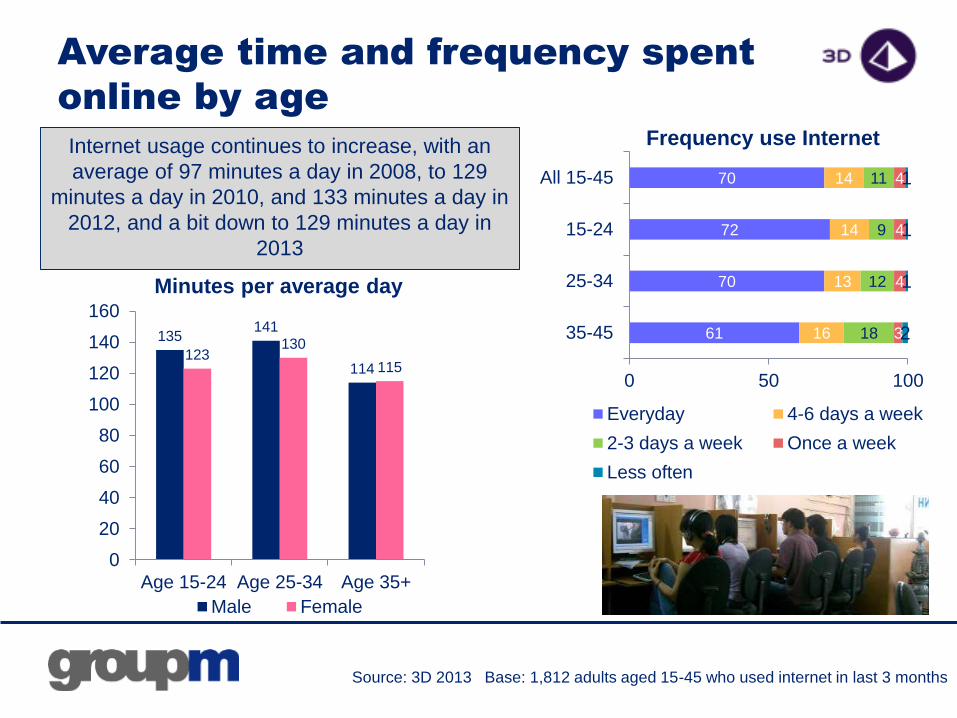
Average time and frequency spent
online by age
61
70
72
70
16
13
14
14
18
12
9
11
3
4
4
4
2
1
1
1
0 50 100
35-45
25-34
15-24
All 15-45
Everyday 4-6 days a week
2-3 days a week Once a week
Less often
Frequency use Internet
135141
114123
130
115
0
20
40
60
80
100
120
140
160
Age 15-24 Age 25-34 Age 35+
Male Female
Minutes per average day
Internet usage continues to increase, with an
average of 97 minutes a day in 2008, to 129
minutes a day in 2010, and 133 minutes a day in
2012, and a bit down to 129 minutes a day in
2013
Source: 3D 2013 Base: 1,812 adults aged 15-45 who used internet in last 3 months
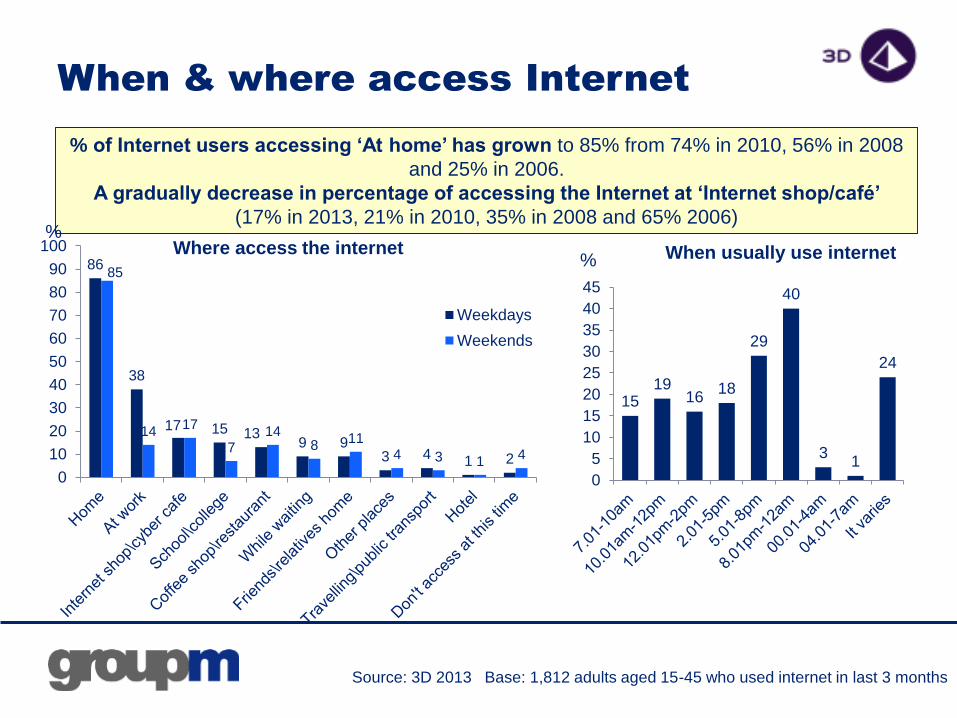
When & where access Internet
1519
1618
29
40
31
24
0
5
10
15
20
25
30
35
40
45
When usually use internet86
38
17 15 139 9
3 41 2
85
1417
714
811
4 3 14
0
10
20
30
40
50
60
70
80
90
100
Weekdays
Weekends
% of Internet users accessing ‘At home’ has grown to 85% from 74% in 2010, 56% in 2008
and 25% in 2006.
A gradually decrease in percentage of accessing the Internet at ‘Internet shop/café’
(17% in 2013, 21% in 2010, 35% in 2008 and 65% 2006)
%
%Where access the internet
Source: 3D 2013 Base: 1,812 adults aged 15-45 who used internet in last 3 months

Online activities
Vietnam
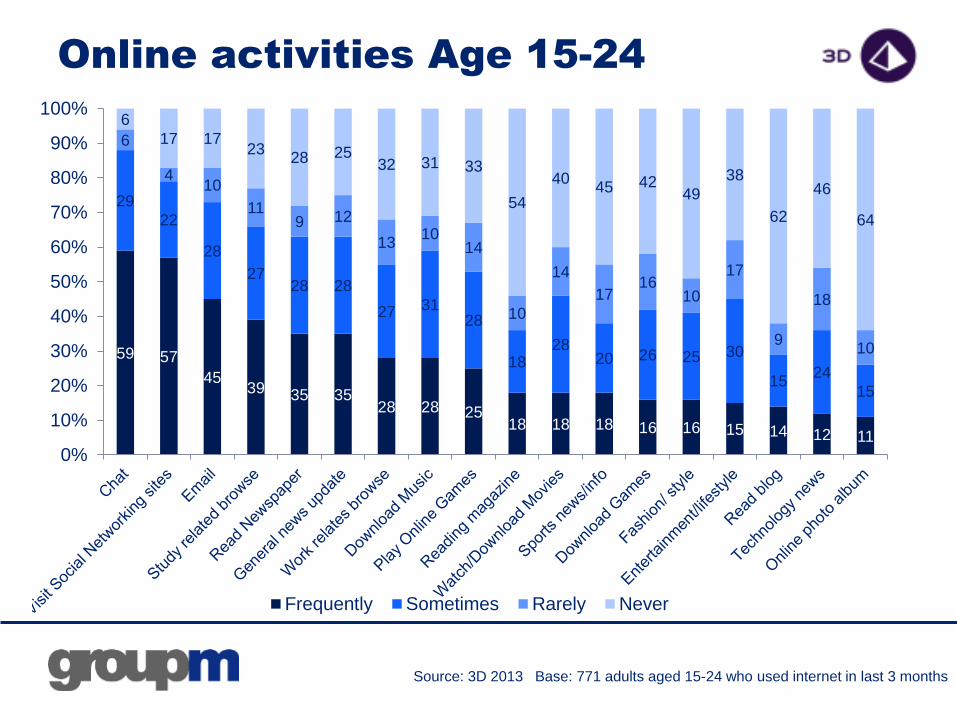
Online activities Age 15-24
59 57
4539 35 35
28 28 2518 18 18 16 16 15 14 12 11
29
22
28
2728 28
27 3128
1828
20 26 25 30
1524
15
6
410
119 12
1310
14
10
14
1716
10
17
9
18
10
6
17 1723
28 2532 31 33
54
4045 42
49
38
62
46
64
0%
10%
20%
30%
40%
50%
60%
70%
80%
90%
100%
Frequently Sometimes Rarely Never
Source: 3D 2013 Base: 771 adults aged 15-24 who used internet in last 3 months
50 46 43 42 41 40
23 21 19 16 16 16 15 14 14 12 12 11
24 2925 24 22
31
20 20 20 23
3631 29
2126 29
10
23
14
610
6 11
6
8
16 1611
16
1114
14
1615 14
5
12
10
2015
26 2331
21
41 4350
4637 39 42
4845 45
73
53
70
0
10
20
30
40
50
60
70
80
90
100
Frequently Sometimes Rarely Never
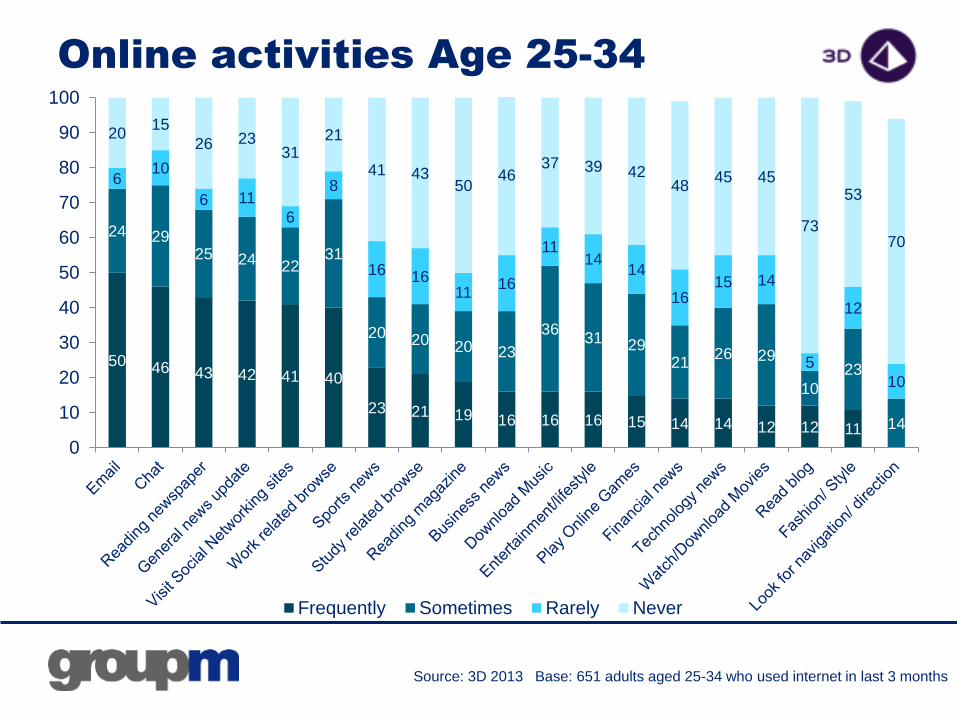
Source: 3D 2013 Base: 651 adults aged 25-34 who used internet in last 3 months
Online activities Age 25-34
45 41 41 3731
21 21 19 18 16 16 12 12 12 9 8 5 5 3
16 21 24
1722
13 16 17 2015 18
16 14 1425
2117 18
9
8 9 6
8 11
710 12 12
1312
11 15 12
12
8
11 12
10
31 29 2937 37
5953 52 50
56 5461 59 62
5463 67 65
78
0
10
20
30
40
50
60
70
80
90
100
Frequently Sometimes Rarely Never
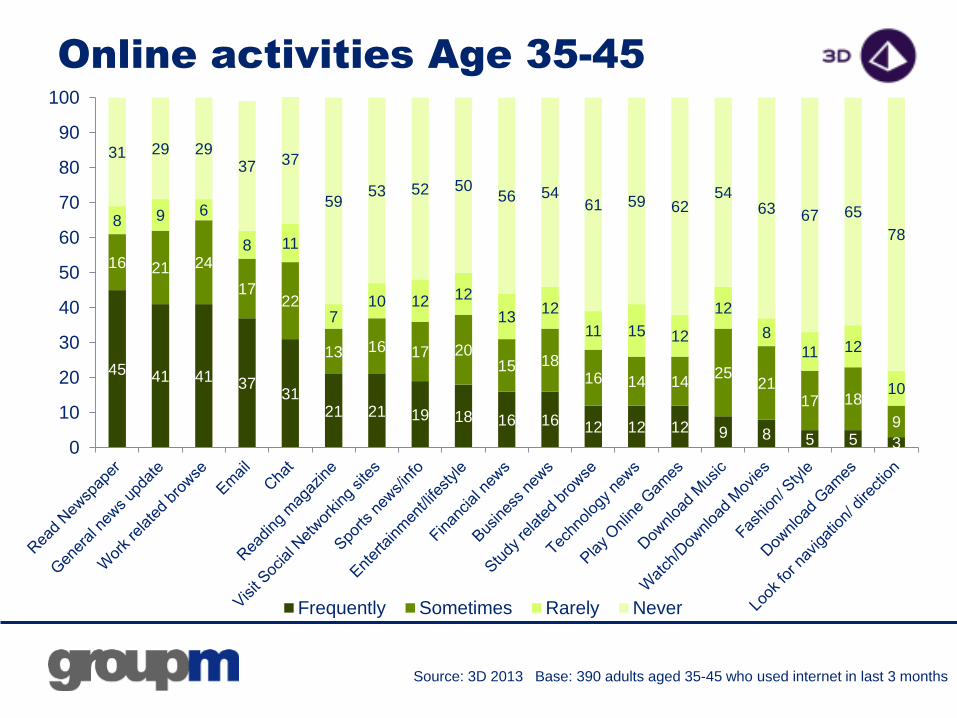
Source: 3D 2013 Base: 390 adults aged 35-45 who used internet in last 3 months
Online activities Age 35-45
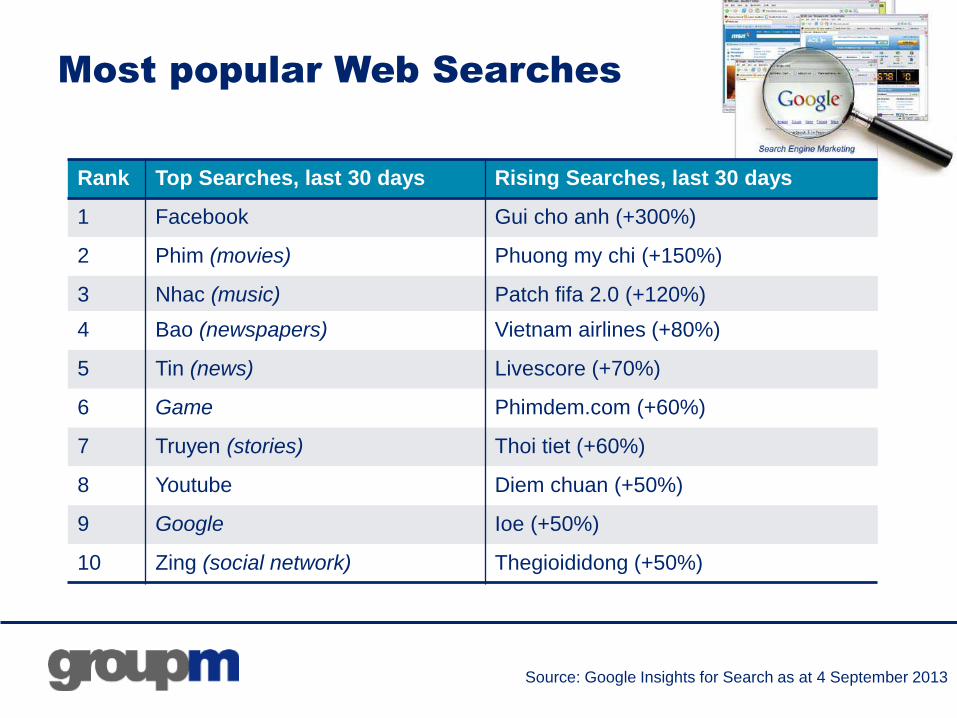
Most popular Web Searches
Rank Top Searches, last 30 days Rising Searches, last 30 days
1 Facebook Gui cho anh (+300%)
2 Phim (movies) Phuong my chi (+150%)
3 Nhac (music) Patch fifa 2.0 (+120%)
4 Bao (newspapers) Vietnam airlines (+80%)
5 Tin (news) Livescore (+70%)
6 Game Phimdem.com (+60%)
7 Truyen (stories) Thoi tiet (+60%)
8 Youtube Diem chuan (+50%)
9 Google Ioe (+50%)
10 Zing (social network) Thegioididong (+50%)
Source: Google Insights for Search as at 4 September 2013
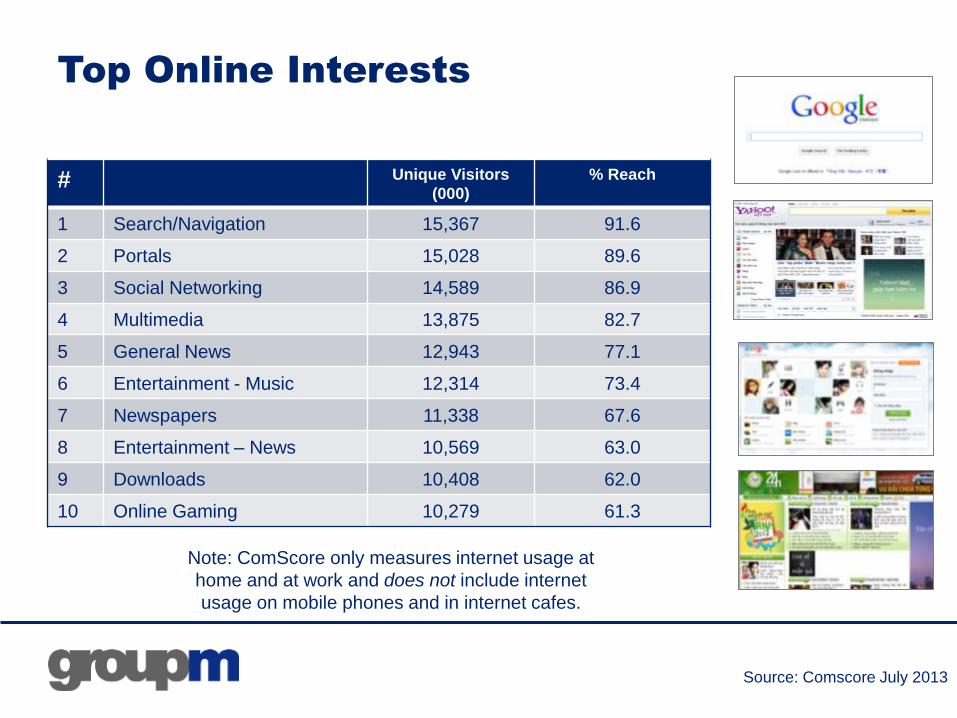
Top Online Interests
Source: Comscore July 2013
# Unique Visitors
(000)
% Reach
1 Search/Navigation 15,367 91.6
2 Portals 15,028 89.6
3 Social Networking 14,589 86.9
4 Multimedia 13,875 82.7
5 General News 12,943 77.1
6 Entertainment - Music 12,314 73.4
7 Newspapers 11,338 67.6
8 Entertainment – News 10,569 63.0
9 Downloads 10,408 62.0
10 Online Gaming 10,279 61.3
Note: ComScore only measures internet usage at
home and at work and does not include internet
usage on mobile phones and in internet cafes.
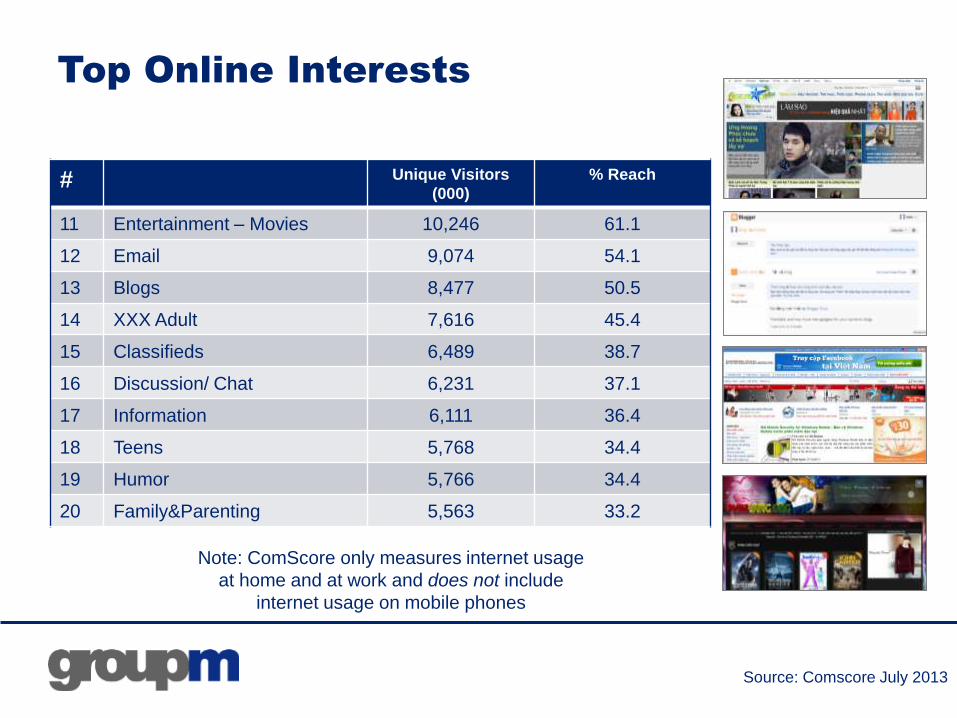
Top Online Interests
Source: Comscore July 2013
# Unique Visitors
(000)
% Reach
11 Entertainment – Movies 10,246 61.1
12 Email 9,074 54.1
13 Blogs 8,477 50.5
14 XXX Adult 7,616 45.4
15 Classifieds 6,489 38.7
16 Discussion/ Chat 6,231 37.1
17 Information 6,111 36.4
18 Teens 5,768 34.4
19 Humor 5,766 34.4
20 Family&Parenting 5,563 33.2
Note: ComScore only measures internet usage
at home and at work and does not include
internet usage on mobile phones

Leading websites
Vietnam
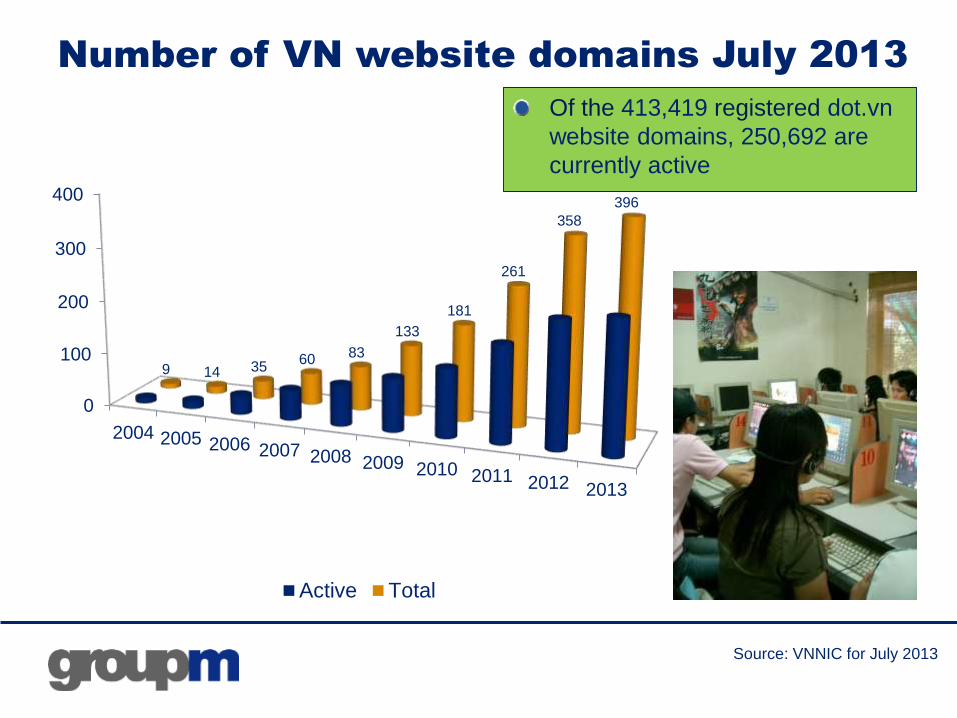
Number of VN website domains July 2013
Of the 413,419 registered dot.vn
website domains, 250,692 are
currently active
Source: VNNIC for July 2013
0
100
200
300
400
2004 2005 2006 2007 2008 2009 2010 2011 2012 2013
9 14 3560 83
133
181
261
358
396
Active Total
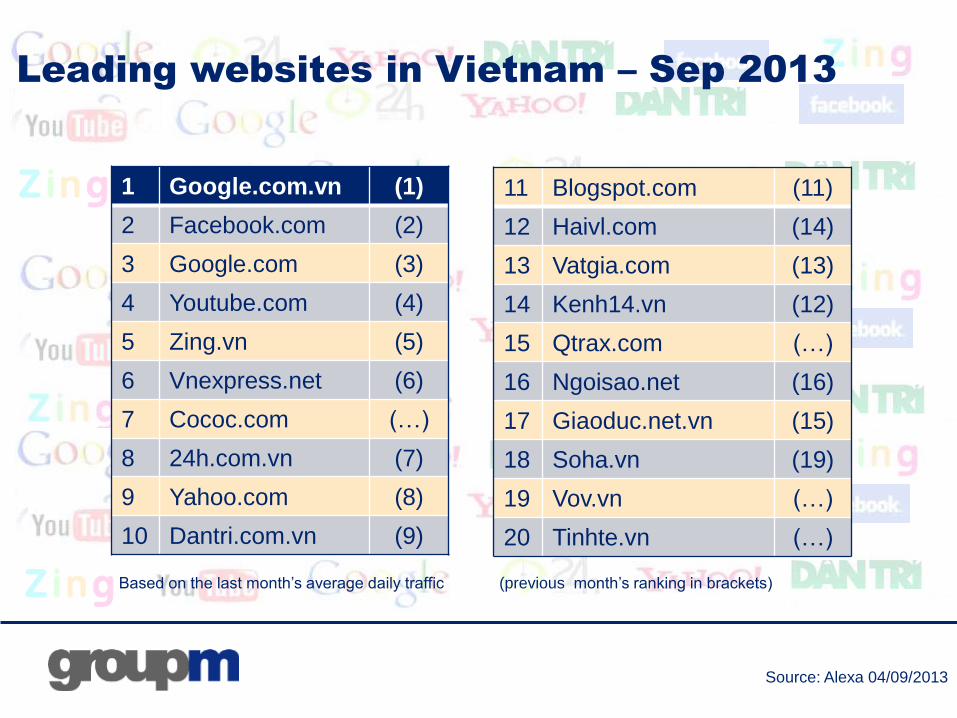
Leading websites in Vietnam – Sep 2013
1 Google.com.vn (1)
2 Facebook.com (2)
3 Google.com (3)
4 Youtube.com (4)
5 Zing.vn (5)
6 Vnexpress.net (6)
7 Cococ.com (…)
8 24h.com.vn (7)
9 Yahoo.com (8)
10 Dantri.com.vn (9)
11 Blogspot.com (11)
12 Haivl.com (14)
13 Vatgia.com (13)
14 Kenh14.vn (12)
15 Qtrax.com (…)
16 Ngoisao.net (16)
17 Giaoduc.net.vn (15)
18 Soha.vn (19)
19 Vov.vn (…)
20 Tinhte.vn (…)
Source: Alexa 04/09/2013
Based on the last month’s average daily traffic (previous month’s ranking in brackets)
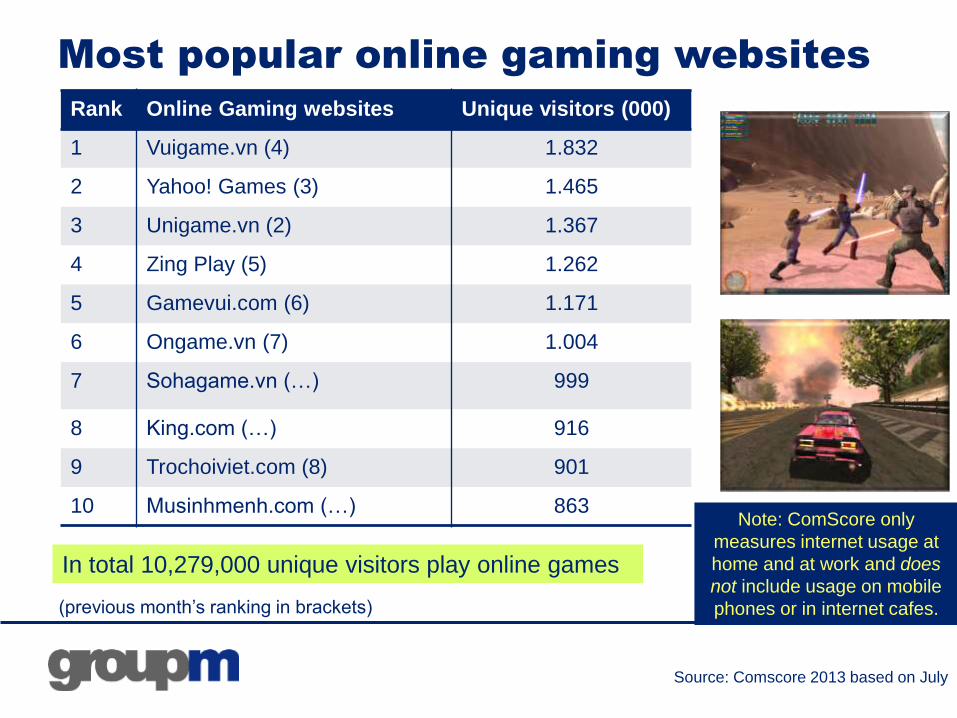
Most popular online gaming websites
Rank Online Gaming websites Unique visitors (000)
1 Vuigame.vn (4) 1.832
2 Yahoo! Games (3) 1.465
3 Unigame.vn (2) 1.367
4 Zing Play (5) 1.262
5 Gamevui.com (6) 1.171
6 Ongame.vn (7) 1.004
7 Sohagame.vn (…) 999
8 King.com (…) 916
9 Trochoiviet.com (8) 901
10 Musinhmenh.com (…) 863
Source: Comscore 2013 based on July
In total 10,279,000 unique visitors play online games
(previous month’s ranking in brackets)
Note: ComScore only
measures internet usage at
home and at work and does
not include usage on mobile
phones or in internet cafes.
Social network sites
Vietnam
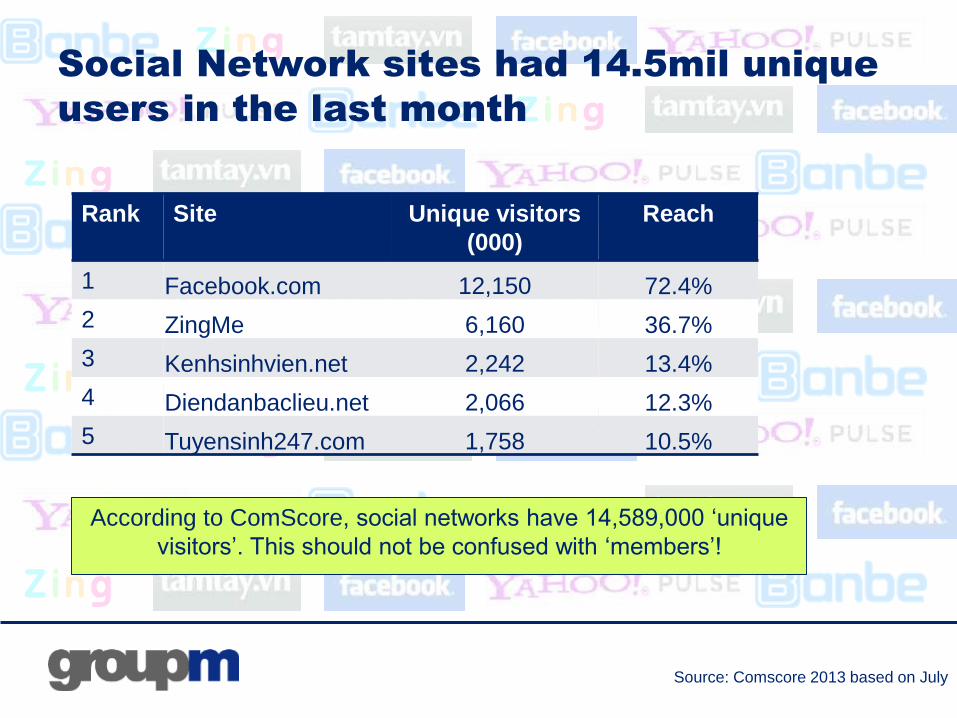
Social Network sites had 14.5mil unique
users in the last month
Rank Site Unique visitors
(000)
Reach
1 Facebook.com 12,150 72.4%
2 ZingMe 6,160 36.7%
3 Kenhsinhvien.net 2,242 13.4%
4 Diendanbaclieu.net 2,066 12.3%
5 Tuyensinh247.com 1,758 10.5%
According to ComScore, social networks have 14,589,000 ‘unique
visitors’. This should not be confused with ‘members’!
Source: Comscore 2013 based on July
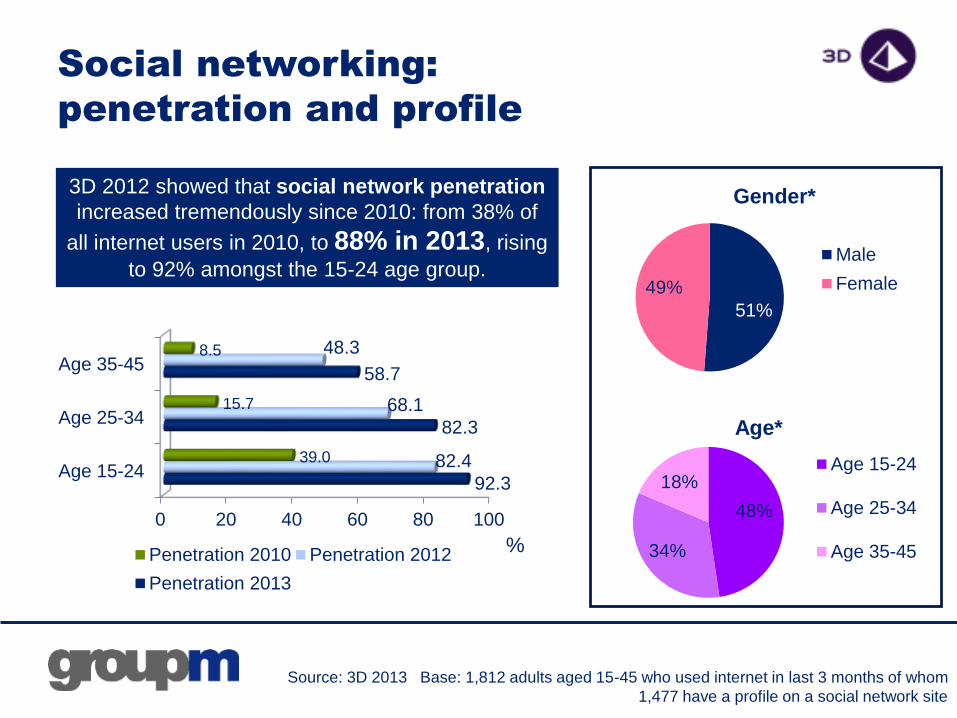
Social networking:
penetration and profile
51%
49%
Gender*
Male
Female
Source: 3D 2013 Base: 1,812 adults aged 15-45 who used internet in last 3 months of whom
1,477 have a profile on a social network site
3D 2012 showed that social network penetration
increased tremendously since 2010: from 38% of
all internet users in 2010, to 88% in 2013, rising
to 92% amongst the 15-24 age group.
48%
34%
18%
Age*
Age 15-24
Age 25-34
Age 35-45
0 20 40 60 80 100
Age 15-24
Age 25-34
Age 35-45
92.3
82.3
58.7
82.4
68.1
48.3
39.0
15.7
8.5
Penetration 2010 Penetration 2012
Penetration 2013
%

52%
25%
11%
6%3%
Age distribution
15-24
25-34
35-44
45-54
55+
54%46%
Gender distribution
Male
Female
Zing Me users in Vietnam
6,2 million Zing Me ‘unique visitors’ in Vietnam
• Zing Me penetration of total population: 6.9%
• Zing Me penetration of internet users: 21.5%*
Source: Comscore 2013 based on July 2013, *VNNIC for Nov 2012
Note: ‘unique visitors’
should not be confused
with profile members.
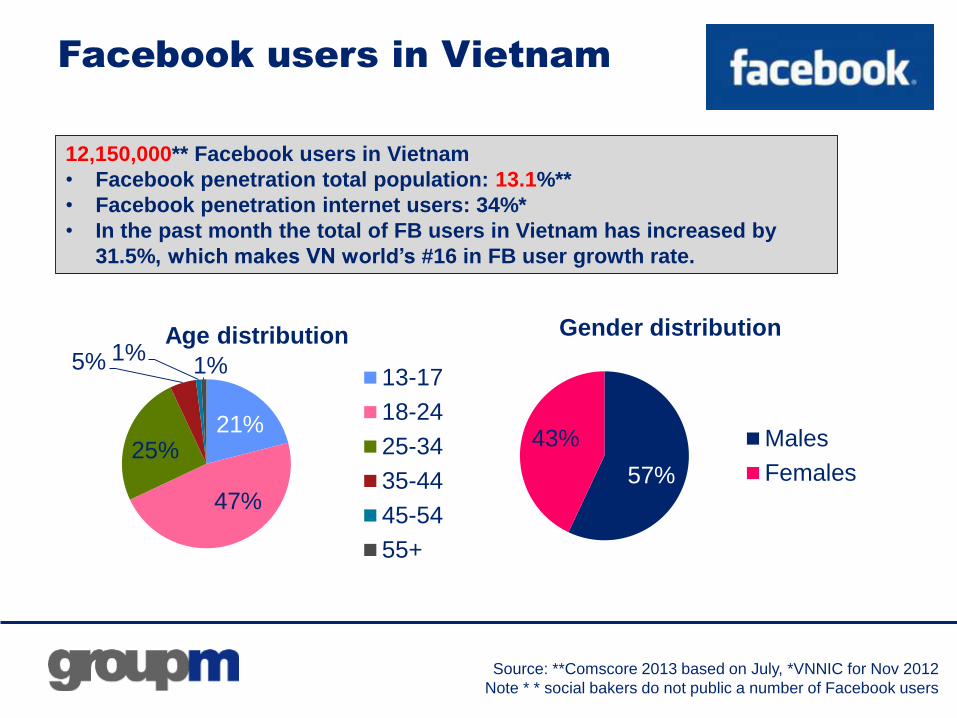
Facebook users in Vietnam
12,150,000** Facebook users in Vietnam
• Facebook penetration total population: 13.1%**
• Facebook penetration internet users: 34%*
• In the past month the total of FB users in Vietnam has increased by
31.5%, which makes VN world’s #16 in FB user growth rate.
Source: **Comscore 2013 based on July, *VNNIC for Nov 2012
Note * * social bakers do not public a number of Facebook users
57%
43%
Gender distribution
Males
Females
21%
47%
25%
5% 1%1%
Age distribution
13-17
18-24
25-34
35-44
45-54
55+
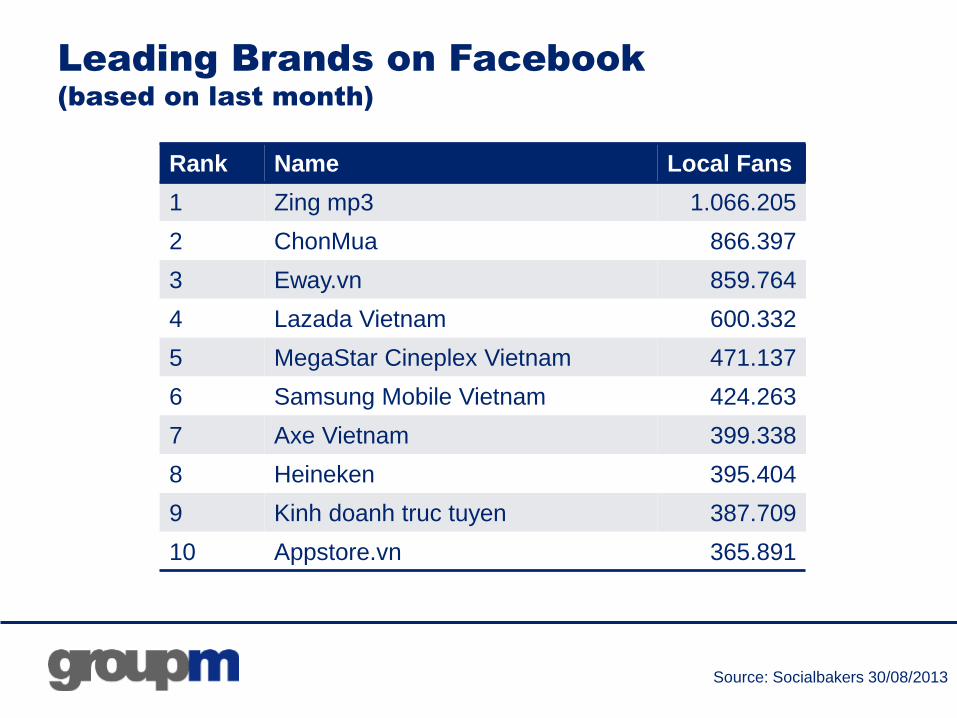
Leading Brands on Facebook
(based on last month)
Rank Name Local Fans
1 Zing mp3 1.066.205
2 ChonMua 866.397
3 Eway.vn 859.764
4 Lazada Vietnam 600.332
5 MegaStar Cineplex Vietnam 471.137
6 Samsung Mobile Vietnam 424.263
7 Axe Vietnam 399.338
8 Heineken 395.404
9 Kinh doanh truc tuyen 387.709
10 Appstore.vn 365.891
Source: Socialbakers 30/08/2013
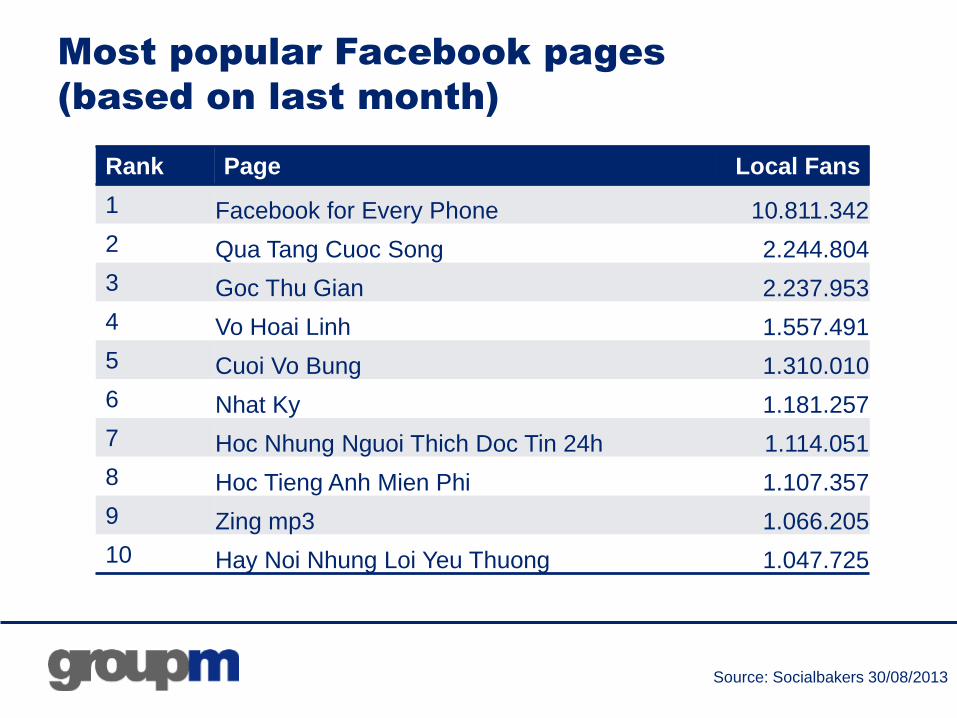
Most popular Facebook pages
(based on last month)
Rank Page Local Fans
1 Facebook for Every Phone 10.811.342
2 Qua Tang Cuoc Song 2.244.804
3 Goc Thu Gian 2.237.953
4 Vo Hoai Linh 1.557.491
5 Cuoi Vo Bung 1.310.010
6 Nhat Ky 1.181.257
7 Hoc Nhung Nguoi Thich Doc Tin 24h 1.114.051
8 Hoc Tieng Anh Mien Phi 1.107.357
9 Zing mp3 1.066.205
10 Hay Noi Nhung Loi Yeu Thuong 1.047.725
Source: Socialbakers 30/08/2013

Online video
Vietnam
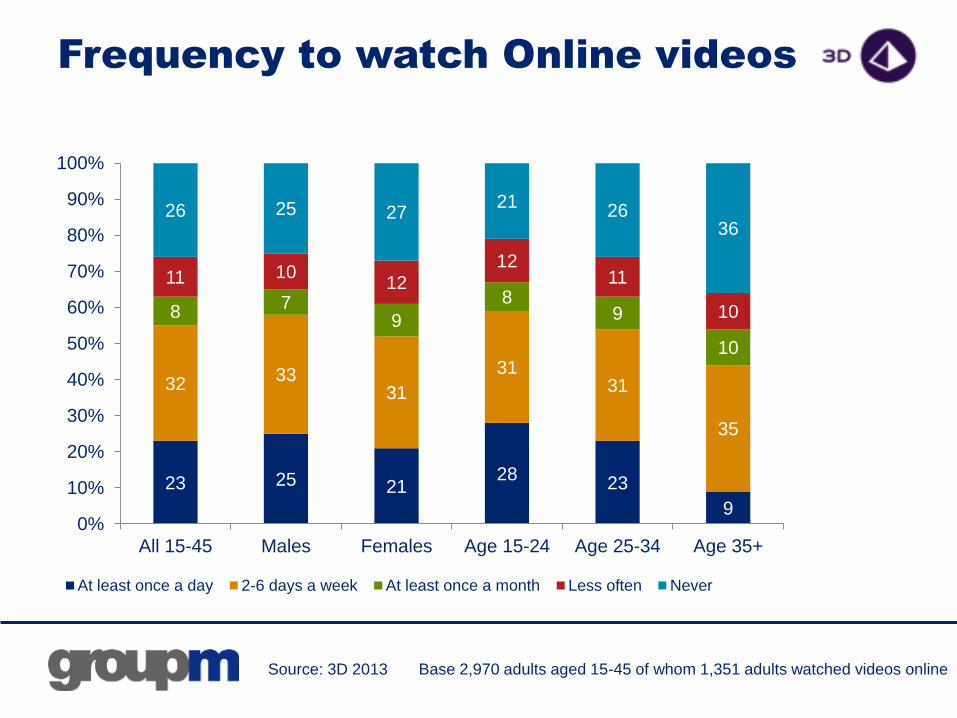
Frequency to watch Online videos
23 25 2128
23
9
3233
31
3131
35
87
9
89
10
11 1012
1211
10
26 25 2721
2636
0%
10%
20%
30%
40%
50%
60%
70%
80%
90%
100%
All 15-45 Males Females Age 15-24 Age 25-34 Age 35+
At least once a day 2-6 days a week At least once a month Less often Never
Source: 3D 2013 Base 2,970 adults aged 15-45 of whom 1,351 adults watched videos online
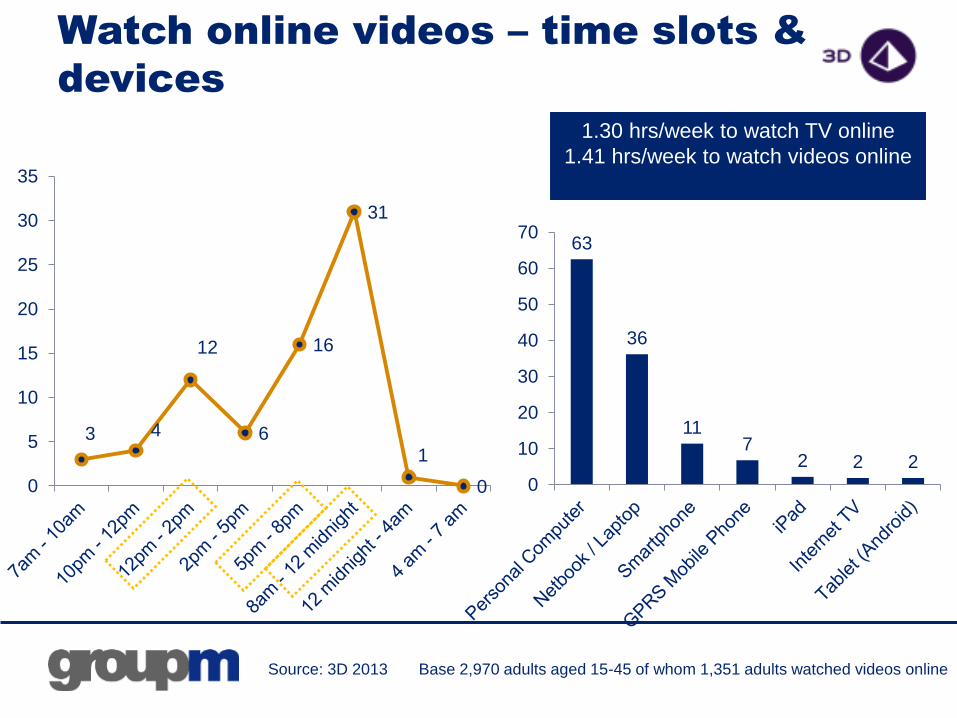
Watch online videos – time slots &
devices
Source: 3D 2013 Base 2,970 adults aged 15-45 of whom 1,351 adults watched videos online
3 4
12
6
16
31
1
00
5
10
15
20
25
30
35
63
36
117
2 2 2
0
10
20
30
40
50
60
70
1.30 hrs/week to watch TV online
1.41 hrs/week to watch videos online
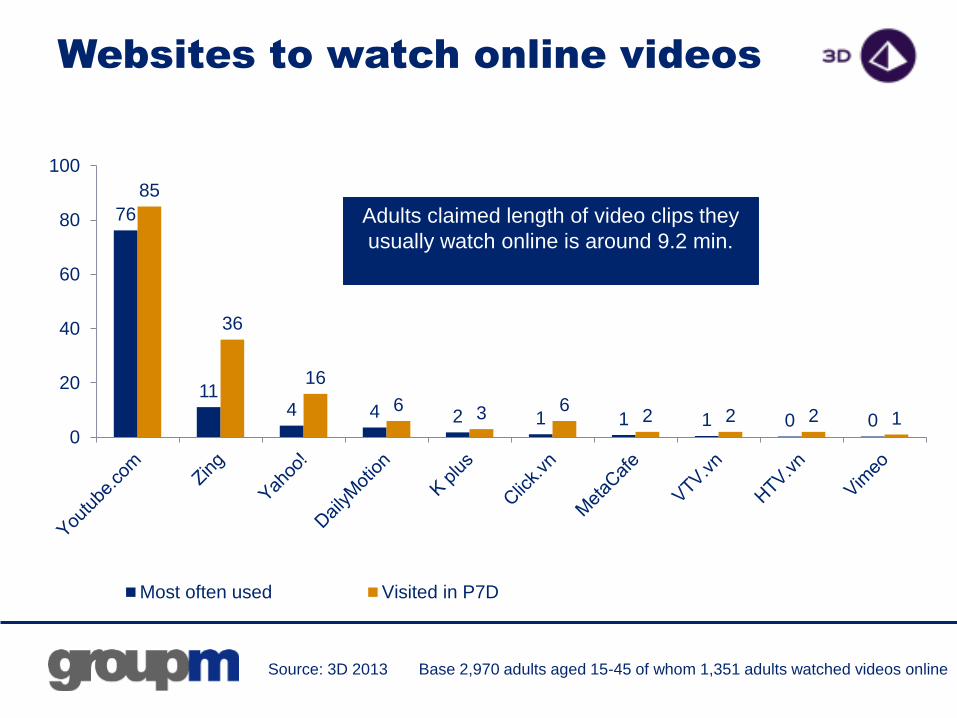
Websites to watch online videos
76
114 4 2 1 1 1 0 0
85
36
16
6 3 62 2 2 1
0
20
40
60
80
100
Most often used Visited in P7D
Source: 3D 2013 Base 2,970 adults aged 15-45 of whom 1,351 adults watched videos online
Adults claimed length of video clips they
usually watch online is around 9.2 min.
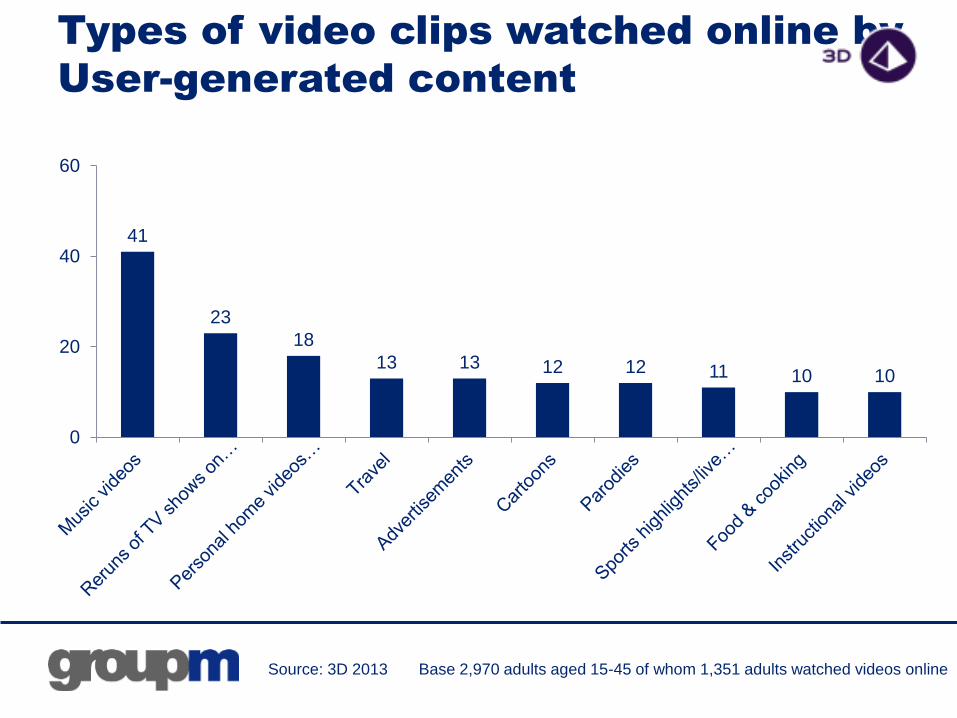
Types of video clips watched online by
User-generated content
41
23
18
13 13 12 12 11 10 10
0
20
40
60
Source: 3D 2013 Base 2,970 adults aged 15-45 of whom 1,351 adults watched videos online
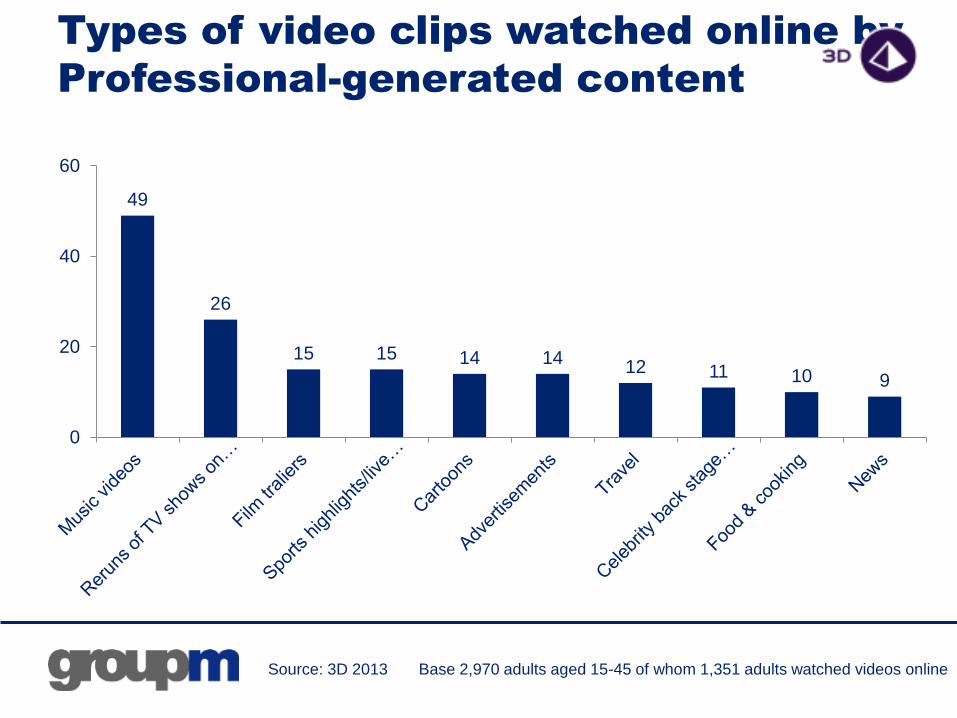
Types of video clips watched online by
Professional-generated content
49
26
15 15 14 1412 11 10 9
0
20
40
60
Source: 3D 2013 Base 2,970 adults aged 15-45 of whom 1,351 adults watched videos online

Telephone subscribers
Vietnam
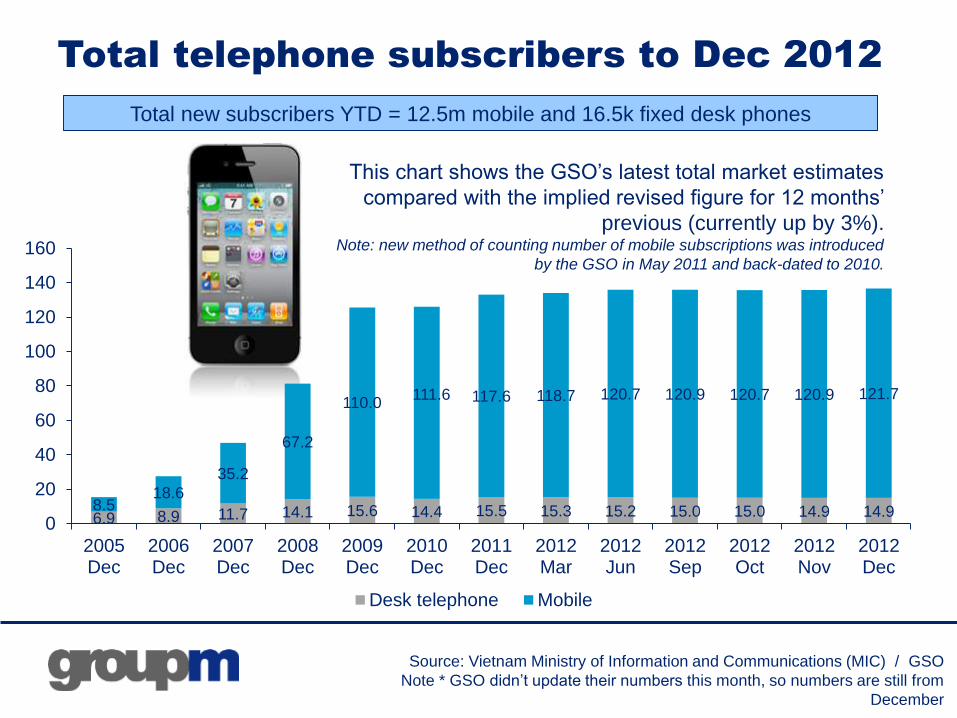
Total telephone subscribers to Dec 2012
Total new subscribers YTD = 12.5m mobile and 16.5k fixed desk phones
This chart shows the GSO’s latest total market estimates
compared with the implied revised figure for 12 months’
previous (currently up by 3%). Note: new method of counting number of mobile subscriptions was introduced
by the GSO in May 2011 and back-dated to 2010.
Source: Vietnam Ministry of Information and Communications (MIC) / GSO
Note * GSO didn’t update their numbers this month, so numbers are still from
December
6.9 8.9 11.7 14.1 15.6 14.4 15.5 15.3 15.2 15.0 15.0 14.9 14.98.518.6
35.2
67.2
110.0111.6 117.6 118.7 120.7 120.9 120.7 120.9 121.7
0
20
40
60
80
100
120
140
160
2005Dec
2006Dec
2007Dec
2008Dec
2009Dec
2010Dec
2011Dec
2012Mar
2012Jun
2012Sep
2012Oct
2012Nov
2012Dec
Desk telephone Mobile
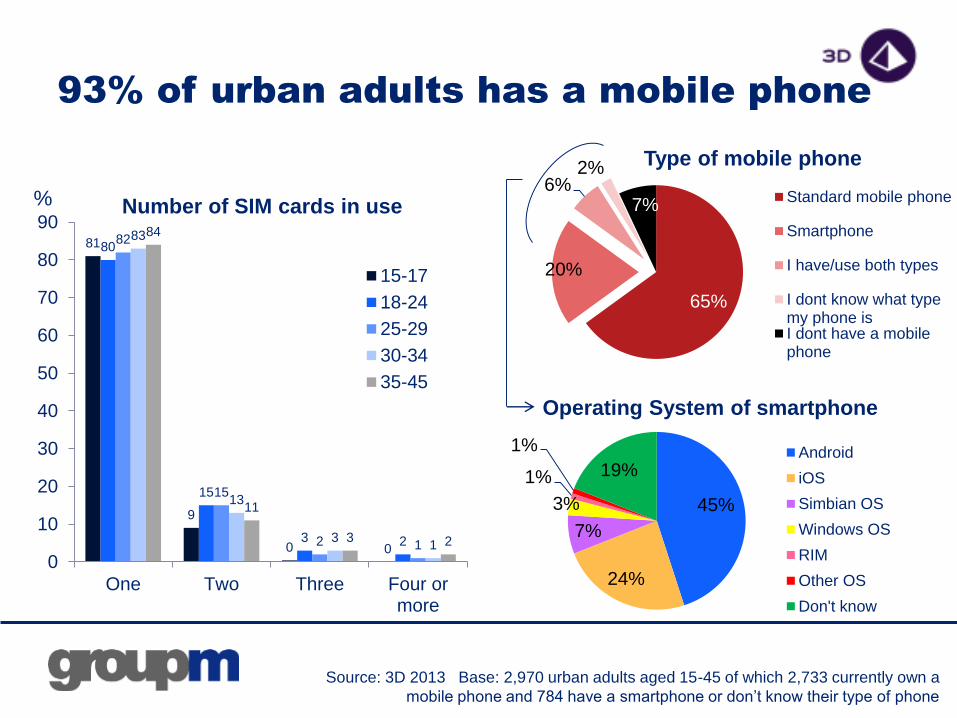
93% of urban adults has a mobile phone
81
9
0 0
80
15
3 2
82
15
2 1
83
13
31
84
11
3 2
0
10
20
30
40
50
60
70
80
90
One Two Three Four ormore
15-17
18-24
25-29
30-34
35-45
Source: 3D 2013 Base: 2,970 urban adults aged 15-45 of which 2,733 currently own a
mobile phone and 784 have a smartphone or don’t know their type of phone
Number of SIM cards in use%
65%
20%
6%2%
7%
Type of mobile phone
Standard mobile phone
Smartphone
I have/use both types
I dont know what typemy phone isI dont have a mobilephone
45%
24%
7%
3%
1%
1%
19%
Operating System of smartphone
Android
iOS
Simbian OS
Windows OS
RIM
Other OS
Don't know
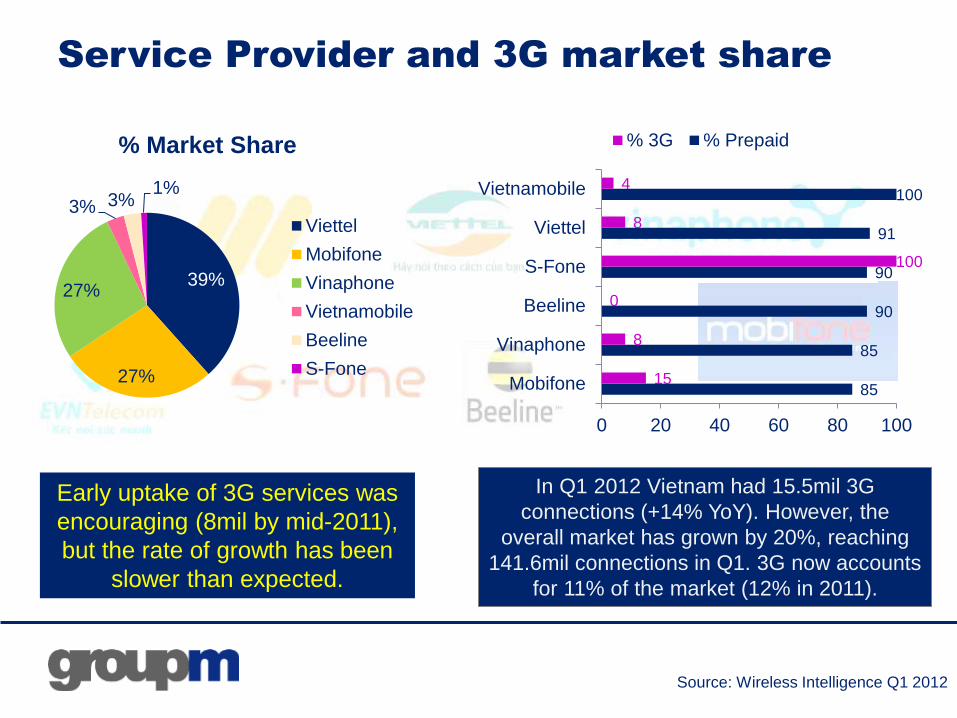
Service Provider and 3G market share
In Q1 2012 Vietnam had 15.5mil 3G
connections (+14% YoY). However, the
overall market has grown by 20%, reaching
141.6mil connections in Q1. 3G now accounts
for 11% of the market (12% in 2011).
Source: Wireless Intelligence Q1 2012
39%
27%
27%
3% 3%1%
% Market Share
Viettel
Mobifone
Vinaphone
Vietnamobile
Beeline
S-Fone85
85
90
90
91
100
15
8
0
100
8
4
0 20 40 60 80 100
Mobifone
Vinaphone
Beeline
S-Fone
Viettel
Vietnamobile
% 3G % Prepaid
Early uptake of 3G services was
encouraging (8mil by mid-2011),
but the rate of growth has been
slower than expected.
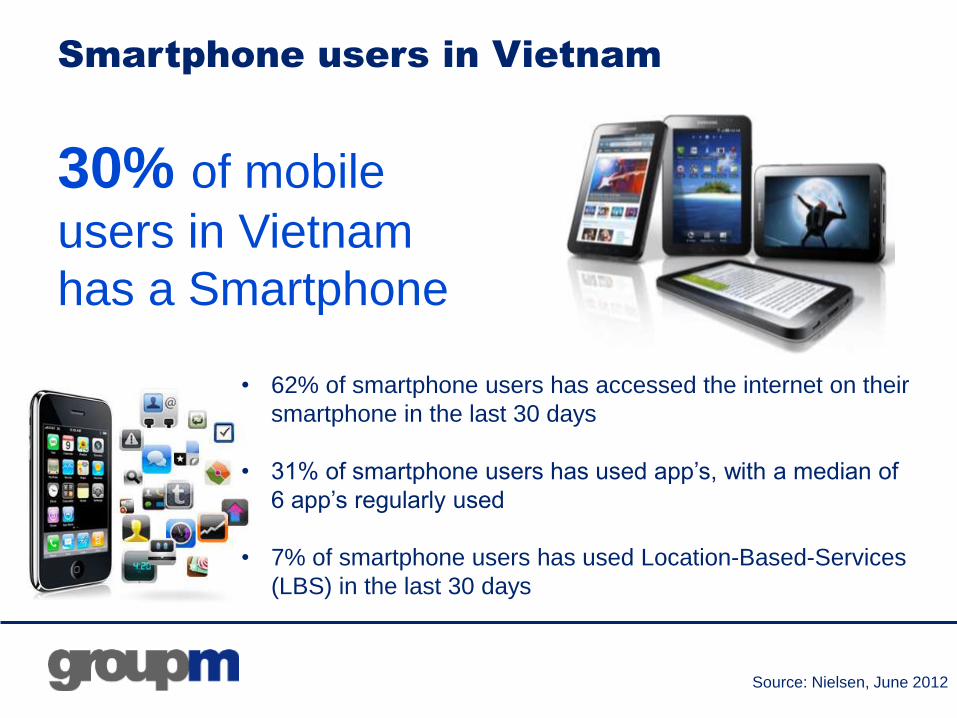
Smartphone users in Vietnam
Source: Nielsen, June 2012
30% of mobile
users in Vietnam
has a Smartphone
• 62% of smartphone users has accessed the internet on their
smartphone in the last 30 days
• 31% of smartphone users has used app’s, with a median of
6 app’s regularly used
• 7% of smartphone users has used Location-Based-Services
(LBS) in the last 30 days
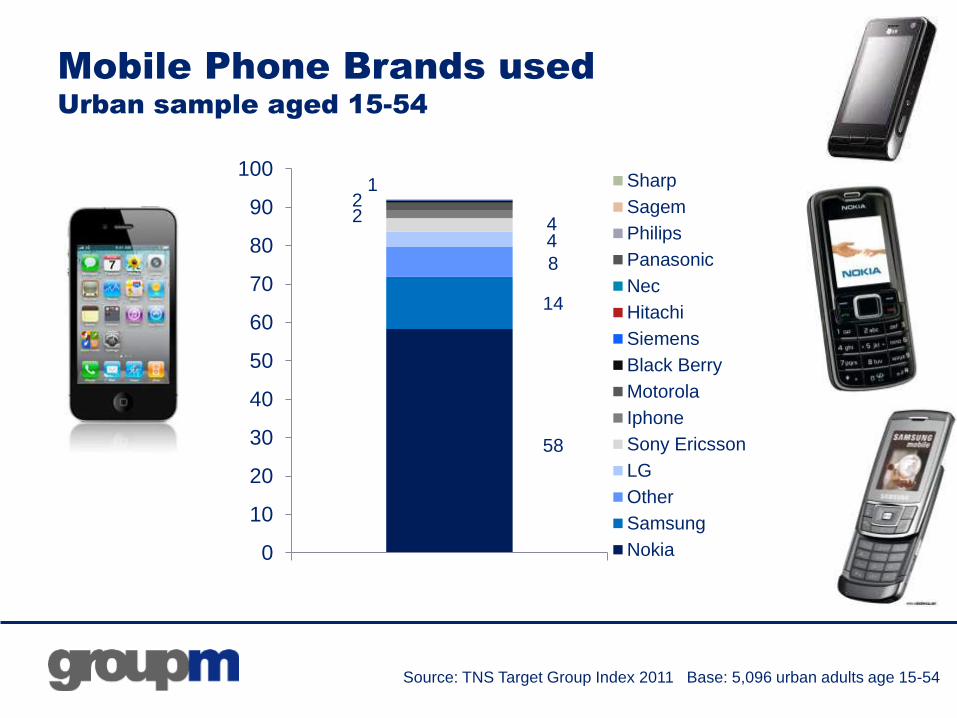
Mobile Phone Brands used
Urban sample aged 15-54
Source: TNS Target Group Index 2011 Base: 5,096 urban adults age 15-54
58
14
8
442
21
0
10
20
30
40
50
60
70
80
90
100Sharp
Sagem
Philips
Panasonic
Nec
Hitachi
Siemens
Black Berry
Motorola
Iphone
Sony Ericsson
LG
Other
Samsung
Nokia
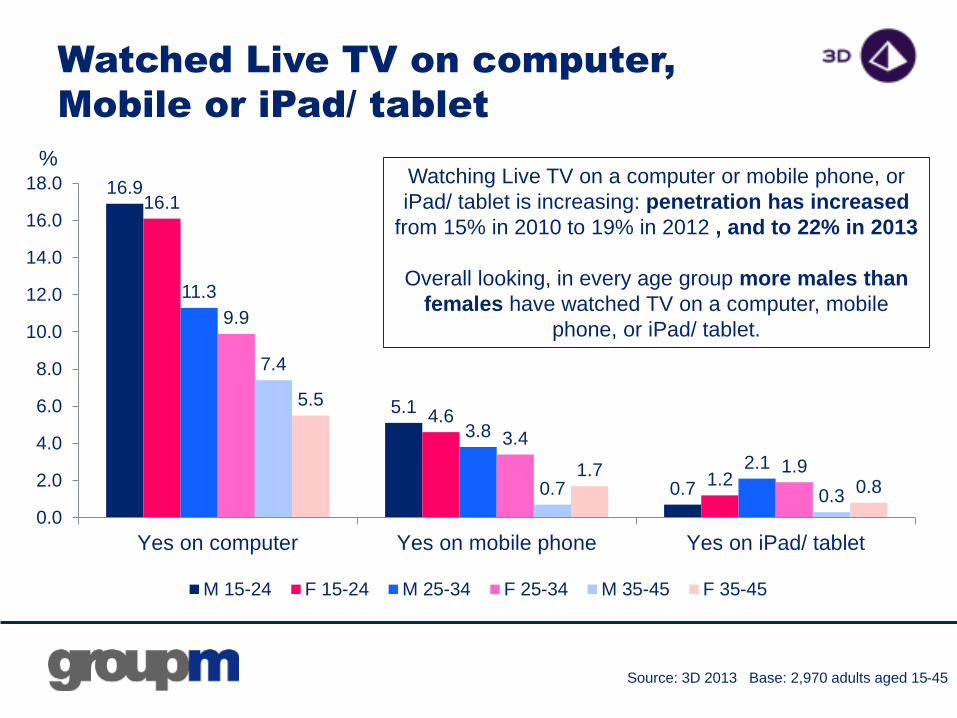
16.9
5.1
0.7
16.1
4.6
1.2
11.3
3.8
2.1
9.9
3.4
1.9
7.4
0.7 0.3
5.5
1.70.8
0.0
2.0
4.0
6.0
8.0
10.0
12.0
14.0
16.0
18.0
Yes on computer Yes on mobile phone Yes on iPad/ tablet
M 15-24 F 15-24 M 25-34 F 25-34 M 35-45 F 35-45
Watching Live TV on a computer or mobile phone, or
iPad/ tablet is increasing: penetration has increased
from 15% in 2010 to 19% in 2012 , and to 22% in 2013
Overall looking, in every age group more males than
females have watched TV on a computer, mobile
phone, or iPad/ tablet.
Source: 3D 2013 Base: 2,970 adults aged 15-45
%
Watched Live TV on computer,
Mobile or iPad/ tablet

Advertising revenue
Vietnam
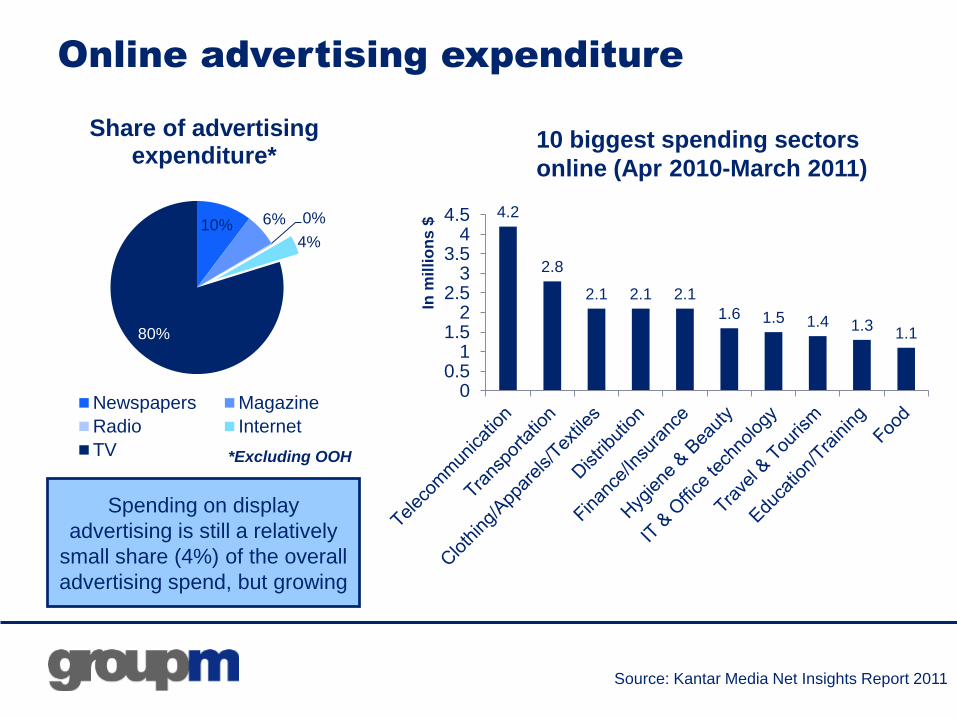
Online advertising expenditure
10% 6% 0%
4%
80%
Share of advertising expenditure*
Newspapers Magazine
Radio Internet
TV
Spending on display
advertising is still a relatively
small share (4%) of the overall
advertising spend, but growing
4.2
2.8
2.1 2.1 2.1
1.6 1.5 1.4 1.31.1
00.5
11.5
22.5
33.5
44.5
10 biggest spending sectors
online (Apr 2010-March 2011)
In m
illi
on
s $
Source: Kantar Media Net Insights Report 2011
*Excluding OOH