digital maps of jewish populations in europe (1750 – … maps of jewish populations in europe...
TRANSCRIPT

Digital maps of Jewish Populations in Europe (1750 – 1950)
for Online Viewing by the Public
Final report
February 2014
Project supported by the International Institute for Jewish Genealogy and Paul Jacobi Center at the Jewish National and University Library, Jerusalem
Sandy Crystall Bow, New Hampshire, USA
Dr. Laurence Leitenberg Geneva, Switzerland

1

2
Table of contents 1. Introduction......................................................................................................................4
2. Technical report ................................................................................................................5 Sources of Population Data ...................................................................................................... 5 Methods .................................................................................................................................. 7
Time frames.................................................................................................................................7 Creation of the maps...................................................................................................................7 Localities: 1750 to 1930 ............................................................................................................12 Localities: 1950..........................................................................................................................12 Data on Jewish populations ......................................................................................................14
3. Patterns in the Maps.......................................................................................................16 Background .............................................................................................................................16
Natural growth ..........................................................................................................................16 Concentration in the Eastern part of the continent ..................................................................16 International migration .............................................................................................................17 Urbanization..............................................................................................................................17 The Holocaust............................................................................................................................18
The Maps ................................................................................................................................18 1750 Map................................................................................................................................18 1800 and 1850 Maps ...............................................................................................................19
A marked dispersion thorough small towns..............................................................................19 The Pale of Settlement ..............................................................................................................20 A limited presence in major cities .............................................................................................20
1900 and 1930 Maps ...............................................................................................................21 A growing concentration in larger cities of Western and Central Europe.................................21 A spatial distribution that remains unique to Russia ................................................................21 Metropolization.........................................................................................................................22 Concentration towards the main centers: Three Europes ........................................................22 Decrease of small Jewish communities .....................................................................................23
1950 Map................................................................................................................................24 The immediate period after the war .........................................................................................24 The two largest centers of Jewish population...........................................................................24 Urbanization..............................................................................................................................25
4. Conclusion ......................................................................................................................26
5. Acknowledgments ..........................................................................................................28
6. Appendices .....................................................................................................................29 Bibliography............................................................................................................................29
GIS and Mapping sources ..........................................................................................................29 Population Sources....................................................................................................................30
References for data on Jewish population of localities, 1750 – 1950........................................42 Maps of Jewish Communities in Europe: 1750 – 1950......................................................44 User Guide.............................................................................................................................44

3

4
1. Introduction Population movement has been a central aspect in Jewish history for millennia. Academic researchers, using modern demographic and statistical techniques, have collected and aggregated large amounts of data and cartographic material relating to this phenomenon. However, the results are diffused in scholarly works and obstacles exist, especially for the non-specialist, to access and comprehend the data in their historical and geographic context. The aim of our project was to use existing information together with additional researched material on European Jewish populations in the modern era and import the data into a geographic information system (GIS) to create digital maps that are accessible online for use by the public. The growing interest in genealogy and in particular Jewish genealogy, extends beyond the creation of a family tree. Increasingly, genealogical researchers are seeking historical information to better understand the lands of their ancestors and the Jewish communities of which their ancestors were a part1. Maps that show Jewish populations at the community scale (and the geospatial database that is developed) will be of value to historians, genealogists and social scientists in general. In addition, the maps will open new perspectives for family historians and wider audiences with an interest in the changing nature and dimensions of Jewish populations in specific geographical areas. Developing the geospatial database to create the maps will provide additional opportunities for further analysis of the population data in a spatial context. In this report, we describe the methodological aspects of the project, the sources that have been used. We provide a short summary of the main substantive trends uncovered, the potential for further research using the spatial data, and provide instructions on how to use the maps in the form of a user guide.
1 Conferences sponsored by the International Association of Jewish Genealogical Societies typically
include lectures and presentations with geographical or historical focuses; See http://www.iajgs.org/prior-seminars.html.

5
2. Technical report Sources of Population Data In a statistical project like the present one, the definition of the population under study namely the question “who is a Jew”, cannot be answered according to the Jewish religious law. In many sources, such as a census, this definition is based on subjective criteria and typically depends on self-identification. The definition used is the one that has been used in the sources available and may differ from one source to the other (Bachi, 1965, pp.37-50; Della Pergola, 1993b, pp.276-281; Engelman, 1960, pp.1510-1511). Official statistical sources, such as population censuses may provide a large and good range of information about the Jewish population. However, some sources are more reliable than others. As it is based on self-declaration of the respondent, some may have been reticent to identify themselves as such upon historical grounds or upon perspective of future use of the results, like discriminatory measures against minorities (expulsion of the unwanted, special taxes, etc.)2. The methodology may also differ from one census to the next, and the variation between two successive counts in the same territory may reflect more methodological changes than effective differences in numbers3. We also observe differences of definition across Europe. In Central and Eastern European countries, unlike in the West, Judaism may be defined not only as a religion, but also (or sometimes only) based on ethnicity, nationality or mother-tongue (Yiddish)4. The availability of official statistics on Jewish populations differs in time and space. The period studied here covers a timeframe in which statistical data become more available. In the eighteenth century official demographic data were limited and irregular. One important source was the 1764-1765 census of Jews (liable to the poll tax) in the Polish-Lithuanian Commonwealth. It provides data of the principal Jewish community that lived in Europe at that time. In the course of the nineteenth century, the collection of official statistics became more systematic. Increasingly countries that conducted a regular census included information about religion. But in Russia, where almost half of the world Jewish population lived until 1914, no such
2 The various censuses conducted in the nineteenth century in Warsaw – where at that time lived one of
the most important Jewish communities – provides such an example (Bloch, 1977, pp.212-219; Corrsin, 1988, p.123; Eisenbach, 1988, pp.59-66). Also, after World War II it is believed that the figure given for the Jewish population in the Soviet census of 1959 may be significantly underestimated since many may have preferred not to identify as Jews to the census enumerators (American Jewish Year Book, 1962, p.366 and 1961, p.284; Goldstein and Goldstein, 1997, p.9, note 2).
3 An example is given again for Warsaw where until 1860, censuses generally counted only “persons enjoying the status of residents”, and from 1961 official statistics recorded both “residents” and “non-resident” inhabitants (those present in Warsaw for at least one month) (Bloch, 1977, pp.211-212 and 218).
4 That was the case for example in the 1921 and 1930 censuses of Czechoslovakia (Baron, 1964, pp.15-17), in the 1921 census of Republic of Poland (Halevi, 1961, p.96), in the Soviet Union’s censuses (Baron, 1972, p.886; Engelman, 1960, pp.1511 and 1532; Halevi, 1961, p.94; Rowland, 1986, pp.207-234) and in the 1953 census of Yugoslavia (Svob, 1997, p.106).

6
global enquiry was conducted before the end of the century. In 1897 the first and only census of the Russian Empire5 was conducted (Baron, 1972, p.884; Kuznets, 1975, p.68). The period of the most comprehensive statistics started with the twentieth century. A large majority of European Jewry lived in Central and Eastern European countries where demographic official statistics, including information about minorities, were collected regularly. The Austro-Hungarian Empire and, after its dismantling in 1918, Austria and Hungary, Germany, interwar Poland, Baltic states, Romania and other countries of this region had references to the Jewish minority in their population censuses (Baron, 1972, p.886; Schmelz, 1972d, p.344). In the course of the twentieth century, the major emigration of Jews westward caused the demographic data about this minority to become more limited. The censuses of some of the host countries provide little or no data about religion. The latter is confined to the private sphere. The Netherlands, Germany, Austria and Switzerland provide information about religion in their censuses; this is not the case with France, Great Britain, Belgium or Italy (Spain and Portugal as well) (Schmelz, 1972d, pp.344-345; Engelman, 1960, p.1511; Bachi, 1965, pp.40-41; Della Pergola, 1993b, p.279; Karady, 1990, pp.84-85). Besides a population census, another important direct source of data is provided by the registered members of the Jewish communities (such as synagogue membership). But one may note that the population included in those sources is usually not identical to the one considered in the censuses (some of the Jews are not members of the religious community). In addition, the community may comprise a territory different from the city district itself. When direct sources of data are not available, other documents and methods have helped make estimates, such as registers of births, marriages and deaths, school registers, censuses which do not have any reference to religion but from which information can be extracted (family names, place of birth, place of living, etc.), and surveys, etc.6. The summary above points out the relative reliability of some of those primary sources. Some sources may not be comparable to others. Some of their results have been discussed by scholars who, in some cases, a posteriori made adjustments and new estimations. The references that have been consulted for this project are mainly secondary sources based on the primary sources described above. Those references contain reevaluations that have been made by historians and demographers. Researchers must consider the data with caution to reduce the potential for misrepresentation. The secondary sources that have been consulted for this research can be classified in different categories:
• Periodic and main references in demography and statistics: American Jewish Year Book; Leo Baeck Institute Year Book; Papers in Jewish Demography; Zeitschrift für Demographie und Statistik der Juden and other references published up to 1930s by the Bureau für Statistik der Juden of Berlin.
5 The 1897 census of the Russian Empire excluded the area of Finland. 6 Some of those methods used for evaluating the Jewish population of Great Britain are described in
Coleman and Salt, 1992, pp.475, 479, 481 and 495; Lipman, 1990, pp.xv-xvi, 12, 52 and 204; Neustatter, 1955, pp.63-68; Pollins, 1982, p.73; The Jewish Year Book, 1898-1899, pp.27-28 and further publications; Rubinstein, 1996, p.196; Williams, 1976, pp.355-356.

7
• Articles extracted from the Jewish Encyclopedias on topics such “demography”,
“statistics,” “migrations” and on different countries, cities and localities: Encyclopedia Judaica, 1928 - 1934; Encyclopedia Judaica, 1972 and 2007; Evrejskaja enciklopedija, 1906 - 1913; Jüdisches Lexikon, 1927 - 1930; Magyar Zsidó Lexikon, 1929; Révai Nagy Lexikona, 1900 - 1920; The Jewish Encyclopedia, 1901 - 1906; The Universal Jewish Encyclopedia, 1939 - 1944.
• Books dedicated to Jewish communities destroyed in the Holocaust: Black Book of Localities Whose Jewish Population Was Exterminated by the Nazis, 1965; Klevan A. (ed.), Jewish Communities Destroyed in the Holocaust, 1982 and 1983; Mokotoff G. and Sack S.A., Where Once We Walked. A Guide to the Jewish Communities Destroyed in the Holocaust, 1991.
• Studies on Jewish demography, on Jewish migration or on specific Jewish communities in different cities, regions or countries.
For the year 1950, in addition to the references above, some data have been collected from the archives of the Documentation Center of Demography and Statistics of the Jews in the Avraham Harman Institute of Contemporary Jewry at the Hebrew University of Jerusalem. All the references that have been used are listed in the bibliography in the Appendix. The references used specifically for each country are also provided in the Appendix. Methods Time frames Six central years have been chosen to illustrate the distribution of the Jewish population: 1750, 1800, 1850, 1900, 1930 and 1950. The consistent fifty-year interval between each map enables comparison over time. The additional map of 1930 shows the situation that prevailed before the outbreak of World War II and shortly before the population’s movement induced by the rise of the Nazis after 1933. The 1930 map presents the significant number and size of the Jewish communities, a great portion of them decimated in the Holocaust, as may be observed in the 1950 map. These benchmark years however may disregard some time changes. The demographic consequences of World War I are partly hidden. A halt in the growth of some Eastern Jewish communities during World War I and the Civil War (e.g., the city of Lodz was partly destroyed) or significant growth of those who, like Ekaterinoslav (Dnipropetrovsk) or Warsaw hosted refugees (Lestschinsky, 1946, pp.156-177), cannot be seen through the 1900 and 1930 data. Creation of the maps Geographic information system (GIS) software is used for modern cartography, as well as many other applications given its capabilities to assist in the analysis of spatial data. Geographic Information science (GIscience) has been employed increasingly to analyze historical data, sometimes referred to as historical GIS or HGIS (Gregory, 2013; Knowles, 2000; Marti-Henneberg, 2005; Morillas-Torne, 2012; Bol, 2008). While historical GIS has been described as
8
being underused in the past (Roper, 2003), a significant body of work in this area has developed over the past ten years. There have been several national historical GIS projects developed, among them The Great Britain Historical GIS, which was the first, and also produced a web resource designed for the public, A Vision of Britain through Time (http://www.visionofbritain.org.uk/). In 2007, the United States Holocaust Memorial Museum (USHMM) sponsored a project “Geographies of the Holocaust” which examined “the potential benefits of applying geographic methods, such as spatial analysis and visualization, to the study of the Holocaust”. Several case studies were developed to demonstrate the use of GIS in increasing the understanding of this significant historical event (Beorn et al, 2009; USHMM, undated). There were several constraints that affected the choice of software needed to create the maps and display them once created. Online maps that the public has been accustomed to viewing require a map server to produce the map images as users “move” over the digital landscape. Since there were no resources available for ongoing costs associated with providing the maps over the Internet using a map server, other options had to be considered. Another constraint was that the maps had to be accessible online without the need for the user to have special software; that ruled out other options. We chose ESRI’s ArcGIS 10.x software to create the basic maps, and the Alta 4 HTML ImageMapper 13.x, to create tiles of the maps and an interface that enables the maps to be viewed through one’s browser and enables searches of the data as well. To produce the basic digital maps with the locations of the Jewish communities and their populations from 1750 to 1950, a geospatial database was created from the population data and geographic coordinates identified7. The first step in the creation of the maps was to review the population data8 and identify the geographic coordinates (longitude and latitude) of each community. Many communities are known by multiple names as a result of multiple languages and host countries that changed over time. Often multiple references were necessary to identify the geographic coordinates and confirm the country in which the community is located today. We used the population and town information, along with additional sources to identify or confirm the locations of the 827 localities and prepare them in a format that is usable in a GIS. The JewishGen Communities database, the GEOnet Names Server (GNS), and Google maps were among the online sources of information used to confirm the official (and variant) names and geographic coordinates of the localities to enable mapping. Once the official names and confirmation of the communities’ geographic coordinates were established, the data (community, location and population by year) were imported into ArcGIS 10.x. The geographic coordinate system used is the European Terrestrial Reference System 1989, with the Lambert Conformal Conic projection for conformal pan-European mapping at scales smaller than or equal to 1:500,000 (Annoni, 2001).
7 We have used the terms "locality” and “community” somewhat interchangeably in this project. 8 Laurence Leitenberg research on the distribution of the Jewish population in European cities for the
period of 1750 to 1930 has been used as a first basis for this project (Leitenberg L., La population juive des villes d’Europe, Croissance et répartition, 1750-1930, Bern, 2008).

9
In order to present the data in a manner that would work best visually, four maps were used to display the population data for the six timeframes: 1750, 1800 and 1850, 1900 and 1930, and 1950. Research for 1950 population data was ongoing through the course of the project. After the data were given a spatial reference in ArcGIS, the next consideration was how to symbolize the data on the maps. The populations of the hundreds of communities in the six timeframes range from single digits to more than 352,000. This provided a significant challenge in the presentation of the data. Although ArcGIS offers the capability to use proportional symbols – so the size of the symbols are directly proportional to the size of the population – this was infeasible given the large range in size of populations. As a result, we made the decision to use graduated symbols – in this case, circles. The next step in representing the data using graduated circles was to identify how the population values would be grouped or classified. Of 827 communities, more than 300 never had a population of more than 3,000 in the years of the maps. Only 13 communities had a Jewish population of more than 75,000 in 1930 (with one, Warszawa, as large as 352,600). These 13 cities – referred to as “Index Cities” – appear on all the maps regardless of their population. After reviewing several approaches, we applied a modified version of a classification approach that is used with “tail-heavy” distributions (Bin Jiang, 2013). The population data were classified into the following groups: 7,000 or less, 7,001 - 20,000, 20,001- 75,000, 75,001 - 150,000, and 150,001 - 353,000. Figure 1. The frequency distribution table produced by ArcGIS illustrates the tail-heavy distribution. The x axis is the population counts of the communities (grouped) and the y axis is the number of communities by population count.
For the first three timeframes, 1750, 1800 and 1850, only the three smaller classes are present; in the remaining three timeframes, 1900, 1930 and 1950, all five classes are used with the graduated circles to represent the populations. By making the circles semi-transparent, two timeframes of population data were represented on one map.
10
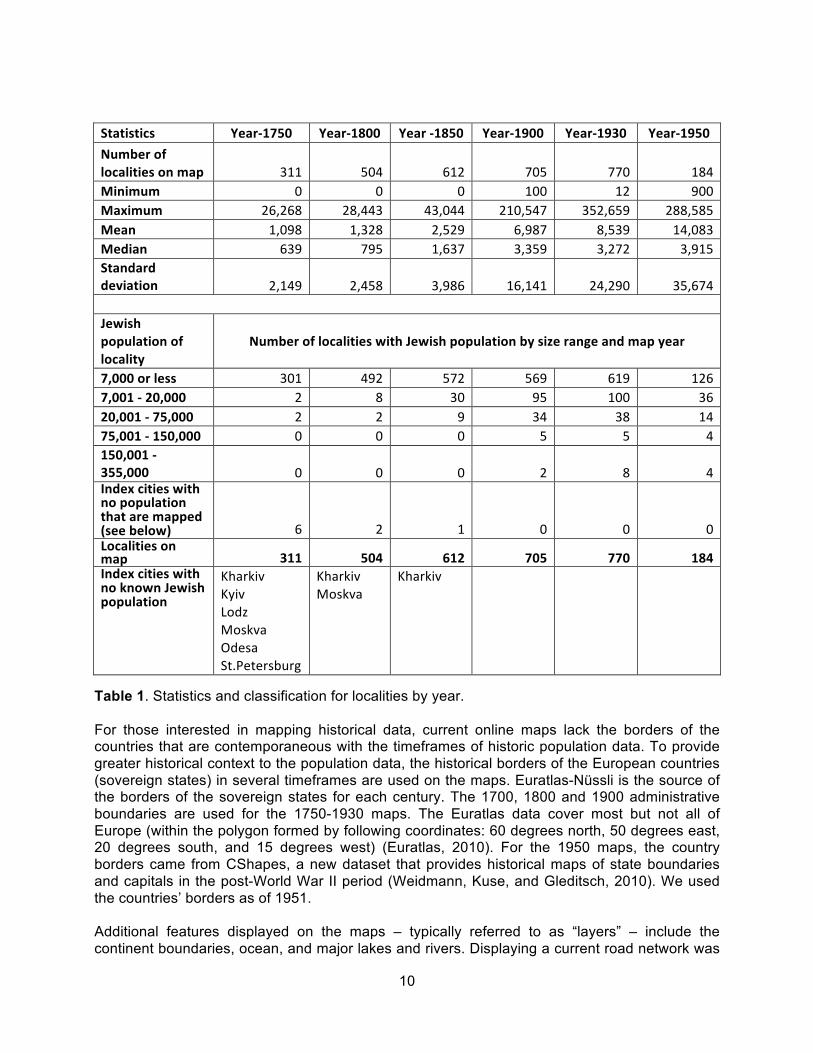
Statistics Year-‐1750 Year-‐1800 Year -‐1850 Year-‐1900 Year-‐1930 Year-‐1950
Number of localities on map 311 504 612 705 770 184 Minimum 0 0 0 100 12 900 Maximum 26,268 28,443 43,044 210,547 352,659 288,585 Mean 1,098 1,328 2,529 6,987 8,539 14,083 Median 639 795 1,637 3,359 3,272 3,915 Standard deviation 2,149 2,458 3,986 16,141 24,290 35,674 Jewish population of locality
Number of localities with Jewish population by size range and map year
7,000 or less 301 492 572 569 619 126 7,001 -‐ 20,000 2 8 30 95 100 36 20,001 -‐ 75,000 2 2 9 34 38 14 75,001 -‐ 150,000 0 0 0 5 5 4 150,001 -‐ 355,000 0 0 0 2 8 4 Index cities with no population that are mapped (see below) 6 2 1 0 0 0 Localities on map 311 504 612 705 770 184 Index cities with no known Jewish population
Kharkiv Kyiv Lodz Moskva Odesa St.Petersburg
Kharkiv Moskva
Kharkiv
Table 1. Statistics and classification for localities by year. For those interested in mapping historical data, current online maps lack the borders of the countries that are contemporaneous with the timeframes of historic population data. To provide greater historical context to the population data, the historical borders of the European countries (sovereign states) in several timeframes are used on the maps. Euratlas-Nüssli is the source of the borders of the sovereign states for each century. The 1700, 1800 and 1900 administrative boundaries are used for the 1750-1930 maps. The Euratlas data cover most but not all of Europe (within the polygon formed by following coordinates: 60 degrees north, 50 degrees east, 20 degrees south, and 15 degrees west) (Euratlas, 2010). For the 1950 maps, the country borders came from CShapes, a new dataset that provides historical maps of state boundaries and capitals in the post-World War II period (Weidmann, Kuse, and Gleditsch, 2010). We used the countries’ borders as of 1951. Additional features displayed on the maps – typically referred to as “layers” – include the continent boundaries, ocean, and major lakes and rivers. Displaying a current road network was
11
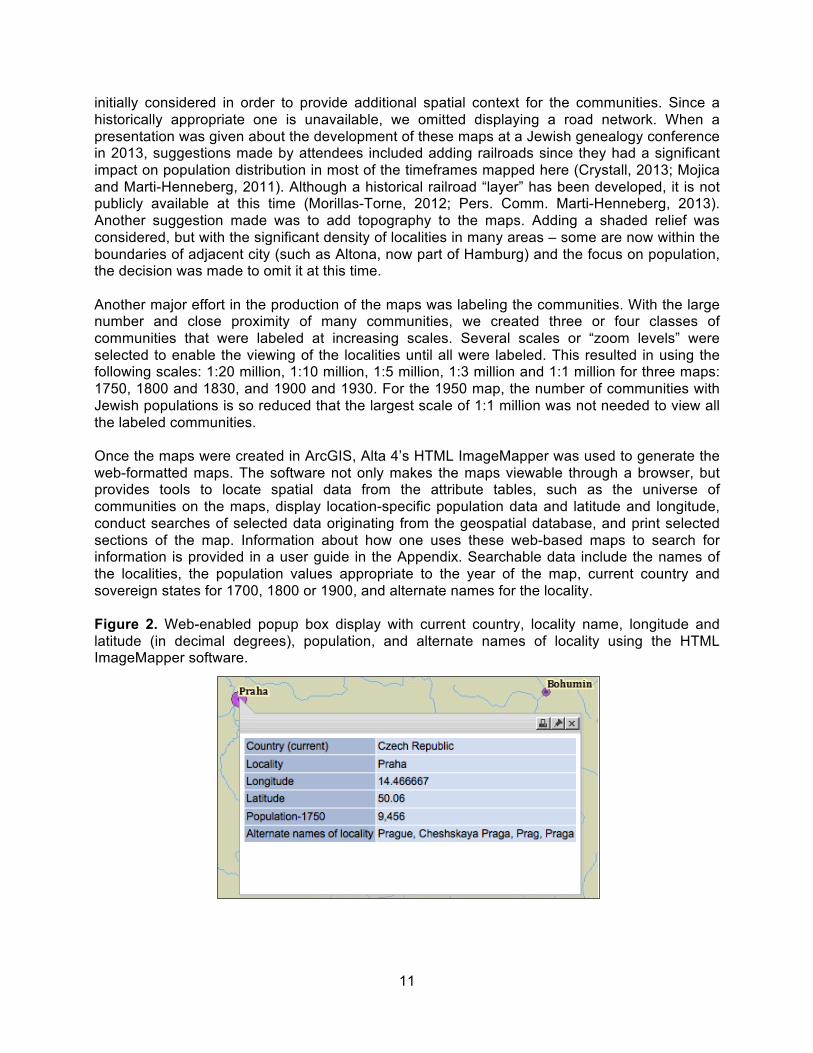
initially considered in order to provide additional spatial context for the communities. Since a historically appropriate one is unavailable, we omitted displaying a road network. When a presentation was given about the development of these maps at a Jewish genealogy conference in 2013, suggestions made by attendees included adding railroads since they had a significant impact on population distribution in most of the timeframes mapped here (Crystall, 2013; Mojica and Marti-Henneberg, 2011). Although a historical railroad “layer” has been developed, it is not publicly available at this time (Morillas-Torne, 2012; Pers. Comm. Marti-Henneberg, 2013). Another suggestion made was to add topography to the maps. Adding a shaded relief was considered, but with the significant density of localities in many areas – some are now within the boundaries of adjacent city (such as Altona, now part of Hamburg) and the focus on population, the decision was made to omit it at this time. Another major effort in the production of the maps was labeling the communities. With the large number and close proximity of many communities, we created three or four classes of communities that were labeled at increasing scales. Several scales or “zoom levels” were selected to enable the viewing of the localities until all were labeled. This resulted in using the following scales: 1:20 million, 1:10 million, 1:5 million, 1:3 million and 1:1 million for three maps: 1750, 1800 and 1830, and 1900 and 1930. For the 1950 map, the number of communities with Jewish populations is so reduced that the largest scale of 1:1 million was not needed to view all the labeled communities. Once the maps were created in ArcGIS, Alta 4’s HTML ImageMapper was used to generate the web-formatted maps. The software not only makes the maps viewable through a browser, but provides tools to locate spatial data from the attribute tables, such as the universe of communities on the maps, display location-specific population data and latitude and longitude, conduct searches of selected data originating from the geospatial database, and print selected sections of the map. Information about how one uses these web-based maps to search for information is provided in a user guide in the Appendix. Searchable data include the names of the localities, the population values appropriate to the year of the map, current country and sovereign states for 1700, 1800 or 1900, and alternate names for the locality. Figure 2. Web-enabled popup box display with current country, locality name, longitude and latitude (in decimal degrees), population, and alternate names of locality using the HTML ImageMapper software.
12
A User Guide has been developed to explain the data shown on the maps and how to use the map interface. The guide is provided in the Appendix. It has been designed to enable posting on the web for users to access and download. Research of 1950 Population Data Data on Jewish populations in 1950 were researched and compiled. We met Professor Sergio Della Pergola and Dr. Mark Tolts of the Harman Institute of Contemporary Jewry at the Hebrew University of Jerusalem in February 2013. They provided us valuable information and bibliographical orientation. Thanks to Professor Sergio Della Pergola, we have been able to consult the archives of the Division of Jewish Demography and Statistics at the Hebrew University of Jerusalem. During the entire period of the project, the authors were in frequent email communication on various aspects of the project, and regularly video-conferenced (via Skype) to discuss various approaches and address various questions that had arisen. Localities: 1750 to 1930 The localities that appear on the maps from 1750 to 1930 had at least once, at some time between 1750 and 1930, a Jewish population that was close to or greater than 3,000 souls, regardless of the entire population of the locality. With that condition we considered that we would get a significant number of localities, but also that it would be possible to obtain population data for all the Jewish communities that met the criterion. By this way we can observe the urbanization of the Jewish population and the convergence towards the main European cities but also the evolution of smaller communities. A total of 507 localities met this criterion. Some localities that surpassed or may have surpassed the criterion of 3,000 during in-between years are not apparent; therefore, in order not to miss any localities we also included some 276 additional localities whose Jewish population never reached 3,000 in one of those five central years but was close to that number. Localities: 1950 For the 1950 map, different criteria were applied. As a large number of Central and Eastern European Jewish communities vanished in the Holocaust, using the population criterion of at least 3,000 Jews was much less relevant for the 1950 timeframe. We identified about 104 communities with at least 3,000 Jews in the 1950 timeframe. In order to get a wide enough group of localities, we have documented communities whose Jewish population was at least around 1,000 in 1950. In a similar manner to the earlier maps, we also kept some localities (four) whose Jewish population did not reach 1,000 in 1950 but was close to that number (900 or more). Finally a total of 184 localities are shown on the 1950 map. Some 15 “new” localities, which were not on the maps of 1750 to 1930, appear on the 1950 map. The 15 localities are (according to their spelling shown on the maps): Dziezoniow, Legnica, Swidnica and Walbrzych (in Germany until 1945 and then in Poland’s Lower Silesia), Liberec (Bohemia), Groznyy, Makhachkala and Orenburg (Russia), Kulashi (Georgia), Nice (France), “Brighton and Hove” (Great Britain), Grenoble (France), Malmo (Sweden), Salzburg (Austria), and Lausanne (Switzerland).

13
Population data are more complete for some countries than for others. Some localities that would meet the threshold may not appear on the 1950 map because of the difficulty with locating population data for small communities, especially with the lower population threshold applied (1,000). This may be the case for the relatively small Jewish communities in the former Soviet Union and France. The population data for communities in the Union of Soviet Socialist Republics (USSR) are based on the Soviet population census of 1959, which provides figures for the Jewish population in the capitals of the Republics and other large cities. In general, data by ethnic origin or nationality for smaller towns are unavailable (Kochan, 1978, p.147; Millman, 1971, p.13). Yet for the Ukraine, information by nationalities in cities and towns has been analyzed. The results on the Jewish minority have been presented by John A. Newth in 1969 (Newth, 1969, pp.16-19). Mordechai Altshuler published Newth’s figures in 1987 (Altshuler, 1987, pp.85-87). Based on this last reference, data on Ukrainian towns with a Jewish population of at least 1,000 could be then included on the map. For the entire USSR, Ivor I. Millman has identified localities whose Jewish population may have been, according to his estimations, at least around 5,000, based on the 1959 census (Millman, 1971, pp.13-18). He presents his estimates by size ranges of Jewish population (“towns which may have around 5,000 Jews”, “towns with 5,000 to 10,000 Jews”, “towns with 10,000 to 20,000 Jews”, “towns with 20,000 to 30,000 Jews”, etc.). For the 1950 map, we have chosen the mid-point of the values in those size groups. For example, Millman estimated that Tiraspol was a town that had 10,000 to 20,000 Jews. We used the mid-point of 15,000 Jews. In summary, the 1950 map presents towns of the USSR whose Jewish population reached at least 5,000, except for the republic of Ukraine for which smaller Jewish communities have been included -- towns whose Jewish population was at least 1,000. Table 2 provides the Jewish population of each European Soviet Republic according to the 1959 population census.

14
Jewish population by European Soviet Republics according to the 1959 population census
Republic Jewish population
Belorussia 150,000 Ukraine 840,000 RSFSR a) 880,000 Latvia 37,000 Estonia 5,400 Lithuania 25,000 Moldavia 95,000 Georgia 51,600 Armenia 1,000 Azerbaijzhan 40,200 Total 2,125,200
Note: a) Russian Soviet Federative Socialist Republic, Including the Asian part of the RSFSR. Sources: Encyclopedia Judaica, Second Edition, New York and Jerusalem, 2007; Tolts M., “Jewish Demography of the Former Soviet Union”, in Della Pergola S. and Even J. (eds.), Papers in Jewish Demography 1997, Jerusalem, 2001, pp.109-139; Tolts M., “Population since World War I”, in Hundert G. D. (ed.), The YIVO Encyclopedia of Jews in Eastern Europe, New Haven and London, 2008 (http://www.yivoencyclopedia.org).
Table 2. Jewish population by European Soviet Republics according to the 1959 population census France is another country for which some rather small Jewish communities may be missing on the 1950 map. It was important to take into account the situation before the major immigration from Hungary, and mainly from North African countries (Tunisia, Egypt, Morocco and Algeria), which started around 1956. This immigration increased even more during the 1960s and in particular after the independence of Algeria in 1962 (Becker and Wieviorka, 1998, pp.268-271). We considered data for around 1955 (extracted from Institute of Jewish Affairs of the World Jewish Congress, 1956, p.206), rather than more recent data that may be more comprehensive but too far from the 1950s situation (such as those presented by the Fonds Social Juif Unifié for 1961 and 1966). Grenoble, with a Jewish population of 1,700 around the year 1955 is thereby the smallest French Jewish community shown on the map. It might be possible that some other Jewish communities had a population of 1,000 to 1,700 at that time. Data on Jewish populations Standardization of the data had to be done as much as possible to ensure the same group of population has been considered (all members of the family, not only the head of the family). The populations represent those of the localities and cities with their suburbs. To the extent possible, we did not consider the entire district or province. In some cases the only data available were
15
related to a larger territory than just the locality itself. For Zurich, Basel, and Geneva in Switzerland, we considered the territory of the whole “canton” (or “semi-canton” in the case of Basel-Stadt). The territory of those cantons is rather small and can be indeed considered like the suburb of their capital city. Population data collected sometimes were associated with a year that differed from the date of the map on which the information is presented. In many cases we used the data if it represented another year, as long as we believed it to be generally representative of the date of the map. For example, the 1897 census in Russia provides the basis for a significant amount of the data for 1900. The results of the population census of 1959, the first one conducted in USSR after World War II, provide data on localities in Soviet Union for the 1950 map. In other cases depending on the availability of the data and on history of the locality or the country, some adjustments and estimations (like interpolation between two different years) were made. Eastern and Central European countries underwent many changes between the end of World War II and 1950. Some survivors of the Holocaust returned to their homelands, some stayed where they were (sometimes temporarily), and many others emigrated to new places. After 1948, the Jewish population decreased in Europe as emigration to the newly founded State of Israel increased. The movement was especially strong from those countries where Communist rules affected the status of the Jews and stimulated greater migration. For Hungary, we have found data on Jewish populations for 1949 and 1955. Knowing that an important emigration took place after 1949 and that large-scale expulsion of the Jews from the cities to the provinces occurred in 1951, neither the data of 1949 nor those of 1955 would be representative of 1950. From those two years of data before and after 1950, we made estimations for the Jewish population of provincial localities in 1950.

16
3. Patterns in the Maps The maps cover a central period of Jewish history in Europe. As a consequence of a migratory movement initiated in the Middle Ages and fostered by population growth from the eighteenth century to World War II, Europe was predominant in the geographic distribution of world Jewry. At the dawn of the eighteenth century, it is estimated that 65.1% of world Jewry were living in Europe. This proportion increased further and reached more than 80% in the nineteenth century. After the nineteenth century the Jewish population continued to grow in absolute numbers. However, as a result of the overseas emigration stream, Europe’s share of world Jewry declined. Even so, on the eve of World War II, 57.2% of the Jewish population lived in Europe. After the Holocaust, this proportion fell to 32.2% (in 1948) (Della Pergola, 1989a, p.158; Della Pergola, 1993a, pp.587-590). Background From 1750 to 1950 the Jewish population underwent some major demographic changes that are apparent when the populations are mapped. Some of those changes were common to the general population and some were specific to this minority: important natural growth, concentration in the Eastern part of the continent, great migration, and urbanization. The changes described in the following sections provide a greater context for the maps. Natural growth The nineteenth century is characterized by a considerable growth of the total world population. The general population of Europe more than doubled in one century; from 180 million in 1800 it reached 390 million in 1900 (McEvedy and Jones, 1978, p.18). Among the Jewish population, this increase was even greater. From around 2.7 million in 1825 it grew to 8.7 million in 1900. On the eve of the outbreak of World War II, it reached its peak: 9.5 million Jews were living in Europe (figure for 1939) (Della Pergola, 1989a, p.158; Lestschinsky, 1929, p.132). Concentration in the Eastern part of the continent This growth in population had an impact on the spatial distribution of the Jewish population inside Europe. Indeed during the nineteenth century, the population growth was particularly significant among Jews in Eastern regions where a majority of Jews were living: Ukraine, Belorussia, Lithuania, Poland, Romania, Galicia and Hungary (Engelman, 1960, pp.1520-1522). In 1900 some 84.7% of the European Jews were living in the Eastern part of the continent and in the Balkans (including the European territories of Russia, Galicia, Hungary, Romania, Bucovina and Bulgaria), while “only” 40.0% of the total 400.6 million Europeans were living in those regions (Lestschinsky, 1929, p.132; Sunbarg, 1908, p.35). Hence more than 80% of localities shown on the maps are situated in the former Soviet Union, Poland or Romania. The greater density of communities in the East is particularly so for smaller communities. The larger communities are more evenly distributed among Eastern, Central and Western Europe.

17
International migration From the late Middle Ages, following their expulsion from different parts of Western Europe, Jews came in large numbers to Eastern Europe. Then from the late seventeenth century, the migratory movement from West to East was reversed for the first time. The Chmelnitsky massacres of 1648-49 in Poland, prompted the first exodus westward. In 1881, following the assassination of Tsar Alexander II in Russia, the westward migration movement accelerated. Millions of Jews moved westward, thus effecting significant changes in the size and composition of Jewish populations in their home communities and the Jewish groups in their countries of destination. Between 1881 and 1914, the exodus was particularly significant. It is estimated that 2.75 million Jews left their countries of residence, including 2 million from Russia. The rest were mainly from Romania ̶˗ fleeing economic hardship and anti-Semitism ̶ and from the Eastern parts of the Austro-Hungarian Empire (Galicia) affected by extreme poverty. The majority settled overseas, particularly in the United States (2.04 million) and also in Palestine, Canada, Argentina, South Africa and Brazil. Those who remained in Europe, some 350,000, although they constituted only a small percentage of those migrants, played a key role in the development of Jewish communities in Western and Central European cities (Schmelz, 1972c, pp.1519-1522). Although Jewish emigration was much larger relative to its population base than the non-Jewish population, the Jewish exodus fitted into the context of an overall emigration, which in the nineteenth century led some 60 million Europeans across the Atlantic (Irish, German, Italian, Austro-Hungarian, Polish, etc.) (Green, 1985, p.25; Lipman, 1990. p.44). To this international movement one may add Jewish migration within national boundaries, especially from the mid-nineteenth century ̶ those that cross the empires of Austria-Hungary, Germany and Russia. Given the size of these empires, these movements, sometimes on a large scale are similar to international migration. In those countries, where the economic development gaps between regions were significant, population flowed from the poorest areas to urban areas and the more developed industrial centers. Urbanization The nineteenth century was a turning point in the urbanization of Europe. Beginning in the United Kingdom in the eighteenth century in the wave of industrialization, the rapid urban growth started in several other countries during the first half of the nineteenth century before spreading to the entire continent in the second half. In 1750, 11.6% of the Europeans lived in localities with at least 5,000 inhabitants, the rate increased to 33.6% on the eve of the First World War (Bairoch, 1985, pp.107-115; Bairoch, 1998, pp.195-221). The number and size of cities underwent unprecedented growth and very large cities emerged. Traditionally Jews were more town dwellers than rural inhabitants. But until their emancipation they were kept away from many cities. The last decades of the nineteenth century were characterized by a growing concentration of Jews in larger cities. This trend of urbanization was much more rapid among Jews than among non-Jews.

18
The Holocaust The killing of millions of Jews and the annihilation of many Jewish communities in the Holocaust radically changed the structure of the European Jewry. In 1948, 3.7 million Jews were left in Europe (Della Pergola, 1989a, p.158) when the foundation of the State of Israel induced a new migration movement. The Maps The following sections provide a screen shot of the maps as they should appear online and review information on each map as well as background. 1750 Map Figure 3: Screenshot of 1750 opening map online.
In the beginning of the eighteenth century the total Jewish population living in Europe was 716,000 (Della Pergola, 1989a, p.158). In 1750 many Jewish communities did not yet exist. The map displays the countries’ borders for 1700 (Euratlas-Nüssli, 2009). The spatial distribution of European Jews was much different from the surrounding population and reflected historical events from the former centuries. When Jews had been expulsed from Western European countries ̶ from England (1290), France (fourteenth century), Spain (1492), Portugal (1496-1497), most of the Italian peninsula (sixteenth century) and most of the German cities and principalities (sixteenth century) – many found refuge in the Eastern part of the continent and especially in a less-developed Poland. Some Jews from Spain and Portugal settled in territories of the Ottoman Empire (Friesel, 1990, p.11). Hence in 1750 most of the Jewish communities were situated in the Eastern part of the continent and especially in Poland. However, the two main Jewish population centers shown on the map

19
are Salonika (Thessaloniki9 - 26,300 Jews), the Ottoman port in the South, and Amsterdam (20,200 Jews), the economic center in the Northwest Europe. Those two cities provided refuge for Jews and conversos from the Iberian Peninsula after the Inquisition and their expulsion at the end of the fifteenth century. Only Brody with 7,200 Jews and Prague (Praha) with 9,500 Jews are in the next largest population group (7,001 - 20,000). Finally in 1750, only a relatively small number of Jews were found in some of the major European cities, such as Paris (600), Naples (Napoli - 700) and Vienna (Wien - 500), and no Jewish populations were recorded in Madrid and Lisbon (Lisboa) where the banishment of Jews had not yet been lifted. 1800 and 1850 Maps Figure 4: Screenshot of combined 1800 and 1850 opening map.
The European Jewish population grew from 716,000 in 1700 to 2.7 million in 1825 and 4.1 million in 1850 (Della Pergola, 1989a, pp.158; Lestschinsky, 1929, p.132). Yet the geographical distribution of this minority was not much different from the one depicted for 1750. The map displays the countries’ borders for 1800 (Euratlas-Nüssli, 2009). A marked dispersion thorough small towns Prior to the emancipation, the distribution of the Jewish population was different from the general population due to various factors, including restrictions on residence, freedom of movement and the right to work. In some large cities Jews were not allowed to live; in Paris and Strasbourg until the emancipation at the end of the eighteenth century, in Vienna until 1848. In Russia until the Revolution of 1917, such large cities as Moscow (Moskva), Saint Petersburg (Sankt-Petersburg), Kiev (Kyiv) and Kharkov (Kharkiv) were partially closed to the Jews (Friesel, 1990, pp.32 and 41; Neher-Bernheim, 2002, pp.33 and 58). 9 In this chapter locality names are those in English used in the period concerned. When the locality
name is different from the one on the maps, the latter is indicated in parentheses (it is indicated only the first time the locality appears in the text).

20
Jews had long been scattered in rural areas or established in small urban or semi-urban areas. In those towns, they often engaged in handcrafts or trades. Closely related to the peasant world, they acted as intermediaries between the rural society and the market. The Pale of Settlement The sovereign state with the largest number of Jewish communities was the Russian Empire. After the partitions of Poland (1772, 1793 and 1795) masses of Jews living within the former Polish and Lithuanian territories came under Russian rule. Greater legislative restrictions on their economic activities and places of residence, starting with the establishment of the Pale of Settlement in 1791 where Jews were forced to live, kept their distribution pattern very different from the surrounding non-Jewish population. The Pale, located on the territory of ten former provinces of Poland and fifteen Western Russian provinces, acquired its final delimitation in 1835. It remained in force until the fall of the Russian Empire in 1917. Even within the Pale, restrictions varied. Jewish residence was limited in some cities, such as Kiev, and during part of the nineteenth century, along the Western border of the Empire (Friesel, 1990, p.32). A limited presence in major cities Until 1850, a map of the main Jewish centers was very different from the map of the main urban centers. The nine largest Jewish centers of that year (localities of more than 20,000 Jews) were Warsaw (Warszawa – 43,000 Jews), Salonika (39,500 Jews), Iasi (28,600 Jews), Berdichev (Berdichiv - 26,900 Jews), Amsterdam (25,200), Istanbul (24,300), Lemberg (Lviv - 24,100), Budapest (21,600) and Vilna (Vilnius – 20,300). Except for Istanbul, which had a total population of 753,000 inhabitants, and Amsterdam with 225,000 inhabitants, the other Jewish population centers were not among the largest cities of Europe. Some large cities of more than 200,000 inhabitants – London, Paris, Istanbul, Berlin, Vienna and Amsterdam – had at least 7,000 Jews. But in other cities of that size such as Saint Petersburg, Moscow, Naples, Liverpool, Glasgow, Manchester, Madrid, Dublin, Lisbon, Birmingham, Barcelona and Milan (Milano), the Jewish population was much smaller or absent. Those cities in Russia, Spain and Portugal, as well as Naples (a sovereign state in 1800), did not allow Jewish establishment or only partly so. For the growing urban centers of Great Britain, the immigration of the Jews would start later. Until the mid-nineteenth century at least, the overall Jewish presence in the largest cities of Europe was thus on average globally similar or less than that of all Europeans. In 1800, 1.6% of the general population and 0.9% of the European Jews were living in the five cities of 300,000 inhabitants or more. In 1850 those percentage were 2.8% and 1.9% respectively.

21
1900 and 1930 Maps Figure 5: Screenshot of combined 1900 and 1930 opening map.
The Jewish population of Europe reached 8.7 million in 1900 and increased up to 9.5 million in 1939 (Della Pergola, 1989a, p.158; Lestschinsky, 1929, p.132). In the course of the second half of the nineteenth century, radical changes occurred in the geographic distribution of this population. There were now some very large Jewish communities. In 1900 two of them, Warsaw and Budapest, had more than 150,000 souls. There were eight communities of that size in 1930 and four of them had even more than 200,000 Jewish inhabitants: Warsaw, London, Budapest and Lodz. The map displays the countries’ borders for 1900 (Euratlas-Nüssli, 2009). A growing concentration in larger cities of Western and Central Europe In Western Europe, intensive urbanization of the Jewish population followed the elimination of existing restrictions. The emancipation of the Jews was first granted by France in 1791, then by other countries in the next century. Following the abolition of restrictions and stimulated by economic development, Jews were encouraged to leave their villages or small towns. Convergence towards large cities accelerated. A spatial distribution that remains unique to Russia While freedom expanded in the West, a different picture emerged in the Russian Empire. A strong population expansion took place among Jews in the Pale of Settlement. About 1 million were living there in the beginning of the nineteenth century and in spite of the emigration, they were almost 5 million at the end of the century. About 96% of Jews of European Russia lived in the Pale, only a small elite was allowed to live outside. Overwhelmed, urban centers did not have economic structures capable of supporting such a demographic contribution. Livelihoods dwindled in this remote region of the most dynamic economic places (Friesel, 1990, p.32; Green, 1985, pp.20-28; Kuznets, 1975, pp.68-72). In 1881, following the assassination of Tsar Alexander II, successive pogroms occurred in southern Russia and Ukraine. The May Laws of 1882 provided a legal framework for persecution. Under the new provisions, Jews were not allowed to settle or to own land outside of

22
urban areas. Exclusion from villages in different districts of the Pale of Settlement contributed to the rush of hundreds of thousands towards larger towns or cities of the Pale and stimulated westward migration. Metropolization At the dawn of the twentieth century, the redrawn concentration of Jewish populations in the larger centers was proportionally greater than that of the overall population. The intensity of this process was such that Salo W. Baron described the process as “metropolization” rather than “urbanization” (Baron, 1937, volume 2, p.226; Engelman, 1960, p.1530). By 1900, 8.4% of the general population and 15.9% of the European Jews were living in 42 cities of more than 300,000 inhabitants. Jews represented 2.2% of the total European population but 4.2% of the population of those cities. In 1930, 11.8% of the general population and 30.7% of the Jews were living in the 66 cities of that size. Yet there were differences between the map of the largest Jewish communities and a map of the largest cities. The distinction between the East and West is apparent. While the largest Jewish communities of Western and Central Europe were located in the major cities of the continent, in the East on the other hand, they were located in cities of smaller sizes. If we consider the 19 localities that had at least 40,000 Jews in 1900, eight of them – London, Paris, Berlin, Vienna, Istanbul, Budapest, Warsaw and Amsterdam – were cities of over 500,000 inhabitants. The remaining Jewish communities were located in smaller cities (52,000 to 405,000 inhabitants): Odessa (Odesa), Lodz, Vilna, Kishinev, Bialystok, Minsk, Berdichev and Ekaterinoslav (Dnipropetrovsk), in the Russian Empire, Lemberg (Lviv) in Austria-Hungary, Salonika in the Ottoman Empire, and Bucharest (Bucuresti) in Romania. All those cities belonged to the Eastern sector of the continent. Conversely, the cities of over 500,000 inhabitants with a Jewish population of less than 40,000 persons were all Western cities (except for Moscow and Saint Petersburg in the Russian Empire): Glasgow, Hamburg, Liverpool, Manchester, Brussels (Bruxelles), Naples, Madrid, Barcelona, Birmingham and Munich (Munchen). After the Pale of Settlement was abolished in 1917, Jews left rural regions of Belorussia and Ukraine for industrial districts of Ukraine, Russia and important cities of the Pale that were once forbidden. Moscow, Saint Petersburg/Leningrad, Kiev and Kharkov, which had thus far had a relatively small Jewish population, as well as Odessa, became the largest centers of Soviet Jewry. Concentration towards the main centers: Three Europes By observing the Jewish population concentrations, three different Europes emerge -- Western Europe, Central Europe and Eastern Europe. Western Europe In Western Europe the migration to the capitals was generally very high. Around 1930 more than 75% of the 300,000 Jews living in Great Britain were in London, 77.8% of the 225,000 Jews living in France were in Paris, and 58.7% of the 111,900 Jews living in the Netherlands were in Amsterdam, two-thirds of the 60,000 Jews living in Belgium were in Brussels and Antwerp (Antwerpen). But Jews represented only a small minority of the population; not more than 6% of the total population of Paris, London, Brussels, Copenhagen (Amsterdam was quite an exception; in 1900 the Jews minority represented 11.6% of the population)10. 10 Sources of data for total and Jewish population by countries and for total population by cities are
mentioned in Leitenberg, 2008, pp.104-108, 116-119, 120-121, 123-129 and 211-222.

23
Eastern Europe In Eastern Europe the picture was different. The number of Jews in Russia/Soviet Union and in Poland was much larger and the dispersion across many communities was more pronounced than elsewhere. In 1931, “only” 11.3% of the 3.1 million Jews of the Republic of Poland lived in Warsaw. In 1926, 4.9% of the 2.7 million Jews of the entire Soviet Union lived in Moscow and 3.2% in Leningrad. In many places in the Pale of Settlement, more than half of the population was Jewish. According to the Russian census of 1897, that was the case in small localities, but also in some middle-sized towns over 50,000 inhabitants such as Berdichev, Bialystock, Vitebsk (Vitsyebsk) and Minsk. In the large cities of Warsaw, Odessa and Lodz, Jews were about one-third of the population at the end of the nineteenth century. Central Europe In Central Europe at the image of its geographical position, the situation was in between those in East and West in term of migration to the capitals. Around 1930, 46.0% of the 444,600 Jews of Hungary were in Budapest, 32.1% of the 499,700 German Jews were in Berlin, and “only” 9.9% of the 356,800 Jews of Czechoslovakia were in Prague. The proportion of Jews among the general population of the main cities was greater in Central Europe than in Western cities but as in the East, tended to diminish during the first decades of the twentieth century. Decrease of small Jewish communities After the lifting of restrictions on settlement, urbanization and economic development, the population of small Jewish communities decreased. A decline of the Jewish population in the small and middle-sized localities was observed after 1850 in Western Europe. In Russia, dispersion through the countryside lasted longer. A decrease of small and middle-sized Jewish communities is observed on the map between 1900 and 1930. Thus the decrease likely occurred after 1917 among middle-sized towns formerly situated in the Pale of Settlement such as Brest, Grodno (Hrodna), Pinsk and Slonim in Belorussia and Skvira (Skvyra) in Ukraine.

24
1950 Map Figure 6: Screenshot of 1950 opening map.
The 1950 map shows how the demographic composition of the Jews has been totally changed by the Holocaust. The absolute and relative size of European Jewry had considerably dropped; 3.7 million Jews remained in Europe in 1948, representing only 32.2% of the world Jewish population (Della Pergola, 1989a, p.158). The map displays the countries’ borders for 1951 (Weidmann, Kuse, and Gleditsch, 2010). While the map visually presents only the 1950 population, the popup boxes provide the 1930 populations as well. The Jewish communities that played a key role in the development of modern Jewry have largely been destroyed. In Eastern Europe, 90% of Polish Jewry – more than 3 million – perished; 90% of Lithuanian and Latvian Jewry; 85% of Czechoslovakian Jewry and 75% of Hungarian Jewry. In Western and Southern Europe, about 80% of Greek Jews and 75% of the Dutch Jews were exterminated. German Jewry virtually vanished; Jews were either killed or had left the country in the 1930s (Friesel, 1990, p.111). The immediate period after the war In the immediate period after the war, many survivors and refugees left Europe. During the following years, various events helped stimulate the exodus. Demonstrations of hostility such as the 1946 Kielce pogrom (Poland) contributed to encourage further departures. The establishment of communist regimes between 1945 and 1949 in the countries of Central and Eastern Europe was accompanied in many cases by hostile policies towards the Jews. In 1948 the foundation of the State of Israel made a mass migration possible and gave a great impulsion to population movement out of Europe. The two largest centers of Jewish population When looking at the map we can see quite a polarization of the Jewish population in two regions of Europe; Western Europe, especially the United Kingdom, on the one hand, the Soviet Union and on the other hand.

25
Unlike countries that had suffered German occupation, the United Kingdom had a larger Jewish population in 1950 than it had in 1939; 350,000 Jews were living there on the eve of World War II and 450,000 in 1950-1951 (American Jewish Yearbook, 1951, p.196; Friesel, 1990, pp.17 and 111). The Soviet Union had the largest portion of the European Jewish population. According to the 1959 Soviet census there were about 2.1 million Jews in the territory of the European Republics (including the Asian part of the Russian Republic, RSFSR) (Tolts, 2001, p.110). Inside the Soviet Union, important shifts occurred in the geographical distribution of the Jewish population during the war and in the postwar years. While Jewish populations in Belorussia and the Ukraine were largely annihilated by the Nazis and their accomplices, refugees and those subject to forced population displacement migrated towards Northern and Eastern European Russia, to Siberia and Central Asia. Some of those who survived stayed there after the war. The Russian Republic (RSFSR) thus became the largest center of Jewish population in the Soviet Union. Belorussia and Ukraine were substantially enlarged by new territories gained after 1940. In spite of the decrease in their Jewish population, in 1959 the two Republics harbored almost half of the Soviet Jewry (American Jewish Yearbook, 1952, pp.315-316; 1961, pp.284-285; Kochan, 1978, p.148; Rothenberg, 1967, pp.234-240). New cities that were not on the earlier maps appear on the 1950 map: Groznyy, Orenburg and Makhachkala in Russia, and Kulashi in Georgia. Urbanization Following the Holocaust, the convergence towards urban centers strengthened. Small Jewish communities in Central and Eastern countries have been definitively annihilated and the surviving population settled in cities. There are fewer Jewish communities on the 1950 map than on the earlier maps; 184 communities in 1950, while there are 770 in 1930 and 705 in 1900. In addition, it should be noted that the population criterion for including a community on the 1950 map is lower than for the earlier maps. In general, the communities shown on the 1950 map had at least 1,000 Jews, whereas for earlier maps the criterion was approximately 3,000 Jews. (The Soviet Union and France are exceptions, as the criteria for the 1950 map are at least 5,000 Jews for the Soviet Union and at least 1,700 Jews for France. See the Methods chapter). The four largest Jewish communities - with more than 150,000 Jews - were London, Moscow, Leningrad (Sankt-Petersburg) and Kiev. Their population had grown since 1930. The following largest Jewish centers – between 75,000 to 150,000 Jews – are Paris, Budapest, Odessa and Kharkov. Their Jewish population decreased from 1930. Budapest is the largest Jewish community in Central Europe.

26
4. Conclusion Over the course of two centuries, the Jewish population was subject to a variety of forces that contributed to the population distribution shown on the maps. In 1750, the map represents the population pattern prevailing before the emancipation of Jews. The changes through 1930 reflect the progressive concentration in larger urban centers and movement toward Western Europe. The Jewish communities grew in size rapidly. No community had more than 75,000 souls in 1850; there were 13 such communities in 1930 ̶ the “Index Cities”. Approximately 23.5% of the Jewish population of Europe was living in one of those 13 communities. During the period studied, maps of Jewish communities tended to conform to maps of urban centers. The 1950 map reflects the upheaval caused by the Holocaust ̶ many Jewish communities vanished and others have been dramatically reduced in number. Some of the trends that will mark the next decades are already observable on this map ̶ a strong continued concentration in larger centers and emigration to Israel will continue. Maps showing population changes in the decades following 1950 would however testify to significant events thereafter ̶ mass immigration from North Africa to France in the 1950s and the exodus of Jews from the USSR after the fall of the Berlin Wall in 1989; the exodus directed towards Israel in particular, but also in part to Germany. The data contained within the newly created geospatial database provide many opportunities for analysis. The power of GIS is not with the mapping, but the ability to analyze data spatially. It is possible to conduct quantitative analyses on the communities’ populations based on their proximity to one another or location within a certain country or region, etc. Access to other historical spatial data, such as railways in Europe, would provide additional options for analysis of the population data and settlement patterns. Incorporating additional population data would be useful to conduct analyses of the migration of populations or of populations within a given territory (sovereign state), for example, or beyond the boundaries of Europe. While we have not endeavored to document the entire Jewish population in every locality and country in Europe, conducting analyses of the data we have and what population is unaccounted for would provide additional insights into the proportion of the population that lived in the smaller communities. The existing geospatial database could be expanded -- with data that are available for other smaller Jewish communities, geographically to regions beyond Europe, and in time, to periods subsequent to 1950. The maps presented here display the countries’ borders at the beginning of each century (1700, 1800, 1900), except for the 1950 map. Further analysis of the population data would benefit from more time-appropriate presentations of the countries’ borders. For 1850 to present, such work has been developed and will be published later in 2014 (Marti-Henneberg, pers. comm.)11. Lastly, GIS software has the capability to display temporal data, which would be very appropriate for this type of study. Additional software (and possibly hardware) beyond that used in this 11 European Regions: The Territorial Structure of Europe since 1870 (Societies of Europe), Peter Flora,
Franz Kraus, Rick Walton and Daniele Caramani (Nov 28, 2014). Palgrave-MacMillan.

27
project would be necessary. By providing locations, names, population data, and countries in different timeframes, these maps provide a resource to historians, genealogists and other interested individuals that is otherwise unavailable. We look forward to receiving feedback from their use to identify even more opportunities to enhance the information that this new resource provides.

28
5. Acknowledgments The authors extend their gratitude to the International Institute for Jewish Genealogy for supporting this project, as well as those who provided valuable information or helped locate data on Jewish population or map data: Prof. Sergio Della Pergola (supervisor of the project) and Dr. Mark Tolts from the Avraham Harman Institute of Contemporary Jewry at the Hebrew University of Jerusalem; Prof. Hy Dao and Dr. Erik Gløersen from the Department of Geography at the University of Geneva; Prof. Rafael Matos in Sion (Switzerland); Prof. Nils Weidmann from the Department of Politics and Public Administration, University of Konstanz; Mrs Isabelle Pleskoff from the library of the Musee d’art et d’histoire du judaïsme in Paris; Mrs. Judith Markish from the library of the Jewish community in Geneva (CIG); Dr. Bruce Abramson, Prof. Amos Bairoch, Dr. Sev Fluss, Mrs Shalu Zurn and Dr. Pascal Zurn in Geneva; Mrs. Monika Hanková and Mr. Pavel Kocman of the Jewish Museum in Prague.

29
6. Appendices Bibliography GIS and Mapping sources Annoni, J.; Luzet, C; Gubler, E.; Ihde, J. edts. Map Projections for Europe, Institute for Environment and Sustainability for the European Commission. 2001.
Beorn, W., Cole, T., Gigiliotti, S., Giordano, A., Holian, A., Jaskot, P. B., Knowles, A. K., Masurovsky, M. and Steine, E. B., Geographies of the Holocaust. Geographical Review, 99: 563–574. 2009.
Bol, Peter K. “Creating a GIS for the History of China.” In Placing History: How Maps, Spatial Data, and GIS Are Changing Historical Scholarship, ed. Anne Kelly Knowles. (Redlands, Calif.: ESRI Press, 2008): 27-60.
Bol, Peter. “The China Historical Geographic Information System (CHGIS) Choices Faced, Lessons Learned.” For the Conference on Historical Maps and GIS Nagoya University, August 23-24, 2007.
Caramani, D., Flora, P., Kraus, F. and Marti-Henneberg, J. (2010) European Regions: the Territorial Structure of Europe, 1870-2000. London: Macmillan-Palgrave. To be published.
Crystall, Sandra. “Mapped! Jewish populations in Europe and beyond -- a resource for your research”, presented at the 33rd International Association of Jewish Genealogical Societies (IAJGS) International Conference on Jewish Genealogy, Boston, Massachusetts, August 9, 2013.
Gregory, I. N., Bennett, C., Gilham, V. L. and Southall, H. R. The Great Britain Historical GIS: from maps to changing human geography. Cartographic Journal, The. 39.1 (2002): 37-49.
Gregory, I. N., Marti-Henneberg, J. and Tapiador, F. J., Modelling long-term pan-European population change from 1870 to 2000 by using geographical information systems. Journal of the Royal Statistical Society: Series A (Statistics in Society), 173: 31–50. (2010)
JewishGen Communities Database. http://www.jewishgen.org/Communities/About.htm (accessed multiple dates)
Jiang, Bin. "Head/tail breaks: A new classification scheme for data with a heavy-tailed distribution." The Professional Geographer 65.3 (2013): 482-494.
Marti-Henneberg, Jordi. The map of Europe: continuity and change of the administrative boundaries (1850-2000). Geopolitics, 10, (2005) 791–815.
Martí-Henneberg, Jordi. Empirical Evidence of Regional Population Concentration in Europe, 1870–2000. Popul. Space Place 11, 269–281 (2005).
Mojica, Laia and J. Marti-Henneberg. Railways and Population Distribution: France, Spain, and Portugal, 1870-2000. Journal of Interdisciplinary History, Vol. 42, No. 1, Summer 2011, pp. 15-28.
Mokotoff, Gary, Sallyann Amdur Sack, Alexander Sharon. Where Once We Walked - Revised Edition. A Guide to the Jewish Communities Destroyed in the Holocaust. Avoytanu, Inc. Bergenfield (NJ), 2002.

30
Morillas-Torné, Mateu. Creation of a Geo-Spatial Database to Analyse Railways in Europe (1830-2010). A Historical GIS Approach. Journal of Geographic Information System, 2012, Vol 4, No. 2, pp.176-187 National Geospatial-Intelligence Agency. NGA GEOnet Names Server (GNS) http://earth-info.nga.mil/gns/html/index.html. (accessed multiple dates)
Roper, Christopher. Historical Mapping is Still Under-valued and Under-used. The Cartographic Journal Vol. 40 No. 2 pp.131–134 ICA Special Issue 2003 131. The British Cartographic Society 2003.
United States Holocaust Memorial Museum (USHMM). Undated. http://www.ushmm.org/learn/mapping-initiatives/geographies-of-the-holocaust
Placing History: How Maps, Spatial Data, and GIS are Changing Historical Scholarship, edts Anne Kelly Knowles, Amy Hillier, ESRI, Inc., 2008.
GIS Software and Data Layers Maps were created using ArcGIS® software by Esri and HTML ImageMapper 13.x. ArcGIS® and ArcMap™ are the intellectual property of Esri and are used herein under license. Copyright ©Esri. All rights reserved. For more information about Esri® software, please visit www.esri.com.
Alta4. HTML ImageMapper13.3. http://www.alta4.com
Euratlas-Nüssli. Base Maps. www.euratlas.com, all rights reserved. (1700, 1800 and 1900). 2009.
Euratlas. Georeferenced Vector Data Description. 2010-03-10 ESRI, 2008. Data layers. Continent, Lakes. Redlands, California Natural Earth. Free vector and raster map data at naturalearthdata.com (2013). Weidmann, Nils B., Doreen Kuse & Kristian Skrede Gleditsch (2010) The Geography of the International System: The CShapes Dataset, International Interactions: Empirical and Theoretical Research in International Relations, 36:1, 86-106. http://nils.weidmann.ws/projects/cshapes Population Sources Archives DDSJJ The Documentation Center of Demography and Statistics of the Jews, The Avraham
Harman Institute of Contemporary Jewry, The Hebrew University of Jerusalem, Mount Scopus, Jerusalem.
General population PB85 Bairoch P., De Jéricho à Mexico. Villes et économie dans l’histoire, Paris, Gallimard,
1985.
PB98 Bairoch P., “Une nouvelle distribution des populations: villes et campagnes”, in Bardet J.-P. and Dupaquier J. (eds), Histoire des populations de l’Europe, vol. 2: La révolution démographique 1750 - 1914, Paris, Fayard, 1998, pp.193-229.
BB88 Bairoch P., Batou J. and Chèvre P., La population des villes européennes de 800 à 1850, Geneva, Droz, 1988.
31
TC87 Chandler T., Four Thousand Years of Urban Growth. An Historical Census, New York, St David’s University Press, second edition, 1987.
MJ78 McEvedy C. and Jones R., Atlas of World Population History, London, Penguin Books, 1978.
BM93 Mitchell B.R., International Historical Statistics - Europe 1750 - 1988, New York, M Stockton Press, third edition, 1993.
PM92 Pietri N., Michel B. and Buffet C., Villes et sociétés urbaines dans les Pays germaniques, 1815 - 1914, Paris, Sedes, second edition, 1992.
GS08 Sundbarg G., Aperçus statistiques internationaux, New York, London and Paris, Gordon and Breach Science Publishers, 1908.
Jewish population Encyclopedias EN34 Encyclopedia Judaica, Berlin, Verlag Eschkol, 1928 - 1934, 10 volumes (from Aachen
to Lyra).
EJ Encyclopedia Judaica, Jerusalem, Keter Publishing House Ltd., 1972, 16 volumes and supplements.
EJ07 Encyclopedia Judaica, second edition, New York city and Jerusalem, Macmillan Reference USA and Keter Publishing House Ltd., 2007, 22 volumes.
EE13 Evrejskaja enciklopedija, S-Peterburg, Izd. Brokgauz-Efron, 1906 - 1913, 16 volumes.
JL30 Jüdisches Lexikon, Berlin, Jüdischer Verlag, 1927 - 1930, 5 volumes.
ZS29 Magyar Zsidó Lexikon, Budapest, 1929.
RL20 Révai Nagy Lexikona, Budapest, Révai Testvérek, 1900 - 1920.
JE06 The Jewish Encyclopedia, New York and London, Funk and Wagnalls Compagny, 1901 - 1906, 12 volumes.
UJ44 The Universal Jewish Encyclopedia, New York, Universal Jewish Encyclopedia Co., 1939 - 1944, 10 volumes.
Statistical references and periodicals AJ.. American Jewish Year Book, New York, The Jewish Publication Society of America and
The American Jewish Committee, 1899 – 2008 (http://www.ajcarchives.org/main.php?GroupingId=40) (various years consulted: AJ51; AJ52; etc.).
YV65 Black Book of Localities Whose Jewish Population Was Exterminated by the Nazis, Jerusalem, Yad Vashem, 1965.
YV82 Klevan A. (ed.), Jewish Communities Destroyed in the Holocaust, Jerusalem, Yad Vashem, 1982.
YV83 Klevan A. (ed.), Jewish Communities Destroyed in the Holocaust, Jerusalem, Yad Vashem, 1983.
GM91 Mokotoff G. and Sack S.A., Where Once We Walked. A Guide to the Jewish Communities Destroyed in the Holocaust, Teaneck (USA), Avotaynu Inc., 1991.
32
VJ03 Nossig A. (ed.), Jüdische Statistik, Berlin, Verein für jüdische Statistik, 1903.
SE14 Segall J., Internationale Konfessionsstatistik, Berlin, Bureau für Statistik der Juden, 1914. (Unpublished manuscript, transmitted by Prof. Sergio Della Pergola).
JY.. The Jewish Year Book, London, Joseph Jacobs, 1896 - .
ZD.. Zeitschrift für Demographie und Statistik der Juden, Berlin, Bureau für Statistik der Juden, 1905 - 1931 (various years consulted: ZD14; ZD26; ZD31; etc.).
www.jewishgen.org (consulted in April 2011)
Population, cities and migration RB65 Bachi R., “Buts et problèmes de la démographie juive”, in La vie juive dans l’Europe
contemporaine, Brussels, Editions de l’Institut de Sociologie de l’Université Libre de Bruxelles, 1965, pp.37-50.
RB76 Bachi R., Population Trends of World Jewry, Jewish Population Studies, Jerusalem, The Institute of Contemporary Jewry, The Hebrew University, 1976.
SB37 Baron S.W., A Social and Religious History of the Jews, New York, 1937, 3 volumes.
SB72 Baron S.W., “Population”, in Encyclopedia Judaica, Jerusalem, Keter Publishing House Ltd., 1972.
DP89a Della Pergola S., “Changing Patterns of Jewish Demography in the Modern World”, in Studia Rosenthaliana, supplement vol. 23 (2), 1989a, pp.154-174.
DP89b Della Pergola S., “Distribution résidentielle des Juifs dans quelques villes européennes et à Rome en particulier”, in Revue des Etudes juives, vol. 148 (1-2), 1989b, pp.69-92.
DP93a Della Pergola S., “Histoire démographique du peuple juif: Bref aperçu”, in Trigano S. (ed.), La société juive à travers l’histoire, vol. 4: Le peuple-monde, Paris, Fayard, 1993a, pp.573-620.
DP89c Della Pergola S., “Jewish Urban Ecology in European Cities: A Comparative Approach”, in Schmelz U.O. and Della Pergola S. (eds.), Papers in Jewish Demography 1985, Jerusalem, The Institute of Contemporary Jewry, The Hebrew University, 1989c, pp.303-336.
DP83 Della Pergola S., La trasformazione demografica della diaspora ebraica, Turin, Loescher, 1983.
DP93b Della Pergola S., “Modern Jewish Demography”, in Wertheimer J. (ed.), The Modern Jewish Experience. A Reader’s Guide, New York and London, New York University Press, 1993b, pp.275-290.
DP01 Della Pergola S., “Some Fundamentals of Jewish Demographic History”, in Della Pergola S. and Even J. (eds.), Papers in Jewish Demography 1997, Jerusalem, The Institute of Contemporary Jewry, The Hebrew University, 2001, pp.11-33.
UE60 Engelman U.Z., “Sources of Jewish Statistics”, in Finkelstein L. (ed.), The Jews. Their History, Culture, and Religion, vol. 2, New York, Harper & Row Publishers, third edition, 1960, pp.1510-1535.
UE44 Engelman U.Z., The Rise of the Jew in the Western World. A Social and Economic History of the Jewish People of Europe, New York, Behrman’s Jewish Book House, 1944.

33
EF90 Friesel E., Atlas of Modern Jewish History, New York, Oxford University Press, 1990.
LH46 Hersch L., “Jewish Migrations During the Last Hundred Years”, reprinted from: The Jewish People: Past and Present, vol. 1, New York, Jewish Encyclopedic Handbooks, 1946, pp.407-430.
IJ56 Institute of Jewish Affairs, European Jewry Ten Years after the War, New York, 1956.
AK86 Kahan A., Essays in Jewish Social and Economic History, Chicago and London, The University of Chicago Press, 1986.
KA94 Katz S., “Les migrations des populations ahkenazes”, in Baumgarten J., Ertel R., Niborski I. and Wieviorka A. (eds), Mille ans de cultures ashkenazes, Paris, Liana Levi, 1994, pp.282-286.
VK83 Klaff V.Z., “The Urban Ecology of Jewish Population: A Comparative Analysis”, in Schmelz U.O., Glikson P. and Della Pergola S. (eds.), Papers in Jewish Demography 1981, Jerusalem, The Institute of Contemporary Jewry, The Hebrew University, 1983, pp.343-361.
CJ38 La situation économique des minorités juives, vol. 1, Paris, World Jewish Congress, 1938.
LI08 Leitenberg L., La population juive des villes d’Europe, Croissance et répartition, 1750-1930, Bern, Peter Lang, 2008.
LE29 Lestschinsky J., “Die Umsiedlung und Umschichtung des jüdischen Volkes im Laufe des letzten Jahrhunderts”, in Weltwirtschaftliches Archiv, Kiel, Verlag von Gustav Fischer-Jena, vol. 30, 1929, pp.123-156 and vol. 32, 1930, pp.563-599.
LE48 Lestschinsky J., Crisis, Catastrophe and Survival. A Jewish Balance Sheet, 1914 - 1948, New York, Institute of Jewish Affairs of the World Jewish Congress, 1948.
LE34 Lestschinsky J., La situation économique des Juifs depuis la guerre mondiale, Paris, Rousseau and Cie éditeurs, 1934.
ML93 Levy M.-L., “Démographie, généalogie et Torah. Existe-t-il un peuple juif?”, in Schmelz U.O. and Della Pergola S. (eds.), Papers in Jewish Demography 1989, Jerusalem, The Institute of Contemporary Jewry, The Hebrew University, 1993, pp.29-35.
RN02 Neher-Bernheim R., Histoire juive de la Révolution à l’Etat d’Israël. Faits et documents, Paris, Seuil, 2002.
AR30 Ruppin A., Soziologie der Juden, Berlin, Jüdischer Verlag, 1930 and 1931, 2 volumes.
US07 Schmelz U.O. and Della Pergola S, “Demography”, in Encyclopedia Judaica, second edition, New York City and Jerusalem, Macmillan Reference USA and Keter Publishing House Ltd., 2007.
US72c Schmelz U.O., “Migrations”, in Encyclopedia Judaica, Jerusalem, Keter Publishing House Ltd., 1972c.
US72d Schmelz U.O., “Statistics”, in Encyclopedia Judaica, Jerusalem, Keter Publishing House Ltd., 1972d.
PS94 Schreiber J.-P., “Pour une étude typologique des conditions d’accès des Juifs à la modernité (1750 - 1850)”, in Migrazioni in Europa. Seccolo XIII - XVIII, Prato, Le Monnier, 1994, pp.415-440.
LW56 Wirth L., The Ghetto, Chicago, University of Chicago Press, second edition, 1956.

34
Publications by country in the period 1750 to 1950 Austria MC90 McCagg W.O. Jr., “The Jewish Position in Interwar Central Europe: A Structural Study
of Jewry at Vienna, Budapest, and Prague”, in Don Y. and Karady V. (eds), A Social and Economic History of Central European Jewry, New Brunswick (USA), Transaction Publishers, 1990, pp.47-81.
OW85 Oxaal I. and Weitzmann W.R., “The Jews of Pre-1914 Vienna. An Exploration of Basic Sociological Dimensions”, in Leo Baeck Institute Year Book, 1985, pp.395-432.
US72b Schmelz U.O., “Les Juifs en Autriche et en Allemagne. Aperçu démographique”, in Démographie et identité juive dans l’Europe contemporaine, Liege, Editions de l’Université de Bruxelles, 1972b, pp.163-183.
AU88 Thalmann R., “La communauté juive de Vienne jusqu’à l’Anschluss”, in Austriaca, vol. 26, 1988, pp.73-82.
Belgium
WB65 Bok W., “Considérations sur les estimations quantitatives de la population juive en Belgique”, in La vie juive dans l’Europe contemporaine, Brussels, Editions de l’Institut de Sociologie de l’Université Libre de Bruxelles, 1965, pp.89-106.
WB73 Bok W., “La population juive en Belgique au XIXe siècle”, in Schmelz U.O., Glikson P. and Della Pergola S. (eds.), Papers in Jewish Demography 1969, Jerusalem, The Institute of Contemporary Jewry, The Hebrew University, 1973, pp.43-82.
PS96 Schreiber J.-P., L’immigration juive en Belgique du Moyen Age à la Première Guerre mondiale, Brussels, Editions de l’Université de Bruxelles, 1996.
Bulgaria
LA72 Aslanov L., “Sur quelques questions des études historico-ethnographiques de la population juive dans la République Populaire Bulgare”, in Démographie et identité juive dans l’Europe contemporaine, Liege, Editions de l’Université de Bruxelles, 1972, pp.239-243.
HR03 Rimalovsky H., “Zur Statistik der bulgarischen Juden”, in Jüdische Statistik, Berlin, Verein für jüdische Statistik, 1903, pp.316-317.
Former Czechoslovakia (Bohemia, Moravia, Slovakia)
DA84 Dagan A., Hirschler G. and Weiner L. (eds.), The Jews of Czechoslovakia : Historical Studies and Surveys, Philadelphia, The Jewish Publication Society of America, 1984, vol. 3.
JF91 Fiedler J., Jewish Sights of Bohemia and Moravia, Prague, Sefer, 1991.
FF33 Friedmann F., “Einige Zahlen über die tschechoslovakischen Juden”, in Schriften zur Diskussion des Zionismus, vol. 9, Prague, J.A. Verb. “Barissia”, 1933.
TH08 Haas T., Die Juden in Mähren, Brno, Hickl, 1908.
IH72 Herman J., “La démographie juive en Bohême, problèmes et résultats”, in Démographie et identité juive dans l’Europe contemporaine, Liege, Editions de l’Université de Bruxelles, 1972, pp.193-207.

35
IH80 Herman J., “The Evolution of the Jewish Population in Prague, 1869 - 1939”, in Schmelz U.O., Glikson P. and Della Pergola S. (eds.), Papers in Jewish Demography 1977, Jerusalem, The Institute of Contemporary Jewry, The Hebrew University, 1980, pp.53-68.
KK96 Kuca K., Mesta a mestecka v Cechách na Morave a ve Slezsku, Prague, Libri, 1996.
AI58 “Les communautés juives en Tchécoslovaquie”, in Les Cahiers de l’Alliance Israélite Universelle, n°115, March 1958, pp.13-16.
MC90 McCagg W.O. Jr., “The Jewish Position in Interwar Central Europe: A Structural Study of Jewry at Vienna, Budapest, and Prague”, in Don Y. and Karady V. (eds), A Social and Economic History of Central European Jewry, New Brunswick (USA), Transaction Publishers, 1990, pp.47-81.
Denmark
CT18 Trap C., “Die Juden in Dänemark, insbesondere in Kopenhagen”, in Statistik der Juden, Berlin, Bureau für Statistik der Juden, 1918, pp.42-43.
France
BC98 Becker J.-J. and Wieviorka A. (eds), Les Juifs de France de la Révolution française à nos jours, Paris, Liana Levi, 1998.
BR97 Benbassa E., Histoire des Juifs de France, Paris, Seuil, 1997.
DP86 Bensimon D. and Della Pergola S., La population juive de France: socio-démographie et identité, Jerusalem, The Institute of Contemporary Jewry, The Hebrew University and Paris, Centre national de la recherche scientifique, second edition, 1986.
DB76 Bensimon-Donath D., Socio-démographie des Juifs de France et d’Algérie: 1867 - 1907, Paris, Publications orientalistes de France, 1976.
JC94 Cavignac J., Les Israélites bordelais de 1780 à 1850. Autour de l’émancipation, Paris, Publisud, 1991.
FS61 Fonds Social Juif Unifié, Guide communautés juives Belgique, France, Italie, Luxembourg, Pays-Bas, Paris, 1961.
FS66 Fonds Social Juif Unifié, Guide communautés juives de France, Paris, 1966.
NG89 Green N.L., “Jewish Migrations to France in the Nineteenth and Twentieth Centuries: Community or Communities?”, in Studia Rosenthaliana, supplement vol. 23 (2), 1989, pp.135-153.
NG85 Green N.L., Les travailleurs immigrés juifs à la Belle Epoque. Le “Pletzl” de Paris, Paris, Fayard, 1985.
JS39 Posener S., “The Immediate Economic and Social Effects of the Emancipation of the Jews in France”, in Jewish Social Studies, vol. 1, 1939, pp.271-326.
MW04 Winock M., La France et les Juifs de 1789 à nos jours, Paris, Seuil, 2004.
Germany GA91 Alexander G., “Die Entwicklung der jüdischen Bevölkerung in Berlin zwischen 1871 und
1945”, in Tel Aviver Jahrbuch für Deutsche Geschichte. Sozialgeschichte der Juden in Deutschland, Tel-Aviv, Institut für Deutsche Geschichte, Bleicher Verlag, 1991, pp.287-314.

36
AB88 Barkai A., Jüdische Minderheit und Industrialisierung. Demographie, Berufe und Einkommen der Juden in Westdeutschland 1850 - 1914, Tübingen, J.C.B. Mohr, 1988.
AG83 Goldstein A., “The Urbanization of Jews in Baden, Germany, 1825 - 1925”, in Schmelz U.O., Glikson P. and Della Pergola S. (eds.), Papers in Jewish Demography 1981, Jerusalem, The Institute of Contemporary Jewry, The Hebrew University, 1983, pp.71-86.
AK86 Kahan A., “The Urbanization Process of the Jews in Nineteenth - Century Europe”, in Kahan A., Essays in Jewish Social and Economic History, Chicago and London, The University of Chicago Press, 1986, pp.70-81.
WK75 Knopp W., Statistische Materialien zur Geschichte der jüdischen Bevölkerung. Dokumentation zur Geschichte der jüdischen Bevölkerung in Rheinland-Pfalz und im Saarland von 1800 bis 1945, Koblenz, Selbstverlag der Landesarchivverwaltung Rheinland-Pfalz, 1975.
SL83 Lowenstein S.M., “Jewish Residential Concentration in Post-Emancipation Germany”, in Leo Baeck Institute Year Book, 1983, pp.471-495.
SL80 Lowenstein S.M., “The Rural Community and the Urbanization of German Jewry”, in Central European History, vol. 13, 1980, pp.218-236.
PM92 Pietri N., “La minorité juive dans la ville à l’exemple de Francfort sur le Main et de Posen”, in Piétri N., Michel B. and Buffet C., Villes et sociétés urbaines dans les Pays germaniques, 1815 - 1914, Paris, Sedes, second edition, 1992, pp.105-111.
US89 Schmelz U.O., “Die Demographische Entwicklung der Juden in Deutschland von der Mitte des 19. Jahrhunderts bis 1933”, in Leo Baeck Institute Bulletin, 1989, pp.15-62.
US72b Schmelz U.O., “Les Juifs en Autriche et en Allemagne. Aperçu démographique”, in Démographie et identité juive dans l’Europe contemporaine, Liege, Editions de l’Université de Bruxelles, 1972b, pp.163-192.
SE10 Segall J., Die Entwicklung der jüdischen Bevölkerung in München 1875-1905; ein Beitrag zur Kommunalstatistik, Berlin, Bureau für Statistik der Juden, 1910.
Greece
JB92 Barnaï J., “La communauté juive de Salonique (1430 - 1943)”, in Méchoulan H. (ed.), Les Juifs d’Espagne, histoire d’une diaspora 1492 - 1992, Paris, Liana Levi, 1992, pp.397-408.
EH78 Eléments d’histoire de la communauté israélite de Thessaloniki, Thessalonique, Communauté Israélite de Thessalonique, 1978.
GV92 Molho R., “Le Renouveau...”, in Veinstein G. (ed.), Salonique 1850 - 1918. “La ville des Juifs” et le réveil des Balkans, Paris, Autrement, 1992, pp.64-78.
JN78 Nehama J., Histoire des Israélites de Salonique, vol. 6 and 7, Thessaloniki, Communauté israélite de Thessalonique, 1978.
Hungary
JS83 Don Y. and Magos G., “The Demographic Development of Hungarian Jewry”, in Jewish Social Studies, vol. 45 (3-4), 1983, pp.189-216.

37
KY90 Karady V., “Demography and Social Mobility: Historical Problem Areas in the Study of Contemporary Jewry in Central Europe (With special reference to Hungary) ”, in Don Y. and Karady V. (eds), A Social and Economic History of Central European Jewry, New Brunswick (USA), Transaction Publishers, 1990, pp.83-119.
AK22 Kovács A., A zsidók térfoglalása Magyarországon, Budapest, chez l’auteur, 1922.
ZS29 Magyar Zsidó Lexikon, Budapest, 1929.
MZ89 Magyarországi zsinagógák, Budapest, Müszaki Könyvkiadó, 1989.
MY53 Meyer Peter. et al., The Jews in the Soviet Satellites, Westport (Connecticut), Greenwood Press, second edition, 1971.
TS97 Stark T., “Hungarian Jewry during the Holocaust and after Liberation”, in Della Pergola S. and Even J. (eds.), Papers in Jewish Demography 1993, Jerusalem, The Institute of Contemporary Jewry, The Hebrew University, 1997, pp.139-145.
Ireland HY72 Hyman L., The Jews of Ireland from Earliest Times to the Year 1910, London, The
Jewish Historical Society of England and Jerusalem, Israel Universities Press, 1972.
DK98 Keogh D., Jews in Twentieth-Century Ireland, Refugees, Anti-Semitism and the Holocaust, Cork, Cork University Press, 1998.
Italy
RB62 Bachi R., “The Demographic Development of Italian Jewry from the Seventeenth Century”, in The Jewish Journal of Sociology, vol. 4 (2), 1962, pp.172-191.
DP72c Della Pergola S., The Demography of Italian Jews, Jerusalem, The Hebrew University, 1972 (doctoral thesis).
Netherlands MA72 Akker M., “Progrès de la démographie juive aux Pays-Bas”, in Démographie et identité
juive dans l’Europe contemporaine, Liege, Editions de l’Université de Bruxelles, 1972, pp.73-78.
EB36 Boekman E., Demografie van de Joden in Nederland, Amsterdam, M. Hertzberger, 1936.
RC84 Cohen R., “Boekman’s Legacy: Historical Demography of the Jews in the Netherlands”, in Michman J. (ed.), Dutch Jewish History, Jerusalem, Institute for Research on Dutch Jewry, The Hebrew University, 1984, pp.519-540.
RC85 Cohen R., “Family, Community and Environment: Early Nineteenth-Century Dutch Jewry”, in Studia Rosenthaliana, vol. 19 (2), 1985, pp.321-341.
MB92 Michman J., Beem H. and Michman D., Pinkas, geschiedenis van de joodse gemeenschap in Nederland, Amsterdam, Joods Historisch Museum, 1992.
Poland
BB77 Bloch B., “Spatial Evolution of the Jews and General Population of Warsaw, 1792 - 1939”, in Schmelz U.O., Glikson P. and Della Pergola S. (eds.), Papers in Jewish Demography 1973, Jerusalem, The Institute of Contemporary Jewry, The Hebrew University, 1977, pp.209-234.

38
BB83 Bloch B., “Urban Ecology of the Jewish Population of Warsaw, 1897 - 1938”, in Schmelz U.O., Glikson P. and Della Pergola S. (eds.), Papers in Jewish Demography 1981, Jerusalem, The Institute of Contemporary Jewry, The Hebrew University, 1983, pp.381-400.
JJ72 Bronsztejn S., “Les problèmes démographiques de la population juive en Basse Silésie d’après-guerre”, in Démographie et identité juive dans l’Europe contemporaine, Liege, Editions de l’Université de Bruxelles, 1972, pp.207-238.
JJ64 Bronsztejn S., “The Jewish Population of Poland in 1931”, in The Jewish Journal of Sociology, vol. 6, 1964, pp.3-29.
SC88 Corrsin S.D., “Aspects of Population Change and of Acculturation in Jewish Warsaw at the End of the Nineteenth Century: The Censuses of 1882 and 1897”, in Polansky A. (ed.), Polin. A Journal of Polish-Jewish Studies, vol. 3, Oxford, Basil Blackwell for the Institute for Polish-Jewish Studies, 1988, pp.122-141.
AE88 Eisenbach A., “The Jewish Population in Warsaw at the Turn of the Eighteenth Century”, in Polansky A. (ed.), Polin. A Journal of Polish-Jewish Studies, vol. 3, Oxford, Basil Blackwell for the Institute for Polish-Jewish Studies, 1988, pp.46-77.
BZ85 Fijalkowski P., “Zydzi sochaczewscy”, in Biuletyn Zydowskiego Instytutu Historycznego w Polsce (Bulletin of the Jewish Historical Institute in Poland), vol. 3-4, 1985, pp.21-39.
PG77 Glikson P., “Jewish Population in the Polish People’s Republic, 1944 - 1972”, in Schmelz U.O., Glikson P. and Della Pergola S. (eds.), Papers in Jewish Demography 1973, Jerusalem, The Institute of Contemporary Jewry, The Hebrew University, 1977, pp.235-253.
GW05 Gawryszewski A., Ludność Polski w XX wieku [The population of Poland in the 20th century], Warszawa, Instytut Geografii i Przestrzennego Zagospodarowania im. Stanisława Leszczyckiego, 2005, pp.299-300.
WK17 Kaplun-Kogan W.W., Die jüdische Sprach und Kulturgemeinschaft in Polen, Berlin and Vienna, R. Löwit-Verlag, 1917.
YI46 Lestschinsky L., “The Jews in the Cities of the Republic of Poland”, in YIVO Annual of Jewish Social Science, vol. 1, 1946, pp.156-177.
AM46 Melezin A., Przyczynek do znajomosci stosunkow demograficznych wsrod ludnosci zydowskiej w Lodzi, Krakowie i Lublinie podezas okupacji niemieckiej, Lodz, Centralna Zydowska Komisja Historyczna, 1946. (Includes summary in English on the demographic processes among the Jewish population of the towns Lodz, Cracow and Lublin, during the German occupation period, pp. 61-72).
WS83 Sanning W.N., The Dissolution of Eastern European Jewry, Torrance California, Institute for Historical Review, 1983.
ST89 Stampfer S., “The 1764 Census of Polish Jewry”, in Annual of Bar-Ilan University, Studies in Judaica and the Humanities, vol. 24-25, Ramat Gan, 1989, pp.41-59.
Romania
IM83 Millman I.I., “The Jewish Population of Romania: Continuity and Decline”, in Schmelz U.O., Glikson P. and Della Pergola S. (eds.), Papers in Jewish Demography 1981, Jerusalem, The Institute of Contemporary Jewry, The Hebrew University, 1983, pp.163-172.

39
WS83 Sanning W.N., The Dissolution of Eastern European Jewry, Torrance California, Institute for Historical Review, 1983.
Russia / Republics of ex-Soviet Union AL87 Altshuler M., Soviet Jewry since the Second World War. Population and Social
Structure, Studies in Population and Urban Demography, n°5, New York, Westport and London, Greenwood Press, 1987.
BS06 Die sozialen Verhältnisse der Juden in Russland, Berlin, Bureau für Statistik der Juden, 1906.
GG97 Goldstein S. and Goldstein A., Lithuanian Jewry 1993: A Demographic and Sociocultural Profile, Jewish Population Studies 28, Jerusalem, The Institute of Contemporary Jewry, The Hebrew University, 1997.
HH61 Halevi H.S., “The Demography of Jewish Communities in Eastern Europe”, in Papers in Jewish Demography 1957, Part I, Jerusalem, Association for Jewish Demography and Statistics, 1961, pp.94-100.
AK86 Kahan A., Essays in Jewish Social and Economic History, Chicago and London, The University of Chicago Press, 1986.
ZK75 Katz L. (ed.), Handbook of Major Soviet Nationalities, New York, The Free Press, 1975.
LK78 Kochan L. (ed.), The Jews in Soviet Russia Since 1917, Oxford, London, New York, Oxford University Press, third edition, 1978.
KO91 Konstantinov V., “Jewish Population of the USSR on the Eve of the Great Exodus”, in Dymerskaya-Tsigelman L. and Cohen Y.E. (eds), Jews and Jewish Topics in the Soviet Union and Eastern Europe, n°3 (16), Jerusalem, Centre for Research and Documentation of East European Jewry, The Hebrew University, Winter 1991, p.8.
KU75 Kuznets S., “Immigration of Russian Jews to the United States: Background and Structure”, in Perspectives in American History, vol. 9, 1975, pp.35-124.
WD71 Meyer P., Weinryb B.D., Duschinsky E. and Sylvain N., Jews in the Soviet Satellites, Westport (Connecticut), Greenwood Press, second edition, 1971.
IM71 Millman Ivor I., “Major Centres of Jewish Population in the USSR and a Note on the 1970 Census”, in Soviet Jewish Affairs , n°1, June 1971, pp. 13-18.
NW69 Newth J.A., “Jews in the Ukraine”, in Bulletin on Soviet and East European Jewish Affairs, n°3, 1969, pp.16-19.
PI84 Pinkus B., The Soviet Government and the Jews, 1948 – 1967, A documented study, Cambridge, Cambridge University Press, 1984.
RO67 Rothenberg J., “How Many Jews are in the Soviet Union”, in Jewish Social Studies, 1967, n°4, pp.234-40.
JS86 Rowland R.H., “Geographical Patterns of the Jewish Population in the Pale of Settlement of the Late Nineteenth Century Russia”, in Jewish Social Studies, vol. 48 (3-4), 1986, pp.207-234.
WS83 Sanning W.N., The Dissolution of Eastern European Jewry, Torrance California, Institute for Historical Review, 1983.
NS91 Schoenburg N. and Schoenburg S., Lithuanian Jewish Communities, New York and London, Garland Publishing, Inc., 1991.

40
SW51 Schwarz Solomon M., The Jews in the Soviet Union, New York, Syracuse University Press, 1951.
SY03 Smilovitsky L., “A Demographic Profile of the Jews in Belorussia, 1939-1959”, in Journal of Genocide Research, vol. 5 (1), 2003, pp.117-129.
TO10 Data transmitted by Dr. Mark Tolts on the Jewish population of cities of the former Soviet Union from 1959 to 2000 and 2010 (February 2013).
TO97 Tolts M., “Demographic Trends Among the Jews in the Three Slavic Republics of the Former USSR: A Comparative Analysis”, in Della Pergola, S. and Even, J. (eds.), Papers in Jewish Demography 1993, Jerusalem, The Institute of Contemporary Jewry, The Hebrew University, 1997, pp.147-175.
TO01 Tolts M., “Jewish Demography of the Former Soviet Union”, in Della Pergola, S. and Even, J. (eds.), Papers in Jewish Demography 1997, Jerusalem, The Institute of Contemporary Jewry, The Hebrew University, 2001, pp.109-139.
TO08b Tolts M., “Migration since World War I”, in Hundert G. D. (ed.), The YIVO Encyclopedia of Jews in Eastern Europe, New Haven and London, Yale University Press, 2008, 2 volumes (http://www.yivoencyclopedia.org).
TO08a Tolts M., “Population since World War I”, in Hundert G. D. (ed.), The YIVO Encyclopedia of Jews in Eastern Europe, New Haven and London, Yale University Press, 2008, 2 volumes (http://www.yivoencyclopedia.org).
Sweden JA69 Jacobson S., The Jewish Congregations’ Answer to the 1968 Investigation of
Immigrants (excerpts), The Central Council of the Jewish Congregations in Sweden, 1969.
Switzerland
EG23 Ginsburger E., “Histoire des Juifs de Carouge, Juifs du Léman et de Genève”, in Revue des Etudes juives, vol. 75, 1922, pp.119-139 and vol. 76, 1923, pp.7-36 and 146-170.
UK85 Kaufmann U.R., “Swiss Jewry: From the Jewish Village to the City, 1780 - 1930”, in Leo Baeck Institute Year Book, 1985, pp.283-299.
LI04 Leitenberg L., “Evolution et perspectives des communautés en Suisse romande”, in FSCI, Vie et culture juives en Suisse, Zurich, Chronos, 2004, pp.153-166.
HB96 Ritzmann-Blickenstorfer H. (ed.), Statistique historique de la Suisse, Zurich, Chronos, 1996.
AN40 Statistiques de la population de confession israélite du canton de Genève, Genève, 1940. (Anonymous manuscript, unpublished, obtained from the Library of the Jewish Community of Geneva, CIG).
VS92 Musée historique de Lausanne (ed.), Vie juive en Suisse, Lausanne, Editions du Grand-Pont, 1992.
WN04 Weingarten R., “Entwicklung und Perspektiven der jüdischen Gemeinden in der deutschen Schweiz”, in FSCI, Vie et culture juives en Suisse, Zurich, Chronos, 2004, pp.138-152.
AW70 Welder-Steinberg A. and Guggenheim-Grunberg F., Geschichte der Juden in der Schweiz, vom 16. Jahrhundert bis nach der Emanzipation, Zurich, Schweizerisches Israelitisches Gemeindebund, 1966 and 1970, 2 volumes.

41
Turkey - Ottoman Empire
SH91 Shaw, S.J., The Jews of the Ottoman Empire and the Turkish Republic, Hong Kong, Macmillan, 1991.
United Kingdom
DC92 Coleman, D. and Salt J., The British Population: Patterns, Trends, and Processes, Oxford, Oxford University Press, 1992.
MK36 Kantorowitsch M., “Estimate of the Jewish Population of London”, 1929-1933, in Journal of the Royal Statistical Society, vol. XCIX, Part II, 1936.
IM86 Kosmin B.A., Waterman S. and Grizzard N., “The Jewish Dead of the Great War as an Indicator of the Location, Size and Structure of the Jewish Community in Britain”, in Immigrants and Minorities, vol. 5 (2), 1986, pp.181-192.
VL90 Lipman V.D., A History of the Jews in Britain since 1858, London, Leicester University Press, 1990.
VL54 Lipman V.D., Social History of the Jews in England 1850 - 1950, London, Watts & Co., 1954.
HN55 Neustatter H., “Demographic and Other Statistical Aspects of Anglo-Jewry”, in Freedman M. (ed.), A Minority in Britain, Social Studies of the Anglo-Jewish Community, London, Vallentine, Mitchell & Co., 1955, pp.55-133.
HP82 Pollins H., Economic History of the Jews in England, London and Toronto, Fairleigh Dickinson University Press, 1982.
WR96 Rubinstein W.D., A History of the Jews in the English-Speaking World: Great Britain, London and New York, Macmillan, 1996.
HT33 Trachtenberg H.L., “Estimates of the Jewish Population of London in 1929”, in Journal of the Royal Statistical Society, vol. XCVI, Part I, 1933.
BW76 Williams B., The Making of Manchester Jewry 1740 - 1875, Manchester, Manchester University Press, 1976.
Former Yugoslavia PE77 Peric M., “Demographic Study of Jewish Community in Yugoslavia, 1971-1972”, in
Schmelz U.O., Glikson P. and Della Pergola S. (eds.), Papers in Jewish Demography 1973, Jerusalem, The Institute of Contemporary Jewry, The Hebrew University, 1977, pp.267-287.
PC92 Peric M. and Stanic S., “Jevreji Beograda u popisima stanovnistva XIX I XX veka [Belgrade Jewry in Population census in XIX and XX Centuries] ”, in Jevrejski Istorijski Muzej [Jewish Historical Museum], Zbornik 6. Studije, Arhivska I Memoarska Grada O Istoriji Jevreja U Beogradu [Jewish Studies VI. Studies, Archival and Memorial Materials about the History of the Jews in Belgrade], Belgrade, Federation of Jewish Communities in Yugoslavia, 1992, pp.277-309.
SV97 Svob M., Jews in Croatia. Migrations and Changes in Jewish Population, Zagreb, D-Graf, 1997.

42
References for data on Jewish population of localities, 1750 – 1950 The references used for each timeframe are presented here by current countries. This is in contrast to the bibliography where, for historical reasons and sources, the countries are those corresponding to the timeframes of the maps. The codes of the references are detailed in the bibliography. References for population data for specific localities on the maps are not detailed here but are available. Austria: 1750 (EJ); 1800 (EJ); 1850 (AU88; EJ; MC90; OW85); 1900 (AU88; DP89b; DP89c; OW85; ZD11); 1930 (AJ35; AJ37; AJ38; AJ39; DP89c; GM91) 1950 (AJ51; DDSJJ; EJ; IJ56; US72b) Azerbaijan: 1750 ( - ); 1800 ( - ); 1850 (EJ); 1900 (EJ; ZD05); 1930 (EJ); 1950 (AL87; EJ; EJ07; IM71; KO91; TO10) Belarus: 1750 (EJ); 1800 (EJ); 1850 (EJ; YI46); 1900 (BS06; EJ; YI46); 1930 (AJ38; AJ39; EJ; GM91; WS83; YI46; YV65; YV82); 1950 (EJ07; IM71; SY03; TO10) Belgium: 1750 (EJ); 1800 (WB73); 1850 (EJ; WB73); 1900 (EJ; WB65; WB73); 1930 (AJ30; AJ36; AJ38; WB65); 1950 (AJ52; DDSJJ; DP83; WB65) Bosnia and Herzegovina: 1750 ( - ); 1800 (EJ); 1850 (EJ); 1900 (EJ; GM91); 1930 (AJ38; AJ39; EJ; GM91; ZD26); 1950 (AJ52; IJ56: SV97) Bulgaria: 1750 (EJ); 1800 ( - ); 1850 (EJ; ZD08); 1900 (EJ; ZD05; ZD08; ZD10; ZD11); 1930 (AJ35; AJ36; AJ37; CJ38; EJ; GM91; YV65; YV82); 1950 (EJ; IJ56; LA72) Croatia: 1750 ( - ); 1800 (EJ); 1850 (CT18; EJ; SV97; ZD24); 1900 (EJ; SV97); 1930 (AJ38; AJ39; EJ; GM91; SV97; ZD26); 1950 (AJ52; EJ; IJ56; SV97) Czech Republic: 1750 (EJ; IH80; JF91; MC90); 1800 (EJ; IH80; JF91; KK96; MC90); 1850 (DP89c; EJ; IH80; JF91; KK96; MC90; TH08); 1900 (EJ; FF33; IH80; JF91; KK96; MC90; SE14; TH08); 1930 (DP89c; EJ; FF33; GM91; IH72; IH80; JF91; KK96); 1950 (AJ52; AI58; EJ07; IJ56; WD71) Denmark: 1750 ( - ); 1800 (CT18; ZD24); 1850 (CT18; ZD24); 1900 (CT18; ZD05; ZD16; ZD24); 1930 (AJ35; AJ36; AJ38; AJ39); 1950 (AJ52; DDSJJ; IJ56) Estonia: 1750 ( - ); 1800 ( - ); 1850 (EJ); 1900 (EJ; ZD26); 1930 (AJ36; AJ37; AJ38; AJ39; EJ; GM91; ZD26); 1950 (AL87; EJ07) Finland: 1750 ( - ); 1800 ( - ); 1850 ( - ); 1900 ( - ); 1930 (DDSJJ; EJ); 1950 (AJ51; AJ52) France: 1750 (DP86; EJ; JC94; JS39); 1800 (DDSJJ; BR97; DP76; DP86; EJ; JC94; JS39; NG89); 1850 (DDSJJ; BR97; DP76; DP86; DP89c; EJ; JC94; PS94, SR89); 1900 (DDSJJ; DP76; DP86; EJ; SE14; ZD07; ZD08); 1930 (AJ38; AJ39; BR97; DDSJJ; DP83; EJ); 1950 (AJ51; AJ52; BC98; DDSJJ; EJ; EJ07; IJ56) Georgia: 1750 ( - ); 1800 ( - ); 1850 (EJ); 1900 (EJ; ZD05); 1930 (EJ); 1950 (AL87; EJ07; IM71; TO10) Germany: 1750 (EJ; ZD26); 1800 (AG83; EJ; PM92; SL83; WK75; ZD07; ZD14; ZD26); 1850 (AB88; AG83; AK86; EJ; PM92; SE14; SL80; SL83; US89; WK75; ZD05; ZD06; ZD08; ZD14; ZD26); 1900 (AB88; AK86; AR30; EJ; GA91; PM92; SE14; SL83; US89; WK75; ZD06; ZD14); 1930 (AB88; AJ36; AJ38; AJ39; AK86; DP89c; EJ; GM91; PD89b; SL80; SL83; US89; WK75; YV82); 1950 (AJ51; DDSJJ; EJ; EJ07; IJ56; US72b) Greece: 1750 (EJ); 1800 (JN78); 1850 (EJ; GV92); 1900 (EH78; EJ; EE13; GV92; JB92; ZD05; ZD08); 1930 (AJ38; AJ39; CJ38; DDSJJ; EJ; GM91); 1950 (AJ51; DDSJJ; EJ; IJ56) Hungary: 1750 (EJ; MZ89; ZS29); 1800 (AK22; EJ; MZ89; ZS29); 1850 (AK22; EJ; MZ89); 1900 (AK22; EJ; MZ89; ZS29); 1930 (EJ; GM91; ZS29); 1950 (EJ07; IJ56) Ireland: 1750 ( - ); 1800 (EJ; HY72); 1850 (DK98; HP82; VL54); 1900 (DK98; HY72; ZD09); 1930 (AJ38; AJ39; EF90; HN55); 1950 (DDSJJ; HN55)

43
Italy: 1750 (DP72c; EJ); 1800 (DP72c; EJ); 1850 (DP72c; DP89b; DP89c; EJ); 1900 (DP72c; EJ; VJ03); 1930 (AJ38; AJ39; DP72c; DP89b; DP89c; EJ; YV82; YV83); 1950 (AJ51; AJ52; DP72c; EJ; IJ56) Latvia: 1750 (EJ); 1800 (EJ); 1850 (EJ); 1900 (BS06; EJ; ZD10); 1930 (AJ36; AJ38; AJ39; EJ; GM91); 1950 (AL87; EJ07; KO91; IM71; TO10) Lithuania: 1750 (EJ; NS91); 1800 (EJ; NS91); 1850 (EJ; NS91; YI46); 1900 (EJ; NS91; YI46); 1930 (EJ; GM91; NS91; YV82); 1950 (AJ65; AL87, EJ07; IM71; TO10) Luxembourg: 1750 ( - ); 1800 (EJ); 1850 (EJ; ZD10); 1900 (AJ20; EJ; ZD07; ZD10); 1930 (AJ36; AJ38; AJ39; DDSJJ; EJ); 1950 (DDSJJ) Macedonia: 1750 (EJ); 1800 (EJ; GM91); 1850 (EJ; GM91); 1900 (EJ; ZD08); 1930 (GM91; ZD26); 1950 (AJ52; SV97) Moldova: 1750 ( - ); 1800 (EJ); 1850 (EJ; EN34); 1900 (EJ; EN34; BS06; JE06); 1930 (AJ38; AJ39; EJ; GM91); 1950 (AJ65; AL87; EJ07; IM71; KO91; TO10) Netherlands: 1750 (EJ; MB92); 1800 (EJ; JL30; MB92; RC85; ZD06); 1850 (EB36; EJ; MB92; RC84; ZD06); 1900 (EB36; EJ; JE06; JL30; MB92; RC84); 1930 (EB36; EJ; JL30; MB92; RC84); 1950 (AJ56; DDSJJ; EJ; IJ56; MA72; MB92) Norway: 1750 ( - ); 1800 ( - ); 1850 ( - ); 1900 (EJ); 1930 (DDSJJ); 1950 (DDSJJ; IJ56) Poland: 1750 (EJ); 1800 (AE88; BB77; BZ85; DP89c; EJ; PM92; PS94; YI46; ZD31); 1850 (BB77; BZ85; DP89c; EJ; PM92; SE14; YI46; ZD05; ZD10; ZD31); 1900 (BB77; BB83; BS06; BZ85; DP89c; EJ; PM92; PS94; SE10; SE14; WK17; YI46; ZD05; ZD15; ZD27; ZD31; www.jewishgen.org); 1930 (AJ38; AJ39; AM46; BB77; BB83; BZ85; DP89b; DP89c; EJ; FF33; GM91; JJ64; LE34; LE48; WS83; YI46; YV65; YV82; ZD31; www.jewishgen.org); 1950 (AJ51; EJ07; GW05; IJ56; JJ72; Portugal: 1750 ( - ); 1800 (EE13; JE06); 1850 (EE13; JE06); 1900 (JE06); 1930 (AJ38; AJ39; EJ; ZD26); 1950 ( - ) Romania: 1750 (EJ); 1800 (AK22; EJ); 1850 (AK22; EJ); 1900 (AK22; EJ; ZD05; ZD07); 1930 (AJ38; EJ; GM91; WS83; YV82); 1950 (AJ51; DDSJJ; EJ07; IM83) Russia: 1750 (EJ); 1800 (EJ); 1850 (EJ; EN34; JL30; SE14); 1900 (BS06; EJ; EN34; SE14; ZD27); 1930 (AJ36; AJ37; AJ38; AJ39; EJ; GM91; JL30; WS83; YV65); 1950 (AJ52; AJ65; AL87; EJ07; IM71; LK78; TO10) Serbia: 1750 (EJ); 1800 (AK22; EJ); 1850 (AK22; EJ); 1900 (AK22; ZD06); 1930 (AJ38; EJ; GM91; YV65; ZD26); 1950 (AJ51; AJ52; EJ07; IJ56; SV97) Slovakia: 1750 (EJ; JF91); 1800 (AK22; EJ); 1850 (AK22; EJ); 1900 (AK22; EJ; JF91; ZS29); 1930 (EJ; FF33; JF91; GM91; YV82); 1950 (AI58; EJ07) Spain: 1750 ( - ); 1800 ( - ); 1850 ( - ); 1900 (EJ; JE06); 1930 (EJ); 1950 (AJ62; AJ67; EJ) Sweden: 1750 ( - ); 1800 ( - ); 1850 (EJ); 1900 (EJ; ZD08); 1930 (AJ38; AJ39; EJ; ZD27); 1950 (JA69) Switzerland: 1750 ( - ); 1800 (EG23; EJ); 1850 (EG23; HB96; ZD06); 1900 (AN40; DP89c; HB96; VJ03; ZD05; ZD06; ZD11); 1930 (AJ38; AN40; HB96); 1950 (HB96) Turkey: 1750 (EJ; SH91); 1800 (EJ; SH91); 1850 (EJ; SH91); 1900 (EJ; EE13; SH91; ZD05; ZD08); 1930 (AJ36; AJ37; AJ38; AJ39; EJ; SH91); 1950 (AJ52; DDSJJ) Ukraine: 1750 (EE13; EJ); 1800 (AK22; EE13; EJ); 1850 (AK22; DP89c; EE13; EJ; SE14; YI46); 1900 (AK22; BS06; DP89c; EE13; EJ; SE14; YI46; ZD08; www.jewishgen.org); 1930 (AJ36; AJ37; AJ38; AJ39; EJ; FF33; GM91; JJ64; WS83; YI46; YV65; YV82; YV83); 1950 (AJ65; AL87; DP83; EJ07; KO91; IM71; TO10) United Kingdom: 1750 (EJ; EN34); 1800 (EJ; VL90); 1850 (EJ; HP82; VL54; VL90); 1900 (EJ; JE06; JL30; JY16; VL90; ZD09); 1930 (AJ38; AJ39; HN55; JY21; JY35; MK36; VL90); 1950 (AJ51; DDSJJ; EJ; HN55).
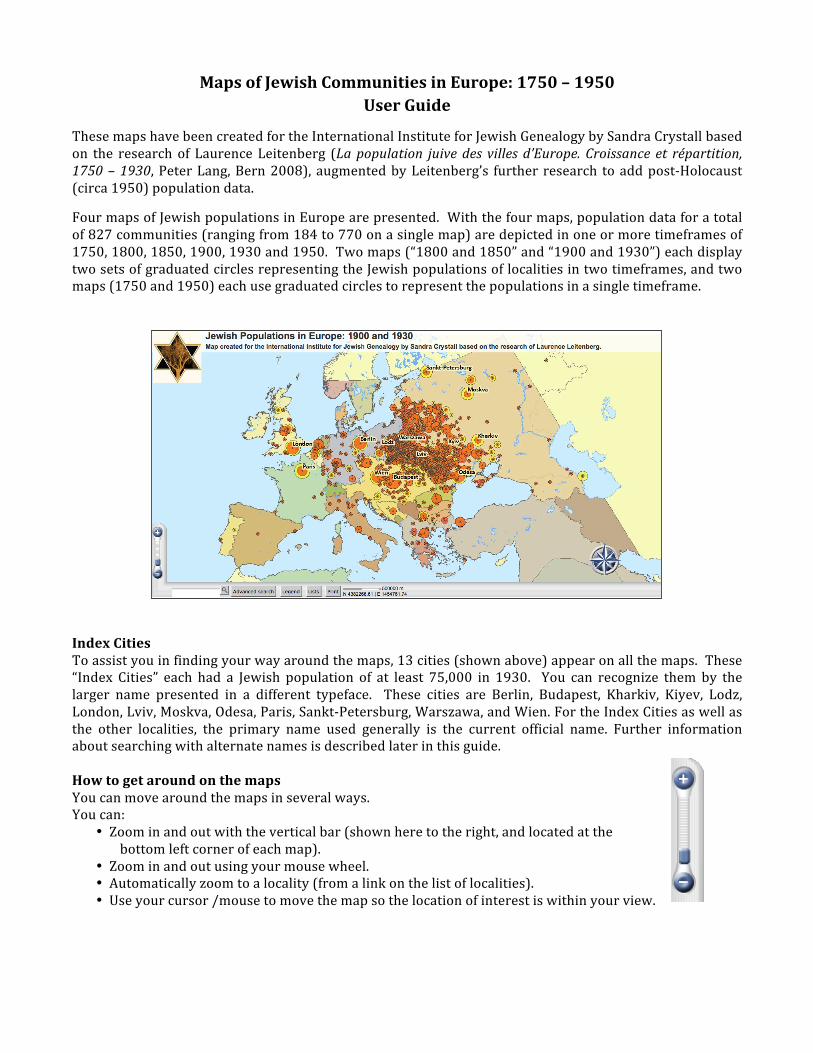
Maps of Jewish Communities in Europe: 1750 – 1950 User Guide
These maps have been created for the International Institute for Jewish Genealogy by Sandra Crystall based on the research of Laurence Leitenberg (La population juive des villes d’Europe. Croissance et répartition, 1750 – 1930, Peter Lang, Bern 2008), augmented by Leitenberg’s further research to add post-‐Holocaust (circa 1950) population data. Four maps of Jewish populations in Europe are presented. With the four maps, population data for a total of 827 communities (ranging from 184 to 770 on a single map) are depicted in one or more timeframes of 1750, 1800, 1850, 1900, 1930 and 1950. Two maps (“1800 and 1850” and “1900 and 1930”) each display two sets of graduated circles representing the Jewish populations of localities in two timeframes, and two maps (1750 and 1950) each use graduated circles to represent the populations in a single timeframe.
Index Cities To assist you in finding your way around the maps, 13 cities (shown above) appear on all the maps. These “Index Cities” each had a Jewish population of at least 75,000 in 1930. You can recognize them by the larger name presented in a different typeface. These cities are Berlin, Budapest, Kharkiv, Kiyev, Lodz, London, Lviv, Moskva, Odesa, Paris, Sankt-‐Petersburg, Warszawa, and Wien. For the Index Cities as well as the other localities, the primary name used generally is the current official name. Further information about searching with alternate names is described later in this guide. How to get around on the maps You can move around the maps in several ways. You can:
• Zoom in and out with the vertical bar (shown here to the right, and located at the bottom left corner of each map).
• Zoom in and out using your mouse wheel. • Automatically zoom to a locality (from a link on the list of localities). • Use your cursor /mouse to move the map so the location of interest is within your view.

45
Start at the bottom left corner.
At the bottom left corner, there is a short vertical bar (“scroll button”) that will bring you closer in (“zoom in”) when you press the plus sign (+) at the top of the bar. When you are zoomed in, you can press the minus sign (–) to zoom out to the full map. You should notice that as you zoom in, additional localities are labeled, until they all are labeled at the largest “zoom level.”
At the bottom right corner of the map, there is a compass rose (see example to the right). This serves as a navigation tool. When you press the top point (North), you will move north towards the top of the map. The same approach applies to the other directions. It will also move to the northeast and other directions in a similar manner. If you move around the map and find yourself at a far corner of the map, to return to the full map, use the short vertical bar at the bottom left corner and click on the minus (-‐) sign (a few times) to return to the starting zoom level for the map. How to find the information for your locality of interest.
There are several ways to obtain the population and location information, including the current and historic countries (sovereign states). The circles The graduated circles represent groupings or classes of the population data. The five circles represent the following population size classes. If you are looking for a locality that is small (with a Jewish population less than 3,000), you may find that it is not on the maps.
Circles of increasing size represent Jewish populations of the following size classes: 7,000 or less 7,001 – 20,000 20,001 – 75,000 75,001 – 150,000 (the two largest population classes are only on the 1900-‐1930-‐1950 maps) 150,001 – 360,000
For those maps that depict two timeframes of population data, the circles are semi-‐transparent, so the combination of the two colors used allows interpretation of how much the population increased or decreased according to the size of the population grouping. If a Jewish community was 5,000 in the first timeframe and 6,000 in the next, the change will not be visible by the circle size. However, by clicking on the circle to see the popup box information, the exact population figures for each of the two years are provided.
For the 1800 and 1850 map: 1800 – green circle; 1850 – orange circle; they appear olive green or when they overlap.
Locality grew enough from 1800 to 1850 to “move” to a larger class.
No locality meet this criterion
Locality’s population decreased from 1800 to 1850, enough so that it moved to a smaller population class.
Locality’s population may have increased or decreased from 1800 to 1850 but not enough to move it a larger or smaller class. (Click on locality on the map to see popup box and the population values.)
Population data are available in only one timeframe. Where the population data are unavailable, the population value for the other timeframe is shown as 0 (zero).

46
For the 1900 and 1930 map: 1900 – red circle; 1930 – yellow circle; they appear orange when they overlap.
Jewish population in locality grew enough from 1900 to 1930 to “move” to a larger class.
Jewish population in locality decreased from 1900 to 1930, enough so that it moved to a smaller class.
Locality’s population may have increased or decreased from 1900 to 1930 but not enough to move it a larger or smaller class. (Click on locality on the map to see popup box and the population values.)
Population data are available in only one timeframe. Where the population data are unavailable, the population value for the other timeframe is shown as 0 (zero).
Information beyond the circles
Additional information can be viewed by using your mouse cursor:
• If you move your mouse cursor to a circle around a locality, by clicking on the circle, a popup box will appear and provide the locality name, the geographic location (longitude and latitude in decimal degrees), Jewish population in one or two timeframes, current country, and alternate names by which the locality has been known. (See example popup box for Rivne below).
You will notice that the popup box has a printer logo as well as a pushpin in the upper right corner. By clicking on the printer logo, you can print the information that is displayed. If you click on the pushpin, it will place the popup box on the right side of your computer screen. You can view other localities and (by clicking on the pushpin) add popup boxes to view the information for multiple localities. If you want to close the popup box, click on the small box with an “x” located next to the pushpin.

47
• If your mouse “hovers” over an open area outside the population circles, the name of the country (sovereign state) in one time period will display. For Map 1750, country boundaries are for 1700; for Map 1800 and 1850, country boundaries are for 1800; for Map 1900 and 1930 (country boundaries are for 1900); for Map 1950 (country boundaries represent those as of 1951).
Tool bar
At the bottom of the map, there is a horizontal bar and several buttons that provide various tools to assist you in finding information.
To the right of the Print button is a scale bar in meters (the entire grey and white bar is the distance indicated). The following table provides some conversions from meters to miles:
20,000 meters = 13 miles 100,000 meters = 62 miles 50,000 meters = 31 miles 200,000 meters = 124 miles 70,000 meters = 44 miles 500,000 meters = 311 miles 80,000 meters = 50 miles
Searches
Simple search
The white rectangle to the left of the magnifying glass symbol is for entering text for a “simple search.” The search result is delivered in form of a list of localities (that contain that search text). Click on a name on the list to navigate to its location and view the popup box information. You may also enter the spelling of the name you may know or partial text in the search box if you are unsure about the spelling of a locality’s name. The alternate names of the locality will be searched, even when not visible on the list. Advanced search By clicking this button, you can search the data with multiple criteria. Searches can be conducted of all fields that appear in the popup box. The search can be limited as well.
1. Select a field to be searched using the pull-‐down menu.
2. Enter the search text in the blank area and click on the magnifying glass to start the search. With numeric fields (such as population), you can search the population values for those that are equal, bigger than or smaller than the numeric search criterion chosen. (For example, you can search for all localities with a population less than 3,000. (Do not use a comma when you enter numbers in the thousands.)
3. The results will appear as a list of localities that match the search criteria you entered. Once again you can click on the locality names in the list that will navigate to the locality and its popup box.

48
Legend The legend provides information about the symbols used and population classes represented by the circles. When you print a map, the legend is placed on the page automatically. Lists A list of all the localities on the map will appear when you click on the Lists button. The name of each locality on the list is a link to its location on the map. By clicking on the name of a community of interest on the list, the map will navigate to the location on the map so the community is within your view and it will display the popup box with information. The Pin Board (Bulletin Board) You may notice that when you click on a locality, the popup box that appears has a “pushpin” at the top right corner. If you want to temporarily keep the information visible to compare with another locality’s information, click on the pushpin and it will post the popup for further review. There will be a small trash can button in the right corner where the pushpin was, so you may remove the items from the map when you are finished viewing them.
Printing There are several options for printing a map and population data (some have been mentioned previously). The print button in the tool bar will provide one option for printing. If you want to print a copy of the map
view you see, search results, or pin board data, press the print button . It is recommended that your set your print setting to allow background printing.
This project was supported by:
iijg.org