digital salary and industry insights 6th edition
TRANSCRIPT

Body copy
Header
Section Title
DigitalSalary &IndustryInsights6th Edition
propelllondon.com0207 432 [email protected]@propellondon.com
2 Digital Salary Industry Insights
Preface 4Methodology 5Demographics 6
Industry Overview 7Job satisfaction 8 Willingness to move roles 10Factors that drive job change 11How professionals find a role 12Bonus 14C-Level Insights 15Contractual Staff & Freelancers 16Remuneration Perceptions 17Salary overview 18Gender pay gap 18
Marketing 19Highlights & Key demographics 20 Factors that drive job change 21Job satisfaction 22Salaries 23
Contract Rates 24Advertising-Operations/Trafficking 25Affiliates 25Content Management 26eCommerce 26eCRM 27Online Marketing/Digital Generalist 27Paid Search 28Paid Social 28Planning 29Product management 29Project management 30RTB 30SEO 31Social Media 31Operations 32
Commercial 33Highlights & Key demographics 34
Factors that drive job change 35Job satisfaction 36Salaries 37
Contract Rates 38 Business Development 39Pre-Sales 39Publisher Development 40Advertising Sales 40Technology Sales 41Sales Management 41Technical Account Management 42
Technical 43Highlights & Key demographics 44Factors that drive job change 45Job satisfaction 46Salaries 47
48494950505151525253
Contract Rates .NETBack End Business Analyst Data Science DatabaseFront End IT Support JavaTestingProject Management 53
Creative Services 55Highlights & Key demographics 56Factors that drive job changes 57Job satisfaction 58Salaries 59
Contract Rates 60UX 60Design 61Artwork 61Creative 62Technologist 62
Contents
Digital Salary Industry Insights 3
The sixth edition of our ‘Salary & Industry Insights’ report builds on the success of last year’s and continues to be an invaluable tool for employers and job seekers alike. This year our research delves even deeper into the working lives of the professionals who drive the global digital economy.
Similar to last year’s edition, our research combines the results from an online survey (with over 1,800 respondents) with data taken from our own internal records and relationships with employers. This method of data collection allows us to present a broad insight not only into people’s salaries, but also their opinions on their current jobs.
How does your salary compare to your peers? How satisfied are digital professionals and what factors drive job change?
Thanks to our extensive insight we are now able to answer these questions and more.
So whether you’re looking to hire, get hired or are just interested in the results, our report is a fantastic resource for the people who make up the global digital economy.
Melina Jacovou
CEO & Founder Propel
“This year our research delves evendeeper into the working lives of the professionals who drive theglobal digital economy.”
Welcome
4 Digital Salary Industry Insights
Propel’s sixth annual ‘Digital Salary & Industry Insights’ combines our own internal salary data with over 1,800 respondents to a survey we conducted in February and March of 2015. The survey builds on the successful introduction of this element in our 2014 research, and provides insight into levels of satisfaction and role perceptions within the global digital economy.
The report is split into five main sections. First, an industry overview section breaks down the overall results from our findings across our entire sample, showing differences across seniority, length of tenure, gender and sector.
The remaining four sections analyse our sample based on their wider role classification. We split out our respondents into four main groups: Marketing, Commercial, Technical and Creative roles. We also included a wider 'Operations' group.
Within these role groups, data is broken down further by seniority. The classification of these seniorities varies dependent on the particular occupation being analysed, but for the vast majority of roles, the following definitions are appropriate:
• Junior: 0 - 3 years experience, non management role• Mid-level: 3 - 7 years experience, mid management level• Senior: 8+ years experience, senior management level• C-level: Country Manager, Director or Board level status
The following pages provide a brief overview of the methodology adopted to compile the report, and a summary of the demographic splits for the entire sample in terms of gender, type of business, age and skill set.
This document has been produced by Propel in partnership with The Drum.
Any queries regarding the contents of this report, as well as any media queries, can be directed to our marketing department on 0207 432 6340 or by emailing us at [email protected].
Preface
Digital Salary Industry Insights 5
Our research data is drawn from two primary sources; an online survey carried out in early 2015, and internal salary records drawn from our own database.
Online survey
We gathered the data through a pre-tested and then revised questionnaire throughout February and March of 2015. The responses were collected online and hosted on SurveyMonkey, then analysed in Microsoft Office Excel and IBM SPSS.
We received 1,849 responses to the survey. 213 of these responses were invalidated due to being either incomplete, irrelevant or due to respondent error.
The final survey data set therefore consists of 1,636 respondents working across the digital economy.
The questionnaire structure took into consideration a number of factors regardingrespondents behaviour, namely:
• Direct influences - demographic variables (age, gender, seniority, job title and salary)• Behavioural variables - career level, years in industry, skill• Deduced influences - job satisfaction, attitudes, lifestyle, career patterns
Internal data
We took a total of 1,650 records from our own administrative database, which allowed us to supplement the salary data provided by survey respondents with robust data drawn from placed candidates.
Final data total
In total we have 3,286 individual data records to form the basis of our analysis.
Methodology
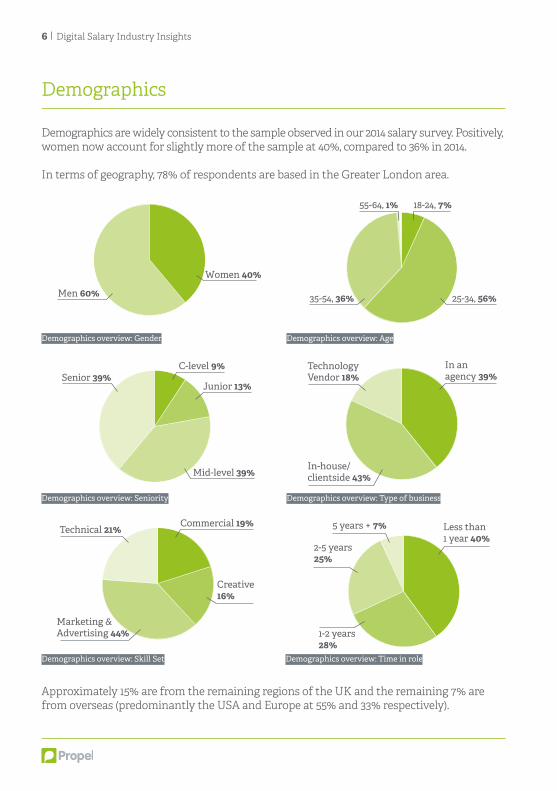
Demographics are widely consistent to the sample observed in our 2014 salary survey. Positively, women now account for slightly more of the sample at 40%, compared to 36% in 2014.
In terms of geography, 78% of respondents are based in the Greater London area.
Approximately 15% are from the remaining regions of the UK and the remaining 7% are from overseas (predominantly the USA and Europe at 55% and 33% respectively).
6 Digital Salary Industry Insights
Demographics
Women 40%
Men 60%
Junior 13%
C-level 9%
Mid-level 39%
Senior 39%
Creative16%
Commercial 19%Technical 21%
Marketing &Advertising 44%
18-24, 7%55-64, 1%
25-34, 56%35-54, 36%
In an agency 39%
TechnologyVendor 18%
In-house/clientside 43%
Less than1 year 40%
5 years + 7%
2-5 years25%
1-2 years28%
Demographics overview: Gender
Demographics overview: Seniority
Demographics overview: Skill Set
Demographics overview: Age
Demographics overview: Type of business
Demographics overview: Time in role
Section 1:
IndustryOverview
Before delving deeper into the four main sections, we break down the main trends in the industry overview section.
This section acts to provide perspective to the rest of the report and provide a general summary of employee perceptions across the sector.
Industry Overview
8 Digital Salary Industry Insights
One of the primary factors explored in the survey is job satisfaction, and the factors which act to influence this across individuals.
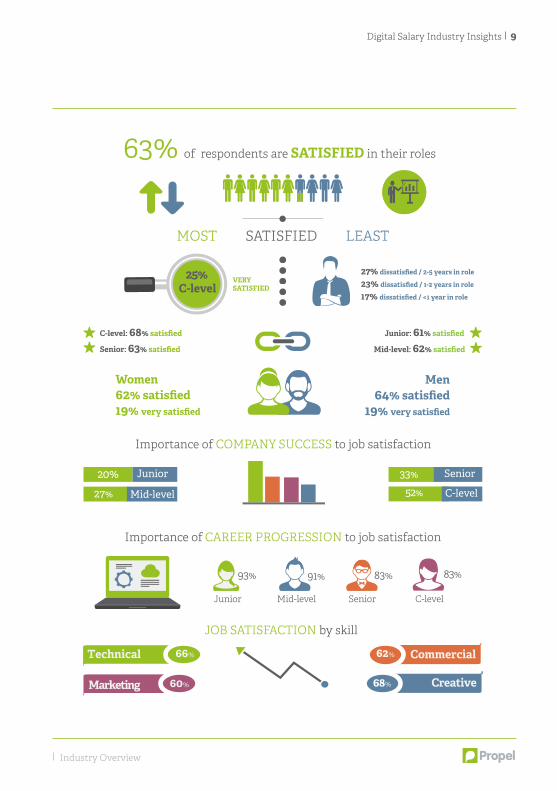
The results show that 63% of respondents are either satisfied or very satisfied in their roles, a slight decrease compared to 2014 (64%). C-level and junior respondents show the highest level of job satisfaction (approx. 25% of employees across both groups state that they are ‘very’ satisfied). As with 2014, there are no significant differences when satisfaction is split by gender.
Similar to our 2014 salary survey, length of tenure continues to hold a strong link to satisfaction. Those with 2-5 years of service continue to be the most dissatisfied group (27% of this group are dissatisfied, and only 8% are very satisfied). Those working at an organisation for under a year continue to be the most satisfied, with 67% of this group showing some level of positive satisfaction (28% are “very satisfied”).
In terms of the factors most likely to influence satisfaction, a number of crucial components were highlighted by our respondents. The most important was deemed to be working environment and culture, followed closely by financial remuneration, feedback and recognition, and work life balance.
In the 2014 report, we highlighted the importance of linking company success to an individual’s own sense of professional success. There still appear to be challenges with engaging junior members of staff with overall company success. Only 20% of juniors believe company success is important to their own professional success, in comparison with 52% of C-level individuals.
In contrast, more than 67% junior level professionals determine financial success as the most important factor in their own achievements.
Job satisfaction
Recommendations
• Engaging with staff at the 2-5 year period remains crucial for employers, as theseindividuals continue to display the lowest levels of satisfaction across the sample.
• Junior members of staff remain distanced from company success as an influence to theirown perceptions of achievement. More remains to be done to convince staff outside theboardroom that wider company success is important.
• Developing a productive and welcoming organisational culture and working environmentis particularly crucial to employees. More focus should be given to fostering an effectiveculture, and towards recruiting employees that display a good cultural fit.
Digital Salary Industry Insights 9
Women62% satisfied19% very satisfied
25%C-level
Men64% satisfied
19% very satisfied
Junior Mid-level Senior C-level
93% 91% 83% 83%
Junior: 61% satisfied
Mid-level: 62% satisfied
C-level: 68% satisfied
Senior: 63% satisfied
Creative
CommercialTechnical
Marketing
JOB SATISFACTION by skill
63% of respondents are SATISFIED in their roles
20% Junior
27% Mid-level
33% Senior
52% C-level
MOST SATISFIED LEAST
Importance of COMPANY SUCCESS to job satisfaction
27% dissatisfied / 2-5 years in role 23% dissatisfied / 1-2 years in role
17% dissatisfied / <1 year in role
Importance of CAREER PROGRESSION to job satisfaction
VERYSATISFIED
62%
68%
66%
60%
Industry Overview
Despite the upturn in the economy, the results show that willingness to move roles has actually decreased from 2014, with only 52% of individuals looking to change roles compared to 59% last year.
Intentions continue to be slightly higher amongst men (53% to 50% of women). There is also a downward trend based on seniority, with juniors the most likely to move at 54%, followed by mid-level (53%), senior (52%) and C-level at 49%.
All types of organisation covered in the survey display similar leaving intentions, with agency and client side respondents hovering around the 52% average, and tech vendors just below at 51%.
As observed in the 2014 report, bonus receipt continues to influence leaving intentions. Only 50% of those receiving a bonus are seeking to leave, in comparison to 57% of those who do not receive this type of incentive.
One interesting insight was that perceptions of remuneration are a crucial influence on leaving intentions. To illustrate this, 60% of those believing they are fairly paid intend to stay in their role this year. Furthermore, out of those believing they are overpaid, 71% have no intention of changing roles. In sharp contrast to this, only 28% of those believing they are underpaid are not seeking to change roles this year.
Another important financial aspect refers to previous compensation vs. current compensation. 60% of the individuals who accepted a pay cut when taking on their current role are planning to move on, in comparison to only 47% of those earning more.
Time in post also remains as a persistent predictor of leaving intentions. Only 37% of those in post for a year are intending to leave, in comparison with 68% of those who have held a role for between 2-5 years.
Willingness to move roles
10 Digital Salary Industry Insights
Industry Overview
Recommendations
• As observed in the job satisfaction section, it remains crucial to build initiatives designedto engage those in post for 2-5 years, as they remain the most likely to move on.
• Bonus receipt continues to have an effect on leaving intentions, but perceptions ofremuneration appear even more important.
• Recruitment and salary reviews need to take remuneration perceptions into account.Employees should be confident that they are fairly compensated for their roles. Similarly, a candidate’s previous salary should be considered in the recruitment stage, as if the suggested salary for the role doesn’t compare favourably with their previous wage, they are more likely to move on.
Digital Salary Industry Insights 11
Industry Overview
Respondents were asked two questions relative to job change, with the first focused on reasons for leaving their previous roles. The main reasons for moving on are consistent with those observed in our 2014 research.
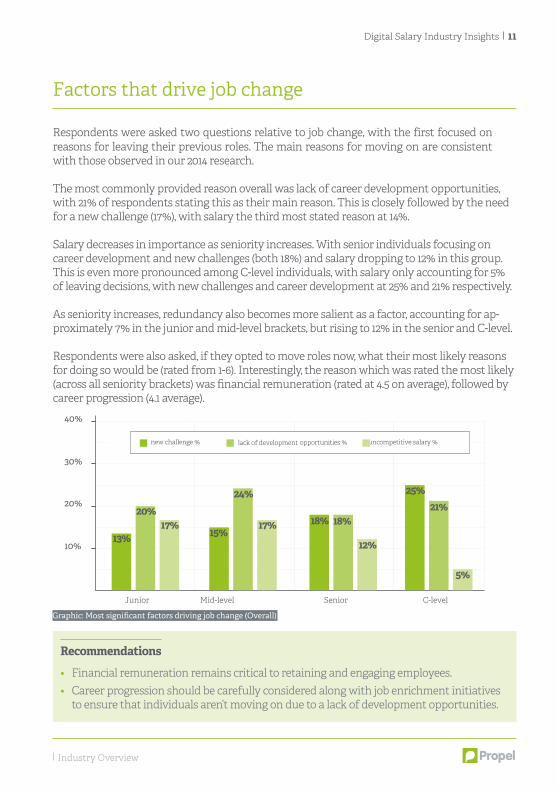
The most commonly provided reason overall was lack of career development opportunities, with 21% of respondents stating this as their main reason. This is closely followed by the need for a new challenge (17%), with salary the third most stated reason at 14%.
Salary decreases in importance as seniority increases. With senior individuals focusing on career development and new challenges (both 18%) and salary dropping to 12% in this group. This is even more pronounced among C-level individuals, with salary only accounting for 5% of leaving decisions, with new challenges and career development at 25% and 21% respectively.
As seniority increases, redundancy also becomes more salient as a factor, accounting for ap-proximately 7% in the junior and mid-level brackets, but rising to 12% in the senior and C-level.
Respondents were also asked, if they opted to move roles now, what their most likely reasons for doing so would be (rated from 1-6). Interestingly, the reason which was rated the most likely (across all seniority brackets) was financial remuneration (rated at 4.5 on average), followed by career progression (4.1 average).
Factors that drive job change
Recommendations
• Financial remuneration remains critical to retaining and engaging employees.• Career progression should be carefully considered along with job enrichment initiatives
to ensure that individuals aren’t moving on due to a lack of development opportunities.
Graphic: Most significant factors driving job change (Overall)
Junior Mid-level Senior C-level
10%
20%
30%
40%
13%
20%17%
15%
24%
17% 18% 18%
12%
25%21%
5%
new challenge % lack of development opportunities % uncompetitive salary %
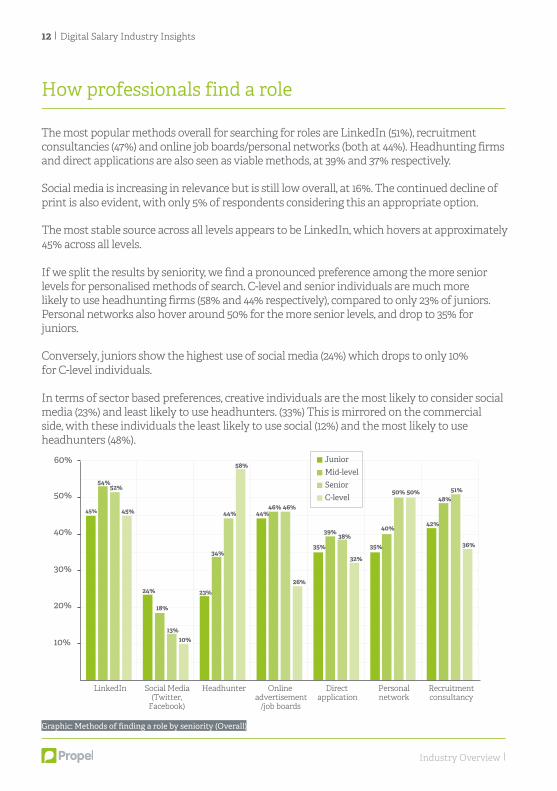
The most popular methods overall for searching for roles are LinkedIn (51%), recruitment consultancies (47%) and online job boards/personal networks (both at 44%). Headhunting firms and direct applications are also seen as viable methods, at 39% and 37% respectively.
Social media is increasing in relevance but is still low overall, at 16%. The continued decline of print is also evident, with only 5% of respondents considering this an appropriate option.
The most stable source across all levels appears to be LinkedIn, which hovers at approximately 45% across all levels.
If we split the results by seniority, we find a pronounced preference among the more senior levels for personalised methods of search. C-level and senior individuals are much more likely to use headhunting firms (58% and 44% respectively), compared to only 23% of juniors. Personal networks also hover around 50% for the more senior levels, and drop to 35% for juniors.
Conversely, juniors show the highest use of social media (24%) which drops to only 10% for C-level individuals.
In terms of sector based preferences, creative individuals are the most likely to consider social media (23%) and least likely to use headhunters. (33%) This is mirrored on the commercial side, with these individuals the least likely to use social (12%) and the most likely to use headhunters (48%).
How professionals find a role
12 Digital Salary Industry Insights
Industry Overview
Graphic: Methods of finding a role by seniority (Overall)
LinkedIn Social Media(Twitter,
Facebook)
Headhunter Onlineadvertisement
/job boards
Directapplication
Personalnetwork
Recruitmentconsultancy
10%
20%
30%
40%
50%
60% JuniorMid-levelSeniorC-level
45%
24%
18%
13%10%
23%26%
35%
39% 38%
32%
35%
42%
36%
40%
50% 50%48%
51%
34%
44%
58%
44%46% 46%45%
54%52%
Digital Salary Industry Insights 13
Industry Overview
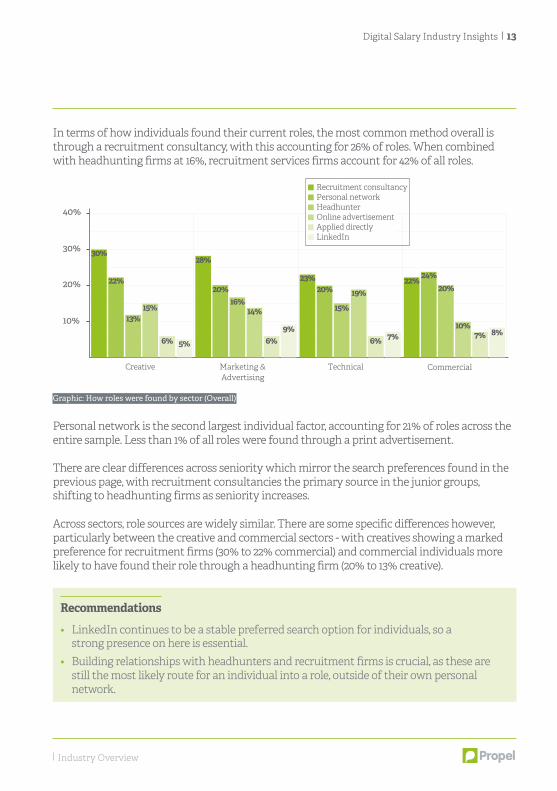
In terms of how individuals found their current roles, the most common method overall is through a recruitment consultancy, with this accounting for 26% of roles. When combined with headhunting firms at 16%, recruitment services firms account for 42% of all roles.
Personal network is the second largest individual factor, accounting for 21% of roles across the entire sample. Less than 1% of all roles were found through a print advertisement.
There are clear differences across seniority which mirror the search preferences found in the previous page, with recruitment consultancies the primary source in the junior groups, shifting to headhunting firms as seniority increases.
Across sectors, role sources are widely similar. There are some specific differences however, particularly between the creative and commercial sectors - with creatives showing a marked preference for recruitment firms (30% to 22% commercial) and commercial individuals more likely to have found their role through a headhunting firm (20% to 13% creative).
Recommendations
• LinkedIn continues to be a stable preferred search option for individuals, so a strong presence on here is essential.
• Building relationships with headhunters and recruitment firms is crucial, as these arestill the most likely route for an individual into a role, outside of their own personalnetwork.
Graphic: How roles were found by sector (Overall)
Creative Marketing &Advertising
Technical Commercial
10%
20%
30%
40%
30%
22%
13%15%
6% 5%
28%
20%16%
14%
6%9%
23%20%
15%
19%
6% 7%
22% 24%20%
10%7% 8%
Recruitment consultancyPersonal networkHeadhunterOnline advertisementApplied directlyLinkedIn
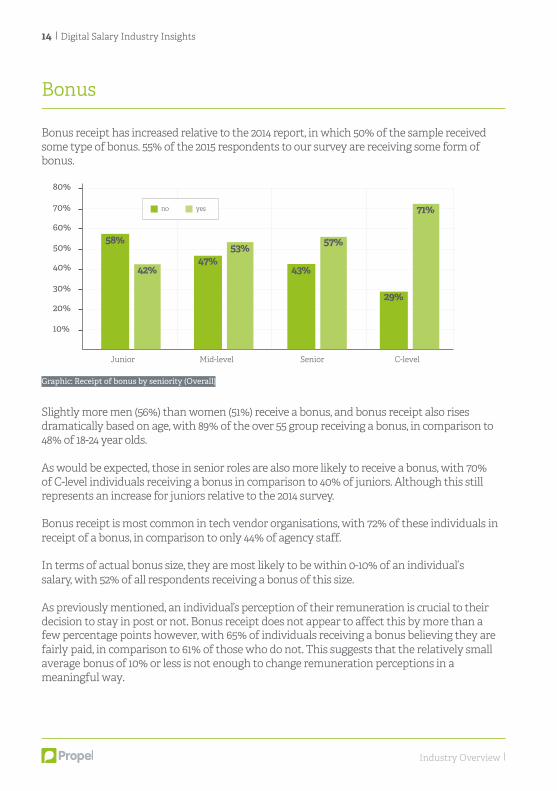
Bonus receipt has increased relative to the 2014 report, in which 50% of the sample received some type of bonus. 55% of the 2015 respondents to our survey are receiving some form of bonus.
Slightly more men (56%) than women (51%) receive a bonus, and bonus receipt also rises dramatically based on age, with 89% of the over 55 group receiving a bonus, in comparison to 48% of 18-24 year olds.
As would be expected, those in senior roles are also more likely to receive a bonus, with 70% of C-level individuals receiving a bonus in comparison to 40% of juniors. Although this still represents an increase for juniors relative to the 2014 survey.
Bonus receipt is most common in tech vendor organisations, with 72% of these individuals in receipt of a bonus, in comparison to only 44% of agency staff.
In terms of actual bonus size, they are most likely to be within 0-10% of an individual’s salary, with 52% of all respondents receiving a bonus of this size.
As previously mentioned, an individual’s perception of their remuneration is crucial to their decision to stay in post or not. Bonus receipt does not appear to affect this by more than a few percentage points however, with 65% of individuals receiving a bonus believing they are fairly paid, in comparison to 61% of those who do not. This suggests that the relatively small average bonus of 10% or less is not enough to change remuneration perceptions in a meaningful way.
Bonus
14 Digital Salary Industry Insights
Industry Overview
Graphic: Receipt of bonus by seniority (Overall)
Junior Mid-level Senior C-level
20%
10%
30%
50%
40%
60%
70%
80%
58%
42%47%
53%
43%
57%
29%
71%no yes
Digital Salary Industry Insights 15
Industry Overview
As part of our survey, we collected specific data on C-level executives and their experiences of employment.
Of our C-level sample, 40% hold global responsibility, with 32% responsible for UK operations only and an additional 21% accountable for European performance.
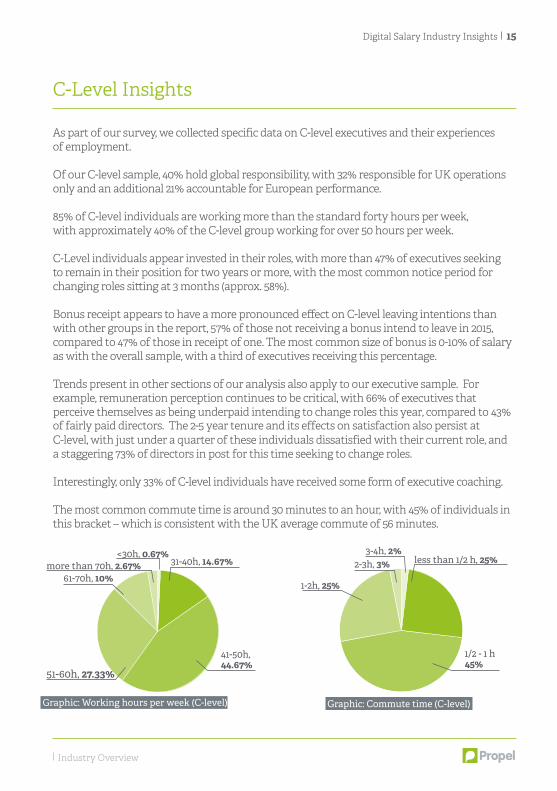
85% of C-level individuals are working more than the standard forty hours per week, with approximately 40% of the C-level group working for over 50 hours per week.
C-Level individuals appear invested in their roles, with more than 47% of executives seeking to remain in their position for two years or more, with the most common notice period for changing roles sitting at 3 months (approx. 58%).
Bonus receipt appears to have a more pronounced effect on C-level leaving intentions than with other groups in the report, 57% of those not receiving a bonus intend to leave in 2015, compared to 47% of those in receipt of one. The most common size of bonus is 0-10% of salary as with the overall sample, with a third of executives receiving this percentage.
Trends present in other sections of our analysis also apply to our executive sample. For example, remuneration perception continues to be critical, with 66% of executives that perceive themselves as being underpaid intending to change roles this year, compared to 43% of fairly paid directors. The 2-5 year tenure and its effects on satisfaction also persist at C-level, with just under a quarter of these individuals dissatisfied with their current role, and a staggering 73% of directors in post for this time seeking to change roles.
Interestingly, only 33% of C-level individuals have received some form of executive coaching.
The most common commute time is around 30 minutes to an hour, with 45% of individuals in this bracket – which is consistent with the UK average commute of 56 minutes.
C-Level Insights
Graphic: Working hours per week (C-level) Graphic: Commute time (C-level)
31-40h, 14.67%<30h, 0.67%
more than 70h, 2.67%
41-50h,44.67%
61-70h, 10%
51-60h, 27.33%
less than 1/2 h, 25%3-4h, 2%
2-3h, 3%
1/2 - 1 h45%
1-2h, 25%
16 Digital Salary Industry Insights
We were also interested in the unique experiences of freelance and contract staff with regards to their working habits and preferences.
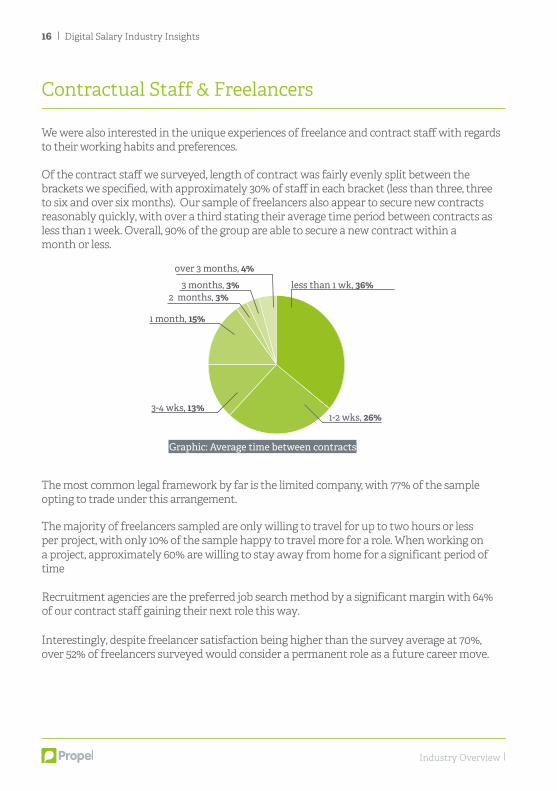
Of the contract staff we surveyed, length of contract was fairly evenly split between the brackets we specified, with approximately 30% of staff in each bracket (less than three, three to six and over six months). Our sample of freelancers also appear to secure new contracts reasonably quickly, with over a third stating their average time period between contracts as less than 1 week. Overall, 90% of the group are able to secure a new contract within a month or less.
The most common legal framework by far is the limited company, with 77% of the sample opting to trade under this arrangement.
The majority of freelancers sampled are only willing to travel for up to two hours or less per project, with only 10% of the sample happy to travel more for a role. When working on a project, approximately 60% are willing to stay away from home for a significant period of time
Recruitment agencies are the preferred job search method by a significant margin with 64% of our contract staff gaining their next role this way.
Interestingly, despite freelancer satisfaction being higher than the survey average at 70%, over 52% of freelancers surveyed would consider a permanent role as a future career move.
Contractual Staff & Freelancers
Industry Overview
Graphic: Average time between contracts
less than 1 wk, 36%
over 3 months, 4%
3 months, 3%2 months, 3%
1-2 wks, 26%
1 month, 15%
3-4 wks, 13%
Digital Salary Industry Insights 17
One of the most commonly observed trends throughout our sample was that remuneration perception appeared to have a strong influence on leaving intentions, with individuals who believe they are underpaid consistently more likely to be seeking a new role.
Remuneration perception and satisfaction also appear to be related, with 74% of respondents that are very dissatisfied across the sample stating that they are underpaid. In sharp contrast, 84% of individuals who are very satisfied, state that they are fairly paid. Whenever we increase a level in terms of satisfaction, we also see higher levels of positive remuneration perception.
As financial success also persists as one the most important factors in determining individual views of professional success among the sample, it is crucial that organisations are commu-nicating reward systems effectively to ensure that employees have an open understanding of how their remuneration has been determined, and why this is appropriate in relation to other members of the organisation.
Traditionally, it has been argued that individuals base their own pay perceptions on equity models in relation to their co-workers, and perceive these levels of pay in the wider context of organisational justice.
Perceptions of organisational justice have been studied extensively by academics and HR professionals, and have been determined to influence a wide range of behaviours, including satisfaction and leaving intentions. Views of organisational justice have also been shown to impact behaviours within the workplace, linking to withdrawal behaviours such as absentee-ism and lateness, and a number of behaviours linked to job performance.
Therefore, although complete organisational transparency may not always be appropriate or possible in terms of pay communication, there should be a level of focus applied within organisations to ensure that employees believe their pay is fair and equitable.
Where this is not the case, creating communication programs that outline the reasoning be-hind remuneration models to ensure that employees are aware of the mechanics behind them is important. Employers should also react appropriately to any injustices highlighted in existing reward systems, to ensure that these do not impact on retention levels or employee performance.
Remuneration Perceptions
Industry Overview
18 Digital Salary Industry Insights
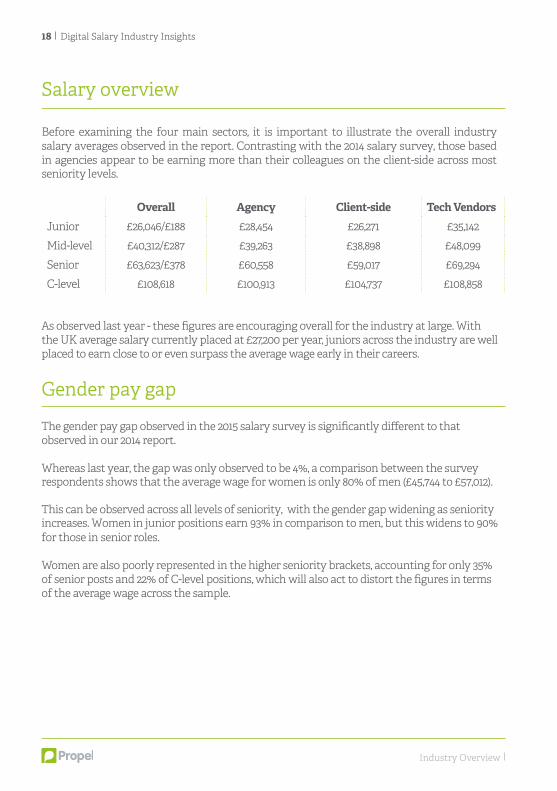
Before examining the four main sectors, it is important to illustrate the overall industry salary averages observed in the report. Contrasting with the 2014 salary survey, those based in agencies appear to be earning more than their colleagues on the client-side across most seniority levels.
Overall Agency Client-side Tech VendorsJunior £26,046/£188 £28,454 £26,271 £35,142
Mid-level £40,312/£287 £39,263 £38,898 £48,099
Senior £63,623/£378 £60,558 £59,017 £69,294
C-level £108,618 £100,913 £104,737 £108,858
As observed last year - these figures are encouraging overall for the industry at large. With the UK average salary currently placed at £27,200 per year, juniors across the industry are well placed to earn close to or even surpass the average wage early in their careers.
The gender pay gap observed in the 2015 salary survey is significantly different to that observed in our 2014 report.
Whereas last year, the gap was only observed to be 4%, a comparison between the survey respondents shows that the average wage for women is only 80% of men (£45,744 to £57,012).
This can be observed across all levels of seniority, with the gender gap widening as seniority increases. Women in junior positions earn 93% in comparison to men, but this widens to 90% for those in senior roles.
Women are also poorly represented in the higher seniority brackets, accounting for only 35% of senior posts and 22% of C-level positions, which will also act to distort the figures in terms of the average wage across the sample.
Salary overview
Gender pay gap
Industry Overview
Section 2:
Marketing
The Marketing section summarises the salaries of those working across a range of digital marketing services.
These individuals represent the voice of organisations across the UK, and increasingly specialise in narrow digital disciplines, illustrating the increasing complexity of modern marketing.
20 Digital Salary Industry Insights
Our survey highlighted a range of interesting themes across the marketing sector. Some of the key points are summarised below:
• 64% of marketers earning less than they achieved in their previous role are seeking a newposition.
• 62% of marketers aged between 18-24 intend to stay in their post in 2015.• Almost 70% of affiliate marketers are looking to change roles in 2015, in comparison with only
17% of those in paid social.• Just under a third (28%) of marketers secured their role through a recruitment consultancy,
which was the most prominent source for securing a role.• 58% of men working in marketing receive a bonus, in comparison with just 49% of women.
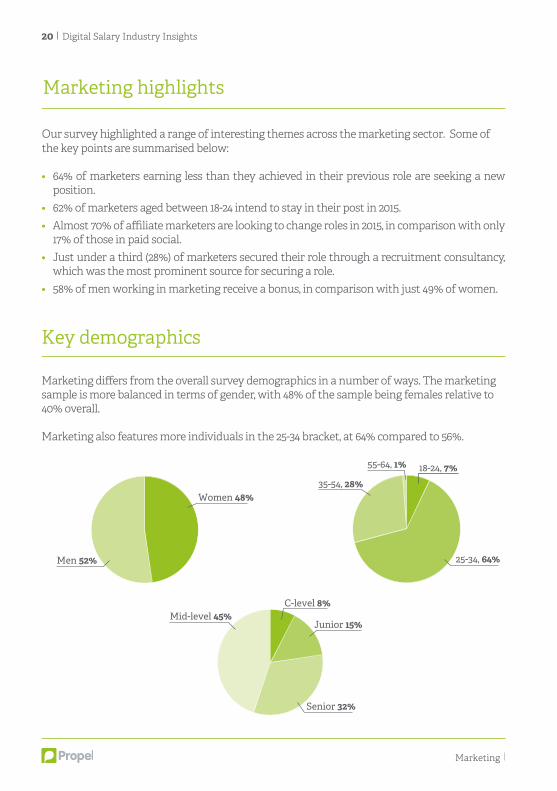
Marketing differs from the overall survey demographics in a number of ways. The marketing sample is more balanced in terms of gender, with 48% of the sample being females relative to 40% overall.
Marketing also features more individuals in the 25-34 bracket, at 64% compared to 56%.
Key demographics
Marketing
Women 48%
Men 52%
55-64, 1% 18-24, 7%
25-34, 64%
35-54, 28%
Junior 15%
C-level 8%
Senior 32%
Mid-level 45%
Marketing highlights
Digital Salary Industry Insights 21
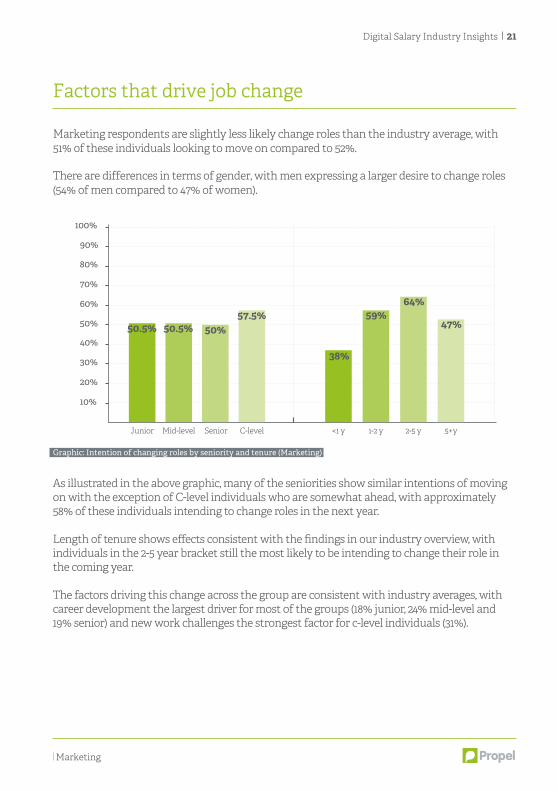
Marketing respondents are slightly less likely change roles than the industry average, with 51% of these individuals looking to move on compared to 52%.
There are differences in terms of gender, with men expressing a larger desire to change roles (54% of men compared to 47% of women).
As illustrated in the above graphic, many of the seniorities show similar intentions of moving on with the exception of C-level individuals who are somewhat ahead, with approximately 58% of these individuals intending to change roles in the next year.
Length of tenure shows effects consistent with the findings in our industry overview, with individuals in the 2-5 year bracket still the most likely to be intending to change their role in the coming year.
The factors driving this change across the group are consistent with industry averages, with career development the largest driver for most of the groups (18% junior, 24% mid-level and 19% senior) and new work challenges the strongest factor for c-level individuals (31%).
Factors that drive job change
Marketing
Graphic: Intention of changing roles by seniority and tenure (Marketing)
Junior Mid-level Senior C-level
20%
10%
40%
30%
60%
50%
80%
70%
100%
90%
<1 y 1-2 y 2-5 y 5+y
50.5%
38%
59%47%
64%
50.5% 50%57.5%
22 Digital Salary Industry Insights
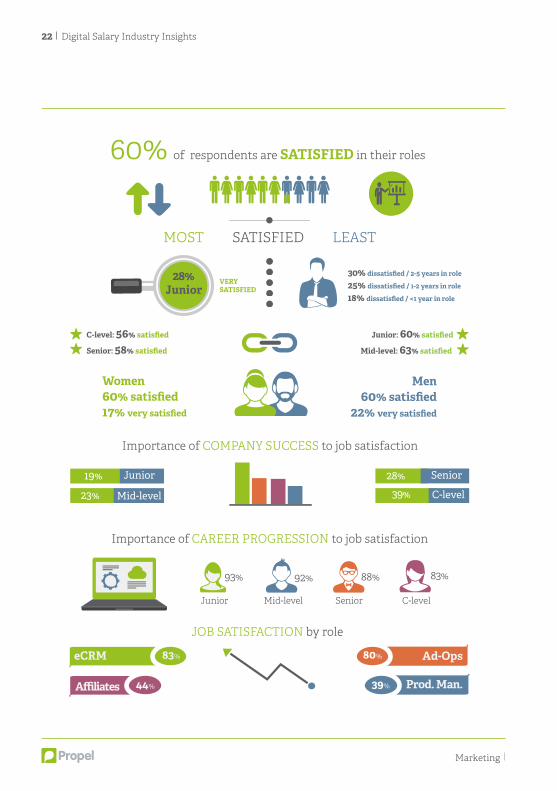
Women60% satisfied17% very satisfied
28%Junior
Men60% satisfied
22% very satisfied
Junior Mid-level Senior C-level
93% 92% 88% 83%
Junior: 60% satisfied
Mid-level: 63% satisfied
C-level: 56% satisfied
Senior: 58% satisfied
Prod. Man.
Ad-OpseCRM
Affiliates
JOB SATISFACTION by role
60% of respondents are SATISFIED in their roles
19% Junior
23% Mid-level
28% Senior
39% C-level
MOST SATISFIED LEAST
Importance of COMPANY SUCCESS to job satisfaction
30% dissatisfied / 2-5 years in role 25% dissatisfied / 1-2 years in role
18% dissatisfied / <1 year in role
Importance of CAREER PROGRESSION to job satisfaction
VERYSATISFIED
80%
39%
83%
44%
Marketing
Digital Salary Industry Insights 23
Job satisfaction statistics can be viewed on the infographic on the adjacent page. Marketing satisfaction is overall slightly lower than the industry average at 60% (compared to 63%).
Juniors are most likely to be “very satisfied” but the mid-level group has the highest level of satisfaction overall (63%).
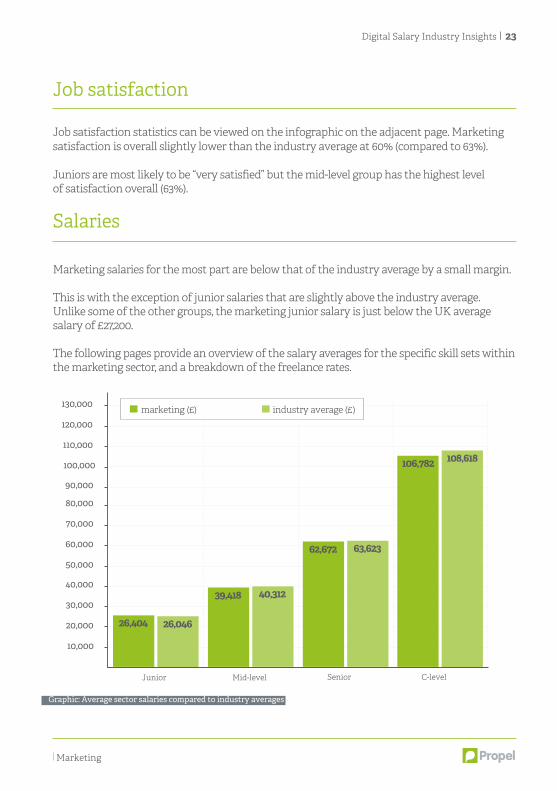
Marketing salaries for the most part are below that of the industry average by a small margin.
This is with the exception of junior salaries that are slightly above the industry average. Unlike some of the other groups, the marketing junior salary is just below the UK average salary of £27,200.
The following pages provide an overview of the salary averages for the specific skill sets within the marketing sector, and a breakdown of the freelance rates.
Job satisfaction
Salaries
Marketing
Junior Mid-level
Graphic: Average sector salaries compared to industry averages
(Marketing)
Senior C-level
20,000
10,000
40,000
30,000
60,000
50,000
80,000
70,000
90,000
100,000
110,000
120,000
130,000
26,404 26,046
39,418 40,312
62,672 63,623
106,782 108,618
marketing (£) industry average (£)
24 Digital Salary Industry Insights
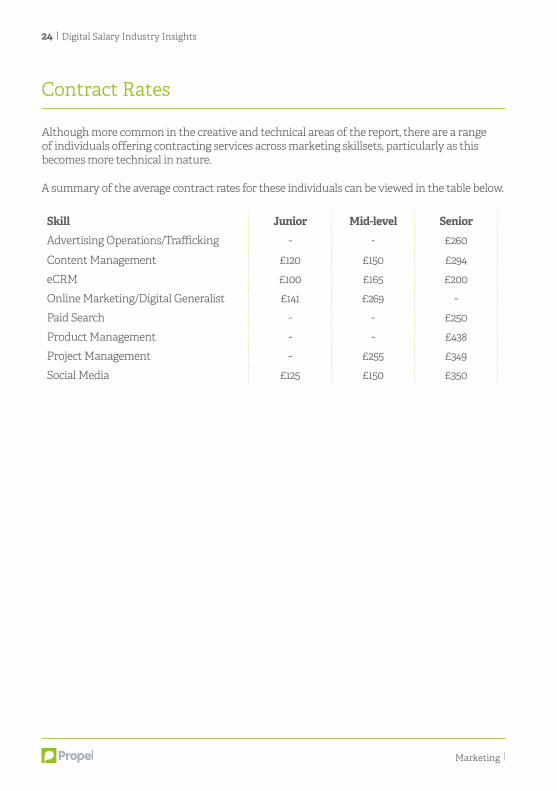
Although more common in the creative and technical areas of the report, there are a range of individuals offering contracting services across marketing skillsets, particularly as this becomes more technical in nature.
A summary of the average contract rates for these individuals can be viewed in the table below.
Skill Junior Mid-level SeniorAdvertising Operations/Trafficking - - £260
Content Management £120 £150 £294
eCRM £100 £165 £200
Online Marketing/Digital Generalist £141 £269 -
Paid Search - - £250
Product Management - - £438
Project Management - £255 £349
Social Media £125 £150 £350
Contract Rates
Marketing
Digital Salary Industry Insights 25
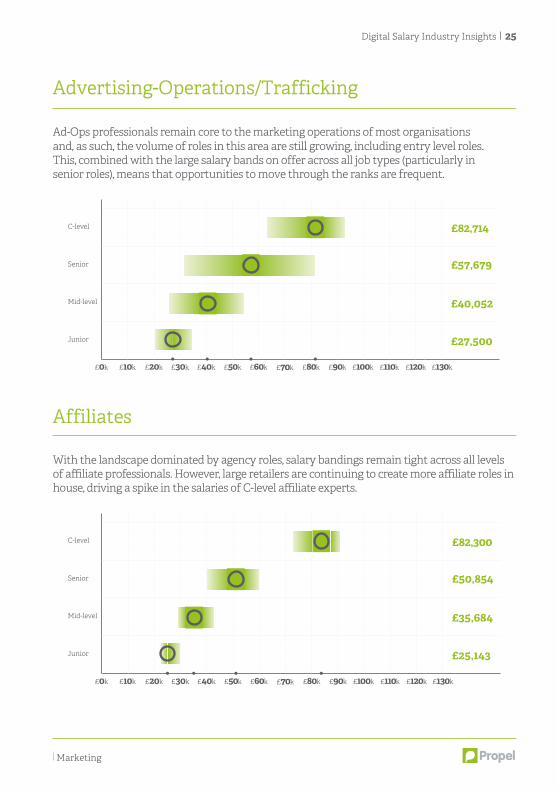
Ad-Ops professionals remain core to the marketing operations of most organisations and, as such, the volume of roles in this area are still growing, including entry level roles. This, combined with the large salary bands on offer across all job types (particularly in senior roles), means that opportunities to move through the ranks are frequent.
With the landscape dominated by agency roles, salary bandings remain tight across all levels of affiliate professionals. However, large retailers are continuing to create more affiliate roles in house, driving a spike in the salaries of C-level affiliate experts.
Advertising-Operations/Trafficking
Affiliates
Marketing
£40,052
£27,500
C-level
£0k
£57,679
£82,714
Senior
Mid-level
Junior
£10k £20k £30k £40k £50k £60k £70k £80k £90k £100k £110k £120k £130k
£35,684
£25,143
C-level
£0k
£50,854
£82,300
Senior
Mid-level
Junior
£10k £20k £30k £40k £50k £60k £70k £80k £90k £100k £110k £120k £130k
26 Digital Salary Industry Insights
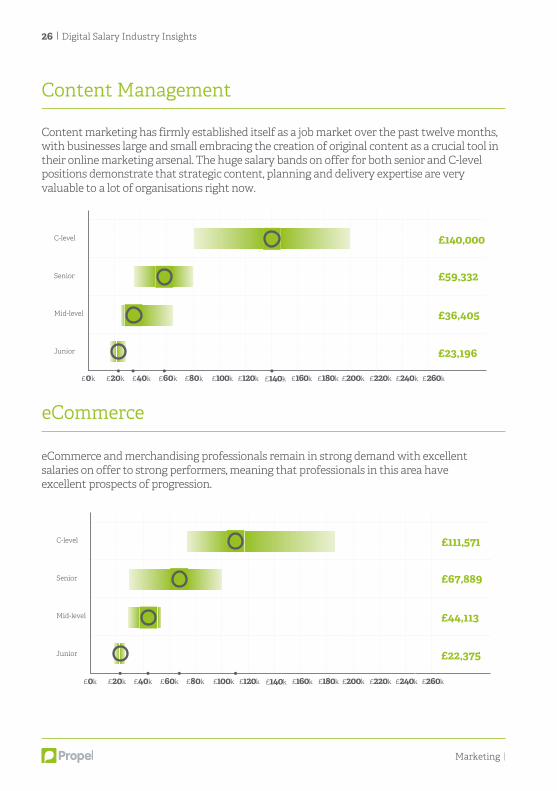
Content marketing has firmly established itself as a job market over the past twelve months, with businesses large and small embracing the creation of original content as a crucial tool in their online marketing arsenal. The huge salary bands on offer for both senior and C-level positions demonstrate that strategic content, planning and delivery expertise are very valuable to a lot of organisations right now.
eCommerce and merchandising professionals remain in strong demand with excellent salaries on offer to strong performers, meaning that professionals in this area have excellent prospects of progression.
Content Management
£0k £20k £40k £60k £80k £100k £120k £140k £160k £180k £200k £220k £240k £260k
eCommerce
Marketing
£36,405
£23,196
C-level
£59,332
£140,000
Senior
Mid-level
Junior
£44,113
£22,375
C-level
£0k
£67,889
£111,571
Senior
Mid-level
Junior
£20k £40k £60k £80k £100k £120k £140k £160k £180k £200k £220k £240k £260k
Digital Salary Industry Insights 27
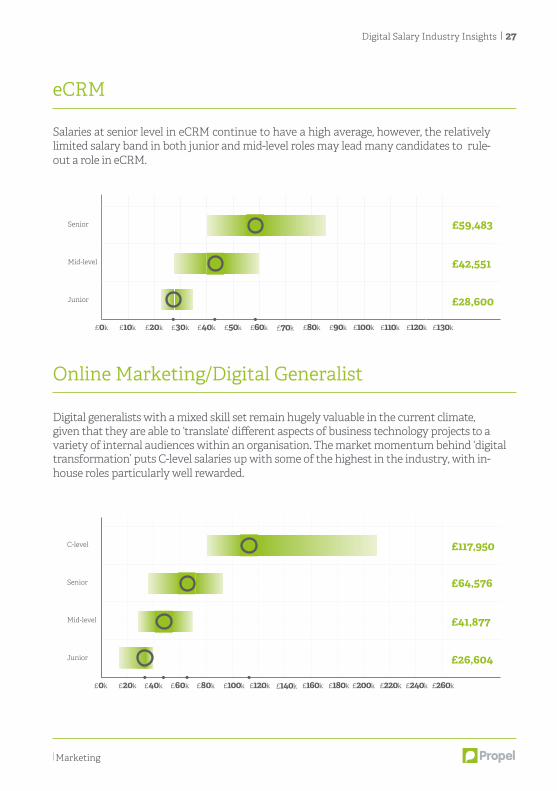
Salaries at senior level in eCRM continue to have a high average, however, the relatively limited salary band in both junior and mid-level roles may lead many candidates to rule-out a role in eCRM.
eCRM
Digital generalists with a mixed skill set remain hugely valuable in the current climate, given that they are able to ‘translate’ different aspects of business technology projects to a variety of internal audiences within an organisation. The market momentum behind ‘digital transformation’ puts C-level salaries up with some of the highest in the industry, with in-house roles particularly well rewarded.
Online Marketing/Digital Generalist
Marketing
£42,551
£28,600
£0k
£59,483Senior
Mid-level
Junior
£10k £20k £30k £40k £50k £60k £70k £80k £90k £100k £110k £120k £130k
£41,877
£26,604
C-level
£0k
£64,576
£117,950
Senior
Mid-level
Junior
£20k £40k £60k £80k £100k £120k £140k £160k £180k £200k £220k £240k £260k
28 Digital Salary Industry Insights
Marketing
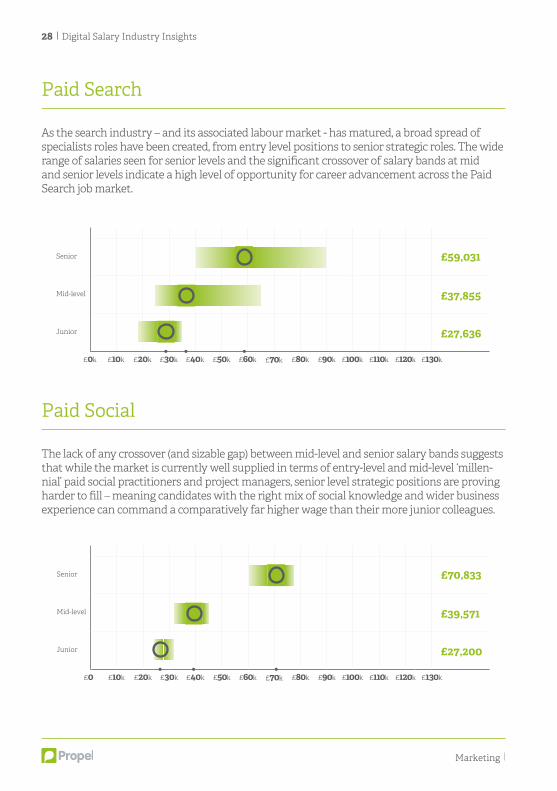
As the search industry – and its associated labour market - has matured, a broad spread of specialists roles have been created, from entry level positions to senior strategic roles. The wide range of salaries seen for senior levels and the significant crossover of salary bands at mid and senior levels indicate a high level of opportunity for career advancement across the Paid Search job market.
The lack of any crossover (and sizable gap) between mid-level and senior salary bands suggests that while the market is currently well supplied in terms of entry-level and mid-level ‘millen-nial’ paid social practitioners and project managers, senior level strategic positions are proving harder to fill – meaning candidates with the right mix of social knowledge and wider business experience can command a comparatively far higher wage than their more junior colleagues.
Paid Search
Paid Social
£37,855
£27,636
£0k
£59,031Senior
Mid-level
Junior
£10k £20k £30k £40k £50k £60k £70k £80k £90k £100k £110k £120k £130k
£39,571
£27,200
£0
£70,833Senior
Mid-level
Junior
£10k £20k £30k £40k £50k £60k £70k £80k £90k £100k £110k £120k £130k
Digital Salary Industry Insights 29
Marketing
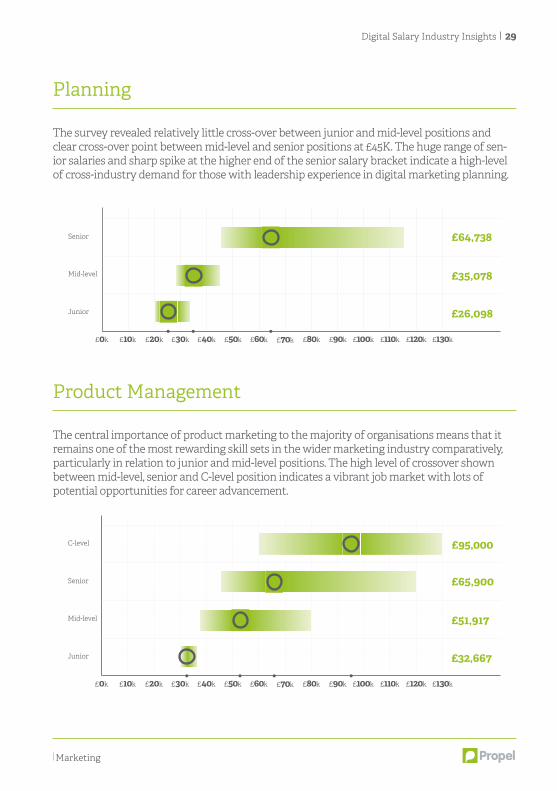
The survey revealed relatively little cross-over between junior and mid-level positions and clear cross-over point between mid-level and senior positions at £45K. The huge range of sen-ior salaries and sharp spike at the higher end of the senior salary bracket indicate a high-level of cross-industry demand for those with leadership experience in digital marketing planning.
Planning
The central importance of product marketing to the majority of organisations means that it remains one of the most rewarding skill sets in the wider marketing industry comparatively, particularly in relation to junior and mid-level positions. The high level of crossover shown between mid-level, senior and C-level position indicates a vibrant job market with lots of potential opportunities for career advancement.
Product Management
£35,078
£26,098
£0k
£64,738Senior
Mid-level
Junior
£10k £20k £30k £40k £50k £60k £70k £80k £90k £100k £110k £120k £130k
£51,917
£32,667
C-level
£0k
£65,900
£95,000
Senior
Mid-level
Junior
£10k £20k £30k £40k £50k £60k £70k £80k £90k £100k £110k £120k £130k
30 Digital Salary Industry Insights
Marketing
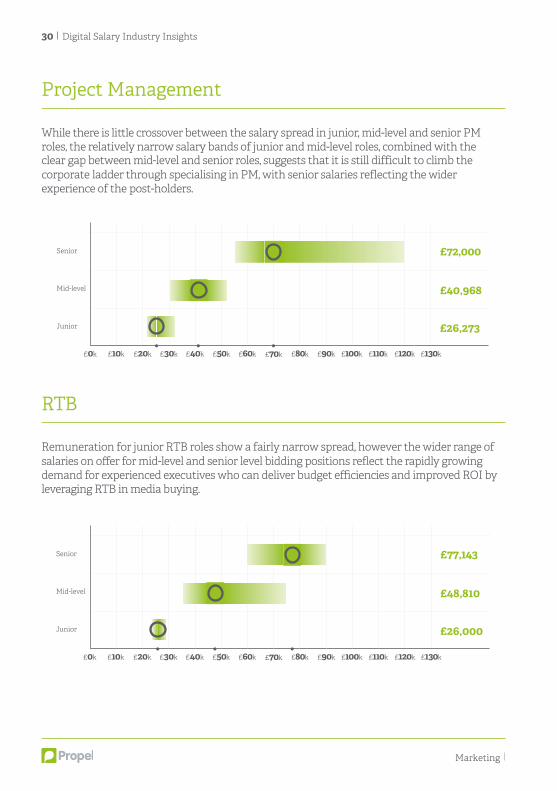
While there is little crossover between the salary spread in junior, mid-level and senior PM roles, the relatively narrow salary bands of junior and mid-level roles, combined with the clear gap between mid-level and senior roles, suggests that it is still difficult to climb the corporate ladder through specialising in PM, with senior salaries reflecting the wider experience of the post-holders.
Remuneration for junior RTB roles show a fairly narrow spread, however the wider range of salaries on offer for mid-level and senior level bidding positions reflect the rapidly growing demand for experienced executives who can deliver budget efficiencies and improved ROI by leveraging RTB in media buying.
Project Management
RTB
£40,968
£26,273
£0k
£72,000Senior
Mid-level
Junior
£10k £20k £30k £40k £50k £60k £70k £80k £90k £100k £110k £120k £130k
£48,810
£26,000
£0k
£77,143Senior
Mid-level
Junior
£10k £20k £30k £40k £50k £60k £70k £80k £90k £100k £110k £120k £130k
Digital Salary Industry Insights 31
Marketing
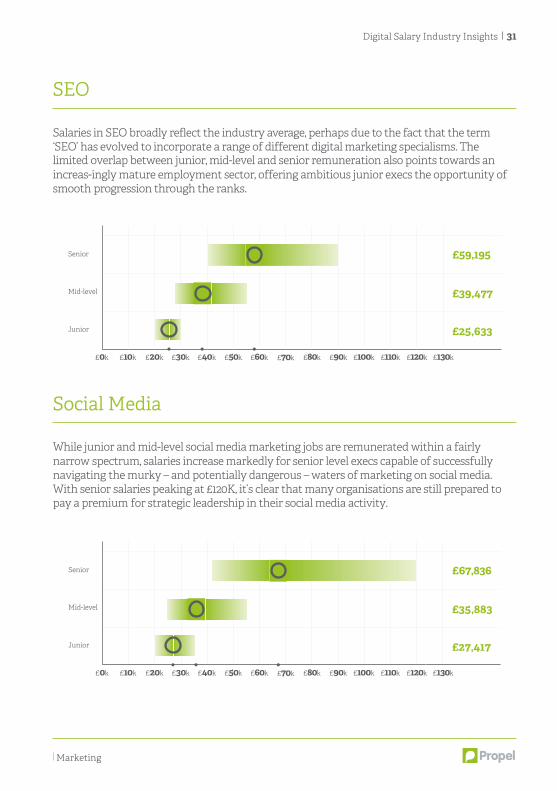
Salaries in SEO broadly reflect the industry average, perhaps due to the fact that the term ‘SEO’ has evolved to incorporate a range of different digital marketing specialisms. The limited overlap between junior, mid-level and senior remuneration also points towards an increas-ingly mature employment sector, offering ambitious junior execs the opportunity of smooth progression through the ranks.
While junior and mid-level social media marketing jobs are remunerated within a fairly narrow spectrum, salaries increase markedly for senior level execs capable of successfully navigating the murky – and potentially dangerous – waters of marketing on social media. With senior salaries peaking at £120K, it’s clear that many organisations are still prepared to pay a premium for strategic leadership in their social media activity.
SEO
Social Media
£39,477
£25,633
£0k
£59,195Senior
Mid-level
Junior
£10k £20k £30k £40k £50k £60k £70k £80k £90k £100k £110k £120k £130k
£35,883
£27,417
£0k
£67,836Senior
Mid-level
Junior
£10k £20k £30k £40k £50k £60k £70k £80k £90k £100k £110k £120k £130k
32 Digital Salary Industry Insights
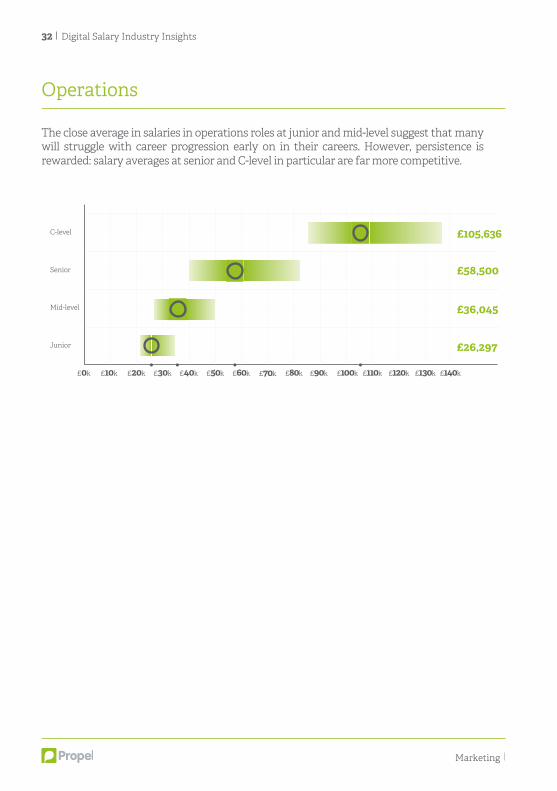
The close average in salaries in operations roles at junior and mid-level suggest that many will struggle with career progression early on in their careers. However, persistence is rewarded: salary averages at senior and C-level in particular are far more competitive.
Operations
£36,045
£26,297
C-level
£0k
£58,500
£105,636
Senior
Mid-level
Junior
£10k £20k £30k £40k £50k £60k £70k £80k £90k £100k £110k £120k £130k £140k
Marketing
Section 3:
Commercial
The Commercial section provides a summary of those at the front line of business development in organisations, charged with the responsibility of bringing in the essential revenue streams needed to foster growth.
34 Digital Salary Industry Insights
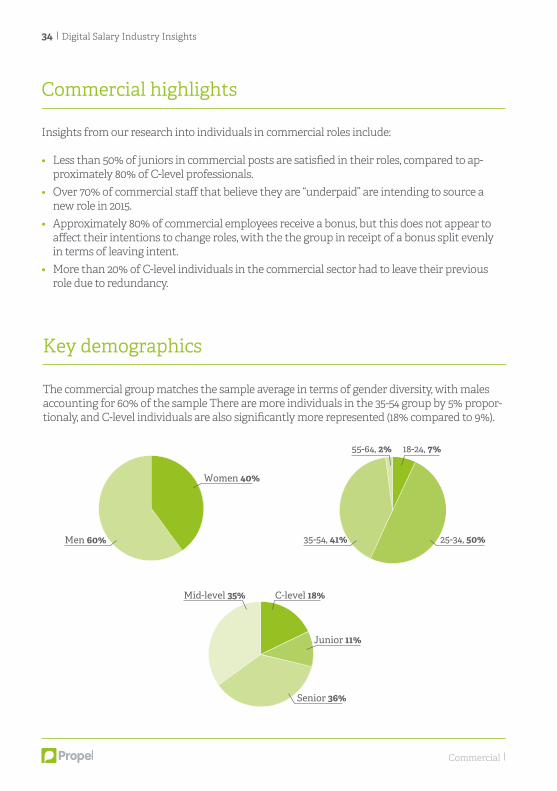
Insights from our research into individuals in commercial roles include:
• Less than 50% of juniors in commercial posts are satisfied in their roles, compared to ap-proximately 80% of C-level professionals.
• Over 70% of commercial staff that believe they are “underpaid” are intending to source anew role in 2015.
• Approximately 80% of commercial employees receive a bonus, but this does not appear toaffect their intentions to change roles, with the the group in receipt of a bonus split evenlyin terms of leaving intent.
• More than 20% of C-level individuals in the commercial sector had to leave their previousrole due to redundancy.
The commercial group matches the sample average in terms of gender diversity, with males accounting for 60% of the sample There are more individuals in the 35-54 group by 5% propor-tionaly, and C-level individuals are also significantly more represented (18% compared to 9%).
Commercial highlights
Key demographics
Commercial
Women 40%
Men 60%
55-64, 2% 18-24, 7%
25-34, 50%35-54, 41%
Junior 11%
C-level 18%
Senior 36%
Mid-level 35%
Digital Salary Industry Insights 35
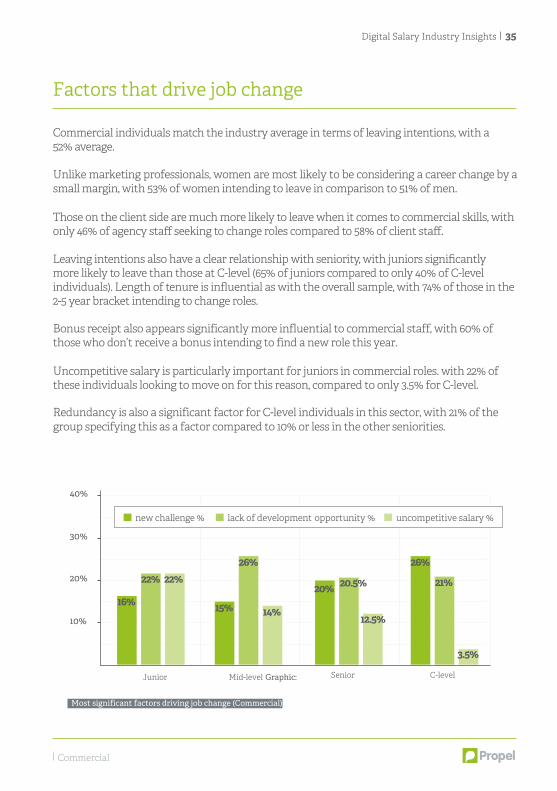
Commercial individuals match the industry average in terms of leaving intentions, with a 52% average.
Unlike marketing professionals, women are most likely to be considering a career change by a small margin, with 53% of women intending to leave in comparison to 51% of men.
Those on the client side are much more likely to leave when it comes to commercial skills, with only 46% of agency staff seeking to change roles compared to 58% of client staff.
Leaving intentions also have a clear relationship with seniority, with juniors significantly more likely to leave than those at C-level (65% of juniors compared to only 40% of C-level individuals). Length of tenure is influential as with the overall sample, with 74% of those in the 2-5 year bracket intending to change roles.
Bonus receipt also appears significantly more influential to commercial staff, with 60% of those who don’t receive a bonus intending to find a new role this year.
Uncompetitive salary is particularly important for juniors in commercial roles. with 22% of these individuals looking to move on for this reason, compared to only 3.5% for C-level.
Redundancy is also a significant factor for C-level individuals in this sector, with 21% of the group specifying this as a factor compared to 10% or less in the other seniorities.
Factors that drive job change
Commercial
Junior Mid-level Graphic:
Most significant factors driving job change (Commercial)
Senior C-level
10%
20%
30%
40%
16%
22% 22%
15%
26%
14%
20% 20.5%
12.5%
26%
21%
3.5%
new challenge % lack of development opportunity % uncompetitive salary %
36 Digital Salary Industry Insights
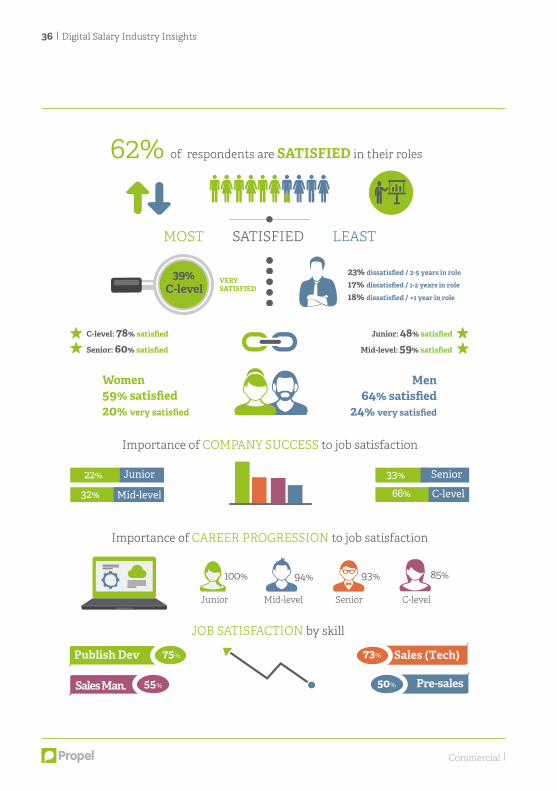
Women59% satisfied20% very satisfied
39%C-level
Men64% satisfied
24% very satisfied
Junior Mid-level Senior C-level
100% 94% 93% 85%
Junior: 48% satisfied
Mid-level: 59% satisfied
C-level: 78% satisfied
Senior: 60% satisfied
Pre-sales
Sales (Tech)Publish Dev
Sales Man.
JOB SATISFACTION by skill
62% of respondents are SATISFIED in their roles
22% Junior
32% Mid-level
33% Senior
66% C-level
MOST SATISFIED LEAST
Importance of COMPANY SUCCESS to job satisfaction
23% dissatisfied / 2-5 years in role 17% dissatisfied / 1-2 years in role
18% dissatisfied / <1 year in role
Importance of CAREER PROGRESSION to job satisfaction
VERYSATISFIED
73%
50%
75%
55%
Commercial
Digital Salary Industry Insights 37
Commercial satisfaction statistics can be observed in the preceding infographic. Perhaps the most critical observation from this is that only 48% of junior level staff have expressed a positive level of job satisfaction.
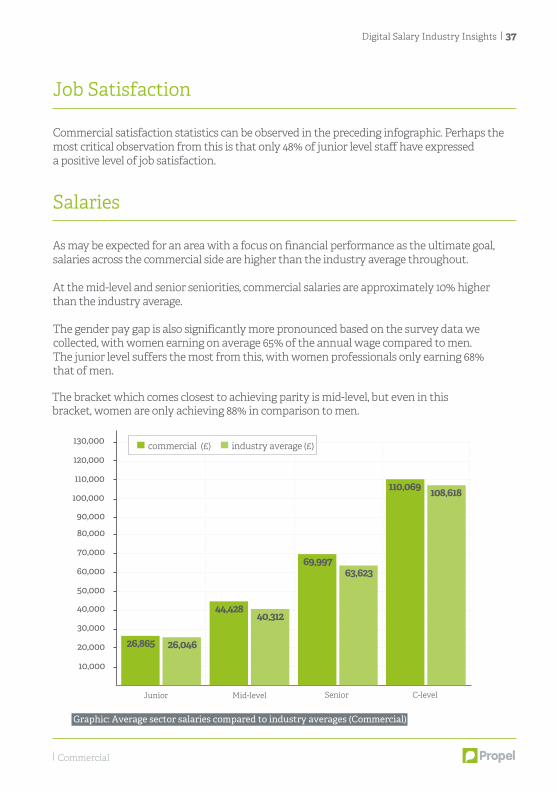
As may be expected for an area with a focus on financial performance as the ultimate goal, salaries across the commercial side are higher than the industry average throughout.
At the mid-level and senior seniorities, commercial salaries are approximately 10% higher than the industry average.
The gender pay gap is also significantly more pronounced based on the survey data we collected, with women earning on average 65% of the annual wage compared to men. The junior level suffers the most from this, with women professionals only earning 68% that of men.
The bracket which comes closest to achieving parity is mid-level, but even in this bracket, women are only achieving 88% in comparison to men.
Job Satisfaction
Salaries
Commercial
Junior Mid-level
Graphic: Average sector salaries compared to industry averages (Commercial)
Senior C-level
20,000
10,000
40,000
30,000
60,000
50,000
80,000
70,000
90,000
100,000
110,000
120,000
130,000
26,865 26,046
44,42840,312
69,99763,623
110,069 108,618
commercial (£) industry average (£)
38 Digital Salary Industry Insights
Contract Rates
Commercial
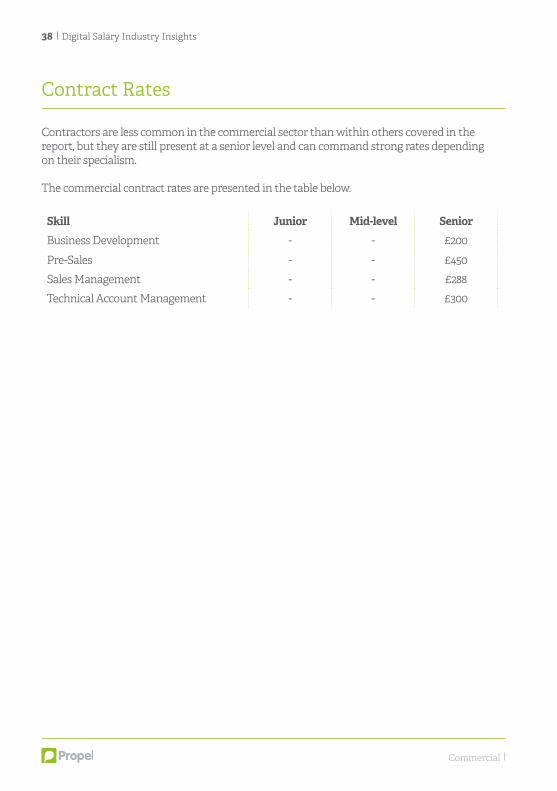
Contractors are less common in the commercial sector than within others covered in the report, but they are still present at a senior level and can command strong rates depending on their specialism.
The commercial contract rates are presented in the table below.
Skill Junior Mid-level SeniorBusiness Development - - £200
Pre-Sales - - £450
Sales Management - - £288
Technical Account Management - - £300
Digital Salary Industry Insights 39
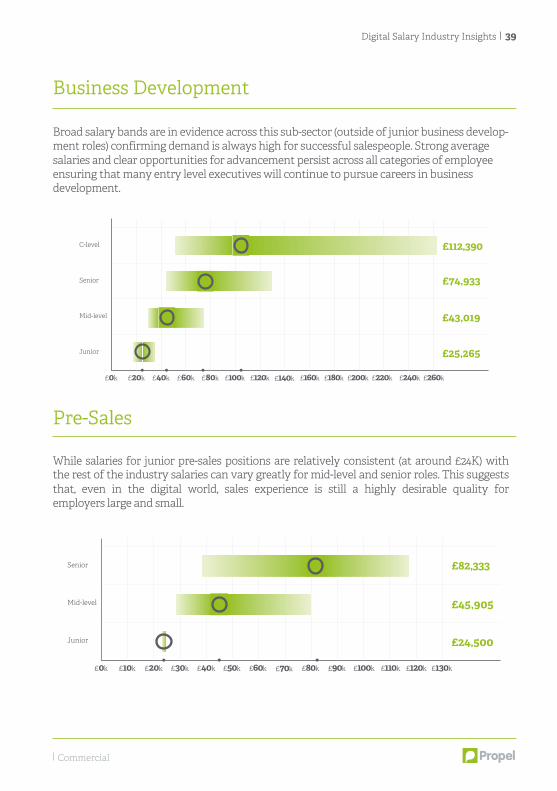
Broad salary bands are in evidence across this sub-sector (outside of junior business develop-ment roles) confirming demand is always high for successful salespeople. Strong average salaries and clear opportunities for advancement persist across all categories of employee ensuring that many entry level executives will continue to pursue careers in business development.
While salaries for junior pre-sales positions are relatively consistent (at around £24K) with the rest of the industry salaries can vary greatly for mid-level and senior roles. This suggests that, even in the digital world, sales experience is still a highly desirable quality for employers large and small.
Business Development
Pre-Sales
Commercial
£43,019
£25,265
C-level
£0k
£74,933
£112,390
Senior
Mid-level
Junior
£20k £40k £60k £80k £100k £120k £140k £160k £180k £200k £220k £240k £260k
£45,905
£24,500
£0k
£82,333Senior
Mid-level
Junior
£10k £20k £30k £40k £50k £60k £70k £80k £90k £100k £110k £120k £130k
40 Digital Salary Industry Insights
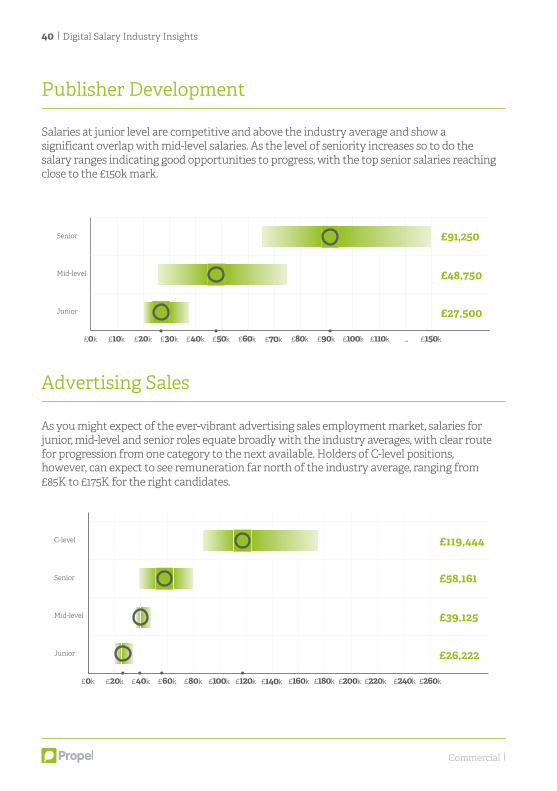
Salaries at junior level are competitive and above the industry average and show a significant overlap with mid-level salaries. As the level of seniority increases so to do the salary ranges indicating good opportunities to progress, with the top senior salaries reaching close to the £150k mark.
As you might expect of the ever-vibrant advertising sales employment market, salaries for junior, mid-level and senior roles equate broadly with the industry averages, with clear route for progression from one category to the next available. Holders of C-level positions, however, can expect to see remuneration far north of the industry average, ranging from £85K to £175K for the right candidates.
Publisher Development
Advertising Sales
Commercial
£48,750
£27,500
£0k
£91,250Senior
Mid-level
Junior
£10k £20k £30k £40k £50k £60k £70k £80k £90k £100k £110k ... £150k
£39,125
£26,222
C-level
£0k
£58,161
£119,444
Senior
Mid-level
Junior
£20k £40k £60k £80k £100k £140k £160k £180k £200k £220k £240k £260k£120k
Digital Salary Industry Insights 41
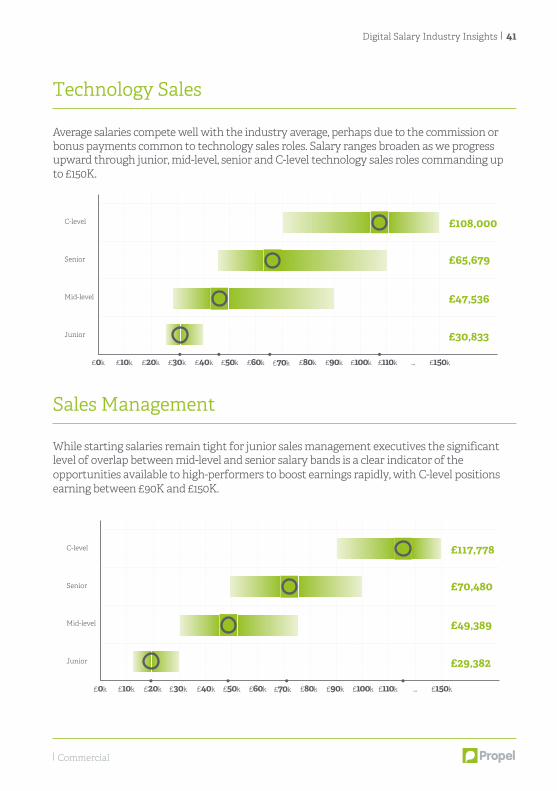
Average salaries compete well with the industry average, perhaps due to the commission or bonus payments common to technology sales roles. Salary ranges broaden as we progress upward through junior, mid-level, senior and C-level technology sales roles commanding up to £150K.
While starting salaries remain tight for junior sales management executives the significant level of overlap between mid-level and senior salary bands is a clear indicator of the opportunities available to high-performers to boost earnings rapidly, with C-level positions earning between £90K and £150K.
Technology Sales
Sales Management
Commercial
£47,536
£30,833
C-level
£0k
£65,679
£108,000
Senior
Mid-level
Junior
£10k £20k £30k £40k £50k £60k £70k £80k £90k £100k £110k ... £150k
£49,389
£29,382
C-level
£0k
£70,480
£117,778
Senior
Mid-level
Junior
£10k £20k £30k £40k £50k £60k £70k £80k £90k £100k £110k ... £150k
42 Digital Salary Industry Insights
Commercial
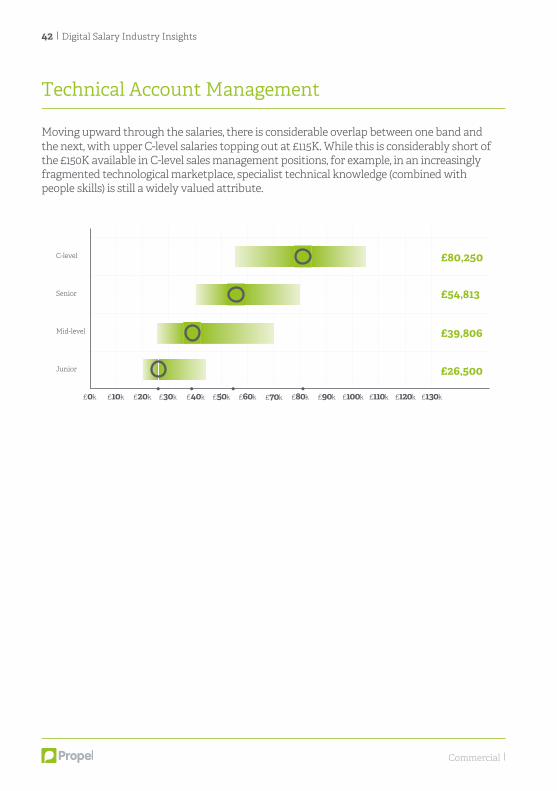
Moving upward through the salaries, there is considerable overlap between one band and the next, with upper C-level salaries topping out at £115K. While this is considerably short of the £150K available in C-level sales management positions, for example, in an increasingly fragmented technological marketplace, specialist technical knowledge (combined with people skills) is still a widely valued attribute.
Technical Account Management
£39,806
£26,500
C-level
£0k
£54,813
£80,250
Senior
Mid-level
Junior
£10k £20k £30k £40k £50k £60k £70k £80k £90k £100k £110k £120k £130k
Section 4:
Technical
Technical staff have become essential in an environment in which all aspects of business increasingly require digital skills as standard.
Here we review the salaries and perceptions of the talented members of staff driving the technology behind modern businesses.
44 Digital Salary Industry Insights
Highlights from our respondents based in technical focused roles are as follows:
• 80% of data science professionals are satisfied in their posts, compared to only 43% of thoseworking in IT support.
• Under 20% of junior technical employees believe company success is important to their ownpersonal success.
• The most stated reason for technical staff seeking to change roles is due to a lack of careerdevelopment opportunities, with this trend observed from junior to C-level seniorities.
• Of those technical employees who have been in post for 2-5 years, only 47% state they aresatisfied in their role. This compares to a 75% satisfaction rate amongst those in their post for under a year.
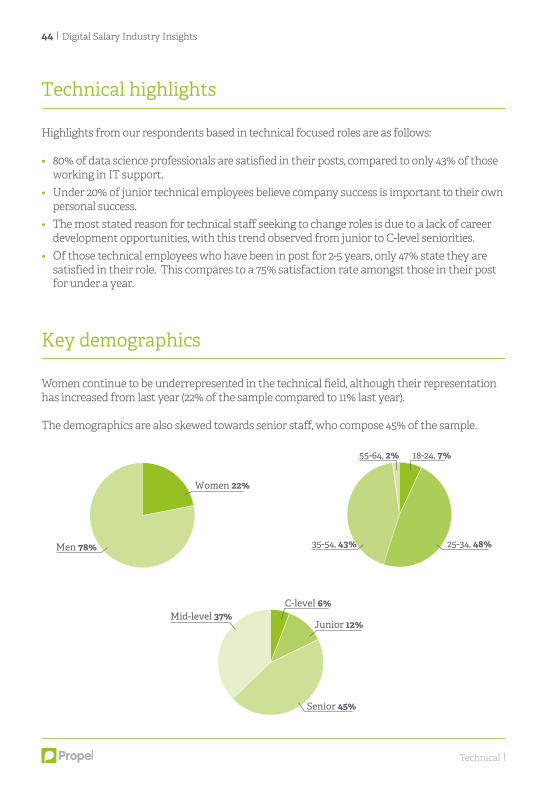
Women continue to be underrepresented in the technical field, although their representation has increased from last year (22% of the sample compared to 11% last year).
The demographics are also skewed towards senior staff, who compose 45% of the sample.
Technical highlights
Key demographics
Technical
Women 22%
Men 78%
55-64, 2% 18-24, 7%
25-34, 48%35-54, 43%
Junior 12%
C-level 6%
Senior 45%
Mid-level 37%
Digital Salary Industry Insights 45
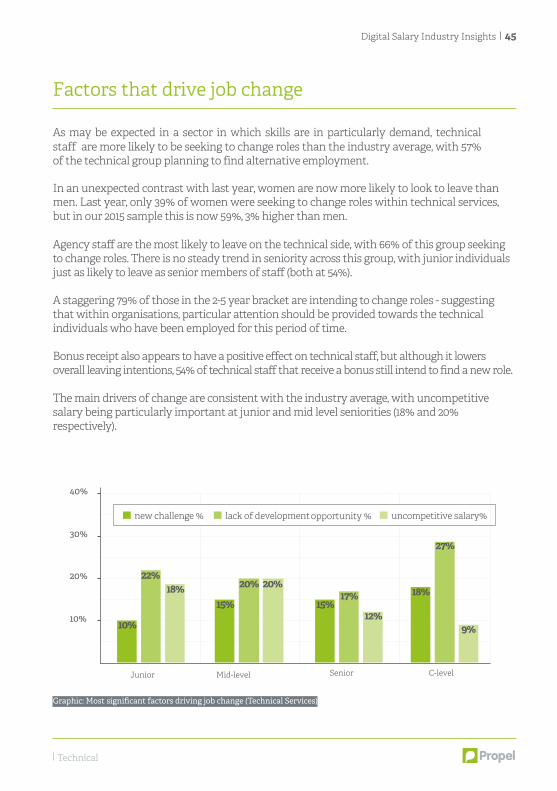
As may be expected in a sector in which skills are in particularly demand, technical staff are more likely to be seeking to change roles than the industry average, with 57% of the technical group planning to find alternative employment.
In an unexpected contrast with last year, women are now more likely to look to leave than men. Last year, only 39% of women were seeking to change roles within technical services, but in our 2015 sample this is now 59%, 3% higher than men.
Agency staff are the most likely to leave on the technical side, with 66% of this group seeking to change roles. There is no steady trend in seniority across this group, with junior individuals just as likely to leave as senior members of staff (both at 54%).
A staggering 79% of those in the 2-5 year bracket are intending to change roles - suggesting that within organisations, particular attention should be provided towards the technical individuals who have been employed for this period of time.
Bonus receipt also appears to have a positive effect on technical staff, but although it lowers overall leaving intentions, 54% of technical staff that receive a bonus still intend to find a new role.
The main drivers of change are consistent with the industry average, with uncompetitive salary being particularly important at junior and mid level seniorities (18% and 20% respectively).
Factors that drive job change
Technical
Junior Mid-level
Graphic: Most significant factors driving job change (Technical Services)
Senior C-level
10%
20%
30%
40%
10%
22%18%
15%
20% 20%
15%17%
12%
18%
27%
9%
new challenge % lack of development opportunity % uncompetitive salary%
46 Digital Salary Industry Insights
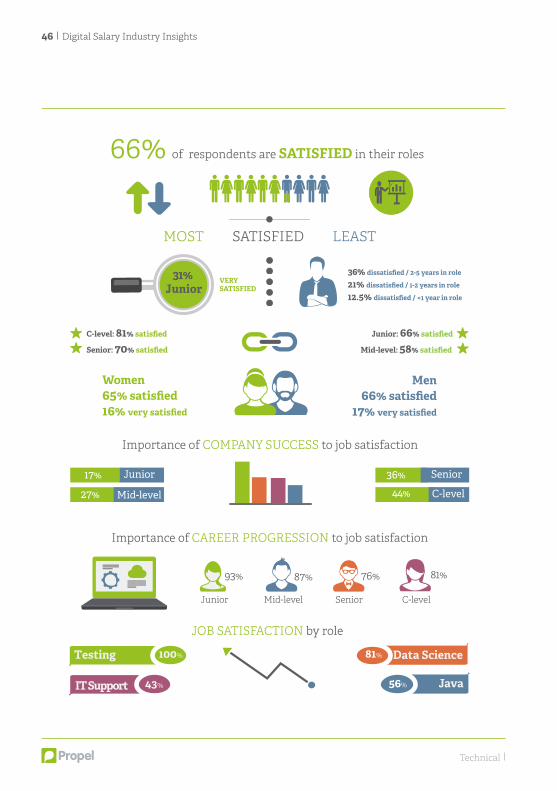
Women65% satisfied16% very satisfied
31%Junior
Men66% satisfied
17% very satisfied
Junior Mid-level Senior C-level
93% 87% 76% 81%
Junior: 66% satisfied
Mid-level: 58% satisfied
C-level: 81% satisfied
Senior: 70% satisfied
Java
Data ScienceTesting
IT Support
JOB SATISFACTION by role
66% of respondents are SATISFIED in their roles
17% Junior
27% Mid-level
36% Senior
44% C-level
MOST SATISFIED LEAST
Importance of COMPANY SUCCESS to job satisfaction
36% dissatisfied / 2-5 years in role 21% dissatisfied / 1-2 years in role
12.5% dissatisfied / <1 year in role
Importance of CAREER PROGRESSION to job satisfaction
VERYSATISFIED
81%
56%
100%
43%
Technical
Digital Salary Industry Insights 47
Technical staff actually sit slightly above the industry average in terms of satisfaction, however there are some groups within the sector that show very low levels of satisfaction. Groups such as IT support and Java developers show levels of satisfaction significantly below the average, with only 43% of IT support staff satisfied.
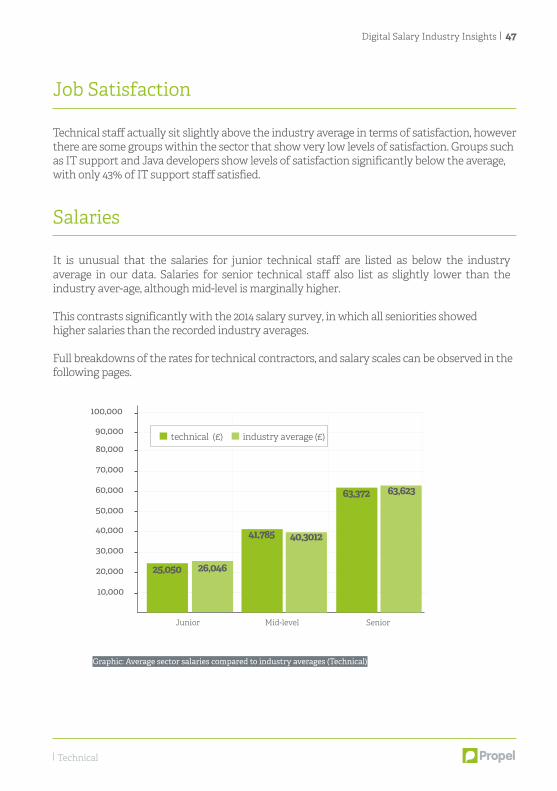
It is unusual that the salaries for junior technical staff are listed as below the industry average in our data. Salaries for senior technical staff also list as slightly lower than the industry aver-age, although mid-level is marginally higher.
This contrasts significantly with the 2014 salary survey, in which all seniorities showed higher salaries than the recorded industry averages.
Full breakdowns of the rates for technical contractors, and salary scales can be observed in the following pages.
Job Satisfaction
Salaries
Technical
Graphic: Average sector salaries compared to industry averages (Technical)
Junior Mid-level Senior
20,000
10,000
40,000
30,000
60,000
50,000
80,000
70,000
90,000
100,000
technical (£) industry average (£)
25,050
41,785
63,372
40,3012
26,046
63,623
48 Digital Salary Industry Insights
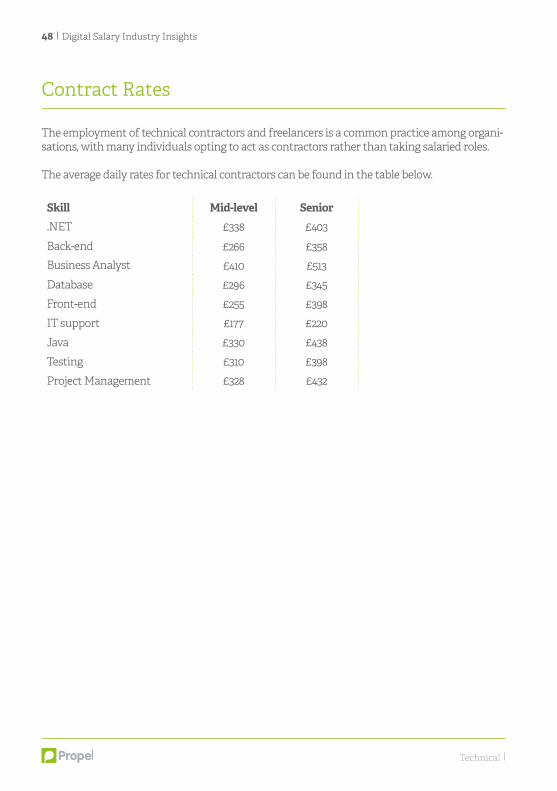
The employment of technical contractors and freelancers is a common practice among organi-sations, with many individuals opting to act as contractors rather than taking salaried roles.
The average daily rates for technical contractors can be found in the table below.
Mid-level Senior£338 £403
£266 £358
£410 £513
£296 £345
£255 £398
£177 £220
£330 £438
£310 £398
Skill.NET
Back-endBusiness Analyst
Database
Front-end
IT support
Java
Testing
Project Management £328 £432
Contract Rates
Technical

Digital Salary Industry Insights 49
While demand for .NET skills remains solid, the relative spread of junior, mid-level and senior salaries – with senior salaries topping out at £70K – suggest that anyone with six-figure salary expectations will need to develop a broader skill set than simply .NET.
Due to the business-critical nature of back-end development work, junior positions are generally hard to find in this area. Large salary ranges at mid-level and senior level suggest great opportunities for candidates with experience.
.NET
Back-end
Technical
£43,857
£31,100
£0k
£52,897Senior
Mid-level
Junior
£10k £20k £30k £40k £50k £60k £70k £80k £90k £100k £110k £120k £130k
£58,118
£43,404
£0k
Senior
Mid-level
£10k £20k £30k £40k £50k £60k £70k £80k £90k £100k £110k £120k £130k
50 Digital Salary Industry Insights
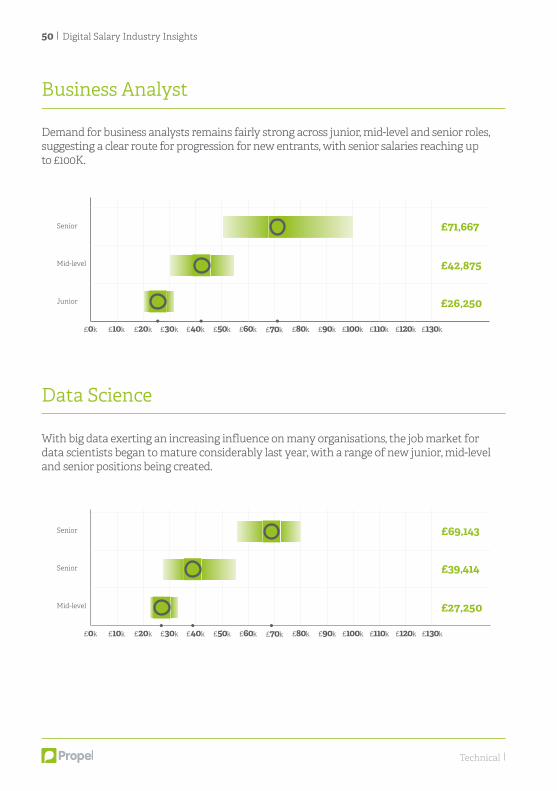
Demand for business analysts remains fairly strong across junior, mid-level and senior roles, suggesting a clear route for progression for new entrants, with senior salaries reaching up to £100K.
With big data exerting an increasing influence on many organisations, the job market for data scientists began to mature considerably last year, with a range of new junior, mid-level and senior positions being created.
Business Analyst
Data Science
Technical
£42,875
£26,250
£0k
£71,667Senior
Mid-level
Junior
£10k £20k £30k £40k £50k £60k £70k £80k £90k £100k £110k £120k £130k
£27,250
£0k
£39,414Senior
Mid-level
£10k £20k £30k £40k £50k £60k £70k £80k £90k £100k £110k £120k £130k
£69,143Senior
Digital Salary Industry Insights 51
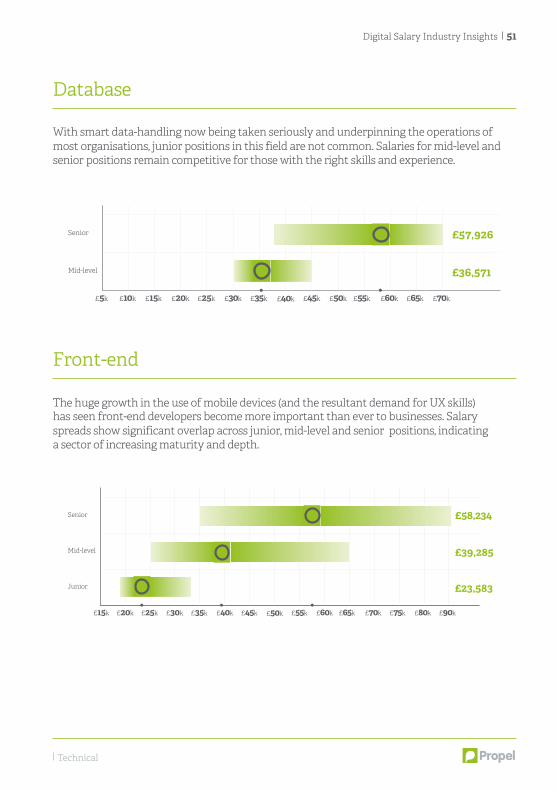
With smart data-handling now being taken seriously and underpinning the operations of most organisations, junior positions in this field are not common. Salaries for mid-level and senior positions remain competitive for those with the right skills and experience.
The huge growth in the use of mobile devices (and the resultant demand for UX skills) has seen front-end developers become more important than ever to businesses. Salary spreads show significant overlap across junior, mid-level and senior positions, indicating a sector of increasing maturity and depth.
Database
Front-end
Technical
£57,926
£36,571
£5k
Senior
Mid-level
£10k £15k £20k £25k £30k £35k £40k £45k £50k £55k £60k £65k £70k
£39,285
£23,583
£15k
£58,234Senior
Mid-level
Junior
£20k £25k £30k £35k £40k £45k £50k £55k £60k £65k £70k £75k £80k £90k
52 Digital Salary Industry Insights
Technical
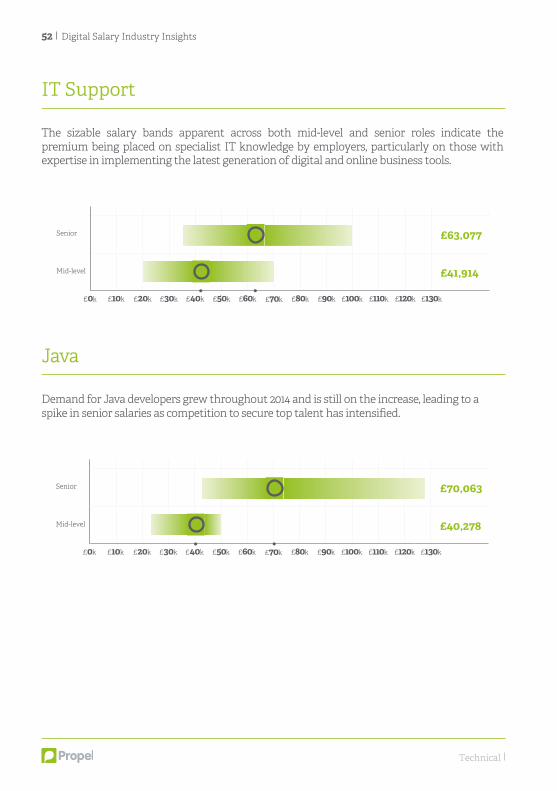
The sizable salary bands apparent across both mid-level and senior roles indicate the premium being placed on specialist IT knowledge by employers, particularly on those with expertise in implementing the latest generation of digital and online business tools.
Demand for Java developers grew throughout 2014 and is still on the increase, leading to a spike in senior salaries as competition to secure top talent has intensified.
IT Support
Java
£63,077
£41,914
£0k
Senior
Mid-level
£10k £20k £30k £40k £50k £60k £70k £80k £90k £100k £110k £120k £130k
£70,063
£40,278
£0k
Senior
Mid-level
£10k £20k £30k £40k £50k £60k £70k £80k £90k £100k £110k £120k £130k
Digital Salary Industry Insights 53
Technical
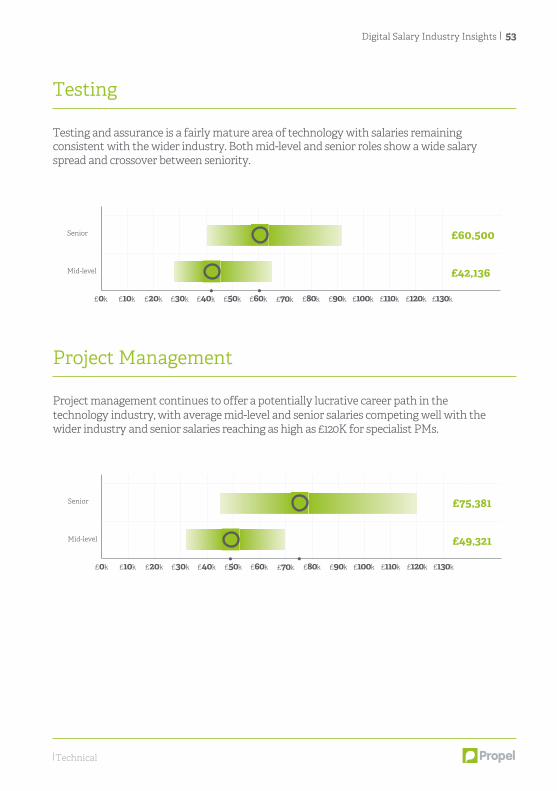
Testing and assurance is a fairly mature area of technology with salaries remaining consistent with the wider industry. Both mid-level and senior roles show a wide salary spread and crossover between seniority.
Project management continues to offer a potentially lucrative career path in the technology industry, with average mid-level and senior salaries competing well with the wider industry and senior salaries reaching as high as £120K for specialist PMs.
Testing
Project Management
£60,500
£42,136
£0k
Senior
Mid-level
£10k £20k £30k £40k £50k £60k £70k £80k £90k £100k £110k £120k £130k
£75,381
£49,321
£0k
Senior
Mid-level
£10k £20k £30k £40k £50k £60k £70k £80k £90k £100k £110k £120k £130k
54 Digital Salary Industry Insights
- Intentionally blank -
Section 5:
CreativeServices
Creative professionals are the skilled individuals that ensure marketing campaigns are truly distinctive. Whether that is through eye-catching design, concise copywriting or increasingly, a unique use of technology.
56 Digital Salary Industry Insights
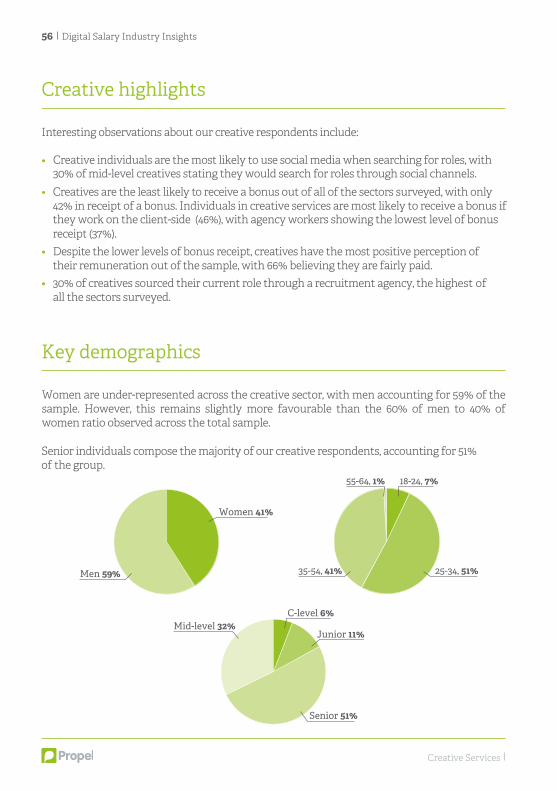
Interesting observations about our creative respondents include:
• Creative individuals are the most likely to use social media when searching for roles, with30% of mid-level creatives stating they would search for roles through social channels.
• Creatives are the least likely to receive a bonus out of all of the sectors surveyed, with only42% in receipt of a bonus. Individuals in creative services are most likely to receive a bonus if they work on the client-side (46%), with agency workers showing the lowest level of bonus receipt (37%).
• Despite the lower levels of bonus receipt, creatives have the most positive perception oftheir remuneration out of the sample, with 66% believing they are fairly paid.
• 30% of creatives sourced their current role through a recruitment agency, the highest ofall the sectors surveyed.
Women are under-represented across the creative sector, with men accounting for 59% of the sample. However, this remains slightly more favourable than the 60% of men to 40% of women ratio observed across the total sample.
Senior individuals compose the majority of our creative respondents, accounting for 51% of the group.
Creative highlights
Key demographics
Creative Services
Women 41%
Men 59%
55-64, 1% 18-24, 7%
25-34, 51%35-54, 41%
Junior 11%
C-level 6%
Senior 51%
Mid-level 32%
Digital Salary Industry Insights 57
Creative professionals match the industry average when it comes to leaving intention, with 52% of individuals seeking a new post in 2015.
Women are slightly more likely than men to be looking for a new role (56% to 50%). This is significantly different from the creative sample of 2014, in which almost 68% of men were seeking a new post.
In terms of business type, the stand out statistic is that 67% of creative staff in technology vendors intend to change roles in the coming year, compared to only 44% of creative agency staff.
Linking to our findings last year and the industry averages observed throughout the report, over 60% of staff who have been in post for either a year or more are looking to move on, across both the 1-2 year bracket and the 2-5 year brackets. This trend flattens out after 5 years, as only 45% of these longer tenure individuals are intending to move on.
Counter-intuitively, bonus does not seem to affect creative leaving intentions at all, with those receiving a bonus actually marginally more likely to be seeking a new role (53% of those receiving a bonus compared to 50% of those not receiving one).
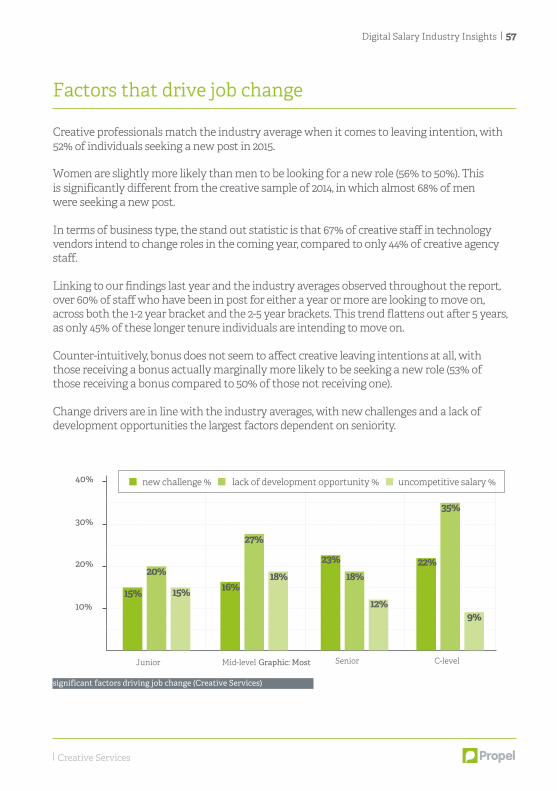
Change drivers are in line with the industry averages, with new challenges and a lack of development opportunities the largest factors dependent on seniority.
Factors that drive job change
Creative Services
Junior Mid-level Graphic: Most
significant factors driving job change (Creative Services)
Senior C-level
10%
20%
30%
40%
15%
20%
15% 16%
27%
18%23%
18%
12%
22%
35%
9%
new challenge % lack of development opportunity % uncompetitive salary %
58 Digital Salary Industry Insights
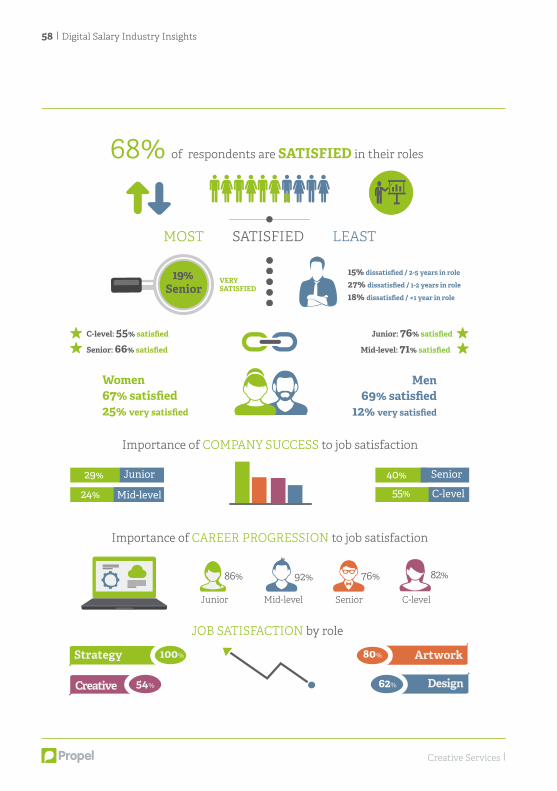
Women67% satisfied25% very satisfied
19%Senior
Men69% satisfied
12% very satisfied
Junior Mid-level Senior C-level
86% 92% 76% 82%
Junior: 76% satisfied
Mid-level: 71% satisfied
C-level: 55% satisfied
Senior: 66% satisfied
Design
ArtworkStrategy
Creative
JOB SATISFACTION by role
68% of respondents are SATISFIED in their roles
29% Junior
24% Mid-level
40% Senior
55% C-level
MOST SATISFIED LEAST
Importance of COMPANY SUCCESS to job satisfaction
15% dissatisfied / 2-5 years in role 27% dissatisfied / 1-2 years in role
18% dissatisfied / <1 year in role
Importance of CAREER PROGRESSION to job satisfaction
VERYSATISFIED
80%
62%
100%
54%
Creative Services
Digital Salary Industry Insights 59
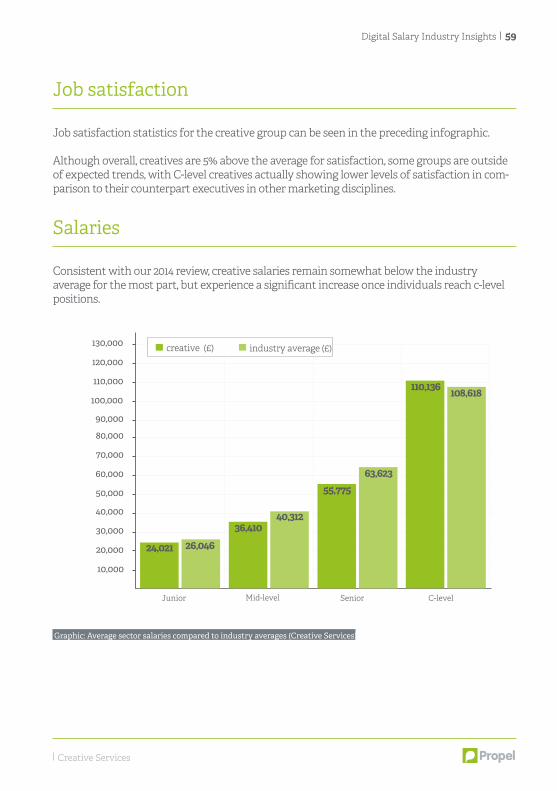
Job satisfaction statistics for the creative group can be seen in the preceding infographic.
Although overall, creatives are 5% above the average for satisfaction, some groups are outside of expected trends, with C-level creatives actually showing lower levels of satisfaction in com-parison to their counterpart executives in other marketing disciplines.
Consistent with our 2014 review, creative salaries remain somewhat below the industry average for the most part, but experience a significant increase once individuals reach c-level positions.
Job satisfaction
Salaries
Creative Services
Graphic: Average sector salaries compared to industry averages (Creative Services)
Junior Mid-level Senior C-level
20,000
10,000
40,000
30,000
60,000
50,000
80,000
70,000
90,000
100,000
110,000
120,000
130,000
24,021 26,04636,410
40,312
55,77563,623
110,136 108,618
creative (£) industry average (£)
60 Digital Salary Industry Insights
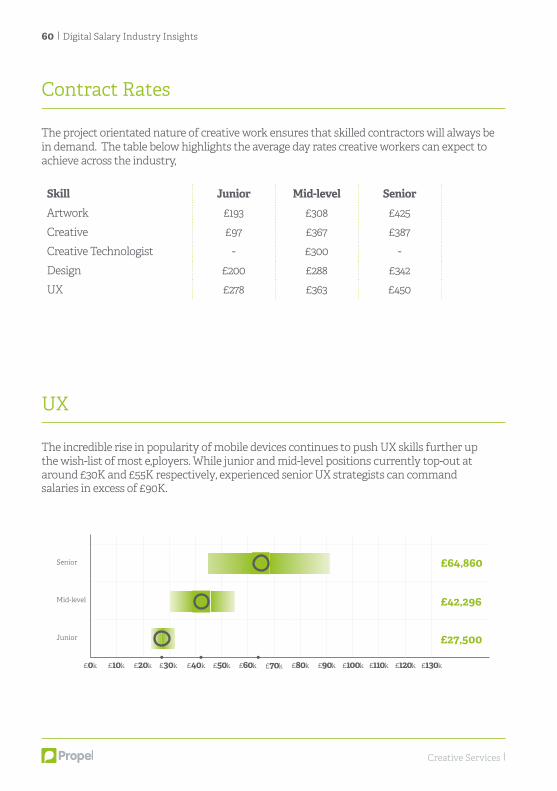
The incredible rise in popularity of mobile devices continues to push UX skills further up the wish-list of most e,ployers. While junior and mid-level positions currently top-out at around £30K and £55K respectively, experienced senior UX strategists can command salaries in excess of £90K.
UX
Creative Services
£42,296
£27,500
£0k
£64,860Senior
Mid-level
Junior
£10k £20k £30k £40k £50k £60k £70k £80k £90k £100k £110k £120k £130k
The project orientated nature of creative work ensures that skilled contractors will always be in demand. The table below highlights the average day rates creative workers can expect to achieve across the industry,
Skill Junior Mid-level SeniorArtwork £193 £308 £425
Creative £97 £367 £387
Creative Technologist - £300 -
Design £200 £288 £342
UX £278 £363 £450
Contract Rates
Digital Salary Industry Insights 61
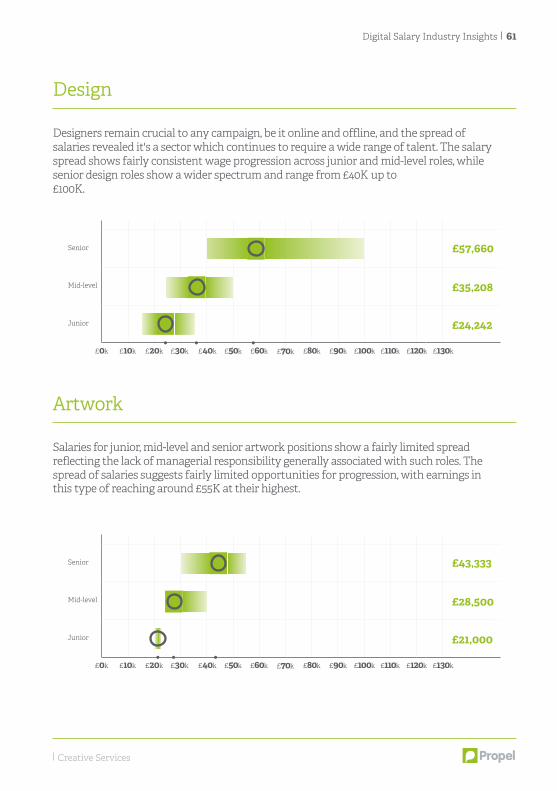
Designers remain crucial to any campaign, be it online and offline, and the spread of salaries revealed it's a sector which continues to require a wide range of talent. The salary spread shows fairly consistent wage progression across junior and mid-level roles, while senior design roles show a wider spectrum and range from £40K up to £100K.
Salaries for junior, mid-level and senior artwork positions show a fairly limited spread reflecting the lack of managerial responsibility generally associated with such roles. The spread of salaries suggests fairly limited opportunities for progression, with earnings in this type of reaching around £55K at their highest.
Design
Artwork
Creative Services
£35,208
£24,242
£0k
£57,660Senior
Mid-level
Junior
£10k £20k £30k £40k £50k £60k £70k £80k £90k £100k £110k £120k £130k
£28,500
£21,000
£0k
£43,333Senior
Mid-level
Junior
£10k £20k £30k £40k £50k £60k £70k £80k £90k £100k £110k £120k £130k
62 Digital Salary Industry Insights
Creative Services
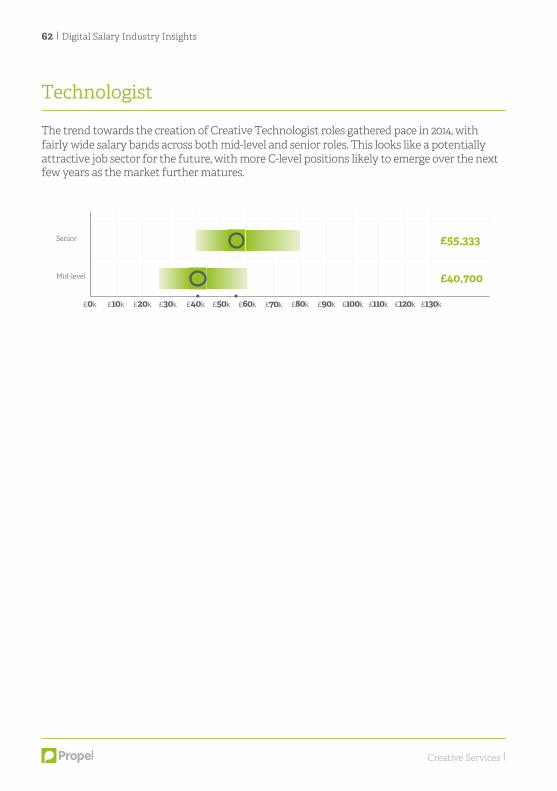
The trend towards the creation of Creative Technologist roles gathered pace in 2014, with fairly wide salary bands across both mid-level and senior roles. This looks like a potentially attractive job sector for the future, with more C-level positions likely to emerge over the next few years as the market further matures.
Technologist
£55,333
£40,700
£0k
Senior
Mid-level
£10k £20k £30k £40k £50k £60k £70k £80k £90k £100k £110k £120k £130k
Digital Salary Industry Insights 63
Thank you for taking the time to read the sixth edition of our ‘Digital Salary & IndustryInsights’ report. We hope you found it useful.
Our report is an annual undertaking produced for the digital talent industry, so we will be back in the future with our seventh edition full of more insight and information. In the meantime, you can get in touch with any questions or queries you have on 0207 432 6340, or by emailing [email protected].
Propel are the UK’s largest independent provider of permanent and contract recruitment services to the global digital economy, specialising in commercial, marketing, technical and creative talent.
Our client base ranges from large global corporates and venture backed start-ups to international businesses expanding in Europe.
Until next time...
Propel: Recruiters for the global digital economy

propelllondon.com0207 432 [email protected]@propellondon.com