dimboola flood study - wimmera...
TRANSCRIPT

Dimboola Flood Study
Report No. J035/R2 Final A
February 2003
AAM LICS
Neil M Craigie S Brizga & Associates
WATER TECHNOLOGY PTY LTD Specialist Water and Coastal Engineering Consultants

Dimboola Flood Study
Report No. J035/R2 Final A
February 2003
WATER TECHNOLOGY PTY LTD
Unit 19 Business Park Drive Notting Hill VIC 3168
Telephone (03) 9558 9366 Facsimile (03) 9558 9365
ACN No. 093 377 283 ABN No. 60 093 377 283

Dimboola Flood Study WATER TECHNOLOGY AAM, LICS, Neil M Craigie, S Brizga & Assoc.
J035/R2, 7 February 2003, Final, Ver. A Page i
Executive Summary Background Following a flood level investigation conducted the Rural Water Commission in 1987, a series of 1% flood levels were declared along the Wimmera River at Dimboola in 1988. These flood levels were based primarily on anecdotal evidence of the 1909 flood height. Development on the floodplain at Dimboola is expanding beyond the extent of the previous study. The limited information on flood risk in the areas of new and future development has been of great concern to the Wimmera Catchment Management Authority and Hindmarsh Shire Council. This “Dimboola Flood Study” details the results of an investigation into the existing flooding risks to the Dimboola township. Review of Previous Investigations There has been a significant amount of work documenting the impacts of flooding on the Wimmera River, although relatively little undertaken specifically for Dimboola. Much of this work is summarised in the FDT Project (SKM, 2000). This current investigation has augmented the observed flood level information through additional flood levels sourced from Wimmera CMA records, and observed flood levels that have been surveyed directly. As incorporated into the FDT Project, to the study team’s knowledge, the Dimboola Flood Level Investigation (RWC, 1987) is the most complete compilation of historic flood data. This study adopted the 1909 event as being indicative of the 100 year ARI event. On the basis of this information, flood level lines were drawn at 0.1m intervals and formed the basis of the designated flood levels. Community Consultation Information has been distributed to the community in two distinct phases. Firstly the study inception was publicly announced, along with a call for information relating to flooding. A series of public presences were held where interested parties could meet with the study team. Secondly, a series of public information sessions (preceded by a media briefing and radio and paper advertising) were conducted to provide feedback to the community about the study outcomes. In general, the most common comments received were:
1. As with the initial consultation, many residents were concerned about the “choking” of the river by vegetation.
2. Concerns were expressed by a number of residents regarding the impact of stormwater flooding (as distinct from river flooding).

Dimboola Flood Study WATER TECHNOLOGY AAM, LICS, Neil M Craigie, S Brizga & Assoc.
J035/R2, 7 February 2003, Final, Ver. A Page ii
Data Gathering/Survey Ortho-rectified digital photogrammetry was undertaken specifically for this project. Flown on the 16 march, 2002, the vertical and horizontal accuracies (68% confidence level or 1 sigma) of the data points is 0.1m. Based on this photogrammetric survey, a Digital Terrain Model of the study area is now available. Within the study area, 63 floor levels of potentially flood affected commercial and residential buildings have been surveyed, with an additional 51 floor levels sourced from previous surveys. An additional 9 observed historic flood levels have also been gathered. These observed flood levels have been added to the Flood Data Transfer data set. Four Wimmera River cross sections were taken with the aim of quantifying the capacity of the Wimmera River channel through the Dimboola township. Hydrologic Analysis The conduct of detailed hydrologic analysis of the Wimmera River at Dimboola is restricted due to limited adjacent streamflow. The available streamflow data indicates that peak flows during observed flood are of similar magnitude at Horsham and Dimboola. For this study, the design peak flows determined for Horsham were considered representative of design peak flows at Dimboola. As detailed in the “Horsham Flood Study”, Water Technology (2003), Table 1 presents the adopted design discharges for the Wimmera River through Dimboola.
Table 1 Wimmera River Design Discharges at Horsham (adopted as representative for Dimboola)
Wimmera River (Horsham (Walmer) Gauge) Average
recurrence interval (years) Design peak flow
(ML/d) Design peak flow
(m3/s)
5 12,900 149
10 18,100 209
20 23,700 274
50 31,200 361
100 37,000 428
200 43,000 498

Dimboola Flood Study WATER TECHNOLOGY AAM, LICS, Neil M Craigie, S Brizga & Assoc.
J035/R2, 7 February 2003, Final, Ver. A Page iii
Hydraulic Analysis A detailed hydrodynamic model of the Wimmera River has been established. This hydraulic model is based on the MIKE 21 2D hydrodynamic modelling package. Observed flood profiles were available for the Wimmera River for the 1981 event. In addition to council staff and resident observations of flooding behaviour, these levels were used for calibration purposes. Following calibration, the full suite of design events were simulated using the model. The results of these design event simulations were then used to characterise the flood risks faced by the Dimboola community. Inundation Mapping On the basis of the hydraulic analysis, a series of detailed inundation maps have been prepared for the Dimboola township. More specifically, these maps present the predicted inundation for events ranging from 5 year ARI to 200 year ARI. These maps provide information relevant for both town planning and emergency response purposes. Risk Assessment Table 2 below summarises the hydraulic behaviour of the study area, referenced to the design event frequency.
Table 2 Floodplain behaviour for varying levels of Design Flood Events
Event (ARI) Behaviour
5 year (~’92) Minor flow through anabranches
10 year (~’96) Flow through township anabranch
20 year (’81) Flow through township anabranch
50 year Upstream breakout initiated
100 year (<’09) Town center levee overtopped
Based on discussions by the study team and the outcomes of the risk assessment workshop, this characterisation of flooding risk appeared to be generally in accordance with the communities expectations. There was general consensus at the risk assessment workshop that the existing (ad-hoc) town levee should be formalised and raised to provide protection for the ARI 100 year event.

Dimboola Flood Study WATER TECHNOLOGY AAM, LICS, Neil M Craigie, S Brizga & Assoc.
J035/R2, 7 February 2003, Final, Ver. A Page iv
Flood Warning During the course of discussions, several residents have indicated the desire for improved flood warning arrangements. Recommendations There have been a number of specific recommendations made as a result of the work undertaken as part of the Dimboola Flood Study. These are briefly summarised below: Floodplain Management and Flood Response Plan for Dimboola Work items include:
• Undertake public consultation to both educate the community and involve the community in the decision making process,
• Consideration of the impact of stormwater flooding, • Comprehensive update of the flood damage analysis, • Consideration of appropriate planning controls over “at-risk” areas of the floodplain, • Consideration of works to address weaknesses in the current town protection scheme, • Quantification of the associated benefits and costs from economic, social and
environmental perspectives, • Identify possible funding mechanisms • Based on the results of the public consultation, prepare a Floodplain Management Plan, • Review existing flood warning arrangements and recommend potential improvements, • Prepare a flood response plan.
Dimboola Flood Study WATER TECHNOLOGY AAM, LICS, Neil M Craigie, S Brizga & Assoc.
J035/R2, 7 February 2003, Final, Ver. A Page v
Acknowledgements Numerous organisations and individuals have contributed both time and valuable information to the Dimboola Flood Study. The study team acknowledges the contributions made by these groups and individuals, in particular:
• The Technical Steering Committee for the study, consisting of:
Elyse Riethmuller (Wimmera CMA & Project Manager) Jo Bourke (Wimmera CMA) John Young (Wimmera CMA) Gil Hopkins (Wimmera CMA) David Eltringham (Horsham Rural City Council) Robyn Neilson (Horsham Rural City Council) John Kemfert (Hindmarsh Shire) John Partington (Hindmarsh Shire) Allan Kingston (community representative)
• The staff of Wimmera Mallee Water, in particular John Martin,
• The staff of Grampians Rural Water Authority, in particular Ray Chiaramonte,
• The staff of Thiess Hydrographic Services, in particular Gavin Ryan.
The study team also wishes to thank all those stakeholders and members of the public that attended the information sessions, contributed flooding information, returned questionnaires and discussed their experiences with the study team.

Dimboola Flood Study WATER TECHNOLOGY AAM, LICS, Neil M Craigie, S Brizga & Assoc.
J035/R2, 7 February 2003, Final, Ver. A Page vi
Table of Contents 1 Introduction ...................................................................................................................... 1
2 Study Context ................................................................................................................... 2 2.1 Background .................................................................................................................... 2
2.2 Terms of Reference ........................................................................................................ 3
3 Previous Investigations .................................................................................................... 4 3.1 Wimmera Floodplain Management Strategy ................................................................. 4
3.2 Horsham Flood Study..................................................................................................... 4
3.3 River Basin Report – Wimmera River, Lower SubCatchment - Flood Data Transfer Project............................................................................................................................. 5
3.4 Economic Evaluation of Flood Damages for the Wimmera CMA ................................ 8
3.5 Dimboola Flood Level Investigation.............................................................................. 9
3.6 Study of Flood Events within the Wyperfield National Park......................................... 9
3.7 Horsham Floodplain Management Study..................................................................... 10
3.8 Derivation of Wimmera and Glenelg Daily Flows – Summary Report ....................... 12
3.9 Stressed Rivers Project – Environmental Flows Study – Wimmera River System ..... 13
3.10 Draft Wimmera Waterway Management Strategy....................................................... 14
3.11 Draft Regional Waterway Management Strategy ........................................................ 14
3.12 Wimmera River Geomorphic Investigation, Sediment Sources, Transport and Fate .. 16
3.13 Summary of Previous Investigations............................................................................ 18
4 Consultation & Data Gathering.................................................................................... 20 4.1 Public Consultation ...................................................................................................... 20
4.2 Authority Consultation................................................................................................. 21
4.3 Risk Assessment Workshop ......................................................................................... 22
5 Survey and Digital Terrain Model Development ........................................................ 23 5.1 General ......................................................................................................................... 23
5.2 Flood Level Survey and General Flood Information ................................................... 23
5.3 Floor Level Survey....................................................................................................... 23
5.4 Topographic Survey Information ................................................................................. 23
5.4.1 Aerial Photogrammetry .................................................................................... 23
5.4.2 Current Study’s Field Survey........................................................................... 23
5.4.3 Historic Level Information............................................................................... 24

Dimboola Flood Study WATER TECHNOLOGY AAM, LICS, Neil M Craigie, S Brizga & Assoc.
J035/R2, 7 February 2003, Final, Ver. A Page vii
6 Floodplain Characteristics ............................................................................................ 25 6.1 General ......................................................................................................................... 25
6.2 Wimmera River ............................................................................................................ 26
6.3 Overbank Flooding....................................................................................................... 28
7 Hydrologic Analysis ....................................................................................................... 29 7.1 General ......................................................................................................................... 29
7.2 Flood Data Transfer Project Outcomes........................................................................ 29
7.3 Review of Horsham Floodplain Management Study SRWSC (1982) - Hydrologic Analyses ....................................................................................................................... 31
7.4 Design Peak Flow Estimates – Wimmera River .......................................................... 33
7.5 Design Events............................................................................................................... 36
8 Hydraulic Analysis ......................................................................................................... 37 8.1 General ......................................................................................................................... 37
8.2 Model Establishment.................................................................................................... 37
8.3 Calibration.................................................................................................................... 39
8.4 Design Events............................................................................................................... 42
9 Design Event Mapping................................................................................................... 43
10 Discussion........................................................................................................................ 44
11 Conclusions ..................................................................................................................... 45 11.1 Previous Investigations ................................................................................................ 45
11.2 Community Consultation ............................................................................................. 45
11.3 Data Gathering/Survey................................................................................................. 45
11.4 Hydrologic Analysis..................................................................................................... 45
11.5 Hydraulic Analysis....................................................................................................... 46
11.6 Risk Assessment........................................................................................................... 46
11.7 Flood Warning.............................................................................................................. 47
12 Recommendations for future investigations ................................................................ 48 12.1 Floodplain management and flood response plans ...................................................... 48
13 References ....................................................................................................................... 50

Dimboola Flood Study WATER TECHNOLOGY AAM, LICS, Neil M Craigie, S Brizga & Assoc.
J035/R2, 7 February 2003, Final, Ver. A Page viii
Figures Figure 2.1 Study Area Drawing 500701-40 Flood Data Map, Shire of Hindmarsh (SKM, 2000) Drawing 500702-40 Flood Planning Map, Shire of Hindmarsh (SKM, 2000) Figure 5.1 Field and Aerial Photogrammetric Survey Extents Figure 6.1 Key Floodplain Features Figure 6.2 Dimboola Weir Figure 6.3 Dimboola Weir during the 1981 event (1) Figure 6.4 Dimboola Weir during the 1981 event (2) Figure 6.5 Wimmera River Long Section Through Dimboola Figure 7.1 Wimmera River Stream Gauge Locations Figure 7.2 Summary of Gauge Records – 1992 Flood Event Figure 7.3 Summary of Gauge Records – 1996 Flood Event Figure 7.4 Flood Frequency Curve for the Wimmera River at Horsham Figure 8.1 Hydraulic Model Topography Figure 8.2 Hydraulic Model Roughness Map Figure 8.3 Predicted Peak Hydraulic Conditions – 1981 event with current topography Figure 8.4 Predicted Peak Hydraulic Conditions – 1909 event with current topography Figure 8.5 Wimmera River Profile through Dimboola – Historic Events Figure 8.6 Wimmera River Design Event Flood Profiles Figure 8.7 Predicted Peak Flood Inundation (Depths)
ARI 100 year event, Dimboola Township
Appendices Appendix A Summary of survey responses Appendix B Summary of Flood Survey Information Appendix C Flood Inundation Mapping Appendix D Technical Briefs for Additional Investigations

Dimboola Flood Study WATER TECHNOLOGY AAM, LICS, Neil M Craigie, S Brizga & Assoc.
J035/R2, 7 February 2003, Final, Ver. A Page ix
Document Status
Issue Revision Date Issued to Prepared by Reviewed by Approved by
Draft E 14/12/02 Wimmera CMA (.pdf) SQC AMC AMC
Final A 7/02/03 Wimmera CMA (hardcopy & .pdf) SQC AMC AMC
It is the responsibility of the reader to verify the currency of revision of this report.
Copyright
Water Technology Pty Ltd has produced this document in accordance with instructions from Wimmera CMA and Hindmarsh Shire council for their specific use only. The concepts and information contained in this document are the copyright of Wimmera CMA and Hindmarsh Shire. Use or copying of this document in whole or in part without written permission of Wimmera CMA and Hindmarsh Shire Council constitutes an infringement of copyright. The Wimmera CMA, Hindmarsh Shire Council and Water Technology Pty Ltd does not warrant this document is definitive nor free from error and does not accept liability for any loss caused or arising from reliance upon the information provided herein.

Dimboola Flood Study WATER TECHNOLOGY AAM, LICS, Neil M Craigie, S Brizga & Assoc.
J035/R2, 7 February 2003, Final, Ver. A Page 1
1 Introduction As part of the Wimmera Catchment Management Authority (CMA)’s Floodplain Management Strategy (Wimmera CMA, 2001) a flood study of the Wimmera River through Dimboola was identified as a priority study. In February 2002, a consortium lead by WaterTechnology Pty Ltd was commissioned to undertake this investigation on behalf of the Wimmera CMA. Consortium members were: Water Technology Project Management Specialist water resources engineering AAM Aerial Photogrammetry LICS Field Survey GIS and Flood mapping & research Neil M Craigie Specialist Waterway Management Sandra Brizga & Associates Geomorphology This report details the scope and findings of this investigation. This is the Final (Version A) issue of the report. Section 2 presents the background to the study and the terms of reference. There have been numerous previous investigations of relevance to this current study. An overview of these previous investigations, along with key points of relevance to the current investigation is presented in Section 3. Section 4 outlines the consultation and data gathering that was undertaken specifically as part of the current scope of work. Section 5 provides an overview of the survey that was undertaken during the course of the investigation. Section 6 provides an overview of the floodplain characteristics that give rise to flood risks in Dimboola. Sections 7 and 8 detail the hydrologic and hydraulic analyses that have been undertaken to assess or quantify these flood risks. The process whereby the results of the hydrologic and hydraulic analyses have been mapped for use as town planning and emergency response measures is described in Section 9. Section 10 provides an overview of the implications of this study for authorities and stakeholders with responsibilities and/or interests in the Dimboola Township. Conclusions of the study, and recommendations for the next stage in the risk management approach are presented in Sections 11 and 12 respectively.

Dimboola Flood Study WATER TECHNOLOGY AAM, LICS, Neil M Craigie, S Brizga & Assoc.
J035/R2, 7 February 2003, Final, Ver. A Page 2
2 Study Context 2.1 Background The study area is defined as the Dimboola Township and is indicated in Figure 2.1. A brief description of the background to the current study follows, mostly sourced from the project brief.
Figure 2.1 Study Area The nature of flooding is influenced by the geomorphology of the area. The essential feature here is the large body sand deposits which have extended from the South Australian border in a general easterly direction. The prevailing westerly winds have, over a long period, blown these sands into the course of the Wimmera River, which has resulted in a local raising of the river and flattening of its grade. Dimboola is located on the downstream side of this sand drift, with various natural anabranches and breakaways passing through the township. The Dimboola weir is located downstream of the township. In flood events, the weir increases the amount of flow diversion into the adjoining anabranches. Following a flood level investigation conducted by the Rural Water Commission (RWC, 1987), a 1% flood level was designated along the Wimmera River at Dimboola on the 27th April, 1988. Lacking adequate information for a comprehensive hydrologic and hydraulic analysis, the designated 1% flood level was set at the 1909 flood height.

Dimboola Flood Study WATER TECHNOLOGY AAM, LICS, Neil M Craigie, S Brizga & Assoc.
J035/R2, 7 February 2003, Final, Ver. A Page 3
Development on the floodplain at Dimboola is expanding beyond the areas of the previous study. The limited information on flood risk in the areas of new and future development is of great concern to the Wimmera Catchment Management Authority (the responsible authority for waterway and floodplain management) and Hindmarsh Shire Council. The aims of this current study are then to provide a more accurate definition of flood levels, extent and flood risk to facilitate more effective land use planning, emergency response practices, flood mitigation to minimise flood risk to the residents and infrastructure of Dimboola.
2.2 Terms of Reference Floodplain Management Investigations are carried out in accordance with current risk management procedures as set out in “AS/NZS 4360:1995 Risk Management”. The key steps are:
• Establish the context • Identify risks • Analyse risks • Assess and prioritise risks • Treat risks
The work items undertaken in this Flood Study aim to address the first three points of this approach, and provide enough information to enable authorities and stakeholders to undertake the fourth step, Assessing and Prioritising Risks in an informed fashion.
As per the brief, work items undertaken as part of this investigation are:
1. Identify and review all previous flood and waterway management studies and historic flood data in the area.
2. Identify the nature, cause, frequency, extent, economic damages and social and environmental impacts of a range of flood events, the flood storage capacity for the Wimmera River and floodplain and the effects of private and public works on flooding characteristics.
3. Review the adequacy of previous hydrological and hydraulic models.
4. Review the ARI of the historical floods and revise if necessary.
5. Review the designated 1% flood level and revise if necessary.
6. Review the effectiveness of existing flood mitigation works.
7. Determine the flood profiles for 20%, 5%, 2%, 1% and PMF flood event.
8. Map the floodways and areas of inundation during 20%, 5%, 2% 1% and PMF flood events.
9. Determine the effects of significant existing private and public works on flow distributions and flood profiles and identify a range of options for the management of these features.
10. Make preliminary recommendation for risk treatment options and recommend the requirements for a detailed risk treatment study (floodplain management plan).
11. Prepare the funding applications and consultancy briefs for any additional studies identified.

Dimboola Flood Study WATER TECHNOLOGY AAM, LICS, Neil M Craigie, S Brizga & Assoc.
J035/R2, 7 February 2003, Final, Ver. A Page 4
3 Previous Investigations There have been numerous investigations undertaken previously, or currently being undertaken that are of relevance to this current study. A brief discussion of the most relevant portions of these investigations follows. 3.1 Wimmera Floodplain Management Strategy
Wimmera CMA, 2001 The Wimmera Floodplain Management Strategy is the policy document that has established the framework under which this current investigation is being conducted. The introduction states:
“The Floodplain Management Strategy develops a number of programs aimed at addressing the structural and non-structural components of floodplain management in the Wimmera. A program for identifying and managing existing flood protection assets is detailed. Non-structural measures are identified to ensure that appropriate mechanisms are provided for flood plans, warning systems, flood monitoring, responsible land use planning and community eduction and awareness.”
This current investigation falls under Program 3 Flood Studies and Floodplain Management Plans as presented in the Wimmera Floodplain Management Strategy (2001). 3.2 Horsham Flood Study
Water Technology report prepared for Wimmera Catchment Management Authority, February 2003
As part of the Wimmera Catchment Management Authority (Wimmera CMA)’s Floodplain Management Strategy (Wimmera CMA, 2001), a review of flood levels and flood inundation mapping for Horsham was identified as a priority study. In February 2002, a consortium lead by Water Technology Pty Ltd was commissioned to undertake this investigation on behalf of the Wimmera CMA and Horsham Rural City Council. As part of these investigations, a comprehensive data gathering exercise was undertaken with detailed aerial photogrammetry and field survey as well as extensive public consultation. The previously adopted flood frequency analysis was comprehensively reviewed, and updated with the latest analysis techniques. A detailed two dimensional model was constructed, enabling flood mapping to be carried out for the design events derived through the course of the study. Of particular relevance to this study is the review of the hydrologic analysis and the derived design events for the Wimmera River. This will be discussed in greater detail in following sections.

Dimboola Flood Study WATER TECHNOLOGY AAM, LICS, Neil M Craigie, S Brizga & Assoc.
J035/R2, 7 February 2003, Final, Ver. A Page 5
3.3 River Basin Report – Wimmera River, Lower SubCatchment - Flood Data Transfer Project Sinclair Knight Merz, report prepared for Department of Natural Resources and Environment, June 2000
In February 1998, NRE commissioned a series of consultancies for undertaking Flood Data Transfer (FDT) to the nine CMAs. In August 1999 Sinclair Knight Merz was appointed to undertake the FDT Project for the Wimmera-Mallee Catchment in northern Victoria. This was one part of the program of floodplain management reform, aimed at providing available flood data in a convenient form to the regional CMAs and other beneficiaries. The objectives of the Flood Data Transfer (FDT) project were to:
• Produce and deliver high quality, consistent and comprehensive Geographic Information System (GIS) layer and hardcopy map products showing a range of flood data for urban and rural floodplains in Victoria;
• To deliver, in hardcopy and digital form, a series of flood information reports based on Municipal and river basin boundaries, and
• As part of the above, to reorganise the storage of existing flood and related information within the Flood Plain Management (FPM) unit of NRE.
Two forms of mapping were produced through the FDT process:
• Flood Data Maps, which incorporate relevant historical flood information captured from source maps, as well as relevant cadastre, infrastructure and hydrologic data; and
• Flood Planning Maps, which showed the analysed data incorporating 1% annual exceedance probability (AEP) flood level isolines (where possible) and floodways.
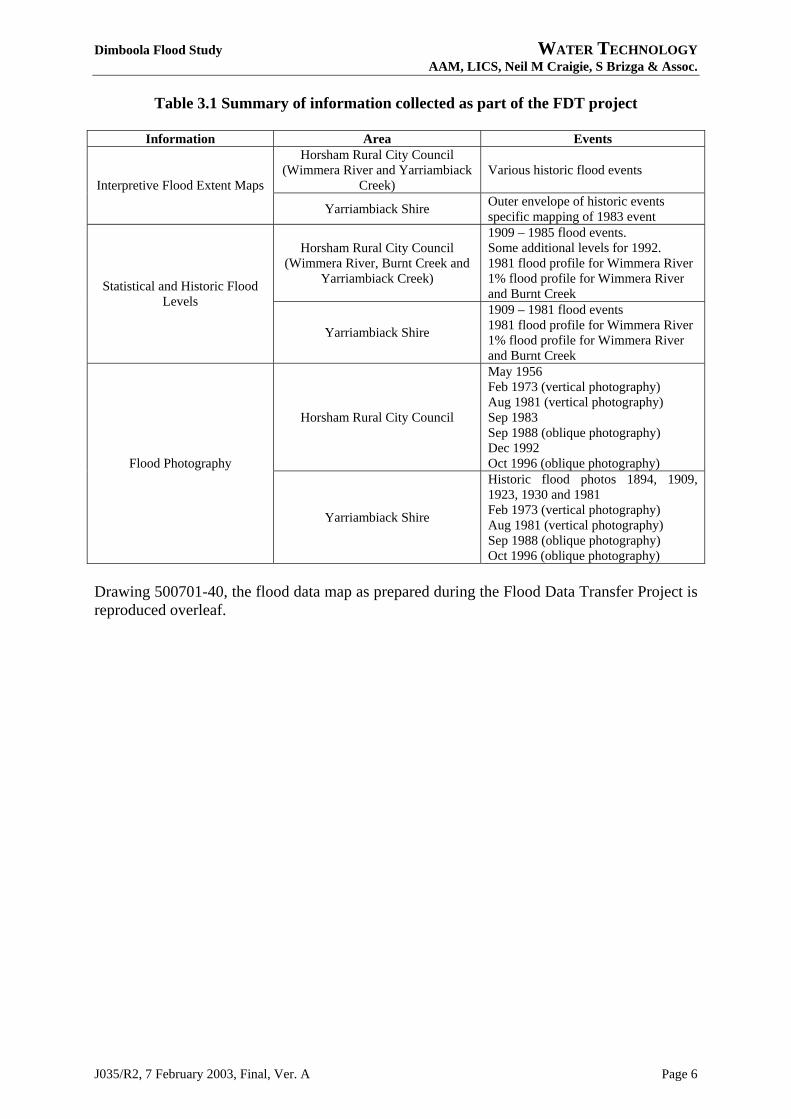
Table 3.1 presents an overview of the information collated as part of the FDT Project.
Dimboola Flood Study WATER TECHNOLOGY AAM, LICS, Neil M Craigie, S Brizga & Assoc.
J035/R2, 7 February 2003, Final, Ver. A Page 6
Table 3.1 Summary of information collected as part of the FDT project
Information Area Events Horsham Rural City Council
(Wimmera River and Yarriambiack Creek)
Various historic flood events Interpretive Flood Extent Maps
Yarriambiack Shire Outer envelope of historic events specific mapping of 1983 event
Horsham Rural City Council (Wimmera River, Burnt Creek and
Yarriambiack Creek)
1909 – 1985 flood events. Some additional levels for 1992. 1981 flood profile for Wimmera River1% flood profile for Wimmera River and Burnt Creek Statistical and Historic Flood
Levels
Yarriambiack Shire
1909 – 1981 flood events 1981 flood profile for Wimmera River1% flood profile for Wimmera River and Burnt Creek
Horsham Rural City Council
May 1956 Feb 1973 (vertical photography) Aug 1981 (vertical photography) Sep 1983 Sep 1988 (oblique photography) Dec 1992 Oct 1996 (oblique photography) Flood Photography
Yarriambiack Shire
Historic flood photos 1894, 1909, 1923, 1930 and 1981 Feb 1973 (vertical photography) Aug 1981 (vertical photography) Sep 1988 (oblique photography) Oct 1996 (oblique photography)
Drawing 500701-40, the flood data map as prepared during the Flood Data Transfer Project is reproduced overleaf.

Dimboola Flood Study WATER TECHNOLOGY AAM, LICS, Neil M Craigie, S Brizga & Assoc.
J035/R2, 7 February 2003, Final, Ver. A Page 7
Based on this historic flood information, flood planning maps were prepared. These flood planning maps showed areas delineated as either “Floodway” or “1% AEP flood extent”. 1 in 100 year ARI (1% AEP) flood extent delineation was based on the flood extent from either the 1% AEP flood, or the largest flood for which data was available. Floodways are defined as areas where significant discharge or storage of water occurs during major floods (DNRE, 1998). Six main criteria have been used for floodway designation, these being:
1. Velocity – depth criteria as per DNRE, 1998. 2. Drain and Creek corridors which are strategically important in maintaining flow paths. 3. Flood storage areas, including lakes (generally greater than 0.5m depth). 4. High hazard areas where flash flooding may occur without warning. 5. Areas which flood more frequently than 10 years on average. 6. Areas where the duration of flooding is generally greater than 7 days.
A reach by reach description of the methodology used to develop the 1% Flood Extent and Floodway maps is presented in SKM, 2000. In summary, these maps were prepared principally on the basis of aerial photography (both vertical and oblique) of historic floods. In almost all areas, little associated topographic information was available. Drawing 500702-40, the flood planning map as prepared during the Flood Data Transfer Project is reproduced overleaf.

Dimboola Flood Study WATER TECHNOLOGY AAM, LICS, Neil M Craigie, S Brizga & Assoc.
J035/R2, 7 February 2003, Final, Ver. A Page 8
3.4 Economic Evaluation of Flood Damages for the Wimmera CMA Read Sturgess & Associates, report prepared for Department of Natural Resources and Environment, September, 2001.
This study was undertaken for the Floodplain Management Unit of Victoria’s Department of Natural Resources and Environment by Read Sturgess and Associates using the Rapid Appraisal Method (RAM) for consideration of flood damages in the Wimmera CMA’s region. While necessarily a broad brush investigation, this document provides a valuable overview of the regions exposure to loss, quantified in economic terms due to flooding. In order to undertake the economic evaluation, the Wimmera CMA region was divided into 33 sub areas for specific consideration. Tables 3.2 and 3.3 below summarises the estimated damages (rounded to the neatest $1,000) associated with an ARI 100 year event for the study areas of relevance to this current investigation. These regions are illustrated in Figure 3.2.
Table 3.2 Estimates of Damage associated with the 1 in 100 year ARI
event in the study area (extracted from Read Sturgess, 2001)
Damages for the ARI 100 Year Event
Buildings $2,213,000
Roads $ 100,000
Agriculture $ 3,000
Indirect $ 695,000
Total $3,010,000
Table 3.3 Estimates of physical damages and AAD
(extracted from Read Sturgess, 2001)
Physical Damages ion LSI Event
Total Area Flooded 84 ha
No. large, non-residential buildings 6
No. urban buildings 134
No. urban properties 173
Average Annual Population Affected 14
Average Annual Damages $118,000

Dimboola Flood Study WATER TECHNOLOGY AAM, LICS, Neil M Craigie, S Brizga & Assoc.
J035/R2, 7 February 2003, Final, Ver. A Page 9
3.5 Dimboola Flood Level Investigation Rural Water Commission of Victoria, 1987.
The introduction of the Dimboola Flood Level Investigation states:
Parts of the township of Dimboola are liable to flooding form the Wimmera River. Most of the older development in the town has been on high ground. However, more recently there has been some development of the lower areas towards the river. In 1979 the Dimboola Shire Council requested the Commission to conduct a flood investigation to determine 1% probability flood levels in the township. This would enable appropriate floor levels to be set and development proposals to be assessed with due regard to the flooding risk.
Following the results of the SRWSC, 1982 investigation, it was considered reasonable for the purposes of this investigation to adopt the 1909 flood as indicative of the 1% event. The scope of this investigation was then limited to:
• Searching through historic documents for records of the 1909 flood, • Obtaining levels of the 1981 flood which, although only a moderate flood, could be
used to determine general flood profile gradients, and • Obtaining ground level information in the town so that flow patterns could be
determined. To the study teams knowledge, this compilation of flood level information is the most comprehensive available for Dimboola to date. On the basis of this information, flood level lines were drawn at 0.1m intervals for the Wimmera River flood plain through Dimboola and used as the basis for designated flood levels. These levels are illustrated in Figure 3.2 3.6 Study of Flood Events within the Wyperfield National Park
Binnie and Partners report prepared for the Department of Conservation and Environment, 1991
As stated in the introduction, the primary aims of this investigation were:
• To investigation the hydrology of the lower Wimmera River by flood frequency analysis and thereby determine the effects of River regulation and any long term climatic changes on the ability of the River to provide water to the terminal lakes system.
• To determine whether or not it would be feasible to employ and environmental allocation or any other practical means to promote flooding in the Park; and
• Identify any future studies that might be required (for example the effects of elevated River salinity levels on vegetation).
The principal hydrological finding of the study is that diversion of the flow to the Wimmera Mallee Stock and Domestic System (WMSDS) does decrease the frequency of flooding to Wyperfield and considered several options (including piping of the WMSDS for the provision of additional flows.

Dimboola Flood Study WATER TECHNOLOGY AAM, LICS, Neil M Craigie, S Brizga & Assoc.
J035/R2, 7 February 2003, Final, Ver. A Page 10
The hydrologic analysis was undertaken by considering the catchment in two parts. The upper catchment was defined as the river to the entrance to Lake Hindmarsh and was modelled using RORB. A spreadsheet model was developed for the lower catchment, enabling routing of events through Lake Hindmarsh and Albacutya downstream to the terminal lakes system. Diversions to the WMSDS were accounted for through use of the RWC headworks model of the system. The investigation details a long term yield type analysis, characterising the volumetric response of the lake systems associated with the existing situation, and a number of potential operating scenarios. As such, the data presented is of limited use for this current investigation. 3.7 Horsham Floodplain Management Study
State Rivers and Water Supply Commission, 1982.
The aim of this study was develop a comprehensive floodplain management strategy for Horsham to assist in urban planning and form a flood mitigation scheme for the (then) existing urban development on the floodplain. Components of this investigation included:
• A comprehensive frequency analysis of Wimmera River flood flows at Horsham. This frequency analysis is the basis for much subsequent work. During the course of this current study, some concerns have been expressed to the study team regarding the magnitude of the design flows that have resulted from the partial series analysis utilised.
• A comprehensive floor level and flood mark survey for the Horsham vicinity. • A comprehensive series of cross sections of the Wimmera River through Horsham. • A HEC-2 analysis of design floods for the Wimmera River and Burnt Creek. On the
basis of this analysis, 1% probability flood levels were declared. • Various non-structural and structural mitigation options were investigated. • A preferred strategy was identified. Non-structural works identified as part of this
strategy included planning controls, amendments to flood warning procedures and preservation of upstream floodplains. Structural works included levee construction and works to increase the capacity of the Wimmera River channel.
• Public information sessions. While focussing primarily on the urban area of Horsham and as such, the hydraulic analysis presented is not of specific relevance to the Glenorchy-Horsham reach. However, detailed hydrology was undertaken which is of relevance to this current investigation. Consideration was given to changing land use patterns, (natural and artificial) catchment storage, initial loss estimation, and the major distributaries. The general conclusions may be summarised as follows:
1. Land use change has had little impact on flood frequency distribution, 2. The natural storage of the floodplain has a significant impact on flood flows delivered
to Horsham. 3. The incidence of major flows at Horsham is very much dependent upon catchment
wetness.

Dimboola Flood Study WATER TECHNOLOGY AAM, LICS, Neil M Craigie, S Brizga & Assoc.
J035/R2, 7 February 2003, Final, Ver. A Page 11
4. The five off river storages of Fyans, Taylors, Pine, Green and Dock lakes have little capacity to influence flood flows at Horsham.
5. Of the two on-river storages, only Lake Lonsdale has the capacity to alter flood flows at Horsham. This impact was considered to be of the order of 1 to 2 % reduction in peak flow (at Horsham). Lake Bellfield was considered to have little impact on peak flows at Horsham.
Appendix G of the SRWSC report, “Frequency of Flood Flows at Horsham” presents the results of the flood frequency analysis performed on the Horsham gauge record. This analysis determined the design flow rates used for the subsequent Horsham hydraulic analysis. A Log-Pearson Type 3 distribution using a partial series approach as per AR&R (1977). Table 3.4 presents the results of this analysis.
Table 3.4 Results of Historic Flood Frequency Analysis (reproduced from SRWSC, 1982)
Annual Exceedence
Probability (%)
Return Period
(years)
Calculated Flow
10 10 215 m3/s (18,600 ML/day)
5 20 256 m3/s (22,100 ML/day)
2 50 318 m3/s (27,500 ML/day)
1 100 370 m3/s (32,000 ML/day)
0.5 200 429 m3/s (37,100 ML/day)
0.1 1,000 594 m3/s (51,300 ML/day)

Dimboola Flood Study WATER TECHNOLOGY AAM, LICS, Neil M Craigie, S Brizga & Assoc.
J035/R2, 7 February 2003, Final, Ver. A Page 12
3.8 Derivation of Wimmera and Glenelg Daily Flows – Summary Report Sinclair Knight Merz, draft report prepared for Department of Natural Resources and Environment, March, 2002.
The purpose of the Bulk Water Entitlements Project is to develop clearly specified water entitlements for the water authorities that take their water from the Wimmera-Mallee water supply system (Wimmera Mallee Water, Grampians Water, Coliban Water and Glenelg Water), as well as for the affected riverine environments (the Glenelg, Wimmera, Avoca and Avon/Richardson rivers). The project is part of a statewide program to improve the way that water entitlements are defined and managed. To date, about 75% of Victoria’s water resources have been converted into the new bulk entitlements. The project will develop new entitlements that provide:
• water authorities with more certainty about their rights to harvest and use water, • greater flexibility for re-allocation of water • a basis for protecting the environmental values of streams
Sinclair Knight Merz are undertaking aspects of the project on behalf of the Department of Natural Resources and Environment. To complete the Bulk Entitlements Project additional flow data was required. This report presents the methodology and results of the derivation of daily flows at several locations in the Wimmera and Glenelg catchments for the period January 1990 to December 2000. Flows corresponding to both the existing level of development and daily natural flows were derived. As for the previous investigation, significant detail is presented for the low to moderate flow regimes with little consideration of extreme events.

Dimboola Flood Study WATER TECHNOLOGY AAM, LICS, Neil M Craigie, S Brizga & Assoc.
J035/R2, 7 February 2003, Final, Ver. A Page 13
3.9 Stressed Rivers Project – Environmental Flows Study – Wimmera River System Sinclair Knight Merz, report prepared for Wimmera CMA, January, 2002.
The aim of this project was to:
… provide a scientific basis for the implementation of the provisions for water dependant ecosystems, and in doing so, meet the objective of the State’s Water for the Environment Program and objectives of the Wimmera Catchment Management Authority.
… Part A includes a catchment description, a synopsis of the key issues in the Wimmera River system, methods, environmental flow objectives, detailed environmental flow recommendations and key supporting recommendations. Part B consists of the Issues Paper completed during Stage 1 of the project. This contains a more detailed discussion of the environmental status of the catchment according to discipline categories of ecology, hydrology, geomorphology and water quality. The Appendices to Part B provide the detailed assessment of flow related issues for the system.
The key issues associated with the determination of environmental flows considered in the investigation were:
• Modification to the natural flow regime, • Deterioration of water quality, and • Bed and bank instability.
The study area was divided into 5 reaches, the relevant reach for the Dimboola area being Wimmera River Reach 4/5 – McKenzie River to Lake Hindmarsh. Detailed investigations into a range of hydrological, ecological and geomorphological features were undertaken at specific sites within each reach. At each site, between 6 and 9 cross sections were undertaken. To the study teams knowledge, these cross sections represent virtually the only available cross sectional information on the Wimmera River outside of the main townships. The closest site to Dimboola was Site 7 – Little Desert National Park. Alteration to the natural flow regime is assessed on a mean monthly basis.

Dimboola Flood Study WATER TECHNOLOGY AAM, LICS, Neil M Craigie, S Brizga & Assoc.
J035/R2, 7 February 2003, Final, Ver. A Page 14
3.10 Draft Wimmera Waterway Management Strategy Wimmera CMA, 2002.
As stated in the introduction:
This strategy provides a direction for waterway management within the Wimmera region. As well as providing a planning framework for the Strategy’s programs, it incorporates the vision, objectives and targets necessary for implementation. The waterway strategy incorporate strategies for floodplain, rural drainage, water quality and urban stormwater already or currently being developed. The strategy also recognises the work previously undertaken through other strategies and plans such as the Wimmera River Integrated Catchment Management Strategy (Wimmera Catchment Coordination Group, 1992), Assessment and Review of Crown Frontages (SKM 1998b) and Wimmera River and Environs Action Plan (Thompson and Hay 1997).
Within the Wimmera CMA, 11 waterway management reaches were defined by grouping areas of similar geomorphological characteristics, vegetation coverage and key infrastructure assets and controls. Dimboola is located within Water Management Unit 8, Wimmera River – O’Bree’s Crossing to Lake Albacutya. 3.11 Draft Regional Waterway Management Strategy
Sinclair Knight Merz, report prepared for Wimmera CMA, 1999 The development of the Draft Regional Waterway Management Strategy was undertaken by Sinclair Knight Merz. The draft provides the background information which was used to develop the Final Draft Wimmera Waterway Management Strategy (Wimmera CMA, 2002). This investigation proceeded by dividing the study area into 17 segments covering tributaries, distributaries, mainstreams and terminal streams. A summary of the segments of relevance to this current flood scoping study, along with the issues that were identified for each segment as presented in the Waterway Management Strategy is reproduced below. Note that the waterway management units have been referenced in accordance with the 11 current waterway management reaches, rather than the 17 reaches originally proposed.

Dimboola Flood Study WATER TECHNOLOGY AAM, LICS, Neil M Craigie, S Brizga & Assoc.
J035/R2, 7 February 2003, Final, Ver. A Page 15
Wimmera River mainstream – Lake Hindmarsh to O’Bree’s Crossing
• The river is a natural anabranching character, possibly related to its highly variable flow regime and low gradient valley slope.
• Both mainstream and anabranches are sinuous to meandering channels, subject to natural erosion processes at outer banks of bends, which are related to meander processes.
• The anabranches vary in size – Datchak Creek is a major anabranch.
• Elevated base flow (“environmental flow”) has created conditions that are favourable for rampant macrophyte growth in areas where there is shallow, low velocity flow. Other factors such as elevated nutrient levels may also be important. Also favoured is the growth of indigenous riparian vegetation near the waterline and on instream islands.
• Macrophytes and other vegetation in the channel increase hydraulic roughness, thereby trapping sediment. Continuing growth traps further sediment and leads to channel aggradation and contraction.
• Sediment availability is a control on aggradation. Aggradation is a concern in the Lochiel area due to increased frequency of overbank flooding. This may be partly due to the proximity of sediment sources in the form of unconsolidated sandy formations through which the river flows here and in the Little Desert.
• Instream vegetation growth, and islands, deflect flood flows towards outside banks on bends and this aggravates the natural erosion processes. This causes conflict with fixed assets such as roads (eg River Road).
• Island formation is a likely natural process in intermittent streams with high annual variability of flow. Regulation impacts have further increased the naturally very high annual variability of flows in the Wimmera.

Dimboola Flood Study WATER TECHNOLOGY AAM, LICS, Neil M Craigie, S Brizga & Assoc.
J035/R2, 7 February 2003, Final, Ver. A Page 16
3.12 Wimmera River Geomorphic Investigation, Sediment Sources, Transport and Fate ID&A, report prepared for Wimmera CMA, 2002.
Following the development of the Draft Waterway Management Strategy, ID&A were commissioned to review and report on the proposed waterway management field trial sites identified in the strategy. The outcome of this review was that a geomorphological investigation study of sediment sources, transport and fate would be beneficial to establish a greater understanding of stream processes to direct waterway management activities. As stated in the introduction,
Part of this investigation has analysed the changes that have occurred and are likely to occur in flooding, particularly in the middle reaches of the river. Analysis of hydrology, hydraulic and effective discharge found that the likelihood of overbank flow events is less now than what it was in the early part of last century. This result indicates that works to extract sediment, vegetation and debris from the channel to reduce a perceived increase in flooding may not be warranted. Such work may also be detrimental to stream health.
ID&A present the most current and detailed flood frequency analysis available to date. Appendix A Hydrologic Analysis presents the results of flood frequency analyses of three gauges within the Wimmera River catchment (including Glynwylln and Horsham on the Wimmera River itself) and one gauge on the Avoca for comparison purposes. This analysis for the Wimmera River at Horsham and Avoca River was undertaken for two periods in an attempt to quantify the impacts of regulation. These periods were characterised as: 1900-1930 – pre-regulation, and 1970-2000 – post regulation. Table 3.5 presents the results of this analysis.
Table 3.5 Flood Frequency Summary Wimmera River Downstream of Horsham (reproduced from ID&A, 2002)
AEP Pre-regulation discharge Post Regulation Discharge % Change
50 97m3/s (8,400 ML/day) 53m3/s (4,600 ML/day) -45
20 217m3/s (18,700 ML/day) 135m3/s (11,700 ML/day) -38
10 311m3/s (26,900 ML/day) 200m3/s (17,300 ML/day) -36
5 411m3/s (35,500 ML/day) 269m3/s (23,200 ML/day) -35
ID&A concluded that:

Dimboola Flood Study WATER TECHNOLOGY AAM, LICS, Neil M Craigie, S Brizga & Assoc.
J035/R2, 7 February 2003, Final, Ver. A Page 17
These results suggest a reduction in flood magnitude in the post regulation period when compared against the pre regulation periods. This is in contrast to the results for the Avoca River gauge. The analysis suggests that the reduction in stream flow and flood magnitude in the Wimmera River is likely to be the result of human intervention (flow regulation) alone and not associated with temporal variation in hydrology.
Based on the results of this hydrologic analysis, and limited hydraulic analysis, ID&A utilised the concept of “effective discharge” to predict the direction and magnitude of the channel response to the modified flow regime post regulation. This was undertaken using the results at the Horsham gauging station, and a river cross section downstream of Horsham (upstream of McKenzie River). In the Implications for Management section it is stated:
Based on this analysis there appears to have been a period of reduced flood frequency immediately following regulation. Because the process of channel adjustment is slow (dependent on sediment supply) and the introduction of regulation relatively rapid, there has been a period of reduced probability of overbank flooding. The bankfull flow of approximately 175m3/s has an AEP of 10% on the post regulation flood frequency curve. In essence the large channel is operating within an environment of reduced flow. Channel adjustments will occur (albeit slowly) and as a result the occurrence of overbank flooding is likely to increase. However review of the flood frequency curve for the post regulation flow regime reveals that the AEP associated with a flow of 150 m3/s, (the post regulation effective discharge) is approximately 20% (ie a 5 year ARI event). This is the same as the AEP of the pre-regulation effective discharge. In essence if the channel capacity of the Wimmera River adjusts to the new effective discharge, the occurrence of overbank flooding will not be significantly different to that which occurred prior to regulation.
Cross section comparisons were undertaken at several locations. Some new cross sections were surveyed, while historic data was sourced for other locations. In terms of the reach definition for this project, Dimboola is the delineation between reach 17 and reach 18. No cross section analysis was undertaken for either of these two reaches.

Dimboola Flood Study WATER TECHNOLOGY AAM, LICS, Neil M Craigie, S Brizga & Assoc.
J035/R2, 7 February 2003, Final, Ver. A Page 18
3.13 Summary of Previous Investigations Table 3.6 below summarises the key points arising out of the previous investigations. Table 3.6 Summary of information presented in previous investigations of relevance to
this current study
Investigation Key areas of relevance Comments
Wimmera Floodplain Management Strategy (Wimmera CMA, 2001)
Establishes framework for the current investigation.
Horsham Flood Study (Water Technology, 2002)
Investigation undertaken in conjunction with the Dimboola Study.
Detailed review of Wimmera River hydrology.
Historic event and design event flow rates defined for the Wimmera River at Horsham adopted for the Dimboola Flood Study.
Flood Data Transfer Project(SKM, 2000)
Consolidated available flood data from SRWC records.
LSI and floodway zones defined
Significant quantity of data available for flood events in the 80’s. Some information available for the 1909 event.
Due to lack of topographic data, the reliability of zones in the study area has been defined as low.
Economic Evaluation of Flood Damages (Read Sturgess, 2001)
Presentation of “broad brush” economic damage figures.
Most current and comprehensive economic data available to date.
Dimboola Flood Level Investigation (Rural Water Commission, 1987)
Source of historic flood levels. Levels available for the 1981 and 1909 events.
Study of Flood Events within the Wyperfield National Park (Binnie and Partners, 1991)
Hydrology of the Wimmera River system investigated.
Approach was primarily a long term yield type analysis. Of limited value for current investigation.
Horsham Floodplain Management Study (SRWSC, 1982)
Detailed investigation of flooding with flood mitigation options developed along with consultation and planning instruments.
Detailed consideration of catchment characteristics and flood frequency analysis of Horsham gauge leading to historically adopted design events.
Hydraulic analysis and flood mitigation proposals of limited relevance to the current (upstream) study area.
Flood frequency analysis now quite dated and concern has been expressed regarding the (seemingly high) return period, which results for the 1909 event.
Draft Waterway Management Strategy (CMA, 2002)
Establishes framework for current waterway management activities.
11 waterway management reaches defined and priorities presented.

Dimboola Flood Study WATER TECHNOLOGY AAM, LICS, Neil M Craigie, S Brizga & Assoc.
J035/R2, 7 February 2003, Final, Ver. A Page 19
Table 3.8 Summary of information presented in previous investigations of relevance to this current study (continued)
Investigation Key areas of relevance Comments
Derivation of Wimmera and Glenelg Daily Flows (SKM, 2002)
Daily flow records derived using a REALM model at several locations.
Emphasis on daily flows.
Stressed Rivers Project – Environmental Flows Study (SKM, 2002)
Investigation of long term impacts of regulation on the hydrologic regime.
Cross section survey and some hydraulic analysis undertaken.
Analysis used primarily mean monthly flows.
Cross section survey at specific sites only. Little detail of hydraulic analysis presented.
Draft Waterway Management Strategy (SKM, 1999)
Detailed discussion of the physical and biological processes occurring in the Wimmera River and tributaries on a reach by reach basis.
Detailed discussion of the processes leading to aggradation problems in the study area in general, and at key locations in particular.
The physical and biological processes described are key factors in determining flood flow distributions across the study area.
Wimmera River Geomorphic Investigation (ID&A, 2002)
Investigation of long term impacts of regulation on flooding.
Presentation of an effective discharge analysis indicating a current period of reduced (overbank) flood flows due to differing timescales of regulation and the geomorphic response.
Detailed discussion of the geomorphic processes occurring in the Wimmera River and tributaries on a reach by reach basis.
Most current hydrologic analysis of flood events, although large to extreme events not considered.
Analysis based on cross section downstream of Horsham. Additional data (specifically cross sections & flow paths) required allowing accurate assessment in the current study area.
Assessment of ongoing morphological processes. Note different reach delineation to waterway management reaches.

Dimboola Flood Study WATER TECHNOLOGY AAM, LICS, Neil M Craigie, S Brizga & Assoc.
J035/R2, 7 February 2003, Final, Ver. A Page 20
4 Consultation & Data Gathering
4.1 Public Consultation Wimmera CMA and study team personnel conducted information sessions at the Dimboola Band Hall on the 13 March 2002. Radio and newspaper advertising, and direct mail out of questionnaires preceded these information sessions. A copy of the questionnaire is included in Appendix A. There were 12 surveys completed at the Dimboola information session with an additional 2 received in the following weeks. The most common concern expressed by residents was that the river was “choked” and that “cleaning out” out the river was necessary to alleviate flooding. Other comments included:
• A number of residents expressed concern about the management of the weir in flood situations.
• Concerns were raised about the weir becoming blocked with debris.
• One comment was received expressing concern about adjoining levees.
• Access is cut to residents on the southern/downstream side of the river during flood events for longer periods than that experienced in the township.
• There was anecdotal evidence of extensive bank erosion around the golf course in the 1981 flood event.
• Some concern about the capacity of the stormwater system, as opposed to river flooding.
The main method of flood warning for residents appears to be radio and TV.

Dimboola Flood Study WATER TECHNOLOGY AAM, LICS, Neil M Craigie, S Brizga & Assoc.
J035/R2, 7 February 2003, Final, Ver. A Page 21
4.2 Authority Consultation Table 4.1 summarises comments by various authorities contacted during the course of the investigation.
Table 4.1 Summary of Authority Consultation
Authority Comments
Hindmarsh Shire
81 event was smaller, but it seemed to have a bigger impact
Following the '81 event, banks were constructed.
83 event flowed through town, but no houses were inundated
(houses were sandbagged to protect them though)
Council do not have floor level information
Council operate the weir during floods, although WM Water own it
All boards are removed when flood comes through
Possibly a significant amount of flow escapes into little desert
Has been a gauge at the bridge
Installation of flood flaps on culverts would improve situation
Could also alter (potentially raise) bank to improve flood protection for town centre
Grampians Water
Can supply sewerage authority plans for Dimboola (have some floor level information)
Are currently doing an asset inventory, which involves determination of horizontal positions to within 1m and vertical positions to within 2 to 3m.
Following completion of the technical aspects of the project, a risk assessment workshop was conducted with authority personnel (discussed in more detail in the following section). On the 3/9/02, a general briefing session was held for authority personnel providing an opportunity to discuss:
1. The floodplain management process in general,
2. Outcomes of the flood study,
3. The next stages in the development of a Floodplain Management Plan,
4. Implications for other authorities.
In attendance were staff from the following authorities:
• Wimmera Catchment Management Authority,
• Horsham Rural City Council,
• Yarriambiack Shire Council,
• Northern Grampians Shire Council,
• Wimmera Mallee Water,
• Grampians Rural Water Authority,
• Department of Natural Resources and Environment,

Dimboola Flood Study WATER TECHNOLOGY AAM, LICS, Neil M Craigie, S Brizga & Assoc.
J035/R2, 7 February 2003, Final, Ver. A Page 22
• Police,
• State Emergency Service,
• Victorian Country Fire Authority.
4.3 Risk Assessment Workshop Once preliminary technical results were available and initial flood mapping was complete, a risk assessment workshop was conducted by the study team, with key authority personnel and the steering committee members. This workshop was conducted on 14/8/02 at the study team’s offices with the aims of:
1. Providing an overview of the investigation’s progress, 2. Summarising community and authority feedback received, 3. Providing an indication of the flooding risk to Horsham as characterised by the
technical analysis to date, 4. Identifying in more detail what the likely consequences of various levels of flooding
are, and 5. Identifying issues that need to be addressed in the development of a Floodplain
Management Plan.
Key outcomes of the workshop are presented in Table 4.2 below:
Table 4.2 Summary of Risk Assessment Workshop Outcomes
Item Comments
Flood Risk
The established community appears to be generally aware of potential flooding issues in Dimboola. However, this is not necessarily the case for new arrivals to the area.
Stormwater flooding is an issue as well.
Potentially water quality issues at lower events.
Existing areas
Existing town levee should be formalised and “low points” eliminated.
Improvements to the existing flood warning arrangements need to be made.
Some concern about in stream vegetation and tree stability along banks. There are associated concerns about debris blockage and potential damage to the town weir.
Current/future development
Important that the appropriate planning controls are in place so that inappropriate development is avoided.
Dimboola Flood Study WATER TECHNOLOGY AAM, LICS, Neil M Craigie, S Brizga & Assoc.
J035/R2, 7 February 2003, Final, Ver. A Page 23
5 Survey and Digital Terrain Model Development 5.1 General There have been 3 main sources of survey information gathered during the course of this investigation, these being:
1. Observed maximum flood levels, both those recorded historically and those gathered specifically as part of this investigation,
2. Floor level survey undertaken specifically for this project.
3. Topographic survey information, both historically available, and specifically gathered for this project.
Following collection of the topographic information, a Digital Terrain Model (DTM) was developed as a basis for the subsequent hydraulic modelling. These items are discussed in more detail below.
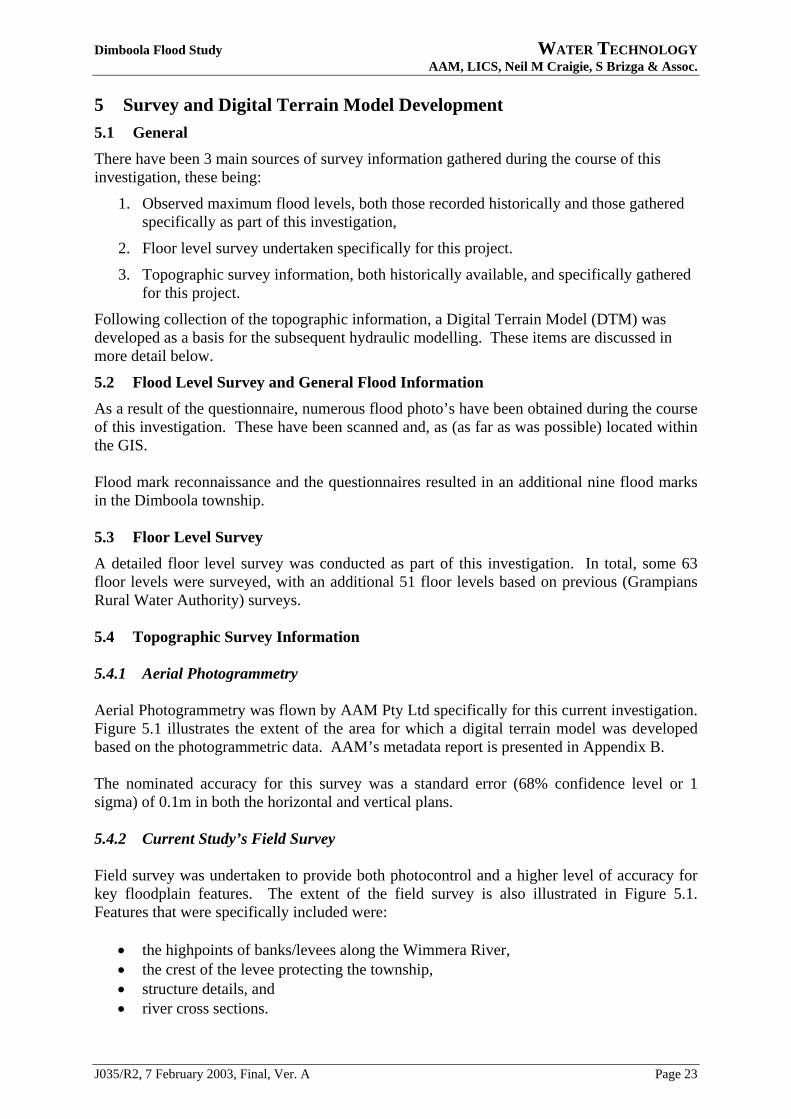
5.2 Flood Level Survey and General Flood Information As a result of the questionnaire, numerous flood photo’s have been obtained during the course of this investigation. These have been scanned and, as (as far as was possible) located within the GIS. Flood mark reconnaissance and the questionnaires resulted in an additional nine flood marks in the Dimboola township. 5.3 Floor Level Survey A detailed floor level survey was conducted as part of this investigation. In total, some 63 floor levels were surveyed, with an additional 51 floor levels based on previous (Grampians Rural Water Authority) surveys. 5.4 Topographic Survey Information 5.4.1 Aerial Photogrammetry Aerial Photogrammetry was flown by AAM Pty Ltd specifically for this current investigation. Figure 5.1 illustrates the extent of the area for which a digital terrain model was developed based on the photogrammetric data. AAM’s metadata report is presented in Appendix B. The nominated accuracy for this survey was a standard error (68% confidence level or 1 sigma) of 0.1m in both the horizontal and vertical plans. 5.4.2 Current Study’s Field Survey Field survey was undertaken to provide both photocontrol and a higher level of accuracy for key floodplain features. The extent of the field survey is also illustrated in Figure 5.1. Features that were specifically included were:
• the highpoints of banks/levees along the Wimmera River, • the crest of the levee protecting the township, • structure details, and • river cross sections.

Dimboola Flood Study WATER TECHNOLOGY AAM, LICS, Neil M Craigie, S Brizga & Assoc.
J035/R2, 7 February 2003, Final, Ver. A Page 24
5.4.3 Historic Level Information The principal source of historic level information is the Dimboola Sewerage Authority Maps, dated June 1982 as supplied by Grampians Water. These provide a good coverage of levels to Australian Height Datum (AHD) across the township area, north of the river. Some floor levels are also indicated. While these plans are some 20 years old, they are still representative of the township area.
Figure 5.1 Field and Aerial Photogrammetric Survey Extents

Dimboola Flood Study WATER TECHNOLOGY AAM, LICS, Neil M Craigie, S Brizga & Assoc.
J035/R2, 7 February 2003, Final, Ver. A Page 25
6 Floodplain Characteristics 6.1 General The Wimmera River through Dimboola is a highly altered system. Low flows through the township are controlled by the Dimboola Weir. Flood flows through the township are influenced by the combination of:
• main channel capacity upstream of the weir,
• backwater behind the weir (and the operation of the weir itself),
• the levee system protecting the township,
• flowpaths through the township.
These are illustrated in Figure 6.1 and discussed in greater detail below.
Figure 6.1 Key Floodplain Features

Dimboola Flood Study WATER TECHNOLOGY AAM, LICS, Neil M Craigie, S Brizga & Assoc.
J035/R2, 7 February 2003, Final, Ver. A Page 26
6.2 Wimmera River At low flows, the profile of the Wimmera River through Dimboola is governed by backwater from the town weir. In the late 60’s, the Rural Water Commission recommended that the then existing timber structure be replaced by a concrete structure. This reconstruction was undertaken in 1975. The weir in low flow conditions is presented in Figure 6.2.
Figure 6.2 Dimboola Weir
Construction drawings are still available for the remodelling of the weir. These are referenced to “Commission” Datum. In several places in the available files, the conversion from Commission Datum to AHD is given as:
AHD (m) = Commission Datum (ft) x 0.3048 – 0.746.
In one location, the conversion has is given as:
AHD (m) = Commission Datum (ft) x 0.3048 – 0.735.
For the purposes of this investigation, we have adopted the former (-0.746m) datum shift. This then provides the following key characteristics (as derived from RWC records) for the weir:
Standing water level (all boards in place) 333.0 ft 100.75 m AHD
Crest level (all boards removed) 325.85 ft 98.62 m AHD
Total width 108 ft 32.92 m
18 drop board bays with a clear width of 1.68m providing a clear width of 30.24m
Discussions during the course of this current investigation indicate that when flooding appears imminent, Wimmera Mallee Water advise Hindmarsh Shire personnel. Hindmarsh Shire personnel are then responsible for the removal of the weir drop boards in preparation for the passage of flood waters.
There is also anecdotal evidence to suggest that there has been significant debris loads caught on the weir structure during previous flood events. Figures 6.3 and 6.4 show the weir during the 1981 event with some debris back up.

Dimboola Flood Study WATER TECHNOLOGY AAM, LICS, Neil M Craigie, S Brizga & Assoc.
J035/R2, 7 February 2003, Final, Ver. A Page 27
Figure 6.3 Dimboola Weir during the 1981 flood event (1)
Figure 6.4 Dimboola Weir during the 1981 flood event (2)

Dimboola Flood Study WATER TECHNOLOGY AAM, LICS, Neil M Craigie, S Brizga & Assoc.
J035/R2, 7 February 2003, Final, Ver. A Page 28
6.3 Overbank Flooding In response to flooding in Dimboola, a number of measures have been undertaken over time. These include:
• Raising of banks along either side of the river,
• Modifications made to the stormwater system to prevent back flow during times of elevated Wimmera River water levels,
• Blocking off of minor flow paths exiting the river system,
• Provision of an ad-hoc levee to protect some areas of the township.
As these measures have not been undertaken in a coordinated fashion, they offer a variety of levels of protection. Many of these measures, in particular the levee protecting portions of the township are poorly constructed.
Figure 6.5 presents a long section of the Wimmera River through Dimboola, showing both the channel inverts and the high points of the adjacent banks. This long section shows:
• The left bank is generally higher than the right bank,
• There is one significant opening in the right bank, just downstream of the bridge.
92
93
94
95
96
97
98
99
100
101
102
103
104
63.0 63.2 63.4 63.6 63.8 64.0 64.2 64.4 64.6 64.8 65.0 65.2 65.4 65.6 65.8 66.0
Chainage (km)
Surfa
ce E
leva
tion
(mAH
D)
Left Bank
Right Bank
River bed
Dimboola Weir
Wimmera St Bridge Park St
Normal Standing Water Level
Lloyd St
Weir Crest Level
Figure 6.5 Wimmera River Long Section Through Dimboola
Flow Direction

Dimboola Flood Study WATER TECHNOLOGY AAM, LICS, Neil M Craigie, S Brizga & Assoc.
J035/R2, 7 February 2003, Final, Ver. A Page 29
7 Hydrologic Analysis 7.1 General There is limited streamflow gauging data available for the Wimmera River at Dimboola. As a result of this limited record, it is necessary to utilise the results of other investigations to establish design events for the Wimmera River at Dimboola.
The two investigations of specific relevance are:
• The Horsham Floodplain Management Study, SRWSC (1982), and
• The Horsham Flood Study, Water Technology (2003).
The available data, and these previous investigations are discussed in the following section.
7.2 Flood Data Transfer Project Outcomes Table 7.1 presents the availability of streamflow gauging for the Wimmera River and tributaries in the area of interest as summarised through the FDT Project (SKM, 2000).
Table 7.1 Gauging Stations (extracts of Table 3.1 SKM, 2000).
Gauge Station (No.)
River/Creek, Location Period of Observation
Gauge Station Area
(km2)
Comments
415201 Wimmera River, Glenorchy 1910 – 19181946 to date 1,953 Good for frequency analyses
415200 Wimmera River, Horsham 1881-date1 4,066 Good for frequency analyses
415251 McKenzie River, McKenzie Creek 1988-date
415256 Wimmera River, Upstream of Dimboola 1989-date
415243 Wimmera River, Dimboola Not known Some sporadic records may exist. Not located to date.
415246 Wimmera River, Lochiel Railway Bridge 1987-date
1 Discontinuous record
SKM (2000) state:
Historic floods for the Wimmera River downstream of Glenorchy are listed in Table 3.2 along with estimated annual exceedance probabilities (AEP’s) for the two main gauging stations suitable for flood frequency analyses. …
Anecdotal evidence points to the August 1909 flood as being the largest major flood for which detailed records exist. About 82mm of rain fell over the Wimmera catchment during the 19 hours ending 6 pm August 1909, causing widespread flooding (Commonwealth Bureau of Meteorology, 1909). At Elmhurst, in the upper reaches of the catchment, the flood was estimated to be at least 0.6m higher than the 1870 flood. At Glenorchy, all but 6 houses were flooded. …
Table 7.2 presents a summary of the flood data sourced for the current study area as part of the FDT project.

Dimboola Flood Study WATER TECHNOLOGY AAM, LICS, Neil M Craigie, S Brizga & Assoc.
J035/R2, 7 February 2003, Final, Ver. A Page 30
Table 7.2 Flood Data at Gauging Stations Along Wimmera River (reproduction of Table 3.2 SKM, 2000).
Gauging Station and Location Flood 415201 Glenorchy 415200 Horsham Comments
Oct. 1894 No records 3.87m gauge 44,300 ML/day 1.2%AEP
Major flood along the Wimmera River. Townships of Horsham, Glenorchy, Dimboola & Jeparit affected
Aug. 1909 No records 3.87m gauge (est) 43,900 ML/day 1.3%AEP
Widespread flooding along the Wimmera River and Dunmunkle and Yarriambiack Creeks. Townships of Horsham, Glenorchy, Warraknabeal, Dimboola, Jeparit and Rupanyup affected.
Feb 1911 No records 3.65m gauge 26,300 ML/day 8.3%AEP
Sep 1915 No records 3.84m gauge 40,900 ML/day 1.8%AEP
Major flood along Wimmera River and Yarriambiack Creek. Townships of Horsham, Glenorchy Warracknabeal, Dimboola & Jeparit affected.
Sep 1916 No records 3.73m gauge 31,700 ML/day 4.8%AEP
Major flood along Wimmera River. Townships of Horsham and Glenorchy affected.
Aug 1923 No records 3.63m gauge1 25,000 ML/day 9.2%AEP1
Oct 1973 4.97m gauge 25,200 ML/day 4.3% AEP
3.35m gauge1 14,100 ML/day 30%AEP1
Oct 1975 4.91m gauge 20,100 ML/day 9.1% AEP
3.39m gauge1 15,200 ML/day 23%AEP1
Aug 1980 4.72m gauge 13,500 ML/day 20% AEP
2.93m gauge1 7,870 ML/day 40%AEP1
Aug 1981 4.85m gauge 17,200 ML/day 12.5% AEP
3.55m gauge1 21,000 ML/day 12%AEP1
Significant flooding along Wimmera River & Yarriambiack Creek. Horsham, Warracknabeal, Dimboola & Jeparit may have been affected to some degree.
Sep 1983 4.86m gauge 17,700 ML/day 12% AEP
3.64m gauge1 25,300 ML/day 9.1%AEP1
Sep 1988 4.97m gauge 25,200 ML/day 4.2% AEP
3.50m gauge1 19,100 ML/day 16%AEP1
Oct 1996 4.77m gauge 14,500 ML/day 21% AEP
3.49m gauge1 18,500 ML/day 17%AEP1
Flood along Wimmera River. Township of Dimboola affected.
Sep 1992 4.77m gauge 14,600 ML/day 20% AEP
2.94m gauge1 7,900 ML/day 40%AEP1
Oct 1992 4.69m gauge 13,000 ML/day 25% AEP
3.30m gauge1 12,800 ML/day 27%AEP1
Source: RWC, 1987 and Thiess, 1999 and Thiess Environmental Services. Gauge heights have been adjusted in places to suite current site. 1 Gauge heights and flood frequency estimated from Thiess, 1999.

Dimboola Flood Study WATER TECHNOLOGY AAM, LICS, Neil M Craigie, S Brizga & Assoc.
J035/R2, 7 February 2003, Final, Ver. A Page 31
7.3 Review of Horsham Floodplain Management Study SRWSC (1982) - Hydrologic Analyses
A number of large floods occurred prior to 1924 including events in 1889, 1894, 1909 and 1915. This is in contrast to the subsequent period (1924 to 2001) where only a few large floods have occurred. The general community attribute the absence of large floods since 1923 to development within the catchment such as land use change and the construction of water storages.
The 1982 study undertook a comprehensive investigation into the factors influencing the nature of flooding in the Wimmera River catchment and at Horsham. Conclusions of this investigation are summarised as follows:
• The major change in land use since 1880’s has been from natural pasture to sown pasture. The absence of large floods since 1923 cannot be attributed to land use change, although total runoff (yield) from the catchment may have reduced.
• Commanding approximately 25% of the catchment, Lake Lonsdale has generally reduced large flood peak flows at Horsham by 1% to 2% since its construction in 1902. However, peak flows for moderate flood events may have been reduced by 25 %.
• Lake Bellfield commands less than 3% of the catchment area to Horsham. Given this small catchment and the modest impact of Lake Lonsdale, the impact of Bellfield on flood peak flows at Horsham was considered negligible.
• Changes to the offtake to Yarriambiack Creek have increased peak flows for large flood events at Horsham by of the order of 5% from the natural conditions. In particular the reconstruction of the Wimmera Highway crossing in 1959 has contributed to this increase.
• Large floods in Horsham are due to a rainfall scenario where intense rainfall has occurred after a prolonged period of general rainfall. The period of general rainfall “wets up” the catchment and also partially fills the natural floodplain storage. These two effects combine to increase the runoff generated during the intense rainfall event and results in a large flood at Horsham. Apart from in August 1981 and September 1983 this rainfall scenario has not occurred since the 1920’s.
• The absence of large floods since 1923 was not due to subsequent catchment development (i.e. land use change and construction of storages), but rather was due to the rainfall scenario outlined above not having occurred.
To evaluate the probability of large floods, the 1982 study undertook a frequency analysis of the re-estimated peak flows over the period 1889 to 1981 (93 years). Current practice is to use a series of annual peak flows in flood frequency analysis for determining the probability of large floods with ARIs greater than 10 years (IEAust, 1987). An annual series consists of the maximum peak flow in each calendar year. For catchments with a high variability in streamflow, like the Wimmera River, the annual series may contain peak flows which are very low and/or zero for given years. At the time of the 1982 study, then available approaches had difficulty in dealing with annual series containing very low and/or zero peak flows.

Dimboola Flood Study WATER TECHNOLOGY AAM, LICS, Neil M Craigie, S Brizga & Assoc.
J035/R2, 7 February 2003, Final, Ver. A Page 32
To overcome these difficulties the 1982 study adopted the use of partial series of peak flows in the flood frequency analysis. A partial series of peak flows consists of all independent peak flows above a given value and may contain more than one peak flow from a single calendar year. The selection of peak flows above a given value prevents the inclusion of very low and/or zero flows in the frequency analysis. A partial series of peak flow above 6,800 ML/d was complied from the revised streamflow record. The value of 6,8000 ML/d was selected as to result in the number of peak flows in the series being equal to the number of years in the streamflow record (93 years). A log Pearson 3 distribution was fitted to the partial series. Table 7.3 displays the results of the frequency analysis from the 1982 study. The 1909 flood was estimated to have an average recurrence interval of 300 years.
Table 7.3 Results of frequency analysis (partial series) for the period 1889 to 1982 (SRWSC 1982)
Average recurrence interval
(years)
Design peak flow
(ML/d)
Design peak flow
(m3/s)
10 19,100 221
20 22,800 264
50 28,300 328
100 33,000 382
200 38,300 443
The 1982 study did not consider the probable maximum flood (PMF). As discussed, the 1982 study concluded that land use change and construction of water storages has had a minimal impact on the magnitude of large floods at Horsham. These conclusions were made following a comprehensive investigation. Following a review of the 1982 study it is considered the conclusions regarding the impact of the land change use and water storages are valid. As a result, this study did not undertake any further investigation into the impacts of land use change and storage construction on large floods.

Dimboola Flood Study WATER TECHNOLOGY AAM, LICS, Neil M Craigie, S Brizga & Assoc.
J035/R2, 7 February 2003, Final, Ver. A Page 33
7.4 Design Peak Flow Estimates – Wimmera River Figure 7.1 illustrates the locations of the streamflow gauging stations on the Wimmera River of direct relevance to Dimboola.
Figure 7.1 Wimmera River Stream Gauge Locations
Downstream of Horsham, the only significant watercourse to enter the Wimmera River is the McKenzie River.
As can be seen from the Table 7.1, there are no gauges on the Wimmera River in the immediate vicinity of Dimboola with records longer than 15 years. The Horsham Gauge, however, has over 100 years of record for which flood frequency analyses have been conducted.
In the period covered by the gauging, both in the vicinity of Dimboola and at Horsham, there have been flood events in 1992 and 1996. Figures 7.2 and 7.3 present the gauge records for both these events respectively.

Dimboola Flood Study WATER TECHNOLOGY AAM, LICS, Neil M Craigie, S Brizga & Assoc.
J035/R2, 7 February 2003, Final, Ver. A Page 34
Note that for both of the events, the McKenzie River inflow is an order of magnitude smaller than the Wimmera River flow, and occurs several days earlier than the Wimmera River peak.
Note also that while the recorded flows at Horsham and the Lochiel Railway Bridge are of a similar magnitude, the flows recorded at the station “Upstream of Dimboola” are somewhat less than either the upstream or downstream gauged flows. While this hasn’t been investigated quantitatively, the study team suggests that there may be uncertainty associated with rating curve at this point, and that the gauge upstream of Dimboola may be underestimating flows.
0
25
50
75
100
125
150
175
200
225
250
08/10/92 15/10/92 22/10/92
Date
Gau
ge D
isch
arge
(m3 /s
)
Discharge - HorshamDischarge - LochielDischarge - US DimboolaDischarge - McKenzie Creek
Figure 7.2 Summary of Gauge Records – 1992 flood event.
0
50
100
150
200
250
25/09/96 02/10/96 09/10/96 16/10/96
Date
Gau
ged
Dis
char
ge (m
3 /s)
Discharge - HorshamDischarge - LochielDischarge - US DimboolaDischarge - McKenzie Creek
Figure 7.3 Summary of Gauge Records – 1996 flood event.

Dimboola Flood Study WATER TECHNOLOGY AAM, LICS, Neil M Craigie, S Brizga & Assoc.
J035/R2, 7 February 2003, Final, Ver. A Page 35
The conduct of detailed hydrologic analysis of the Wimmera River at Dimboola is restricted due to limited adjacent streamflow. The available streamflow data indicates that peak flows during observed flood are of similar magnitude at Horsham and Dimboola. For this study, the design peak flows determined for Horsham were considered representative of design peak flows at Dimboola.
This approach is viewed as conservative, as, especially for larger events, increased attenuation and possibly increased breakouts may be expected in between Horsham and Dimboola.
Flows associated with historic events for the purposes of this investigation have been based on the Horsham gauge records and are detailed in Table 7.4. Where available, the corresponding peak flow as recorded at the downstream gauges is presented as well.
Table 7.4 Peak Flows for Historic Events
Event Horsham Gauge Flow (m3/s)
US Dimboola Gauge Flow(m3/s)
Lochiel Gauge Flow (m3/s)
1909 500
1983 293
1981 275
1988 242 198
1996 222 171 204
1992 156 139 152

Dimboola Flood Study WATER TECHNOLOGY AAM, LICS, Neil M Craigie, S Brizga & Assoc.
J035/R2, 7 February 2003, Final, Ver. A Page 36
7.5 Design Events A comprehensive investigation into the factors influencing the nature of flooding in the Wimmera River catchment detailed analysis of the Horsham gauge record was undertaken in 1982 as part of the Horsham Floodplain Management Study (SRWSC, 1982). As part of this investigation, a frequency analysis of the gauged flows at Horsham was undertaken for the period 1889 to 1981 (93 years) using a partial series approach.
This frequency analysis was updated as part of the Horsham Flood Study (WaterTechnology, 2002). Using both the additional 20 years of records available, and an annual series approach, a revised set of design return periods was derived. These are summarised in Table 7.5 and the corresponding flood frequency curve illustrated graphically in Figure 7.4.
Table 7.5 Results of frequency analysis for the Horsham Gauge (WaterTechnology, 2002)
Average recurrence interval (years)
Design peak flow (ML/d)
Design peak flow (m3/s)
5 12,900 149
10 18,100 209
20 23,700 274
50 31,200 361
100 37,000 428
200 43,000 498
Wimmera River at Horsham (415200) SRWSC (1982) (1889-1981) + Theiss Peak Inst (1982-2001)
100
1000
10000
100000
AEP (1 in Y)
Peak
Flo
w M
L/d
Flood Series
Upper C.L.
LP3DistributionLower C.L.
AEP0.9 0.50.70.8 0.10.2 0.010.020.05
100501.111
27 low flows omitted
20102 5
0.005
200
Figure 7.4 Flood Frequency Curve for the Wimmera River at Horsham
(WaterTechnology, 2002)

Dimboola Flood Study WATER TECHNOLOGY AAM, LICS, Neil M Craigie, S Brizga & Assoc.
J035/R2, 7 February 2003, Final, Ver. A Page 37
8 Hydraulic Analysis 8.1 General
The construction of a hydraulic model enables the simulation of Wimmera River flow through the vicinity of Dimboola to be simulated in great detail. Varying flow conditions ranging from the reproduction of historical events, to the simulation of hypothetical “design” events can be modelled. These flow conditions can be applied to both the existing topography, and also to topographies that have been altered to represent changes eg flood mitigation measures or catastrophic failures. Hydraulic modelling of the study area has been undertaken utilising the Mike 21 modelling system. MIKE 21 solves the full non-linear equations describing conservation of mass and momentum in two horizontal dimensions. It is commonly referred to as a full two dimensional or 2D hydraulic model. MIKE 21 has been developed by the Danish Hydraulic Institute for modelling two-dimensional flows in estuaries, bays and coastal seas. Recent developments have broadened its application to complex two-dimensional flows in river and floodplain systems. For the study area the use of a fully two-dimensional model enables the following: • The 2-D model computes water levels and velocities at each grid point as a function of
the local ground level, bed resistance, hydraulic grade and any shear stresses from flow in adjacent grid points. As such, the model can readily describe major and minor flow paths down to the same scale as the model grid. No prior assumptions need be made as to the path the flow will take or its direction.
• The 2-D model can accurately represent flow around individual structures (such as buildings, bridges, etc.) and the formation of any eddies or flow separation zones along with their associated head losses. These are included explicitly in the model formulation, and do not need to be incorporated in the bed-friction term.
The 2-D model can provide details of water levels and velocities throughout the model domain. This detailed information can be provided on the same scale as the model grid.
8.2 Model Establishment The basis of the two dimensional model is the topographic grid. This is illustrated in Figure 8.1 and is based on the photogrammetry as supplied by AAM. A 10m grid has been for the purposes of the Dimboola Investigation. As discussed in section 4, field survey of key features (eg levees and river cross sections) was also conducted. These features have been specifically incorporated into the model grid to ensure accurate representation.
The other essential input to the hydraulic model directly related to the topography is the hydraulic roughness. This was based principally on the aerial photograph (AAM, 2002) and is illustrated in Figure 8.2.
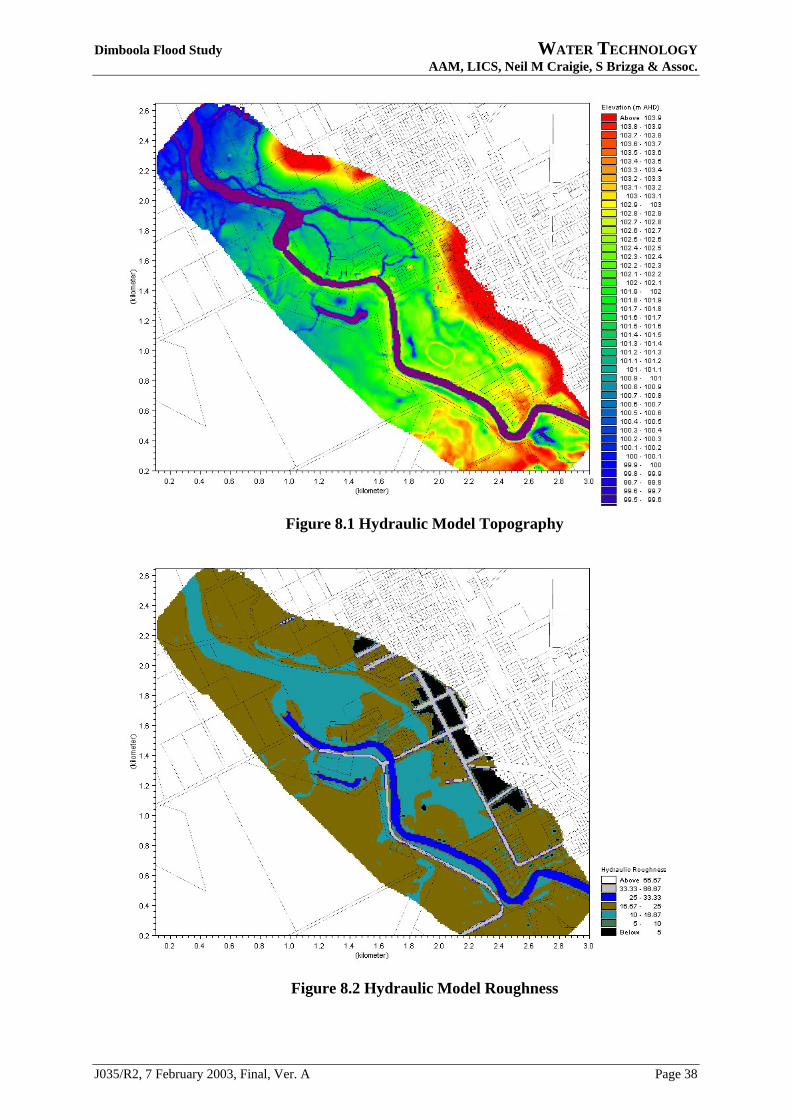
Dimboola Flood Study WATER TECHNOLOGY AAM, LICS, Neil M Craigie, S Brizga & Assoc.
J035/R2, 7 February 2003, Final, Ver. A Page 38
Figure 8.1 Hydraulic Model Topography
Figure 8.2 Hydraulic Model Roughness

Dimboola Flood Study WATER TECHNOLOGY AAM, LICS, Neil M Craigie, S Brizga & Assoc.
J035/R2, 7 February 2003, Final, Ver. A Page 39
Table 8.1 summarises the hydraulic roughness elements as schematised in the hydraulic roughness map.
Table 8.1 Adopted Hydraulic Roughness Parameters
Floodplain Element Manning’s M Manning’s n (n = 1/M)
General floodplain roughness (open space, lightly vegetated)
25
0.04
Main channel roughness 33 0.03
Open vegetated areas 16.7 0.06
Thickly vegetated areas 10 0.10
Urban Area (houses, back yards etc) 5 0.20
Clear, paved areas (streets) 66.7 0.015 Note the roughness adopted for urban areas and streets. Through previous experience, it has been found that the most appropriate way to model the significantly reduced flow capacity of residential areas (houses, fences etc), while accurately accounting for the floodplain storage in these areas, is to adopt an extremely high hydraulic roughness for these areas. The hydraulic model exhibits inundation in these urban areas but with higher velocities (due to the higher conveyance) in the adjacent streets. Values adopted through previous projects were utilised for this investigation and are considered a realistic representation of the complex process.
8.3 Calibration “Calibration” refers to the process whereby the hydraulic models’ representation of flooding through the study area is systematically compared to observed flooding behaviour. This process may incorporate gauged stream flows, observed maximum flood levels, areas of inundation as shown in aerial photographs and residents or observers’ recollections of flooding patterns. Where the model does not adequately represent what was observed, the reason for the discrepancy is identified, the model adjusted and the additional simulations undertaken until adequate representation of the historical event is reached.
In Dimboola, while there are many flood qualitative observations of flooding available, there are relatively few quantitative observations. The previous flood investigation (SRWSC, 1989) provided a summary of the available flood marks. This information is still the most comprehensive available, with the best data set available for the 1981 flood event.
Unfortunately, neither of the streamflow gauges in the immediate vicinity of Dimboola were operational in 1981. For the purposes of this investigation, the study team has adopted (as previously discussed) the flows as derived for the Horsham town gauge.
Through discussions with residents and Shire personnel, the study team understands that the main source of flooding in the township during the 1981 flood was back up through the stormwater system. In most locations, the high banks adjacent to the Wimmera River were not overtopped (although there may have been sandbagging in key locations). Following this event, the low points along the banks of the river were raised, and surcharge of the stormwater system has been effectively eliminated in the locations previously affected.
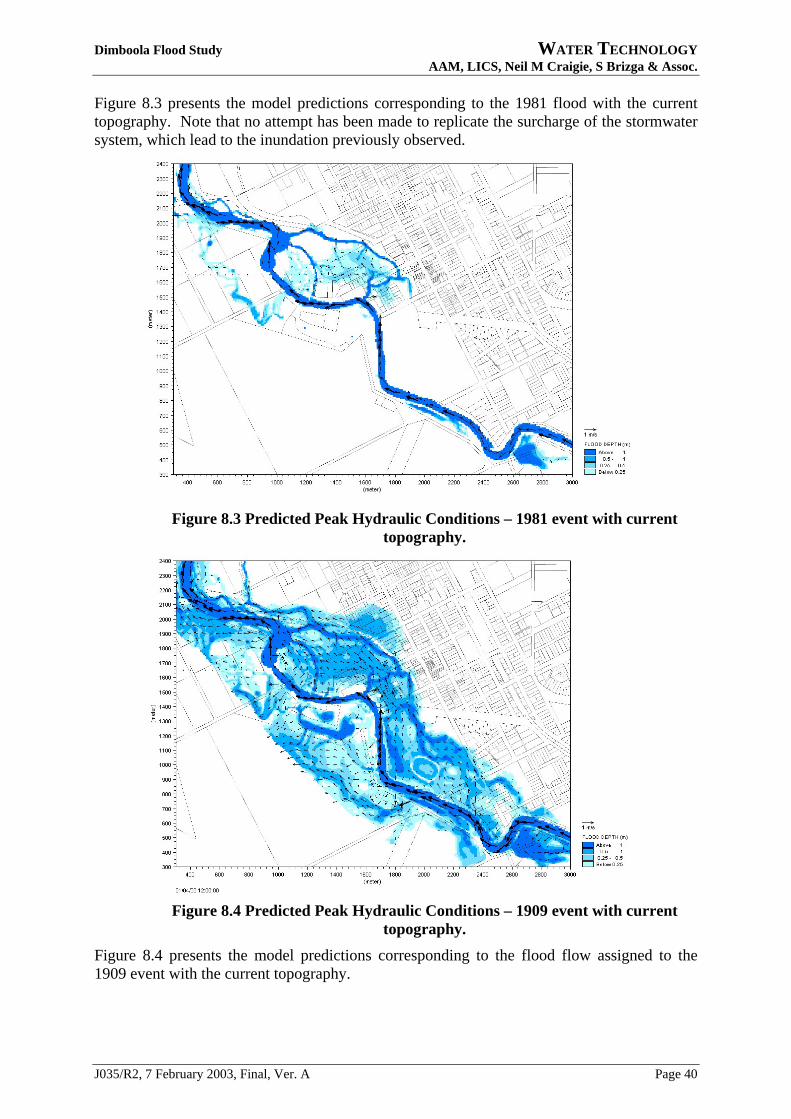
Dimboola Flood Study WATER TECHNOLOGY AAM, LICS, Neil M Craigie, S Brizga & Assoc.
J035/R2, 7 February 2003, Final, Ver. A Page 40
Figure 8.3 presents the model predictions corresponding to the 1981 flood with the current topography. Note that no attempt has been made to replicate the surcharge of the stormwater system, which lead to the inundation previously observed.
Figure 8.3 Predicted Peak Hydraulic Conditions – 1981 event with current
topography.
Figure 8.4 Predicted Peak Hydraulic Conditions – 1909 event with current
topography. Figure 8.4 presents the model predictions corresponding to the flood flow assigned to the 1909 event with the current topography.
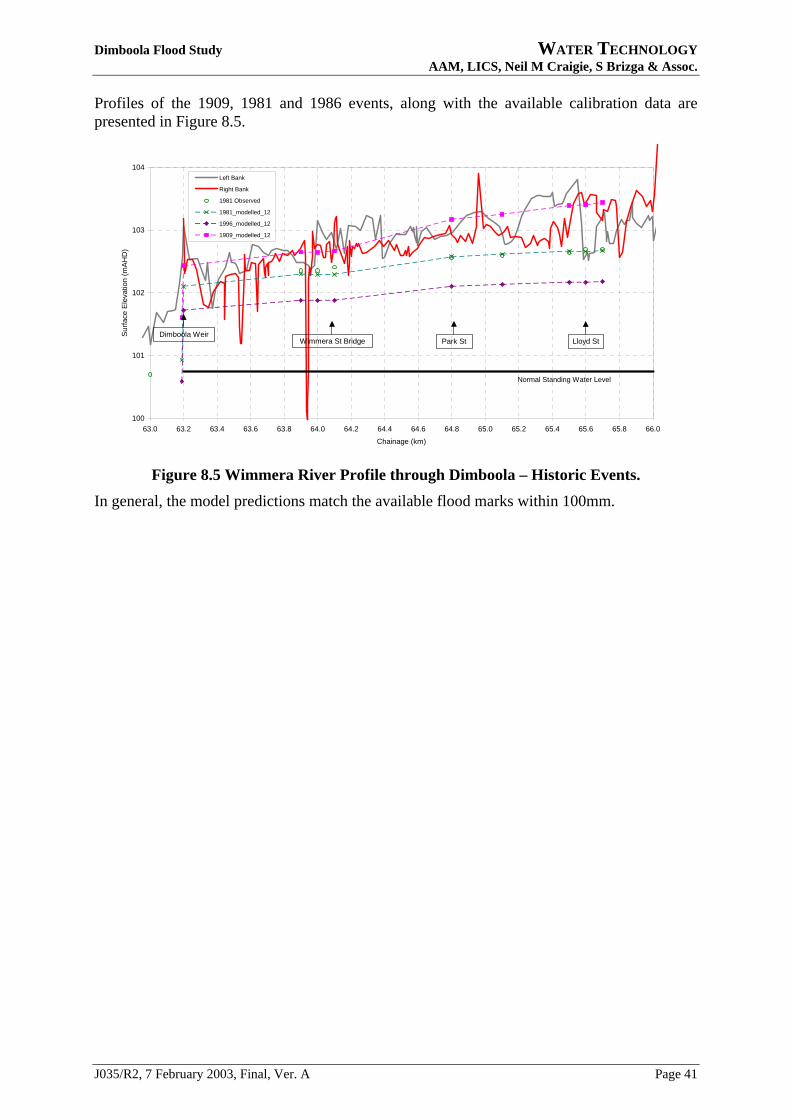
Dimboola Flood Study WATER TECHNOLOGY AAM, LICS, Neil M Craigie, S Brizga & Assoc.
J035/R2, 7 February 2003, Final, Ver. A Page 41
Profiles of the 1909, 1981 and 1986 events, along with the available calibration data are presented in Figure 8.5.
100
101
102
103
104
63.0 63.2 63.4 63.6 63.8 64.0 64.2 64.4 64.6 64.8 65.0 65.2 65.4 65.6 65.8 66.0
Chainage (km)
Sur
face
Ele
vatio
n (m
AH
D)
Left Bank
Right Bank
1981 Observed
1981_modelled_12
1996_modelled_12
1909_modelled_12
Dimboola WeirWimmera St Bridge Park St
Normal Standing Water Level
Lloyd St
Figure 8.5 Wimmera River Profile through Dimboola – Historic Events.
In general, the model predictions match the available flood marks within 100mm.
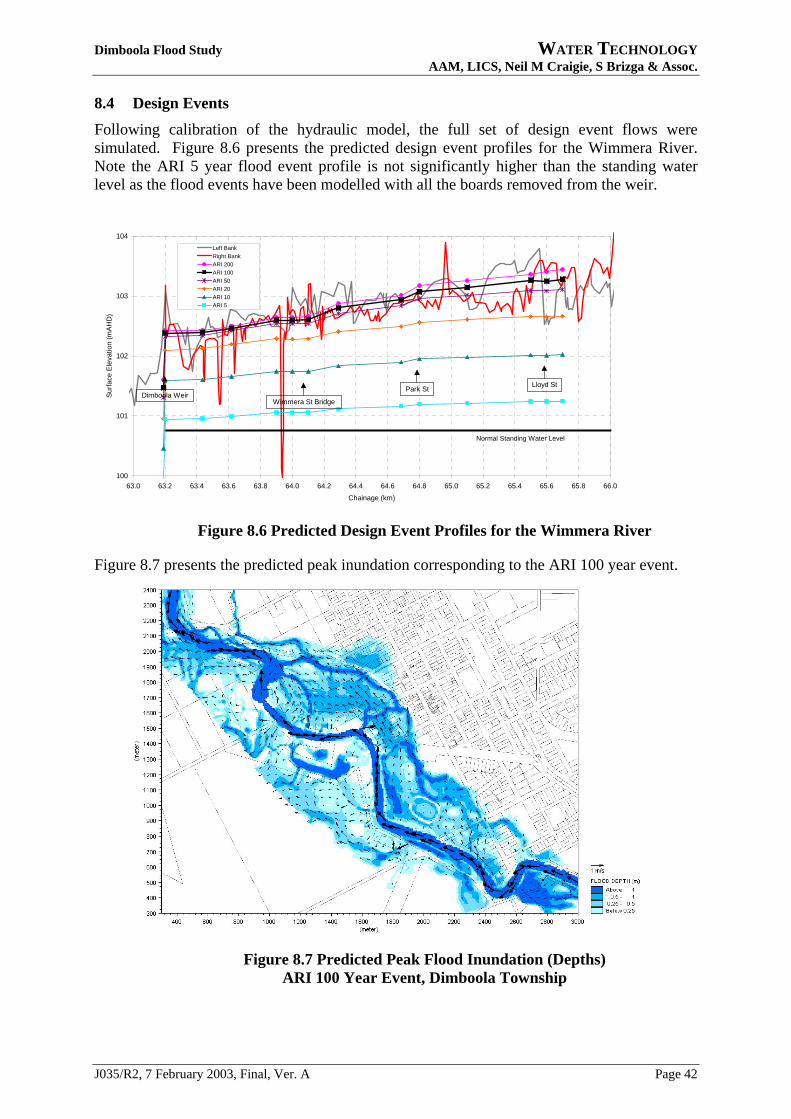
Dimboola Flood Study WATER TECHNOLOGY AAM, LICS, Neil M Craigie, S Brizga & Assoc.
J035/R2, 7 February 2003, Final, Ver. A Page 42
8.4 Design Events Following calibration of the hydraulic model, the full set of design event flows were simulated. Figure 8.6 presents the predicted design event profiles for the Wimmera River. Note the ARI 5 year flood event profile is not significantly higher than the standing water level as the flood events have been modelled with all the boards removed from the weir.
100
101
102
103
104
63.0 63.2 63.4 63.6 63.8 64.0 64.2 64.4 64.6 64.8 65.0 65.2 65.4 65.6 65.8 66.0
Chainage (km)
Surfa
ce E
leva
tion
(mAH
D)
Left BankRight BankARI 200ARI 100ARI 50ARI 20ARI 10ARI 5
Dimboola WeirWimmera St Bridge
Park St
Normal Standing Water Level
Lloyd St
Figure 8.6 Predicted Design Event Profiles for the Wimmera River
Figure 8.7 presents the predicted peak inundation corresponding to the ARI 100 year event.
Figure 8.7 Predicted Peak Flood Inundation (Depths)
ARI 100 Year Event, Dimboola Township

Dimboola Flood Study WATER TECHNOLOGY AAM, LICS, Neil M Craigie, S Brizga & Assoc.
J035/R2, 7 February 2003, Final, Ver. A Page 43
9 Design Event Mapping The flood inundation maps prepared as a result of this investigation are presented in Appendix C (A3 size). These are outlined in Table 9.1 below.
Table 9.1 Wimmera River Flooding Inundation Maps for Dimboola
No. Drawing
590,011 5 year Average Recurrence Interval Flood Event - Flood Depths and Flood Contours
590,012 20 year Average Recurrence Interval Flood Event - Flood Depths and Flood Contours
590,013 50 year Average Recurrence Interval Flood Event - Flood Depths and Flood Contours
590,014 100 year Average Recurrence Interval Flood Event - Flood Depths and Flood Contours
590,015 200 year Average Recurrence Interval Flood Event - Flood Depths and Flood Contours
590,016 5 year Average Recurrence Interval Flood Event - Flood Depths
590,017 20 year Average Recurrence Interval Flood Event - Flood Depths
590,018 50 year Average Recurrence Interval Flood Event - Flood Depths
590,019 100 year Average Recurrence Interval Flood Event - Flood Depths
590,020 200 year Average Recurrence Interval Flood Event - Flood Depths
On each map, the surveyed floor levels have been compared to the predicted flood height. If floor levels are predicted to be inundated, a visual indication (a red dot) is provided.
Also note that each map has been “tied in” to the Horsham (Walmer) gauge. An indication of the predicted maximum gauge height for each design event is provided, along with a comparison of historic events. This has been provided with a view to the potential use of these maps for flood warning purposes.
At the time of writing of this report the Bureau of Meteorology (BOM) provides flood predictions for the Glenorchy and Quantong Gauging stations. BOM do not provide flood predictions for the Horsham gauge. However, it is envisaged that at some stage in the future, predictions may be made for the Horsham gauge, or correlations between the Horsham gauge and other gauging stations may be developed.

Dimboola Flood Study WATER TECHNOLOGY AAM, LICS, Neil M Craigie, S Brizga & Assoc.
J035/R2, 7 February 2003, Final, Ver. A Page 44
10 Discussion Considering the currently declared flood levels for Dimboola (as detailed in RWC, 1987), the results of this study are not significantly different when considering the results for the revised ARI 100 year event. In some areas, slightly lower levels are predicted. This principally reflects the use of the ARI 100 year event, rather than the 1909 flood event (indicated by this current work as having a return period of the order of ARI 200 years).
There are several things to note regarding the performance of the floodplain through Dimboola.
Of primary concern to the township is that the majority of the breakout flow in larger events is through the township. These breakouts become significant at design events of magnitudes ARI 20 year and above.
The inundation diagrams illustrate flood flows “bypassing” the weir through the anabranches at moderate to higher flows. For these higher events (greater than ARI 50 year) there are only small increases in flood levels with increasing design event magnitude predicted within the Wimmera River main channel.
Breakouts at the upstream end of the town (across St Leonards Avenue) are predicted to initiate between the ARI 20 and the ARI 50 year event. Considering freeboard requirements, this indicates that the existing levee system provides a level of protection for events somewhat less than the ARI 20 year event.
Similarly, the township levee protecting the town centre is predicted to overtop in between the ARI 20 and the ARI 50 year event. Again, considering freeboard requirements, this indicates that the levee system provides protection for events somewhat less than the ARI 50 year event.

Dimboola Flood Study WATER TECHNOLOGY AAM, LICS, Neil M Craigie, S Brizga & Assoc.
J035/R2, 7 February 2003, Final, Ver. A Page 45
11 Conclusions
Based on the work completed as part of the Dimboola Flood Study, the following conclusions have been made:
11.1 Previous Investigations 1. There has been a significant amount of work documenting the impacts of flooding on
the Wimmera River, although relatively little undertaken specifically for Dimboola and is summarised in the FDT Project (SKM, 2000). This current investigation has augmented the observed flood level information through additional flood levels sourced from Wimmera CMA records, and observed flood levels that have been surveyed directly.
2. As incorporated into the FDT Project, to the study team’s knowledge, the Dimboola Flood Level Investigation (RWC, 1987) is the most complete compilation of historic flood data. This study adopted the 1909 event as being indicative of the 100 year ARI event. On the basis of this information, flood level lines were drawn at 0.1m intervals and formed the basis of the designated flood levels.
3. A significant amount of the previous SRWSC 1982 investigation into flooding of Horsham is still relevant, and has served as the basis for the hydrologic analysis undertaken in this current investigation. However, during the course of this current investigation, the partial series approach adopted in the SRWSC 1982 study has been revised using both the longer record now available, and an annual series approach. This has resulted in increased design discharges for the Wimmera River.
11.2 Community Consultation 4. Information has been distributed to the community in two distinct phases. Firstly the
study inception was publicly announced, along with a call for information relating to flooding. A series of public presences were held where interested parties could meet with the study team. Secondly, a series of public information sessions were conducted to provide feedback to the community about the study outcomes.
11.3 Data Gathering/Survey 5. Ortho-rectified digital photogrammetry is now available for the Dimboola township.
6. Based on this photogrammetric survey, a Digital Terrain Model of the study area is now available.
7. 114 floor levels in the Dimboola township were surveyed during the course of this investigation.
8. An additional 8 observed flood levels have been gathered in the township ara.
9. 4 Wimmera River cross sections were taken with the aim of quantifying the channel capacity of the Wimmera River through Dimboola.
11.4 Hydrologic Analysis 10. The conduct of detailed hydrologic analysis of the Wimmera River at Dimboola is
restricted due to limited adjacent streamflow. The available streamflow data indicates that peak flows during observed flood are of similar magnitude at Horsham and Dimboola.

Dimboola Flood Study WATER TECHNOLOGY AAM, LICS, Neil M Craigie, S Brizga & Assoc.
J035/R2, 7 February 2003, Final, Ver. A Page 46
For this study, the design peak flows determined for Horsham were considered representative of design peak flows at Dimboola. As detailed in the “Horsham Flood Study”, Water Technology (2003), Table 11.1 presents adopted design discharges for the Wimmera River through Dimboola.
Table 11.1 Wimmera River Design Discharges at Horsham (adopted as representative for Dimboola)
Wimmera River (Horsham (Walmer) Gauge) Average
recurrence interval (years) Design peak flow
(ML/d) Design peak flow
(m3/s)
5 12,900 149
10 18,100 209
20 23,700 274
50 31,200 361
100 37,000 428
200 43,000 498
11.5 Hydraulic Analysis 11. A detailed hydrodynamic model of the Wimmera River has been established. This
hydraulic model is based on the MIKE 21 2D hydrodynamic modelling package.
12. Observed flood profiles were available for the Wimmera River for the 1981 event. In addition to council staff and resident observations of flooding behaviour, these levels were used for calibration purposes.
13. Following calibration, the full suite of design events were simulated using the model.
11.6 Risk Assessment
14. Table 11.2 below summarises the hydraulic behaviour of the area, referenced to the design event frequency.
Table 11.2 Floodplain behaviour for varying levels of Design Flood Events
Event (ARI) Behaviour
5 year (~’92) Minor flow through anabranches
10 year (~’96) Flow through township anabranch
20 year (’81) Flow through township anabranch
50 year Upstream breakout initiated
100 year (<’09) Town centre levee overtopped
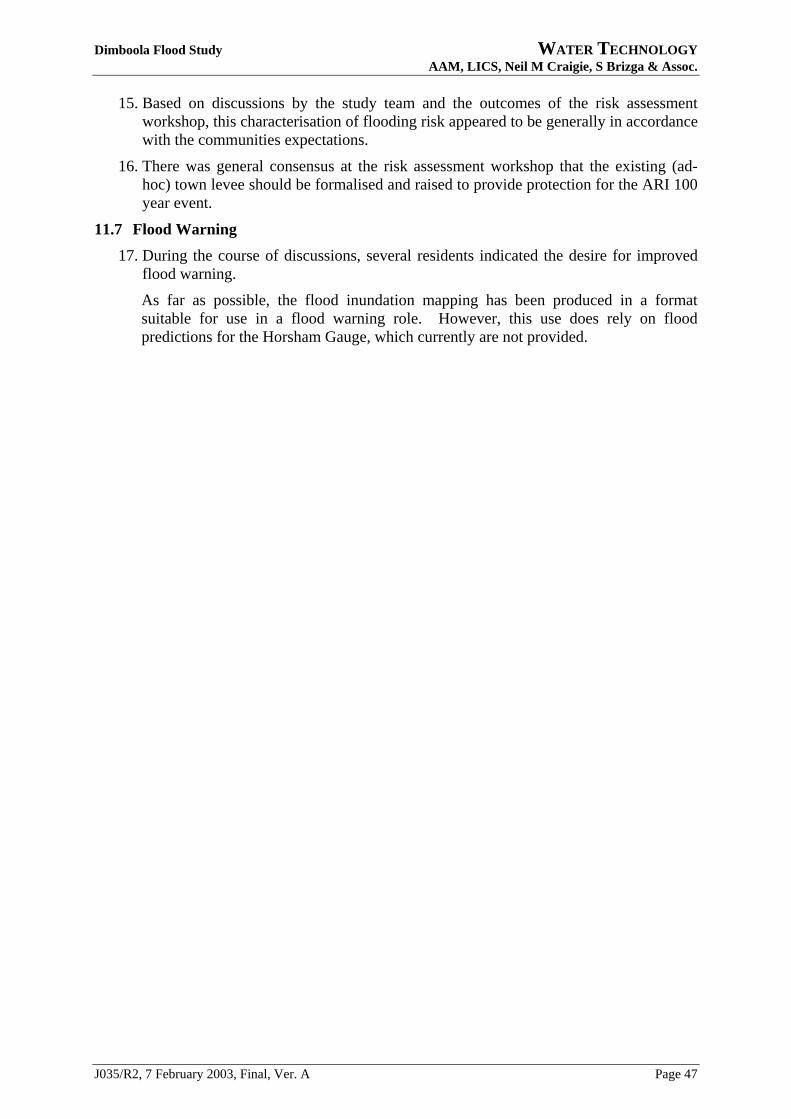
Dimboola Flood Study WATER TECHNOLOGY AAM, LICS, Neil M Craigie, S Brizga & Assoc.
J035/R2, 7 February 2003, Final, Ver. A Page 47
15. Based on discussions by the study team and the outcomes of the risk assessment workshop, this characterisation of flooding risk appeared to be generally in accordance with the communities expectations.
16. There was general consensus at the risk assessment workshop that the existing (ad-hoc) town levee should be formalised and raised to provide protection for the ARI 100 year event.
11.7 Flood Warning 17. During the course of discussions, several residents indicated the desire for improved
flood warning.
As far as possible, the flood inundation mapping has been produced in a format suitable for use in a flood warning role. However, this use does rely on flood predictions for the Horsham Gauge, which currently are not provided.

Dimboola Flood Study WATER TECHNOLOGY AAM, LICS, Neil M Craigie, S Brizga & Assoc.
J035/R2, 7 February 2003, Final, Ver. A Page 48
12 Recommendations for future investigations The study team recommends that the following additional investigations be conducted:
• Floodplain management study and plan for Dimboola,
• Flood response plan for Dimboola
Within a risk management framework, the current study has identified and analysed the existing risk from flooding due to overland flow from the Wimmera River.
The floodplain management study and plan will assess the consequences to the community from the existing flooding risk and develop mitigation measures aimed at reducing these consequences. A flood response plan will provide a framework for effective and efficient flood response and recovery. Both the management and response plans will promote a greater community awareness of flooding risks, consequences and community actions that can reduce both the risks and the consequences.
Section 12.1 outline the key objectives for the recommended future investigations. Detailed briefs for the recommended future investigations are provided in Appendix D.
12.1 Floodplain management and flood response plans The aim of this investigation would be to assess and prioritise the flood risks facing the Dimboola community. The study should consider:
• What are the current risks facing the community (as defined by this current investigation)?
• Are these risks acceptable? The feedback gained through the course of this investigation is that in many areas, stakeholders feel that the current level of risks is not acceptable.
• If these risks aren’t acceptable, what mechanisms are available to minimise flood risks?
• What are the environmental, economic and social benefits and costs associated with such mechanisms?
Specific works items that will need to be addressed as part of such a study include:
1. Public consultation to both educate the community and involve the community in the decision making process.
2. A comprehensive update of the flood damage calculations presented in Read Sturgess (2001), based on the results of this current flood study.
3. Consideration of the most appropriate planning controls over development in the “at risk” areas of the floodplain ie:
• Adjacent areas to Lloyd Street and St Leonards Avenue,
• Areas to the west of the Wimmera River,
• Residential/commercial areas behind the existing town levee system.
4. Consideration of works to address the weaknesses in the current town protection scheme that have been identified in the course of this study. Consideration of such works should include, but not be limited to:

Dimboola Flood Study WATER TECHNOLOGY AAM, LICS, Neil M Craigie, S Brizga & Assoc.
J035/R2, 7 February 2003, Final, Ver. A Page 49
• Modifications to the existing town levee, to at least, eliminate the existing low points and if possible raise the levee crest along the entire length,
• Modifications to the existing bunding upstream of St Leonards Avenue, to eliminate the existing low points.,
5. Quantification of the benefits and costs from economic, environmental and social viewpoints associated with each of these flood mitigation schemes.
6. Identification of funding mechanisms for proposed schemes.
7. Formalisation of the existing flood warning system as part of the flood response plan. At present, there are established procedures (principally between Hindmarsh Shire Council and Wimmera Mallee Water) that are initiated in the event of a flood.
8. Development of operational framework for flood response and recovery including defining of roles and responsibilities of relevant authorities.
9. Consideration of the exposure of essential services (eg SES, Council, WMW, GWA, police, ambulance, hospital etc) to flooding.

Dimboola Flood Study WATER TECHNOLOGY AAM, LICS, Neil M Craigie, S Brizga & Assoc.
J035/R2, 7 February 2003, Final, Ver. A Page 50
13 References
1. Binnie and Partners, “Study of Flood Events within the Wyperfield National Park”, report prepared for Dept. Conservation and Environmental, 1991.
2. Commonwealth Bureau of Meteorology, “The Remarkable Rains over South Eastern Australia During the Winter of 1909”, Bulletin No. 3, 1909
3. Floodplain Management Unit, Department of Natural Resources and Environment, “Advisory Notes for Delineating Floodways”, 1998.
4. ID&A, “Wimmera River Geomorphic Investigation, Sediment Sources, Transport and Fate”, report prepared for Wimmera CMA, 2002.
5. Institution of Engineers Austalia (IEAust, 1987), “Australian Rainfall and Runoff”, Vols 1&2. (Ed: Pilgrim D.H.) Institution of Engineers, Australia.
6. Read Sturgess and Associates, “Economic Evaluation of Flood Damages for the Wimmera CMA”, report prepared for the Department of Natural Resources and Environment, 2001.
7. Rural Water Commission of Victoria, “Victorian Surface Water Information to 1987”, 1987.
8. Rural Water Commission, “Report on Dimboola Flood Level Investigation”, 1987.
9. Sinclair Knight Merz, “Draft Regional Waterway Management Strategy”, report prepared for Wimmera CMA, 1999.
10. Sinclair Knight Merz “River Basin Report, Wimmera River, Lower Sub Catchment – Flood Data Transfer Project”, prepared for the Department of Natural Resources and Environment, June 2000.
11. Sinclair Knight Merz, “Draft Wimmera Floodplain Management Strategy”, report prepared for Wimmera CMA, 2001.
12. Sinclair Knight Merz, “Stressed Rivers Project – Environmental Flows Study, Wimmera River”, report prepared for the Department of Natural Resources and Environment, 2002.
13. State Rivers and Water Supply Commission, “Horsham Floodplain Management Study Volume 1 – Final Report”, 1982.
14. State Rivers and Water Supply Commission, “Horsham Floodplain Management Study Volume 2 – Technical Report”, 1982.
15. Thiess Environmental Services, “Flood Warning Stations Information Manual”, 1999.
16. Water Technology, “Horsham Flood Study”, draft report prepared for Wimmera CMA, 2003.
17. Wimmera CMA, “Wimmera Floodplain Management Strategy”, 2001.
18. Wimmera Mallee Water, “Wimmera Mallee Headworks System Reference Manual”, 1987.