dimensional trusts · dimensional trusts financial statements for the year ended 30 june 2019...
TRANSCRIPT

DIMENSIONAL TRUSTS
Financial Statements for the year ended 30 June 2019
Dimensional Global Core Equity Trust ARSN 120 009 305
Dimensional Global Sustainability Trust ARSN 162 758 036
Dimensional Global Real Estate Trust ARSN 126 933 131
Dimensional Global Value Trust ARSN 092 663 360
Dimensional Global Large Company Trust ARSN 092 663 100
Dimensional Global Small Company Trust ARSN 092 662 952
Dimensional Emerging Markets Trust ARSN 092 662 818


CONTENTSDirectors’ Report 2
Auditor’s Independence Declaration 9
Statements of Comprehensive Income 10
Statements of Financial Position 13
Statements of Changes in Equity 16
Statements of Cash Flows 19
Notes to the Financial Statements 22
Directors’ Declaration 97
Independent Auditor’s Report 98
FINANCIAL STATEMENTSfor the year ended 30 June 2019

The Directors of DFA Australia Limited (ABN 46 065 937 671), the ‘Responsible Entity’ of the following trusts, which form part of the Dimensional Trusts (collectively the ‘Schemes’), present their report together with the Financial Statements of the following Schemes for the year ended 30 June 2019:
Dimensional Global Core Equity Trust
Dimensional Global Sustainability Trust
Dimensional Global Real Estate Trust
Dimensional Global Value Trust
Dimensional Global Large Company Trust
Dimensional Global Small Company Trust
Dimensional Emerging Markets Trust
The Responsible Entity of the Schemes is DFA Australia Limited (the ‘Responsible Entity’), a public company incorporated and operating in Australia.
In order to comply with the provisions of the Corporations Act 2001, the Directors of the Responsible Entity report as follows:
Directors
The names of the Directors of the Responsible Entity during the year and up to the date of this report (unless otherwise stated) are:
J.G. Crane M.S. Gilliland (resigned 31 July 2018)
N.A.D. Stewart S.A. Clark
C.L. Newell D.P. Butler
B.P. Singh G.K. O’Reilly
DIMENSIONAL TRUSTSDirectors’ Report for the year ended 30 June 2019
2 Annual Report 2019

Principal activitiesThe Schemes are registered managed investment schemes domiciled in Australia. The principal activity of the Schemes is to invest funds in accordance with their investment objectives and guidelines set out in the Schemes’ current Product Disclosure Statements and in accordance with the provisions of their Constitutions. The following is a summary of the investment objectives of the Schemes:
Scheme Name Investment Objective Principal Investments
Dimensional Global Core Equity Trust
To provide long-term capital growth by gaining exposure to a diversified portfolio of securities associated with approved developed markets (excluding Australia), with increased exposure to small companies and value companies relative to a Market Capitalisation Weighted portfolio.
Ordinarily, the Scheme will invest in a diversified market-wide portfolio of securities associated with approved developed markets (excluding Australia). Eligible securities for the strategy include securities of companies and Real Estate Investment Trusts (REITs) and REIT-like entities listed on approved developed markets (excluding Australia).Three classes of units are offered to all investors: unhedged class units, AUD hedged class units that are denominated in Australian dollars and NZD hedged class units that are denominated in New Zealand dollars. For the hedged class units, most foreign currency exposure is hedged either to the Australian dollar (for the AUD hedged class units) or the New Zealand dollar (for the NZD hedged class units).
Dimensional Global Sustainability Trust
To provide long-term capital growth by gaining exposure to a diversified portfolio of large companies associated with approved developed markets (excluding Australia), with increased emphasis on higher expected return securities, and adjusted to take into account certain environmental and sustainability impact and social considerations.
Ordinarily, the Scheme will invest in a diversified portfolio of large companies associated with approved developed markets (excluding Australia). Large companies are generally defined as those falling into the largest 85-90% of securities by market capitalisation in each eligible country (or region in the case of Europe). Eligible securities for the strategy include securities of companies and Real Estate Investment Trusts (REITs) and REIT-like entities listed on approved developed markets (excluding Australia).Three classes of units are offered to all investors: unhedged class units, AUD hedged class units that are denominated in Australian dollars and NZD hedged class units that are denominated in New Zealand dollars. For the hedged class units, most foreign currency exposures are hedged either to the Australian dollar (for the AUD hedged class units) or the New Zealand dollar (for the NZD hedged class units).
Dimensional Global Value Trust
To provide long-term capital growth by gaining exposure to a diversified portfolio of large value companies associated with approved developed markets (excluding Australia).
Ordinarily, the Scheme will invest in a diversified portfolio of large, low relative price or ‘value’ companies associated with approved developed markets (excluding Australia). Large companies are generally defined as those falling into the largest 85-90% of securities by market capitalisation in each eligible country (or region in the case of Europe).
Dimensional Global Large Company Trust
To provide long-term capital growth by gaining exposure to a diversified portfolio of large companies associated with approved developed markets (excluding Australia).
Ordinarily, the Scheme will invest in a diversified portfolio of large companies associated with approved developed markets (excluding Australia). Large companies are generally defined as those falling into the largest 85-90% of securities by market capitalisation in each eligible country (or region in the case of Europe).
DIMENSIONAL TRUSTSDirectors’ Report for the year ended 30 June 2019
3Annual Report 2019

Scheme Name Investment Objective Principal Investments
Dimensional Global Small Company Trust
To provide long-term capital growth by gaining exposure to a diversified portfolio of small companies associated with approved developed markets (excluding Australia).
Ordinarily, the Scheme will invest in a diversified portfolio of small companies associated with approved developed markets(excluding Australia). Dimensional generally defines small companies as those falling into the smallest 10-15% of securities by market capitalisation of each eligible country (or region in the case of Europe).
Dimensional Global Real Estate Trust
To provide long-term capital growth by gaining exposure to a diversified portfolio of listed international and Australian real estate securities.
Ordinarily, the Scheme will invest in a diverse group of listed real estate securities associated with Australia and other approved developed and emerging markets. Eligible securities for the strategy include the securities of Real Estate Investment Trusts (REITs), REIT-like entities and entities principally engaged in the real estate industry. Two classes of units are offered to all investors: AUD unhedged class units and NZD hedged class units that are denominated in New Zealand dollars, For the hedged class units, most foreign currency exposures are hedged to the New Zealand dollar.
Dimensional Emerging Markets Trust
To provide long-term capital growth by gaining exposure to a diversified portfolio of value companies associated with approved emerging markets.
Ordinarily, the Scheme will invest in a diversified portfolio of value companies associated with approved emerging markets.
The Schemes continued to have no employees during the year.
Principal activities (continued)
DIMENSIONAL TRUSTSDirectors’ Report for the year ended 30 June 2019
4 Annual Report 2019

Review and results of operationsThe results of the operations of the Schemes and the total amount distributed to unitholders are presented below. For details of distributions paid during the year, refer to Note 9 of the Financial Statements.
Dimensional Global Core Equity Trust
AUD Unhedged Class AUD Hedged Class NZD Hedged Class
Year Ended Year Ended Year Ended
2019 2018 2019 2018 2019 2018
Operating profit/(loss) ($’000) 143,059 246,025 27,467 80,109 34,617 26,717
Distributions paid and payable ($’000) 45,647 41,407 73 10,286 2 –
Distributions paid and payable (cents per unit) 33.53 32.77 0.13 23.21 0.01 –
Dimensional Global Sustainability Trust
AUD Unhedged Class AUD Hedged Class NZD Hedged Class
Year Ended Year Ended Year Ended
2019 2018 2019 2018 2019 2018
Operating profit/(loss) ($’000) 6,402 4,824 3,495 1,701 9,033 2,215
Distributions paid and payable ($’000) 1,176 505 – – – –
Distributions paid and payable (cents per unit) 19.56 15.35 – – – –
Dimensional Global Real Estate Trust
AUD Unhedged Class NZD Hedged Class
Year Ended Year Ended
2019 2018 2019 2018
Operating profit/(loss) ($’000) 91,136 43,207 6,908 1,115
Distributions paid and payable ($’000) 16,449 12,673 645 104
Distributions paid and payable (cents per unit) 29.82 25.01 17.38 3.46
DIMENSIONAL TRUSTSDirectors’ Report for the year ended 30 June 2019
5Annual Report 2019

Review and results of operations (continued)
Dimensional Global Value Trust
Dimensional Global Large Company Trust
Year Ended Year Ended
2019 2018 2019 2018
Operating profit/(loss) ($’000) 21,472 93,313 14,839 20,476
Distributions paid and payable ($’000) 33,220 112,123 2,636 2,440
Distributions paid and payable (cents per unit) 101.70 133.65 24.53 21.21
Dimensional Global Small Company Trust
Dimensional Emerging Markets Trust
Year Ended Year Ended
2019 2018 2019 2018
Operating profit/(loss) ($’000) 4,417 48,822 40,700 46,557
Distributions paid and payable ($’000) 6,569 3,435 18,075 25,669
Distributions paid and payable (cents per unit) 38.93 24.94 58.14 94.21
Matters subsequent to the end of the financial yearThere has not been any matter or circumstance, other than that referred to in the Financial Statements or Notes thereof, that has arisen since the end of the financial year that has significantly affected, or may significantly affect:
(i) theoperationsoftheSchemesinfuturefinancialyears,or
(ii) theresultsofthoseoperationsinfuturefinancialyears,or
(iii) thestateofaffairsoftheSchemesinfuturefinancialyears.
DIMENSIONAL TRUSTSDirectors’ Report for the year ended 30 June 2019
6 Annual Report 2019

Significant changes in the State of affairsIn the opinion of the Directors, there were no significant changes in the state of affairs of the Schemes that occurred during the financial year.
Likely developments and expected results of operationsThe Schemes will continue to be managed in accordance with the investment objectives and guidelines as prescribed in the governing documents of the Schemes and in accordance with the provisions of the Schemes’ Constitutions.
The results of the Schemes’ operations will be affected by several factors, including the performance of investment markets in which the Schemes invest. Investment performance is not guaranteed and future returns may differ from past returns. As investment conditions change over time, past returns should not be used to predict future returns.
Further information on likely developments in the operations of the Schemes and the expected results of those operations have not been included in this report because the Responsible Entity believes it would likely result in unreasonable prejudice to the Schemes.
Options grantedNo options were:
(i) granted over unissued units in the Schemes during or since the end of the financial year; or
(ii) granted to the Responsible Entity.
No unissued units in the Schemes were under option as at the date on which this report is made.
No units were issued in the Schemes during or since the end of the financial year as a result of the exercise of an option over unissued units in the Schemes.
Indemnification and insurance of officers and auditorNo insurance premiums are paid for out of the assets of the Schemes in regards to insurance cover provided to either the officers of the Responsible Entity or the auditor of the Schemes. So long as the officers of the Responsible Entity act in accordance with the Schemes’ Constitutions and the Law, the officers remain indemnified out of the assets of the Schemes against losses incurred while acting on behalf of the Schemes. The auditor of the Schemes is in no way indemnified out of the assets of the Schemes.
Fees paid to and interests in the Schemes by the Responsible EntityFees paid to the Responsible Entity and its associates out of the Schemes’ property during the year are disclosed in the Statements of Comprehensive Income and in Note 12(e) to the Financial Statements.
No fees were paid out of the Schemes’ property to the directors of the Responsible Entity during the year. The number of units in the Schemes held by the Responsible Entity or its associates as at the end of the financial year are disclosed in Note 12(d) to the Financial Statements.
The number of interests in the Schemes issued during the financial year, withdrawals from the Schemes during the financial year, and the number of interests in the Schemes at the end of the financial year are disclosed in Note 7 to the Financial Statements.
The value of the Schemes’ assets as at the end of the financial year are disclosed in the Statements of Financial Position as “Total assets” and the basis of valuation is included in Note 2 to the Financial Statements.
DIMENSIONAL TRUSTSDirectors’ Report for the year ended 30 June 2019
7Annual Report 2019

Auditor’s independence declarationA copy of the Auditor’s independence declaration as required under section 307C of the Corporations Act 2001 is set out on page 9.
Environmental regulationThe operations of the Schemes are not subject to any particular or significant environmental regulations under either Commonwealth, State or Territory law.
Signed in accordance with a resolution of the Directors of the Responsible Entity made pursuant to section 298(2) of the Corporations Act 2001.
Rounding of amounts to the nearest thousand dollarsAmounts in the Directors’ report have been rounded to the nearest thousand dollars in accordance with ASIC Corporations (Rounding in Financial/Directors’ Reports) Instrument 2016/191, unless otherwise indicated.
Signed in accordance with a resolution of the Directors of the Responsible Entity made pursuant to section 298(2) of the Corporations Act 2001.
On behalf of the Directors,
J.G. Crane N.A.D. Stewart
Director Director
Sydney, 17 September 2019
DIMENSIONAL TRUSTSDirectors’ Report for the year ended 30 June 2019
8 Annual Report 2019

DIMENSIONAL TRUSTSAuditor’s Independence Declaration
Annual Report 2019 9

Dimensional Global Core Equity Trust
Dimensional Global Sustainability Trust
Dimensional Global Real Estate Trust
Year Ended Year Ended Year Ended30 June 2019 30 June 2018 30 June 2019 30 June 2018 30 June 2019 30 June 2018
Note $’000 $’000 $’000 $’000 $’000 $’000
Investment income
Interest income from financial assets at amortised cost 380 985 24 24 36 31
Dividend and distribution income 79,836 64,372 3,855 1,991 22,160 19,252
Net gains/(losses) on financial instruments at fair value through profit or loss
6 138,618 299,246 15,899 7,183 78,002 26,757
Other income 909 1,103 17 5 85 92
Total net investment income/(loss) 219,743 365,706 19,795 9,203 100,283 46,132
Expenses
Management fees 11(e ) 14,101 12,050 820 443 2,173 1,783
Brokerage fees 406 173 43 19 59 19
Other expenses 93 632 2 1 7 8
Total operating expenses 14,600 12,855 865 463 2,239 1,810
Operating profit/(loss) 205,143 352,851 18,930 8,740 98,044 44,322
Finance costs attributable to unitholders
Distributions to unitholders 9 45,722 51,693 1,176 505 17,094 12,777
Increase/(decrease) in net assets attributable to unitholders
7 159,421 301,158 17,754 8,235 80,950 31,545
Profit/(loss) for the year – – – – – –
Other comprehensive income – – – – – –
Total comprehensive income – – – – – –
10 Annual Report 2019
The above Statements of Comprehensive Income should be read in conjunction with the accompanying notes.
DIMENSIONAL TRUSTSStatements of Comprehensive Income for the year ended 30 June 2019

Dimensional Global Value Trust
Dimensional Global Large Company Trust
Year Ended Year Ended30 June 2019 30 June 2018 30 June 2019 30 June 2018
Note $’000 $’000 $’000 $’000
Investment income
Interest income from financial assets at amortised cost 43 31 6 4
Dividend and distribution income 14,038 15,816 3,057 2,908
Net gains/(losses) on financial instruments at fair value through profit or loss 6 9,802 80,602 12,268 18,048
Other income 58 74 11 15
Total net investment income/(loss) 23,941 96,523 15,342 20,975
Expenses
Management fees 11(e ) 2,393 3,126 496 492
Brokerage fees 71 78 5 5
Other expenses 5 6 2 2
Total operating expenses 2,469 3,210 503 499
Operating profit/(loss) 21,472 93,313 14,839 20,476
Profit/(loss) for the year 21,472 93,313 14,839 20,476
Other comprehensive income – – – –
Total comprehensive income 21,472 93,313 14,839 20,476
11Annual Report 2019
The above Statements of Comprehensive Income should be read in conjunction with the accompanying notes.
DIMENSIONAL TRUSTSStatements of Comprehensive Income for the year ended 30 June 2019

Dimensional Global Small Company Trust
Dimensional Emerging Markets Trust
Year Ended Year Ended30 June 2019 30 June 2018 30 June 2019 30 June 2018
Note $’000 $’000 $’000 $’000
Investment income
Interest income from financial assets at amortised cost 32 15 48 23
Dividend and distribution income 6,200 4,810 16,293 13,393
Net gains/(losses) on financial instruments at fair value through profit or loss 6 312 45,643 28,360 36,502
Other income 280 380 278 403
Total net investment income/(loss) 6,824 50,848 44,979 50,321
Expenses
Management fees 11(e ) 2,283 1,966 3,849 3,637
Brokerage fees 93 28 211 78
Other expenses 31 32 219 49
Total operating expenses 2,407 2,026 4,279 3,764
Operating profit/(loss) 4,417 48,822 40,700 46,557
Profit/(loss) for the year 4,417 48,822 40,700 46,557
Other comprehensive income – – – –
Total comprehensive income 4,417 48,822 40,700 46,557
12 Annual Report 2019
The above Statements of Comprehensive Income should be read in conjunction with the accompanying notes.
DIMENSIONAL TRUSTSStatements of Comprehensive Income for the year ended 30 June 2019

Dimensional Global Core Equity Trust
Dimensional Global Sustainability Trust
Dimensional Global Real Estate Trust
30 June 2019As at
30 June 2018 30 June 2019As at
30 June 2018 30 June 2019As at
30 June 2018Note $’000 $’000 $’000 $’000 $’000 $’000
Assets Cash and cash equivalents 65,521 46,868 1,272 2,700 2,482 2,453Deposits held with brokers for margin 1,873 5 – – – –Financial assets at fair value through profit or loss 3 3,974,711 3,397,204 224,296 139,629 640,705 529,400Receivables 12,056 11,858 9,575 229 9,196 4,126
Total assets 4,054,161 3,455,935 235,143 142,558 652,383 535,979
Liabilities Distributions payable 9 31,842 39,152 835 356 5,518 4,945Payables 25,485 3,105 9,206 57 4,518 517Financial liabilities at fair value through profit or loss 4 276 32,542 58 2,184 11 714Total liabilities 57,603 74,799 10,099 2,597 10,047 6,176Net assets attributable to unitholders – liability 7 3,996,558 3,381,136 225,044 139,961 642,336 529,803
13Annual Report 2019
The above Statements of Financial Position should be read in conjunction with the accompanying notes.
DIMENSIONAL TRUSTSStatements of Financial Position as at 30 June 2019

Dimensional Global Value Trust
Dimensional Global Large Company Trust
30 June 2019As at
30 June 2018 30 June 2019As at
30 June 2018Note $’000 $’000 $’000 $’000
Assets Cash and cash equivalents 21,586 4,787 633 661Deposits held with brokers for margin 1,252 – – –Financial assets at fair value through profit or loss 3 486,193 529,218 145,893 143,167Receivables 6,189 2,241 1,519 427
Total assets 515,220 536,246 148,045 144,255
LiabilitiesDistributions payable 9 25,282 34,573 1,607 1,436Payables 339 313 199 123Financial liabilities at fair value through profit or loss 4 30 – – –Total liabilities 25,651 34,886 1,806 1,559Net assets attributable to unitholders – equity 7 489,569 501,360 146,239 142,696
14 Annual Report 2019
The above Statements of Financial Position should be read in conjunction with the accompanying notes.
DIMENSIONAL TRUSTSStatements of Financial Position as at 30 June 2019

Dimensional Global Small Company Trust
Dimensional Emerging Markets Trust
30 June 2019As at
30 June 2018 30 June 2019As at
30 June 2018Note $’000 $’000 $’000 $’000
Assets Cash and cash equivalents 7,251 1,861 13,188 3,416Deposits held with brokers for margin 179 – 326 –Financial assets at fair value through profit or loss 3 419,812 334,483 597,986 503,277Receivables 1,303 796 2,882 1,872
Total assets 428,545 337,140 614,382 508,565
Liabilities Distributions payable 9 5,205 2,282 9,867 18,570Payables 1,585 591 1,875 438Financial liabilities at fair value through profit or loss 4 – – – –Total liabilities 6,790 2,873 11,742 19,008Net assets attributable to unitholders – equity 7 421,755 334,267 602,640 489,557
15Annual Report 2019
The above Statements of Financial Position should be read in conjunction with the accompanying notes.
DIMENSIONAL TRUSTSStatements of Financial Position as at 30 June 2019

Dimensional Global Core Equity Trust
Dimensional Global Sustainability Trust
Dimensional Global Real Estate Trust
30 June 2019Year Ended
30 June 2018 30 June 2019Year Ended
30 June 2018 30 June 2019Year Ended
30 June 2018
Note $’000 $’000 $’000 $’000 $’000 $’000
Total equity at the beginning of the financial year – – – – – –
Comprehensive income for the year
Profit/(loss) for the year – – – – – –
Other comprehensive income – – – – – –
Total comprehensive income – – – – – –
Transactions with unitholders 7
Applications – – – – – –
Redemptions – – – – – –
Units issued upon reinvestment of distributions – – – – – –
Distributions paid and payable 9 – – – – – –
Total transactions with unitholders – – – – – –
Total equity at the end of the financial year – – – – – –
16 Annual Report 2019
DIMENSIONAL TRUSTSStatements of Changes in Equity for the year ended 30 June 2019
The above Statements of Changes in Equity should be read in conjunction with the accompanying notes.

Dimensional Global Value Trust
Dimensional Global Large Company Trust
30 June 2019Year Ended
30 June 2018 30 June 2019Year Ended
30 June 2018
Note $’000 $’000 $’000 $’000
Total equity at the beginning of the financial year 501,360 – 142,696 –
Reclassification due to AMIT tax regime implementation* – 744,372 – 130,009
Comprehensive income for the year
Profit/(loss) for the year 21,472 93,313 14,839 20,476
Other comprehensive income – – – –
Total comprehensive income 21,472 93,313 14,839 20,476
Transactions with unitholders 7
Applications 110,239 112,516 12,650 17,578
Redemptions (112,784) (343,513) (21,398) (22,974)
Units issued upon reinvestment of distributions 2,502 6,795 87 47
Distributions paid and payable 9 (33,220) (112,123) (2,636) (2,440)
Total transactions with unitholders (33,263) (336,325) (11,296) (7,789)
Total equity at the end of the financial year 489,569 501,360 146,239 142,696
* Effective from 1 July 2017, the Schemes’ units have been reclassified from financial liability to equity.
17Annual Report 2019
DIMENSIONAL TRUSTSStatements of Changes in Equity for the year ended 30 June 2019
The above Statements of Changes in Equity should be read in conjunction with the accompanying notes.

Dimensional Global Small Company Trust
Dimensional Emerging Markets Trust
30 June 2019Year Ended
30 June 2018 30 June 2019Year Ended
30 June 2018
Note $’000 $’000 $’000 $’000
Total equity at the beginning of the financial year 334,267 – 489,557 –
Reclassification due to AMIT tax regime implementation* – 270,173 – 455,234
Comprehensive income for the year
Profit/(loss) for the year 4,417 48,822 40,700 46,557
Other comprehensive income – – – –
Total comprehensive income 4,417 48,822 40,700 46,557
Transactions with unitholders 7
Applications 122,788 58,232 139,046 94,810
Redemptions (34,044) (40,091) (52,951) (83,697)
Units issued upon reinvestment of distributions 896 566 4,363 2,322
Distributions paid and payable 9 (6,569) (3,435) (18,075) (25,669)
Total transactions with unitholders 83,071 15,272 72,383 (12,234)
Total equity at the end of the financial year 421,755 334,267 602,640 489,557
* Effective from 1 July 2017, the Schemes’ units have been reclassified from financial liability to equity.
18 Annual Report 2019
DIMENSIONAL TRUSTSStatements of Changes in Equity for the year ended 30 June 2019
The above Statements of Changes in Equity should be read in conjunction with the accompanying notes.
Dimensional Global Core Equity Trust
Dimensional Global Sustainability Trust
Dimensional Global Real Estate Trust
30 June 2019
Year Ended 30 June 2018
30 June 2019
Year Ended 30 June 2018
30 June 2019
Year Ended 30 June 2018
Note $’000 $’000 $’000 $’000 $’000 $’000
Cash flows from operating activities
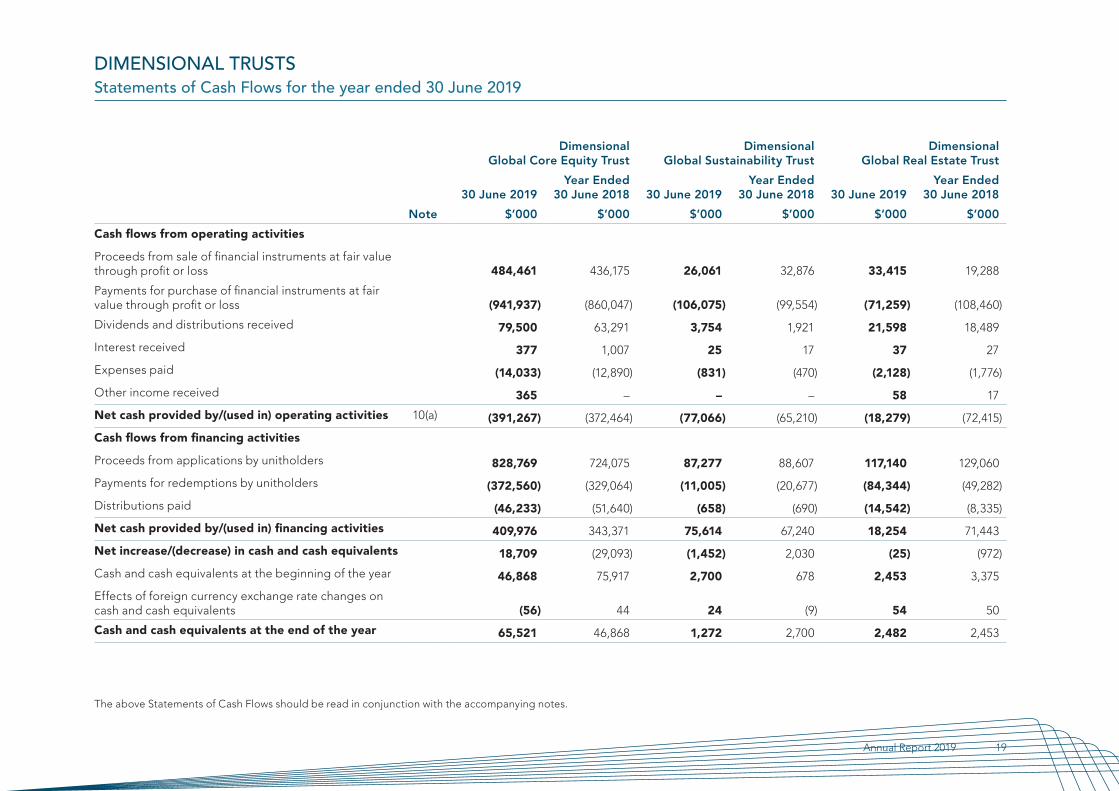
Proceeds from sale of financial instruments at fair value through profit or loss 484,461 436,175 26,061 32,876 33,415 19,288
Payments for purchase of financial instruments at fair value through profit or loss (941,937) (860,047) (106,075) (99,554) (71,259) (108,460)
Dividends and distributions received 79,500 63,291 3,754 1,921 21,598 18,489
Interest received 377 1,007 25 17 37 27
Expenses paid (14,033) (12,890) (831) (470) (2,128) (1,776)
Other income received 365 – – – 58 17
Net cash provided by/(used in) operating activities 10(a) (391,267) (372,464) (77,066) (65,210) (18,279) (72,415)
Cash flows from financing activities
Proceeds from applications by unitholders 828,769 724,075 87,277 88,607 117,140 129,060
Payments for redemptions by unitholders (372,560) (329,064) (11,005) (20,677) (84,344) (49,282)
Distributions paid (46,233) (51,640) (658) (690) (14,542) (8,335)
Net cash provided by/(used in) financing activities 409,976 343,371 75,614 67,240 18,254 71,443
Net increase/(decrease) in cash and cash equivalents 18,709 (29,093) (1,452) 2,030 (25) (972)
Cash and cash equivalents at the beginning of the year 46,868 75,917 2,700 678 2,453 3,375
Effects of foreign currency exchange rate changes on cash and cash equivalents (56) 44 24 (9) 54 50
Cash and cash equivalents at the end of the year 65,521 46,868 1,272 2,700 2,482 2,453
19Annual Report 2019
DIMENSIONAL TRUSTSStatements of Cash Flows for the year ended 30 June 2019
The above Statements of Cash Flows should be read in conjunction with the accompanying notes.

Dimensional Global Value Trust
Dimensional Global Large Company Trust
30 June 2019
Year Ended 30 June 2018
30 June 2019
Year Ended 30 June 2018
Note $’000 $’000 $’000 $’000
Cash flows from operating activities
Proceeds from sale of financial instruments at fair value through profit or loss 143,298 491,797 15,219 15,162
Payments for purchase of financial instruments at fair value through profit or loss (95,680) (194,795) (6,799) (9,966)
Dividends and distributions received 14,058 15,942 3,071 2,893
Interest received 46 30 6 4
Expenses paid (2,415) (3,606 ) (497) (553)
Other income received 143 – (9) –
Net cash provided by/(used in) operating activities 10(a) 59,450 309,368 10,991 7,540
Cash flows from financing activities
Proceeds from applications by unitholders 110,247 112,785 12,678 17,635
Payments for redemptions by unitholders (112,745) (343,695) (21,322) (22,924)
Distributions paid (40,009) (79,037) (2,377) (2,291)
Net cash provided by/(used in) financing activities (42,507) (309,947) (11,021) (7,580)
Net increase/(decrease) in cash and cash equivalents 16,943 (579) (30) (40)
Cash and cash equivalents at the beginning of the year 4,787 5,328 661 694
Effects of foreign currency exchange rate changes on cash and cash equivalents (144) 38 2 7
Cash and cash equivalents at the end of the year 21,586 4,787 633 661
20 Annual Report 2019
DIMENSIONAL TRUSTSStatements of Cash Flows for the year ended 30 June 2019
The above Statements of Cash Flows should be read in conjunction with the accompanying notes.

Dimensional Global Small Company Trust
Dimensional Emerging Markets Trust
30 June 2019
Year Ended 30 June 2018
30 June 2019
Year Ended 30 June 2018
Note $’000 $’000 $’000 $’000
Cash flows from operating activities
Proceeds from sale of financial instruments at fair value through profit or loss 57,642 51,021 63,582 64,931
Payments for purchase of financial instruments at fair value through profit or loss (142,071) (70,264) (129,533) (70,401)
Dividends and distributions received 6,090 4,724 15,696 13,649
Interest received 31 16 47 23
Expenses paid (2,278) (1,966) (3,841) (3,669)
Other income received 221 302 348 450
Net cash provided by/(used in) operating activities 10(a) (80,365) (16,167) (53,701) 4,983
Cash flows from financing activities
Proceeds from applications by unitholders 122,500 58,252 138,578 95,187
Payments for redemptions by unitholders (33,980) (40,334) (52,660) (84,263)
Distributions paid (2,750) (2,034) (22,415) (15,176)
Net cash provided by/(used in) financing activities 85,770 15,884 63,503 (4,252)
Net increase/(decrease) in cash and cash equivalents 5,405 (283) 9,802 731
Cash and cash equivalents at the beginning of the year 1,861 2,134 3,416 2,677
Effects of foreign currency exchange rate changes on cash and cash equivalents (15) 10 (30) 8
Cash and cash equivalents at the end of the year 7,251 1,861 13,188 3,416
21Annual Report 2019
DIMENSIONAL TRUSTSStatements of Cash Flows for the year ended 30 June 2019
The above Statements of Cash Flows should be read in conjunction with the accompanying notes.

1. General informationThese Financial Statements cover the following registered schemes (the ‘Schemes’) as individual entities;
Scheme Name Date of Constitution Date of Commencement Date of Activation Date of Termination
Dimensional Global Core Equity Trust 5 October 2005 24 November 2006 5 December 2006 24 November 2086
Dimensional Global Sustainability Trust 7 March 2013 1 March 2016 23 May 2016 1 March 2096
Dimensional Global Real Estate Trust 1 August 2007 2 October 2007 29 October 2007 2 October 2087
Dimensional Global Value Trust 11 November 1997 29 June 1998 27 August 1999 29 June 2078
Dimensional Global Large Company Trust 11 November 1997 29 June 1998 21 August 2000 29 June 2078
Dimensional Global Small Company Trust 11 November 1997 29 June 1998 21 August 2000 29 June 2078
Dimensional Emerging Markets Trust 11 November 1997 29 June 1998 1 September 2000 29 June 2078
The Schemes are registered managed investment schemes domiciled in Australia. The Schemes may be terminated prior to termination date in accordance with the provisions of the Schemes’ Constitutions.
The Responsible Entity of the Schemes is DFA Australia Limited (the ‘Responsible Entity’), a public company incorporated and operating in Australia.
Principal Registered Office and Place of Business of the Responsible Entity
Level 43
1 Macquarie Place
Sydney NSW 2000
Tel: (02) 8336 7100
Fax: (02) 8336 7197
www.dimensional.com.au
The Financial Statements are presented in the Australian currency.
The Financial Statements were authorised for issue by the Directors of the Responsible Entity on 11 September 2019. The Directors of the Responsible Entity have the power to amend and reissue the Financial Statements.
DIMENSIONAL TRUSTSNotes to the Financial Statements for the year ended 30 June 2019
22 Annual Report 2019

2. Summary of significant accounting policies
Financial reporting frameworkThese general-purpose Financial Statements have been prepared in accordance with Australian Accounting Standards, and Interpretations issued by the Australian Accounting Standards Board, and the Corporations Act 2001 in Australia.
The Schemes are for-profit entities for the purpose of preparing the Financial Statements.
(a) Basis of preparationThe Schemes are of the kind referred to in ASIC Corporations (Related Scheme Reports) Instrument 2015/839 dated 18 September 2015 issued by ASIC. In accordance with that Instrument, Schemes with a common Responsible Entity can include the Financial Statements in adjacent columns in a single financial report.
The Financial Statements are prepared on the basis of fair value measurement of assets and liabilities except where otherwise stated.
The Statements of Financial Position are presented on a liquidity basis. Assets and liabilities are presented in decreasing order of liquidity and do not distinguish between current and non-current. All balances are expected to be recovered or settled within 12 months, except for financial assets at fair value through profit or loss and net assets attributable to unitholders. The amount expected to be recovered or settled within 12 months after the end of each reporting period cannot be reliably determined.
The following significant accounting policies have been adopted in the preparation and presentation of the Financial Statements and have been consistently applied to all years presented unless otherwise stated below:
(i) Compliance with International Financial Reporting Standards
The Financial Statements of the Schemes also comply with International Financial Reporting Standards as issued by the International Accounting Standards Board.
(ii) New and amended standards adopted by the Schemes
(i) AASB 9 Financial Instruments became effective for annual periods beginning on or after 1 July 2018. AASB 9 addresses the classification, measurement and derecognition of financial assets and liabilities and replaces the multiple classification measurement and “incurred loss” models in AASB 139 with ‘expected credit loss’ (ECL) models.
Classification and measurement of debt securities is driven by the entity’s business model for managing the financial assets and the contractual cash flow characteristics of the financial assets whilst derivative and equity instruments are measured at fair value through profit or loss unless, for equity instruments not held for trading, an irrevocable option is taken to measure at fair value through other comprehensive income.
The adoption of AASB 9 did not result in a change to the classification or measurement of financial instruments in either the current or prior periods. The Schemes’ investment portfolios continue to be classified as fair value through profit or loss and other financial assets which are held for collection continue to be measured at amortised cost. The Schemes do not apply hedge accounting.
AASB 9 has been applied retrospectively by the Schemes without the use of hindsight. The adoption of AASB 9 has not had a material effect on the Schemes’ accounting policies related to financial liabilities and derivative financial instruments in either the current or prior periods. The Schemes have elected to restate the comparative period presented to comply with AASB 9. The Schemes’ investment portfolio continues to be classified as fair value through profit or loss and other financial assets which are held for collection continue to be measured at amortised cost.
DIMENSIONAL TRUSTSNotes to the Financial Statements for the year ended 30 June 2019
23Annual Report 2019

2. Summary of significant accounting policies (continued)
(a) Basis of preparation (continued)
(ii) New and amended standards adopted by the Schemes (continued)
(ii) AASB 15 Revenue from Contracts with Customers became effective for annual periods beginning on or after 1 January 2018 and replaced AASB 118 Revenue and related interpretations. The adoption of this standard did not have a material impact on the Schemes’ main sources of interest income, dividends and gains on financial instruments on the basis that these revenue sources are all outside the scope of the new standard.
There are no other standards, interpretations or amendments to existing standards that are effective for the first time for the financial year commencing on or after 1 July 2018 that have a material impact on the amounts recognised in the prior periods or the current or future periods.
(iii) New standards, amendments and interpretations not yet adopted
AASB 16 Leases became effective for annual periods beginning on or after 1 January 2019. AASB 16 Leases amends the accounting for leases. Lessees will be required to bring all leases on the Statements of Financial Position as the distinction between operating and finance leases has been eliminated. Lessor accounting remains largely unchanged.
Initial application is not expected to result in any material impact for the Schemes on the basis that the Schemes do not hold any operating or finance leases contracts.
A number of other new standards, amendments to standards and interpretations are effective for annual periods beginning after 1 January 2019, and have not been early adopted in preparing these Financial Statements. None of these are expected to have a material effect on the Financial Statements of the Schemes.
(b) Financial assets and liabilities at fair value through profit or loss
(i) Classification
Financial assetsThe Schemes classify financial assets in the following measurement categories:
> those to be measured subsequently at fair value through profit or loss; and
> those to be measured at amortised cost.
The Schemes classify their investments based on their business model for managing those financial assets and the contractual cash flow characteristics of the financial assets. The Schemes’ portfolio of financial assets are managed and their performance are evaluated on a fair value basis in accordance with the Schemes’ documented investment strategy. The Schemes’ policy is for the Responsible Entity to evaluate the information about these financial assets on a fair value basis together with other related financial information.
For equity securities and derivatives, the contractual cash flows of these instruments do not represent solely payments of principal and interest. Consequently, these investments are measured at fair value through profit or loss.
Investments in financial assets previously designated at fair value through profit or lossThe Schemes hold equity securities and derivatives which had previously been designated at fair value through profit or loss. On adoption of AASB 9, these interest securities are now mandatorily classified as fair value through profit or loss.
DIMENSIONAL TRUSTSNotes to the Financial Statements for the year ended 30 June 2019
24 Annual Report 2019

2. Summary of significant accounting policies (continued)
(b)Financialassetsandliabilitiesatfairvaluethroughprofitorloss(continued)
Financial liabilities
The Schemes invest in derivative financial instruments such as futures, warrants and forward currency contracts. These derivative financial instruments that have a negative fair value are presented as liabilities at fair value through profit or loss.
(ii) Recognition/derecognition
The Schemes recognise financial assets and financial liabilities on the date they become party to the contractual agreement (trade date) and recognise changes in the fair value of the financial assets or financial liabilities from this date.
Investments are derecognised when the right to receive cash flows from the investments have expired or have been transferred and the Schemes have transferred substantially all risks and rewards of ownership.
(iii) Measurement
At initial recognition, the Schemes measure financial assets and financial liabilities at fair value. Transaction costs of financial assets and financial liabilities carried at fair value through profit or loss are expensed in the Statements of Comprehensive Income.
Subsequent to initial recognition, all financial assets and financial liabilities at fair value through profit or loss are measured at fair value. Gains and losses arising from changes in the fair value of the financial assets or financial liabilities at fair value through profit or loss category are presented in the Statements of Comprehensive Income within ‘net gains/(losses) on financial instruments at fair value through profit or loss’ in the period in which they arise. The following represent the basis of valuation for financial reporting purposes:
(i) Securities that are listed or traded on an exchange are fair valued based on quoted ‘last’ prices on long securities.
(ii) Securities which are not listed on a securities exchange or are thinly traded are valued using quotes from brokers. Investments in unlisted unit trusts are valued at the redemption price as established by the underlying trust’s responsible entity.
(iii) In the absence of quoted values or brokers’ representative prices, securities are valued using appropriate valuation techniques as reasonably determined by the Responsible Entity.
The Responsible Entity has determined that the Schemes are an investment entity under AASB 10 as they meet all criteria and characteristics of an investment entity.
(iv) Impairment
At each reporting date, the Schemes shall measure the loss allowance on financial assets at amortised cost at an amount equal to the lifetime expected credit losses if the credit risk has increased significantly since initial recognition. If, at the reporting date, the credit risk has not increased significantly since initial recognition, the Schemes shall measure the loss allowance at an amount equal to 12-month expected credit losses. Significant financial difficulties of the counter party, probability that the counter party will enter bankruptcy or financial reorganisation, and default in payments are all considered indicators that a loss allowance may be required. If the credit risk increases to the point that it is considered to be credit impaired, interest income will be calculated based on the gross carrying amount adjusted for the loss allowance. A significant increase in credit risk is defined by management as any contractual payment which is more than 30 days past due. Any contractual payment which is more than 90 days past due is considered credit impaired.
The ECL approach is based on the difference between the contractual cash flows due in accordance with the contract and all the cash flows that the Scheme expects to receive. The shortfall is then discounted at an approximation to the asset’s original effective interest rate.
DIMENSIONAL TRUSTSNotes to the Financial Statements for the year ended 30 June 2019
25Annual Report 2019

2. Summary of significant accounting policies (continued)
(b)Financialassetsandliabilitiesatfairvaluethroughprofitorloss(continued)
(iv) Impairment (continued)
Financial assets measured at amortised cost are measured initially at fair value plus transaction costs and subsequently amortised using the effective interest rate method, less impairment losses if any. Such assets are reviewed at the end of each reporting period to determine whether there is objective evidence of impairment.
If evidence of impairment exists, an impairment loss is recognised in the Statements of Comprehensive Income as the difference between the asset’s carrying amount and the present value of estimated future cash flows discounted at the original effective interest rate.
If in a subsequent period the amount of an impairment loss recognised on a financial asset carried at amortised cost decreases and the decrease can be linked objectively to an event occurring after the write-down, the write-down is reversed through the Statements of Comprehensive Income.
(c)OffsettingfinancialinstrumentsFinancial assets and liabilities are offset and the net amount reported in the Statements of Financial Position when there is a legally enforceable right to offset the recognised amounts and there is an intention to settle on a net basis or realise the asset and settle the liability simultaneously. Refer to Note 5 to the Financial Statements for further information.
(d) Net assets attributable to unitholdersUnits are redeemable at the unitholders’ option, however, applications and redemptions may be suspended by the Responsible Entity if it is in the best interests of the unitholders.
The units can be put back to the Schemes at any time for cash based on the redemption price, which is equal to a proportionate share of the Schemes’ net asset value attributable to the unitholders.
The units are carried at the redemption amount that is payable at balance sheet date if the holder exercises the right to put the unit back to the Schemes. This amount represents the expected cash flows on redemption of these units.
Units are classified as equity when they satisfy the following criteria under AASB 132 Financial Instruments: Presentation:
> the puttable financial instrument entitles the holder to a pro-rata share of net assets in the event of the Schemes’ liquidation
> the puttable financial instrument is in the class of instruments that is subordinate to all other classes of instruments and class features are identical
> the puttable financial instrument does not include any contractual obligations to deliver cash or another financial asset, or to exchange financial instruments with another entity under potentially unfavourable conditions to the Scheme, and it is not a contract settled in the Schemes’ own equity instruments; and
> the total expected cash flows attributable to the puttable financial instrument over the life are based substantially on the profit or loss.
The Dimensional Global Value Trust, Dimensional Global Large Trust, Dimensional Global Small Trust and Dimensional Emerging Markets Trust satisfy all the above conditions. The remaining Schemes have multiple classes of units where the features are not identical. Therefore, they do not satisfy all of the above conditions and thus the units are classified as financial liabilities.
DIMENSIONAL TRUSTSNotes to the Financial Statements for the year ended 30 June 2019
26 Annual Report 2019

2. Summary of significant accounting policies (continued)
(e) Investment incomeInterest income is recognised in the Statement of Comprehensive Income for all financial instruments that are at amortised cost on a time-proportionate basis using the effective interest method.
Interest income on financial assets measured at fair value through profit or loss is included in the net gains/ (losses) on financial instruments. Other changes in fair value for such instruments are recorded in accordance with the policies described in Note 2(b) to the Financial Statements.
Dividend income is recognised on the ex-dividend date inclusive of any related foreign withholding tax.
Trust distributions are recognised on an entitlements basis.
(f) ExpensesAll expenses, including Responsible Entity fees and custodian fees, are recognised in the Statements of Comprehensive Income on an accruals basis.
(g) Cash and cash equivalentsFor the purpose of presentation in the Statements of Cash Flows, cash and cash equivalents include deposits at call which are readily convertible to cash on hand and are subject to an insignificant risk of changes in value, and bank overdrafts.
Overdrafts are presented as liabilities in the Statements of Financial Position.
(h) Deposits with brokersMargin accounts comprise cash held as collateral for derivative transactions and short sales. The cash is held by the broker and is only available to meet margin calls.
(i) Income taxUnder current legislation, the Schemes are not subject to income tax provided they attribute the entirety of their taxable income to their unitholders.
The benefits of imputation credits and foreign tax paid are passed on to unitholders. The Schemes currently incur withholding tax imposed by certain countries on investment income. Such income is recorded net of withholding tax in the Statements of Comprehensive Income.
(j) DistributionsDistributions are payable as set out in the Schemes’ Constitutions and offering documents, at the end of December and June each year for all Schemes except the Dimensional Global Real Estate Trust which is payable at the end of September, December, March and June.
Distributions in the current period are recognised in the Statements of Comprehensive Income as finance costs attributable to unitholders with the exception of Dimensional Global Value Trust, Dimensional Global Large Trust, Dimensional Global Small Trust and Dimensional Emerging Markets Trust which are recognised in the Statements of Changes in Equity.
(k) Increase/decrease in net assets attributable to unitholdersIncome not distributed is included in net assets attributable to unitholders. Where the Scheme’s units are classified as liabilities, movements in net assets attributable to unitholders are recognised in the Statements of Comprehensive Income as finance costs.
DIMENSIONAL TRUSTSNotes to the Financial Statements for the year ended 30 June 2019
27Annual Report 2019

2. Summary of significant accounting policies (continued)
(l) Due from/to brokersAmounts due from/to brokers represent receivables for securities sold and payables for securities purchased that have been contracted for but not yet delivered by the end of the year. Trades are recorded on trade date, and for equities normally settled within three business days. A provision for impairment of amounts due from brokers is established when there is objective evidence that the Schemes will not be able to collect all amounts due from the relevant broker. Indicators that the amount due from brokers is impaired include significant financial difficulties of the broker, probability that the broker will enter bankruptcy or financial reorganisation and default in payments.
(m) ReceivablesReceivables may include amounts for dividends, trust distributions, interest and securities sold where settlement has not yet occurred. Dividends and trust distributions are accrued when the right to receive payment is established. Interest is accrued at the end of each reporting period from the time of last payment. Amounts are generally received within 30 days of being recorded as receivables.
(n) PayablesPayables represent liabilities and accrued expenses for amounts owing by the Schemes at year end which are unpaid. The amounts are unsecured and are usually paid within 30 days of recognition. Trades are recorded on trade date and normally settled within three business days. Purchases of securities and investments that are unsettled at reporting date are included in payables. The distributions payable to unitholders as at the end of each reporting period is recognised separately in the Statements of Financial Position, where these amounts remain unpaid as at the end of the reporting period.
(o) Applications and redemptionsApplications received for units in the Schemes are recorded net of any Transaction Cost Allowance payable before the issue of units in the Schemes. Redemptions from the Schemes are recorded gross of any Transaction Cost Allowance payable after the cancellation of units redeemed. Unit redemption prices are determined by reference to the net assets of the Schemes, divided by the number of units on issue at or immediately before close of business each day less any Transaction Cost Allowance.
(p) Goods and Services Tax (GST)The GST incurred on the cost of various services provided to the Responsible Entity by third parties, such as audit fees, custodial fees and other expenses of the Schemes, have been passed on to the Schemes. The Schemes qualify for reduced input-tax credits (RITCs) on certain fees and expenses, which have been recognised in the Statements of Comprehensive Income net of the amount of GST recoverable from the Australian Taxation Office (ATO). Accounts payable are inclusive of GST. The net amount of GST recoverable from the ATO is included in receivables in the Statements of Financial Position. Cash flows related to GST are included in the Statements of Cash Flows on a gross basis.
(q) Use of estimatesThe Schemes make estimates and assumptions that affect the reported amounts of assets and liabilities within the next financial year. Estimates are continually evaluated and based on historical experience and other factors, including expectations of future events that are believed to be reasonable in the circumstances.
Quoted market prices are readily available for most of the Schemes’ financial instruments. However, certain financial instruments, for example, over-the-counter derivatives or unquoted securities, are fair valued using valuation techniques. Where valuation techniques (for example, pricing models) are used to determine fair values, they are validated and periodically reviewed by experienced personnel of the Responsible Entity, independent of the area that created them.
DIMENSIONAL TRUSTSNotes to the Financial Statements for the year ended 30 June 2019
28 Annual Report 2019

2. Summary of significant accounting policies (continued)
(q) Use of estimates (continued)Models use observable data to the extent practicable. However, areas such as credit risk (both own and counterparty), volatilities and correlations require management to make estimates. Changes in assumptions about these factors could affect the reported fair value of financial instruments. For certain other financial instruments, including amounts due from/to brokers and payables, the carrying amounts approximate fair value due to the short-term nature of these financial instruments.
(r) Rounding of amountsThe Schemes are an entity of a kind referred to in ASIC Corporations (Rounding in Financial/Directors’ Reports) Instrument 2016/191 relating to the “rounding off” of amounts in the Financial Statements. Amounts in the Financial Statements have been rounded to the nearest thousand dollars, unless otherwise indicated.
(s) Foreign currency transactions and translation(i) Functional and presentation currency
Items included in the Schemes’ Financial Statements are measured using the currency of the primary economic environment in which they operate (the ‘functional currency’). This is the Australian dollar, reflecting the currency of the economy in which the Schemes compete for funds and are regulated. The Australian dollar is also the Schemes’ presentation currency.
(ii) Transactions and balances
Foreign currency transactions are translated into the functional currency using the exchange rates prevailing at the dates of the transactions. Foreign-exchange gains and losses resulting from the settlement of such transactions and from the translations at year-end exchange rates of monetary assets and liabilities denominated in foreign currencies are recognised in the Statements of Comprehensive Income.
Non-monetary items that are measured at fair value in a foreign currency are translated using the exchange rates at the date when fair value was determined. Translation differences on assets and liabilities carried at fair value are reported in the Statement of Comprehensive Income on a net basis within net gains/ (losses) on financial instruments at fair value through profit or loss.
DIMENSIONAL TRUSTSNotes to the Financial Statements for the year ended 30 June 2019
29Annual Report 2019

3. Financial assets at fair value through profit or loss
Dimensional Global Core Equity Trust
Dimensional Global Sustainability Trust
Dimensional Global Real Estate Trust
30 June 2019 30 June 2018 30 June 2019 30 June 2018 30 June 2019 30 June 2018$’000 $’000 $’000 $’000 $’000 $’000
Financial assets at fair value through profit or loss
Derivatives
International share price index futures 125 – – – – –
Forward currency contracts 21,265 387 2,079 15 689 –
Total derivatives 21,390 387 2,079 15 689 –
Listed securities
International listed equity 3,832,176 3,295,634 216,538 136,734 1,867 10,002
Units in listed Australian property trust – – – – 108,548 87,620
Units in listed international unit trusts 121,145 101,183 5,679 2,880 529,601 431,778
Total listed securities 3,953,321 3,396,817 222,217 139,614 640,016 529,400
Total financial assets at fair value through profit or loss 3,974,711 3,397,204 224,296 139,629 640,705 529,400
The Schemes’ investments in equity securities were previously designated at fair value through profit or loss and derivatives were held for trading. On adoption of AASB 9, all above instruments are mandatorily classified as fair value through profit or loss.
An overview of the risk exposures relating to financial assets at fair value through profit or loss is included in Note 12.
DIMENSIONAL TRUSTSNotes to the Financial Statements for the year ended 30 June 2019
30 Annual Report 2019

3. Financial assets at fair value through profit or loss (continued)
Dimensional Global Value Trust
Dimensional Global Large Company Trust
Dimensional Global Small Company Trust
Dimensional Emerging Markets Trust
30 June 2019 30 June 2018 30 June 2019 30 June 2018 30 June 2019 30 June 2018 30 June 2019 30 June 2018$’000 $’000 $’000 $’000 $’000 $’000 $’000 $’000
Financial assets at fair value through profit or loss
Derivatives
International share price index futures – – – – 67 – 54 –
Warrants – – – – – – – 4
Total derivatives – – – – 67 – 54 4
Listed securities
International listed equity 486,193 529,218 145,838 143,123 418,931 333,763 593,882 499,568
Units in listed international unit trusts – – 55 44 814 720 4,050 3,705
Total listed securities 486,193 529,218 145,893 143,167 419,745 334,483 597,932 503,273
Total financial assets at fair value through profit or loss 486,193 529,218 145,893 143,167 419,812 334,483 597,986 503,277
The Schemes’ investments in equity securities were previously designated at fair value through profit or loss and derivatives were held for trading. On adoption of AASB 9, all above instruments are mandatorily classified as fair value through profit or loss.
An overview of the risk exposures relating to financial assets at fair value through profit or loss is included in Note 12.
DIMENSIONAL TRUSTSNotes to the Financial Statements for the year ended 30 June 2019
31Annual Report 2019

3. Financial assets at fair value through profit or loss (continued)The Schemes have entered into a securities lending arrangement with Citigroup. In accordance with the terms of the securities lending arrangement, the securities lent continue to be disclosed in the Statements of Financial Position of the Schemes, while the respective collateral received from counterparties is not included in the Statements of Financial Position.
The value of securities lent to the counterparty and the respective collateral received are set out in the following tables.
Dimensional Global Core Equity Trust Dimensional Global Sustainability Trust
Fair-value Collateral value Fair-value Collateral value
30 June 2019 30 June 2018 30 June 2019 30 June 2018 30 June 2019 30 June 2018 30 June 2019 30 June 2018
$’000 $’000 $’000 $’000 $’000 $’000 $’000 $’000
98,538 159,474 105,436 186,533 512 2,899 680 3,339
Dimensional Global Real Estate Trust Dimensional Global Value Trust
Fair-value Collateral value Fair-value Collateral value
30 June 2019 30 June 2018 30 June 2019 30 June 2018 30 June 2019 30 June 2018 30 June 2019 30 June 2018
$’000 $’000 $’000 $’000 $’000 $’000 $’000 $’000
11,707 16,187 12,449 19,193 2,948 22,296 3,132 26,247
Dimensional Global Large Company Trust Dimensional Global Small Company Trust
Fair-value Collateral value Fair-value Collateral value
30 June 2019 30 June 2018 30 June 2019 30 June 2018 30 June 2019 30 June 2018 30 June 2019 30 June 2018
$’000 $’000 $’000 $’000 $’000 $’000 $’000 $’000
997 3,507 1,070 4,115 26,862 27,603 28,846 32,892
Dimensional Emerging Markets Trust
Fair-value Collateral value
30 June 2019 30 June 2018 30 June 2019 30 June 2018
$’000 $’000 $’000 $’000
11,409 17,459 12,130 19,779
DIMENSIONAL TRUSTSNotes to the Financial Statements for the year ended 30 June 2019
32 Annual Report 2019

4. Financial liabilities at fair value through profit or loss
Dimensional Global Core Equity Trust
Dimensional Global Sustainability Trust
Dimensional Global Real Estate Trust
Dimensional Global Value Trust
30 June 2019 30 June 2018 30 June 2019 30 June 2018 30 June 2019 30 June 2018 30 June 2019 30 June 2018$’000 $’000 $’000 $’000 $’000 $’000 $’000 $’000
Financial liabilities at fair value through profit or loss
International share price index futures – – – – – – 30 –
Forward currency contracts 276 32,542 58 2,184 11 714 – –
Total financial liabilities at fair value through profit or loss 276 32,542 58 2,184 11 714 30 –
Dimensional Global Large Company Trust
Dimensional Global Small Company Trust
Dimensional Emerging Markets Trust
30 June 2019 30 June 2018 30 June 2019 30 June 2018 30 June 2019 30 June 2018$’000 $’000 $’000 $’000 $’000 $’000
Financial liabilities at fair value through profit or loss
Total financial liabilities at fair value through profit or loss – – – – – –
The Schemes’ investments in derivatives were previously held for trading. On adoption of AASB 9, all above investments are mandatorily classified as fair value through profit or loss.
An overview of the risk exposures relating to financial liabilities at fair value through profit or loss is included in Note 12.
DIMENSIONAL TRUSTSNotes to the Financial Statements for the year ended 30 June 2019
33Annual Report 2019

5. Offsetting financial assets and financial liabilitiesFinancial assets and liabilities are offset and the net amount reported in the Statement of Financial Position when there is a legally enforceable right to offset the recognised amounts and there is an intention to settle on a net basis or realise the asset and settle the liability simultaneously. The gross and net positions of financial assets and liabilities that have been offset in the Statement of Financial Position are disclosed in the first three columns of the tables below.
Dimensional Global Core Equity Trust
Financial assetsGross amounts of
financial assetsGross amounts set off in
the balance sheet
Net amount of financial assets presented in the
balance sheet
Amounts subject to master netting
arrangements Net amount
2019 $’000 $’000 $’000 $’000 $’000
Derivative financial instruments 21,265 – 21,265 (275) 20,990
Total 21,265 – 21,265 (275) 20,990
2018
Derivative financial instruments 387 – 387 (368) 19
Total 387 – 387 (368) 19
Dimensional Global Core Equity Trust
Financial liabilitiesGross amounts of financial liabilities
Gross amounts set off in the balance sheet
Net amount of financial liabilities presented in the
balance sheet
Amounts subject to master netting
arrangements Net amount
2019 $’000 $’000 $’000 $’000 $’000
Derivative financial instruments 275 – 275 (275) –
Total 275 – 275 (275) –
2018
Derivative financial instruments 32,542 – 32,542 (368) 32,174
Total 32,542 – 32,542 (368) 32,174
DIMENSIONAL TRUSTSNotes to the Financial Statements for the year ended 30 June 2019
34 Annual Report 2019

5. Offsetting financial assets and financial liabilities (continued)
Dimensional Global Sustainability Trust
Financial assetsGross amounts of
financial assetsGross amounts set off
in the balance sheet
Net amount of financial assets presented in the
balance sheet
Amounts subject to master netting
arrangements Net amount
2019 $’000 $’000 $’000 $’000 $’000
Derivative financial instruments 2,079 – 2,079 (58) 2,022
Total 2,079 – 2,079 (58) 2,022
2018
Derivative financial instruments 15 – 15 (15) –
Total 15 – 15 (15) –
Dimensional Global Sustainability Trust
Financial liabilitiesGross amounts of financial liabilities
Gross amounts set off in the balance sheet
Net amount of financial liabilities presented in
the balance sheet
Amounts subject to master netting
arrangements Net amount
2019 $’000 $’000 $’000 $’000 $’000
Derivative financial instruments 58 – 58 (58) –
Total 58 – 58 (58) –
2018
Derivative financial instruments 2,184 – 2,184 (15) 2,169
Total 2,184 – 2,184 (15) 2,169
DIMENSIONAL TRUSTSNotes to the Financial Statements for the year ended 30 June 2019
35Annual Report 2019

5. Offsetting financial assets and financial liabilities (continued)
Dimensional Global Real Estate Trust
Financial assetsGross amounts of
financial assetsGross amounts set off
in the balance sheet
Net amount of financial assets presented in the
balance sheet
Amounts subject to master netting
arrangements Net amount
2019 $’000 $’000 $’000 $’000 $’000
Derivative financial instruments 689 – 689 (11) 678
Total 689 – 689 (11) 678
2018
Derivative financial instruments – – – – –
Total – – – – –
Dimensional Global Real Estate Trust
Financial liabilitiesGross amounts of financial liabilities
Gross amounts set off in the balance sheet
Net amount of financial liabilities presented in
the balance sheet
Amounts subject to master netting
arrangements Net amount
2019 $’000 $’000 $’000 $’000 $’000
Derivative financial instruments 11 – 11 (11) –
Total 11 – 11 (11) –
2018
Derivative financial instruments 714 – 714 – 714
Total 714 – 714 – 714
DIMENSIONAL TRUSTSNotes to the Financial Statements for the year ended 30 June 2019
36 Annual Report 2019

6. Net gains/(losses) on financial instruments at fair value through profit or lossNet gains/(losses) recognised in relation to financial assets and financial liabilities at fair value through profit or loss:
Dimensional Global Core Equity Trust
Dimensional Global Sustainability Trust
Dimensional Global Real Estate Trust
30 June 2019 30 June 2018 30 June 2019 30 June 2018 30 June 2019 30 June 2018$’000 $’000 $’000 $’000 $’000 $’000
Financial assets
Net gain/(loss) on financial assets at fair value through profit or loss 388,935 592,300 35,946 25,487 84,631 33,777
Total net gain/(loss) on financial assets at fair value through profit or loss 388,935 592,300 35,946 25,487 84,631 33,777
Financial liabilities
Net gain/(loss) on financial liabilities at fair value through profit or loss (250,317) (293,054) (20,047) (18,304) (6,629) (7,020)
Total net gain/(loss) on financial liabilities at fair value through profit or loss (250,317) (293,054) (20,047) (18,304) (6,629) (7,020)
Total net gain/(loss) on financial instruments at fair value through profit or loss 138,618 299,246 15,899 7,183 78,002 26,757
Dimensional Global Value Trust
Dimensional Global Large Company Trust
30 June 2019 30 June 2018 30 June 2019 30 June 2018$’000 $’000 $’000 $’000
Financial assets
Net gain/(loss) on financial assets at fair value through profit or loss 10,247 80,985 12,307 18,086
Total net gain/(loss) on financial assets at fair value through profit or loss 10,247 80,985 12,307 18,086
Financial liabilities
Net gain/(loss) on financial liabilities at fair value through profit or loss (445) (383) (39) (38)
Total net gain/(loss) on financial liabilities at fair value through profit or loss (445) (383) (39) (38)
Total net gain/(loss) on financial instruments at fair value through profit or loss 9,802 80,602 12,268 18,048
DIMENSIONAL TRUSTSNotes to the Financial Statements for the year ended 30 June 2019
37Annual Report 2019

6. Net gains/(losses) on financial instruments at fair value through profit or loss (continued)Net gains/(losses) recognised in relation to financial assets and financial liabilities at fair value through profit or loss:
Dimensional Global Small Company Trust
Dimensional Emerging Markets Trust
30 June 2019 30 June 2018 30 June 2019 30 June 2018$’000 $’000 $’000 $’000
Financial assets
Net gain/(loss) on financial assets at fair value through profit or loss 583 45,759 28,945 36,738
Total net gain/(loss) on financial assets at fair value through profit or loss 583 45,759 28,945 36,738
Financial liabilities
Net gain/(loss) on financial liabilities at fair value through profit or loss (271) (116) (585) (236)
Total net gain/(loss) on financial liabilities at fair value through profit or loss (271) (116) (585) (236)
Total net gain/(loss) on financial instruments at fair value through profit or loss 312 45,643 28,360 36,502
7. Net assets attributable to unitholdersUnder AASB 132 Financial instruments: Presentation, puttable financial instruments are classified as equity where certain strict criteria are met. The Dimensional Global Value Trust, Dimensional Global Large Company Trust, Dimensional Global Small Company Trust and Dimensional Emerging Markets Trust classifies their net assets attributable to unitholders as equity as it satisfies all the criteria. However, the remaining Schemes haves multiple classes of units where the features are not identical, they do not satisfy all the conditions and thus the units are classified as financial liabilities.
DIMENSIONAL TRUSTSNotes to the Financial Statements for the year ended 30 June 2019
38 Annual Report 2019

7. Net assets attributable to unitholders (continued)Movements in the number of units and net assets attributable to unitholders during the year are presented as follows:
Global Core Equity Trust Global Core Equity Trust
AUD Unhedged Class AUD Hedged Class30 June 2019 30 June 2018 30 June 2019 30 June 2018 30 June 2019 30 June 2018 30 June 2019 30 June 2018
Units’000 Units’000 $’000 $’000 Units’000 Units’000 $’000 $’000
Opening balance 127,417 116,986 1,995,837 1,635,650 44,705 36,945 933,230 705,418
Applications 24,403 23,946 374,926 345,072 15,052 11,747 325,627 252,659
Redemptions (14,785) (13,684) (229,310) (198,350) (3,913) (4,039) (85,114) (86,869)
Units issued upon reinvestment of distributions 348 169 5,111 2,361 77 52 1,688 1,066
Increase/(decrease) in net assets attributable to unitholders 109,580 211,104 34,281 60,956
Closing balance 137,383 127,417 2,256,144 1,995,837 55,921 44,705 1,209,712 933,230
NZD Hedged Class30 June 2019 30 June 2018 30 June 2019 30 June 2018
Units’000 Units’000 $’000 $’000
Opening balance 25,002 20,597 452,069 343,492
Applications 6,636 6,665 127,409 121,712
Redemptions (3,320) (2,335) (64,336) (43,564)
Units issued upon reinvestment of distributions – 75 – 1,331
Increase/(decrease) in net assets attributable to unitholders 15,560 29,098
Closing balance 28,318 25,002 530,702 452,069
New Zealand Dollar equivalent (NZD$) – – 554,485 493,332
DIMENSIONAL TRUSTSNotes to the Financial Statements for the year ended 30 June 2019
39Annual Report 2019

7. Net assets attributable to unitholders (continued)
Dimensional Global Sustainability Trust Dimensional Global Sustainability Trust
AUD Unhedged Class AUD Hedged Class30 June 2019 30 June 2018 30 June 2019 30 June 2018 30 June 2019 30 June 2018 30 June 2019 30 June 2018
Units’000 Units’000 $’000 $’000 Units’000 Units’000 $’000 $’000
Opening balance 3,672 1,635 47,595 18,780 2,221 1,034 27,349 11,432
Applications 2,995 2,323 39,299 27,225 2,079 1,245 27,232 15,654
Redemptions (294) (286) (3,853) (3,356) (196) (59) (2,578) (754)
Units issued upon reinvestment of distributions 3 – 39 6 – 1 – 9
Increase/(decrease) in net assets attributable to unitholders 10,870 4,940 2,665 1,008
Closing balance 6,376 3,672 93,950 47,595 4,104 2,221 54,668 27,349
NZD Hedged Class30 June 2019 30 June 2018 30 June 2019 30 June 2018
Units’000 Units’000 $’000 $’000
Opening balance 5,603 3,062 65,017 33,184
Applications 1,728 3,917 20,875 45,696
Redemptions (1,094) (1,413) (13,685) (16,558)
Units issued upon reinvestment of distributions – 37 – 408
Increase/(decrease) in net assets attributable to unitholders 4,219 2,287
Closing balance 6,237 5,603 76,426 65,017
New Zealand Dollar equivalent (NZD$) – – 79,852 70,952
DIMENSIONAL TRUSTSNotes to the Financial Statements for the year ended 30 June 2019
40 Annual Report 2019

7. Net assets attributable to unitholders (continued)
Dimensional Global Real Estate Trust Dimensional Global Real Estate Trust
AUD Unhedged Class NZD Hedged Class30 June 2019 30 June 2018 30 June 2019 30 June 2018 30 June 2019 30 June 2018 30 June 2019 30 June 2018
Units’000 Units’000 $’000 $’000 Units’000 Units’000 $’000 $’000
Opening balance 52,448 45,083 497,693 402,305 3,132 1,627 32,110 15,266
Applications 10,630 12,314 106,293 109,662 1,039 1,945 11,389 19,391
Redemptions (7,936) (5,039) (80,795) (44,810) (638) (440) (7,283) (4,359)
Units issued upon reinvestment of distributions 199 90 1,974 803 1 – 5 –
Increase/(decrease) in net assets attributable to unitholders – – 75,606 29,733 – – 5,344 1,812
Closing balance 55,341 52,448 600,771 497,693 3,534 3,132 41,565 32,110
New Zealand Dollar equivalent (NZD$) 43,427 35,040
DIMENSIONAL TRUSTSNotes to the Financial Statements for the year ended 30 June 2019
41Annual Report 2019

7. Net assets attributable to unitholders (continued)
Dimensional Global Value Trust Dimensional Global Large Company Trust30 June 2019 30 June 2018 30 June 2019 30 June 2018 30 June 2019 30 June 2018 30 June 2019 30 June 2018
Units’000 Units’000 $’000 $’000 Units’000 Units’000 $’000 $’000
Opening balance 28,972 45,426 501,360 744,372 11,293 11,695 142,696 130,009
Applications 6,334 6,328 110,239 112,516 973 1,492 12,650 17,578
Redemptions (6,634) (23,181) (112,784) (343,513) (1,632) (1,898) (21,398) (22,974)
Units issued upon reinvestment of distributions 146 399 2,502 6,795 7 4 88 47
Distribution paid and payable – – (33,220) (112,123) – – (2,636) (2,440)
Profit/(loss) for the year – – 21,472 93,313 – – 14,839 20,476
Closing balance 28,818 28,972 489,569 501,360 10,641 11,293 146,239 142,696
Dimensional Global Small Company Trust Dimensional Emerging Markets Trust30 June 2019 30 June 2018 30 June 2019 30 June 2018 30 June 2019 30 June 2018 30 June 2019 30 June 2018
Units’000 Units’000 $’000 $’000 Units’000 Units’000 $’000 $’000
Opening balance 13,785 12,928 334,267 270,173 27,314 26,563 489,557 455,234
Applications 5,160 2,590 122,788 58,232 7,560 5,055 139,046 94,810
Redemptions (1,431) (1,759) (34,044) (40,091) (2,888) (4,434) (52,951) (83,697)
Units issued upon reinvestment of distributions 39 26 896 566 245 130 4,363 2,322
Distribution paid and payable – – (6,569) (3,435) – – (18,075) (25,669)
Profit/(loss) for the year – – 4,417 48,822 – – 40,700 46,557
Closing balance 17,553 13,785 421,755 334,267 32,231 27,314 602,640 489,557
As stipulated in the Schemes’ Constitutions, each unit represents an equal part of the net asset value of the Schemes (based on the market value of the portfolio of investments of the Schemes) and does not extend to a right to the underlying assets of the Schemes. Capital risk management is included in Note 12.
DIMENSIONAL TRUSTSNotes to the Financial Statements for the year ended 30 June 2019
42 Annual Report 2019

8. Auditor’s remuneration
Dimensional Global Core Equity Trust
Dimensional Global Sustainability Trust
Dimensional Global Real Estate Trust
Dimensional Global Value Trust
30 June 2019 30 June 2018 30 June 2019 30 June 2018 30 June 2019 30 June 2018 30 June 2019 30 June 2018$ $ $ $ $ $ $ $
Auditing the financial report 18,025 17,500 9,270 9,000 12,875 12,500 11,845 11,500
Other non-audit services 18,652 22,146 18,652 22,146 13,499 16,577 8,346 8,873
Total auditor's remuneration 36,677 39,646 27,922 31,146 26,374 29,077 20,191 20,373
Dimensional Global Large Company Trust
Dimensional Global Small Company Trust
Dimensional Emerging Markets Trust
30 June 2019 30 June 2018 30 June 2019 30 June 2018 30 June 2019 30 June 2018$ $ $ $ $ $
Auditing the financial report 11,845 11,500 11,845 11,500 11,845 11,500
Other non-audit services 8,346 8,873 8,346 8,873 8,346 9,855
Total auditor's remuneration 20,191 20,373 20,191 20,373 20,191 21,355
The auditor of the Schemes is PricewaterhouseCoopers.
The auditor’s remuneration for auditing Financial Statements and other non-audit services was paid by the Responsible Entity. Other non-audit services include taxation services.
DIMENSIONAL TRUSTSNotes to the Financial Statements for the year ended 30 June 2019
43Annual Report 2019

9. Distributions payable
Dimensional Global Core Equity Trust
Unhedged Class AUD Hedged Class
30 June 2019 30 June 2018 30 June 2019 30 June 2018 30 June 2019 30 June 2018 30 June 2019 30 June 2018$’000 $’000 c/unit c/unit $’000 $’000 c/unit c/unit
Opening balance 29,973 14,953 23.52 12.78 9,179 5,993 20.53 16.22
Additional provisions for distributions recognised 45,647 41,407 33.53 32.77 73 10,286 0.13 23.21
Reductions arising from payments:
June (29,973) (14,953) (23.52) (12.78) (9,179) (5,993) (20.53) (16.22)
December (13,880) (11,434) (10.41) (9.25) – (1,107) – (2.68)
Closing balance as at 30 June 31,767 29,973 23.12 23.52 73 9,179 0.13 20.53
NZD Hedged Class
30 June 2019 30 June 2018 30 June 2019 30 June 2018$’000 $’000 c/unit c/unit
Opening balance – 22,910 – 111.23
Additional provisions for distributions recognised 2 – 0.01 –
Reductions arising from payments:
June – (22,910) – (111.23)
December – – – –
Closing balance as at 30 June 2 – 0.01 –
DIMENSIONAL TRUSTSNotes to the Financial Statements for the year ended 30 June 2019
44 Annual Report 2019

9. Distributions payable (continued)
Dimensional Global Sustainability Trust
AUD Unhedged Class AUD Hedged Class
30 June 2019 30 June 2018 30 June 2019 30 June 2018 30 June 2019 30 June 2018 30 June 2019 30 June 2018$’000 $’000 c/unit c/unit $’000 $’000 c/unit c/unit
Opening balance 356 130 9.68 7.94 – 182 – 17.59
Additional provisions for distributions recognised 1,176 505 19.56 15.35 – – – –
Reductions arising from payments:
June (356) (130) (9.68) (7.94) – (182) – (17.59)
December (341) (149) (6.47) (5.67) – – – –
Closing balance as at 30 June 835 356 13.09 9.68 – – – –
NZD Hedged Class
30 June 2019 30 June 2018 30 June 2019 30 June 2018$’000 $’000 c/unit c/unit
Opening balance – 651 – 21.26
Additional provisions for distributions recognised – – – –
Reductions arising from payments:
June – (651) – (21.26)
December – – – –
Closing balance as at 30 June – – – –
DIMENSIONAL TRUSTSNotes to the Financial Statements for the year ended 30 June 2019
45Annual Report 2019

9. Distributions payable (continued)
Dimensional Global Real Estate Trust
AUD Unhedged Class NZD Hedged Class
30 June 2019 30 June 2018 30 June 2019 30 June 2018 30 June 2019 30 June 2018 30 June 2019 30 June 2018$’000 $’000 c/unit c/unit $’000 $’000 c/unit c/unit
Opening balance 4,945 955 9.43 2.12 – 351 – 21.58
Additional provisions for distributions recognised 16,449 12,673 29.82 25.01 645 104 17.38 3.46
Reductions arising from payments:
June (4,945) (955) (9.43) (2.12) – (351) – (21.58)
September (2,296) (2,083) (4.30) (4.36) – – – –
December (2,630) (2,848) (4.75) (5.74) (199) – (5.47) –
March (6,005) (2,797) (10.80) (5.48) (446) (104) (11.91) (3.46)
Closing balance as at 30 June 5,518 4,945 9.97 9.43 – – – –
Dimensional Global Value Trust Dimensional Global Large Company Trust
30 June 2019 30 June 2018 30 June 2019 30 June 2018 30 June 2019 30 June 2018 30 June 2019 30 June 2018$’000 $’000 c/unit c/unit $’000 $’000 c/unit c/unit
Opening balance 34,573 8,282 119.33 18.23 1,436 1,334 12.71 11.41
Additional provisions for distributions recognised 33,220 112,123 101.70 133.65 2,636 2,440 24.53 21.21
Withdrawal Entitlement (3,639) (70,974) – –
Reductions arising from payments:
June (34,573) (8,282) (119.33) (18.23) (1,436) (1,334) (12.71) (11.41)
December (4,299) (6,576) (13.97) (14.32) (1,029) (1,004) (9.42) (8.50)
Closing balance as at 30 June 25,282 34,573 87.73 119.33 1,607 1,436 15.11 12.71
DIMENSIONAL TRUSTSNotes to the Financial Statements for the year ended 30 June 2019
46 Annual Report 2019

9. Distributions payable (continued)
Dimensional Global Small Company Trust Dimensional Emerging Markets Trust
30 June 2019 30 June 2018 30 June 2019 30 June 2018 30 June 2019 30 June 2018 30 June 2019 30 June 2018$’000 $’000 c/unit c/unit $’000 $’000 c/unit c/unit
Opening balance 2,282 1,447 16.56 11.19 18,570 10,399 67.99 39.15
Additional provisions for distributions recognised 6,569 3,435 38.93 24.94 18,075 25,669 58.14 94.21
Reductions arising from payments:
June (2,282) (1,447) (16.56) (11.19) (18,570) (10,399) (67.99) (39.15)
December (1,364) (1,153) (9.27) (8.38) (8,208) (7,099) (27.53) (26.22)
Closing balance as at 30 June 5,205 2,282 29.66 16.56 9,867 18,570 30.61 67.99
DIMENSIONAL TRUSTSNotes to the Financial Statements for the year ended 30 June 2019
47Annual Report 2019

10. Cash and cash equivalents(a) Reconciliation of profit/(loss) to net cash inflows/(outflows) from operating activities
Dimensional Global Core Equity Trust
Dimensional Global Sustainability Trust
Dimensional Global Real Estate Trust
30 June 2019 30 June 2018 30 June 2019 30 June 2018 30 June 2019 30 June 2018$’000 $’000 $’000 $’000 $’000 $’000
Operating profit/(loss) 205,143 352,851 18,930 8,740 98,044 44,322
Proceeds from sale of financial instruments at fair value through profit or loss 484,461 436,175 26,061 32,876 33,415 19,288
Purchase of financial instruments at fair value through profit or loss (941,937) (860,047) (106,075) (99,554) (71,259) (108,460)
Net (gains)/losses on financial instruments at fair value through profit or loss (138,618) (299,246) (15,899) (7,183) (78,002) (26,757)
Change in:
Receivables (883) (2,566) (161) (141) (587) (842)
Creditors and accruals 567 369 78 52 110 34
Net cash provided by operating activities (391,267) (372,464) (77,066) (65,210) (18,279) (72,415)
DIMENSIONAL TRUSTSNotes to the Financial Statements for the year ended 30 June 2019
48 Annual Report 2019

10. Cash and cash equivalents (continued)(a) Reconciliation of profit/(loss) to net cash inflows/(outflows) from operating activities (continued)
Dimensional Global Value Trust
Dimensional Global Large Company Trust
Dimensional Global Small Company Trust
Dimensional Emerging Markets Trust
30 June 2019 30 June 2018 30 June 2019 30 June 2018 30 June 2019 30 June 2018 30 June 2019 30 June 2018$’000 $’000 $’000 $’000 $’000 $’000 $’000 $’000
Operating profit/(loss) 21,472 93,313 14,839 20,476 4,417 48,822 40,700 46,557
Proceeds from sale of financial instruments at fair value through profit or loss 143,298 491,797 15,219 15,162 57,642 51,021 63,582 64,931
Purchase of financial instruments at fair value through profit or loss (95,680) (194,795) (6,799) (9,966) (142,071) (70,264) (129,533) (70,401)
Net (gains)/losses on financial instruments at fair value through profit or loss (9,802) (80,602) (12,268) (18,048) (312) (45,643) (28,360) (36,502)
Change in:
Receivables 106 (323) (5) (91) (169) (164) (528) 302
Creditors and accruals 56 (22) 5 7 128 61 438 96
Net cash provided by operating activities 59,450 309,368 10,991 7,540 (80,365) (16,167) (53,701) 4,983
DIMENSIONAL TRUSTSNotes to the Financial Statements for the year ended 30 June 2019
49Annual Report 2019

10. Cash and cash equivalents (continued)(b) Non-cash financing and investing activitiesDuring the year, income distributions that were reinvested by unitholders for additional units in the Schemes are presented below.
Dimensional Global Core Equity Trust
Dimensional Global Sustainability Trust
Dimensional Global Real Estate Trust
Dimensional Global Value Trust
30 June 2019 30 June 2018 30 June 2019 30 June 2018 30 June 2019 30 June 2018 30 June 2019 30 June 2018$’000 $’000 $’000 $’000 $’000 $’000 $’000 $’000
Distributions reinvested 6,799 4,758 39 423 1,979 803 2,502 6,795
Dimensional Global Large Company Trust
Dimensional Global Small Company Trust
Dimensional Emerging Markets Trust
30 June 2019 30 June 2018 30 June 2019 30 June 2018 30 June 2019 30 June 2018$’000 $’000 $’000 $’000 $’000 $’000
Distributions reinvested 88 47 896 566 4,363 2,322
DIMENSIONAL TRUSTSNotes to the Financial Statements for the year ended 30 June 2019
50 Annual Report 2019

11. Related party transactions
(a) Responsible Entity and Investment ManagerThe Responsible Entity of the Schemes is DFA Australia Limited (ABN 46 065 937 671). DFA Australia Limited is a subsidiary of Dimensional Fund Advisors LP (incorporated in the United States of America).
DFA Australia Limited also acts as the Investment Manager of the Schemes.
(b) Key management personnelThe names of each person considered to be key management personnel of the Responsible Entity at any time during the financial year were:B.P. Singh M.S. Gilliland (resigned 31 July 2018) J.G. Crane N.A.D. StewartC.L. Newell S.A. Clark D.P. Butler G.K. O’Reilly
(c) Key management personnel compensationNo payments were made from the Schemes directly to the key management personnel of the Responsible Entity. Key management personnel are paid by the Responsible Entity.
(d) Related party unitholdingsThe below related party unitholdings include units held by individuals and entities associated with key management personnel, DFA Australia Limited and other Dimensional Trusts.
Fair Value Holding Acquired Disposals
Distribution Paid and Payable
Number of Units
Held2019 2018 2019 2018 2019 2018 2019 2018 2019 2018 2019 2018
$ $ % % Units Units Units Units $ $ Units UnitsDimensional Emerging Markets Trust 67,566,773 40,890,443 11.04 8.05 1,375,731 726,901 (14,644) (24,037) 1,865,725 1,974,906 3,565,413 2,204,326Dimensional Global Core Equity Trust 509,498,443 308,550,883 12.71 9.04 10,653,592 5,820,877 (414,490) (97,326) 5,038,344 4,726,351 27,264,455 17,025,352Dimensional Global Large Company Trust 388,035 528,800 0.26 0.37 – – (13,894) – 6,856 8,330 27,954 41,848Dimensional Global Real Estate Trust 70,851,347 39,831,112 10.95 7.45 2,448,609 1,347,497 (128,679) (85,889) 1,722,345 951,622 6,484,893 4,164,963Dimensional Global Small Company Trust 352,031 519,852 0.08 0.15 74 54 (7,022) (4) 5,638 4,209 14,491 21,439Dimensional Global Sustainability Trust 2,856,413 2,572,314 1.28 1.83 18,997 5,307 (14,925) – 20,452 18,151 206,328 202,257Dimensional Global Value Trust 495,663 513,382 0.10 0.10 2,000 1,101 (2,684) (28) 28,181 29,802 27,772 28,455
Apart from those details disclosed in this note, no key management personnel have entered into a contract with the Schemes during the financial year and there were no material contracts involving key management personnel’s interests existing at year end.
DIMENSIONAL TRUSTSNotes to the Financial Statements for the year ended 30 June 2019
51Annual Report 2019
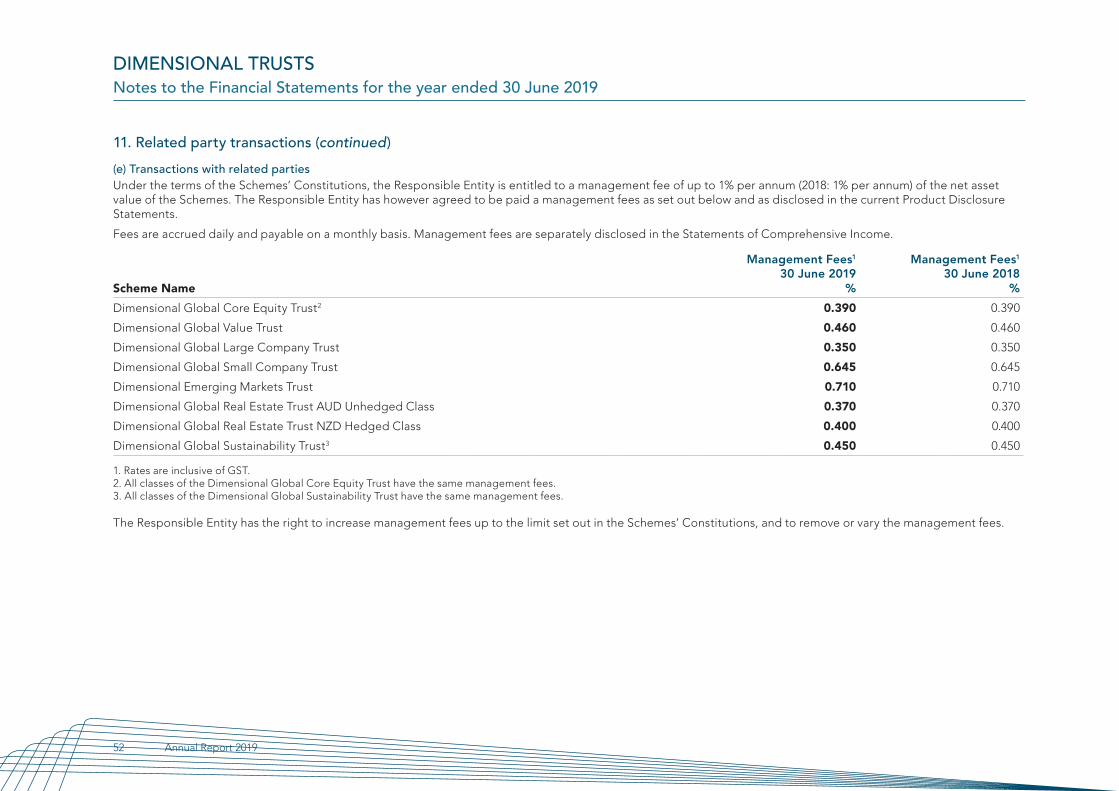
11. Related party transactions (continued)
(e) Transactions with related partiesUnder the terms of the Schemes’ Constitutions, the Responsible Entity is entitled to a management fee of up to 1% per annum (2018: 1% per annum) of the net asset value of the Schemes. The Responsible Entity has however agreed to be paid a management fees as set out below and as disclosed in the current Product Disclosure Statements.
Fees are accrued daily and payable on a monthly basis. Management fees are separately disclosed in the Statements of Comprehensive Income.
Management Fees1
30 June 2019Management Fees1
30 June 2018Scheme Name % %
Dimensional Global Core Equity Trust2 0.390 0.390
Dimensional Global Value Trust 0.460 0.460
Dimensional Global Large Company Trust 0.350 0.350
Dimensional Global Small Company Trust 0.645 0.645
Dimensional Emerging Markets Trust 0.710 0.710
Dimensional Global Real Estate Trust AUD Unhedged Class 0.370 0.370
Dimensional Global Real Estate Trust NZD Hedged Class 0.400 0.400
Dimensional Global Sustainability Trust3 0.450 0.450
1. Rates are inclusive of GST.2. All classes of the Dimensional Global Core Equity Trust have the same management fees.3. All classes of the Dimensional Global Sustainability Trust have the same management fees.
The Responsible Entity has the right to increase management fees up to the limit set out in the Schemes’ Constitutions, and to remove or vary the management fees.
DIMENSIONAL TRUSTSNotes to the Financial Statements for the year ended 30 June 2019
52 Annual Report 2019

11. Related party transactions (continued)
(e) Transactions with related parties (continued)The management fees paid/payable for the year end between the Trust and the Responsible Entity were as follows:
Dimensional Global CoreEquity Trust
Dimensional GlobalSustainability Trust
Dimensional Global RealEstate Trust
Dimensional GlobalValue Trust
30 June 2019 30 June 2018 30 June 2019 30 June 2018 30 June 2019 30 June 2018 30 June 2019 30 June 2018$ $ $ $ $ $ $ $
Management fees for the year earned by the Responsible Entity 14,101,102 12,050,654 820,057 443,345 2,172,731 1,783,101 2,393,379 3,125,689
Management fees payable to the Responsible Entity at the end of the reporting period 1,370,198 1,209,288 91,122 56,624 227,065 176,211 197,061 211,945
Dimensional Global Large Company Trust
Dimensional Global Small Company Trust
Dimensional Emerging Markets Trust
30 June 2019 30 June 2018 30 June 2019 30 June 2018 30 June 2019 30 June 2018$ $ $ $ $ $
Management fees for the year earned by the Responsible Entity 496,088 492,130 2,282,666 1,965,837 3,849,209 3,637,538
Management fees payable to the Responsible Entity at the end of the reporting period 42,608 43,497 224,520 189,057 354,800 318,658
(f) Investments in related partiesAmounts invested by the Schemes in other schemes managed by DFA Australia Limited are included in Note 11(d). The Schemes did not hold any investment in DFA Australia, its affiliates, or any other Schemes managed by DFA Australia Limited or its parent entity during the year (2018: nil).
No guarantees were provided or received for any related party transactions or balances.
DIMENSIONAL TRUSTSNotes to the Financial Statements for the year ended 30 June 2019
53Annual Report 2019

12. Financial risk management
(a) Significant accounting policiesDetails of significant accounting policies and methods adopted, including the criteria for recognition, the basis of measurement and the basis on which revenues and expenses are recognised, in respect of each class of financial asset, financial liability and equities instrument are disclosed in Note 2 to the Financial Statements.
(b) Significant terms and conditionsThe Schemes are exposed to a variety of financial risks as a result of their activities. These include market risk (including foreign exchange risk, interest rate risk and price risk), credit risk, liquidity risk and cash flow interest rate risk. The Schemes’ risk management and investment policies, approved by the Responsible Entity, seek to minimise potential adverse effects of these risks on the Schemes’ financial performance. These policies may include the use of certain financial derivative instruments.
The Responsible Entity manages the financial risks relating to the operations of the Schemes in accordance with the Schemes’ Constitutions and Product Disclosure Statements.
The Schemes do not enter into or trade derivative financial instruments for speculative purposes. The use of financial derivatives is governed by the Schemes’ investment policies, which provide written principles on the use of financial derivatives. These principles permit the use of derivatives to change the Schemes’ exposure to particular assets. Derivatives are not used to gear the Schemes and the Schemes’ effective market exposure will not exceed its market value. Compliance with policies and exposure limits are reviewed by the Responsible Entity on a continuous basis.
(c) Capital risk managementThe Schemes consider their net assets attributable to unitholders as capital. The amount of net assets attributable to unitholders can change significantly on a daily basis as the Schemes are subject to daily applications and redemptions.
The Responsible Entity manages cash levels to ensure there are sufficient cash resources to meet unitholder redemptions.
The Schemes have no restrictions or specific capital requirements for the application and redemption of units. The Schemes’ overall investment strategy remains unchanged from the previous year.
(d) Market riskMarket risk is the risk that the value of the Schemes’ investment portfolio will fluctuate as a result of changes in market prices. This risk is managed by ensuring that all activities are transacted in accordance with mandates, overall investment strategies and within approved limits. Market-risk analysis is conducted regularly on a total portfolio basis, which includes the effect of derivatives.
Derivative financial instruments
In the normal course of business the Schemes may enter into transactions in various derivative financial instruments which have certain risks. A derivative is a financial instrument or other contract which is settled at a future date the value of which changes in response to the change in a specified interest rate, financial instrument price, commodity price, foreign exchange rate, index of prices or rates, credit rating or credit index or other variable.
Derivative financial instruments require no initial net investment or an initial net investment that is smaller than would be required for other types of contracts that would be expected to have a similar response to changes in market factors.
DIMENSIONAL TRUSTSNotes to the Financial Statements for the year ended 30 June 2019
54 Annual Report 2019

12. Financial risk management (continued)(d) Market risk (continued)
Derivative financial instruments (continued)
Derivative transactions include many different instruments such as forwards, futures and options. Derivatives are considered to be part of the investment process and the use of derivatives is an essential part of the Schemes’ portfolio management. Derivatives are not managed in isolation. Consequently, the use of derivatives is multifaceted and includes:
> hedging to protect an asset or liability of the Schemes against a fluctuation in market values or to reduce volatility;
> a substitution for trading of physical securities; and
> adjusting asset exposures within the parameters set in the investment strategy, and adjusting the duration of fixed-interest portfolios or the weighted average maturity of cash portfolios.
Derivatives are not used to gear (leverage) a portfolio. Gearing a portfolio would occur if the level of exposure to the markets exceeded the underlying value of the Schemes.
The Schemes hold the following derivative instruments:
(i) Futures
Futures are contractual obligations to buy or sell financial instruments on a future date at a specified price established in an organised market. The futures contracts are collateralised by cash or marketable securities. Changes in futures contracts’ values are usually settled net daily with the exchange. Interest-rate futures are contractual obligations to receive or pay a net amount based on changes in interest rates at a future date at a specified price, established in an organised financial market.
(ii) Forward currency contracts
Forward currency contracts are primarily used by the Schemes to hedge against foreign currency exchange-rate risks on their non-Australian dollar denominated trading securities. The Schemes agree to receive or deliver a fixed quantity of foreign currency for an agreed price on an agreed future date. Forward currency contracts are valued at the prevailing last price at the end of each reporting period. The Schemes recognise a gain or loss equal to the change in fair value at the end of each reporting period.
(iii) Warrants
Warrants are an option to purchase additional securities from the issuer at a specified price during a specified period. Warrants are valued at the prevailing market price at the end of each reporting period. The Schemes recognise a gain or loss equal to the change in fair value at the end of each reporting period.
Foreign exchange risk
A scheme that invests in financial denominated currencies other than the Australian dollar is exposed to foreign exchange risk. Foreign exchange risk arises as the income and value of monetary securities denominated in other currencies will fluctuate due to changes in exchange rates.
Derivative financial instruments are used within the Schemes to manage foreign exchange risk as described above.
The following tables detail the Schemes’ international investments in Australian dollar equivalents by currency exposure and the amounts that are economically hedged using forward foreign currency contracts at the end of each reporting period. At 30 June 2019 had the exchange rate of all the currencies increased or decreased by 10% (2018: 10%) with all other variables held constant, the impact on the net assets attributable to unitholders is reflected in the tables below.
DIMENSIONAL TRUSTSNotes to the Financial Statements for the year ended 30 June 2019
55Annual Report 2019

12. Financial risk management (continued)(d) Market risk (continued)
Foreign exchange risk (continued)
Dimensional Global Core Equity Trust
Japanese Yen
US Dollar
Swiss Franc
Canadian Dollar
Hong Kong Dollar
European Euro
British Pound
New Zealand Dollar Other Total
30 June 2019 $A’000 $A’000 $A’000 $A’000 $A’000 $A’000 $A’000 $A’000 $A’000 $A’000
Gross investment amounts in foreign currency 372,883 2,440,295 120,666 130,668 50,993 481,820 244,368 7,413 125,329 3,974,435
Increase/(decrease) in foreign currency exposure (167,216) (1,168,669) – – – (310,361) (118,219) 559,079 – (1,205,386)
Total foreign currency exposure 205,667 1,271,626 120,666 130,668 50,993 171,459 126,149 566,492 125,329 2,769,049
Net foreign currency exposure 205,667 1,271,626 120,666 130,668 50,993 171,459 126,149 566,492 125,329 2,769,049
Foreign currency exposure (+/-10%) 20,567 127,163 12,067 13,067 5,099 17,146 12,615 56,649 12,533 276,906
Dimensional Global Core Equity Trust
Japanese Yen
US Dollar
Swiss Franc
Canadian Dollar
Hong Kong Dollar
European Euro
British Pound
New Zealand Dollar Other Total
30 June 2018 $A’000 $A’000 $A’000 $A’000 $A’000 $A’000 $A’000 $A’000 $A’000 $A’000
Gross investment amounts in foreign currency 354,511 2,014,761 91,834 113,728 44,451 405,877 228,927 6,523 104,049 3,364,661
Increase/(decrease) in foreign currency exposure (154,860) (958,682) – – – (253,487) (106,399) 473,349 – (1,000,079)
Total foreign currency exposure 199,651 1,056,079 91,834 113,728 44,451 152,390 122,528 479,872 104,049 2,364,582
Net foreign currency exposure 199,651 1,056,079 91,834 113,728 44,451 152,390 122,528 479,872 104,049 2,364,582
Foreign currency exposure (+/-10%) 19,965 105,608 9,183 11,373 4,445 15,239 12,253 47,987 10,405 236,458
DIMENSIONAL TRUSTSNotes to the Financial Statements for the year ended 30 June 2019
56 Annual Report 2019

12. Financial risk management (continued)(d) Market risk (continued)
Foreign exchange risk (continued)
Dimensional Global Sustainability Trust
30 June 2019
Japanese Yen
$A’000
US Dollar
$A’000
Swiss Franc
$A’000
Canadian Dollar
$A’000
Hong Kong Dollar
$A’000
European Euro
$A’000
British Pound
$A’000
New Zealand Dollar
$A’000
Other
$A’000
Total
$A’000
Gross investment amounts in foreign currency 22,884 141,069 6,886 4,292 2,640 27,112 11,455 441 7,461 224,240
Increase/(decrease) in foreign currency exposure (13,726) (86,298) – – – (25,554) (7,088) 79,111 – (53,555)
Total foreign currency exposure 9,158 54,771 6,886 4,292 2,640 1,558 4,367 79,552 7,461 170,685
Net foreign currency exposure 9,158 54,771 6,886 4,292 2,640 1,558 4,367 79,552 7,461 170,685
Foreign currency exposure (+/-10%) 916 5,477 689 429 264 156 437 7,955 746 17,069
Dimensional Global Sustainability Trust
30 June 2018
Japanese Yen
$A’000
US Dollar
$A’000
Swiss Franc
$A’000
Canadian Dollar
$A’000
Hong Kong Dollar
$A’000
European Euro
$A’000
British Pound
$A’000
New Zealand Dollar
$A’000
Other
$A’000
Total
$A’000
Gross investment amounts in foreign currency 15,016 85,069 3,863 2,924 1,405 17,101 7,257 267 4,545 137,447
Increase/(decrease) in foreign currency exposure (10,392) (62,359) – – – (17,759) (5,020) 65,055 – (30,475)
Total foreign currency exposure 4,624 22,710 3,863 2,924 1,405 (658) 2,237 65,322 4,545 106,972
Net foreign currency exposure 4,624 22,710 3,863 2,924 1,405 (658) 2,237 65,322 4,545 106,972
Foreign currency exposure (+/-10%) 462 2,271 386 292 141 (66) 224 6,532 454 10,696
DIMENSIONAL TRUSTSNotes to the Financial Statements for the year ended 30 June 2019
57Annual Report 2019

12. Financial risk management (continued)(d) Market risk (continued)
Foreign exchange risk (continued)
Dimensional Global Real Estate Trust
30 June 2019
Japanese Yen
$A’000
US
Dollar
$A’000
Canadian Dollar
$A’000
Hong Kong
Dollar
$A’000
Singapore Dollar
$A’000
European Euro
$A’000
British Pound
$A’000
South African
Rand
$A’000
Other
$A’000
Total
$A’000
Gross investment amounts in foreign currency 56,057 350,299 12,042 14,125 20,401 37,347 26,660 6,782 8,433 532,146
Increase/(decrease) in foreign currency exposure (3,797) (25,228) – – – (2,367) (1,697) – 40,982 7,893
Total foreign currency exposure 52,260 325,071 12,042 14,125 20,401 34,980 24,963 6,782 49,415 540,039
Net foreign currency exposure 52,260 325,071 12,042 14,125 20,401 34,980 24,963 6,782 49,415 540,039
Foreign currency exposure (+/-10%) 5,226 32,507 1,204 1,413 2,040 3,498 2,496 678 4,941 54,003
Dimensional Global Real Estate Trust
30 June 2018
Japanese Yen
$A’000
US
Dollar
$A’000
Canadian Dollar
$A’000
Hong Kong
Dollar
$A’000
Singapore Dollar
$A’000
European Euro
$A’000
British Pound
$A’000
South African
Rand
$A’000
Other
$A’000
Total
$A’000
Gross investment amounts in foreign currency 39,262 291,720 8,448 9,877 13,851 32,167 24,014 6,211 6,871 432,421
Increase/(decrease) in foreign currency exposure (2,505) (20,230) – – – (2,560) (1,497) – 31,634 4,842
Total foreign currency exposure 36,757 271,490 8,448 9,877 13,851 29,607 22,517 6,211 38,505 437,263
Net foreign currency exposure 36,757 271,490 8,448 9,877 13,851 29,607 22,517 6,211 38,505 437,263
Foreign currency exposure (+/-10%) 3,676 27,149 845 988 1,385 2,961 2,252 621 3,851 43,728
DIMENSIONAL TRUSTSNotes to the Financial Statements for the year ended 30 June 2019
58 Annual Report 2019

12. Financial risk management (continued)(d) Market risk (continued)
Foreign exchange risk (continued)
Dimensional Global Value Trust
30 June 2019
Japanese Yen
$A’000
US
Dollar
$A’000
Swiss Franc
$A’000
Canadian Dollar
$A’000
Hong Kong Dollar
$A’000
Swedish Krona
$A’000
European Euro
$A’000
British
Pound
$A’000
Other
$A’000
Total
$A’000
Gross investment amounts in foreign currency 46,277 308,870 19,970 14,922 6,928 5,197 55,254 19,366 9,378 486,162
Increase/(decrease) in foreign currency exposure – – – – – – – – – –
Total foreign currency exposure 46,277 308,870 19,970 14,922 6,928 5,197 55,254 19,366 9,378 486,162
Net foreign currency exposure 46,277 308,870 19,970 14,922 6,928 5,197 55,254 19,366 9,378 486,162
Foreign currency exposure (+/-10%) 4,628 30,887 1,997 1,492 693 520 5,525 1,937 938 48,617
Dimensional Global Value Trust
30 June 2018
Japanese Yen
$A’000
US
Dollar
$A’000
Swiss Franc
$A’000
Canadian Dollar
$A’000
Hong Kong Dollar
$A’000
Swedish Krona
$A’000
European Euro
$A’000
British
Pound
$A’000
Other
$A’000
Total
$A’000
Gross investment amounts in foreign currency 53,230 334,951 16,279 12,991 6,229 6,487 68,274 21,798 8,979 529,218
Increase/(decrease) in foreign currency exposure – – – – – – – – – –
Total foreign currency exposure 53,230 334,951 16,279 12,991 6,229 6,487 68,274 21,798 8,979 529,218
Net foreign currency exposure 53,230 334,951 16,279 12,991 6,229 6,487 68,274 21,798 8,979 529,218
Foreign currency exposure (+/-10%) 5,323 33,495 1,628 1,299 623 649 6,827 2,180 898 52,922
DIMENSIONAL TRUSTSNotes to the Financial Statements for the year ended 30 June 2019
59Annual Report 2019

12. Financial risk management (continued)(d) Market risk (continued)
Foreign exchange risk (continued)
Dimensional Global Large Company Trust
30 June 2019
Japanese Yen
$A’000
US Dollar
$A’000
Swiss Franc
$A’000
Canadian Dollar
$A’000
Hong Kong Dollar
$A’000
Swedish Krona
$A’000
European Euro
$A’000
British
Pound
$A’000
Other
$A’000
Total
$A’000
Gross investment amounts in foreign currency 13,626 88,179 5,178 5,494 2,131 1,776 17,735 9,011 2,763 145,893
Increase/(decrease) in foreign currency exposure – – – – – – – – – –
Total foreign currency exposure 13,626 88,179 5,178 5,494 2,131 1,776 17,735 9,011 2,763 145,893
Net foreign currency exposure 13,626 88,179 5,178 5,494 2,131 1,776 17,735 9,011 2,763 145,893
Foreign currency exposure (+/-10%) 1,363 8,818 518 549 213 178 1,773 901 276 14,589
Dimensional Global Large Company Trust
30 June 2018
Japanese Yen
$A’000
US Dollar
$A’000
Swiss Franc
$A’000
Canadian Dollar
$A’000
Hong Kong Dollar
$A’000
Swedish Krona
$A’000
European Euro
$A’000
British
Pound
$A’000
Other
$A’000
Total
$A’000
Gross investment amounts in foreign currency 14,700 85,015 4,313 5,293 1,979 1,608 17,619 9,997 2,642 143,166
Increase/(decrease) in foreign currency exposure – – – – – – – – – –
Total foreign currency exposure 14,700 85,015 4,313 5,293 1,979 1,608 17,619 9,997 2,642 143,166
Net foreign currency exposure 14,700 85,015 4,313 5,293 1,979 1,608 17,619 9,997 2,642 143,166
Foreign currency exposure (+/-10%) 1,470 8,502 431 529 198 161 1,762 1,000 264 14,317
DIMENSIONAL TRUSTSNotes to the Financial Statements for the year ended 30 June 2019
60 Annual Report 2019

12. Financial risk management (continued)(d) Market risk (continued)
Foreign exchange risk (continued)
Dimensional Global Small Company Trust
30 June 2019
Japanese Yen
$A’000
US Dollar
$A’000
Swiss Franc
$A’000
Canadian Dollar
$A’000
Swedish Krona
$A’000
European Euro
$A’000
British Pound
$A’000
Hong Kong Dollar
$A’000
Other
$A’000
Total
$A’000
Gross investment amounts in foreign currency 40,256 253,209 8,602 15,670 6,572 48,346 31,388 4,702 11,068 419,813
Increase/(decrease) in foreign currency exposure – – – – – – – – – –
Total foreign currency exposure 40,256 253,209 8,602 15,670 6,572 48,346 31,388 4,702 11,068 419,813
Net foreign currency exposure 40,256 253,209 8,602 15,670 6,572 48,346 31,388 4,702 11,068 419,813
Foreign currency exposure (+/-10%) 4,026 25,321 860 1,567 657 4,835 3,139 470 1,107 41,982
Dimensional Global Small Company Trust
30 June 2018
Japanese Yen
$A’000
US Dollar
$A’000
Swiss Franc
$A’000
Canadian Dollar
$A’000
Swedish Krona
$A’000
European Euro
$A’000
British Pound
$A’000
Hong Kong Dollar
$A’000
Other
$A’000
Total
$A’000
Gross investment amounts in foreign currency 38,389 197,436 6,624 11,500 4,124 38,915 24,178 4,429 8,888 334,483
Increase/(decrease) in foreign currency exposure – – – – – – – – – –
Total foreign currency exposure 38,389 197,436 6,624 11,500 4,124 38,915 24,178 4,429 8,888 334,483
Net foreign currency exposure 38,389 197,436 6,624 11,500 4,124 38,915 24,178 4,429 8,888 334,483
Foreign currency exposure (+/-10%) 3,839 19,744 662 1,150 412 3,892 2,418 443 889 33,449
DIMENSIONAL TRUSTSNotes to the Financial Statements for the year ended 30 June 2019
61Annual Report 2019

12. Financial risk management (continued)(d) Market risk (continued)
Foreign exchange risk (continued)
Dimensional Emerging Markets Trust
30 June 2019
Taiwan Dollar
$A’000
US Dollar
$A’000
Hong Kong Dollar
$A’000
Indian Rupee
$A’000
South Korean Won
$A’000
Mexican New Peso
$A’000
South African Rand
$A’000
Brazilian Real
$A’000
Other
$A’000
Total
$A’000
Gross investment amounts in foreign currency 99,579 20,827 99,842 77,850 97,604 19,794 39,272 55,736 87,482 597,986
Increase/(decrease) in foreign currency exposure – – – – – – – – – –
Total foreign currency exposure 99,579 20,827 99,842 77,850 97,604 19,794 39,272 55,736 87,482 597,986
Net foreign currency exposure 99,579 20,827 99,842 77,850 97,604 19,794 39,272 55,736 87,482 597,986
Foreign currency exposure (+/-10%) 9,958 2,083 9,984 7,785 9,760 1,979 3,927 5,574 8,748 59,798
Dimensional Emerging Markets Trust
30 June 2018
Taiwan Dollar
$A’000
US
Dollar
$A’000
Hong Kong Dollar
$A’000
Indian Rupee
$A’000
South Korean Won
$A’000
Mexican New Peso
$A’000
South African Rand
$A’000
Brazilian Real
$A’000
Other
$A’000
Total
$A’000
Gross investment amounts in foreign currency 84,300 14,257 88,005 65,772 84,515 20,485 32,535 40,183 73,224 503,276
Increase/(decrease) in foreign currency exposure – – – – – – – – – –
Total foreign currency exposure 84,300 14,257 88,005 65,772 84,515 20,485 32,535 40,183 73,224 503,276
Net foreign currency exposure 84,300 14,257 88,005 65,772 84,515 20,485 32,535 40,183 73,224 503,276
Foreign currency exposure (+/-10%) 8,430 1,426 8,800 6,577 8,452 2,048 3,254 4,018 7,322 50,327
DIMENSIONAL TRUSTSNotes to the Financial Statements for the year ended 30 June 2019
62 Annual Report 2019

12. Financial risk management (continued)(d) Market risk (continued)
Interest rate risk
Interest rate risk is the risk that a financial asset’s value will fluctuate as a result of changes in market interest rates. Interest rate risk is managed as part of the overall investment strategy of the Schemes.
The following tables detail the Schemes’ exposure to interest rate risk as at 30 June 2019 and 30 June 2018.
Dimensional Global Core Equity Trust
Floating interest rate
Non-interest bearing
Total
30 June 2019 $’000 $’000 $’000
Assets
Cash and cash equivalents 65,521 – 65,521
Deposits held with brokers for margin 1,873 – 1,873
Receivables – 12,056 12,056
Financial assets at fair value through profit or loss – 3,974,711 3,974,711
Total assets 67,394 3,986,767 4,054,161
Liabilities
Payables – (25,485) (25,485)
Distributions payable – (31,842) (31,842)
Financial liabilities at fair value through profit or loss – (276) (276)
Total liabilities – (57,603) (57,603)
Net assets 67,394 3,929,164 3,996,558
DIMENSIONAL TRUSTSNotes to the Financial Statements for the year ended 30 June 2019
63Annual Report 2019

12. Financial risk management (continued)(d) Market risk (continued)
Interest rate risk (continued)
Dimensional Global Core Equity Trust
Floating interest rate
Non-interest bearing Total
30 June 2018 $’000 $’000 $’000
Assets
Cash and cash equivalents 46,868 – 46,868
Deposits held with brokers for margin 5 – 5
Receivables – 11,858 11,858
Financial assets at fair value through profit or loss – 3,397,204 3,397,204
Total assets 46,873 3,409,062 3,455,935
Liabilities
Payables – (3,105) (3,105)
Distributions payable – (39,152) (39,152)
Financial liabilities at fair value through profit or loss – (32,542) (32,542)
Total liabilities – (74,799) (74,799)
Net assets 46,873 3,334,263 3,381,136
Change in variableEffect on profit/net assets attributable to unitholders
30 June 2019 30 June 2018 30 June 2019 30 June 2018
+/-% +/-% $’000 $’000
Interest rate risk 1.00 1.00 674 469
DIMENSIONAL TRUSTSNotes to the Financial Statements for the year ended 30 June 2019
64 Annual Report 2019

12. Financial risk management (continued)(d) Market risk (continued)
Interest rate risk (continued)
Dimensional Global Sustainability Trust
Floating interest rate
Non-interest bearing Total
30 June 2019 $’000 $’000 $’000
Assets
Cash and cash equivalents 1,272 – 1,272
Deposits held with brokers for margin – – –
Receivables – 9,575 9,575
Financial assets at fair value through profit or loss – 224,296 224,296
Total assets 1,272 233,871 235,143
Liabilities
Payables – (9,206) (9,206)
Distributions payable – (835) (835)
Financial liabilities at fair value through profit or loss – (58) (58)
Total liabilities – (10,099) (10,099)
Net assets 1,272 223,772 225,044
DIMENSIONAL TRUSTSNotes to the Financial Statements for the year ended 30 June 2019
65Annual Report 2019

12. Financial risk management (continued)(d) Market risk (continued)
Interest rate risk (continued)
Dimensional Global Sustainability Trust
Floating interest rate
Non-interest bearing Total
30 June 2018 $’000 $’000 $’000
Assets
Cash and cash equivalents 2,700 – 2,700
Receivables – 229 229
Financial assets at fair value through profit or loss – 139,629 139,629
Total assets 2,700 139,858 142,558
Liabilities
Payables – (57) (57)
Distributions payable – (356) (356)
Financial liabilities at fair value through profit or loss – (2,184) (2,184)
Total liabilities – (2,597) (2,597)
Net assets 2,700 137,261 139,961
Change in variableEffect on profit/net assets attributable to unitholders
30 June 2019 30 June 2018 30 June 2019 30 June 2018
+/-% +/-% $’000 $’000
Interest rate risk 1.00 1.00 13 27
DIMENSIONAL TRUSTSNotes to the Financial Statements for the year ended 30 June 2019
66 Annual Report 2019

12. Financial risk management (continued)(d) Market risk (continued)
Interest rate risk (continued)
Dimensional Global Real Estate Trust
Floating interest rate
Non-interest bearing Total
30 June 2019 $’000 $’000 $’000
Assets
Cash and cash equivalents 2,482 – 2,482
Receivables – 9,196 9,196
Financial assets held at fair value through profit or loss – 640,705 640,705
Total assets 2,482 649,901 652,383
Liabilities – –
Payables – (4,518) (4,518)
Distributions payable – (5,518) (5,518)
Financial liabilities held at fair value through profit or loss – (11) (11)
Total liabilities – (10,047) (10,047)
Net assets 2,482 639,854 642,336
DIMENSIONAL TRUSTSNotes to the Financial Statements for the year ended 30 June 2019
67Annual Report 2019

12. Financial risk management (continued)(d) Market risk (continued)
Interest rate risk (continued)
Dimensional Global Real Estate Trust
Floating interest rate
Non-interest bearing Total
30 June 2018 $’000 $’000 $’000
Assets
Cash and cash equivalents 2,453 – 2,453
Receivables – 4,126 4,126
Financial assets at fair value through profit or loss – 529,400 529,400
Total assets 2,453 533,526 535,979
Liabilities
Payables – (517) (517)
Distributions payable – (4,945) (4,945)
Financial liabilities at fair value through profit or loss – (714) (714)
Total liabilities – (6,176) (6,176)
Net assets 2,453 527,350 529,803
Change in variableEffect on profit/net assets attributable to unitholders
30 June 2019 30 June 2018 30 June 2019 30 June 2018
+/-% +/-% $’000 $’000
Interest rate risk 1.00 1.00 25 25
DIMENSIONAL TRUSTSNotes to the Financial Statements for the year ended 30 June 2019
68 Annual Report 2019

12. Financial risk management (continued)(d) Market risk (continued)
Interest rate risk (continued)
Dimensional Global Value Trust
Floating interest rate
Non-interest bearing Total
30 June 2019 $’000 $’000 $’000
Assets
Cash and cash equivalents 21,586 – 21,586
Deposits held with brokers for margin 1,252 – 1,252
Receivables – 6,189 6,189
Financial assets held at fair value through profit or loss – 486,193 486,193
Total assets 22,838 492,382 515,220
Liabilities
Payables – (339) (339)
Distributions payable – (25,282) (25,282)
Financial liabilities held at fair value through profit or loss – (30) (30)
Total liabilities – (25,651) (25,651)
Net assets 22,838 466,731 489,569
DIMENSIONAL TRUSTSNotes to the Financial Statements for the year ended 30 June 2019
69Annual Report 2019

12. Financial risk management (continued)(d) Market risk (continued)
Interest rate risk (continued)
Dimensional Global Value Trust
Floating interest rate
Non-interest bearing Total
30 June 2018 $’000 $’000 $’000
Assets
Cash and cash equivalents 4,787 – 4,787
Receivables – 2,241 2,241
Financial assets at fair value through profit or loss – 529,218 529,218
Total assets 4,787 531,459 536,246
Liabilities
Payables – (313) (313)
Distributions payable – (34,573) (34,573)
Total liabilities – (34,886) (34,886)
Net assets 4,787 496,573 501,360
Change in variableEffect on profit/net assets attributable to unitholders
30 June 2019 30 June 2018 30 June 2019 30 June 2018
+/-% +/-% $’000 $’000
Interest rate risk 1.00 1.00 228 48
DIMENSIONAL TRUSTSNotes to the Financial Statements for the year ended 30 June 2019
70 Annual Report 2019

12. Financial risk management (continued)(d) Market risk (continued)
Interest rate risk (continued)
Dimensional Global Large Company Trust
Floating interest rate
Non-interest bearing Total
30 June 2019 $’000 $’000 $’000
Assets
Cash and cash equivalents 633 – 633
Receivables – 1,519 1,519
Financial assets held at fair value through profit or loss – 145,893 145,893
Total assets 633 147,412 148,045
Liabilities
Payables – (199) (199)
Distributions payable – (1,607) (1,607)
Total liabilities – (1,806) (1,806)
Net assets 633 145,606 146,239
DIMENSIONAL TRUSTSNotes to the Financial Statements for the year ended 30 June 2019
71Annual Report 2019

12. Financial risk management (continued)(d) Market risk (continued)
Interest rate risk (continued)
Dimensional Global Large Company Trust
Floating interest rate
Non-interest bearing Total
30 June 2018 $’000 $’000 $’000
Assets
Cash and cash equivalents 661 – 661
Receivables – 427 427
Financial assets at fair value through profit or loss – 143,167 143,167
Total assets 661 143,594 144,255
Liabilities
Payables – (123) (123)
Distributions payable – (1,436) (1,436)
Total liabilities – (1,559) (1,559)
Net assets 661 142,035 142,696
Change in variableEffect on profit/net assets attributable to unitholders
30 June 2019 30 June 2018 30 June 2019 30 June 2018
+/-% +/- % $’000 $’000
Interest rate risk 1.00 1.00 6 7
DIMENSIONAL TRUSTSNotes to the Financial Statements for the year ended 30 June 2019
72 Annual Report 2019

12. Financial risk management (continued)(d) Market risk (continued)
Interest rate risk (continued)
Dimensional Global Small Company Trust
Floating interest rate
Non-interest bearing Total
30 June 2019 $’000 $’000 $’000
Assets
Cash and cash equivalents 7,251 – 7,251
Deposits held with brokers for margin 179 – 179
Receivables – 1,303 1,303
Financial assets held at fair value through profit or loss – 419,812 419,812
Total assets 7,430 421,115 428,545
Liabilities
Payables – (1,585) (1,585)
Distributions payable – (5,205) (5,205)
Total liabilities – (6,790) (6,790)
Net assets 7,430 414,325 421,755
DIMENSIONAL TRUSTSNotes to the Financial Statements for the year ended 30 June 2019
73Annual Report 2019

12. Financial risk management (continued)(d) Market risk (continued)
Interest rate risk (continued)
Dimensional Global Small Company Trust
Floating interest rate
Non-interest bearing Total
30 June 2018 $’000 $’000 $’000
Assets
Cash and cash equivalents 1,861 – 1,861
Receivables – 796 796
Financial assets at fair value through profit or loss – 334,483 334,483
Total assets 1,861 335,279 337,140
Liabilities
Payables – (591) (591)
Distributions payable – (2,282) (2,282)
Total liabilities – (2,873) (2,873)
Net assets 1,861 332,406 334,267
Change in variableEffect on profit/net assets attributable to unitholders
30 June 2019 30 June 2018 30 June 2019 30 June 2018
+/-% +/-% $’000 $’000
Interest rate risk 1.00 1.00 74 19
DIMENSIONAL TRUSTSNotes to the Financial Statements for the year ended 30 June 2019
74 Annual Report 2019

12. Financial risk management (continued)(d) Market risk (continued)
Interest rate risk (continued)
Dimensional Emerging Markets Trust
Floating interest rate
Non-interest bearing Total
30 June 2019 $’000 $’000 $’000
Assets
Cash and cash equivalents 13,188 – 13,188
Deposits held with brokers for margin 326 – 326
Receivables – 2,882 2,882
Financial assets at fair value through profit or loss – 597,986 597,986
Total assets 13,514 600,868 614,382
Liabilities
Payables – (1,875) (1,875)
Distributions payable – (9,867) (9,867)
Total liabilities – (11,742) (11,742)
Net assets 13,514 589,126 602,640
DIMENSIONAL TRUSTSNotes to the Financial Statements for the year ended 30 June 2019
75Annual Report 2019

12. Financial risk management (continued)(d) Market risk (continued)
Interest rate risk (continued)
Dimensional Emerging Markets Trust
Floating interest rate
Non-interest bearing Total
30 June 2018 $’000 $’000 $’000
Assets
Cash and cash equivalents 3,416 – 3,416
Receivables – 1,872 1,872
Financial assets at fair value through profit or loss – 503,277 503,277
Total assets 3,416 505,149 508,565
Liabilities
Payables – (438) (438)
Distributions payable – (18,570) (18,570)
Total liabilities – (19,008) (19,008)
Net assets 3,416 486,141 489,557
Change in variableEffect on profit/net assets attributable to unitholders
30 June 2019 30 June 2018 30 June 2019 30 June 2018
+/-% +/-% $’000 $’000
Interest rate risk 1.00 1.00 135 34
DIMENSIONAL TRUSTSNotes to the Financial Statements for the year ended 30 June 2019
76 Annual Report 2019

12. Financial risk management (continued)(d) Market risk (continued)
Price riskPrice risk is the risk that the total value of investments will fluctuate due to of changes in market prices, whether caused by factors specific to an individual investment, its issuer, or all factors affecting all instruments traded in the market. The Schemes have investments in equity securities, unit trusts and equity derivatives which expose them to price risk. The Responsible Entity manages the Schemes’ market risk on a daily basis in accordance with the Schemes’ investment objectives and policies.
As the majority of the Schemes’ financial instruments are carried at fair value with changes in fair value recognised in the Statements of Comprehensive Income, all changes in market conditions will directly affect investment income.
The following table details the effect on profit attributable to unitholders and net assets attributable to unitholders from possible changes in other market risk that were reasonably possible based on the risk the Schemes were exposed to at the reporting date:
Dimensional Global Core Equity Trust Dimensional Global Sustainability Trust
Change in variableEffect on profit attributable
to unitholders Change in variableEffect on profit attributable
to unitholders
30 June 2019 30 June 2018 30 June 2019 30 June 2018 30 June 2019 30 June 2018 30 June 2019 30 June 2018
+/-% +/-% $’000 $’000 +/-% +/-% $’000 $’000
Equity price risk
Australia 10.00 10.00 – 26 10.00 10.00 – –
Asia Pacific (excluding Australia) 10.00 10.00 44,156 41,111 10.00 10.00 2,643 1,703
USA and Canada 10.00 10.00 244,026 201,426 10.00 10.00 13,709 8,322
Continental Europe 10.00 10.00 75,286 62,489 10.00 10.00 4,627 2,781
United Kingdom 10.00 10.00 25,163 23,480 10.00 10.00 1,165 711
Other 10.00 10.00 8,813 7,934 10.00 10.00 281 227
DIMENSIONAL TRUSTSNotes to the Financial Statements for the year ended 30 June 2019
77Annual Report 2019

12. Financial risk management (continued)(d) Market risk (continued)
Price risk (continued)
Dimensional Global Real Estate Trust
Change in variableEffect on profit attributable
to unitholders
30 June 2019 30 June 2018 30 June 2019 30 June 2018
+/-% +/-% $’000 $’000
Equity price risk Australia 10.00 10.00 10,855 8,762
Asia Pacific (excluding Australia) 10.00 10.00 9,273 6,501
USA and Canada 10.00 10.00 36,199 30,007
Continental Europe 10.00 10.00 2,694 4,081
United Kingdom 10.00 10.00 2,643 2,359
Other 10.00 10.00 2,406 1,158
Dimensional Global Value Trust Dimensional Global Large Company Trust
Change in variableEffect on profit attributable
to unitholders Change in variableEffect on profit attributable
to unitholders
30 June 2019 30 June 2018 30 June 2019 30 June 2018 30 June 2019 30 June 2018 30 June 2019 30 June 2018
+/-% +/-% $’000 $’000 +/-% +/-% $’000 $’000
Equity price risk
Asia Pacific (excluding Australia) 10.00 10.00 5,315 5,974 10.00 10.00 1,638 1,726USA and Canada 10.00 10.00 28,435 30,641 10.00 10.00 8,977 8,663
Continental Europe 10.00 10.00 10,566 11,197 10.00 10.00 2,872 2,739
United Kingdom 10.00 10.00 3,073 3,770 10.00 10.00 895 967
Other 10.00 10.00 1,227 1,339 10.00 10.00 207 221
DIMENSIONAL TRUSTSNotes to the Financial Statements for the year ended 30 June 2019
78 Annual Report 2019

12. Financial risk management (continued)(d) Market risk (continued)
Price risk (continued)
Dimensional Global Small Company Trust Dimensional Emerging Markets Trust
Change in variableEffect on profit attributable
to unitholders Change in variableEffect on profit attributable
to unitholders
30 June 2019 30 June 2018 30 June 2019 30 June 2018 30 June 2019 30 June 2018 30 June 2019 30 June 2018
+/-% +/-% $’000 $’000 +/-% +/-% $’000 $’000
Equity price risk
Australia 10.00 10.00 – 10 10.00 10.00 – –Asia Pacific (excluding Australia) 10.00 10.00 4,702 4,308 10.00 10.00 44,156 37,555
USA and Canada 10.00 10.00 25,350 19,776 10.00 10.00 5 –
Continental Europe 10.00 10.00 7,268 5,628 10.00 10.00 1,410 990
United Kingdom 10.00 10.00 2,948 2,420 10.00 10.00 – –
Other 10.00 10.00 1,714 1,306 10.00 10.00 14,228 11,782
(e) Credit riskCredit risk refers to the risk that a counterparty will default on its contractual obligations resulting in financial loss to the Schemes. The Schemes have adopted the policy of only dealing with creditworthy counterparties and obtaining sufficient collateral or other security where appropriate, also ensuring that the majority of transactions are undertaken on recognised markets as a means of mitigating the risk of financial loss from default. The Schemes measure credit risk on a fair value basis.
The Schemes are also exposed to counterparty credit risk on derivative financial instruments, cash and cash equivalents, amounts due from brokers and other receivables.
The Schemes have no significant credit risk exposure to any single counterparty or counterparties having similar characteristics.
All transactions in listed securities are settled/paid upon delivery using approved brokers. The risk of default is considered low, as delivery of securities sold is only made once the broker has received payment. Payment is made once securities purchased have been received by the broker. The trade will fail if either party fails to meet its obligations.
The exposure to credit risk for cash and cash equivalents is low as all counterparties have a rating of AA or higher.
The exposure to credit risk in relation to other financial assets, such as equity securities and exchange traded derivatives, is reflected in the price of the assets and, therefore, subject to price risk.
The maximum exposure to credit risk at the end of each reporting period is the carrying amount of the financial assets. None of these assets are impaired nor past due but not impaired as at 30 June 2019. Refer to Summary of Significant Accounting Policies Note 2(b)(iv).
(f) Net fair valueThe carrying amount of financial assets and financial liabilities recorded in the Financial Statements represents their respective net fair values, determined in accordance with Note 2 to the Financial Statements. The Schemes have no significant holdings of investments which are not readily traded on original markets in standardised form or for which prices are not publicly available.
DIMENSIONAL TRUSTSNotes to the Financial Statements for the year ended 30 June 2019
79Annual Report 2019

12. Financial risk management (continued)
(g) Liquidity and cash flow riskLiquidity risk is the risk that the Schemes will experience difficulty in either realising assets or otherwise raising sufficient funds to satisfy commitments associated with financial instruments. This risk is controlled through the Schemes’ investments in financial instruments which under normal market conditions are readily convertible to cash. In addition, the Schemes maintain cash and cash equivalents to meet normal operating requirements.
Cash flow risk is the risk that the future cash flows derived from holding financial instruments will fluctuate.
The risk-management guidelines adopted are designed to minimise liquidity and cash flow risk through:
> Ensuring there is no significant exposure to illiquid or thinly traded financial instruments; and
> Applying limits to ensure there is no concentration of liquidity risk to a particular counterparty or market
Maturity analysis of financial liabilities
The following tables analyse the Schemes’ non-derivative financial liabilities into relevant maturity groupings based on the remaining period at balance sheet date to the contractual maturity date. The amounts in the tables are the contractual undiscounted cash flows. Units are redeemed on demand at the unitholder’s option. However, the Board of Directors does not envisage that the contractual maturity disclosed in the tables below will be representative of the actual cash flows, as holders of these instruments typically retain them for the medium to long term.
Dimensional Global Core Equity Trust
Due on demand Due within 3 months Due after 3 months Total
30 June 2019 $’000 $’000 $’000 $’000
Payables – 25,485 – 25,485
Distributions payable – 31,842 – 31,842
Financial liabilities – Net settled derivatives – 276 – 276
Net assets attributable to unitholders 3,996,558 – – 3,996,558
Contractual cash flows (excluding derivatives) 3,996,558 57,603 – 4,054,161
Dimensional Global Core Equity Trust
Due on demand Due within 3 months Due after 3 months Total
30 June 2018 $’000 $’000 $’000 $’000
Payables – 3,105 – 3,105
Distributions payable – 39,152 – 39,152
Financial liabilities – Net settled derivatives – 32,542 – 32,542
Net assets attributable to unitholders 3,381,136 – – 3,381,136
Contractual cash flows (excluding derivatives) 3,381,136 74,799 – 3,455,935
DIMENSIONAL TRUSTSNotes to the Financial Statements for the year ended 30 June 2019
80 Annual Report 2019

12. Financial risk management (continued)(g) Liquidity and cash flow risk (continued)
Maturity analysis of financial liabilities (continued)
Dimensional Global Sustainability Trust
Due on demand Due within 3 months Due after 3 months Total
30 June 2019 $’000 $’000 $’000 $’000
Payables – 9,206 – 9,206
Distributions payable – 835 – 835
Financial liabilities – Net settled derivatives – 58 – 58
Net assets attributable to unitholders 225,044 – – 225,044
Contractual cash flows (excluding derivatives) 225,044 10,099 – 235,143
Dimensional Global Sustainability Trust
Due on demand Due within 3 months Due after 3 months Total
30 June 2018 $’000 $’000 $’000 $’000
Payables – 57 – 57
Distributions payable – 356 – 356
Financial liabilities – Net settled derivatives – 2,184 – 2,184
Net assets attributable to unitholders 139,961 – – 139,961
Contractual cash flows (excluding derivatives) 139,961 2,597 – 142,558
DIMENSIONAL TRUSTSNotes to the Financial Statements for the year ended 30 June 2019
81Annual Report 2019

12. Financial risk management (continued)(g) Liquidity and cash flow risk (continued)
Maturity analysis of financial liabilities (continued)
Dimensional Global Real Estate Trust
Due on demand Due within 3 months Due after 3 months Total
30 June 2019 $’000 $’000 $’000 $’000
Payables – 4,518 – 4,518
Distributions payable – 5,518 – 5,518
Financial liabilities – Net settled derivatives – 11 – 11
Net assets attributable to unitholders 642,336 – – 642,336
Contractual cash flows (excluding derivatives) 642,336 10,047 – 652,383
Dimensional Global Real Estate Trust
Due on demand Due within 3 months Due after 3 months Total
30 June 2018 $’000 $’000 $’000 $’000
Payables – 517 – 517
Distributions payable – 4,945 – 4,945
Financial liabilities – Net settled derivatives – 714 – 714
Net assets attributable to unitholders 529,803 – – 529,803
Contractual cash flows (excluding derivatives) 529,803 6,176 – 535,979
DIMENSIONAL TRUSTSNotes to the Financial Statements for the year ended 30 June 2019
82 Annual Report 2019

12. Financial risk management (continued)(g) Liquidity and cash flow risk (continued)
Maturity analysis of financial liabilities (continued)
Dimensional Global Value Trust
Due on demand Due within 3 months Due after 3 months Total
30 June 2019 $’000 $’000 $’000 $’000
Payables – 339 – 339
Distributions payable – 25,282 – 25,282
Financial liabilities – Net settled derivatives – 30 – 30
Net assets attributable to unitholders 489,569 – – 489,569
Contractual cash flows (excluding derivatives) 489,569 25,651 – 515,220
Dimensional Global Value Trust
Due on demand Due within 3 months Due after 3 months Total
30 June 2018 $’000 $’000 $’000 $’000
Payables – 313 – 313
Distributions payable – 34,573 – 34,573
Financial liabilities – Net settled derivatives – – – –
Net assets attributable to unitholders 501,360 – – 501,360
Contractual cash flows (excluding derivatives) 501,360 34,886 – 536,246
DIMENSIONAL TRUSTSNotes to the Financial Statements for the year ended 30 June 2019
83Annual Report 2019

12. Financial risk management (continued)(g) Liquidity and cash flow risk (continued)
Maturity analysis of financial liabilities (continued)
Dimensional Global Large Company Trust
Due on demand Due within 3 months Due after 3 months Total
30 June 2019 $’000 $’000 $’000 $’000
Payables – 199 – 199
Distributions payable – 1,607 – 1,607
Financial liabilities – Net settled derivatives – – – –
Net assets attributable to unitholders 146,239 – – 146,239
Contractual cash flows (excluding derivatives) 146,239 1,806 – 148,045
Dimensional Global Large Company Trust
Due on demand Due within 3 months Due after 3 months Total
30 June 2018 $’000 $’000 $’000 $’000
Payables – 123 – 123
Distributions payable – 1,436 – 1,436
Financial liabilities – Net settled derivatives – – – –
Net assets attributable to unitholders 142,696 – – 142,696
Contractual cash flows (excluding derivatives) 142,696 1,559 – 144,255
DIMENSIONAL TRUSTSNotes to the Financial Statements for the year ended 30 June 2019
84 Annual Report 2019

12. Financial risk management (continued)(g) Liquidity and cash flow risk (continued)
Maturity analysis of financial liabilities (continued)
Dimensional Global Small Company Trust
Due on demand Due within 3 months Due after 3 months Total
30 June 2019 $’000 $’000 $’000 $’000
Payables – 1,585 – 1,585
Distributions payable – 5,205 – 5,205
Financial liabilities – Net settled derivatives – – – –
Net assets attributable to unitholders 421,755 – – 421,755
Contractual cash flows (excluding derivatives) 421,755 6,791 – 428,545
Dimensional Global Small Company Trust
Due on demand Due within 3 months Due after 3 months Total
30 June 2018 $’000 $’000 $’000 $’000
Payables – 591 – 591
Distributions payable – 2,282 – 2,282
Financial liabilities – Net settled derivatives – – – –
Net assets attributable to unitholders 334,267 – – 334,267
Contractual cash flows (excluding derivatives) 334,267 2,873 – 337,140
DIMENSIONAL TRUSTSNotes to the Financial Statements for the year ended 30 June 2019
85Annual Report 2019

12. Financial risk management (continued)(g) Liquidity and cash flow risk (continued)
Maturity analysis of financial liabilities (continued)
Dimensional Emerging Markets Trust
Due on demand Due within 3 months Due after 3 months Total
30 June 2019 $’000 $’000 $’000 $’000
Payables – 1,875 – 1,875
Distributions payable – 9,867 – 9,867
Financial liabilities – Net settled derivatives – – – –
Net assets attributable to unitholders 602,640 – – 602,640
Contractual cash flows (excluding derivatives) 602,640 11,742 – 614,382
Dimensional Emerging Markets Trust
Due on demand Due within 3 months Due after 3 months Total
30 June 2018 $’000 $’000 $’000 $’000
Payables – 438 – 438
Distributions payable – 18,570 – 18,570
Financial liabilities – Net settled derivatives – – – –
Net assets attributable to unitholders 489,557 – – 489,557
Contractual cash flows (excluding derivatives) 489,557 19,008 – 508,565
DIMENSIONAL TRUSTSNotes to the Financial Statements for the year ended 30 June 2019
86 Annual Report 2019

12. Financial risk management (continued)(h) Fair value measurement
The Schemes measure and recognise the following assets and liabilities at fair value on a recurring basis.
> Financial assets/liabilities at fair value through profit or loss; and
> Derivative financial instruments
The Schemes have no assets or liabilities measured at fair value on a non-recurring basis in the current reporting period.
AASB 13 requires disclosure of fair value measurements by level of the following fair value hierarchy:
(a) quoted prices (unadjusted) in active markets for identical assets or liabilities (Level 1);
(b) inputs other than quoted prices included within Level 1 that are observable for the asset or liability, either directly (that is, as prices) or indirectly (that is, derived from prices) (Level 2); and
(c) inputs for the asset or liability that are not based on observable market data (unobservable inputs) (Level 3).
(i) Fair value in an active market (Level 1)
The fair value of financial assets and liabilities traded in active markets is based on their quoted market prices at the end of the reporting period without any deduction for estimated future selling costs.
The Schemes value their investments in accordance with the accounting policies set out in Note 2 to the Financial Statements. For the majority of their investments, the Schemes rely on information provided by independent pricing services for the valuation of their investments.
The quoted market price used for financial assets and financial liabilities held by the Schemes is last price. When the Schemes hold derivatives with offsetting market risks, it uses last market prices as a basis for establishing fair values for the offsetting risk positions and the net open position.
A financial instrument is regarded as quoted in an active market if quoted prices are readily and regularly available from an exchange, dealer, broker, industry group, pricing service, or regulatory agency, and those prices represent actual and regularly occurring market transactions on an arm’s length basis.
(ii) Fair value in an inactive or unquoted market (Level 2 and Level 3)
The fair value of financial assets and liabilities that are not traded in an active market is determined using valuation techniques. These include the use of recent arm’s length market transactions, reference to the current fair value of a substantially similar other instrument, discounted cash flow techniques, option pricing models or any other valuation technique that provides a reliable estimate of prices obtained in actual market transactions.
Where discounted cash flow techniques are used, estimated future cash flows are based on management’s best estimates and the discount rate used is a market rate at the end of the reporting period applicable for an instrument with similar terms and conditions.
For other pricing models, inputs are based on market data at the end of the reporting period. Fair values for unquoted equity investments are estimated, if possible, using applicable price/earnings ratios for similar listed companies adjusted to reflect the specific circumstances of the issuer.
The fair value of derivatives that are not exchange traded is estimated at the amount that the Schemes would receive or pay to terminate the contract at the end of the reporting period taking into account current market conditions (volatility and appropriate yield curve) and the current creditworthiness of the counterparties. The fair value of a forward contract is determined as a net present value of estimated future cash flows, discounted at appropriate market rates as at the valuation date. The fair value of an option contract is determined by applying the Black-Scholes option valuation model.
DIMENSIONAL TRUSTSNotes to the Financial Statements for the year ended 30 June 2019
87Annual Report 2019

12. Financial risk management (continued)(h) Fair value measurement (continued)Investments in other unlisted unit trusts are recorded at the redemption value per unit as reported by the investment managers of such funds.
Some of the inputs to these models may not be market observable and are therefore estimated based on assumptions.
The output of a model is always an estimate or approximation of a value that cannot be determined with certainty, and valuation techniques employed may not fully reflect all factors relevant to the positions the Schemes hold. Valuations are therefore adjusted, where appropriate, to allow for additional factors including liquidity risk and counterparty risk.
The following tables set out the Schemes’ financial assets and liabilities (by class) measured at fair value according to the fair value hierarchy at 30 June 2019 and 30 June 2018.
Dimensional Global Core Equity Trust Dimensional Global Sustainability Trust
Level 1 Level 2 Level 3 Total Level 1 Level 2 Level 3 Total
30 June 2019 $’000 $’000 $’000 $’000 $’000 $’000 $’000 $’000
Financial assets at fair value through profit or loss
Derivatives
Forward currency contracts 125 21,265 – 21,390 – 2,079 – 2,079
Equity securities 3,952,534 – 787 3,953,321 222,217 – – 222,217
Total 3,952,659 21,265 787 3,974,711 222,217 2,079 – 224,296
Financial liabilities at fair value through profit or loss
Derivatives
Forward currency contracts – 276 – 276 – 58 – 58
Total – 276 – 276 – 58 – 58
DIMENSIONAL TRUSTSNotes to the Financial Statements for the year ended 30 June 2019
88 Annual Report 2019

12. Financial risk management (continued)(h) Fair value measurement (continued)
Dimensional Global Real Estate TrustLevel 1 Level 2 Level 3 Total
30 June 2019 $’000 $’000 $’000 $’000Financial assets at fair value through profit or loss Derivatives Forward currency contracts – 689 – 689Equity securities 640,016 – – 640,016Total 640,016 689 – 640,705Financial liabilities at fair value through profit or loss Derivatives Forward currency contracts – 11 – 11Total – 11 – 11
Dimensional Global Core Equity Trust Dimensional Global Sustainability Trust
Level 1 Level 2 Level 3 Total Level 1 Level 2 Level 3 Total30 June 2018 $’000 $’000 $’000 $’000 $’000 $’000 $’000 $’000Financial assets at fair value through profit or lossDerivativesForward currency contracts – 387 – 387 – 15 – 15Equity securities 3,396,565 – 252 3,396,817 139,614 – – 139,614Total 3,396,565 387 252 3,397,205 139,614 15 – 139,629Financial liabilities at fair value through profit or lossDerivativesForward currency contracts – 32,542 – 32,542 – 2,184 – 2,184Total – 32,542 – 32,542 – 2,184 – 2,184
DIMENSIONAL TRUSTSNotes to the Financial Statements for the year ended 30 June 2019
89Annual Report 2019

12. Financial risk management (continued)(h) Fair value measurement (continued)
Dimensional Global Real Estate Trust
Level 1 Level 2 Level 3 Total30 June 2018 $’000 $’000 $’000 $’000Financial assets at fair value through profit or lossDerivativesForward currency contracts – – – –Equity securities 529,398 – 2 529,400Total 529,398 – 2 529,400Financial liabilities at fair value through profit or lossDerivativesForward currency contracts – 714 – 714Total – 714 – 714
Dimensional Global Value Trust Dimensional Global Large Company Trust
Level 1 Level 2 Level 3 Total Level 1 Level 2 Level 3 Total30 June 2019 $’000 $’000 $’000 $’000 $’000 $’000 $’000 $’000Financial assets at fair value through profit or lossDerivativesForward currency contracts – – – – – – – –Equity securities 486,193 – – 486,193 145,892 – 1 145,893Total 486,193 – – 486,193 145,892 – 1 145,893Financial liabilities at fair value through profit or loss
DerivativesForward currency contracts 30 – – 30 – – – –Total 30 – – 30 – – – –
DIMENSIONAL TRUSTSNotes to the Financial Statements for the year ended 30 June 2019
90 Annual Report 2019

12. Financial risk management (continued)(h) Fair value measurement (continued)
Dimensional Global Small Company Trust Dimensional Emerging Markets TrustLevel 1 Level 2 Level 3 Total Level 1 Level 2 Level 3 Total
30 June 2019 $’000 $’000 $’000 $’000 $’000 $’000 $’000 $’000Financial assets at fair value through profit or loss DerivativesForward currency contracts 67 – – 67 54 – – 54Equity securities 419,351 – 394 419,745 597,673 – 259 597,932Total 419,418 – 394 419,812 597,727 – 259 597,986Financial liabilities at fair value through profit or lossDerivativesForward currency contracts – – – – – – – –Total – – – – – – – –
Dimensional Global Value Trust Dimensional Global Large Company TrustLevel 1 Level 2 Level 3 Total Level 1 Level 2 Level 3 Total
30 June 2018 $’000 $’000 $’000 $’000 $’000 $’000 $’000 $’000Financial assets at fair value through profit or lossDerivativesForward currency contracts – – – – – – – –Equity securities 529,218 – – 529,218 143,166 – 1 143,167Total 529,218 – – 529,218 143,166 – 1 143,167Financial liabilities at fair value through profit or loss DerivativesForward currency contracts – – – – – – – –Total – – – – – – – –
DIMENSIONAL TRUSTSNotes to the Financial Statements for the year ended 30 June 2019
91Annual Report 2019

12. Financial risk management (continued)(h) Fair value measurement (continued)
Dimensional Global Small Company Trust Dimensional Emerging Markets TrustLevel 1 Level 2 Level 3 Total Level 1 Level 2 Level 3 Total
30 June 2018 $’000 $’000 $’000 $’000 $’000 $’000 $’000 $’000Financial assets at fair value through profit or loss Derivatives Forward currency contracts – – – – 4 – – 4Equity securities 334,340 – 143 334,483 503,064 – 209 503,273Total 334,340 – 143 334,483 503,068 – 209 503,277Financial liabilities at fair value through profit or loss Derivatives Forward currency contracts – – – – – – – –Total – – – – – – – –
Investments whose values of which are based on quoted market prices in active markets, and therefore classified within Level 1, include active listed equities.
Financial instruments that trade in markets that are not considered to be active but are valued based on quoted market prices, dealer quotations or alternative pricing sources supported by observable inputs are classified within Level 2. These include warrants and active unlisted unit trusts. As Level 2 investments include positions that are not traded in active markets and/or are subject to transfer restrictions, valuation may be adjusted to reflect illiquidity and/or non-transferability, which are generally based on available market information.
Investments classified within Level 3 have significant unobservable inputs, as they are infrequently traded. Level 3 instruments include certain unlisted shares and daily priced unlisted unit trusts with suspended applications and withdrawals. As observable prices are not available for these securities, the Responsible Entity has used valuation techniques to derive fair value.
DIMENSIONAL TRUSTSNotes to the Financial Statements for the year ended 30 June 2019
92 Annual Report 2019

12. Financial risk management (continued)(h) Fair value measurement (continued)
(iii) Transfers between levels
Dimensional Global Core Equity Trust Dimensional Global Real Estate Trust
As at 30 June 2019Level 1
$’000Level 2
$’000Level 3
$’000Level 1
$’000Level 2
$’000Level 3
$’000
Transfers between levels:
Equity securities (679) – 679 – – –
Total (679) – 679 – – –
Dimensional Global Large Company Trust Dimensional Global Small Company Trust Dimensional Emerging Markets Trust
As at 30 June 2019Level 1
$’000Level 2
$’000Level 3
$’000Level 1
$’000Level 2
$’000Level 3
$’000Level 1
$’000Level 2
$’000Level 3
$’000
Transfers between levels:
Equity securities (1) – 1 (331) – 331 (143) – 143
Total (1) – 1 (331) – 331 (143) – 143
Dimensional Global Core Equity Trust:For the Dimensional Global Core Equity Trust, the transfer from Level 1 to Level 3 relates to thirteen securities. These securities were suspended, delisted or priced per the portfolio manager’s recommendation.
Dimensional Global Real Estate Trust:For the Dimensional Global Real Estate Trust, the transfer from Level 1 to Level 3 relates to one security priced per the portfolio manager’s recommendation.
Dimensional Global Small Company Trust:For the Dimensional Global Small Company Trust, the transfer from Level 1 to Level 3 relates to thirteen securities. These securities were suspended, delisted or priced per the portfolio manager’s recommendation.
Dimensional Emerging Markets Trust:For the Dimensional Emerging Markets Trust, the transfer from Level 1 to Level 3 relates to twelve securities. These securities were suspended, delisted or priced per the portfolio manager’s recommendation.
One security was transferred from Level 3 to Level 1.
DIMENSIONAL TRUSTSNotes to the Financial Statements for the year ended 30 June 2019
93Annual Report 2019

12. Financial risk management (continued)(h) Fair value measurement (continued)
(iii) Transfers between levels (continued)
Dimensional Global Core Equity Trust Dimensional Global Real Estate Trust
As at 30 June 2018Level 1
$’000Level 2
$’000Level 3
$’000Level 1
$’000Level 2
$’000Level
3 $’000
Transfers between levels:
Equity securities (213) – 213 – – –
Listed unit trusts – – – (2) – 2
Total (213) – 213 (2) – 2
Dimensional Global Small Company Trust Dimensional Emerging Markets Trust
As at 30 June 2018Level 1
$’000Level 2
$’000Level 3
$’000Level 1
$’000Level 2
$’000Level 3
$’000
Transfers between levels:
Equity securities (126) – 126 (13) – 13
Total (126) – 126 (13) – 13
Dimensional Global Core Equity Trust:For the Dimensional Global Core Equity Trust, the transfer from Level 1 to Level 3 relates to ten securities. Nine securities were suspended or delisted and one security was priced per the portfolio manager’s recommendation. Two securities were transferred from Level 3 to Level 1.
Dimensional Global Real Estate Trust:For the Dimensional Global Real Estate Trust, the transfer from Level 1 to Level 3 relates to one security that was delisted.
Dimensional Global Small Company Trust:For the Dimensional Global Small Company Trust, the transfer from Level 1 to Level 3 relates to eleven securities. Nine securities were suspended or delisted and one security was priced per the portfolio manager’s recommendation. The other security is in trading halt. One security was transferred from Level 3 to Level 1.
Dimensional Emerging Markets Trust:For the Dimensional Emerging Markets Trust, the transfer from Level 1 to Level 3 relates to one security that was suspended. Four securities were transferred from Level 3 to Level 1.
DIMENSIONAL TRUSTSNotes to the Financial Statements for the year ended 30 June 2019
94 Annual Report 2019

12. Financial risk management (continued)(h) Fair value measurement (continued)
(iv) Movement in Level 3 instruments
The following table presents the movement for the year ended 30 June 2019 and 30 June 2018 by class of financial instrument.
Dimensional Global Core Equity Trust Dimensional Global Real Estate Trust
30 June 2019 30 June 2018 30 June 2019 30 June 2018
$’000 $’000 $’000 $’000Listed EquitiesOpening balance 252 106 2 132Purchases – 21 – –Sales (14) (30) (2) –Transfer into Level 3 679 213 – 2Total realised gains/(losses) on Level 3 financial instruments 5 (165) (187) (43)Total unrealised losses/gains on Level 3 financial instruments (135) 107 187 (89)Closing balance 787 252 – 2Total net losses for the year included in the Statements of Comprehensive Income for financial assets and liabilities at the end of the year (130) (58) – (132)
Dimensional Global Value Trust Dimensional Global Large Company Trust
30 June 2019 30 June 2018 30 June 2019 30 June 2018
$’000 $’000 $’000 $’000Listed EquitiesOpening balance – 16 1 1Purchases – – – –Sales – (14) (1) (1)Transfer into Level 3 – – 1 –Total realised gains on Level 3 financial instruments – 14 1 1Total unrealised losses on Level 3 financial instruments – (16) (1) –Closing balance – – 1 1Total net losses/gains for the year included in the Statements of Comprehensive Income for financial assets and liabilities at the end of the year – (2) – 1
DIMENSIONAL TRUSTSNotes to the Financial Statements for the year ended 30 June 2019
95Annual Report 2019

12. Financial risk management (continued)(h) Fair value measurement (continued)
(iv) Movement in Level 3 instruments (continued)
Dimensional Global Small Company Trust Dimensional Emerging Markets Trust
30 June 2019 30 June 2018 30 June 2019 30 June 2018
$’000 $’000 $’000 $’000
Listed Equities
Opening balance 143 26 209 794
Purchases – 4 – 46
Sales (25) – – –
Transfer into Level 3 331 126 143 13
Total realised (losses) on Level 3 financial instruments (35) (170) – (3)
Total unrealised losses/gains on Level 3 financial instruments (20) 157 (93) (641)
Closing balance 394 143 259 209
Total net losses for the year included in the Statements of Comprehensive Income for financial assets and liabilities at the end of the year (55) (13) (93) (644)
(v) Valuation inputs and relationship to fair value
There were no significant inter-relationships between unobservable inputs that materially affect fair value.The carrying value of receivables and payables are assumed to approximate their fair value.
13. Structured entities A structured entity is an entity in which voting or similar rights are not the dominant factors in deciding control. The nature and extent of the Schemes’ interests in structured entities are summarised in Note 3 ’Financial assets at fair value through profit or loss’and Note 11 ’Related party transactions’ where appropriate. The total size of the structured entities that the Schemes have exposure to is their net assets, which is determined based on the percentage interest held and carrying value disclosed in Note 11 ’Related party transactions’.
The Schemes have exposures to unconsolidated structured entities through their trading activities. These Schemes typically have no other involvement with the structured entity other than the securities they hold as part of trading activities and their maximum exposure to loss is restricted to the carrying value of the asset. Exposures to trading assets are managed in accordance with financial risk management practices as set out in Note 12.
14. Contingent assets and liabilities and commitmentsThe Schemes did not have any contingent assets, liabilities or commitments as at 30 June 2019 (30 June 2018: nil).
15. Subsequent eventsNo significant events have occurred since the end of the reporting period which would impact on the financial position of the Schemes disclosed in the Statements of Financial Position as at 30 June 2019 or on the results and cash flows of the Schemes for the year ended on that date.
DIMENSIONAL TRUSTSNotes to the Financial Statements for the year ended 30 June 2019
96 Annual Report 2019

The Financial Statements and notes thereto of the following Schemes have been prepared by the DFA Australia Limited (the Responsible Entity) in accordance with the Corporations Act 2001.
Dimensional Global Core Equity Trust
Dimensional Global Real Estate Trust
Dimensional Global Sustainability Trust
Dimensional Global Value Trust
Dimensional Global Large Company Trust
Dimensional Global Small Company Trust
Dimensional Emerging Markets Trust
In the opinion of the Directors of the Responsible Entity:
(a) there are reasonable grounds to believe that the Schemes will be able to pay their debts as and when they become due and payable; and
(b) the Financial Statements and Notes thereto of the Schemes are in accordance with the Corporations Act 2001, including:
(i) complying with Accounting Standards, the Corporations Regulations 2001 and other mandatory professional reporting requirements; and
(ii) giving a true and fair view of the Schemes’ financial positions as at 30 June 2019 and of their performances for the financial year ended on that date.
(c) the Financial Statements also comply with International Financial Reporting Standards issued by the International Accounting Standards Board as disclosed in Note 2.
Signed in accordance with a resolution of the Directors of the Responsible Entity made pursuant to section 295(5) of the Corporations Act 2001.
On behalf of the Directors,
J.G. Crane N.A.D. Stewart
Director Director
Sydney, 17 September 2019
DIMENSIONAL TRUSTSDirectors’ Declaration for the year ended 30 June 2019
97Annual Report 2019

FPO
DIMENSIONAL TRUSTSIndependent Auditor’s Report to the Unitholders of Dimensional Trusts
98 Annual Report 2019

DIMENSIONAL TRUSTSIndependent Auditor’s Report to the Unitholders of Dimensional Trusts
99Annual Report 2019

DIMENSIONAL TRUSTSIndependent Auditor’s Report to the Unitholders of Dimensional Trusts
100 Annual Report 2019

