dipl.chem. andreas daiber dissertation
TRANSCRIPT
Dipl.Chem.Andreas DaiberDissertation
Universitat Konstanz
Fachbereich Biologie
Lehrstuhl Biologische Chemie
Prof. Dr. V. Ullrich
Universitat KonstanzFachbereich BiologieLehrstuhl Biologische ChemieProf. Dr. V. Ullrich
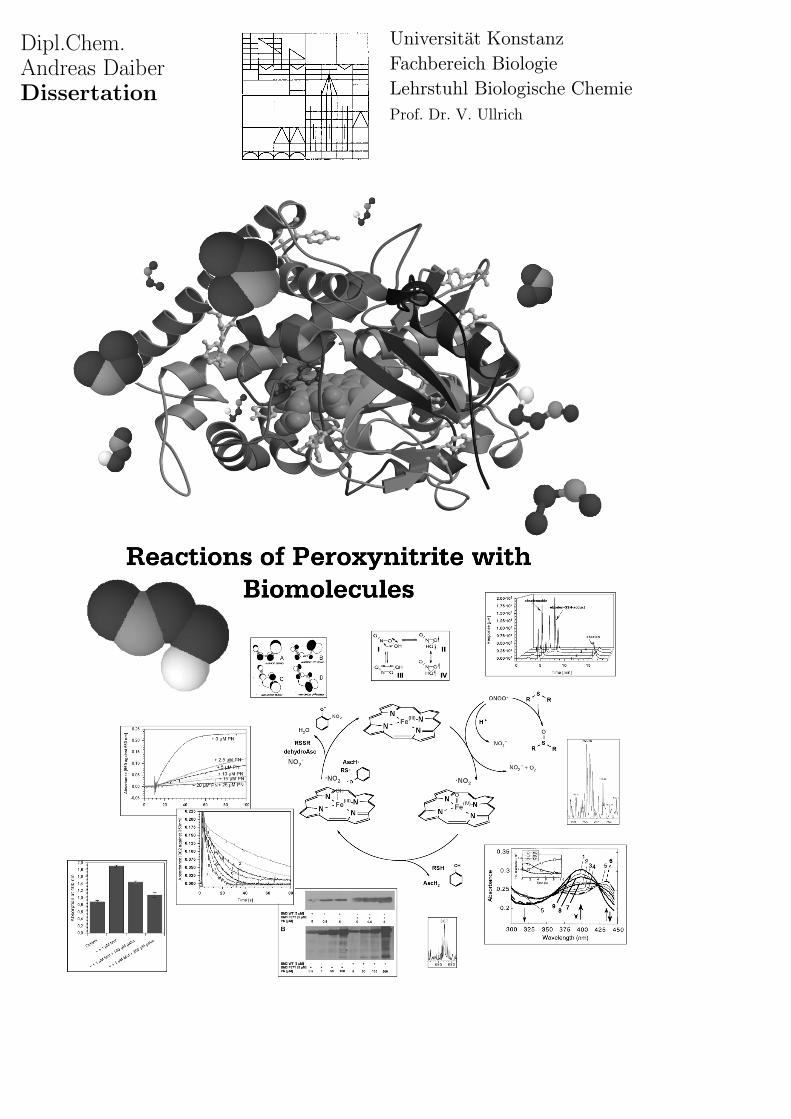
Reactions of Peroxynitrite with
Biomolecules
Dissertation
zur Erlangung des Grades eines Doktors der
Naturwissenschaften der Fakultat fur Biologie der
Universitat Konstanz
vorgelegt von
Dipl.Chem. Andreas Daiber
Konstanz, February 2000
Diese Arbeit ist meiner Frau Tanja
und meinem Sohn Erik gewidmet
fur ihre Liebe, ihre Geduld
und fur das Gluck
mit dem sie mich beschenken.

Acknowledgments
This work was carried out during November 1997 and January 2000 at the depart-
ment of Biological Chemistry, Faculty of Biology, University of Konstanz under
the supervision of Prof. Dr. Volker Ullrich. I’m grateful to
• Prof. Ullrich for expert advising and excellent working conditions. Moreoverfor plenty of helpful discussions and his encouragement. Last but not least
I’m thankful for pushing me sometimes harder than I would have done by
myself. For all these reasons this work could be finished within a short
timescale and was accompanied by the publications listed below.
• My parents for their understanding, encouragement and love. FurthermoreI am indepted to them for their financial support during the 7 years of my
studies and for always lending me a helping hand in problematic times.
• My brothers Jurgen and Wolfgang for always being there for me, wheneverI needed them, for scientific interest and for their friendship. But most for
the splendid time I am having with them.
• My parents in law for their continuous financial support of my family andmyself.
• My colleagues Dr.Dr. Ming-Hui Zou, Martin Mehl, Dr. Ralf Bogumil,Dmitry Namgaladze, Kai Schuler, Patrick Schmidt, Markus Bachschmid
for good cooperation and for helpful discussions and together with Regina
Baudler, Gudrun von Scheeven, Tanja Stengele, Elisabeth Mussig for the
good working atmosphere and helping me whenever it was necessary.
• My dear colleague Peter Weber, who knew always a joke and was an expertin handling electronic and optical maschines. But he was also famous for
his cooking and his feeling when it was the right time for a party.
• Gisela Naschwitz for encouraging words and for always helping with officialthings.
• My friend Michael Schurle for his friendship and the phantastic time wehad together during the last 7 years and all my other friends for supporting
me so much.
• Alexandra Megner, Oliver Godden, Karin Burger, Monika Kulartz, MichaelWalliser for their engagement during the labcourses and all other people
who helped me working on these studies.

• Dr. Susanna Herold (ETH Zurich) for the good cooperation concerning
the stopped-flow measurements, Prof. Christian Schoneich for running the
MS-analysis of tryptic digestions and Prof. Sandro Ghisla for helping me
with additional stopped-flow measurements. Dmitry Namgaladze and Pa-
trick Schmidt for doing some of the Western blots.
Relevant Publications
• A. Daiber, M. Mehl, and V. Ullrich (1998) New aspects in the reaction
mechanism of phenol with peroxynitrite: the role of phenoxy radicals. Nitric
Oxide: Biol. Chem., 2, 259-269.
• V. Ullrich, M.H. Zou, A. Daiber, M. Mehl, and H.J. Bidmon (1998) Cellulartargets and reaction mechanism of peroxynitrite. Pharmacology of cerebral
ischemia. J. Krieglstein (Ed.), Medpharm Scientific Publishers Stuttgart,
251-256.
• M. Mehl, A. Daiber, S. Herold, H. Shoun, and V. Ullrich (1999) Peroxyni-trite reaction with heme proteins. Nitric Oxide: Biol. Chem., 3, 142-152.
• A. Daiber, M.H. Zou, M. Bachschmid, and V. Ullrich (2000) Ebselen asa peroxynitrite scavenger in vitro and ex vivo. Biochem. Pharmacol., 59,
153-160.
• M.H. Zou, A. Daiber, M. Bachschmid, and V. Ullrich. Nitration of prosta-cyclin synthase: mechanism and physiological implications. Free Rad. Biol.
Med., in press.
• M.H. Zou, A. Daiber, J.A. Peterson, H. Shoun, and V. Ullrich. (2000) Ra-pid reactions of peroxynitrite with heme-thiolate proteins as the basis for
protection of prostacyclin synthase from inactivation by nitration. Arch.
Biochem. Biophys., 375, in press.
• A. Daiber, S. Herold, C. Schoneich, K. Burger, D. Namgaladze, M. Mehl,J.A. Peterson, and V. Ullrich. Autocatalytic tyrosine nitration of cytochro-
me P450BM−3 and its F87Y mutant by peroxynitrite. Submitted to Bioche-
mistry.
• A. Daiber, C. Schoneich, P. Schmidt, C. Jung, and V. Ullrich. Autocatalyticnitration of P450CAM by peroxynitrite. Submitted to J. Inorg. Biochem..

Relevant Presentations
• Poster at the ”4. NO Forum der deutschsprachigen Lander” (May 1998),
Dusseldorf, Germany.
• Poster at the ”5. NO Forum der deutschsprachigen Lander” (April 1999),
Erlangen, Germany.
• Poster at the ”2nd International Conference on the Biology and Chemistryof Peroxynitrite” (1999) in Heraklion, Crete, Greece.
• V. Ullrich, M.H. Zou, A. Daiber, and H. Shoun (1999) Book of Abstracts,11th International Conference on Cytochrome P450, Sendai, Japan.
• V. Ullrich, and A. Daiber (1999) DFG Schwerpunktprogramm ”Radikale inder enzymatischen Katalyse”, Marburg, Germany.
CONTENTS i
Contents
1 Introduction 1
1.1 Nitric Oxide . . . . . . . . . . . . . . . . . . . . . . . . . . . . . . 2
1.1.1 Biosynthesis of Nitric Oxide . . . . . . . . . . . . . . . . . 2
1.1.2 Chemical Sources and Determination of Nitric Oxide . . . 3
1.1.3 Chemistry of Nitric Oxide . . . . . . . . . . . . . . . . . . 4
1.1.4 Biology of Nitric Oxide . . . . . . . . . . . . . . . . . . . . 7
1.2 Superoxide . . . . . . . . . . . . . . . . . . . . . . . . . . . . . . . 7
1.2.1 Biosynthesis of Superoxide . . . . . . . . . . . . . . . . . . 7
1.2.2 Chemical Sources and Determination of Superoxide . . . . 9
1.2.3 Chemistry of Superoxide . . . . . . . . . . . . . . . . . . . 10
1.2.4 Biology of Superoxide . . . . . . . . . . . . . . . . . . . . 11
1.3 Peroxynitrite (PN) . . . . . . . . . . . . . . . . . . . . . . . . . . 11
1.3.1 History and Properties of PN . . . . . . . . . . . . . . . . 11
1.3.2 Chemical Sources and Determination of PN . . . . . . . . 15
1.3.3 Chemistry of PN . . . . . . . . . . . . . . . . . . . . . . . 16
1.3.4 Biology of PN . . . . . . . . . . . . . . . . . . . . . . . . . 20
1.4 Compound I and II . . . . . . . . . . . . . . . . . . . . . . . . . . 23
1.5 Oxidative Stress . . . . . . . . . . . . . . . . . . . . . . . . . . . . 27
2 Aims of the Study 30
3 Materials and Methods 31
3.1 Reactions of Phenolic Compounds with Peroxynitrite . . . . . . . 31
3.1.1 Chemicals . . . . . . . . . . . . . . . . . . . . . . . . . . . 31
3.1.2 Peroxynitrite Synthesis . . . . . . . . . . . . . . . . . . . . 31
3.1.3 Oxygen Measurements . . . . . . . . . . . . . . . . . . . . 31
3.1.4 Nitric Oxide Measurements . . . . . . . . . . . . . . . . . 31
3.1.5 Determination of Nitrate and Nitrite . . . . . . . . . . . . 32
3.1.6 Products of the Phenol-PN-reaction . . . . . . . . . . . . . 32
3.1.7 Products of the Anisol-PN-reaction . . . . . . . . . . . . . 34
3.1.8 Reactions of Tyrosine with Peroxynitrite, Nitric Oxide and
PN-generating Systems . . . . . . . . . . . . . . . . . . . . 34
3.2 Scavengers for Peroxynitrite . . . . . . . . . . . . . . . . . . . . . 35
3.2.1 Materials . . . . . . . . . . . . . . . . . . . . . . . . . . . 35
3.2.2 Inhibitors of Phenol Nitration . . . . . . . . . . . . . . . . 35
3.2.3 Inhibitors of Microperoxidase-catalyzed Phenol Nitration . 36
3.2.4 Inhibitors for the Inactivation of ADH by PN . . . . . . . 36
CONTENTS ii
3.2.5 Kinetics of PN-decomposition . . . . . . . . . . . . . . . . 36
3.2.6 Investigation of the Reaction of Uric Acid with PN . . . . 37
3.2.7 Reaction of Ebselen with Peroxynitrite . . . . . . . . . . . 38
3.2.7.1 Materials . . . . . . . . . . . . . . . . . . . . . . 38
3.2.7.2 Separation of ebselen, GSH-ebselen and ebse-
lenoxide . . . . . . . . . . . . . . . . . . . . . . . 38
3.2.7.3 Determination of free ebselen concentrations in
bovine aortic microsomes and tissue-containing
solutions . . . . . . . . . . . . . . . . . . . . . . . 38
3.2.7.4 Protective effects of ebselen, GSH and ebselen-
GSH on phenol- and BSA-nitration . . . . . . . . 39
3.3 Metal-catalyzed Reactions of PN . . . . . . . . . . . . . . . . . . 39
3.3.1 Decomposition Kinetics of PN . . . . . . . . . . . . . . . . 39
3.3.2 Metal-catalyzed Nitration of Phenol . . . . . . . . . . . . . 39
3.3.3 Spectral Intermediates During Reaction of PN with
Transition-metals . . . . . . . . . . . . . . . . . . . . . . . 40
3.4 Reactions of PN with P450BM−3 . . . . . . . . . . . . . . . . . . . 40
3.4.1 Materials . . . . . . . . . . . . . . . . . . . . . . . . . . . 40
3.4.2 Nitration of Free Tyrosine by Bolus Addition and Simulta-
neously Generated PN . . . . . . . . . . . . . . . . . . . . 41
3.4.3 Nitration of P450BM−3 WT and F87Y Variant by Bolus
Addition and Simultaneously Generated PN . . . . . . . . 42
3.4.4 Inhibition of PN-mediated Nitration of Phenol and
P450BM−3 by Palmitate . . . . . . . . . . . . . . . . . . . . 43
3.4.5 Localisation of Nitrated Tyrosines in P450BM−3 WT and
F87Y . . . . . . . . . . . . . . . . . . . . . . . . . . . . . . 43
3.4.6 Electrospray Ionization (ESI) Mass Spectrometry . . . . . 44
3.4.7 Measurements of P450BM−3 Reductase Activity and Deter-
mination of Thiol-groups within the Enzyme . . . . . . . . 44
3.4.8 Monooxygenase Activity Assay for P450BM−3 WT . . . . . 45
3.4.9 Stopped-flow Measurements . . . . . . . . . . . . . . . . . 45
3.4.10 Structure of P450BM−3 . . . . . . . . . . . . . . . . . . . . 45
3.5 Reactions of P450CAM with PN . . . . . . . . . . . . . . . . . . . 45
3.5.1 Materials . . . . . . . . . . . . . . . . . . . . . . . . . . . 45
3.5.2 P450CAM-catalyzed Nitration of Phenol and Tyrosine
Residues by PN . . . . . . . . . . . . . . . . . . . . . . . . 46
3.5.3 Camphor Binding Spectra of P450CAM after Treatment
with PN . . . . . . . . . . . . . . . . . . . . . . . . . . . . 47

CONTENTS iii
3.5.4 CO-binding Spectra of Reduced P450 Enzymes after Treat-
ment with PN . . . . . . . . . . . . . . . . . . . . . . . . . 47
3.5.5 Decomposition Kinetics of PN in Presence of P450CAM,
P450NOR and Microperoxidase and Stopped-flow Analysis
of the Reaction of P450CAM with PN . . . . . . . . . . . . 47
4 Results 48
4.1 Reactions of Peroxynitrite with Phenolic Compounds . . . . . . . 48
4.1.1 Short Introduction . . . . . . . . . . . . . . . . . . . . . . 48
4.1.2 The Contribution of Nitrite . . . . . . . . . . . . . . . . . 48
4.1.3 The Disproportionation of Peroxynitrite . . . . . . . . . . 49
4.1.4 The Reaction of Phenol with Peroxynitrite . . . . . . . . . 50
4.1.5 Dimerization of Phenolic Intermediates . . . . . . . . . . . 52
4.1.6 The Reaction of Anisol with PN . . . . . . . . . . . . . . . 53
4.1.7 Nitrosylation of Phenol and Anisol . . . . . . . . . . . . . 54
4.1.8 Tyrosine Nitration by Bolus-added and Simultaneously
Generated PN . . . . . . . . . . . . . . . . . . . . . . . . . 55
4.2 Scavengers for Peroxynitrite . . . . . . . . . . . . . . . . . . . . . 57
4.2.1 Short Introduction . . . . . . . . . . . . . . . . . . . . . . 57
4.2.1.1 Searching for scavengers of PN requires under-
standing the nature of PN-reactions . . . . . . . 57
4.2.1.2 The test systems . . . . . . . . . . . . . . . . . . 58
4.2.2 Inhibitors for the Nitration of Phenol by Peroxynitrite . . 58
4.2.3 Inhibitors for the Oxidation and Inactivation of ADH by PN 62
4.2.4 Kinetics of Reactions of Scavengers with PN . . . . . . . . 62
4.2.5 Reaction of Uric Acid with PN . . . . . . . . . . . . . . . 64
4.2.6 Reactions of Ebselen with Peroxynitrite . . . . . . . . . . . 66
4.2.6.1 Short introduction . . . . . . . . . . . . . . . . . 66
4.2.6.2 The fate of ebselen in tissues . . . . . . . . . . . 67
4.2.6.3 The reaction of PN with ebselen in the absence
and presence of thiols . . . . . . . . . . . . . . . 68
4.2.6.4 Why is ebselen a good scavenger for PN-anion? . 70
4.3 Reactions of Peroxynitrite with Transition-metals . . . . . . . . . 72
4.3.1 Effect of Metal-containing Enzymes on PN-decomposition
Kinetics and the Nitrite:Nitrate Ratio . . . . . . . . . . . . 72
4.3.2 Metal-catalyzed Nitration of Phenol by Peroxynitrite . . . 75
4.3.3 Formation of High-valence Metal-species during Reactions
of Transition-metals with Peroxynitrite . . . . . . . . . . . 78
CONTENTS iv
4.4 Autocatalytic Tyrosine Nitration of Cytochrome P450BM−3 and its
F87Y Mutant by Peroxynitrite . . . . . . . . . . . . . . . . . . . . 81
4.4.1 Short Introduction . . . . . . . . . . . . . . . . . . . . . . 81
4.4.2 Nitration of P450BM−3 . . . . . . . . . . . . . . . . . . . . 82
4.4.3 Localisation of Nitrated Tyrosine Residues . . . . . . . . . 87
4.4.4 Spectral Intermediates During Reactions of P450BM−3 and
Chloroperoxidase with Peroxynitrite . . . . . . . . . . . . 88
4.4.5 Effect of Peroxynitrite on Monooxygenase Activity . . . . 91
4.5 Reaction of P450CAM with Peroxynitrite . . . . . . . . . . . . . . 94
4.5.1 P450CAM-catalyzed Nitration of Phenol by Peroxynitrite . 94
4.5.2 Autocatalyzed Nitration of P450CAM by Peroxynitrite . . . 96
4.5.3 Camphor-binding and CO-binding of Native and PN-
treated P450CAM . . . . . . . . . . . . . . . . . . . . . . . 98
4.5.4 Kinetic Measurements of the Reaction of P450CAM with PN 100
5 Discussion 102
5.1 The Role of Phenoxy Radicals in Reactions of Peroxynitrite with
Phenolic Compounds . . . . . . . . . . . . . . . . . . . . . . . . . 102
5.2 The Nature of Peroxynitrite-mediated Reactions and the Require-
ments for Potent Inhibitors . . . . . . . . . . . . . . . . . . . . . . 105
5.2.1 Pitfalls when Using Ebselen as a Scavenger in Biological
Systems . . . . . . . . . . . . . . . . . . . . . . . . . . . . 108
5.3 Spectral Intermediates During Reaction of PN with Transition-
metals and Their Effects on PN-decomposition and PN-mediated
Nitration . . . . . . . . . . . . . . . . . . . . . . . . . . . . . . . . 110
5.4 Reactions of the Monooxygenase P450BM−3 with Peroxynitrite . . 113
5.4.1 Metal-catalyzed Nitration of Protein-bound Tyrosines and
Inactivation of P450BM−3 . . . . . . . . . . . . . . . . . . . 113
5.4.2 Nitration of Tyrosines under Biological Conditions . . . . . 115
5.4.3 Spectral Intermediates During Reactions of P450 Enzymes
and PN . . . . . . . . . . . . . . . . . . . . . . . . . . . . 116
5.5 Reactions of Peroxynitrite and Cytochrome P450CAM . . . . . . . 118
6 Outlook 121
7 Summary 122
7.1 Zusammenfassung . . . . . . . . . . . . . . . . . . . . . . . . . . . 123
References 126

CONTENTS v
A Appendix 151
A.1 Chemical Structures . . . . . . . . . . . . . . . . . . . . . . . . . 151
A.2 Sequences of P450CAM and P450BM−3 . . . . . . . . . . . . . . . . 153

LIST OF FIGURES vi
List of Figures
1 Formation of ·NO by NOS . . . . . . . . . . . . . . . . . . . . . . 3
2 Cofactors of NOS . . . . . . . . . . . . . . . . . . . . . . . . . . . 4
3 Proposed mechanism for the formation of superoxide by XO . . . 9
4 Pathways for PN decomposition . . . . . . . . . . . . . . . . . . . 13
5 Formation of ONOOH∗ . . . . . . . . . . . . . . . . . . . . . . . . 14
6 Isomerization of PN on MO-basis . . . . . . . . . . . . . . . . . . 14
7 Different methods to synthesize PN . . . . . . . . . . . . . . . . . 15
8 Different reactivity of ONOO− and ONOOH . . . . . . . . . . . . 19
9 Sulfoxidation of thio-ethers by Compound I . . . . . . . . . . . . 25
10 Monooxygenation of an alkane by a P450 enzyme . . . . . . . . . 26
11 Sources and defenses for reactive oxygen species . . . . . . . . . . 29
12 NO-release from acidic nitrite solutions . . . . . . . . . . . . . . . 49
13 Products formed from reaction of phenol in acidic nitrite solutions 49
14 Oxygen formation during disproportionation of PN . . . . . . . . 50
15 Kinetics of oxygen release from PN at different pH . . . . . . . . 50
16 Nitrite and nitrate formation from PN-decomposition . . . . . . . 50
17 Chromatogram of phenol hydroxylation products . . . . . . . . . 51
18 Chromatogram of phenol nitration and dimerization products . . 51
19 pH-dependent formation of hydroxyproducts in reactions of phenol
with PN . . . . . . . . . . . . . . . . . . . . . . . . . . . . . . . . 52
20 pH-dependent formation of nitration products in reactions of phe-
nol with PN . . . . . . . . . . . . . . . . . . . . . . . . . . . . . . 52
21 pH-dependent formation of dimerization products in reactions of
phenol with PN . . . . . . . . . . . . . . . . . . . . . . . . . . . . 52
22 Yield of nitro- and biphenols in dependence of phenol concentration
at pH 7 . . . . . . . . . . . . . . . . . . . . . . . . . . . . . . . . 53
23 Yield of nitroso- and biphenols in dependence of phenol concentra-
tion at pH 9 . . . . . . . . . . . . . . . . . . . . . . . . . . . . . . 53
24 Formation of hydroxy- and nitro-anisol by PN at different pH . . 54
25 Reaction of anisol with nitric oxide and nitrogen dioxide . . . . . 54
26 Decrease of 4-nitroso-phenol yield from PN by azide . . . . . . . . 55
27 PN concentration-dependent formation of 4-nitroso-phenol . . . . 55
28 3-nitro-tyrosine formation from PN and tyrosine . . . . . . . . . . 56
29 Chromatogram of 3-NT and 3,3’-DT . . . . . . . . . . . . . . . . 56
30 3-NT and 3,3’-DT formation from tyrosine and spermine NONOate 56
31 Influence of oxygen on 3-NT yield in acidic nitrite solutions . . . . 56
LIST OF FIGURES vii
32 Chromatogram of 3-HT in reactions of tyrosine with PN or
XO/NONOate . . . . . . . . . . . . . . . . . . . . . . . . . . . . . 57
33 Yield of 3-HT in reactions of tyrosine with PN, XO and/or NONOate 57
34 Nitration of phenol in dependence of scavenger concentration . . . 59
35 Effect of different scavengers on nitration and hydroxylation of
phenol by PN . . . . . . . . . . . . . . . . . . . . . . . . . . . . . 61
36 Effect of different scavengers on MP-11-catalyzed nitration of phe-
nol by PN . . . . . . . . . . . . . . . . . . . . . . . . . . . . . . . 61
37 More scavengers for nitration and oxidation of phenol by PN . . . 61
38 IC50-value for the oxidation and inactivation of ADH by PN . . . 63
39 IC50-value for the oxidation and inactivation of ADH by nitric oxide 63
40 Kinetics of PN-decomposition in presence of scavengers . . . . . . 64
41 Chromatograms of the reaction of uric acid with PN at different pH 65
42 Chromatogram of the reaction of 1.3-DMUA with PN . . . . . . . 66
43 Adduct-formation of ebselen with thiols in tissue . . . . . . . . . . 67
44 Binding spectra of ebselen with GSH . . . . . . . . . . . . . . . . 67
45 Chromatograms of ebselen after incubation with bovine aortic mi-
crosomes . . . . . . . . . . . . . . . . . . . . . . . . . . . . . . . . 68
46 Chromatograms of ebselen after reaction with PN at different pH 69
47 PN-decompostion kinetics in presence of ebselen and GSH . . . . 70
48 PN-decompostion kinetics in presence of ebselen and BSA . . . . 70
49 Effect of ebselen, GSH and ebselen-GSH-adduct on tyrosine nitra-
tion by PN . . . . . . . . . . . . . . . . . . . . . . . . . . . . . . 70
50 Titration spectra of 2-mercapto-bez-selenazole with PN . . . . . . 71
51 PN-decomposition in presence of 2-mercapto-benz-selenazole . . . 71
52 Kinetics of PN-decomposition in presence of different heme- and
heme-thiolate enzymes (part I) . . . . . . . . . . . . . . . . . . . 72
53 Kinetics of PN-decomposition in presence of different heme- and
heme-thiolate enzymes (part II) . . . . . . . . . . . . . . . . . . . 72
54 Kinetics of PN-decomposition in presence of different heme- and
heme-thiolate enzymes (part III) . . . . . . . . . . . . . . . . . . 74
55 Kinetics of oxygen release from PN in presence of metal-enzymes . 74
56 Nitrite:nitrate ratio from decayed PN in dependence of buffer and
MP-11 concentration . . . . . . . . . . . . . . . . . . . . . . . . . 74
57 Kinetics of phenol nitration by PN in presence and absence of MP-11 75
58 Nitration of phenol in dependence of iron-containing complexes
and enzymes . . . . . . . . . . . . . . . . . . . . . . . . . . . . . . 76
59 Intermediate bands during reactions of Fe(III)edta with H2O2 or PN 79

LIST OF FIGURES viii
60 Intermediate bands during reactions of HRP with SIN-1 and ·NO 80
61 Visible region of the PN-generated ferryl-species of HRP . . . . . 80
62 Stopped-flow spectra of a reaction mixture of NOR and PN . . . . 81
63 Visible region of the stopped-flow spectra of a reaction mixture of
NOR and PN . . . . . . . . . . . . . . . . . . . . . . . . . . . . . 81
64 Rate constants for the reaction of NOR with PN in dependence of
pH . . . . . . . . . . . . . . . . . . . . . . . . . . . . . . . . . . . 81
65 Western blot of PN-treated BM3 . . . . . . . . . . . . . . . . . . 83
66 Western blot of BM3 WT after treatment with PN-generating sys-
tems or nitric oxide . . . . . . . . . . . . . . . . . . . . . . . . . . 83
67 Ponceau S stained gel for Western blot in Fig.65 . . . . . . . . . 83
68 Ponceau S stained gel for Western blot in Fig.69 . . . . . . . . . 83
69 Western blot of BM3 F87Y after treatment with XO/NONOate in
presence of protease inhibitors . . . . . . . . . . . . . . . . . . . . 84
70 Western blots of BM3 F87Y after treatment with PN in presence
of scavengers . . . . . . . . . . . . . . . . . . . . . . . . . . . . . 84
71 Anti-NT Western blot of BM3 F87Y and WT after exposure to
pyrogallol and diethyl NONOate . . . . . . . . . . . . . . . . . . . 85
72 Palmitate inhibits the BM3-WT-catalyzed nitration of phenol by
PN . . . . . . . . . . . . . . . . . . . . . . . . . . . . . . . . . . . 86
73 Palmitate inhibits the BM3 F87Y-catalyzed nitration of phenol by
PN . . . . . . . . . . . . . . . . . . . . . . . . . . . . . . . . . . . 86
74 Palmitate inhibits the autocatalyzed nitration of BM3-WT and
F87Y by PN (part I) . . . . . . . . . . . . . . . . . . . . . . . . . 87
75 Palmitate inhibits the autocatalyzed nitration of BM3-WT and
F87Y by PN (part II) . . . . . . . . . . . . . . . . . . . . . . . . . 87
76 Chromatograms of the tryptic digestion of PN-treated WT and F87Y 88
77 Stopped-flow spectra of the reaction of BM3 with PN . . . . . . . 90
78 Stopped-flow spectra of the reaction of CPO with PN . . . . . . . 90
79 Specific activity of BM3 in dependence of PN-concentration . . . 92
80 Kinetic measurements of the monooxygenase activity of BM3 WT 92
81 Effect of antioxidants on inactivation of BM3 by PN . . . . . . . . 92
82 Reductase activity of the BM3 reductase domain in dependence of
PN-concentration . . . . . . . . . . . . . . . . . . . . . . . . . . . 93
83 Kinetic measurements of the reductase activity of BM3 WT . . . 93
84 Determination of the thiol status of PN-treated and not-treated
BM3-WT . . . . . . . . . . . . . . . . . . . . . . . . . . . . . . . 94

LIST OF FIGURES ix
85 α-NT Western blot of CAM, nitrated in the presence and absence
of camphor . . . . . . . . . . . . . . . . . . . . . . . . . . . . . . 96
86 α-NT Western blot of CAM, nitrated in the presence of metyrapone 96
87 Chromatograms of trypsin-digested PN-treated CAM . . . . . . . 97
88 Chromatograms of digested CAM after treatment with PN in pres-
ence and absence of metyrapone . . . . . . . . . . . . . . . . . . . 98
89 α-NT Western blot of BM3, nitrated in the presence of metyrapone 98
90 Camphor-binding spectra of CAM after treatment with PN . . . . 99
91 CO-binding spectra of CAM after treatment with PN . . . . . . . 99
92 Stopped-flow spectra of CAM (substrate-free) with PN . . . . . . 101
93 Stopped-flow spectra of CAM (substrate-bound) with PN . . . . . 101
94 PN-decomposition kinetics in the presence of CAM . . . . . . . . 101
95 Scheme with the major reaction pathways in the phenol-PN system 102
96 Scheme for the mechanisms of phenol nitration, hydroxylation and
dimerization by PN . . . . . . . . . . . . . . . . . . . . . . . . . . 104
97 Scheme for the hydroxylation of anisol by PN . . . . . . . . . . . 105
98 The two possibilities for PN-scavenger actions . . . . . . . . . . . 107
99 Proposed reaction-scheme for ebselen with GSH . . . . . . . . . . 108
100 Reaction pathways of PN in metal-free systems . . . . . . . . . . 112
101 Reaction pathways of PN in metal-containing systems . . . . . . . 112
102 X-ray structure of BM3 WT without the reductase domain . . . . 114
103 Underlying mechanism for the monooxygenase activity assay of BM3115
104 Formation of PN by SIN-1 and of ·NO by NONOate . . . . . . . . 116105 Crystal structure of P450CAM (side view) . . . . . . . . . . . . . . 119
106 Crystal structure of P450CAM (top view) . . . . . . . . . . . . . . 119
107 Structures of PN scavengers . . . . . . . . . . . . . . . . . . . . . 151
108 Structures of PN scavengers . . . . . . . . . . . . . . . . . . . . . 152
LIST OF TABLES x
List of Tables
1 Reactions of PN with biomolecules and synthetic compounds and
velocities for these reactions . . . . . . . . . . . . . . . . . . . . . 17
2 Velocities for PN decay in presence of physiological concentrations
of biomolecules . . . . . . . . . . . . . . . . . . . . . . . . . . . . 21
3 Detection of 3-NT in human disease . . . . . . . . . . . . . . . . . 22
4 Detection of 3-NT in animal models of disease . . . . . . . . . . . 23
5 Detection of 3-NT in cellular models of disease . . . . . . . . . . . 23
6 HPLC retention times for products of the phenol-PN reaction . . 33
7 IC50-values of scavengers for the nitration and nitrosylation of phe-
nol by PN . . . . . . . . . . . . . . . . . . . . . . . . . . . . . . . 59
8 Compounds with weak effects on PN-mediated nitration and ni-
trosation of phenol . . . . . . . . . . . . . . . . . . . . . . . . . . 60
9 IC50-values of scavengers for the nitration of BSA by PN . . . . . 60
10 IC50-values for the protection of ADH by different antioxidants
from inhibition by peroxynitrite. . . . . . . . . . . . . . . . . . . . 63
11 Effect of different heme- and heme-thiolate enzymes on phenol ni-
tration and hydroxylation by PN . . . . . . . . . . . . . . . . . . 77
12 Effect of iron-containing proteins on phenol nitration by PN . . . 78
13 Mass table of tyr-containing peptides obtained from trypsin diges-
tion of BM3 WT . . . . . . . . . . . . . . . . . . . . . . . . . . . 89
14 P450CAM catalysis of phenol nitration by PN . . . . . . . . . . . . 95
15 Mass table of digested nitrated CAM . . . . . . . . . . . . . . . . 97
16 Area of NT-positive peaks of digested CAM, nitrated in absence
and presence of metyrapone . . . . . . . . . . . . . . . . . . . . . 98
17 Peptide-fragments from trypsin-digested P450CAM . . . . . . . . . 153
18 Peptide-fragments from trypsin-digested P450BM−3 (part I) . . . . 154
19 Peptide-fragments from trypsin-digested P450BM−3 (part II) . . . 155
20 Peptide-fragments from trypsin-digested P450BM−3 (part III) . . . 156

ABBREVIATIONS xi
Abbreviations
α-NT anti-nitro-tyrosineADH alcohol dehydrogenaseAPS ammonium persulfateBQ p-benzoquinoneBM3 P450BM−3-monooxygenaseBSA bovine serum albuminCAM P450CAM-monooxygenasecGMP cyclic guanosine-monophosphateCIDNP chemically induced dynamic nuclear polarizationCM calmodulinCPA m-chloro-perbenzoic acidCPO chloroperoxidaseDENO diethyl NONOateDMUA dimethyl-uric acidDMSO dimethylsulfoxideDNA desoxyribo-nucleic acidDNP 2,4-dinitro-phenolDT dityrosineDTBP 2,2’-dithio-bipyridineDTNB Ellmans reagent, dithio-bis(nitro-benzoic acid)DTPA diethylene-triamino-pentaacetic acidDTPu 2,6-dithio-purineDTPy 2,6-dithio-pyrimidineDTT dithiothreitolECL enhanced chemoluminescenceeNOS endothelial nitric oxide synthase (NOS-III)EDTA ethylene-diamino-tetraacetic acidESR electron spin resonanceGMP guanosine-monophosphateGPx glutathione peroxidaseGSH glutathioneGSSG glutathione-disulfideHA hydroxy-anisolHG hemoglobinHP hydroxy-phenolHPLC high performance liquid chromatographyHRP horseradish peroxidaseHT hydroxy-tyrosineIFN-γ interferon-γiNOS inducible nitric oxide synthase (NOS-II)LPS lipopolysaccharideMBS 2-mercapto-benzo-thiazoleMBT 2-mercapto-benz-selenazoleMET metyraponeMP-11 microperoxidase (11 amino acids)MPO myeloperoxidaseMS mass spectrometry

ABBREVIATIONS xii
NA nitro-anisolNMR nuclear magnetic resonancenNOS neuronal or brain nitric oxide synthase (NOS-I)NO nitric oxideNOR nitric oxide reductaseNOS nitric oxide synthaseNP nitro-phenolNT nitro-tyrosinePBS phosphate-buffered solutionPCS≡PGIS prostacyclin (PGI2) synthasePEP phospho-enolpyruvatePN peroxynitrite (oxoperoxonitrate(-I))pNC 12-(p-nitro-phenoxy)-dodecanoic acidRNS reactive nitrogen speciesROS reactive oxygen speciesRP reversed phaseRSNO nitroso-thiolRT room temperatureSDS sodium dodecyl-sulfateSIN-1 3-morpholino-sydnonimineSOD superoxide dismutaseTBA 2-thio-barbituric acidTEMED N,N,N’,N’-tetramethyl-ethylene-diamineTFA trifluoro-acetic acidTris tris(hydroxymethyl)-amino-methaneXO xanthine oxidase

1 INTRODUCTION 1
1 Introduction
Radicals and oxidants play a major role in pathophysiological processes. In
the course of this century, due to improved analytical methods, it was possible
to identify several of these reactive species and even to understand the basic
principles of oxidative damage. The mechanisms of many reactions of oxidants
with biomolecules are known and also the strategies of cellular defense, mainly
provided by antioxidants such as glutathione, ascorbate (vitamin C) and
tocopherols (vitamin E) [1]. But protection against oxidative damage is also
provided by enzymes such as SOD, catalase, GPx and others [2].
These oxidants have been divided in two major groups [3]:
• Reactive oxygen species (ROS), among them superoxide (O·−2 ), hydrogen-
peroxide (H2O2), singlet oxygen (1O2), hypochlorite (OCl
−), alkylperoxides
(ROO·, ROOH) and hydroxyl radicals (·OH).
• Reactive nitrogen species (RNS), referring to nitric oxide (·NO), nitrogendioxide (·NO2), dinitrogen trioxide (N2O3), nitrylchloride (ONOCl) and
nitrosylchloride (ONCl), but also the nitronium (NO+2 ) and nitrosonium
(NO+) cation.
These reactive species are of great biological and chemical interest, be-
cause they have been characterized by a high reactivity towards many target
molecules. Especially for their characterization in biological systems techniques
have been developed and optimized to investigate reactions of ROS and RNS
with biomolecules. Due to their short lifetime, these species often have to be
detected by indirect methods, such as the employment of spin traps, which
form stable radical adducts with the initial radicals or stable 1e-oxidation
products. These adducts can be detected by ESR [4]. Another possibility
is the identification of ROS and RNS by their footprints, this means stable
endproducts of oxidatively modified biomolecules (e.g. malondialdehyde during
fatty acid peroxidation or 3-NT in PN-mediated nitration) [1, 5]. At last
CIDNP (chemically induced dynamic nuclear polarization) is a very power-
ful method to get insight in the mechanism by which radical reactions proceed [6].
This work will focus on two of these reactive species: ·NO and O·−2 . Both
radicals are rather longlived, but can react with each other in a nearly diffusion
controlled reaction (4-10 x 109 M−1s−1) [7, 8, 9]. The resulting peroxynitrite

1 INTRODUCTION 2
(PN) is the species on which we will concentrate in this work. Studies of Zou
and Ullrich revealed that prostacyclin synthase, a P450 enzyme which forms
the vessel-relaxing PGI2, is inactivated by PN at submicromolar concentrations
[10]. This inactivation went hand in hand with a nitration [11] and since PGIS
contains no other oxidizable cysteine except the heme-ligating one, the nitration
remains as a reason for the inactivation [11, 12]. Therefore it was desirable to
investigate the mechanism of PN-mediated nitration of phenolic compounds in
presence and absence of iron catalysts.
1.1 Nitric Oxide
1.1.1 Biosynthesis of Nitric Oxide
Tannenbaum and coworkers observed in 1981 that animals excreted more nitrate
as they had taken up with the food and concluded on an enzyme which was able
to synthesize NOX species [13, 14]. In the following years a corresponding NO-
synthase, a P450 enzyme, was discovered, which exists in three isoforms: eNOS
(NOS-III), n or bNOS (NOS-I) and iNOS (NOS-II) [15]:
• n or bNOS, type-I (160 kDa): Ca2+/CM-dependent, constitutive and boundto specific membrane proteins in neuronal cells, skeletal muscle, kidney.
• iNOS, type-II (130 kDa): Ca2+/CM-independent, induced by cytokines andLPS and cytosolic in macrophages, hepatocytes, astrocytes and smooth
muscle.
• eNOS, type-III (134 kDa): Ca2+/CM-dependent, constitutive and boundto fatty acids in Golgi and Caveolae membranes of endothelial cells, epithe-
lial cells, cardiomyocytes and neurons.
Fig.1 shows the hypothetical reaction mechanism for the formation of ·NOfrom oxygen and L-arginine by NOS [16]. NG-hydroxy-arginine, which is formed
within the first step could be identified as an intermediate. The other reaction
steps are estimated from spectroscopical investigations. It is not yet clarified,
which pathway of 4-6 or 7-8 is correct. L-arginine is converted to L-citrulline in a
5e-oxidation. The reaction requires 2 equivalents of oxygen and 1.5 of NADPH.
This complex reaction requires several cofactors, which are shown in Fig.2.
FMN and FAD are responsible for the electron transport within the enzyme
and function as shuttles for the electrons from NADPH to the heme iron (see
also (9) in Fig.1). BH4 is essential for a completely activated enzyme. (E-I)

1 INTRODUCTION 3
Figure 1: Hypothetical reaction mechanism for the formation of ·NO from oxygen, arginine
and NOS.
in Fig.2 proposes a mechanism by which BH4 could participate in the ·NOformation. BH4 may play a role during oxygen activation [16], but could also
have structural effects by stabilizing the active form of NOS [15]. In another
publication a pterin radical has been observed, suggesting the formation of a
·BH3 radical during catalysis of NO formation [17].
Inhibitors of NOS are structural analogues of L-arginine, such as NG-methyl-
L-arginine (L-NMA) and NG-nitro-L-arginine (L-NNA). Other often employed
inhibitors are mercapto-ethyl-guanidine (MEG), guanidine, amino-guanidine and
thio-urea [16].
1.1.2 Chemical Sources and Determination of Nitric Oxide
NO-donors are compounds which release ·NO in dependence of time, tempera-
ture, pH and redox reactions. Since 1879 nitro-glycerol (propanetriol-trinitric
acid-ester) is used for the prophylaxis of heart attacks. The benefical action
of nitro-glycerol is based on the release of ·NO in the organism. Also other
alkyl-nitrates and nitrites release ·NO [18]. NONOates and sodium nitro-prusside(SNP) also release ·NO and are used for its continuous production [18]. Spermine

1 INTRODUCTION 4
Figure 2: Cofactors, which are necessary for the formation of ·NO by NOS, in the reduced
and oxidized form. (A) NADPH, (B) NADP+, (C) oxidized FMN, (D) reduced FMN, (E)
tetrahydro-biopterin (BH4), (F) 4a-hydroperoxy-biopterin, (G) 4a-hydroxy-biopterin, (H)
dihydro-biopterin-quinone and (I) dihydro-biopterin.
and diethylamine NONOate (see Fig.104) are the most common NO-donors in
biological systems, because they release ·NO over a longer time period and canthus serve as models for ·NO production from NOS [22]. NONOates are rather
stable at alkaline pH and decay faster with decreasing pH.
·NO concentrations can be easily determined by chemoluminescence: ·NOcan diffuse through a semipermeable membrane and is transported by helium
as carrier to the chemoluminometer [19]. Other possibilities are ·NO sensitive
dyes (e.g. 2,3-diamino-naphthalene), which show a change in fluorescence after
addition of ·NO [20]. The third possibility is the oxidation of oxyHb to metHb.The absorbance change is measured at 401 nm and 411 nm (the isosbestic point)
as a wavelength pair [21].
1.1.3 Chemistry of Nitric Oxide
Nitric oxide is a colorless, paramagnetic gas. Its halflife in an oxygenated satu-
rated 2 mM solution at 25 ◦C is less than one second [19], but it strongly depends
on the concentration of ·NO. One of the major decomposition pathways of ·NO

1 INTRODUCTION 5
is its reaction with oxygen:
2 ·NO + O2 −→ 2 · NO2 (1)
Since under physiological conditions ·NO concentrations are normally in thenanomolar range, reaction (1) is very slow because it depends bimolecular on
[·NO] (see reaction (2)):
d[·NO]dt
= 4k[O2][·NO]2 (2)
with k=2-6.3·106M−2·s−1 at 25◦C [23]. In an air-saturated solution con-
taining 225 µM O2 the halflife of 1 mM ·NO about 0.56 s, at 10 nM it is 15.5
h [19]. Under pathophysiological conditions (e.g. Ischemia/reperfusion) ·NOconcentrations can reach the micromolar range [5] and its halflife is more than
10 s. With its diffusion coefficient, which is a factor of 1.4 higher compared to
that of O2, ·NO has a high radius of action and can diffuse over long distances.Furthermore, due to its lipophilicity [24], ·NO is able to diffuse through cell
membranes and acts as a fast and, at nanomolar concentrations, also specific
messenger. At high concentrations, ·NO gets less specific and may be cytotoxictowards all cell types.
The following equations will describe the major reactions of ·NO in biologicalsystems. Under physiological conditions there will be always an excess of ·NO anda part of it will autoxidize to form nitrogen dioxide. Dimerization and dismutation
of ·NO2 (5,6) will be suppressed in favor of the fast reaction with ·NO (7) to
form dinitrogen trioxide. The formation of N2O3 is also the reason, why ·NO inphysiological concentrations almost quantitatively yields nitrite and only traces
of nitrate (8) [15, 24]:
• The formation of ·NO2 and its disproportionation to nitrite and nitrate in
water [15, 16, 24]:
2NO · + O2 −→ 2NO2 · (3)
3NO2 · + H2O(l) −→ 2HNO3(aq) + NO · (4)
2NO2 ·+ 2OH−(aq) −→ NO−2 (aq) + NO
−3 (aq) + H2O(l) (5)
N2O4(g) ⇀↽ 2NO2 · (g) (6)

1 INTRODUCTION 6
• The formation of N2O3, a nitrosating species [15, 25]:
NO · (g) + NO2 · (g) ⇀↽ N2O3(g) (7)
N2O3 + H2O −→ 2NO−2 + 2H+ (8)
• The reaction with thiols [15, 24, 26]. Reaction (9) is thermodynamically andkinetically hindered and only can proceed, if an electron acceptor is present
(e.g. iron(III)). Nitroso-thiols could be a kind of storage for nitric oxide
and can nitrosylate other compounds by an either polar (12) or radical
mechanism (of course the lifetime of ”free” nitrosyl cation is short under
physiological conditions):
NO · + RSH −→ RSNO + H+ + e− (9)
RSH + ·NO −→ RS · + HNO (10)
RS · + NO· −→ RSNO (11)
RSNO + H+ ⇀↽ RSH + NO+ (12)
• Oxidation of ·NO [5, 16]:
NO · + OH· −→ NO+ + OH− (13)
NO · + Fe(III) −→ Fe(II) · · ·NO+ (14)
• Reduction of ·NO (e.g. by NADH-NO reductase, P450NOR [27]) [16, 24]:
2NO · + Fe(III)/NADH −→ 2NO− + Fe(III)/NAD+ + H+ (15)
NO− + NO· −→ ONNO·− (16)
ONNO·− + NO· −→ N2O + NO−2 (17)
ONNO·− + H+ −→ N2O + OH · (18)
NO− + O2 −→ ONOO− (19)
• The reaction with superoxide will be discussed more detailed in 1.3.1.
1 INTRODUCTION 7
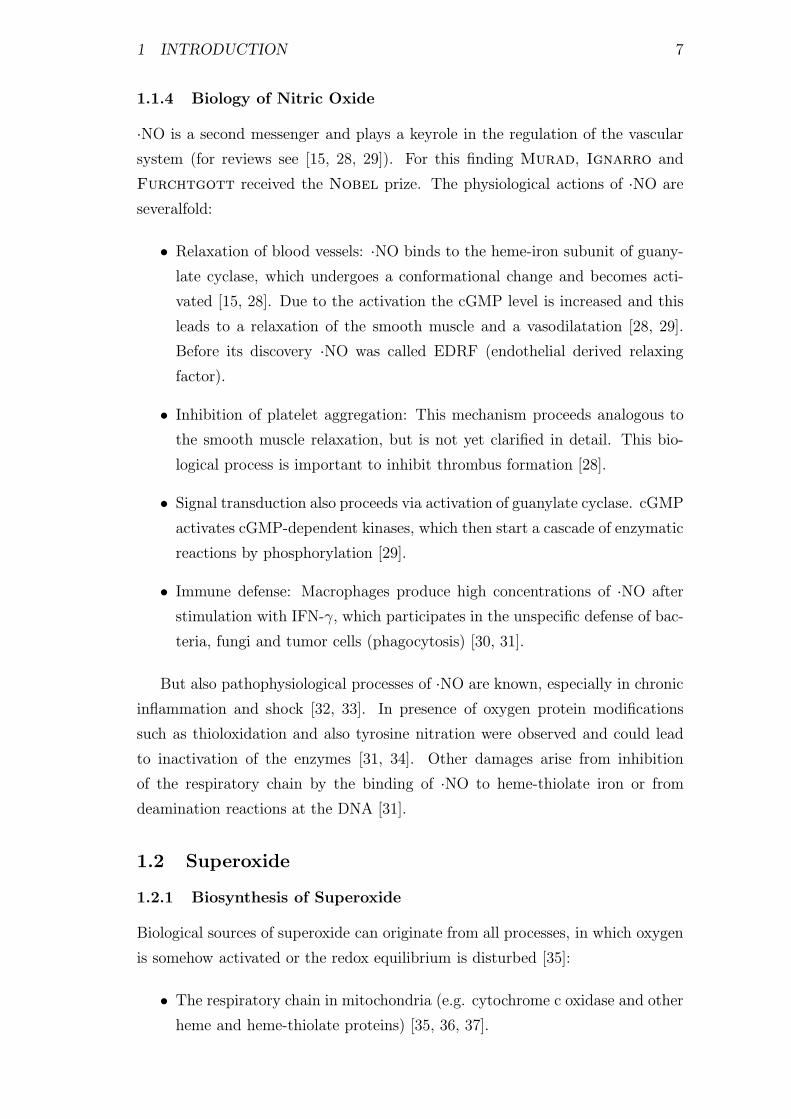
1.1.4 Biology of Nitric Oxide
·NO is a second messenger and plays a keyrole in the regulation of the vascularsystem (for reviews see [15, 28, 29]). For this finding Murad, Ignarro and
Furchtgott received the Nobel prize. The physiological actions of ·NO areseveralfold:
• Relaxation of blood vessels: ·NO binds to the heme-iron subunit of guany-late cyclase, which undergoes a conformational change and becomes acti-
vated [15, 28]. Due to the activation the cGMP level is increased and this
leads to a relaxation of the smooth muscle and a vasodilatation [28, 29].
Before its discovery ·NO was called EDRF (endothelial derived relaxing
factor).
• Inhibition of platelet aggregation: This mechanism proceeds analogous to
the smooth muscle relaxation, but is not yet clarified in detail. This bio-
logical process is important to inhibit thrombus formation [28].
• Signal transduction also proceeds via activation of guanylate cyclase. cGMPactivates cGMP-dependent kinases, which then start a cascade of enzymatic
reactions by phosphorylation [29].
• Immune defense: Macrophages produce high concentrations of ·NO after
stimulation with IFN-γ, which participates in the unspecific defense of bac-
teria, fungi and tumor cells (phagocytosis) [30, 31].
But also pathophysiological processes of ·NO are known, especially in chronicinflammation and shock [32, 33]. In presence of oxygen protein modifications
such as thioloxidation and also tyrosine nitration were observed and could lead
to inactivation of the enzymes [31, 34]. Other damages arise from inhibition
of the respiratory chain by the binding of ·NO to heme-thiolate iron or from
deamination reactions at the DNA [31].
1.2 Superoxide
1.2.1 Biosynthesis of Superoxide
Biological sources of superoxide can originate from all processes, in which oxygen
is somehow activated or the redox equilibrium is disturbed [35]:
• The respiratory chain in mitochondria (e.g. cytochrome c oxidase and otherheme and heme-thiolate proteins) [35, 36, 37].
1 INTRODUCTION 8
• Monooxygenation and oxygenation reactions [35, 38].
• Conversion of xanthine DH into xanthine oxidase (XO) [35, 39, 40, 41].
• Aggregation of certain protein fragments in membranes exhibits the
NADH/NADPH oxidase activity [35, 43, 44].
• Activated macrophages, phagocytosis (NADH/NADPH oxidase activity)
[35, 44].
• Autoxidation of polyphenols or fatty acids [35, 45].
• Under certain circumstances heme-thiolate enzymes can be modified andconverted to superoxide-producing proteins. NOS has been reported to
produce superoxide after treatment with PN [46].
For normal concentrations of superoxide the organism has two protection
enzymes: Mn-SOD (only in mitochondria) and Cu,Zn-SOD in the cytosol [47].
Especially XO and NADPH/NADH oxidase seem to be important sources
for high concentrations of superoxide. XDH from liver and milk is converted
to XO by either thioloxidation and/or proteolysis by which the affinity for
oxygen is increased dramatically [39, 41]. The active site of XO consists of
two metal centers, a Mo-containing one and an iron-sulfur cluster [48, 41].
Inbetween these two metal centers the binding sites for FAD and NAD+
are localized [40, 41]. The Mo-coordinating sulfurs are part of a Mo-pterin-
cofactor. XO is inhibited by tungsten, cyanide and allopurinol, which is
oxidized to 2-oxo-allopurinol and reversibly inhibits the active site [39]. XO
shows only low substrate specificity and converts hypoxanthine, xanthine,
NADH/NADPH (XO has also NADH/NADPH oxidase activity) and even
acetaldehyde [22]. Fig.3 shows the major steps in the postulated mechanism
of superoxide formation, which was combined from a talk of Prof. Dale and [42].
The phagocyte NADPH oxidase flavocytochrome b558 is a heterodimer and
consists of a glycosylated subunit, gp91(phox), and a nonglycosylated one,
p22(phox), which after assembling in the presence of two other components
(p47phox, p67phox) in the membrane show the O·−2 -generating activity [43, 44].
This process is started after phosphorylation by phosphokinase C (PKC). NADPH
oxidase contains two nonidentical heme groups that mediate the final steps of elec-
tron transfer. NADPH oxidase activity is stimulated by angiotensin-II [49]. This
stimulation could not be observed in cell lines which were deficient in one of the
subunits.
1 INTRODUCTION 9
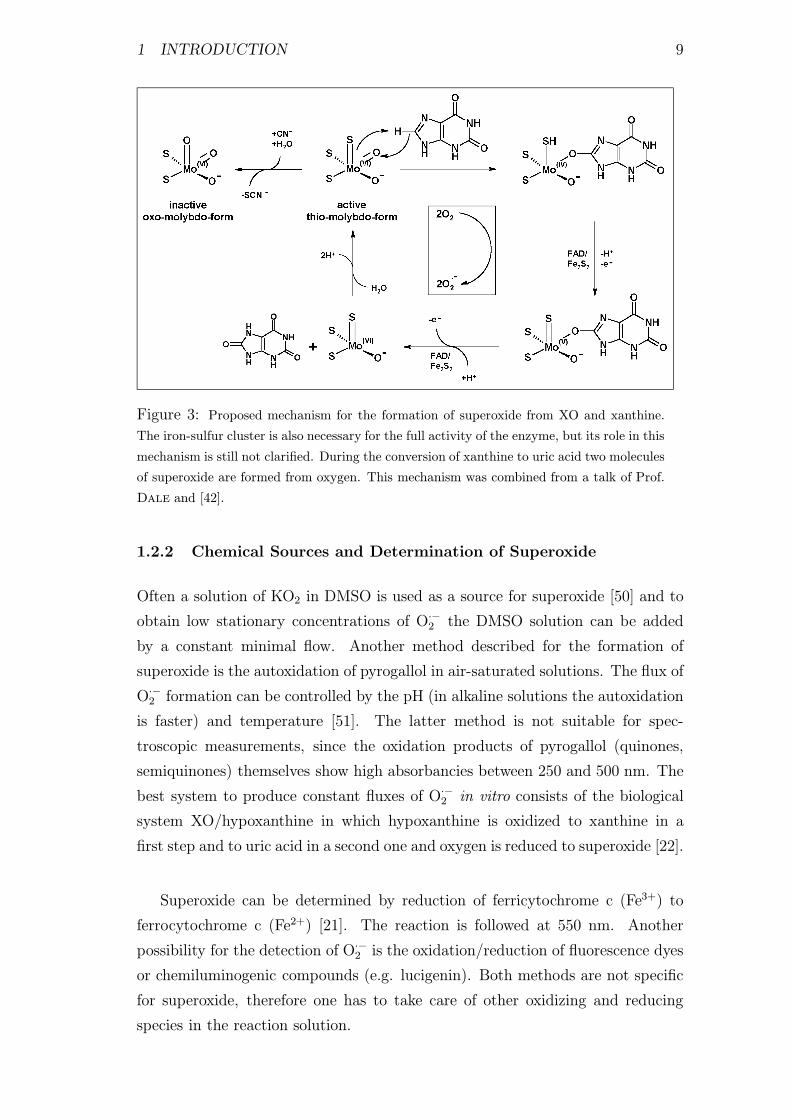
Figure 3: Proposed mechanism for the formation of superoxide from XO and xanthine.
The iron-sulfur cluster is also necessary for the full activity of the enzyme, but its role in this
mechanism is still not clarified. During the conversion of xanthine to uric acid two molecules
of superoxide are formed from oxygen. This mechanism was combined from a talk of Prof.
Dale and [42].
1.2.2 Chemical Sources and Determination of Superoxide
Often a solution of KO2 in DMSO is used as a source for superoxide [50] and to
obtain low stationary concentrations of O·−2 the DMSO solution can be added
by a constant minimal flow. Another method described for the formation of
superoxide is the autoxidation of pyrogallol in air-saturated solutions. The flux of
O·−2 formation can be controlled by the pH (in alkaline solutions the autoxidation
is faster) and temperature [51]. The latter method is not suitable for spec-
troscopic measurements, since the oxidation products of pyrogallol (quinones,
semiquinones) themselves show high absorbancies between 250 and 500 nm. The
best system to produce constant fluxes of O·−2 in vitro consists of the biological
system XO/hypoxanthine in which hypoxanthine is oxidized to xanthine in a
first step and to uric acid in a second one and oxygen is reduced to superoxide [22].
Superoxide can be determined by reduction of ferricytochrome c (Fe3+) to
ferrocytochrome c (Fe2+) [21]. The reaction is followed at 550 nm. Another
possibility for the detection of O·−2 is the oxidation/reduction of fluorescence dyes
or chemiluminogenic compounds (e.g. lucigenin). Both methods are not specific
for superoxide, therefore one has to take care of other oxidizing and reducing
species in the reaction solution.

1 INTRODUCTION 10
1.2.3 Chemistry of Superoxide
At pH 7, superoxide is a shortlived radical with a rather low reactivity. Its short
lifetime is due to its fast disproportion in aqueous solutions. By the reaction with
metals and other reactive species superoxide can generate hydroxyl radicals, which
may damage nearly all existing biomolecules. In vivo there are two enzymatic
systems which keep the O·−2 concentration low, the Mn-SOD and Cu,Zn-SOD.
The following equations show the most important reactions of superoxide and its
major decomposition product hydrogen peroxide:
• Disproportionation of O·−2 in aqueous solution with k=7.3 x 10⁵ M−1s−1 for
the self-dismutation [50], k=108 M−1s−1 for the Mn-SOD catalyzed reac-
tion [50], k=2 x 10⁹ M−1s−1 under catalysis of Cu,Zn-SOD [50] and k=107
M−1s−1 in presence of Mn- and Fe-porphyrins [50]. Hydrogen peroxide is
scavenged by catalase (k=0.8-2 x 10⁷ M−1s−1)[52]:
2O·−2 + 2H+ −→ O2 + H2O2 (20)
2O·−2 + 2H+ SOD−→ O2 + H2O2 (21)
2H2O2Cat−→ O2 + 2H2O (22)
• Reaction with transition metals (Fe(III), Cu(I) and (II), Ni(II) and Co(II)),e.g. Fenton reaction (24) and Haber-Weiss cycle (25)[3, 53, 54]:
Fe3+ + O·−2 −→ Fe2+ + O2 (23)
Fe2+ + H2O2 −→ Fe3+ + ·OH + OH− (24)
H2O2 + O·−2
Fe(III)−→ O2 + OH− + ·OH (25)
• Reaction with hypohalogenites (X=Cl−, Br−, I−) [3, 53]:
O·−2 + HOX −→ O2 + ·OH + X− (26)
• Reactions with thiols leads to thiyl radical and disulfide formation [1]:
O·−2 + RSH + H+ −→ H2O2 + RS· 2x−→ RSSR (27)

1 INTRODUCTION 11
• Oxidations by the perhydroxyl radical (pKa=4.5), e.g. lipidperoxidation of
polyunsaturated fatty acids (28) and radical chain reaction of polyphenolic
compounds (29)[1]:
R− CH = CH− CH2 − CH = CH− R + HOO· −→ (28)
R− CH = CH− C·H− CH = CH− R + H2O2 →→A−OH+O·−
2 → A−O− +HOO· → A−O ·+HOO− (29)
• The reaction with nitric oxide will be discussed in more detail in 1.3.1.
Superoxide is unlikely to react directly with biomolecules, but in its proto-
nated form, as the perhydroxyl radical it is much more reactive and additionally
to unsaturated lipids and polyphenols reacts with antioxidants such as ascorbate
and tocopherols [1]. Especially in the presence of transition metals superoxide
shows a high oxidative potential, mainly mediated by hydroxyl radicals and hy-
drogen peroxide [53].
1.2.4 Biology of Superoxide
There are only few indications for physiological actions of superoxide. It is well
known that O·−2 is produced in macrophages during phagocytosis [55] and this
action can be interpreted as an unspecific immune defense. Furthermore super-
oxide could participate in signal transduction, because nearly all cell types show
increased levels of O·−2 , when they are stimulated by cytokines. Therefore O
·−2
could be a kind of unspecific second messenger. At least superoxide plays a ma-
jor role as an intermediate during oxygen activation, but this physiological action
should proceed protein-bound and caged. So controlled neither free superoxide
should escape the cage nor other reactive species, which are formed during the
catalytic cycle of this oxygen activation. The metal-oxo intermediates will be
discussed in more detail.
1.3 Peroxynitrite (PN)
1.3.1 History and Properties of PN
PN (oxoperoxonitrate (1-)) was first observed in 1901 by Bayer and Villiger
in the reaction of nitrous acid and hydrogen peroxide, but was ill-defined as
pernitric acid (HNO4). In 1935 Gleu and Hubold introduced the name
peroxynitrite for this compound. In 1954 Halfpenny and Robinson observed

1 INTRODUCTION 12
hydroxylation and nitration reactions of aromatics by PN. At the same time
Anbar and Taube postulated the mechanism for PN formation by nitrosation
of H2O2. In 1964 Papee and Petriconi proved the formation of PN in the
photolysis of nitrate. In 1976 traces of PN were found in mars minerals by the
NASA Viking-sonde. In the 80’s, the role of PN in smog chemistry and in the
destruction of ozone in the stratosphere was discussed and first indictions were
found for the formation of PN in vivo.
Today it is known, that PN can be formed in vivo by the nearly diffusion
controlled reaction of ·NO and O·−2 :
·NO + O·−2 −→ ONOO− (30)
The velocity of this reaction (k=4.3-10 x 109 M−1s−1 [7, 8, 9]) is a factor of
2-10 faster compared to the velocities of the reactions of Mn- and Cu,Zn-SOD
with superoxide (see also equation (21) and k-values given in 1.2.3). For the
suppression of PN formation in vivo the ·NO concentration is essential. If the
nitric oxide concentration gets too high, SOD’s cannot compete with it for the
superoxide anion and formation of PN will be favored [5].
PN is a structural isomer of nitrate, but lies 150 KJ·mol−1 higher in energy
[56]. Kept at -20 to -80 ◦C in alkaline solutions PN can be stored for 4 weeks
up to months without serious losses. The intense yellow color of the PN-anion
can be used for its quantification as proposed by Hughes and Nicklin in
1968, by the use of ε302 = 1670 M−1cm−1 [57]. In alkaline solutions PN is
present in its cis-conformation (as shown previously by 15N-NMR and Raman
measurements [58, 59] and x-ray structure analysis [60]) and undergoes a
very slow decomposition to form oxygen and nitrite [61]. The cis-form of
ONOO− is 14.6 KJ·mol−1 more stable than the trans-form of PN-anion [56]. In
neutral solutions PN-anion undergoes protonation to peroxynitrous acid with a
pKa-value of 6.8 [56], which is much more reactive and isomerizes to nitrate by
a yet not completely understood mechnism [56]. ε302 of ONOOH is a factor of
100 lower compared to that of ONOO− (unpublished observation of Kissner
and Koppenol). ONOOH is thought to be present in the trans-conformation,
because trans-ONOOH is 4.18 KJ·mol−1 more stable than cis-ONOOH [56, 62].
The halflife of ONOOH in aqueous phosphate buffer at pH 7.4 is 2.7 s at 25 ◦C
and 0.8 s at 37 ◦C [61, 63]. Fig.4 shows a compilation of the protonation and
conformation equilibria and pathways for the decomposition of PN, as well as

1 INTRODUCTION 13
isomerization energies and pKa-values [56, 61, 62].
Figure 4: Isomerization and decomposition of PN.
Concerning the postulated activated intermediate of PN, ONOOH∗, there are
two theories. Older studies about ONOOH-isomerization proposed a vibronical
excitation in the trans-form by a combined deforming vibration along the N-O-O
angle and a stretching vibration along the O-OH bond (see also Fig.5) [56].
During these vibrations the O-O bond is weakened and the endbonded O-atom
approaches the N-atom. The intermediate can be regarded as a three-membered
ring, which has either singlet or triplet character. In cis-ONOOH these vibrations
are hindered. On an orbital basis, Fig.6 shows that in the trans-ONOOH HOMO
and 2nd HOMO a bonding overlapping of the N- and O-orbitals becomes possible,
whereas in the cis-form it is anti-bonding [59]. The radical cage mechanism of
PN-isomerization and 1e-oxidative reactivity was discussed very controversly in
literature [64, 65, 66, 67, 68, 69, 70].
The current opinion about PN-isomerization and 1e-oxidative reactivity has
changed. Detailed kinetic measurements [71, 72], ESR measurements [73, 74,
75] and CIDNP experiments [6] favor the radical cage as reactive intermediate
during PN-isomerization and also the observed 1e-oxidations are explainable this
way. Equation (31) shows the formation of the radical pair in the solvent cage
and the subsequent recombination to nitrate [71, 72]. If this cage encounters
a 1e-donor (D-H), then a cage will be formed with a ·NO2 and donor radical
pair and a molecule of water (equation (32)) [6]. This cage can either collapse
by recombination of the donor and nitrogen dioxide radical, which would be a
nitration or form nitrite and D+, which would be hydrolyzed by water and form a

1 INTRODUCTION 14
NO
OOH
NO
OOH
NO
OO
NO
OO
III
III IV
H
H
Figure 5: Formation of an excited in-
termediate during isomerization of PN
to nitrate by vibronical activation.
Figure 6: Explanation of PN-isomerization
on the basis of ab initio calculated molecule
orbitals of PN. The MO’s were calculated by
using the 6-311+G∗ basis-set.
hydroxy product. Of course it may also happen, that some of the radical species
escape from the cage and react in a different way. The yield of these radical
species is still under discussion and varies from 5 [76] -40 % with respect to
ONOOH concentration [71, 72].
ONOOH ⇀↽ [ONO · ·OH]cage −→ NO−3 (31)
[ONO · ·OH]cage + D− H −→ [D · ·ONO]cage + H2O (32)
Also in the decomposition of PN at alkaline pH there are new findings. The
formation of nitrite and oxygen is more complicated than shown in Fig.4. The
following equations will introduce the major reactions taking place in an alkaline
solution of PN [24, 61, 77].:
ONOOH ⇀↽ ·NO2 + ·OH k = 1.2− 1.3s−1 (33)
ONOO− ⇀↽ ·NO + O·−2 k = 0.02s−1 (34)
·NO + ONOO− −→ ·NO2 + NO−2 k < 1.3x10⁻³M−1s−1 (35)
·NO2 + ONOO− −→ NO−2 + ONOO · k ≈ 2x10⁴M−1s−1 (36)
·OH + ONOO− −→ OH− + ONOO · k ≈ 5x10⁹M−1s−1 (37)
·NO2 + ·NO ⇀↽ N2O3 k ≈ 1.1x10⁹M−1s−1 (38)
N2O3 + ONOO− −→ NO−2 + 2 · NO2 k ≈ 3x10⁸M−1s−1 (39)
Reaction (33) contributes most to the decay of PN in the physiological pH
range (by formation of hydroxyl radicals which react with PN by equation (37)),
above pH 8 reaction (34) causes PN-decomposition. Reaction (35) and (36) are

1 INTRODUCTION 15
too slow to play a role, especially since the reaction of ·NO with ·NO2 (mainly
produced in the autoxidation of ·NO in oxygenated solutions) is much faster (see(38)). N2O3 is the intermediate that accelerates PN-decomposition at alkaline
pH [77]. Some other reactions may play a role in this decomposition, so the
formation of ONOO· and O2NOO− and their further reactions [77].
1.3.2 Chemical Sources and Determination of PN
Fig.7 gives an overview for the various methos of PN synthesis [63]. SIN-1 (9)
and the NONOate/XO system (7) are mimicks for the physiological continuous
formation of PN and are often used in biological model systems [16, 22]. The
most common chemical syntheses of PN are the reactions of nitrite with acidified
hydrogen peroxide (0) [78], of solid potassium superoxide with gaseous nitric
oxide (1) [9] and of isoamyl nitrite with alkaline hydrogen peroxide (5) [79]. The
reaction of tetramethyl-ammonium superoxide in liquid NH3 with liquid nitric
oxide is dangerous and complicated to handle, but yields highly purified PN as
the solid N(CH3)+4 -salt (deep yellow to orange color) with lowest contaminations
of nitrite (2) [58]. (4) and (6) are methods rather used for physical experiments
and are complicated in handling.
Figure 7: Different methods to synthesize PN (for a review see [63]).
PN concentrations in alkaline solutions are easily monitored by the absorption
of ONOO− at 302 nm (see also 1.3.1) [56, 62]. Other methods to determine

1 INTRODUCTION 16
PN-concentrations are fluorometric measurements (e.g. oxidation of dihydro-
rhodamine 123) [80, 81] and chromatographic or photometric measurements of
other stable reaction products (e.g. nitro-phenols, nitroso-phenol...). But all
these methods are not specific for PN and therefore are not suitable, if other
oxidants may be present in a system.
1.3.3 Chemistry of PN
PN is the biological equivalent to chemical nitration reagents (e.g. NO+2 BF
−4
or HNO3/H2SO4). The chemical nitration is mediated in organic solvents by a
polar mechanism involving the nitronium cation (formation of a π-, a σ-complex
and subsequent rearomatization by proton abstraction). In contrast PN nitrates
in aqueous solutions by a radical mechanism involving nitrogen dioxide and
phenoxyl radicals [6], yielding also dimerization products as a consequence. In
vitro, at concentrations ≥ 1 mM, PN reacts with almost all biomolecules [82].
ONOOH mainly causes 1e-oxidations, in which a ·NO2 or ·OH radical togetherwith the target radical are formed [6, 83]. ONOO− reacts by 2e-oxidations, in
which an oxene is transfered to the target [84, 85, 86]. Tab.1 gives an overview
about reactions of PN with proteins and other biomolecules, as well as with
synthetic compounds.
Nitration of tyrosine residues and thiol or sulfoxidation of cysteine or methio-
nine residues in proteins are the most common reactions of PN in vivo. Some
examples for protein modifications are shown in Tab.1. Here I want to present
some other important modified proteins:
• Studies by Zou and Ullrich on prostacyclin synthase (PGIS), a P450
enzyme, revealed that it is nitrated at a tyrosine residue near the active
site by submicromolar concentrations of PN [11]. The localization of the
nitrated Tyr near the heme-thiolate iron was concluded from the observa-
tion, that this 3-NT formation could be inhibited by blocking the active
site of the enzyme [11]. Nitration went hand in hand with an inactivation
of PGIS suggesting a possible role of the nitrated Tyr in the catalytic cycle,
or a conformational change after nitration [12]. Regarding the high sensi-
tivity of PN towards PGIS inactivation and nitration we concluded on a
heme-thiolate autocatalyzed nitration of the Tyr [116].
• Beckman and coworkers found the Mn-SOD to be nitrated at low PN-
concentrations, also suggesting an involvement of the manganese active cen-
ter [118]. In another study the inactivation of Mn-SOD could be correlated

1 INTRODUCTION 17
Compound Modification k(ONOO−)/k(ONOOH) Ref.
Se-methionine selenoxide, fragmentation 2x10²/2x104 [87]
Ascorbate ascorbyl radical ... 88/2.3x102 [88, 89]
Glutathione thiol oxidation, GSSG 5.8x10²/1.5x106 [15, 63]
Trolox,tocopherol tocopheryl radical ... 33/103-104 [91, 92, 93]
ADH thiol oxidation, zinc release 4x10⁵/ - [15, 94]
Phenol/tyrosine phenoxyl radical ... - /103 [62]
Cysteine thiol oxidation, cystine 5x10³/ - [15]
Methionine sulfoxidation, fragmentation 1.8x10²/ - [15]
Nitric oxide reaction with 9.1x10⁴a, 1.3x10⁻³b/ - [61, 77]
Carbon dioxide reaction with 3-5.8x10⁴/ - [95, 96]
Ebselen ebselenoxide 2x10⁶/ - [97]
Cytochrome c metal center, nitration 1.4x10⁴/ - [15]
oxyHemoglobin metal center, nitration, Fe=O 2x10⁴/8.8x104 [15, 98]
Aconitase thiol oxidation 1.4x10⁵/ - [99]
GPx seleno-cysteine oxidation 4.5x10⁴, 8x10⁶/ - [101, 100]
Lactoperoxidase metal center, Fe=O 3.3x10⁵/8.4x104 [102]
HRP metal center, nitration, Fe=O 3.2x10⁶/ - [102]
Myeloperoxidase metal center, Fe=O 6.2x10⁶/2.5x105 [102]
Mn(III)TMPyP metal center, Mn=O 1.8x10⁶/ - [50]
Fe(III)TMPyP metal center, Fe=O 2.2-50x106/ - [103]
Fe(III)TMPS metal center, Fe=O 6.5x10⁵ [104]
Tryptophane oxidation, nitration - /1.3x102 [90]
Mn-SOD metal center, nitration ??? [117, 118]
Cu,Zn-SOD metal center 103-105 [105]
Mn2+, Fe3+ reaction with 1 [91, 106]
Cu2+ reaction with 40 [91, 106]
Fe(III)edta reaction with - /5.5x103 [62]
Tempone oxidation - /4.5x109 [73]
β-ketoester nitration 8 [107]
Ergothionein thiol oxidation 104 [108]
β-carotene radical intermediate ... ??? [109, 110]
Iodide,bromide radicals,oxidation 2.3x10⁴ [90]
BSA thiol oxidation, nitration 2.5x10³ [105]
P450BM−3 thiol oxidation, nitration, Fe=O 2x10⁵ [111]
Chloroperoxidase metal center, Fe=O 106 [111]
GAPDH thiol oxidation 2.5x10⁵/ - [112]
Tyrosine hydroxylase thiol oxidation, nitration ??? [113]
Tryptophane hydroxyl. thiol oxidation, nitration 3.4x10⁴/ - [114]
PTP1B,CD45,LAR thiol oxidation, nitration 2.2x10⁷-2x10⁸/ - [115]
Table 1: Reactions of PN with biomolecules and synthetic compounds and velocities for
these reactions (for reviews see [15, 124]). ”...” in the field modification means that the first
modification is followed by others (e.g. nitration, hydroxylation, nitrosation or fragmentation).
k-values are given in M−1s−1, first value for the reaction with PN-anion/second one for the
reaction with ONOOH. k-values for nitric oxide were measured in a oxygenated solution and b
in deoxygenated solution. ”-” does not mean that the compound does not react, but no k-value
was determined. PTP1B, CD45 and LAR are protein tyrosine phosphatases.

1 INTRODUCTION 18
with the exclusive nitration of Y34 [117], although there is new evidence
that inactivation may be due to dityrosine formation [119]. Cu,Zn-SOD is
not inactivated by PN, but catalyzes the nitration of other proteins, such
as neurofilament-L [120, 121].
• This thesis work revealed an autocatalyzed nitration of P450BM−3 and
P450CAM by PN at concentrations <50 µM, inactivation of P450BM−3 by
PN was due to thiol oxidation [111].
• Ca-ATPase in skeletal muscle sarcoplasmic reticulum undergoes also sensi-tive Tyr nitration and thiol oxidation by PN and is inactivated [122]. For
P4502B1 a nitration and inactivation by 39 µM PN has been reported [123].
• BSA contains no metal center, but is also nitrated at PN concentrations>100 µM. Thiol oxidation takes place at lower PN concentrations [124].
• NOS is inactivated by PN, probably by thiol oxidation [125]. Phosphatidyli-nositol 3-kinase is a target for protein nitration [126]
PN-mediated nitrations of Tyr-residues in proteins without metal-catalysis
normally require PN-concentrations >100 µM. Exceptions may be cases, where
Tyr is present as a tyrosinate or as a tyrosyl radical. Thiol oxidations of Cys-
residues in proteins normally can be observed at PN concentrations of 5-50 µM
and can get more sensitive, if the SH-group is present as a thiolate, or if it
is located near to a metal center in a protein. The following list will give an
overview about reactions of PN with low molecular weight biomolecules:
• Depletion of antioxidants, such as ascorbate[88], tocopherols[93], uric acid[4] and glutathione [127].
• Nitration, hydroxylation, nitrosation and dimerization of phenolic com-pounds (e.g. phenol, tyrosine, salicylate, L-DOPA and polyphenols)
[62, 128, 65, 129, 130]. The mechanism of these reactions will be discussed
later in more detail.
• Oxidation of aromatics and heterocyclic compounds (e.g. tryptophan,
phenylalanine, indole, histidine and related compounds, purins and related
compounds) [90, 64, 131, 132]. Especially purines play a major role in the
cytotoxicity of PN, by formation of nitro- and oxo-nucleotides or radical
purine intermediates and subsequent strand breaks in DNA [133, 134].
• Oxidation and nitration of polyunsaturated fatty acids or β-keto-esters (e.g.pyruvate and lipidperoxidation) [135, 136].

1 INTRODUCTION 19
• Thiol oxidation (e.g. cysteine and glutathione) [138, 137]. The reactionof thiols with PN-anion or peroxynitrous acid yields a variety of prod-
ucts, such as dithiol (RSSR), sulfenic acid (RS-OH), sulfoxides (sulfinic
acid RS(O)OH, sulfonic acid RS(O)2OH, sulfate ROS(O)2OH depending
on the PN/RSH ratio), nitroso-thiols (RS-NO), nitrito-thiols (RS-ONO),
thiol-nitrates (RS-ONO2) or nitro-thiols (RS-NO2) [83]. These products
can be formed in either 1e- or 2e-oxidations, either involving thiyl radicals
or direct oxene transfer.
• Seleno- or sulfoxidation of thio- or seleno-ethers (e.g. ebselen, methionineand Se-methionine) [86, 139]. A very suitable model to distinguish ONOO−
from ONOOH reactivity was the reaction of PN with thianthrene-5-oxide
(see also Fig.8 (1’)) [84]. The sulfone (4’) is the exclusive product at
pH 14 (ONOO−) and PN reacts as a nucleophilic oxidant. Electrophilic
oxidants, such as hydrogen peroxide in perchloric acid would form the di-
sulfoxide (3’). PN in the protonated form, at pH 6.4, leads to nitration of
the aromatic ring (2’). The sulfone-sulfoxide (5’) is not formed.
Figure 8: Different reactivity of ONOO− and ONOOH, as monitored by using thianthrene-
5-oxide as a model.
• Reaction of ONOO− and ONOOH with carbon dioxide [95, 140]. Nitration
and dimerization of phenolic compounds, but also fragmentation of methio-
nine by PN are increased in presence of carbon dioxide [85, 96]. Nowadays it
is excepted, that PN and CO2 form an adduct, the nitroso-peroxo-carbonate
(ONOOCO−2 ) [140, 141, 142]. This adduct has three major pathways to
form reactive nitrating species: The first and dominant one, the adduct can
undergo homolytic cleavage to form a radical cage-pair of nitrogen dioxide

1 INTRODUCTION 20
and carbonate radical (42). These radicals can escape from the cage (30-
33 %) and lead to the reactions (44 and 45) [141, 143]. 2. The adduct
could undergo heterolytic cleavage to form a nitronium and a carbonate
ion cage-pair (41). But the product pattern (high yields in radical derived
dimerization and fragmentation products), as well as the extremely short
lifetime of NO+2 in aqueous solution stand against this theory. 3. Isomeriza-
tion of ONOOCO−2 to O2NOCO
−2 (nitro-carbonate), but also this pathway
does not play an essential role [141, 142]:
HCO−3 + H+ ⇀↽ H2CO3 ⇀↽ CO2 ↑ + H2O (40)
ONOO− + CO2 −→ ONOOCO−2 −→ [NO+
2 CO2−3 ]cage (41)
ONOO− + CO2 −→ ONOOCO−2 −→ [CO·−
3 · NO2]cage (42)
CO·−3 · + Tyr −→ HCO−
3 + Tyr · (43)
Tyr · + · NO2 −→ O2N− Tyr (44)
Tyr · + Tyr· −→ Dityr (45)
The reaction of carbon dioxide with PN is fast (k=3x10⁴ M−1s−1) and con-
centrations of CO2 are high under physiological conditions [144]. Therefore
the formation of ONOOCO−2 could be one of the major pathways for PN-
reactivity in vivo. Nitration of Tyr by PN is increased by a factor of 3-10
in the presence of CO2 [95, 145, 146], depending on pH.
1.3.4 Biology of PN
The biology of PN is rather characterized by its participation in pathophysiologi-
cal processes. These actions can be summarized by modifications of biomolecules
as shown in 1.3.3, especially nitration of Tyr-residues and oxidation of Cys- and
Met-residues in proteins [148, 149, 150, 151]. All these protein modifications are
not specific for PN, thiols are also oxidized by hydrogen peroxide, superoxide,
hydroxyl radicals and hypochlorite [137] and tyrosines are nitrated by ·NO2 or
by the MPO-catalyzed reaction of nitrite with hydrogen peroxide [15, 152]. 3-NT
is often taken as a marker for PN presence in vivo [5, 153], but is also critizized
for its unspecificity [155, 154, 156] and some reports even question the relevance
of PN-mediated nitration under physiological conditions [22]. 3-NT can be also
formed by nitrogen dioxide, the autoxidation product of nitric oxide [15], by the
myeloperoxidase- or HRP-catalyzed reaction of hydrogen peroxide with nitrite
[152], by the CPO-catalyzed reaction of hypochlorite with nitrite [53] and by
the addition of nitric oxide to a once formed tyrosyl radical with subsequent
oxidation [34, 157, 158]. Protein-bound 3-NT is popular as a footprint of PN

1 INTRODUCTION 21
Biomolecule ksec [M−1s−1] [Biomol.][M] kscav [s
−1]
Self-decompos. - - 0.4-0.6
Carbon dioxide 3-4.6x10⁴ / - 10−3 30-46 / -
Ascorbate 50-90 / 230 10−2 0.5-0.9 / 2.3
Glutathione 580 / 1.5x10⁶ 10−2 5.8 / 15000
Myeloperoxidase 2.5x10⁵ / 6.2x10⁶ 2x10⁻⁷-5x10⁻⁴ 0.05-125 / 0.12-3100
oxyHemoglobin - / 2.5x10⁴ 2.3-5x10⁻³ - / 58-125
GPx 2x104-8x10⁶ / - 1.5-2x10⁻⁶ 0.03-16 / -
Albumin 3-6x10³ 6x10⁻⁴ 1.8-3.6
Table 2: Velocities for PN decay in presence of physiological concentrations of biomolecules
(effective rate constant). Second column: k-value for ONOO− / k-value for ONOOH. Fourth
column: kscav for ONOO− / kscav for ONOOH. Values are taken from reviews [144, 162] and
corrected with values from Tab.1.
in vivo, because antibodies are available for its sensitive detection and the
spectroscopic and electronic properties of 3-NT for UV/Vis and electrochemical
HPLC detection are suitable for a sensitive monitoring [154, 159]. During the last
year another issue was brought up, speaking against 3-NT as a biomarker for PN:
Murad and coworkers have observed that 3-NT is not stable under physiological
conditions and that there may be enzymatic and non-enzymatic pathways for
reduction of PN [160, 161]. These findings also revitalized the discussion, that
PN could be an unspecific messenger, on the basis that PN-mediated nitrations
are reversible.
Depletion of antioxidants or modification of low molecular weight biomolecules
requires extremely high concentrations of PN, to be harmful to cells or the whole
organism. The halflife of PN in vivo is short regarding the cellular defense, which
is able to intercept PN. Tab.2 shows possible pathways for PN consumption
in vivo [144, 162]. Important for the PN scavenging ability are the effective
velocities, that means the second order rate constant of PN with an antioxidative
system multiplied with its physiological concentration. Most important is the
decay velocity (kscav) for the PN-anion. The reactivity of ONOOH is almost
completely suppressed by glutathione (kscav=15000 s−1). The difference of the
values is due to the different second order rate constants and physiological
concentration that were used for calculation of the effective velocities.
The reaction of nitric oxide and superoxide yields PN in the anionic form and
although protonation is in a fast equilibrium, it is mainly present as ONOO− at

1 INTRODUCTION 22
physiological pH due to its pKa of 6.8 [56], therefore scavengers for the PN-anion
are more important than for ONOOH. Most of ONOOH is trapped by GSH,
MPO or oxyHb (see Tab.2). Uric acid also reacts very fast with ONOOH and
is present in cytosol and plasma at concentrations of 100-300 µM [4]. Regarding
the fact that heme- and heme-thiolate proteins increase the nitration potential
of PN [163, 164], these compounds cannot be considered as real scavengers for
PN. On the other hand it had been shown, that such proteins coupled with
antioxidants represent possibly the most effective scavenging systems for PN
[50, 165]. Biomolecules that react with ONOO− are more likely to be oxidized
by PN, since only GPx and GSH have a certain protective potential. Since
many metal-containing proteins and also carbon dioxide react with PN-anion
and increase its oxidative properties, these two reactions could be the major
activation pathways for PN in vivo and contribute the major part to PN-toxicity
[163, 116, 146].
Tab.3 shows a list of human diseases, in which 3-NT could be detected and
an involvement of PN was suggested or proved [166]. Tab.4 shows the same for
animal models of disease [166] and Tab.5 for cellular models of disease [166].
Atherosclerotic plaques of coronary vessels Chronic renal failure in septic patients
LDL isolated from atherosclerotic lesions Inflammatory bowel disease
Lungs with sepsis and/or respiratory disease Heliobacterium pylori gastritis
Idiopathic pulmonary fibrosis Necrotizing enterocolitis
Lung transplants with obliterative bronchiolitis Colliac disease
Plasma of infants with BPD Fluid of patients with arthritis
Amyotrophic lateral sclerosis Early prosthesis failure
Multiple sclerosis plaques Inclusion body myositis
Alzheimer’s lesions Placenta of preeclamptic pregnancies
Rejected renal allografts Skin lesion with anaphylactoid purpura
Table 3: Detection of 3-NT in human disease [166].
These tables show that PN may have a major impact on the pathophysiology
of disease and how important the development of scavengers for PN is. The
impact of PN on the vascular system could be established in our group by Zou
et al [167, 168, 170] and this finding is supported by other groups [171, 172].
PN not only eliminates the vasorelaxating PGI2, but also consumes ·NO, anotherpotent vasorelaxating factor (EDRF), for its formation. Therefore PN could
contribute seriously to vasodysfunction. Nitration and inactivation of PGIS by
PN was found to be involved in hypoxia-reoxygenation triggered vasospasm [169],

1 INTRODUCTION 23
Aorta of septic rats Brain vasculature of CO-poisoned rats
Cardiac allocraft rejection Chronic cerebral vasospasm
Ischemia-reperfusion-injured rat heart Allergic encephalomyelitis
Cholesterol-induced atherosclerosis Central nervous system inflammation
Autoimmune myocarditis Liver transplantation
Myocardial inflammation Dimercaptosuccinic acid nephrosclerosis
Rabbit lungs following exposure to hyperoxia Guinea pig ileitis
Lungs of endotoxin-treated rats Placenta of LPS-treated rats
Ischemia-reperfusion-injured rat lungs Carrageenan paw edema
Influenza-induced pneumonitis Murine leishmaniasis
Pulmonary granulomatous inflammation Zymosan peritonitis
HSV-1-induced pneumonia Autoimmune diabetes in NOD mice
Malonate- and MPTP-induced neurotoxicity Autoimmune uveitis
Excitoxicity model of neuronal injury Dermal tumor promotion
Transgenic model for ALS Mice bearing ResX tumor
ApoE-deficient mice Aged rat skeletal muscle SERc2a isoform
Table 4: Detection of 3-NT in animal models of disease [166].
Ingested bacteria in human PMN H2O2-exposed kidney epithelium
IL-1β-stimulated VSMC Cytokine-stimulated fetal glial cultures
Arginine-depleted neuronal cells TNF-α-treated endothelium
Native LDL-treated endothelium CO-exposed endothelium
Table 5: Detection of 3-NT in cellular models of disease [166].
in atherosclerosis [173] and in endotoxic shock [manuscripts submitted] and was
found to be stimulated by IL-1β in rat mesangial cells [12].
1.4 Compound I and II
Since the nitration mediated by ”free” PN is much less efficient compared
to the metal-catalyzed nitration by PN [163, 174], it may be assumed, that
biologically occuring nitrations require either metal-catalysis [120, 168] or the
presence of carbon dioxide [95, 149] to compete with the antioxidant defense of
the organism. Metal-catalysis could even be a more important factor, when a
tyrosine is located nearby the metal center. In this case reactive intermediates
(e.g. nitrogen dioxide) have a short distance to diffuse and the shortlived species
have the best chances to react with this Tyr. Therefore it is obligatory to
introduce some basic information about the mechanism by which PN reacts with
transition metals.
Oxidized metal species such as ferryl (Compound II, FeIV=O), perferryl

1 INTRODUCTION 24
(Compound I, formally FeV=0), MnIV=O and MnV=O play a central role in
reactions of PN with these metals [163, 175]. Therefore this section will give a
short introduction on the basic chemistry and properties of these high valence
metal compounds.
Compound I has been described for peroxidases and P450 enzymes [176].
Theoretically all heme- and heme-thiolate proteins can form a Compound I inter-
mediate, depending on the generating species and the environment of the active
site [177]. Formation of Compound I requires heterolytic cleavage of the oxidizing
species (e.g. hydrogen peroxide, periodate, chlorite, N-oxides and hypochlorite)
or a direct oxene transfer (e.g. iodoso-benzene) [176, 178]. The following equa-
tions show the steps of perferryl formation and its reduction to Compound II:
(X)FeIII + ROOH + B− ⇀↽ (X)FeIII · · ·OOR− + BH (46)
(X)FeIII · · ·OOR− −→ (X)FeV = O + RO− (47)
(X)FeIII + O = R −→ (X)FeV = O + R (48)
(X)FeV = O ↔ (X)FeIV −O· ↔ (·X)FeIV = O (49)
(·X)FeVI = O + e− + H+ −→ (X)FeVI −OH (50)
Heterolytic cleavage of the oxidizing species (e.g. peroxides) requires the
formation of Compound O, a coordinative complex of the oxidizing species (46),
which is subsequently cleaved (47) [176]. Iodosobenzene can directly transfer an
oxene to the ferric iron (48) [176]. The leaving groups, RO− and R, must be
redox stable or else they may be oxidized by the produced Compound I (this was
observed for MnV=O and FeV=O and nitrite in reactions of PN with Mn(III)
and Fe(III) porphyrins [50, 103, 164]). Concerning the mesomeric structures in
(49) one has to consider, that iron(V) in porphyrins is not stable and was only
described for some peculiar complexes [179]. Iron(V) will immediately abstract
an electron or H-atom from the coordinating porphyrin (HRP) or a nearby
amino acid (cytochrome c peroxidase (Trp), PGH2 synthase (Tyr), cytochrome
P450 mono-oxygenases and lactoperoxidase (Cys)) and form an iron(IV)-AA
or -porphyrin radical or cation radical [176, 180]. The mesomer structure with
an oxygen-centered radical could contribute to the 1e-oxidative potential of
Compound I [178]. All mesomers are in equilibrium with their protonated form.
By uptake of one electron, Compound I is reduced to Compound II (50).
Compound I is able to form epoxides from olefins [38, 181, 178, 182], to oxidize

1 INTRODUCTION 25
Figure 9: Sulfoxidation of thio-ethers
by Compound I.
thio-ethers (see Fig.9) and amines [176, 178], dealkylate alkyl-amines [178, 183],
O-dealkylation [184], N,S-hydroxylation [178], and especially in P450 enzymes is
also able to hydroxylate alkanes (mono-oxygenations) [176, 178]. Fig.10 shows
the proposed mechanism for the hydroxylation of an alkane by P450 Compound
I. In the first step Compound II is formed by H-atom abstraction from the
alkane, followed by either ”oxygen rebound” directly yielding ROH and the
ferric heme [185, 186, 187], or electron transfer yielding a carbenium ion which
can be further hydrolyzed by water [178]. This special ability of P450 enzymes
to insert oxygen in C-H bonds leaves open room for speculations on the role of
the thiolate-ligand in these reactions. Older MO-calculations revealed no radical
character of the thiolate-ligand in P450 Compound I, but a stabilizing effect by
its d-orbitals [188, 189]. By using new calculation methods Green assumed
sulfur-based radicals in heme-thiolate Compound I [190, 191], that would explain
the special reactivity in mono-oxygenations.
Compound II is formed during reduction of Compound I (see (50)), but it can
also be generated by homolysis of suitable peroxides (e.g. m-chloro-perbenzoic
acid (CPA), peracetic acid or PN) [176, 181]. The following equations show the
formation and properties of ferryl:
(X)FeIII + ROOH + B− ⇀↽ (X)FeIII · · ·OOR− + BH (51)
(X)FeIII · · ·OOR− −→ (X)FeIV = O + RO · (52)
(X)FeIV = O ↔ (X)FeIII −O· ↔ (X)FeIV −O− (53)
(X)FeVI = O + e− + H+ −→ (X)FeIII · · ·OH− (54)
For the first step in Compound II generation, the formation of Compound
O is assumed again (51), but in this case the peroxide is splitted homolytically
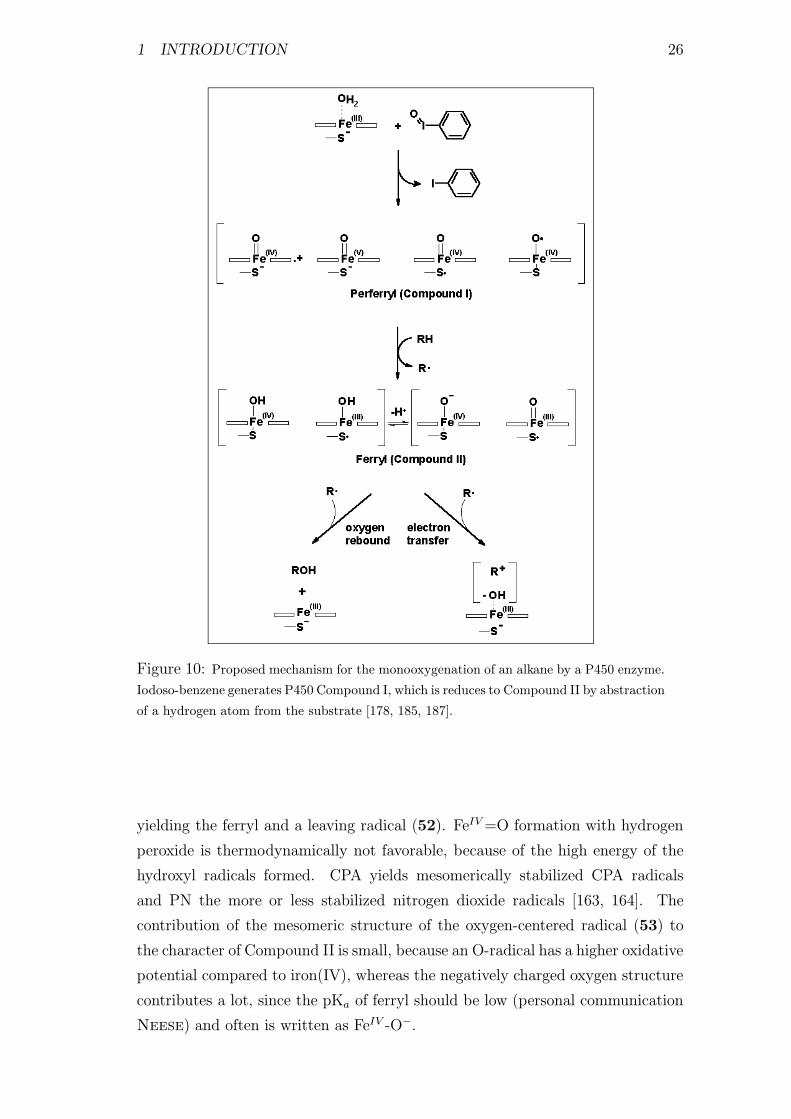
1 INTRODUCTION 26
Figure 10: Proposed mechanism for the monooxygenation of an alkane by a P450 enzyme.
Iodoso-benzene generates P450 Compound I, which is reduces to Compound II by abstraction
of a hydrogen atom from the substrate [178, 185, 187].
yielding the ferryl and a leaving radical (52). FeIV=O formation with hydrogen
peroxide is thermodynamically not favorable, because of the high energy of the
hydroxyl radicals formed. CPA yields mesomerically stabilized CPA radicals
and PN the more or less stabilized nitrogen dioxide radicals [163, 164]. The
contribution of the mesomeric structure of the oxygen-centered radical (53) to
the character of Compound II is small, because an O-radical has a higher oxidative
potential compared to iron(IV), whereas the negatively charged oxygen structure
contributes a lot, since the pKa of ferryl should be low (personal communication
Neese) and often is written as FeIV -O−.

1 INTRODUCTION 27
1.5 Oxidative Stress
PN formation in vivo depends on the levels of superoxide and nitric oxide. Only
under pathophysiological conditions, where the oxygen equilibrium is disturbed,
PN levels are increased dramatically and may be harmful to the organism. These
malfunctions can be summarized under the term ”oxidative stress”. The following
list shows conditions, that fit in this topic (for reviews see [192, 193]) and Fig.11
gives an overview about sources and defenses for reactive oxygen species in the
aerobic cell [Sies, 1989]:
• Hyperbaric oxygen, Hyperoxia
– Retrolental Fibroplasy
– Pulmonary respiration dysfunction
– Ischemia reperfusion damage
• Hypobaric oxygen, Hypoxia
– Systemic hypoxia
– Shock syndrome
• Poisons, chemicals
– Paraquat and other redoxcyclers
– Tetrachloro-methane and other solvents
– Chemotherapy (adriamycin...)
– Nitro-compounds (nitro-phenols, nitrofurantoin)
– Cancerogens, xenobiotica (benzpyren, PCBs)
• Drug-induced hemolytic Anemia
• Vitamin (A, C, E) deficiency
• Aging (cataract, lipofuscine)
• Acute inflammation
– Heat shock, burn damage
– Infections
– Pulmonary edima after hemodialysis
– Cerebral edema

1 INTRODUCTION 28
• Chronical inflammation
– Rheumatoid Arthritis
– Emphysema (inactivation of α-1-antiproteinase)
– Behcets disease
– Cancer
– Diabetes
– Cataracts
• Radiation damage
– Sun burn (UV)
– Radiotherapy
• Air pollution
– Photooxidants (NOX, O3, PAN)
– Sulfur dioxide, hydrogen sulfite
– Asbestos, soot
– Cigarette smoke
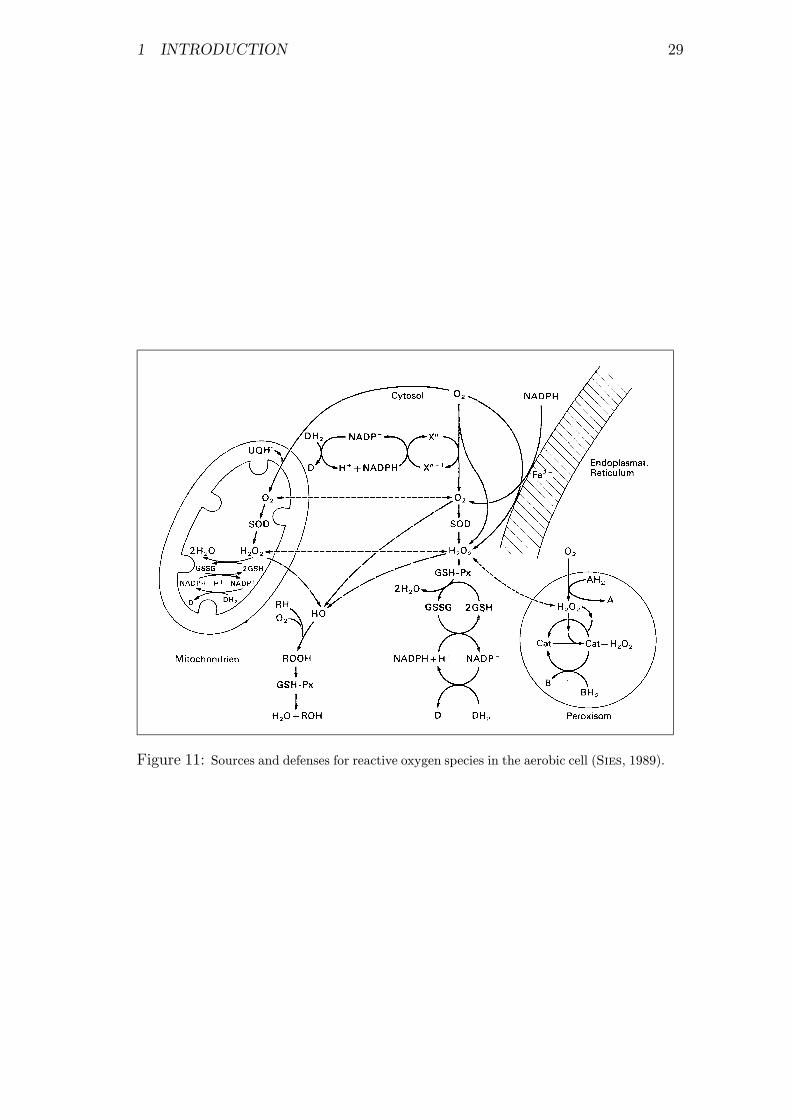
1 INTRODUCTION 29
Figure 11: Sources and defenses for reactive oxygen species in the aerobic cell (Sies, 1989).

2 AIMS OF THE STUDY 30
2 Aims of the Study
With the nitration of prostacyclin synthase as a basis, the present study should
contribute to the following issues:
• It should give a detailed picture of the mechanism by which PN reacts
with phenolic compounds and especially clarify the question, whether this
reaction has a radical or a polar character.
• It should give insights in the mechanism by which metal-complexes influencethe reaction of PN with phenolic compounds. Reactive intermediates during
the metal-catalyzed reaction of phenol with PN should be characterized.
• Other enzymes should be found, which are nitrated in a similar PN con-centration sensitive manner as PGIS and therefore could be considered as
suitable models for PGIS nitration by PN.
• Scavengers for PN or inhibitors for PN-mediated nitration should be iden-tified, which could be employed to protect PGIS from inactivation by PN.
3 MATERIALS AND METHODS 31
3 Materials and Methods
3.1 Reactions of Phenolic Compounds with Peroxynitrite
3.1.1 Chemicals
Chemicals were purchased from Merck, Fluka, Lancaster, Aldrich or Sigma if not
indicated differently and were from the highest purity available. All buffers were
made from water with Milli-Q quality, using salts and corresponding acids for the
desired pH. All buffers were stored not longer than one week at +4 ◦C.
3.1.2 Peroxynitrite Synthesis
Peroxynitrite (PN) was synthesized according to Koppenol and Kissner [9] by
addition of gaseous ·NO to solid potassium superoxide. 0.3 g KO2 were added to 5
g SiO2 sand which was already kept under argon. Next 50 ml ·NO gas were added(2 ml/min) from a syringe to the solid mixture which was stirred on ice. The
solid PN was dissolved in 5 ml 0.1 M sodium hydroxide solution, separated from
the sand, freed from residual hydrogen peroxide with 1-3 g manganese(IV)oxide
and then filtered through a syringe filter. Stock solutions were diluted to a fi-
nal concentration of 50-100 mM, determined spectroscopically using ε302 = 1670
M−1cm−1 [57]. Stock solutions were kept at 193 K for one month or at 253 K
for at least one week without serious losses of PN. The ratio of PN:nitrite was
determined as about 1:1 with the Griess assay [194].
3.1.3 Oxygen Measurements
Oxygen was determined with a modified Clark-type electrode (Eschweiler-Kiel),
using E=+0.8 V for detection of oxygen. The volume of the electrode chamber
was 500 µl. Oxygen release from neutral and alkaline PN solutions was deter-
mined from the decomposition of 800 µM PN in 0.2 M K-phosphate buffer at
different pH-values at 310 K and quantified using a saturated stock solution of
oxygen in water (2.181 mM at 273 K) [195]. Measurements were stopped when
the maximum yield was reached.
3.1.4 Nitric Oxide Measurements
For NO-detection an electrode-potential of -0.8 V was used. Nitric oxide release
from acidic nitrite solutions was measured in the reaction of 5 mM sodium ni-
trite in 0.2 M buffer at 273 K (pH 1: KCl/HCl, pH 2 and 3: Na-citrate/citric
acid, pH 4 and 5: Na-acetate/acetic acid, pH 6 and 7: K-phosphate, pH 8 Tris
3 MATERIALS AND METHODS 32
(tris(hydroxymethyl)-amino-methan)) and quantified with a saturated stock so-
lution of nitric oxide in water (3.275 mM at 273 K) [195].
3.1.5 Determination of Nitrate and Nitrite
Nitrite and Nitrate were quantified by ion chromatography. The column was an
Anion-II 250x4.6 Nucleosil strong anion exchanger (trimethyl-ammonium) from
Macherey & Nagel, the mobile phase consisted of 200 mM potassium phosphate
buffer pH 6.5, the flow was 0.35-0.5 ml/min. The anions were detected UV-
spectroscopically at 225 nm.
3.1.6 Products of the Phenol-PN-reaction
All products from the reaction of phenol with PN were identified and quantified
by HPLC from mixtures containing 5 mM phenol and 800 µM PN in 0.2 M
K-phosphate buffer at 310 K with HPLC using internal and external standards.
Since the buffer was heated and degassed before use a possible contamination
by bicarbonate was low. PN was rapidly added under Vortex-mixing. Standard
incubation times were 5 min. The required minimal incubation times were
determined by spectroscopically recording the absorbance at 350 nm or 400 nm
in the pH-range from 7-12 after addition of PN to the phenolic solution, the
endpoints were determined after 30 sec at pH 8, 120 sec at pH 9, 6 min at pH
10, 30 min at pH 11, 50 min at pH 12. Some products required other incubation
times: for detection of 2-nitroso-phenol the incubationtime was only 1 min,
also biphenols were very sensitive to incubation times. Products were detected
on different HPLC-systems, to avoid overlapping of peaks for identification.
Tab.6 shows a list of all HPLC-systems used and the corresponding retention
times of references. The flow in all HPLC-systems was 1 ml/min. The pH
dependent quantitation of nitrophenols (NP) was done on HPLC-system (VI),
of hydroxyphenols (HP), p-benzoquinone (BQ) and 4-nitrosophenol (p-NO) on
system (I) and of biphenols (BP) on system (V).
1HP for hydroxy-phenol, BQ for benzoquinone, Phe for phenol, NO for nitroso-phenol, NC
for nitro-catechol, NH for nitro-hydroquinone, NP for nitro-phenol and BP for biphenol. The
composition of HPLC-systems was: LKB Bromma 2150 pumps for I-VI, a Spectra Physics
SP8490 variable wavelength detector, SP4290 integrator and an ODS II C18 250x4.6 mm col-
umn (Bischoff) for I-III. A forward optical scanning detector spectra focus from Spectra Physics,
a Merck-Hitachi D-2000 integrator and a Nucleosil C4 250x4.6 mm column (Bischoff) for IV-VI.
The mobile phase of all systems consisted of 0.1 M citric acid/citrate buffer pH 2 and acetoni-
trile. The percentage of acetonitrile is listed beside the system numbers. Hydroxyproducts were
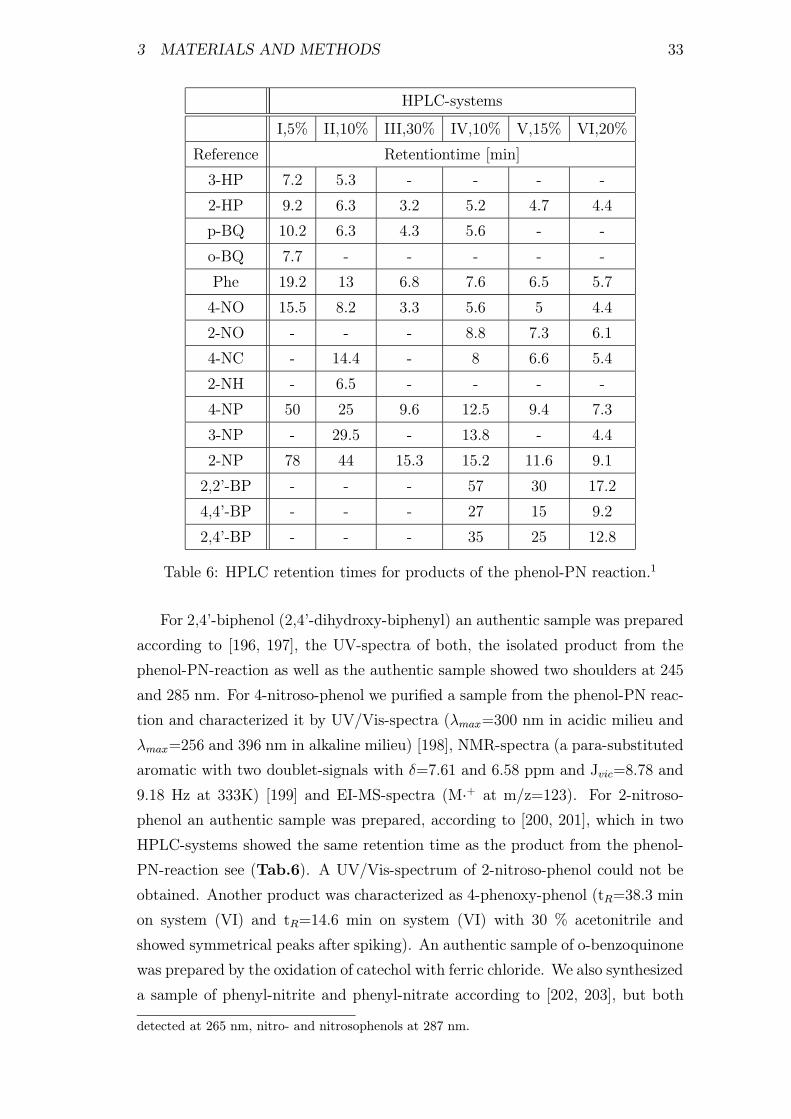
3 MATERIALS AND METHODS 33
HPLC-systems
I,5% II,10% III,30% IV,10% V,15% VI,20%
Reference Retentiontime [min]
3-HP 7.2 5.3 - - - -
2-HP 9.2 6.3 3.2 5.2 4.7 4.4
p-BQ 10.2 6.3 4.3 5.6 - -
o-BQ 7.7 - - - - -
Phe 19.2 13 6.8 7.6 6.5 5.7
4-NO 15.5 8.2 3.3 5.6 5 4.4
2-NO - - - 8.8 7.3 6.1
4-NC - 14.4 - 8 6.6 5.4
2-NH - 6.5 - - - -
4-NP 50 25 9.6 12.5 9.4 7.3
3-NP - 29.5 - 13.8 - 4.4
2-NP 78 44 15.3 15.2 11.6 9.1
2,2’-BP - - - 57 30 17.2
4,4’-BP - - - 27 15 9.2
2,4’-BP - - - 35 25 12.8
Table 6: HPLC retention times for products of the phenol-PN reaction.1
For 2,4’-biphenol (2,4’-dihydroxy-biphenyl) an authentic sample was prepared
according to [196, 197], the UV-spectra of both, the isolated product from the
phenol-PN-reaction as well as the authentic sample showed two shoulders at 245
and 285 nm. For 4-nitroso-phenol we purified a sample from the phenol-PN reac-
tion and characterized it by UV/Vis-spectra (λmax=300 nm in acidic milieu and
λmax=256 and 396 nm in alkaline milieu) [198], NMR-spectra (a para-substituted
aromatic with two doublet-signals with δ=7.61 and 6.58 ppm and Jvic=8.78 and
9.18 Hz at 333K) [199] and EI-MS-spectra (M·+ at m/z=123). For 2-nitroso-phenol an authentic sample was prepared, according to [200, 201], which in two
HPLC-systems showed the same retention time as the product from the phenol-
PN-reaction see (Tab.6). A UV/Vis-spectrum of 2-nitroso-phenol could not be
obtained. Another product was characterized as 4-phenoxy-phenol (tR=38.3 min
on system (VI) and tR=14.6 min on system (VI) with 30 % acetonitrile and
showed symmetrical peaks after spiking). An authentic sample of o-benzoquinone
was prepared by the oxidation of catechol with ferric chloride. We also synthesized
a sample of phenyl-nitrite and phenyl-nitrate according to [202, 203], but both
detected at 265 nm, nitro- and nitrosophenols at 287 nm.

3 MATERIALS AND METHODS 34
were unstable in aqueous solutions and were hydrolyzed to phenol and nitrite or
nitrate, respectively.
3.1.7 Products of the Anisol-PN-reaction
Products of the anisol-PN reaction were identified and quantified on system (V),
using 2-, 3-, 4-nitro-anisol (NA) and 2-, 3-, 4-hydroxy-anisol (HA) as internal and
external standards, with UV-detection at 270 nm. 5 mM anisol was incubated
with 800 µM PN for 5 min at 310 K. The anisol stock solution was 100 mM in
acetonitrile, allowing 25 µl acetonitrile to be added to 475 µl buffer. We ensured,
that this concentration of acetonitrile had no effect on product formation by
adding 25 and 50 µl acetonitrile to the phenol-PN reaction. Retention times:
4-HA (5.8 min), 2-, 3-HA (6.6 and 6.9 min), 4-NA (13.8 min), anisol (15.2 min),
2-NA (17.7 min) and 3-NA (20.4 min). Reactions with NO were done by using
a saturated 3.275 mM standard solution of NO at 273 K [195]. Nitrogen dioxide
was added by a gas-syringe (100 µl ≈ 4.54 µmol) to 1 ml reaction mixtures,
containing 5 mM of the aromatic compound in 0.2 M K-phosphate buffer pH 6
in a sealed microflask with septicum.
3.1.8 Reactions of Tyrosine with Peroxynitrite, Nitric Oxide and PN-
generating Systems
1 mM tyrosine were incubated with different concentrations of PN, Spermine
NONOate (1 or 2 mM) (≥98 %, Cayman Chemical, Ann Arbor, USA) or xanthine(0.5 or 1 mM)/ xanthine oxidase (28 or 56 mU/ml) (grade III, Sigma, Germany)
and NONOate. Decomposition of Spermine NONOate was monitored at 250 nm
(ε250=8000 M−1cm−1) and was found to be ≈16 nmol/min at 37 ◦C in 0.1 M
KPi buffer pH 7.4. The stocksolution was kept on ice in 0.1 M NaOH. Tyrosine
nitration was measured in dependence on PN-concentration and time-dependent
in the case of NO-donors and PN-generating systems by the use of HPLC. A C18
Nucleosil (100-5) 250x4.6 column was used and the mobile phase consisted of 7.5
% acetonitrile in 50 mM citrate buffer pH 2.4, the flow was 1.25 ml/min. Products
were monitored at 275 and 360 nm. Furthermore hydroxylation in these systems
was monitored on the same HPLC system, but the flow was 1 ml/min and a
gradient was used: 0-5 min 0-10 % acetonitrile, 5-15 min 10 % acetonitrile in 50
mM citrate buffer pH 2.5. An authentic sample of 3,3’-dityrosine was synthesized
according to [204].
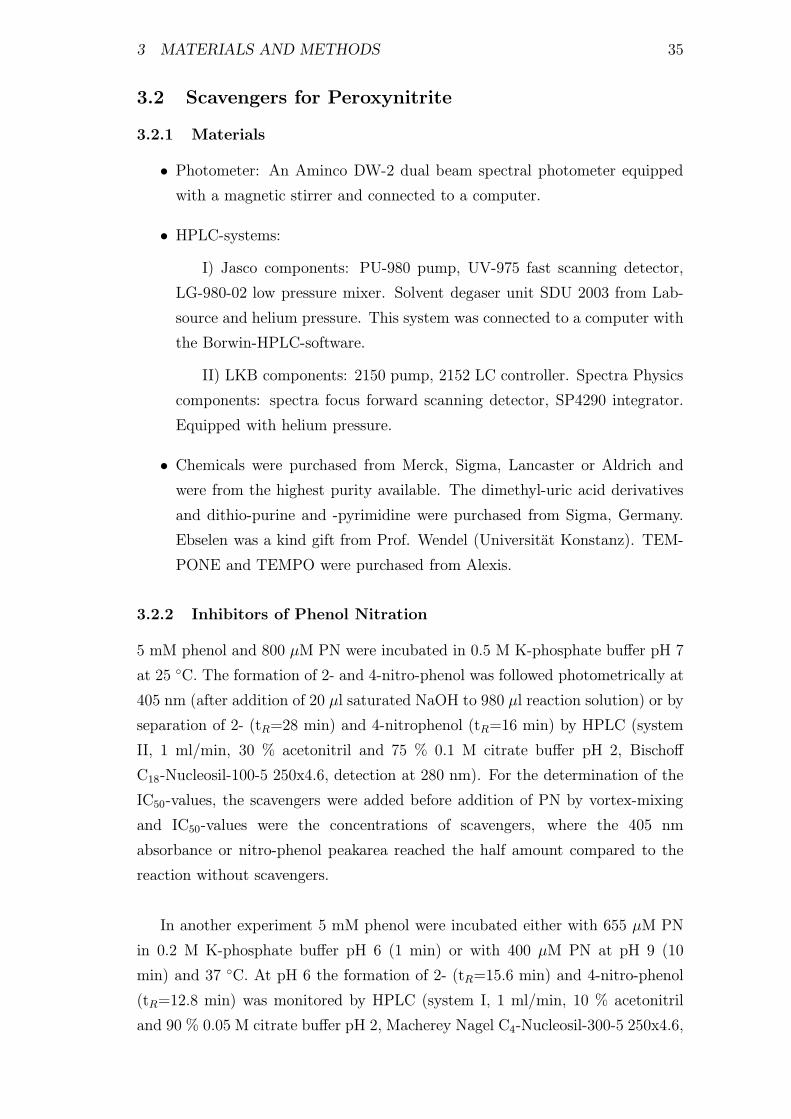
3 MATERIALS AND METHODS 35
3.2 Scavengers for Peroxynitrite
3.2.1 Materials
• Photometer: An Aminco DW-2 dual beam spectral photometer equipped
with a magnetic stirrer and connected to a computer.
• HPLC-systems:I) Jasco components: PU-980 pump, UV-975 fast scanning detector,
LG-980-02 low pressure mixer. Solvent degaser unit SDU 2003 from Lab-
source and helium pressure. This system was connected to a computer with
the Borwin-HPLC-software.
II) LKB components: 2150 pump, 2152 LC controller. Spectra Physics
components: spectra focus forward scanning detector, SP4290 integrator.
Equipped with helium pressure.
• Chemicals were purchased from Merck, Sigma, Lancaster or Aldrich and
were from the highest purity available. The dimethyl-uric acid derivatives
and dithio-purine and -pyrimidine were purchased from Sigma, Germany.
Ebselen was a kind gift from Prof. Wendel (Universitat Konstanz). TEM-
PONE and TEMPO were purchased from Alexis.
3.2.2 Inhibitors of Phenol Nitration
5 mM phenol and 800 µM PN were incubated in 0.5 M K-phosphate buffer pH 7
at 25 ◦C. The formation of 2- and 4-nitro-phenol was followed photometrically at
405 nm (after addition of 20 µl saturated NaOH to 980 µl reaction solution) or by
separation of 2- (tR=28 min) and 4-nitrophenol (tR=16 min) by HPLC (system
II, 1 ml/min, 30 % acetonitril and 75 % 0.1 M citrate buffer pH 2, Bischoff
C18-Nucleosil-100-5 250x4.6, detection at 280 nm). For the determination of the
IC50-values, the scavengers were added before addition of PN by vortex-mixing
and IC50-values were the concentrations of scavengers, where the 405 nm
absorbance or nitro-phenol peakarea reached the half amount compared to the
reaction without scavengers.
In another experiment 5 mM phenol were incubated either with 655 µM PN
in 0.2 M K-phosphate buffer pH 6 (1 min) or with 400 µM PN at pH 9 (10
min) and 37 ◦C. At pH 6 the formation of 2- (tR=15.6 min) and 4-nitro-phenol
(tR=12.8 min) was monitored by HPLC (system I, 1 ml/min, 10 % acetonitril
and 90 % 0.05 M citrate buffer pH 2, Macherey Nagel C4-Nucleosil-300-5 250x4.6,

3 MATERIALS AND METHODS 36
detection at 280 nm). At pH 9 the formation of 4-nitroso-phenol (tR=11 min) was
either followed photometrically at 395 nm or by HPLC (system I, 1 ml/min, 10 %
acetonitril and 90 % 0.05 M citrate buffer pH 2, Macherey Nagel C18-Nucleosil-
100-5 250x4.6, detection at 300 nm). Once more the IC50-values were estimated
as described above.
3.2.3 Inhibitors of Microperoxidase-catalyzed Phenol Nitration
The same method as in the phenol system at pH 6 was used, but with 5 µM
microperoxidase (MP-11) (a porphyrin with 11 amino acids originating from the
degradation of cytochrome c). MP-11 like other heme containing enzymes and
iron-porphyrins leads to a strong increase in nitration of phenol. No IC50-values
were estimated, but the effect of 100 µM scavenger on nitration was monitored
using HPLC.
3.2.4 Inhibitors for the Inactivation of ADH by PN
The activity of 26 nM ADH with 300 µM NAD+ for the conversion of 172 mM
ethanol to acetaldehyde in 0.1 M K-phosphate buffer pH 7.6 was followed spec-
troscopically at 37 ◦C. The formation of NADH at 340 nm was measured time
dependently and the basic specific activity was calculated from the slope of the
linear area (first 25 sec) and was found to be 0.044±0.007 U/mg. In a next stepthe amount of PN was estimated that led to a complete inhibition of the en-
zyme.In this case the ethanol and NAD+ were added after complete reaction of
ADH with PN (5 min) and the activity was measured. 20 µM PN quantitativly
inhibited the enzyme, therefore this value was used for the following experiments.
In a following step we determined the IC50-values of several PN-scavengers in this
systems, by addition of different concentrations to the enzyme, prior to addition
of PN by vortexing carefully. Subsequently the activity was determined. The
IC50-value given for the scavenger corresponded to the concentration, that inhib-
ited 50 % of the ADH-activity.
3.2.5 Kinetics of PN-decomposition
Decay of PN was followed by UV/Vis spectroscopy at 302 nm and the reference
wavelength at 400 nm. The samples were measured in a special cuvette which
was equipped with a magnetic stirrer. Because of inadequate mixing during the
first 2-3 sec the decomposition curves were only compared qualitatively and no
kinetic constants could be obtained from these measurements. 400-800 µM PN
were injected into a stirred pH 7, 8 or 9 buffer solution which contained the

3 MATERIALS AND METHODS 37
scavenger in different concentrations. The velocity of decay was then compared
with the one in controls.
3.2.6 Investigation of the Reaction of Uric Acid with PN
In a first attempt we chose dimethyl analogues of UA, because they were easier
to handle on HPLC and 13C-NMR-data should be easier to interprete, due to
the methyl signals. 2 mM 1,3-dimethyl-uric acid were incubated with 8 mM
PN in 1 M K-phosphate buffer pH 7. The reaction solution (1 ml) was injected
on system II equipped with a semipreparative column (4 ml/min, A: 0.2 M
KCl/HCl buffer B: 2-propanol, gradient: 0-10 min 100 % A, 10-23 min linear to
35 % B, 23-27 min linear to 0 % B, Merck C18-LiChrosorb-7 250x10, detection
at 210 nm). The products were isolated from 20 runs, each of them concentrated
and purified once more with the same HPLC-system, but water as the mobile
phase. This time the isolated peaks were evaporated to dryness and dissolved
in D6-DMSO. From this solutions 1H- and 13C-NMR (also one DEPT) spectra
were made on a Bruker NMR DRX 600, the frequence for 1H was 600MHz, for13C 150 MHz. Also EI-MS and FAB-MS spectra were made on a Varian MAT
312 respectively Varian MAT 312/amd 5000 (EI: 3 kV / 70 eV; FAB: primary
ions (133Cs) 10 kV, secondary ions 6 kV).
In a second attempt 0.5-1 mM uric acid were incubated with 250-2000 µM PN
in 0.2 M K-phosphate buffer pH 6-9 (1-10 min). 20 µl of the reaction solutions
were injected on system I (0.7 ml/min, 0.2 M K-phosphate buffer pH 4.5, two
Macherey Nagel C18-Nucleosil-100-5 250x4.6 columns connected in series, detec-
tion at 220 nm). The HPLC system was modified from the description in [205].
From each product a UV spectrum was taken and the already described oxidation
products of uric acid (allantoin, allantoic acid, alloxanthin, oxonic acid, cyanuric
acid and alloxan) were used as external and internal standards [206, 207]. Some
reaction solutions were additionally incubated with uricase, to see whether some
peaks dissapeared, which could mean that the basic structure was recognized
by uricase. Allantoin and allantoic acid were estimated by hydrolysis (0.12 M
NaOH) of allantoin to allantoate, further hydrolysis to glyoxylic acid and its cou-
pling to 2,4-dinitro-phenyl-hydrazine and identification of the coupling product
on HPLC as described [208]. Urea was quantified by the method of urea degra-
dation to ammonia by urease and the colorimetric measurement of the ammonia-
pH-shift with phthalein purple (o-cresol-phthalein complexone) [209] or by the
o-phthaldialdehyde method [210]. Reagent A consisted of 30 mM Tris, 5 mM

3 MATERIALS AND METHODS 38
complexone, 10 mM edta, 30.8 mM sodium azide and the pH was adjusted to
7.4. Reagent B consisted of 150 mM sodium chloride and 20 U/ml urease (Sigma,
U1500) in water. For assays 250 µl sample were mixed with 125 µl reagent A
and/or 125 µl reagent B respectively in assays without urease, the amount of
reagent B was replaced by equal amounts of 150 mM NaCl-solution.
3.2.7 Reaction of Ebselen with Peroxynitrite
3.2.7.1 Materials Two HPLC systems were used: I) Jasco PU-980 pump,
UV-975 variable-wavelength detector and LG-980-02 low-pressure gradient mixer.
II) LKB 2150 pump, Spectra Physics spectra focus detector and SP4290 integra-
tor. In both systems solvents were gassed with helium. Kinetics were recorded
on an Aminco DW-2 UV/Vis spectrophotometer in the dual-wavelength mode,
equipped with a magnetic stirrer.
3.2.7.2 Separation of ebselen, GSH-ebselen and ebselenoxide System
I was used with a C4-Nucleosil-300-5 column 250x4.6 (Macherey-Nagel, Duren,
Germany), the mobile phase consisted of 80 % 0.1 M K-phosphate buffer pH 4.5
and 20 % acetonitrile. The flow was 1.2 ml/min and the products were detected
at 270 nm. Spectra were taken from each peak. Solutions of 500 µM ebselen
(from a 10 mM stock solution of ebselen in acetonitrile) in 0.1 M K-phosphate
buffer at pH 7 and 9 were treated with different concentrations of GSH (0.05-5
mM) and were then reacted with 500 µM PN. 50 µl of each sample were injected
on the HPLC.
3.2.7.3 Determination of free ebselen concentrations in bovine aortic
microsomes and tissue-containing solutions System II was used with a C4-
Nucleosil-300-5 column 250x4.6 (Macherey-Nagel, Duren, Germany), the mobile
phase consisted of 80 % 0.1 M K-phosphate buffer pH 4.5 and 20 % acetonitril
for the tissue-samples (1) and 75 % water and 25 % acetonitril with 0.1 % added
trifluoroacetic acid in the microsomal experiments (2). The flow was 1.2 ml/min
and the products were detected at 270 nm. (1) 4.3 µM ebselen were incubated
with 0.134 g dry weight (first sample) and 0.077 g (second sample) of bovine
coronary tissue in 10 ml PBS-buffer and aliquotes of 50 µl were taken after 1, 15,
30 and 35 min and injected on HPLC. Ebselen and GSH-ebselen were identified
by external standards. (2) 500 µl bovine aortic microsomes (1 mg/ml protein)
were incubated with 500 µl 1 mM DTNB for 10 min in 0.2 M K-phosphate
buffer pH 7.5. The solution turned yellow, indicating the reaction of DTNB with
free thiol-groups. After centrifugation the supernatant was removed and 1 ml

3 MATERIALS AND METHODS 39
fresh K-phosphate buffer was added. The sample was vortexed and then 20 or
50 µM ebselen were added and incubated for 5 min. 50 µl of this solution were
injected on HPLC. The same procedure was performed for the non-DTNB-treated
microsomes. Concentrations of ebselen were quantified by external standards.
3.2.7.4 Protective effects of ebselen, GSH and ebselen-GSH on
phenol- and BSA-nitration Solutions of 5 mM phenol in 0.1 M K-phosphate
buffer at pH 7 or 9 were supplemented with ebselen, GSH or both and were re-
acted with 1 mM PN. The yield of nitro-phenols (pH 7) or 4-nitroso-phenol (pH
9) was determined from the absorbance at 400 nm (after addition of NaOH(aq)).
PN- and ebselen decomposition kinetics were recorded at 320 against 370 nm.
At this wavelength PN as well as ebselen absorb, but not ebselenoxide and the
ebselen-GSH-adduct has a very low absorbance. PN was always added last to
the stirred solution in the cuvette by a syringe through a septicum. The de-
composition of 100 µM PN and 50 µM ebselen with 0, 20 or 40 µM BSA in
0.2M K-phosphate buffer at pH 10 was recorded and also the decomposition of
250 or 500 µM PN and 200 µM ebselen with 0, 200 and 400 µM GSH in 0.2 M
K-phosphate buffer pH 8, 9 and 10.
3.3 Metal-catalyzed Reactions of PN
3.3.1 Decomposition Kinetics of PN
The decay of PN was followed by the absorbance difference at 302 and 350 nm.
The metal-complex was preincubated in 0.1 M K-phosphate buffer at pH 8 or 9
and 10 ◦C. 200-600 µM PN were injected into the stirred solution with a syringe.
The spectrophotometer was equipped with a magnetic stirrer and the conditions
were analogous to those described in 3.2.5. Dioxygen formation in solutions
of PN and heme or heme-thiolate enzymes were measured polarografically as
described in 3.1.3 [130]. Nitrite and nitrate were measured according to 3.1.5
and NO−2 additionally by the Griess test [194]. The latter was also tried for the
determination of nitrate, which was first reduced by nitrate reductase [194], but
this method failed in our experiments.
3.3.2 Metal-catalyzed Nitration of Phenol
5 mM phenol were preincubated with the 0.5-20 µM of the metal complexes
or enzymes in 0.1 M KPi pH 6-8 at 37◦C. Then 400-800 µM PN were added
in 0.1 M NaOH (not more than 5 vv% of the reaction solution to avoid a pH-
shift) by Vortex-mixing. The yield of nitrated products was either measured

3 MATERIALS AND METHODS 40
qualitatively by their absorbance at 350 nm at neutral and 420 nm at alkaline pH
or quantitatively together with hydroxylated and dimerized products by using
HPLC as described in 3.1.6 [130, 163]. To see whether an effect was really due
to enzyme-catalysis controls were done with heat-denatured enzymes. In these
controls the enzymes were preincubated in buffer, then heated for 10 min at 95◦C, allowed to cool down. Next phenol was added and at last mixed with PN. In
some cases also 10 vv% of acetonitril were added to enhance the denaturation of
the enzymes.
3.3.3 Spectral Intermediates During Reaction of PN with Transition-
metals
Stopped-flow measurements were done in collaboration with Dr. Herold at
ETH Zurich according to [111, 163]. Measurements were carried out with an On-
Line Instrument Systems, Inc. stopped-flow instrument equipped with an OLIS
RSM 1000 rapid scanning monochromator (cell-width 2 cm). The temperature
was maintained at 12 ◦C and the pH was measured at the end of the reactions
for control. Data were taken every millisecond and the spectra which are shown
were averaged (62/s). NOR solutions at 4-20 µM in 0.1 M phosphate buffer pH
5-8, were reacted with an excess of PN, 66-800 µM in an equal volume of 10 mM
NaOH. The final concentrations were 2-10 µM NOR and 33-400 µM PN in 0.05
M KPi at pH 5.9-8.5. Further stopped-flow measurements were done together
with Prof. Dr. Ghisla at Universitat Konstanz. This instrument consisted of
an J&M diode array detector and the setup for the other parts was developed in
the group of Prof. Dr. Ghisla [211]. The stopped-flow data was interpreted by
using the Spectacle software of Labcontrol.
All other spectra were recorded on an Aminco photometer. The HRP-ferryl and
-NO spectra were obtained by difference absorbance spectroscopy. 5 µM HRP
were incubated with either 400 µM SIN-1 or 25 µM DENO in 0.1 M KPi pH 7.4
at 37 ◦C. After some minutes of incubation 200 µM ascorbate were added to both
solutions.
3.4 Reactions of PN with P450BM−3
3.4.1 Materials
P450BM−3 (CYP 102) from Bacillus megaterium [182, 212] (this enzyme was a
gift of J.A. Peterson, USA) and P450NOR (CYP 55AI) from Fusarium oxysporum
[213] (this enzyme was a gift of H. Shoun, Japan) were purified as described.

3 MATERIALS AND METHODS 41
Chloroperoxidase (EC 1.11.1.10) from Calderomyces fumago, horseradish perox-
idase (EC 1.11.1.7) (lyophilized powder) xanthine oxidase (XO) (EC 1.13.22)
(grade II) from buttermilk, Cu,Zn-SOD (EC 1.15.1.1) from bovine erythrocytes,
Mn-SOD (EC 1.15.1.1) from E.coli, Uricase (type V) from porcine liver and
the protease inhibitor cocktail (P8465 and P2714) were purchased from Sigma
(Steinheim, Germany). Spermine NONOate (N-[4-[1-(3-aminopropyl)-2-hydroxy-
2-nitrosohydrazino]butyl]) and diethylamine NONOate (Ethanamine, N-ethyl-,
compound with 1,1-diethyl-2-hydroxy-2-nitrosohydrazine (1 : 1)) were purchased
from Cayman Chemical Company (Ann Arbor, USA). SIN-1 hydrochloride (3-
morpholino sydnonimine) was from Calbiochem-Novabiochem Corporation (La
Jolla, CA, USA) 12-(p-nitrophenoxy)-dodecanoic acid was a kind gift from Dr.
U. Schwaneberg (University of Stuttgart) [214]. All other chemicals were pur-
chased in the highest purity available. Peroxynitrite was synthesized according
to the method described by Kissner and Koppenol [9] from ·NO and potassiumsuperoxide and purified from residual H2O2 with MnO2. 3,3’-dityrosine (3,3’-
DT) was synthesized by incubation of tyrosine with HRP and H2O2 as previously
described [204].
3.4.2 Nitration of Free Tyrosine by Bolus Addition and Simultane-
ously Generated PN
1 mM tyrosine and 10-100 µM PN in 0.1 M K-phosphate buffer pH 7.4 were
vortexed at 37 ◦C, incubated for 5 min and assayed for the product pattern. For
the following experiments the same conditions as described previously [22] were
employed: 1 mM tyrosine was incubated with 1 or 2 mM spermine NONOate
for 16 h at pH 7.4 and aliquotes were taken after 20, 40, 60, 120, 240, 480 and
960 min and directly injected in the HPLC. The same procedure was used for
1 mM tyrosine incubated with 1 mM spermine NONOate and 28 or 56 mU XO
in buffer pH 7.4, containing 1 mM hypoxanthine. Products were identified and
quantified by using a HPLC system from Jasco (PU-980, UV-1575 and LG-980-
02) and a Nucleosil 100-5 C18-column (250 x 4.6 mm) from Macherey & Nagel
(Duren, Germany). The mobile phase consisted of 7.5 % acetonitrile and 92.5
% 50 mM citrate buffer pH 2.4 (1 ml/min) and UV/Vis detection at 275 as well
as 360/428 nm. The detection limit for a 3-NT standard was 40 nM for 50 µl
injection volume. Typical retention times were 3.6 min for tyrosine, 6.7 min for
3-NT and 7.5 min for 3,3’-DT.

3 MATERIALS AND METHODS 42
3.4.3 Nitration of P450BM−3 WT and F87Y Variant by Bolus Addition
and Simultaneously Generated PN
The nitration of P450BM−3 WT, F87Y and CPO was monitored by Western
blot analysis, using a rabbit polyclonal nitrotyrosine antibody (K552) made in
our laboratory according to the method of Beckman et al [215]. Proteins were
separated by SDS-PAGE on a 10 % acrylamide gel, 1 % SDS, 1 % APS and
0.05 % TEMED in 375 mM Tris pH 8.8. The accumulation gel consisted of 4
% acrylamide, 1 % SDS, 0.5 % APS and 0.1 % TEMED in 125 mM Tris pH
6.8. 5 µl of each sample in Laemmli buffer were put on the gel, the electrolyte
consisted of 25 mM Tris, 192 mM glycin and 5 mM SDS at a current of 35 mA
for 1 h. Proteins were transfered by a semi-dry blot procedure to a nitrocellulose
membrane with a current of 0.8 mA/cm2 for 90 min in 48 mM Tris, 39 mM
glycin, 0.07 % SDS and 20 % methanol. Proteins were controlled by Ponceau S
staining on the membrane. The membrane was blocked with 5 % milkpowder in
PBS/T (with 1 % Tween 20) for 2 h at RT. Then the membrane was incubated
for 90 min at RT in 15 ml α-NT 1:2000 in PBS/T with 0.05 % milkpowder,
washed three times in PBS, three times in PBS/T and another three times in
PBS. In the next step the membrane was incubated for 45 min at RT in 15 ml
goat-a-rabbit (1:10000 dil.) in PBS/T with 0.05 % milkpowder. Then the 3
washing steps were repeated and the blot was developed by ECL. In standard
reactions 5 µM of the enzyme were prepared in 0.1 M phosphate buffer pH 7.4
and rapidly mixed with 2.5-5 µl of PN in 0.1 M NaOH giving a final volume
of 100 µl and the desired final concentration of PN. Other enzymes such as
HRP or SOD (150-200 U/100 µl reaction solution) (1-2 µl of an aqueous stock
solution) were added to the buffer together with P450BM−3, the starting volume
of the buffer was adjusted to give 100 µl in all reactions. The buffer for XO
assays contained 500 µM hypoxanthine. To avoid the accumulation of the known
PN-scavenger uric acid, uricase was added in some experiments, but it turned
out that contaminations in the employed uricase decreased the yield of nitration.
2.8, 5.6 or 28 mU/ml XO (1-2 µl of a stock solution in reaction buffer), 0.1 or 1
mM spermine NONOate (1-2 µl of a stock solution in 0.1 M NaOH) and 0.1 or
1 mM SIN-1 (1-2 µl of a freshly prepared stock solution in water) were added
directly to the reaction buffer and incubated for at least 10 h. PN scavengers
(500 µM) were added together with P450BM−3 before mixing with 50 µM PN.
Protease inhibitors were prepared as described in the product information from
Sigma and were solved in 1 ml DMSO / 4 ml water (for bacterial cell extracts)
and 100 ml water (for general use). 2.5 µl of these stock solutions were added

3 MATERIALS AND METHODS 43
where indicated (100 µl final volume).
Another PN-generating system consisted of pyrogallol, which was described
to generate superoxide during its autooxidation [51] and diethyl NONOate, but
the nitration results were not reproducable probably due to the PN-scavenging
effect of pyrogallol [216].
3.4.4 Inhibition of PN-mediated Nitration of Phenol and P450BM−3
by Palmitate
Palmitate was prepared as a 20 mM stock solution in acetonitril, this allowed
additions of small volumes, since acetonitril has a slightly increasing effect on
nitration by PN [130]. The palmitate only was dissolved after sonication and fell
out, when the solution cooled down. Over all experiments the volume of acetoni-
tril was kept the same. 1-1.5 µM BM3-WT and F87Y variant were preincubated
with 10-200 µM palmitate in 0.1 M K-phosphate buffer pH 7.4 at RT. In cases
were the effect on phenol nitration was measured, phenol was present at 500 µM.
PN was added by Vortex-mixing from a stock solution in 0.1 M NaOH. Nitration
of phenol was monitored by UV/Vis spectroscopy (Aminco photometer) at 400
nm after addition of 25 µl 1 M NaOH to 250 µl reaction solution. Nitration of
BM3-WT and F87Y variant was measured by the already described Western blot
technique, but this time an anti-NT was used from Upstate Biotechnology Incor-
porated (Hamburg, Germany). A secondary antibody (goat anti-mouse IgG) was
obtained from Pierce (Rockford, Illinois, USA).
3.4.5 Localisation of Nitrated Tyrosines in P450BM−3 WT and F87Y
From each sample of the Western blots aliquots were directly taken for HPLC
analysis: 20 % acetonitrile were added to the sample, then heated for 10 min at
95 ◦C. After denaturation the pH was adjusted to 8, the pH-optimum for trypsin,
which was added 1:10 based on the concentration of P450BM−3 and incubated for
5-10 h. The degradation was checked by SDS-gel electrophoresis and Coomassie
staining. 50 µl of the degraded sample were injected on the Jasco HPLC system,
by using a Nucleosil 100-5 C18-column (250 x 4.6) from Macherey & Nagel (Duren,
Germany) and a gradient of 0-75 % B in 40 min (A: 10 % acetonitrile and 0.1 %
TFA in water, B: 80 % acetonitrile and 0.08 % TFA in water) (1 ml/min). After it
had passed the first detector the mobile phase was made alkaline by mixing with
0.5 ml/min 50 mM borate buffer pH 10 from a second pump. This step allowed
simultaneous detection of nitrotyrosinate at 428 nm by a second detector. A list

3 MATERIALS AND METHODS 44
of the theoretically obtained peptide fragments and the corresponding masses
were calculated by using the computer program ExPASy-PeptideMass.
3.4.6 Electrospray Ionization (ESI) Mass Spectrometry
Mass spectra were obtained with an AUTOSPEC-Q tandem hybrid mass spec-
trometer (VG Analytical, Manchester, England), equipped with the Mark IV
ESI source (Micromass, Manchester, England) and an OPUS data system. Sam-
ples were diluted with acetic acid to a final concentration of 50 % acetic acid
and injected onto a column (10 x 1 mm) of polymeric beads with 4000 A pores
(Michrom BioResources, Auburn, CA) equilibrated with 0.1 % formic acid. The
trapped peptides were desalted by elution with 0.1 % formic acid. Subsequently,
the peptides were eluted directly into the ESI source with 0.1 % formic acid/90 %
methanol (v/v) at a flow of 8 µl/min through a 130-µm ID stainless steel needle
and nebulized with a coaxial gas flow of nitrogen at 10 l/h.
3.4.7 Measurements of P450BM−3 Reductase Activity and Determina-
tion of Thiol-groups within the Enzyme
The reductase activity of 0.01 µM P450BM−3 was measured by the known
NADPH-dependent reduction of 10 µM cytochrome c [217] in 0.1 M potassium
phosphate buffer pH 7.4 at 37 ◦C. Reduced cytochrome c was followed by
time-dependent measurement of the absorbance difference between 550 and
560 nm. The inactivation of the reductase-domain of 0.01 µM P450BM−3
by PN was determined by addition of 0-20 µM PN to the enzyme and, after
5 min, addition of 10 µM cytochrome c and 25 µMNADPH to start the reduction.
Thiol-groups were determined spectroscopically by addition of 2,2’-dithio-
bipyridine (DTBP) (Sigma, Germany), which forms mixed disulfides with free
SH-groups within the enzyme. For each SH-group one equivalent of free mercapto-
pyridine is formed, which has a high absorption at 343 nm (ε343=7600 M−1cm−1
[218]). The mechanism is similar to that one of Ellmans reagent (dithio-bis-
(nitro-benzoic acid), DTNB) and although the extinction coefficient of DTBP is
half as high compared to DTNB, it has other advantages. DTBP shows a high
pH stability and does not easily undergo self hydrolysis. 5 µM enzyme in 0.1 M
K-phosphate buffer pH 7.4 were either treated or not treated with 50 µM PN.
Next 50 µM DTBP (2 µl in acetonitril) were added from a 5 mM stock solution
in acetonitril. Kinetics were measured at 343 and 400 nm as a wavelength pair
for 5 min. The DTBP dimer only showed marginal absorption when employed at

3 MATERIALS AND METHODS 45
this concentration.
3.4.8 Monooxygenase Activity Assay for P450BM−3 WT
The method described by Schwaneberg et al [214], was used with 12-(p-nitro-
phenoxy)-dodecanoic acid as a substrate. This test is based on the release of
p-nitro-phenolate from an instable hemiacetal formed by ω-hydroxylation of the
fatty acid. 0.1 µM P450BM−3 WT were incubated with 90 µM substrate in 0.1 M
potassium phosphate buffer pH 8.2 at 37 ◦C. The reaction was started by addition
of 200 µM NADPH. The release of p-nitro-phenolate was monitored at 410 nm on
an Aminco DW-2 UV/Vis spectrophotometer equipped with a magnetic stirrer.
For inhibition experiments 0.1 µM enzyme were mixed with different amounts of
PN (2.5-5 µl in 0.1 M NaOH) to give a final volume of 500 µl. Substrate was
added after this first step. Scavengers were added first followed by PN.
3.4.9 Stopped-flow Measurements
Measurements were carried out with an On-Line Instrument Systems, Inc.
stopped-flow instrument equipped with an OLIS RSM 1000 rapid scanning
monochromator (cell-width 2 cm). The temperature was maintained at 12 ◦C
and the pH was measured at the end of the reactions for control. Enzyme so-
lutions, 1-10 µM in 0.1 M phosphate buffer, were reacted with an excess of PN,
33-800 µM in 10 mM NaOH. Alternatively, m-chloro-peroxy-benzoic acid, H2O2
and persulfate in H2O/phosphate buffer were used as oxidizing agents.
3.4.10 Structure of P450BM−3
The structure shown in Fig. 8 was obtained from the corresponding protein
database file (1bu7.pdb) published by Sevrioukova et al (1998) and was rendered
with the computer programs Raster 3D [219] and Molscript [220]. The calcula-
tions of the distancies between heme-iron and OH-groups of tyrosines or 4’-carbon
of F87 were done by using Rasmol [221] and MolMol [222].
3.5 Reactions of P450CAM with PN
3.5.1 Materials
P450CAM from Pseudomonas putida (E.C. 1.14.14.1) was expressed in Es-
cherichia coli strain TB1 and purified as described [223, 224] (this enzyme
was a gift from Dr. C. Jung, Max-Dellbruck-Centrum, Berlin, Germany).
Ethanolic camphor was added to a 50 µM solution of P450CAM, resulting in final

3 MATERIALS AND METHODS 46
concentrations of 500 µM camphor and 132 mM ethanol (0.8 v%). Metyrapone
(1,2-di-(3-pyridyl)-2-methyl-1-propanon) was purchased from Roth, Germany.
PN was synthesized as described in 3.1.2.
A monoclonal antibody against 3-nitrotyrosine (anti-NT, clone 1A6) was pro-
cured from Upstate Biotechnology Incorporated (Hamburg, Germany). The an-
tibody concentration in the stock solution was 2 µg / ml. Secondary antibody
(goat anti-mouse IgG) was obtained from Pierce (Rockford, Illinois, USA). The
stock solution was 0.8 mg / ml. The enhanced chemiluminescence (ECL) kit and
nitrocellulose transfer membrane (Hybond C, pore size 0.5 µm) were purchased
from Amersham (Braunschweig, Germany).
3.5.2 P450CAM-catalyzed Nitration of Phenol and Tyrosine Residues
by PN
5 mM phenol were reacted with 800 µM PN in 0.1 M KPi at pH 7 and 7.5 in the
presence of different heme and heme-thiolate enzymes (1-2 µM). The products
were identified and quantified as described in 3.1.6.
2.5 µM CAM was treated with 0-500 µM PN in 0.1 M KPi pH 7 or 7.5
in the presence or absence of 0.5 mM camphor or 50 µM metyrapone. 10 %
acetonitrile were added to the ”nitrated” enzyme solution, which was then kept
for 5 min at 95 ◦C. After denaturation 250 nM trypsin were added and the
mixture was incubated for 10-18 h. 50 µl of the peptide mixture were analyzed
by using HPLC. All conditions were the same as described in 3.5.4 exept the
gradient which was used here: 0-40 min 0-75 % B (A: 5 % acetonitrile and 0.1 %
TFA in water, B: 80 % acetonitrile and 0.1 % TFA in water). Identification and
localization of the nitrated tyrosine residues was done according to 3.5.5. 10 µl
of the HPLC samples were used for Western blot analysis. α-NT Western blots
were made according to 3.5.3.
Protein samples were treated with Laemmli sample buffer, kept at 95 ◦C for
5 min and then separated by 7.5 % (v/v) sodium dodecyl sulfate-polyacrylamide
gel electrophoresis with an amount of 2 µg protein per well, with a constant
current of 30 mA for 50 min. The size of the separation gel was 8.2 x 7.5 cm2.
Next proteins were transferred from the gel to a nitrocellulose membrane in a
semi-dry blot procedure with a constant current of 50 mA for 90 minutes. The
blot buffer consisted of 48 mM Tris / 39 mM glycine / 20 % (v/v) methanol / 0.07

3 MATERIALS AND METHODS 47
% (w/v) SDS. Proteins were visualized with 0.1 % Ponceau S in 5 % (v/v) acetic
acid to check efficiency of the transfer. After destaining with phosphate-buffered
saline (PBS), the membrane was blocked with 5 % (w/v) milk powder in PBS
(pH 7.4) for 2 hours at room temperature and after several washing steps with
PBS and PBS containing 0.1 % Tween-20 it was incubated with a monoclonal
antibody against nitrotyrosine at a dilution of 1:1000 overnight at 4 ◦C. After
further washing, the membrane was incubated with a goat anti-mouse antibody
for 45 minutes at a dilution of 1:7500. Finally antibody binding was detected by
the ECL technique according to the instructions of the merchant.
3.5.3 Camphor Binding Spectra of P450CAM after Treatment with PN
2.5 µM camphor-free CAM were titrated with an ethanolic aqueous solution of
camphor in 0.1 M KPi pH 7.5 at 10◦C and the absorbance shift from 417 nm
(camphor-free form) to 393 nm (camphor-bound form) was followed by UV/Vis
spectroscopy. After each addition of camphor (1, 2, 3, 13, 113 and 1113 µM total
concentration) a spectrum was recorded. This procedure was repeated for CAM
which was treated with 50 and 250 µM PN.
3.5.4 CO-binding Spectra of Reduced P450 Enzymes after Treatment
with PN
2.1 µM CAM (substrate-free, 250 µl) were mixed with 250 µM CO (50 µl of a
1.56 mM, saturated CO solution in water at 0 ◦C [195]), then 5 µl of a saturated
sodium dithionite solution were added to the total volume of 300 µl. The same
procedure was done for CAM after treatment with 50 and 250 µM PN. Also BM3
and NOR were examined by this method.
3.5.5 Decomposition Kinetics of PN in Presence of P450CAM, P450NOR
and Microperoxidase and Stopped-flow Analysis of the Reaction
of P450CAM with PN
PN-decomposition kinetics were followed according to 3.4.1. Stopped-flow ex-
periments were done together with Prof. Ghisla at Universitat Konstanz as
described in 3.4.3.

4 RESULTS 48
4 Results
4.1 Reactions of Peroxynitrite with Phenolic Compounds
4.1.1 Short Introduction
Our group became involved in the chemistry of PN by the observation that the
heme-thiolate enzyme prostacyclin synthase became inactivated by submicromo-
lar concentrations of PN and a nitration of a tyrosine residue at the active site was
likely to be involved [10, 11]. Current work could establish that this reaction has a
major impact on cardiovascular pathophysiology (Zou et al [167, 169]) and there-
fore more detailled studies were undertaken to elucidate the mechanism of tyrosine
nitration. Phenol can be used as a convenient model and several reports have
been dealing with this compound in order to characterize the reaction pathways
of PN [62, 128]. As a result from a number of investigations a complex behav-
ior of PN emerged which was dominated by the pH-value employed [62, 56, 61].
PN is quite stable as its anion and only few compounds can react directly by
oxene transfer or a so-called two-electron oxidation pathway. Seleno compounds
[85, 225], thioethers [84, 139] or transition metal-complexes [104, 174] are among
such acceptors. At neutral pH with a pKa of 6.8 PN is rapidly protonated and
undergoes a transition from the cis-form to the trans-form of peroxynitrous acid
[56, 59]. This species at room temperature is supposed to reach a vibronically ex-
cited state or a triplet state with properties of a hydroxylradical-nitrogen dioxide
radical complex [HO· ·NO2] [56, 66]. This highly reactive intermediate eventually
would isomerize to nitrate, but during its lifetime can react with organic molecules
by one-electron oxidations [75, 82, 89] by hydroxylation [66, 62], nitration or by
generation of hydroxy-nitrito adducts [226]. It also was reported that above pH
7 dioxygen is formed together with two molecules of nitrite [9, 72, 61] which can
be envisaged as a disproportionation at high concentrations of PN. In the present
study we use phenol as a model for tyrosine nitration and follow the product
pattern over the whole pH range. By comparison with anisol as a substrate we
show that for nitration by PN but not for hydroxylation the phenoxyradical must
be considered an obligatory intermediate.
4.1.2 The Contribution of Nitrite
PN in aqueous solutions undergoes a series of unusual transitions accompanied
by the generation of reactive intermediates which interact with each other so that
a complex pattern of strongly pH-dependent reactions will be a consequence.
Care has to be taken that nitrite as a contaminant and a secondary product

4 RESULTS 49
at higher pH-values does not lead to PN unrelated products. We therefore
first determined the content of nitrite in our preparation and established its
contribution to reactions with phenol over the whole pH-range [227]. As shown
in Fig.13 there is a significant formation of 4-nitroso-phenol starting at about
pH 5 towards the acidic range. The same pH-dependence but with lower yields
one sees for 2- and 4-nitro-phenol formation and a similar one could be observed
for the NO-release from nitrite solutions (see Fig.12).
Figure 12: pH-dependent NO-release
from nitrite solutions in KCl/HCl (pH 1),
citrate buffer (pH 2 and 3), acetate buffer
(pH 4 and 5). 5 mM nitrite were injected in
the electrode-cell of a NO-measuring unit
(∆E= -0.8 V). Quantitation by standard
NO-solutions in water at 273 K (3.275 mM
NO at saturation). Arrow bars indicate
mean values from three measurements.
Figure 13: pH-dependent formation of
nitroso- and nitro-compounds from 5 mM
nitrite and 5 mM phenol in at 310K, in-
cubated for 5 min. Products are: (◦)4-nitro-phenol, (open square) 4-nitroso-
phenol, (�) 2-nitro-phenol. Products were
detected and quantified on HPLC-system
(VI). Arrow bars indicate mean values
from three measurements.
4.1.3 The Disproportionation of Peroxynitrite
It has been reported that PN can undergo isomerization to nitrate at acidic
pH-values [56] but above pH 7 the release of dioxygen with a stoichiometric
formation of two moles of nitrite can be observed [61]. Since this reaction
may depend on buffer composition and on PN concentration the generation
of dioxygen was also followed polarographically under our defined incubation
conditions with 800 µM PN as a function of pH (Fig.14).
Being low at pH 7 the release of dioxygen increased until a maximum of
about 120 µM at pH 9 in 0.2 M K-phosphate buffer (Fig.14). The kinetics
of the release are relatively fast at pH 8 and below and at pH 11 become too
slow to reach completion in an observable time scale (Fig.15). Below pH 7

4 RESULTS 50
Figure 14: pH-dependent oxygen-release of
800 µM peroxynitrite in 0.2 M K-phosphate
buffer at 310 K. Measured with aClark-type-
electrode (Eschweiler, Kiel) and E=+0.8 V for
oxygen detection. At pH 10 the reaction was
completed after 20 min. Representative values
from a series of measurements with different
PN concentrations.
Figure 15: Time-dependent oxygen-
release from 800 µM PN in 0.2 M K-
phosphate at 310K and different pH.
(line) pH 8, (bold line)pH 9, (broken
line) pH 10, (bold broken line) pH 11.
Typical experiment out of five.
the disproportionation pathway was virtually absent and was replaced by the
isomerization as measured by an increasing amount of nitrate (determined by
ion chromatography with UV/Vis detection. See Fig.16).
Figure 16: Formation of nitrite and ni-
trate from 655 µM PN in dependency of
pH. Solid squares for total amount of ni-
trite and nitrate, open squares for the ra-
tio, solid circles for nitrite and open circles
for nitrate. Determined by ion chromatog-
raphy (UV-detection, Anion-II-column).
4.1.4 The Reaction of Phenol with Peroxynitrite
In the presence of 5 mM phenol at pH 5 hydroxylated, nitrated and nitrosy-
lated metabolites were detected as illustrated by the chromatograms shown in
Fig.17,18.
As could be expected for such oxidizing conditions the primary hydroxylation
products catechol and hydroquinone were partly oxidized to their quinones,
from which p-benzoquinone was clearly identified. Another unstable compound

4 RESULTS 51
Figure 17: Chromatogram of the re-
action mixture of 800 µM PN and 5 mM
phenol at pH 5 and 310 K (incubated
for 5 min) on system I, detected at 265
nm.
Figure 18: Chromatogram of the reac-
tion mixture of 800 µM PN and 5 mM phe-
nol at pH 2 and 310 K (incubated for 5
min) on system VI, detected at 287 nm.
(1) 4-nitroso-phenol, p-benzoquinone and 2-
hydroxy-phenol; (2) 4-nitro-catechol; (3) 2-
nitroso-phenol; (4) 4-nitro-phenol; (5) 2-nitro-
phenol; (6) 2,4’-biphenol.
could be identical with o-benzoquinone since the peak was also formed as the
main product from catechol in the presence of ferric chloride. At acidic pH 2-
and 4-nitro-phenol as well as 2- and 4- nitroso-phenol were present, together
with 4-nitro-catechol and a minor peak (Fig.18) which co-chromatographed
with 2,4’-biphenol in two solvent systems (verified by spiking the peak with
an authentic sample) and showing identical UV-spectra. Yields of known
products were in good agreement with previous studies [5, 62, 128], except
2-hydroxyphenol in the first one.
A quantitation of hydroxyphenols (Fig.19) as a function of pH resulted in an
optimum at 4.5 and low activities above 8 or below 3. From 800 µM PN about
85 µM were converted to hydroxylated phenols under optimum conditions.
The formation of nitrated phenols, 2- and 4-nitro-phenol, showed two pH-
optima at 6-7 and at 2 (Fig.20). Since 4-nitroso-phenol was also formed at pH-
values below 4 it can be conceived that the acidic pH-optimum is due to nitrite
contamination as shown in Fig.13. Unexpected was the high amount of 4-nitroso-
phenol, contrary to previous observations [5, 128], formed between pH 7 and 12
with a maximum at pH 9-10 (Fig.20). Since in this range the disproportionation
takes place it could be postulated that nitrosating species must be involved in
this reaction. Although hardly visible at the scale of Fig.20 distinct amounts of
2- and 4-nitrophenol are also formed under alkaline conditions inferring nitrating

4 RESULTS 52
Figure 19: Product yield of 5 mM phe-
nol and 800 µM PN in 0.2 M K-phosphate
buffer at 310 K after 5 min (pH 1-8)
and 10 min (pH 9-12). Longer incubation
times at higher pH led to loss of nitroprod-
ucts. The maximum of 4-nitroso-phenol
was at pH 10, when incubating for 1 hour
at pH 9-12. Symbols mean: (A) (open
circles) 4-hydroxy-phenol, (open triangles)
p-benzoquinone, (solid circles) 2-hydroxy-
phenol.
Figure 20: Yield of nitration and nitro-
sation products: (solid squares) 4-nitroso-
phenol, (open squares) 4-nitro-phenol and
(solid diamonds) 2-nitro-phenol. Nitro-
products were quantified on HPLC-system
VI, hydroxy-phenols, 4-nitroso-phenol and
benzoquinone on HPLC-system I accord-
ing to the conditions mentioned in the
method section. Arrow bars indicate mean
values from three measurements.
species in the course of PN decomposition.
4.1.5 Dimerization of Phenolic Intermediates
We could confirm earlier results [128] that 4,4’- and 2,2’-biphenols are formed and
additionally 2,4’-biphenol was identified. Their maximum formation occurred
between pH 6 and 8 and between 10 and 12 with a distinct second maximum
(Fig.21).
Figure 21: Formation of biphenols from 5 mM phenol
and 800 µM PN in 0.2 M K-phosphate buffer at 310 K
after 1 min (pH 1-6), 5 min (pH 7 and 8), 10 min (pH
9), 15 min (pH 10), 20 min (pH 11) and 35 min (pH 12).
The incubation times shown are optimized for biphenol
formation. Symbols mean: (open circles) 2,2’-biphenol
[µM], (open squares) 2,4’-biphenol [relative area], (open
triangles) 4,4’-biphenol [µM]. Quantitation and identifica-
tion on HPLC-system V. Arrow bars indicate mean values
from four measurements.
When investigating the dependency of phenol nitration on substrate con-

4 RESULTS 53
centration it was noticed that a steep increase occurred up to 1.25 mM phenol
but then rather a decrease was seen at higher phenol concentrations. In the
chromatograms the dimerization products increased as depicted for 2,2’- and
2,4’-biphenol in Fig.23 using the relative area of the product peaks. The
same tendency could be observed when working in alkaline solutions, where
the 4-nitrosophenol decreased with increasing phenol concentration in favor of
dimerization products (see Fig.22).
Figure 22: Formation of nitrophenols and
2,4’-biphenol from 800 µM PN and phenol
after 5 min in 0.2 M K-phosphate buffer
pH 7 in dependency of phenol concentration.
(open squares) 2-nitro-phenol, (open circles)
2-nitro-phenol, (open triangles) 2,4’-biphenol
and (solid circles) 2,2’-biphenol. Representa-
tiv values out of two experiments.
Figure 23: Formation of biphenols
and 4-nitroso-phenol from 655 µM PN
in dependence of phenol concentration
at pH 9.
Although the quantitation of the sum of all biphenols could not be performed
exactly, because of lack of an authentic sample, it appeared that at the given pH
of 7 the biphenols compensated for the decrease in nitrophenols. In view of the
nature of possible precursors it was of interest to look also for diphenylethers as
potential dimerization products. Indeed, a compound which co-chromatographed
with 4-hydroxy-diphenylether was noticed and also co-chromatographed with the
authentic sample in a second solvent system. Another peak could be observed,
which would fit to the retention time of 2-hydroxy-diphenylether, for which how-
ever no authentic reference compound was available.
4.1.6 The Reaction of Anisol with PN
The formation of dimerization products from phenolic compounds would be
compatible with phenoxy radicals as intermediates which also would be in

4 RESULTS 54
accordance with the known one-electron oxidizing properties of PN [75, 82, 89].
Blocking of the phenolic hydroxyl group by methylation would prevent this
one-electron oxidation but still would allow hydroxyl radical addition reactions
to the aromatic ring. We therefore set up an analytical system for anisol
nitration and hydroxylation products. 10 % acetonitrile as a solvent provided
comparable conditions for phenol and anisol reactions with PN. In a test system
with nitronium tetrafluoroborate as a known nitrating agent similar nitration
yields were observed (44 and 45 µM 4- and 2-nitro-phenol and 12 and 36 µM
4- and 2-nitro-anisol). When using 800 µM PN at pH 4 anisol was converted
to about 40 µM 2-hydroxy-anisol and 17 µM 4-hydroxy-anisol (see Fig.24).
However, the corresponding nitration products were only about 1 % of the
hydroxylated products (0.27 µM 2-nitro- and 0.11 µM 4-nitro-anisol). Further
comparisons between phenol and anisol were performed with ·NO and ·NO2 as
reactive species. With ·NO only phenol gave the 4-nitroso-phenol derivative
(0.67 µM) and smaller amounts of nitro-phenols (0.2 µM). Also with ·NO2 only
phenol formed nitro-phenols (7 µM) but no nitration of anisol could be detected
(see Fig.25). However, it seemed that a strong 1e-oxidant such as Ce(IV) was
reactive enough to abstract an electron from the anisol-ring. This species then
could be nitrated by nitrogen dioxide.)
Figure 24: Formation of hydroxy- and
nitro-anisols from 800 µM PN and 5
mM anisol.
Figure 25: Nitroproducts from reactions of 5
mM phenol or anisol with 163 µM nitric oxide
or 4.5 mM nitrogen dioxide. Effect of 1 mM
Ce(IV) on anisol nitration by 800 µM PN at
pH 6.
4.1.7 Nitrosylation of Phenol and Anisol
As shown in Fig.20 the yield of 4-nitroso-phenol in the reaction of phenol with
PN is quite high in the alkaline pH-range. 2-nitroso-phenol is known to be

4 RESULTS 55
unstable under these conditions and probably undergoes rearrangement of the
NO-group, forming an O-nitroso-phenol. This nitrito-aryl is a nitrous acid ester
and therefore should easily hydrolyze yielding nitrite and phenol.The maximum
of nitrosylation (pH 9-10) went hand in hand with maxima of oxygen release and
nitrite formation at this pH (see Fig.14,16). The nitrosylation itself showed a
linear dependence on PN-concentration as shown in Fig.27. Azide, a well known
N2O3 scavenger decreased the yield of 4-nitroso-phenol (Fig.26).
Figure 26: Inhibition of 4-nitroso-phenol for-
mation from 5 mM phenol and 310 µM PN by
5 mM azide. Measured by the absorbance of
4-nitroso-phenol at 395 nm.
Figure 27: Dependence of 4-nitroso-
phenol yield on PN-concentration.
The nitrosylation of anisol could not be investigated because no nitroso-
standards were available. But we could observe several products in reaction
mixtures of anisol with nitrosonium tetrafluoroborate and also with PN. These
products were no nitro-products, but had similar absorbancies in the correspond-
ing wavelength region (not shown). So it is not possible to exclude the formation
of nitroso-products from reactions of anisol with PN.
4.1.8 Tyrosine Nitration by Bolus-added and Simultaneously Gener-
ated PN
In this chapter we reinvestigated the findings of Pfeiffer et al [22]. In this
publication it had been reported that simultaneously generated PN was not able
to nitrate tyrosine. Fig.28 shows the PN-concentration-dependent formation
of 3-nitro-tyrosine from 1 mM tyrosine. We see a linear relationship between
3-NT formation and PN-concentration. Indeed at low fluxes of PN 3-NT was
not detectable anymore, but the 3,3’-dityrosine peak increased, see Fig.29.
Neither 2 mM spermine NONOate nor 2 mM spermine NONOate coupled
with 28 or 56 mU/ml XO and 1 mM xanthine formed more than 500 nM
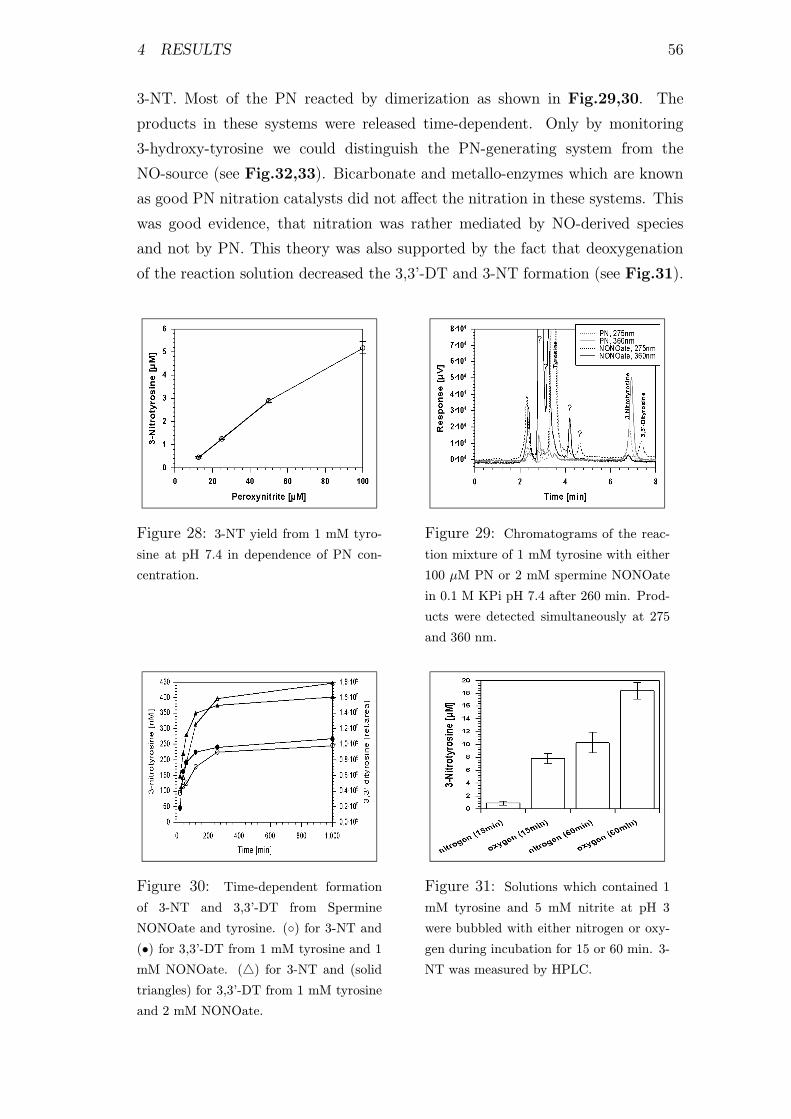
4 RESULTS 56
3-NT. Most of the PN reacted by dimerization as shown in Fig.29,30. The
products in these systems were released time-dependent. Only by monitoring
3-hydroxy-tyrosine we could distinguish the PN-generating system from the
NO-source (see Fig.32,33). Bicarbonate and metallo-enzymes which are known
as good PN nitration catalysts did not affect the nitration in these systems. This
was good evidence, that nitration was rather mediated by NO-derived species
and not by PN. This theory was also supported by the fact that deoxygenation
of the reaction solution decreased the 3,3’-DT and 3-NT formation (see Fig.31).
Figure 28: 3-NT yield from 1 mM tyro-
sine at pH 7.4 in dependence of PN con-
centration.
Figure 29: Chromatograms of the reac-
tion mixture of 1 mM tyrosine with either
100 µM PN or 2 mM spermine NONOate
in 0.1 M KPi pH 7.4 after 260 min. Prod-
ucts were detected simultaneously at 275
and 360 nm.
Figure 30: Time-dependent formation
of 3-NT and 3,3’-DT from Spermine
NONOate and tyrosine. (◦) for 3-NT and
(•) for 3,3’-DT from 1 mM tyrosine and 1
mM NONOate. (�) for 3-NT and (solid
triangles) for 3,3’-DT from 1 mM tyrosine
and 2 mM NONOate.
Figure 31: Solutions which contained 1
mM tyrosine and 5 mM nitrite at pH 3
were bubbled with either nitrogen or oxy-
gen during incubation for 15 or 60 min. 3-
NT was measured by HPLC.

4 RESULTS 57
Figure 32: Chromatogram of the reac-
tion mixture of tyrosine and either PN or
XO/NONOate. This HPLC system was
optimized for detection of 3-HT.
Figure 33: 3-HT yields from reac-
tions of tyrosine with PN, XO/NONOate,
NONOate or XO. 3-HT as a probe for PN,
NO and in situ generated PN reactivity.
4.2 Scavengers for Peroxynitrite
4.2.1 Short Introduction
4.2.1.1 Searching for scavengers of PN requires understanding the
nature of PN-reactions In the PN literature all reactions involving homolytic
OO-bond cleavage have summarized as ”1e-oxidations” in contrast to a few
reactions that transfer one oxygen atom from PN and therefore have been termed
”2e-oxidations” [74, 75, 75, 86]. The formation of ebselen-oxide from ebselen or
the sulfoxide from methionine are examples for this type which can originate
from the PN anion as evidenced from the pH-dependency of such oxidations. To
complicate the reaction pattern of PN further the PN anion can behave as a
nucleophile and form adducts e.g. with carbonyls. The peroxo compound arising
from carbon dioxide is a well-studied example [6, 140].
In view of the plethora of oxidations by PN it is evident that no typical
inhibitor or scavenger will be identified but only mechanism-based subtypes
can be found. In the present study phenol will be used as substrate since our
previous investigations have revealed that the ”1e-oxidation” pathway leads to a
phenoxy-radical to which an ·NO2 radical can add to form 2- and 4-nitro-phenol
[6, 130]. By measuring this parameter, which also closely mimicks the nitration
of tyrosine in PGIS, we attempted to define a basis for PN scavengers.
The aim of the present study was to reinvestigate a series of organic com-
pounds as inhibitors of PN with special emphasis on biologically occurring sub-
stances as lead structures. Among them would be compounds such as ascorbate

4 RESULTS 58
or tocopherols, but also oxo derivatives since carbon dioxide is known to form
an addition product with the PN anion [142]. Our main interest, however, was
focused on uric acid which had been described as an especially good scavenger
for PN [4, 131, 228, 230] and hydroxyl radicals [229].
4.2.1.2 The test systems As a test system we employed the hydroxylation
and nitration of phenol [62, 85], which not only allowed to monitor the formation
of the radical pair but also could serve as a model for tyrosine nitration in proteins.
The analytics and the mechanisms involved were recently published by us [130]
and had been extended to the involvement of heme catalysis [163]. Another aim
of this study was to distinguish between scavengers that mainly react with the
protonated form of PN and those that show high reactivity for the PN-anion. For
this reason we used as a second test system an enzymatic one based on ADH-
activity. For ADH Beckman and coworkers have reported a k-value of 4x10⁵
M−1s−1 for the reaction with PN-anion [94]. Therefore this enzyme seemed to
be a perfect model to monitor scavenging ability and protective effects of the
employed antioxidants. Furthermore decomposition kinetics of PN at alkaline
pH should show if a compound was able to react directly with PN-anion or if
it required the protonated form or one of the decomposition intermediates for
the reaction. We here present data on reactivity of PN-scavengers in different
systems.
4.2.2 Inhibitors for the Nitration of Phenol by Peroxynitrite
Nitration of phenol by PN has been reported to involve phenoxy radicals [6, 130]
and therefore can be considered as two one-electron oxidation steps mediated
by peroxynitrous acid (ONOOH), or more precisely the radical cage form of
decaying PN [72, 71]. Fig.34 shows the formation of nitro-phenols in the PN-
phenol system at pH 6 in dependence of the concentration of some representative
PN-scavengers. It is obvious, that two major groups of inhibitors for phenol
nitration exist: The first one shows an exponential dependence (uric acids,
dithio-purine and -pyrimidine), the second one a more linear dependence (thiols,
ebselen, methionine, tyrosine and ascorbate) from scavenger concentration. This
behavior is directly linked to the reactivity towards ONOOH or ONOO− as will
be shown later.
Tab.7 shows the IC50-values of some natural antioxidants and synthetic
compounds. It turned out, that among the best inhibitors of phenol nitration
at pH 6 or scavengers for the radical cage form of PN are uric acid and its

4 RESULTS 59
Figure 34: Effect of scavengers on phe-
nol nitration by PN in dependence of their
concentration. The IC50-values were deter-
mined from these curves. Furthermore this
graphic allowed to separate the scavengers
into two major groups (linear and expo-
nential dependence on concentration).
1.3- and 3.7-dimethyl analogues (DMUA), as well as 2-TBA, 2.6-DTPy and
2.6-DTPu, followed by cysteine, ascorbate, ebselen, 3.9-DMUA and GSH (left
values). Se-met and methionine itself showed very poor protection in this
system, whereas xanthine, allopurinol, caffeine, allantoin and alloxan, which are
all structurally related to uric acid showed only poor protection (see Tab.8).
Exactly the same observations were made during phenol nitration at pH 7 (not
shown). Very low IC50-values have been reported for TEMPO/TEMPONE
in phenol nitration reactions [106]. Therefore we also used this compound in
our system and found IC50-values of less than 2 µM for the nitration of 5 mM
phenol by 800 µM PN (not shown). Additionally we found increased levels of
4-nitroso-phenol, when using TEMPO/TEMPONE, supporting the mechanism
previously postulated for this reaction [106]. The results in the phenol system
could be reproduced in a test system, where the same scavengers were employed
to prevent BSA from nitration by PN (see Tab.9)[231].
Cysteine 64±14 / 425±125 Glutathione 181±20 / 380±57Methionine 450±34 / 690±75 Se-methionine 250±13 / 170±28Ascorbate 88±18 / 133±18 Uric acid 40±10 / 57±82-TBA 37±6 / 26±4 2.6-DTPu 35±13 / 36±142.6-DTPy 32±4 / 43.5±9.5 1.3-DMUA 36.5±1.5 / 25±123.7-DMUA 19±3 / - 3.9-DMUA 141±7 / -
Ebselen 127.5±4.5 / 190±11 Xanthine > 1 mM / > 1 mM
Allopurinol > 1 mM / > 1 mM Caffeine > 1 mM / -
Allantoin > 1 mM / - Alloxan > 1 mM / -
Table 7: IC50-values [µM] of scavengers for phenol nitration at pH 6 or nitrosylation at pH 9
by peroxynitrite. First value for nitration (pH6), second value for nitrosylation (pH9). Mean-
values of two independent series with at least four concentrations. 5mM phenol were reacted
with 655 µM PN at pH 6 and 400 µM PN at pH 9.
At pH 9 the nitrosylation of phenol by PN was monitored and the effects of

4 RESULTS 60
Inhibitor [1 mM] % Nitration (pH6) % Nitrosation (pH9)
Adenosine 100 80
Caffeine 68 85
Guanosine-5’-P 90 82
Alloxan 100 90
Xanthine 76 97
Allantoine 100 78
Hypoxanthine 100 88
GSSG 89 52
Allopurinol 98 91
D-mannitol 100 88
Table 8: Compounds with poor reactivity towards PN. Effect of 1 mM compound on nitration
of 5 mM phenol by 655 µM PN at pH 6 and on nitrosation of 5 mM phenol by 400 µM PN.
Values are the remaining percentage of nitration or nitrosation compared to the control without
added compound.
Glutathione 150±26 Methionine 200±38Ascorbate 170±17 Uric acid 75±132-TBA 45±12 1.3-DMUA 60±143.7-DMUA 185±37 3.9-DMUA > 200
Ebselen 180±12 Xanthine > 500
Allopurinol > 500
Table 9: IC50-values [µM] for the inhibition of BSA nitration at pH 7 by peroxynitrite. Mean
values of two independent series with at least four concentrations. Reaction of 15 µM BSA with
1 mM PN. TBA, thiobarbituric acid; DMUA, dimethyluric acid.
the same scavengers as used above. These results are also shown in Tab.7 (right
values) and once more the uric acids and the thio-purines and -pyrimidines
were best in preventing phenol from nitrosylation, suggesting that also this
process involves radical species (also in the alkaline pH range high amounts
of biphenols are formed, implicating the involvement of phenoxy radicals, see
herefore Fig.23), for which the same group of scavengers is most effective.
In another experiment we used constant concentrations of PN, phenol and
scavengers, but additionally measured the hydroxylation of phenol by PN
(see Fig.35) and it turned out, that UA was most effective in suppressing
hydroxy-products and benzoquinone, followed by 2-mercapto-benz-selenazol,
2-thio-barbituric acid and 2-mercapto-benz-thiazol. Ascorbate, GSH, cysteine,
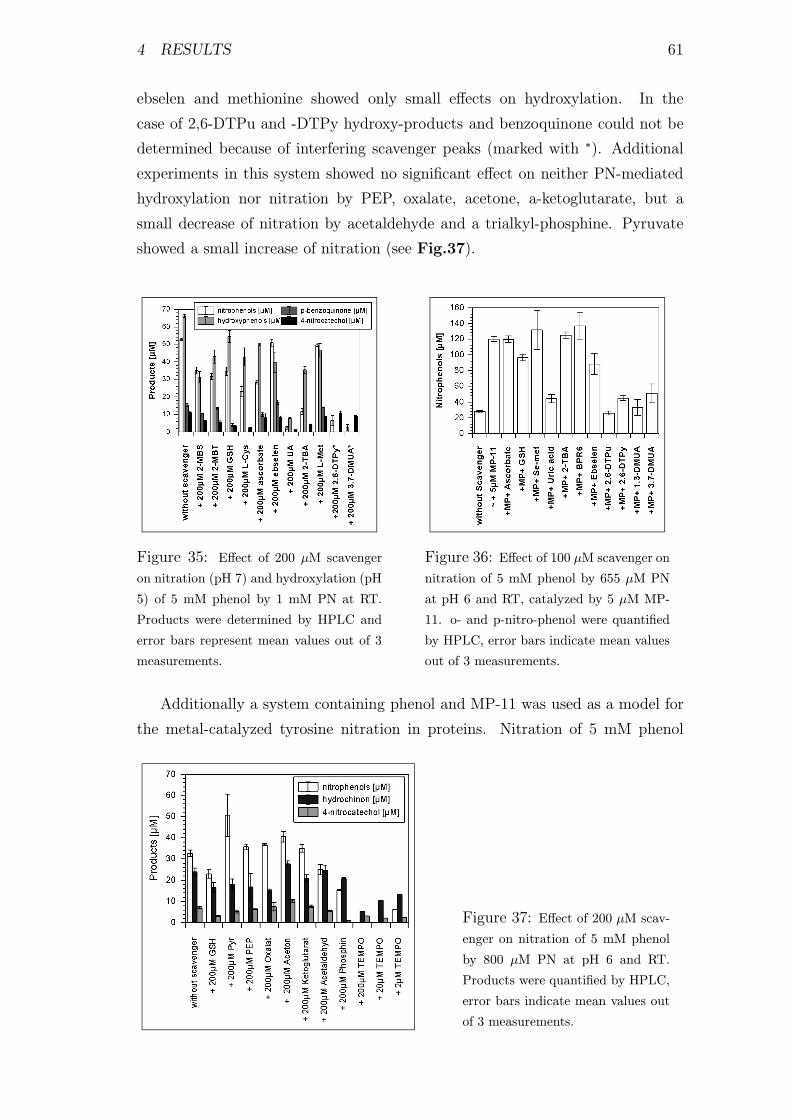
4 RESULTS 61
ebselen and methionine showed only small effects on hydroxylation. In the
case of 2,6-DTPu and -DTPy hydroxy-products and benzoquinone could not be
determined because of interfering scavenger peaks (marked with ∗). Additional
experiments in this system showed no significant effect on neither PN-mediated
hydroxylation nor nitration by PEP, oxalate, acetone, a-ketoglutarate, but a
small decrease of nitration by acetaldehyde and a trialkyl-phosphine. Pyruvate
showed a small increase of nitration (see Fig.37).
Figure 35: Effect of 200 µM scavenger
on nitration (pH 7) and hydroxylation (pH
5) of 5 mM phenol by 1 mM PN at RT.
Products were determined by HPLC and
error bars represent mean values out of 3
measurements.
Figure 36: Effect of 100 µM scavenger on
nitration of 5 mM phenol by 655 µM PN
at pH 6 and RT, catalyzed by 5 µM MP-
11. o- and p-nitro-phenol were quantified
by HPLC, error bars indicate mean values
out of 3 measurements.
Additionally a system containing phenol and MP-11 was used as a model for
the metal-catalyzed tyrosine nitration in proteins. Nitration of 5 mM phenol
Figure 37: Effect of 200 µM scav-
enger on nitration of 5 mM phenol
by 800 µM PN at pH 6 and RT.
Products were quantified by HPLC,
error bars indicate mean values out
of 3 measurements.

4 RESULTS 62
by 655 µM PN at pH 6 is increased by a factor of 4-5 by 5 µM MP-11. The
same scavengers as tested above were employed in this system and it turned
out that also in the metal-catalyzed nitration UA, 1.3-DMUA, 2.6-DTPu and
-DTPy were much more effective in preventing phenol from nitration than were
GSH, ascorbate, ebselen, methionine and Se-met (see Fig.36). 2-TBA showed
an unusually small effect in this system.
4.2.3 Inhibitors for the Oxidation and Inactivation of ADH by PN
Our second test system used the oxidation of ADH as a probe for PN-anion
reactivity. The protecting effect of the employed scavengers on ADH-activity
could be directly correlated with the reactivity of the scavenger towards the
PN-anion. Beckman et al [94] reported about a sensitive thiol-oxidation and
ADH-inactivation by low concentrations of PN. We could confirm these findings
in our system (see Fig.38). The IC50-value for PN was at 1-2 µM, for ·NO alone(from diethyl NONOate) in air-saturated solution it was five magnitudes higher,
in deoxygenated solutions by a factor of 10 (see Fig.39). Fig.10 shows the
effects of PN-scavengers in this system and it turned out, that uric acids, tyrosine
and tryptophan were uneffective in protecting 26 nM ADH from inactivation
by 20 µM PN, whereas GSH, cysteine, Se-met followed by methionine were
highly efficient. We made also controls to ensure that the scavengers employed
could not reactivate already inactivated ADH. 2.6-DTPy and -DTPu showed
also a protecting activity in this system, but led themselves to an inhibition of
the enzyme, when employed at higher concentrations. Therefore no complete
conservation of ADH-activity could be achieved. Ebselen, which is known
to react with thiols by forming adducts [232, 233] inhibited ADH itself at
nanomolar concentrations (not shown). Ascorbate seemed to form intermediates
with PN, that were also inhibiting the enzyme, therefore only a maximum of 60
% conserved ADH-activity could be achieved.
4.2.4 Kinetics of Reactions of Scavengers with PN
To determine whether a scavenger reacts with the PN-anion or not we followed
the decay of PN at 302 nm at pH 8 and 9 in absence and presence of various scav-
engers. In some special cases the wavelength for monitoring was optimized, e.g.
for ebselen the formation of ebselenoxide was followed at 275 nm and for UA the
decrease of UA itself together with PN was observed at 280 nm. Ebselen acceler-
ated the decay of PN equally over the pH-range from 8-12, giving clear evidence
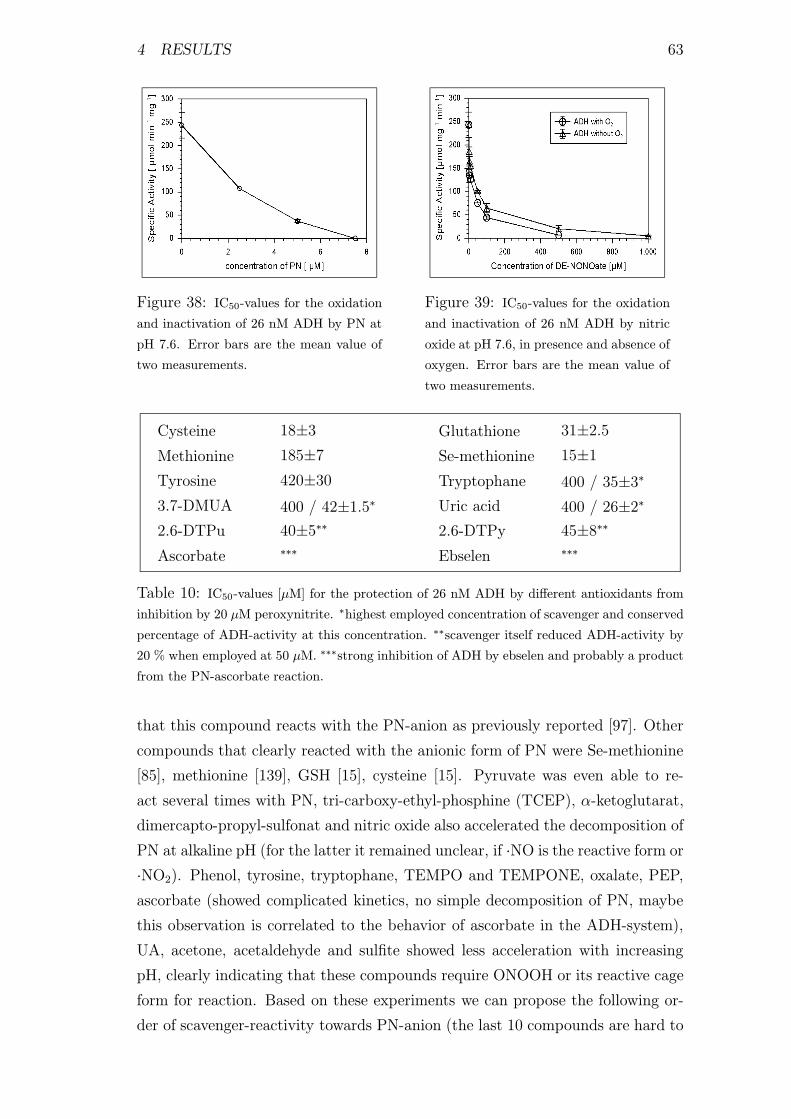
4 RESULTS 63
Figure 38: IC50-values for the oxidation
and inactivation of 26 nM ADH by PN at
pH 7.6. Error bars are the mean value of
two measurements.
Figure 39: IC50-values for the oxidation
and inactivation of 26 nM ADH by nitric
oxide at pH 7.6, in presence and absence of
oxygen. Error bars are the mean value of
two measurements.
Cysteine 18±3 Glutathione 31±2.5Methionine 185±7 Se-methionine 15±1Tyrosine 420±30 Tryptophane 400 / 35±3∗3.7-DMUA 400 / 42±1.5∗ Uric acid 400 / 26±2∗2.6-DTPu 40±5∗∗ 2.6-DTPy 45±8∗∗Ascorbate ∗∗∗ Ebselen ∗∗∗
Table 10: IC50-values [µM] for the protection of 26 nM ADH by different antioxidants from
inhibition by 20 µM peroxynitrite. ∗highest employed concentration of scavenger and conserved
percentage of ADH-activity at this concentration. ∗∗scavenger itself reduced ADH-activity by
20 % when employed at 50 µM. ∗∗∗strong inhibition of ADH by ebselen and probably a product
from the PN-ascorbate reaction.
that this compound reacts with the PN-anion as previously reported [97]. Other
compounds that clearly reacted with the anionic form of PN were Se-methionine
[85], methionine [139], GSH [15], cysteine [15]. Pyruvate was even able to re-
act several times with PN, tri-carboxy-ethyl-phosphine (TCEP), α-ketoglutarat,
dimercapto-propyl-sulfonat and nitric oxide also accelerated the decomposition of
PN at alkaline pH (for the latter it remained unclear, if ·NO is the reactive form or·NO2). Phenol, tyrosine, tryptophane, TEMPO and TEMPONE, oxalate, PEP,
ascorbate (showed complicated kinetics, no simple decomposition of PN, maybe
this observation is correlated to the behavior of ascorbate in the ADH-system),
UA, acetone, acetaldehyde and sulfite showed less acceleration with increasing
pH, clearly indicating that these compounds require ONOOH or its reactive cage
form for reaction. Based on these experiments we can propose the following or-
der of scavenger-reactivity towards PN-anion (the last 10 compounds are hard to

4 RESULTS 64
distinguish by the measured kinetics):
Ebselen > phosphine > GSH ≥ cysteine ≥ Se-methionine >
DTT ≥ Pyruvate ≥ Methionine ≥ DMPS > α-ketoglutarate
> ascorbate > acetaldehyde > PEP ≡ acetone ≡ oxalate >
phenol ≡ tyrosine ≥ tryptophane ≡ TEMPO/TEMPONE ≡Uric acid ≥ sulfite
Figure 40: Kinetics of PN-decomposition in dependence of pH and scavengers. (A) De-
composition of 1 mM PN and 250 µM UA in 0.2 M KPi at pH 7 (1), 8 (2), 9 (3) and 10
(4). (B) Formation of ebselenoxide from 400 µM ebselen and 500 µM PN in 0.2 M KPi at
pH 8 (1), 10 (2) and 12 (3). (C) Decay of 500 µM PN in presence of keto- and aldehyde-
compounds (500 µM, except pyruvate which was 750 µM). (D) Decay of 250 µM PN in
presence of sulfur compounds (500 µM, except DTT and TEMPONE which were 250 µM
and sulfite was 2.5 mM).
4.2.5 Reaction of Uric Acid with PN
For better understanding, why UA was much more efficient as a PN-scavenger
than for example xanthine, caffeine or allopurinol, we tried to identify all stable
products of the reaction of UA with PN in the pH-range from 6-9. Fig.41 shows
the representative chromatograms of the reaction of UA with PN at pH 6, 7,
8 and 9. At pH 6 the reaction yielded three peaks (tR=8.6, 9.5 and 11 min)
eluting before UA (tR=15-16.5 min). At pH 9 the peak at 11 min increased and

4 RESULTS 65
additional peaks at tR= 12 and 17 min appeared, supporting the different action
of PN at neutral and alkaline pH. The slight shifts in retention time are due to
the pH of the injected reaction solutions into the mobile phase. The UV/Vis
spectra of the peaks showed no significant absorbance above 300 nm as reported
elsewhere for a product from the UA-PN reaction [131], even no significant band
above 250 nm except uric acid itself. The reaction of 1.3-DMUA and PN showed
a comparable product pattern in a different HPLC-system (see also Fig.42).
Figure 41: HPLC-chromatograms of the reaction of 0.5 mM uric acid with 1.3 mM PN
in 0.2 M K-phosphate buffer (A) pH 6 (1 min), (B) pH 7 (1 min), (C) pH 8 (5 min) and
(D) pH 9 (10 min). The broken lines were incubated 1 h longer. Conditions as mentioned
in materials and methods.
Peaks from the reaction of 1.3-DMUA and PN were collected for further
identification by 1H- and 13C-NMR and EI-MS ([234] contained reference
signals). These investigations only yielded poor results due to the instability
of the products. 1.3-DMUA was chosen for better monitoring of ring opening
and abstraction of urea from the UA-ring system. Indeed some of the product
peaks had lost one or even two methyl groups, but it could not be determined
if this was already mediated by PN or was due to a slower degradation process.
UA has been also reported to undergo oxidation to allantoin and oxonic acid
in alkaline solutions [208]. 13C-NMR of freshly prepared UA-PN reaction
solutions indicated a lack of allantoin, oxonic acid, cyanuric acid, diimine,
parabanic acid, alloxanthin and alloxan in the product pattern of this reaction,
although these products have been reported for other oxidation reactions of UA

4 RESULTS 66
[206, 207, 208, 235]. Allantoin would have been also visible as a shoulder in the
salt peak of the chromatograms. Furthermore we have tested the content of
allantoin, as well as allantoic acid by the method described elsewhere [208]. What
we found were distinct amounts of urea, determined as previously described
[209]. From 1 mM PN and 0.5 mM uric acid 345±78 µM urea are formed
at pH 7.4 (determined colorimetrically by the NH3-pH-shift after enzymatic
degradation of urea by urease).Uricase had no effect on the peaks above except
UA itself, suggesting that none of these products has a structure similar to UA.
We cannot present any structural proposal for the UA-PN products, but only
the product pattern on HPLC and the finding, that the products formed from
reactions of PN with UA undergoe further degradation. All possible oxidation
products were commercially available and also tested on the HPLC-system from
Fig.41 and could be excluded: Allantoin, allantoic acid, oxonic acid, alloxan,
alloxanthine and cyanuric acid.
Figure 42: HPLC-chromatogram of the
reaction of 2 mM 1.3-dimethyl-uric acid
and 8 mM PN at pH 7. Peak 1, 2, 3, 4 were
isolated and investigated by NMR and MS.
Conditions as described in materials and
methods.
4.2.6 Reactions of Ebselen with Peroxynitrite
4.2.6.1 Short introduction Ebselen is known for its very fast reaction with
PN-anion [97]. Therefore it seemed to be one of the best candidates to protect
PGIS from inactivation by PN, but no protective effect could be observed when
bovine aortic microsomes or bovine aortic rings were preincubated with ebselen in
a 10-50 fold excess with respect to PN concentration. Since ebselen already reacts
with ONOO− with a second order rate constant of 2x10⁶ M−1s−1 [97], the enzyme
would have to react with 107-108 M−1s−1. This requires an almost diffusion
controled reaction, regarding the low concentration of PGIS in bovine aortic
microsomes. However evidence for a a very fast reaction of PN with PGIS was
based on competitive kinetics with several PN-scavengers (e.g. GSH, ascorbate
and trolox) [12]. For this reason we developed a test to see what was happening
to ebselen in tissue or at membranes.
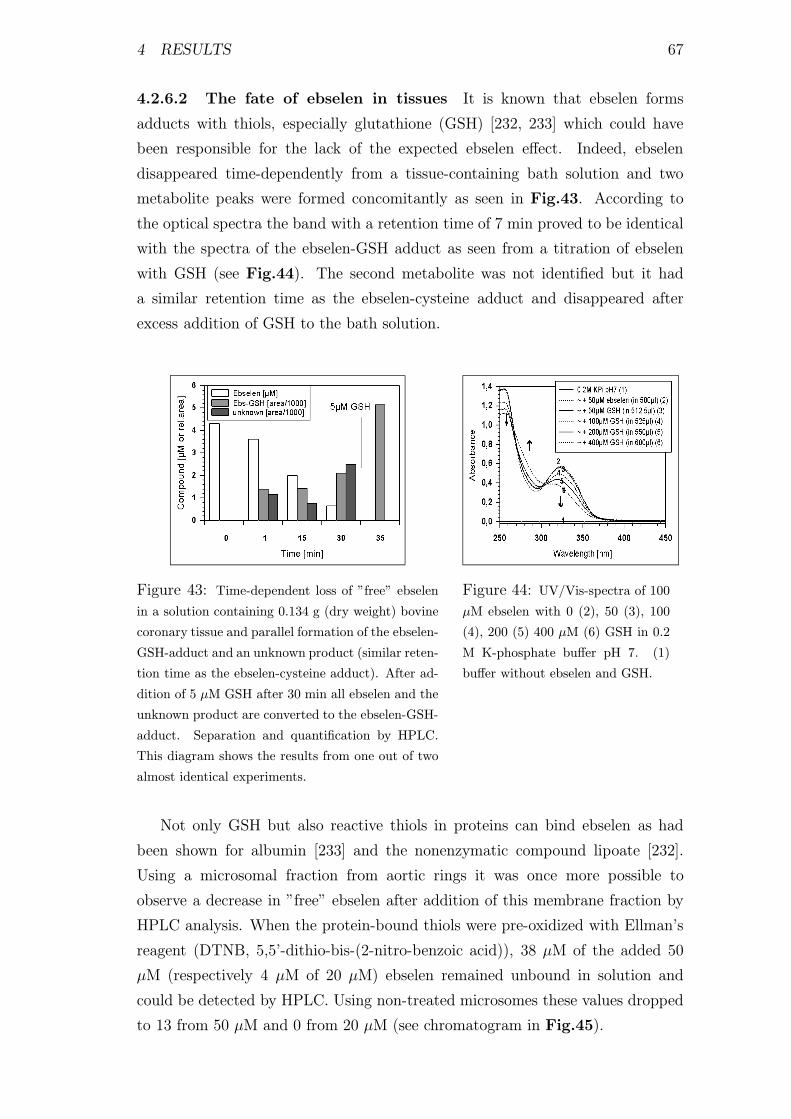
4 RESULTS 67
4.2.6.2 The fate of ebselen in tissues It is known that ebselen forms
adducts with thiols, especially glutathione (GSH) [232, 233] which could have
been responsible for the lack of the expected ebselen effect. Indeed, ebselen
disappeared time-dependently from a tissue-containing bath solution and two
metabolite peaks were formed concomitantly as seen in Fig.43. According to
the optical spectra the band with a retention time of 7 min proved to be identical
with the spectra of the ebselen-GSH adduct as seen from a titration of ebselen
with GSH (see Fig.44). The second metabolite was not identified but it had
a similar retention time as the ebselen-cysteine adduct and disappeared after
excess addition of GSH to the bath solution.
Figure 43: Time-dependent loss of ”free” ebselen
in a solution containing 0.134 g (dry weight) bovine
coronary tissue and parallel formation of the ebselen-
GSH-adduct and an unknown product (similar reten-
tion time as the ebselen-cysteine adduct). After ad-
dition of 5 µM GSH after 30 min all ebselen and the
unknown product are converted to the ebselen-GSH-
adduct. Separation and quantification by HPLC.
This diagram shows the results from one out of two
almost identical experiments.
Figure 44: UV/Vis-spectra of 100
µM ebselen with 0 (2), 50 (3), 100
(4), 200 (5) 400 µM (6) GSH in 0.2
M K-phosphate buffer pH 7. (1)
buffer without ebselen and GSH.
Not only GSH but also reactive thiols in proteins can bind ebselen as had
been shown for albumin [233] and the nonenzymatic compound lipoate [232].
Using a microsomal fraction from aortic rings it was once more possible to
observe a decrease in ”free” ebselen after addition of this membrane fraction by
HPLC analysis. When the protein-bound thiols were pre-oxidized with Ellman’s
reagent (DTNB, 5,5’-dithio-bis-(2-nitro-benzoic acid)), 38 µM of the added 50
µM (respectively 4 µM of 20 µM) ebselen remained unbound in solution and
could be detected by HPLC. Using non-treated microsomes these values dropped
to 13 from 50 µM and 0 from 20 µM (see chromatogram in Fig.45).
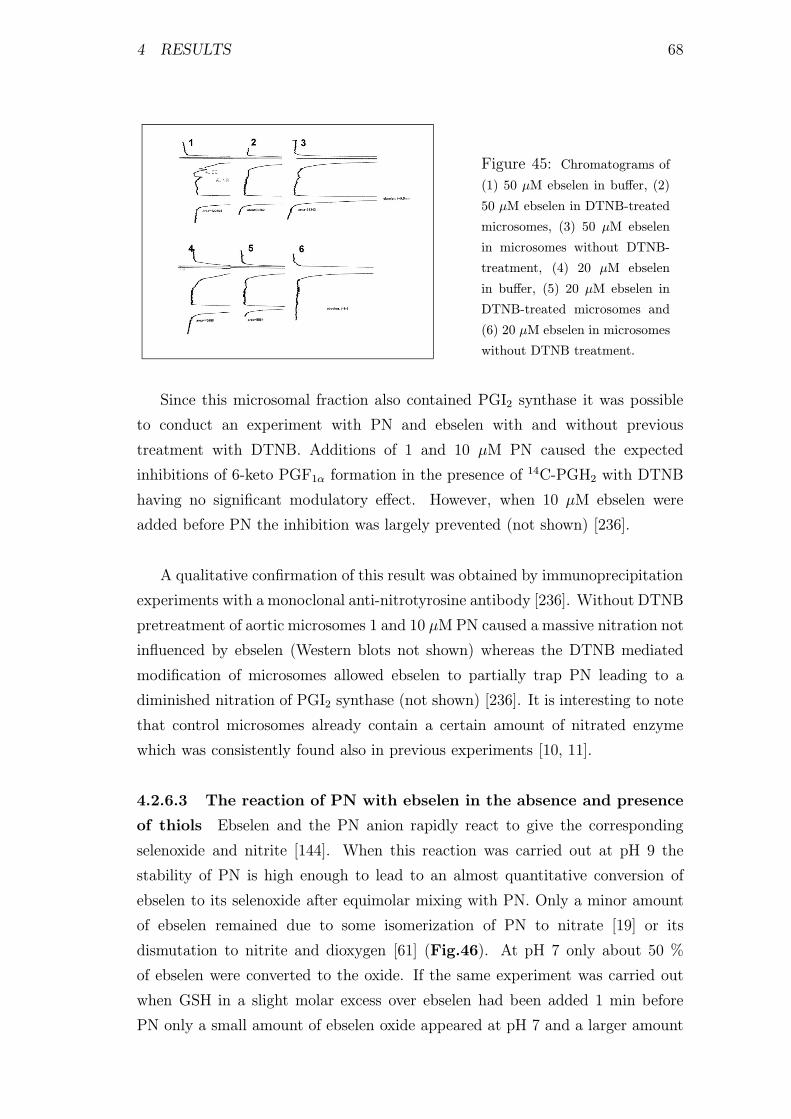
4 RESULTS 68
Figure 45: Chromatograms of
(1) 50 µM ebselen in buffer, (2)
50 µM ebselen in DTNB-treated
microsomes, (3) 50 µM ebselen
in microsomes without DTNB-
treatment, (4) 20 µM ebselen
in buffer, (5) 20 µM ebselen in
DTNB-treated microsomes and
(6) 20 µM ebselen in microsomes
without DTNB treatment.
Since this microsomal fraction also contained PGI2 synthase it was possible
to conduct an experiment with PN and ebselen with and without previous
treatment with DTNB. Additions of 1 and 10 µM PN caused the expected
inhibitions of 6-keto PGF1α formation in the presence of14C-PGH2 with DTNB
having no significant modulatory effect. However, when 10 µM ebselen were
added before PN the inhibition was largely prevented (not shown) [236].
A qualitative confirmation of this result was obtained by immunoprecipitation
experiments with a monoclonal anti-nitrotyrosine antibody [236]. Without DTNB
pretreatment of aortic microsomes 1 and 10 µMPN caused a massive nitration not
influenced by ebselen (Western blots not shown) whereas the DTNB mediated
modification of microsomes allowed ebselen to partially trap PN leading to a
diminished nitration of PGI2 synthase (not shown) [236]. It is interesting to note
that control microsomes already contain a certain amount of nitrated enzyme
which was consistently found also in previous experiments [10, 11].
4.2.6.3 The reaction of PN with ebselen in the absence and presence
of thiols Ebselen and the PN anion rapidly react to give the corresponding
selenoxide and nitrite [144]. When this reaction was carried out at pH 9 the
stability of PN is high enough to lead to an almost quantitative conversion of
ebselen to its selenoxide after equimolar mixing with PN. Only a minor amount
of ebselen remained due to some isomerization of PN to nitrate [19] or its
dismutation to nitrite and dioxygen [61] (Fig.46). At pH 7 only about 50 %
of ebselen were converted to the oxide. If the same experiment was carried out
when GSH in a slight molar excess over ebselen had been added 1 min before
PN only a small amount of ebselen oxide appeared at pH 7 and a larger amount

4 RESULTS 69
at pH 9 (Fig.46).
Figure 46: Chromatograms of the reaction
mixtures of (1) 500 µM ebselen and 500 µM
PN at pH 7, (2) 500 µM ebselen and 500 µM
PN at pH 9, (3) 500 µM ebselen, 500 µM GSH
and 500 µM PN at pH 7, (4) 500 µM ebselen,
500 µM GSH and 500 µM PN at pH 9. Eb-
selen peak, tR=16 min, ebselen-GSH-adduct,
tR=6.6 min and ebselenoxide, tR=4.5 min.
The peak of the ebselen-GSH adduct formed under these conditions suggested
that this adduct does not undergo a rapid reaction with PN to its corresponding
selenoxide. At pH 9 a small peak with a lower retention time as the ebselen-GSH
adduct could be consistent with such a selenoxide confirming the better stability
of PN at pH 9 which allowed to form this product at pH 9 but not at pH 7.
Such results point to a slower reaction of PN with the ebselen-GSH adduct
than with ebselen itself. Direct kinetic measurements are difficult to perform
since the absorbancies of PN and that of the adduct are in the same region
between 290 and 340 nm. However, when choosing 320/370 nm as a wavelength
pair and pH 10 when the stability of PN is high enough one can observe kinetics
of PN decomposition with ebselen (Fig.47 and 48). At the same wavelength
pair a preincubated equimolar mixture of ebselen and GSH decomposes PN with
slower kinetics although the maximum absorbance change is somewhat larger
(Fig.47).
This is at least a qualitative confirmation of the slower reaction of the adduct.
As a control a secondary addition of PN resulted only in a minor change due
to the absorbance of PN at 302 nm [57]. A corresponding experiment could
be performed with the ebselen-albumin adduct (Fig.48). Additions of 20 and
40 µM albumin to 100 µM ebselen at pH 10 slowed down the kinetics of the
ebselen reaction. Again a second addition of PN did not change the absorbance
difference significantly proving that in the initial reaction the disappearance of
the adduct through oxidation by PN had been monitored.
A weaker scavinging effect of the ebselen-GSH adduct than with GSH alone
could also be observed during the nitration of 5 mM phenol by 650 µM PN. The

4 RESULTS 70
Figure 47: Kinetics of the decomposi-
tion of peroxynitrite and disappearance of
ebselen. The system consisted of (1) 400
µM ebselen and 500 µM PN in 0.2 M K-
phosphate buffer at pH 10, (2) second ad-
dition of 500 µM PN to the reaction solu-
tion of (1), (3) 400 µM ebselen and 200 µM
GSH and 500 µM PN and (4) second addi-
tion of 500 µM PN to the reaction solution
of (3).
Figure 48: Kinetics of the decomposi-
tion of peroxynitrite and disappearance of
ebselen. The system consisted of (1) 100
µM ebselen and 100 µM PN in 0.2 M K-
phosphate buffer at pH 10, (2) second addi-
tion of 100 µM PN to the reaction solution
of (1), (3) 100 µM ebselen and 20 µM BSA
and 100 µM PN and (4) 100 µM ebselen
and 40 µM BSA and 100 µM PN.
corresponding hydroxylated and nitrated phenol metabolites were separated by
HPLC as described [130]. In this system 100 µM ebselen caused 21±2 % inhi-
bition, 100 µM GSH gave 88±1 %, and the combination of 100 µM ebselen/100
µM GSH yielded only 83±3 % inhibition (mean values of five measurements).
With tyrosine the corresponding differences were even more distinct (see Fig.49).
Figure 49: Effect of ebselen, GSH and ebselen-GSH-adduct on tyrosine nitration by PN.
4.2.6.4 Why is ebselen a good scavenger for PN-anion? Ebselen shows
an outstanding reactivity towards the PN-anion with a ksec=2x10⁶ M−1s−1 [97].

4 RESULTS 71
Also Se-methionine reacts with PN-anion, but some magnitudes slower with a
ksec=2x10² M−1s−1 [85]. Regarding this difference, the high reactivity of ebselen
towards ONOO− cannot be only due to the selenium atom. Another reason could
be a special ring-tension in the selenazolon ring of ebselen, which is decreased
by formation of the ebselenoxide. To test this we used two related compounds:
2-mercapto-benz-selenazole (2-MBS) and 2-mercapto-benzo-thiazole (2-MBT),
which were also tested as scavengers in the phenol system (see Fig.35), where
the selenium compound provided better protection. Reaction of 2-MBS with
PN at pH 7.6 could be confirmed by a change of the absorbance spectrum
after titration with PN (see Fig.50). So far 2-MBS showed a similar behav-
ior as ebselen, which also changes its absorbance when the ebselenoxide is formed.
Figure 50: Titration spectra of 100 µM
2-MBS in 0.1 M KPi pH 7.6, every trace
was recorded after addition of 10 µM PN.
Figure 51: Decomposition-kinetics of 100
µM PN in presence of 100 µM 2-MBS at
pH 7 and 9 (black lines) and absence of
2-MBS (grey lines).
The kinetics in Fig.51 proved, that 2-MBS reacts rather with the protonated
form of PN or its activated form than with the anionic form. For the kinetics the
decrease of 2-MBS absorbance at 320 nm was measured, all starting absorban-
cies are relative. PN itself absorbs only weak at this wavelength as shown by
the controls. Additional results to prove the exceptional ebselen reactivity were
obtained, when 2-MBS was treated with GSH. Contrary to the adduct formation
in the case of ebselen and GSH, no such adduct could be observed for 2-MBS.
Even after addition of a 4-fold excess of GSH the absorbance spectrum of 2-MBS
remained unchanged (not shown). Also when the absorbance at 320 nm disap-
peared after treatment with PN (see Fig.50), it could not be restored by GSH as
it was the case for ebselen (not shown). Ebselenoxide, the product from ebselen
and PN can be reduced by GSH at equimolar concentrations [144]. So the basis
for high reactivity of ebselen towards PN-anion seems to be connected to the

4 RESULTS 72
special conditions in the selenazolon ring, but these circumstances seem also to
be responsible for the high reactivity of ebselen towards thiols. With thiols, as
we and others have shown, ebselen forms adducts by ring-opening [232, 236].
4.3 Reactions of Peroxynitrite with Transition-metals
In the first part of this work we have investigated the self-decomposition of PN
and the influence of different antioxidants on this decomposition and on the PN-
mediated nitration of phenol. Here we want to present the effect of transition-
metals on the nitration of phenol by PN and its decomposition [116, 163]. Espe-
cially manganese, iron and copper-containing complexes and enzymes have been
reported to modify PN-chemistry [164, 174, 237]. Furthermore cobalt and nickel
seem to interact with PN [76]. All these metals probably form high-valence species
with PN as reported for heme-enzymes and porphyrin complexes (Compound I
and II) [50, 102, 103].
4.3.1 Effect of Metal-containing Enzymes on PN-decomposition Ki-
netics and the Nitrite:Nitrate Ratio
A simple test to measure the efficacy with which metal-complexes and -enzymes
can react with PN is based on the observation of PN-decomposition at 302
nm. Fig.52,53 show the kinetics of PN-decomposition in presence of different
metal-enzymes and complexes.
Figure 52: Kinetics of PN-decomposition
in presence of different heme- and heme-
thiolate enzymes (part I). Reaction condi-
tions as indicated in the legend box and at
10 ◦C. These traces are representative for
at least three independent measurements.
Figure 53: Kinetics of PN-decomposition
in presence of different heme- and heme-
thiolate enzymes (part I). Reaction condi-
tions as indicated in the legend box and at
37 ◦C. These traces are representative for
at least three independent measurements.
In Fig.52 P450NOR (NOR) was the best catalyst for PN-decomposition,
4 RESULTS 73
followed by coupled systems of hemoglobin (HG) or horseradish peroxidase
(HRP) with ascorbate (asc). Next was P450BM−3 wildtype followed by ascorbate
in a 100-fold excess and HG and HRP alone showed the weakest effect on
PN-decay. In Fig.53 chloroperoxidase (CPO) was more efficient than P450BM−3
wildtype (BM3-WT), followed by microperoxidase (MP-11) for which it should
be noted that it was used at a 5-fold higher concentration compared to the
other enzymes. P450CAM (CAM) showed approximately the same reactivity as
MP-11 and the P450BM−3 F87Y (BM3-Mut) variant showed the weakest effect on
PN-decomposition. The reasons for the difference between BM3-WT and -Mut
will be discussed later. Summarizing the results of the kinetic measurements we
can conclude that heme-thiolate enzymes were more efficient in catalyzing the
decomposition of PN than heme-enzymes. Hemin (ferric protoporphyrin IX) and
other manganese- and iron-containing porphyrins were less efficient compared to
the enzymes. Simple metal complexes, such as EDTA showed only effects when
employed at high concentrations (not shown).
It should be noted that the decay curves were obtained with a 30 - 150
fold excess of PN and therefore must include a turnover of the heme proteins
implying that the supposed ferryl intermediates had been rereduced to the
ferric state by PN during the turnover [50, 163]. In agreement with this
assumption it had been reported that in the HRP-phenol system or with a
manganese-porphyrin complex the absorbance decrease at 302 was enhanced in
the presence of ascorbate as a suitable reductant for the intermediate higher
oxidation states of the metals. This was also found to be true for HRP and
HG in our system Fig.54. The subsequent events in the reaction cycle could
be analyzed by the products deriving from PN during its decomposition by
the heme compounds. Such products are dioxygen, water and N2O3, but also
nitrate from the isomerization of PN. Since dioxygen formation can be followed
polarographically with an oxygen electrode the effects of MP-11 and P450NOR
on PN decomposition were investigated with this method. Fig.55 shows kinetics
of dioxygen release in presence of MP-11 and NOR. It clearly turned out that
the heme proteins enhanced the initial rates of dioxygen formation. The total
release of O2 was lower with NOR than with MP-11 or CPO at pH 9 and 10,
but higher at pH 7.5. Catalase and myeloperoxidase (MPO) showed only minor
effects (not shown), although for the latter a fast on-reaction with PN had been
reported [102].
The parameters nitrite and nitrate are more difficult to measure since the

4 RESULTS 74
Figure 54: Kinetics of PN-decomposition
in presence of different heme- and heme-
thiolate enzymes (part III). Reaction con-
ditions as indicated in the legend box and
at 10 ◦C. These traces are representative
for at least three independent measure-
ments.
PN solution already contains nitrite and nitrate and tests for nitrate are rather
insensitive. We therefore analyzed only the ratio of nitrite/nitrate at the end
of the reaction. Time dependent kinetic measurements are not meaningful
by the methods available since any remaining PN will eventually decompose
to nitrite and nitrate during the work-up procedures. As a result of an end
point determination no significant changes in the nitrite/nitrate ratio could
be observed when control assays were compared to the ones with MP-11 and
NOR with PN concentrations much larger than enzyme concentrations, but
more nitrate was found at a 1 : 5 ratio of enzyme to PN (Fig.56). With large
amounts of MP-11 the nitrite:nitrate ratio decreased in agreement with reports
in literature, where even 1 µM concentrations of iron-porphyrins caused a shift
of the nitrite:nitrate ratio by a factor of 7 [104, 238]. This strong shift could
neither be observed with 1 µM concentrations of MP-11, nor with NOR.
Figure 55: Time-dependent oxygen re-
lease from mixtures of 800 µM PN in 0.2
M KPi at pH 9 with no enzyme, 1 µM MP-
11, 1 µM NOR and 1 µM CPO. Typical
experiment out of five.
Figure 56: Nitrite:nitrate ratio from de-
cayed PN (400 µM) in dependence of KPi
buffer and MP-11 concentration.
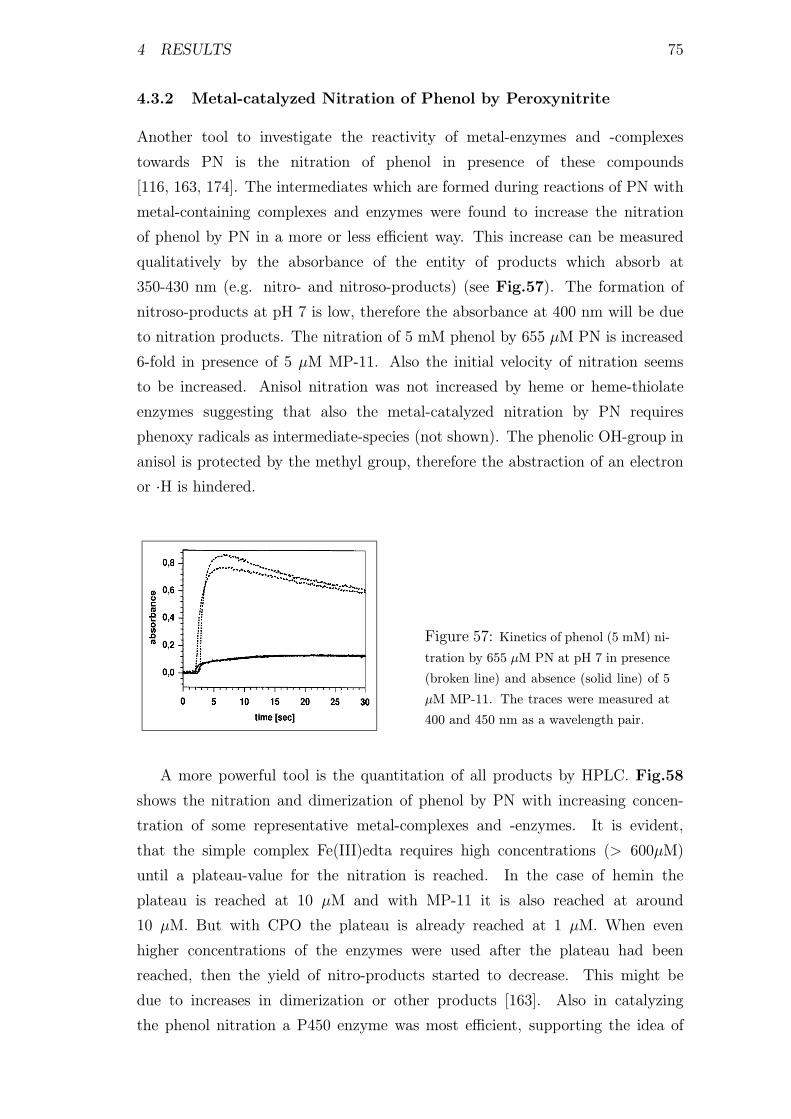
4 RESULTS 75
4.3.2 Metal-catalyzed Nitration of Phenol by Peroxynitrite
Another tool to investigate the reactivity of metal-enzymes and -complexes
towards PN is the nitration of phenol in presence of these compounds
[116, 163, 174]. The intermediates which are formed during reactions of PN with
metal-containing complexes and enzymes were found to increase the nitration
of phenol by PN in a more or less efficient way. This increase can be measured
qualitatively by the absorbance of the entity of products which absorb at
350-430 nm (e.g. nitro- and nitroso-products) (see Fig.57). The formation of
nitroso-products at pH 7 is low, therefore the absorbance at 400 nm will be due
to nitration products. The nitration of 5 mM phenol by 655 µM PN is increased
6-fold in presence of 5 µM MP-11. Also the initial velocity of nitration seems
to be increased. Anisol nitration was not increased by heme or heme-thiolate
enzymes suggesting that also the metal-catalyzed nitration by PN requires
phenoxy radicals as intermediate-species (not shown). The phenolic OH-group in
anisol is protected by the methyl group, therefore the abstraction of an electron
or ·H is hindered.
Figure 57: Kinetics of phenol (5 mM) ni-
tration by 655 µM PN at pH 7 in presence
(broken line) and absence (solid line) of 5
µM MP-11. The traces were measured at
400 and 450 nm as a wavelength pair.
A more powerful tool is the quantitation of all products by HPLC. Fig.58
shows the nitration and dimerization of phenol by PN with increasing concen-
tration of some representative metal-complexes and -enzymes. It is evident,
that the simple complex Fe(III)edta requires high concentrations (> 600µM)
until a plateau-value for the nitration is reached. In the case of hemin the
plateau is reached at 10 µM and with MP-11 it is also reached at around
10 µM. But with CPO the plateau is already reached at 1 µM. When even
higher concentrations of the enzymes were used after the plateau had been
reached, then the yield of nitro-products started to decrease. This might be
due to increases in dimerization or other products [163]. Also in catalyzing
the phenol nitration a P450 enzyme was most efficient, supporting the idea of
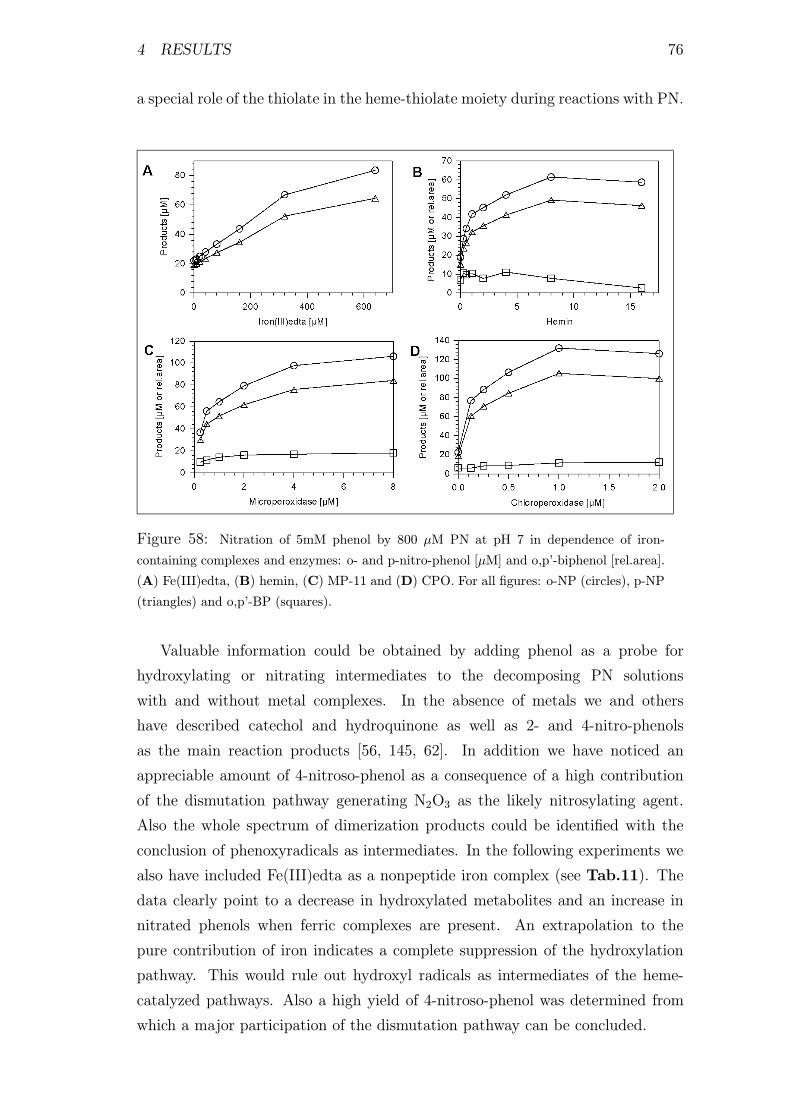
4 RESULTS 76
a special role of the thiolate in the heme-thiolate moiety during reactions with PN.
Figure 58: Nitration of 5mM phenol by 800 µM PN at pH 7 in dependence of iron-
containing complexes and enzymes: o- and p-nitro-phenol [µM] and o,p’-biphenol [rel.area].
(A) Fe(III)edta, (B) hemin, (C) MP-11 and (D) CPO. For all figures: o-NP (circles), p-NP
(triangles) and o,p’-BP (squares).
Valuable information could be obtained by adding phenol as a probe for
hydroxylating or nitrating intermediates to the decomposing PN solutions
with and without metal complexes. In the absence of metals we and others
have described catechol and hydroquinone as well as 2- and 4-nitro-phenols
as the main reaction products [56, 145, 62]. In addition we have noticed an
appreciable amount of 4-nitroso-phenol as a consequence of a high contribution
of the dismutation pathway generating N2O3 as the likely nitrosylating agent.
Also the whole spectrum of dimerization products could be identified with the
conclusion of phenoxyradicals as intermediates. In the following experiments we
also have included Fe(III)edta as a nonpeptide iron complex (see Tab.11). The
data clearly point to a decrease in hydroxylated metabolites and an increase in
nitrated phenols when ferric complexes are present. An extrapolation to the
pure contribution of iron indicates a complete suppression of the hydroxylation
pathway. This would rule out hydroxyl radicals as intermediates of the heme-
catalyzed pathways. Also a high yield of 4-nitroso-phenol was determined from
which a major participation of the dismutation pathway can be concluded.

4 RESULTS 77
pH 5 Hydroxyphenols [µM] Nitrophenols [µM]
without iron∗ 52±11 13.2±1.7with 1 µM NOR 28.9±5.3 37±1.8with 2 µM NOR 6.2±3.2 93.2±4.8with 1 µM MP-11 46.6±7.7 26.9±2.8with 2.5 µM MP-11 2.3±1.5 60.9±4.5with 1 µM HRP∗∗ < 1 40.3±3.7with 2.5 µM HRP∗∗∗ < 1 32.4±5.3with 20 µM Fe(III)edta 35.4±7 14.9±1.2with 100 µM Fe(III)edta 29±8.4 22.2±2.77.5 2-hydroxyphenol [µM] Nitrophenols [µM]
without iron∗ 13.5±1.5 22.2±1.6with 1 µM NOR < 0.5 31±4.3with 1 µM MP-11 10.1±3.8 34.9±2.6with 2.5 µM MP-11 < 0.5 42.7±5.4with 1 µM HRP∗∗ < 0.5 31.3±2.7with 2.5 µM HRP∗∗∗ < 0.5 28.8±1.9with 20 µM Fe(III)edta 1.1±0.2 27.3±0.7with 100 µM Fe(III)edta < 0.5 32.6±3.1
Table 11: Effect of iron-proteins and iron-edta on PN-mediated nitration and hydroxylation.
(+) 4-hydroxy-phenol is only present in trace amounts at this pH (∗) 800 µM PN and 5 mM
phenol in 0.1 M KPi-buffer pH 5 or 7.5 at 37 ◦C for 1 min (∗∗) formed high amounts of biphenols
(∗∗∗) formed highest amounts of biphenols.
Whereas the mechanisms of nitration with free PN via its acid form is still
ill-defined, the presence of ferric complexes very convincingly has been shown to
occur via initial formation of a ferryl ion and the ·NO2 radical [111, 164, 163]. The
data with NOR were in agreement with such homolytic cleavage of PN although
with cytochrome P450 monooxygenases hydroperoxides usually are forming the
perferryl state (Compound I) in which the oxygen atom possesses oxene transfer
properties and provides the basis for monooxygenase reactions [38]. Therefore,
by this mechanism phenol could be converted to 2- and 4-hydroxy-phenols which
should then increase the yield of these products in addition to the pattern of
hydroxy- and nitro-phenols derived from the decomposition of free PN. However,
catalysis by NOR rather decreased the yields of hydroxy-phenols (see Tab.11)
[163]. It was interesting therefore to test the product pattern with a real
P450-monooxygenase like BM3 as shown Tab.12. When tested under the same
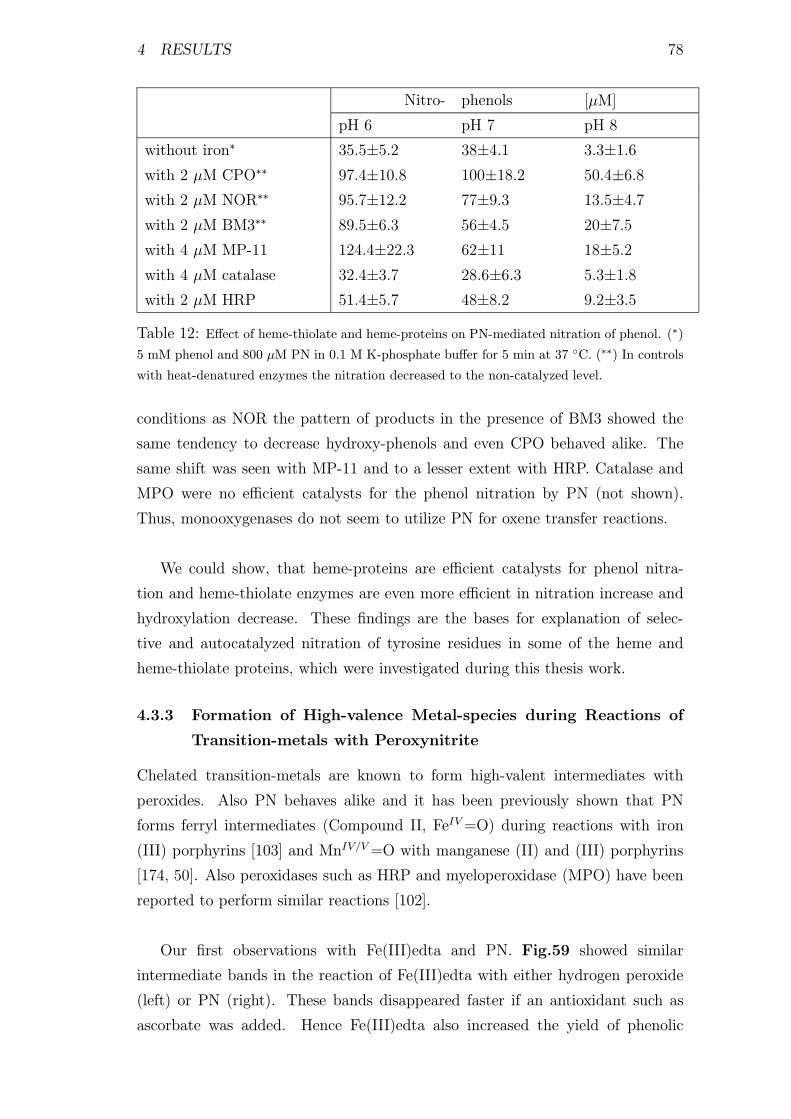
4 RESULTS 78
Nitro- phenols [µM]
pH 6 pH 7 pH 8
without iron∗ 35.5±5.2 38±4.1 3.3±1.6with 2 µM CPO∗∗ 97.4±10.8 100±18.2 50.4±6.8with 2 µM NOR∗∗ 95.7±12.2 77±9.3 13.5±4.7with 2 µM BM3∗∗ 89.5±6.3 56±4.5 20±7.5with 4 µM MP-11 124.4±22.3 62±11 18±5.2with 4 µM catalase 32.4±3.7 28.6±6.3 5.3±1.8with 2 µM HRP 51.4±5.7 48±8.2 9.2±3.5Table 12: Effect of heme-thiolate and heme-proteins on PN-mediated nitration of phenol. (∗)
5 mM phenol and 800 µM PN in 0.1 M K-phosphate buffer for 5 min at 37 ◦C. (∗∗) In controls
with heat-denatured enzymes the nitration decreased to the non-catalyzed level.
conditions as NOR the pattern of products in the presence of BM3 showed the
same tendency to decrease hydroxy-phenols and even CPO behaved alike. The
same shift was seen with MP-11 and to a lesser extent with HRP. Catalase and
MPO were no efficient catalysts for the phenol nitration by PN (not shown).
Thus, monooxygenases do not seem to utilize PN for oxene transfer reactions.
We could show, that heme-proteins are efficient catalysts for phenol nitra-
tion and heme-thiolate enzymes are even more efficient in nitration increase and
hydroxylation decrease. These findings are the bases for explanation of selec-
tive and autocatalyzed nitration of tyrosine residues in some of the heme and
heme-thiolate proteins, which were investigated during this thesis work.
4.3.3 Formation of High-valence Metal-species during Reactions of
Transition-metals with Peroxynitrite
Chelated transition-metals are known to form high-valent intermediates with
peroxides. Also PN behaves alike and it has been previously shown that PN
forms ferryl intermediates (Compound II, FeIV=O) during reactions with iron
(III) porphyrins [103] and MnIV/V=O with manganese (II) and (III) porphyrins
[174, 50]. Also peroxidases such as HRP and myeloperoxidase (MPO) have been
reported to perform similar reactions [102].
Our first observations with Fe(III)edta and PN. Fig.59 showed similar
intermediate bands in the reaction of Fe(III)edta with either hydrogen peroxide
(left) or PN (right). These bands disappeared faster if an antioxidant such as
ascorbate was added. Hence Fe(III)edta also increased the yield of phenolic

4 RESULTS 79
nitration by PN, this intermediate must represent the reactive species, during
Fe(III)edta-catalyzed nitration.
Figure 59: Reaction of 1 mM Fe(III)edta with either 2 mM H2O2 (left side) or 800 µM PN
(right side) at pH 7. Both spectra show the absorbance at around 500 nm before addition
of peroxide and 0, 5 and 10 min after the addition.
HRP was the only heme-enzyme which could form a more or less sta-
ble ferryl-intermediate during reaction with PN. Bolus-added as well as
simultaneously-generated PN caused a shift of the Soret band of HRP at 398
nm to a new intermediate band at 424 nm, which was the ferryl (Compound II)
intermediate as previously described [102]. Fig.60A shows the time-dependent
accumulation of the ferryl-species during decompostion of SIN-1, which is known
to form simultaneously ·NO and O·−2 by autoxidation and serves as a source
of continuously-generated PN [22]. This ferryl-species could be converted back
to the ferric-heme by treatment with ascorbate, indicating the reactivity of
this intermediate towards e-donors. This observation was in agreement with
the increased nitration of phenol and the accelerated decomposition of PN in
presence of HRP. Fig.60B shows the Fe-NO-complex of HRP, which is hard to
distinguish from the ferryl-species, but shows no reactivity towards ascorbate.
Bolus addition of either PN or H2O2 resulted in similar spectra, suggesting that
also in these cases the ferryl-species was formed (not shown). Fig.61 shows
the visible region of the ferryl species with the characteristic double bands
at 525 and 557 nm. Once more the Fe-NO-complex of HRP showed similar
absorbance maxima (not shown). P450’s, hemin and MP-11 formed no stable
ferryl-species with PN which could be observed by conventional spectroscopy.
Stopped-flow spectra of hemin and MP-11 revealed only small spectral changes
and a decomposition of the porphyrin-ring.
After the finding that P450’s could catalyze the nitration of phenol by PN, we

4 RESULTS 80
Figure 60: Difference absorbance spectra, measured against 5 µM native HRP: (A) incu-
bated with 400 µM SIN-1 at pH 7.4 for 1-13 min (black lines) and 0.5 or 2 min after addtion
of 200 µM ascorbate (broken grey lines). (B) incubated with 25 µM DENO at pH 7.4 for
0.2, 1 and 2 min (black lines) and 0.5 or 2 min after addition of 200 µM ascorbate (broken
grey lines).
Figure 61: Visible region of the HRP
ferryl-species generated during the reac-
tion of 5 µM HRP with 650 µM PN at pH
7.5.
concentrated on the mechanism of metal-catalyzed nitration of phenol. Since we
found dimerization products also in metal-containing reactions, the mechanism
was likely to proceed via radical species and to involve a ferryl intermediate,
which we postulated for NOR and PN [163]. As shown in Fig.62 we observed
an intermediate during reaction of NOR with PN which could be assigned to
the ferryl-species in agreement with the Compound II spectrum of CPO [239].
This ferryl-band increased until most of the PN had decayed (first 100 ms in the
kinetic trace in Fig.62) and then started to decompose and formed back the
ferric form of NOR (more than 2000 ms). The bimolecular rate constant ksec for
the formation of the ferryl-species was 8x10⁴-2x10⁵ M−1s−1, kobs was 20 s−1 at
pH 7.2 and 43 s−1 at pH 5.9 (see Fig.64). The monomolecular rate constant kobs
for the decomposition was 1.4-1.6 s−1. In the pH range shown the rate constant
decreases, but at pH 8.8 it increases again (not shown). From the short life-time
we could conclude that Compound II of P450NOR (and also other P450’s as will
be shown later) is much more reactive compared to that one of HRP, which is
stable for at least minutes. This also explains the high efficiency of P450’s in
catalyzing PN-decomposition and phenol nitration by PN.

4 RESULTS 81
Figure 62: Stopped-flow spectra of the
reaction of 1.25 µM NOR and 250 µM PN
at pH 7.1. The inset shows the kinetic
trace for the decrease and reformation of
the Soret band at 417 nm, the formation
and decay of a ferryl species at 434 nm and
the isosbestic point at 420 nm.
Figure 63: Visible region of the stopped-
flow spectra of the reaction of 1.25 µM
NOR and 250 µM PN at pH 7.1.
Figure 64: Rate constants for the reac-
tion of 2.5 µM NOR with 275 µM PN at
different pH.
4.4 Autocatalytic Tyrosine Nitration of Cytochrome
P450BM−3 and its F87Y Mutant by Peroxynitrite
4.4.1 Short Introduction
In order to explain the high selectivity of the enzyme for nitration, we have used
chemical models [130] which suggest that a tyrosine at the active site is nitrated
after a homolytic cleavage of PN and a ferryl species as well as nitrogen diox-
ide are generated [163]. Interestingly, we have also shown that the P450 protein
NADH-NO-reductase (P450NOR) can catalyze the nitration of added phenol but
does not show autocatalytic protein nitration at low PN concentrations [163]. In
contrast, the monooxygenase P450BM−3 [240] gave a positive reaction with NT-Ab
in Western blots after treatment with low PN concentrations [116]. This finding
prompted the present study on the location of nitrated tyrosines in P450BM−3
and in a mutant in which a phenylalanine located close to the active site was
exchanged against a tyrosine (F87Y) [182]. This protein displays similarities to
4 RESULTS 82
PGI2-synthase and can thus be used to study mechanistic aspects on PN medi-
ated nitrations, in particular the role of the heme in this process. In addition,
since Pfeiffer and Mayer [22] had reported the lack of tyrosine nitration by si-
multaneously generated ·NO and O·−2 under physiological conditions, we in this
work emphasize that this is not valid when tyrosines are in a protein close to
a metal-containing active site. In this case reaction with the metal centers can
compete effectively with other chemical processes of PN such as isomerization to
nitrate or dismutation to dioxygen and dinitrogen trioxide. Uncatalyzed nitration
reactions are rather inefficient and may require 100 µM or more PN and are thus
less likely to occur in cellular systems.
4.4.2 Nitration of P450BM−3
Previous work with heme-thiolate enzymes had shown that these enzymes can
catalyze the decomposition of 100 µM PN. When P450BM−3 is reacted with
PN it becomes nitrated [116] and thus displays an analogy to PGI2-synthase
nitration. Nitration of P450BM−3 was monitored by Western blotting with a
polyclonal NT-antiserum which gave only a very weak background staining with
the untreated native enzyme. Fig.65 A and B shows the effect of incubation
of 5 µM wild-type P450µ with 100 µM PN, resulting in a clearly stained band
at 116 kDa. Addition of 500 µM PN intensified this band but also gave a
strong background of contaminating protein, which was not visible on Ponceau
S stained gels for these blots. This suggested that this aggregated material was
only present at low concentrations (Fig.67). With 50 µM PN, the staining of
the holo enzyme (NADPH reductase domain plus the heme-thiolate protein)
became weaker but appeared rather selective compared to other bands. Also 5
µM PN still resulted in a distinct and selective staining which became faint but
still visible after addition of 0.5 µM (not shown). The F87Y variant behaved
qualitatively similarly but displayed significant nitration even when 5 µM enzyme
were incubated with 0.5 µM PN. Other heme-thiolate enzymes such as P450NOR
[163] and CPO were nitrated at PN concentrations above 100 µM (data not
shown). Both enzymes showed a strong NT-positive staining at concentrations
of 250-500 µM of PN.
To demonstrate that tyrosine nitration was effective when the enzyme was
exposed to simultaneously generated ·NO and O·−2 , we incubated 5 µM BM3
aerobically with 100 µM SIN-1 and obtained a strong nitration of the 116 kDa
holo enzyme, but also of proteins of somewhat lower size and of an obviously

4 RESULTS 83
Figure 65: α-NT Western blot of BM3
Wildtype and F87Y Variant (major band
at 116 kDa) after treatment with different
amounts of PN at pH 7.4.
Figure 66: α-NT Western blot of BM3
WT after treatment with PN-generating
systems or nitric oxide. A comparable blot
was made for BM3 F87Y.
aggregated material (Fig.66, lane 2). A control in which O·−2 generated by
SIN-1 autoxidation was scavenged by Cu,Zn-SOD (lane 3) showed negligible
nitration and so did a sample which was only exposed to ·NO, generatedthrough the thermal decomposition of 100 µM spermine NONOate (lane 4).
As expected, the exposure of BM3 to hypoxanthine/xanthine oxidase resulted
in no nitration (lane 1) unless the reaction system was supplemented with 0.1
mM NONOate (lane 5) which then caused strong nitration of the 116 kDa
protein but also of a second band at 54 kDa which corresponds to the size of
the heme domain alone. Weak staining was seen also in a fragment at 66 kDa
which could represent the reductase domain. Both the addition of Cu,Zn-SOD
or the omittance of XO blunted the nitration (Fig.66 lanes 6 and 7, respectively).
Figure 67: Ponceau S stained gel for
Western blot in Fig.65.
Figure 68: Ponceau S stained gel for
Western blot in Fig.69
These blots suggest that the incubation of the enzyme with xanthine oxidase
resulted in a splitting of the 116 kDa holoenzyme into the 66 and 56 kDa
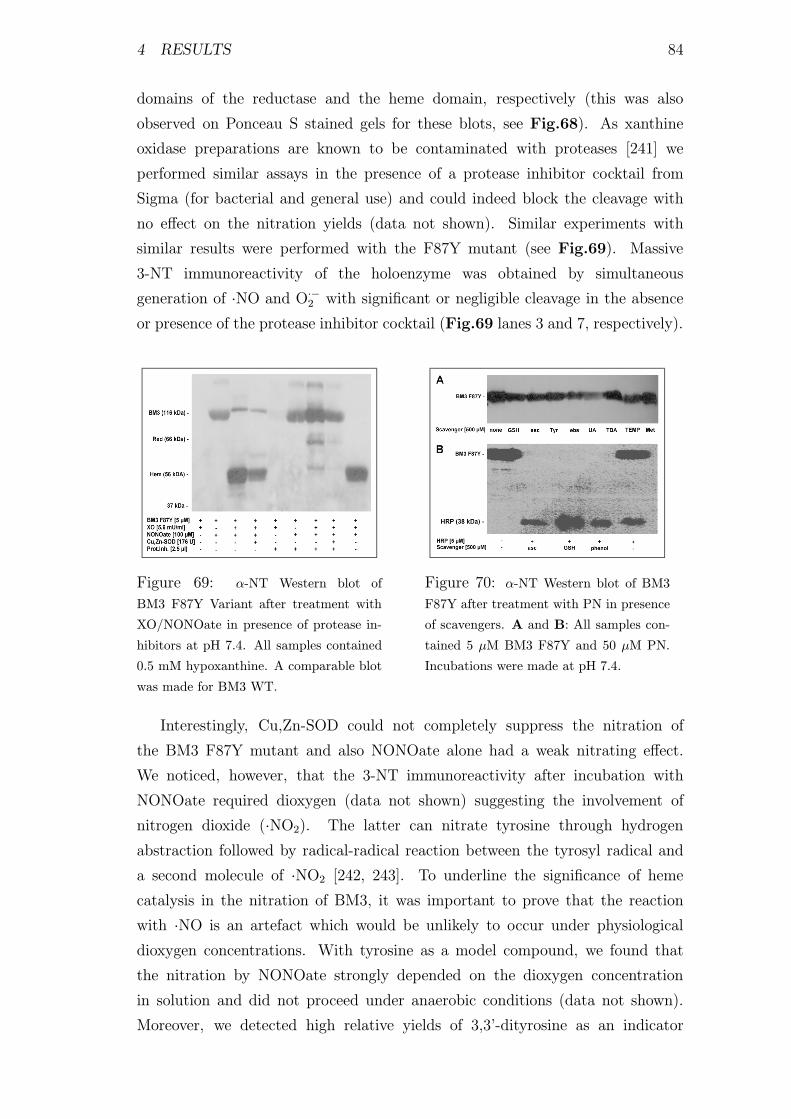
4 RESULTS 84
domains of the reductase and the heme domain, respectively (this was also
observed on Ponceau S stained gels for these blots, see Fig.68). As xanthine
oxidase preparations are known to be contaminated with proteases [241] we
performed similar assays in the presence of a protease inhibitor cocktail from
Sigma (for bacterial and general use) and could indeed block the cleavage with
no effect on the nitration yields (data not shown). Similar experiments with
similar results were performed with the F87Y mutant (see Fig.69). Massive
3-NT immunoreactivity of the holoenzyme was obtained by simultaneous
generation of ·NO and O·−2 with significant or negligible cleavage in the absence
or presence of the protease inhibitor cocktail (Fig.69 lanes 3 and 7, respectively).
Figure 69: α-NT Western blot of
BM3 F87Y Variant after treatment with
XO/NONOate in presence of protease in-
hibitors at pH 7.4. All samples contained
0.5 mM hypoxanthine. A comparable blot
was made for BM3 WT.
Figure 70: α-NT Western blot of BM3
F87Y after treatment with PN in presence
of scavengers. A and B: All samples con-
tained 5 µM BM3 F87Y and 50 µM PN.
Incubations were made at pH 7.4.
Interestingly, Cu,Zn-SOD could not completely suppress the nitration of
the BM3 F87Y mutant and also NONOate alone had a weak nitrating effect.
We noticed, however, that the 3-NT immunoreactivity after incubation with
NONOate required dioxygen (data not shown) suggesting the involvement of
nitrogen dioxide (·NO2). The latter can nitrate tyrosine through hydrogen
abstraction followed by radical-radical reaction between the tyrosyl radical and
a second molecule of ·NO2 [242, 243]. To underline the significance of heme
catalysis in the nitration of BM3, it was important to prove that the reaction
with ·NO is an artefact which would be unlikely to occur under physiological
dioxygen concentrations. With tyrosine as a model compound, we found that
the nitration by NONOate strongly depended on the dioxygen concentration
in solution and did not proceed under anaerobic conditions (data not shown).
Moreover, we detected high relative yields of 3,3’-dityrosine as an indicator

4 RESULTS 85
of a radical pathway different from the PN product pattern. Moreover, other
products appeared which could not be detected with PN as the nitrating agent.
Potential scavengers for PN were employed in order to study their efficiency
to compete with protein nitration. When glutathione, ascorbate and tyrosine
were added in a tenfold excess over PN only 30 - 40 % inhibition could be
observed whereas 500 µM ebselen and TEMPONE were partially (50 - 70 %)
inhibitory and uric acid showed nearly a complete inhibition. However, complete
inhibition of nitration could be observed when ascorbate, glutathione or phenol
were supplemented with 5 µM horseradish peroxidase. HRP alone had no effect
but was also nitrated (see Fig.70 A and B).
For pyrogallol it had been described, that it releases superoxide during
autooxidation [51]. Therefore pyrogallol could be another chemical source of
superoxide and thus when coupled with a NO-donor, such as diethyl NONOate
would form PN. We optimized the pH and temperature, so that fluxes of
superoxide from pyrogallol and ·NO from diethyl NONOate were nearly equal
(determined by the reduction of cytochrome c by O·−2 and by the ·NO-derived
fluorescence of dihydrorhodamine). Employed in our system it turned out,
that the behavior of BM3-WT and F87Y was different (see Fig.71): For
the wildtype enzyme the PN-scavenging ability of pyrogallol seemed to be
more effective than the nitration increase through PN formation and as a
consequence the nitration rather decreased in presence of pyrogallol. Thus
BM3-WT was nitrated more efficiently by NONOate alone. The F87Y vari-
ant gave more intensive signals, when pyrogallol and NONOate were present.
Y87 and Y334 showed a completely different sensitivity for nitration in this system.
Figure 71: α-NT Western
blot of BM3 F87Y and WT
after exposure to pyrogallol
and diethyl NONOate.
To prove the autocatalytic mechansim of the nitration of BM3, two additional
experiments were made. The BM3-catalyzed nitration of phenol as well as the

4 RESULTS 86
autocatalyzed nitration of BM3 by PN have to be influenced if the active site of
the enzyme was blocked by a substrate. Palmitate was chosen, because saturated
fatty acids are known to react slowly with PN and therefore it was expected that
palmitate shows no effect on the nitration. Phenol nitration was monitored by
the absorption of NP at 400 nm in alkaline solution. Fig.72 shows the decrease
of BM3-WT-catalyzed nitration in dependence of palmitate concentration.
Although no clear concentration dependency was found, the nitration decreased
overall experiments which contained palmitate. This result got more obvious in
the case of the F87Y variant, when higher concentrations of palmitate were used
(see Fig.73). Thus palmitate can block the active site of BM3 and inhibit the
enzyme-catalyzed nitration of phenol.
Figure 72: Palmitate inhibits the BM3-WT-
catalyzed nitration of phenol by PN. Reaction
of 5 mM phenol with 800 µM PN in 0.1 M
K-phospahte buffer pH 7.4 at RT.
Figure 73: Palmitate inhibits the
BM3 F87Y-catalyzed nitration of phe-
nol by PN. Reaction of 5 mM phenol
with 800 µM PN at pH 7.4.
A comparable experiment was done for the autocatalyzed nitration of BM3-
WT and the F87Y variant. Fig.75 shows the decrease of nitration of both,
BM3-WT and F87Y, in dependence of palmitate concentration. Unfortunately
Fig.74 shows different results for BM3-F87Y, which is less nitrated by 10 µM
PN in presence of palmitate. BM3-WT showed no difference in staining in either
presence or absence of palmitate. For both enzymes no difference in nitration by
100 µM PN could be observed between palmitate-containing and -free samples.
However, palmitate is not completely soluble at these concentrations and is prob-
ably present as micells. Therefore it may be that palmitate concentrations varied
from the indicated concentrations and caused the differences.

4 RESULTS 87
Figure 74: α-NT Western blot of BM3-WT
and F87Y after treatment with 10 or 100 µM
PN in the presence and absence of 200 µM
palmitate.
Figure 75: α-NT Western blot of
BM3-WT and F87Y after treatment
with 50 µM PN in the presence of 0-
200 µM palmitate.
4.4.3 Localisation of Nitrated Tyrosine Residues
Nitration was quantitatively monitored by HPLC, and nitrotyro-
sine/nitrotyrosinate was detected at 360/428 nm, respectively. Simultaneous
detection at these two wavelengths was possible by postcolumn pH-change of
the mobile phase. The PN-treated enzyme was proteolyzed by trypsin and the
nitrotyrosine-positive peptides were detected by HPLC (see Fig.76), collected,
and subjected to mass spectrometrical analysis. The area of NT-positive peptide
peaks increased linearly with the PN-concentration up to 250 µM and reached
a plateau at 500 µM (see insert in Fig.76). The chromatograms show that
in the WT BM3 only one NT-positive peptide could be detected (tR = 21
min). At PN concentrations above 500 µM also other NT-containing peaks
accumulated. MS-analysis of the peak with tR = 21 min showed that the
WT was nitrated at Y334 in the fragment 324-336 ([M + 1] 1464.7 + 45 Da).
Mass spectrometric analysis of a complete mixture of proteolytic peptides, not
separated by HPLC, indicated the incorporation of a single oxygen atom in the
fragments 640 - 657 ([M + 1] 1893.9 + 16 Da), 16-31 ([M + 1] 1795.2 + 16 Da)
and 350-362 ([M + 1] 1521.1 + 15.6 Da). As these sequences do not contain
F, Y or W, the single incorporation of oxygen might be due to sulfoxidation
of M653, M30 and M354, respectively. For F87Y, the HPLC and MS analyses
revealed nitration of Y87 in the fragment 80 - 94 ([M + 1] 1771.8 + 45 Da) (tR
= 16 min) in addition to Y334 (tR = 21 min). Another signal ([M + 1] 1968
Da) could be correlated to the mass of the nitrated fragment 420-434 (Y429),
but since this signal was also observed in samples without PN-treatment, we
considered it as an artefact or contamination. More evidence for an artifical
signal came from HPLC-analysis, where this nitrated ”peptide” could not be
detected. Tab.13 shows that the mass spectrometric analysis of the complete

4 RESULTS 88
peptide mixtures, not separated by HPLC, served to monitor ca. 35-40 % of
the peptide fragments including several tyrosine-containing fragments which
were not nitrated. However, most importantly the nitrated peaks identified
by HPLC have been characterized. The sequence of BM3 is shown in Tab.18-20.
Figure 76: Chromatograms of the tryptic digestion of PN-treated WT and F87Y. Enzymes
were treated with 250 µM PN at pH 7.4 and digested with 1 µM trypsin. The NT-positive
peptides were detected at 360 and 428 nm. (A) 10 µM BM3 WT, the insert shows the area
of the tR=21 min peak at 360 nm (solid circles) and 428 nm (open circles) in dependence
of PN-concentration. (B) 10 µM BM3 F87Y, the insert shows the area of the tR=16 min
peak at 360 (open circles) and 428 nm (solid circles), as well as the area of the tR=21 min
peak at 360 (open squares) and 428 nm (solid squares).
4.4.4 Spectral Intermediates During Reactions of P450BM−3 and
Chloroperoxidase with Peroxynitrite
The reaction of an excess PN (128 µM) with BM3 WT (1 µM) was studied by
rapid-scan UV/vis spectroscopy between 300 and 450 nm at pH 6.8 and 12 ◦C.
As shown in Fig.77, in the first 300 ms of the reaction the characteristic band
for native BM3 WT at 418 nm rapidly decreased (trace 2) and concomitantly, a
new product with an absorbance maximum around 430 nm was partly formed
(trace 5). The spectrum of this species remained unchanged up to about 4 s
(trace 6) while the absorbance band of PN at 302 nm decreased (see insert
in Fig.77). Finally, when about two thirds of PN had been consumed, the
intermediate species decayed back to the iron(III)-form of native BM3 WT, as
indicated from the increase in absorbance at 418 nm over the last 20 s (traces
7 and 8). Two exponential equations were needed to fit the first 3 s of the
kinetic trace at 435 nm and the following kobs values were obtained: 6.5 ±0.6 s−1 and 1.29 ± 0.04 s−1. An observed rate constant of 0.084 ± 0.001 s−1
was obtained from the fit of the trace at 435 nm between 10 and 50 s; this

4 RESULTS 89
Table 13: Mass table of tyr-containing peptides obtained from trypsin digestion of BM3
WT.
corresponds to the decay rate of the intermediate species back to native BM3 WT.
Two analogous experiments were carried out with different PN and enzyme
concentrations, that is 1 µM BM3 WT with 30 µM PN (A) and 2 µM BM3 WT
with 128 µM PN (B). Surprisingly, the observed rate constants obtained from
the fits of the first 3 s of the traces at 435 nm (7 ± 2 s−1; 1.0 ± 0.1 s−1 (A) and
7.7 ± 0.6 s−1; 1.44 ± 0.02 s−1 (B)) appeared to be independent from the PN as
well as the enzyme concentration, and they were almost identical to the values
obtained when 1 µM BM3 WT was reacted with 128 µM PN. Nevertheless,
because of the relatively large signal to noise ratio of the extracted traces, the
uncertainty of the observed rate constants is significant and, thus, small changes
in the rates cannot be detected by these data. As expected, the decay rate of
the intermediate species back to native BM3 WT, obtained from the fits of the
traces at 435 nm between 10 and 50 s (0.077 ± 0.001 s−1 (A) and 0.072 ± 0.01s−1 (B)), was as well independent from the concentrations of the two reagents.

4 RESULTS 90
Figure 77: Rapid-scan UV/vis spectra of
the reaction of 1 µM BM3 WT with 128
µM PN in 0.05 M phosphate buffer at pH
6.8, 12 ◦C. Scans are shown at the follow-
ing measuring times. 2: 320 ms; 3: 640
ms; 4: 960 ms; 5: 1.60 s; 6: 3.84 s; 7:
15.84 s; 8: 27.84 s. In the inset kinetic
traces at 302, 418 and 435 nm. For clarity,
0.015 absorbance units were subtracted to
the trace at 302 nm and the traces 1-8 were
smoothed.
Figure 78: Rapid-scan UV/vis spectra
of the reaction of 2 µM CPO with 30 µM
PN in 0.05 M phosphate buffer at pH 6.8,
12 ◦C. Scans 1-5 represent the formation
of CPO Compound II whereas scans 6-9
(bold) show its decay back to native CPO
after consumption of PN. Scans are shown
at the following measuring times. 2: 16 ms;
3: 32 ms; 4: 48 ms; 5: 128 ms; 6: 1.41 s;
7: 3.65 s; 8: 6.89 s; 9: 27.01 s. In the inset
kinetic traces at 302, 397 and 434 nm.
The yield of the intermediate species with the absorbance maximum around
430 nm depended on the PN-concentration: when only 30 µM PN were used,
the spectrum of the intermediate showed a significant shoulder at 418 nm which
indicated that a large amount of enzyme was still present in its native form.
The kinetic traces extracted at 302 nm could not be fitted well to a single
exponential equation probably because the spectra of the different enzyme
species involved in the reaction also contribute significantly to the absorbance
changes at this wavelength. However, qualitatively no significant change was
observed for the decay rate of PN in the presence or in the absence of the enzyme.
Rapid-scan kinetic studies of the reaction of the F87Y mutant of BM3 (1
µM) with an excess of PN (30 µM) showed that the yield of this reaction is
significantly lower than that of the analogous reaction with the native enzyme
(data not shown). Nevertheless, analysis of the kinetic trace at 435 nm gave a
result similar to that observed with the WT enzyme. The first 6 s of the trace
could be fitted to a two exponential equation that gave the following kobs-values:
8 ± 1 s−1 and 0.58 ± 0.01 s−1. The decay rate of the intermediate species,
obtained by fitting the trace at 435 nm between 10 and 50 s, was 0.035± 0.001 s−1.

4 RESULTS 91
In a similar stopped-flow experiment a solution of 2 µM CPO was reacted with
an excess PN at pH 6.8 and 12 ◦C. As shown in Fig.78, by addition of 30 µM
PN the broad absorbance band around 397 nm, arising from the iron(III)-form of
native CPO, rapidly disappeared within the first 100 ms of the reaction (traces 1-
5). Simultaneously, a new species appeared with two absorbance maxima around
434 and 372 nm, characteristic for the ferryl-form of CPO Compound II [239].
As shown from the inset in Fig.77 as long as significant amounts of PN were
present (about 1 s), the spectrum of Compound II remained unchanged whereas
a significant decrease in the absorbance was observed at 302 nm. Finally, when
most of the PN had been consumed, CPO Compound II slowly decayed back
(over 30 s) to the native iron(III)-form, as indicated from the reappearance of the
absorbance band at 397 nm (traces 6-9). The first 300 ms of the traces extracted
at 397 and 434 nm were fitted to a single exponential expression and kobs-values of
30 ± 2 s−1 and 32 ± 3 s−1 were obtained, respectively. From these data, a second
order rate constant of about 1 x 10⁶ M−1s−1 was calculated for the formation of
CPO Compound II. Single exponential fits of the two traces between 3 and 30 s,
which correspond to the decay of CPO Compound II to the native iron(III)-form,
gave values of 0.284 ± 0.001 s−1 and 0.301 ± 0.002 s−1, respectively. As in the
reactions with BM3, the kinetic trace extracted at 302 nm could not be fitted
well to single exponential equation but qualitatively it could be observed clearly
that in the presence of 2 µM CPO PN decayed at a significantly faster rate than
under the same conditions in the absence of the enzyme.
4.4.5 Effect of Peroxynitrite on Monooxygenase Activity
BM3 is composed of a single polypeptide chain which includes the FAD-FMN
containing reductase domain and the heme-thiolate domain embedded in its
active site which accommodates fatty acid substrates that undergo monooxy-
genations in the presence of NADPH and dioxygen [244]. A convenient assay
uses dodecanoic acid p-nitro-phenol ether for the assessment of enzyme activity
[214]. BM3 WT activity was lowered by PN in a concentration-dependent
way with an IC50-value of 2.3 ± 1 µM (Fig.79 and 80). Compared to the
non-treated control preincubation of 0.1 µM BM3 with 10 µM PN lowered the
monooxygenase activity to 16 ± 5 %.
The inactivation of the enzyme could be partially blocked with a tenfold
excess relative to the PN-concentration of GSH (92 ± 3 % relative to non-treated

4 RESULTS 92
Figure 79: Specific activity of 0.1 µM
BM3 in dependence of PN-concentration at
pH 8.2.
Figure 80: Measurement of the time-
dependent release of p-NP in solutions,
which contained 0.1 µM BM3 WT, treated
with different concentrations of PN, 90 µM
pNC and 200 µM NADPH at pH 8.2.
control) and ascorbate (88 ± 2 % relative to non-treated control), but uric
acid showed no protection (activity was even less than the non-treated control)
(see Fig.81). In agreement with earlier reports on the BM3 F87Y variant no
enzymatic activity was measurable for this enzyme [182]. As the IC50-value
of 2 - 3 µM obtained for the inactivation was lower than the estimated PN
concentration needed for 50 % nitration we considered also other targets for
modification besides tyrosine especially since the reductase domain is known to
contain essential thiol groups [245]. Indeed, the inactivation could be partly
restored by incubation with 1 mM DTT (30-40 % of the not PN-treated control)
(see Fig.81). Also 10 µM ebselen, which is known to form adducts with thiols
[232, 233, 236] and to react with an essential thiol group of the NADPH reductase
[245], was found to block the enzyme activity completely. It is therefore likely
that oxidation of an essential thiol group and not nitration of a tyrosine residue
is responsible for enzyme inactivation.
Figure 81: Specific activity of 0.1 µM
BM3 after treatment with 10 µM PN in
presence of antioxidants (100 µM). All an-
tioxidants were added before treatment
with PN to protect from inactivation, ex-
cept DTT which was added after treatment
with PN to restore the activity.
Strong evidence for this hypothesis is also based on the finding that, as
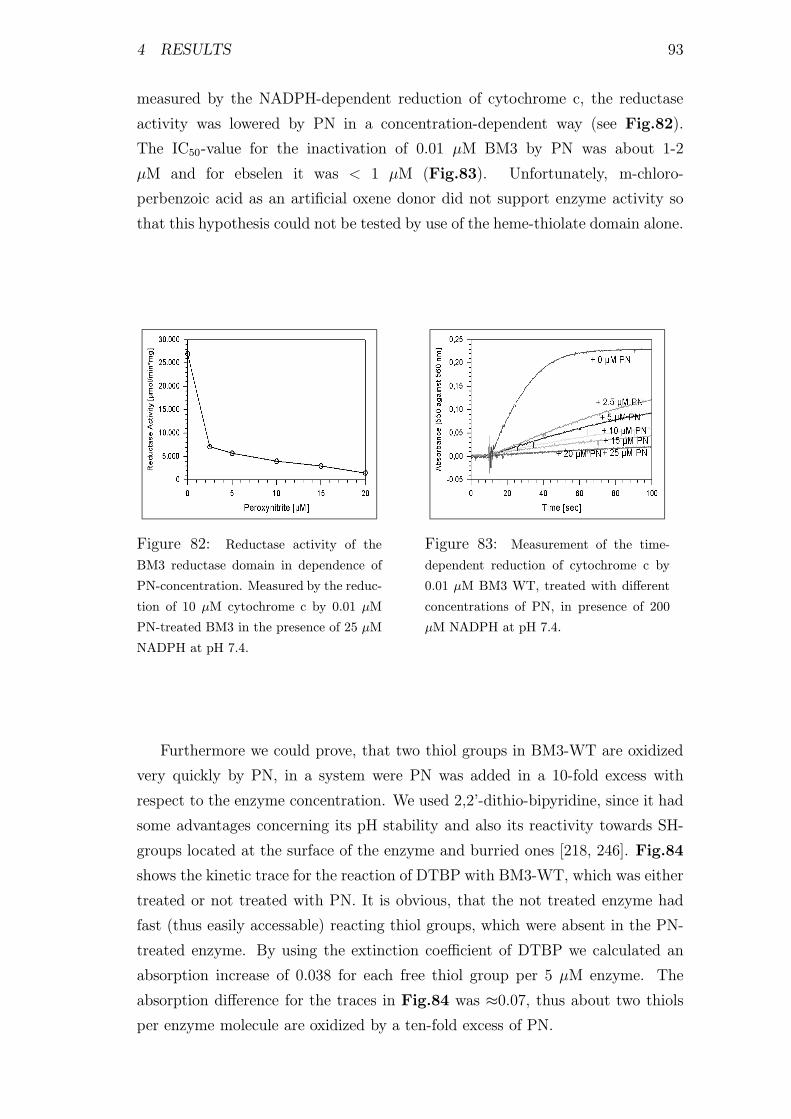
4 RESULTS 93
measured by the NADPH-dependent reduction of cytochrome c, the reductase
activity was lowered by PN in a concentration-dependent way (see Fig.82).
The IC50-value for the inactivation of 0.01 µM BM3 by PN was about 1-2
µM and for ebselen it was < 1 µM (Fig.83). Unfortunately, m-chloro-
perbenzoic acid as an artificial oxene donor did not support enzyme activity so
that this hypothesis could not be tested by use of the heme-thiolate domain alone.
Figure 82: Reductase activity of the
BM3 reductase domain in dependence of
PN-concentration. Measured by the reduc-
tion of 10 µM cytochrome c by 0.01 µM
PN-treated BM3 in the presence of 25 µM
NADPH at pH 7.4.
Figure 83: Measurement of the time-
dependent reduction of cytochrome c by
0.01 µM BM3 WT, treated with different
concentrations of PN, in presence of 200
µM NADPH at pH 7.4.
Furthermore we could prove, that two thiol groups in BM3-WT are oxidized
very quickly by PN, in a system were PN was added in a 10-fold excess with
respect to the enzyme concentration. We used 2,2’-dithio-bipyridine, since it had
some advantages concerning its pH stability and also its reactivity towards SH-
groups located at the surface of the enzyme and burried ones [218, 246]. Fig.84
shows the kinetic trace for the reaction of DTBP with BM3-WT, which was either
treated or not treated with PN. It is obvious, that the not treated enzyme had
fast (thus easily accessable) reacting thiol groups, which were absent in the PN-
treated enzyme. By using the extinction coefficient of DTBP we calculated an
absorption increase of 0.038 for each free thiol group per 5 µM enzyme. The
absorption difference for the traces in Fig.84 was ≈0.07, thus about two thiolsper enzyme molecule are oxidized by a ten-fold excess of PN.
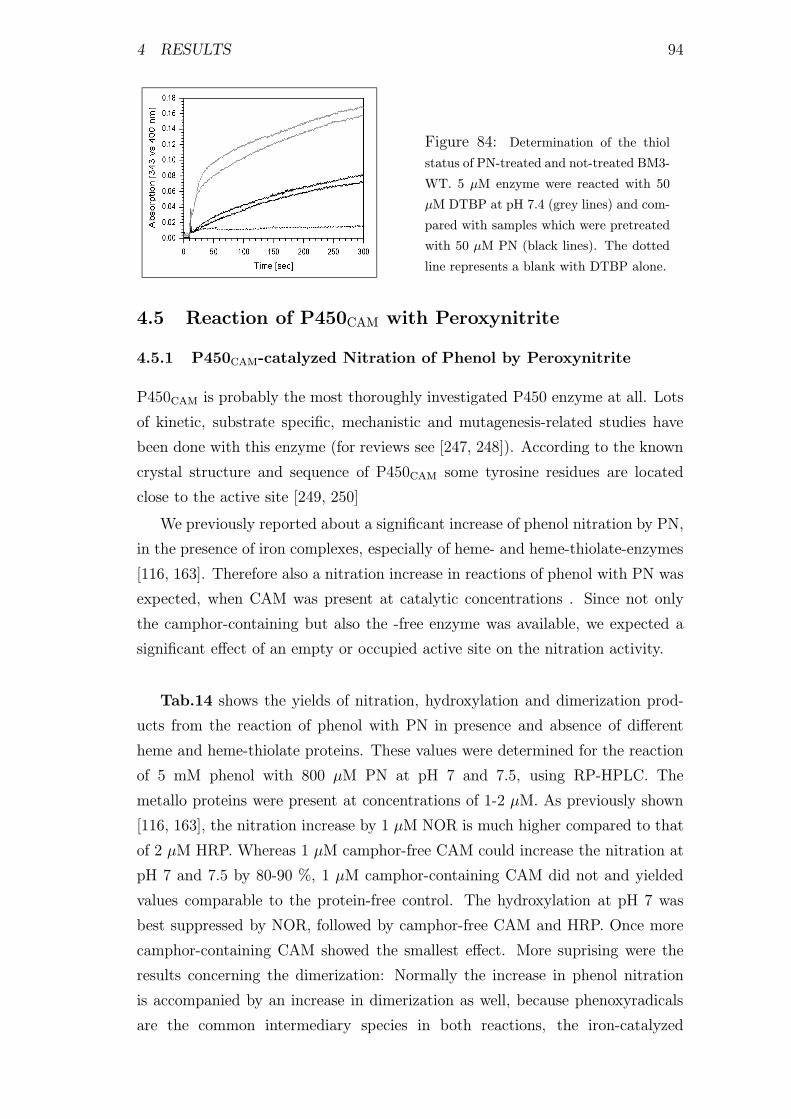
4 RESULTS 94
Figure 84: Determination of the thiol
status of PN-treated and not-treated BM3-
WT. 5 µM enzyme were reacted with 50
µM DTBP at pH 7.4 (grey lines) and com-
pared with samples which were pretreated
with 50 µM PN (black lines). The dotted
line represents a blank with DTBP alone.
4.5 Reaction of P450CAM with Peroxynitrite
4.5.1 P450CAM-catalyzed Nitration of Phenol by Peroxynitrite
P450CAM is probably the most thoroughly investigated P450 enzyme at all. Lots
of kinetic, substrate specific, mechanistic and mutagenesis-related studies have
been done with this enzyme (for reviews see [247, 248]). According to the known
crystal structure and sequence of P450CAM some tyrosine residues are located
close to the active site [249, 250]
We previously reported about a significant increase of phenol nitration by PN,
in the presence of iron complexes, especially of heme- and heme-thiolate-enzymes
[116, 163]. Therefore also a nitration increase in reactions of phenol with PN was
expected, when CAM was present at catalytic concentrations . Since not only
the camphor-containing but also the -free enzyme was available, we expected a
significant effect of an empty or occupied active site on the nitration activity.
Tab.14 shows the yields of nitration, hydroxylation and dimerization prod-
ucts from the reaction of phenol with PN in presence and absence of different
heme and heme-thiolate proteins. These values were determined for the reaction
of 5 mM phenol with 800 µM PN at pH 7 and 7.5, using RP-HPLC. The
metallo proteins were present at concentrations of 1-2 µM. As previously shown
[116, 163], the nitration increase by 1 µM NOR is much higher compared to that
of 2 µM HRP. Whereas 1 µM camphor-free CAM could increase the nitration at
pH 7 and 7.5 by 80-90 %, 1 µM camphor-containing CAM did not and yielded
values comparable to the protein-free control. The hydroxylation at pH 7 was
best suppressed by NOR, followed by camphor-free CAM and HRP. Once more
camphor-containing CAM showed the smallest effect. More suprising were the
results concerning the dimerization: Normally the increase in phenol nitration
is accompanied by an increase in dimerization as well, because phenoxyradicals
are the common intermediary species in both reactions, the iron-catalyzed

4 RESULTS 95
and proton-assisted pathway. As can be seen in the table, dimerization in the
HRP-catalyzed reaction is increased by a factor of about 18, in the case of NOR
by a factor of 4, with camphor containing CAM it reaches the value of the
control and with the camphor-free form it is even decreased by 30 %. It should
be noticed that 2,4’-BP is the major dimerization product [130] and was not
available as a standard, therefore it was quantified by its relative peak area in
HPLC chromatograms. The simultaneous increase in nitration and decrease in
dimerization was first observed with this enzyme. Camphor-free CAM seems to
be able to increase the nitration by a highly specific mechanism, by which less
free radicals are formed or where formed radicals are somehow caged in a more
efficient way.
Table 14: CAM catalysis of phenol nitration by PN. 5 mM phenol were reacted with 800 µM
peroxynitrite in 0.1 M potassium phosphate buffer pH 7 and 7.5 at RT.

4 RESULTS 96
4.5.2 Autocatalyzed Nitration of P450CAM by Peroxynitrite
Since nitration of added phenol is increased, it would be also feasible if the
nitration of tyrosyl-residues within the enzyme requires low concentrations of
PN. To prove an autocatalytic nitration of CAM we used the Western blot
technique and stained with anti-NT as already described for other nitrated
P450-enzymes, such as PGI2 synthase, BM3 and NOR [10, 163, 116]. Fig.85
shows an anti-NT Western blot of camphor-containing and -free CAM samples
after treatment with different concentrations of PN. Obviously the free-form
shows a clear signal at 50 µM, whereas the camphor-containing-form shows an
intense signal only at 250 µM.
Figure 85: α-NT Western blot of CAM in
the camphor-free and -containing (25 µM
camphor) form after treatment with differ-
ent concentrations of PN.
Figure 86: α-NT Western blot of CAM,
nitrated in the presence and absence of 12.5
µM metyrapone.
In another experiment the same samples as taken for these Western blots
in Fig.85 were injected to a HPLC-system, optimized for the detection of
NT-positive peptides at 428 nm and alkaline pH. Before injection, the enzyme
was digested by trypsin. Fig.87 shows the HPLC chromatograms of camphor-
free (A) and -containing (B) trypsin-digested CAM after treatment with 50 or
500 µM PN. The same pattern of NT-positive peaks was found in both cases,
except a strong signal at 12.3 min, which only appeared in the camphor-free
enzyme. The areas of all peaks (except that one of the porphyrin) increased
with increasing PN-concentration and reached a plateau at around 500 µM PN
(see inserts in Fig.87). It should be noted that the chromatograms are shown
at different scales and that the areas of all peptide-containing NT-positive peaks
were decreased by a factor of 2-3 in the camphor-containing experiments (see
inserts). Thus autocatalytic nitration of CAM was hindered by camphor.
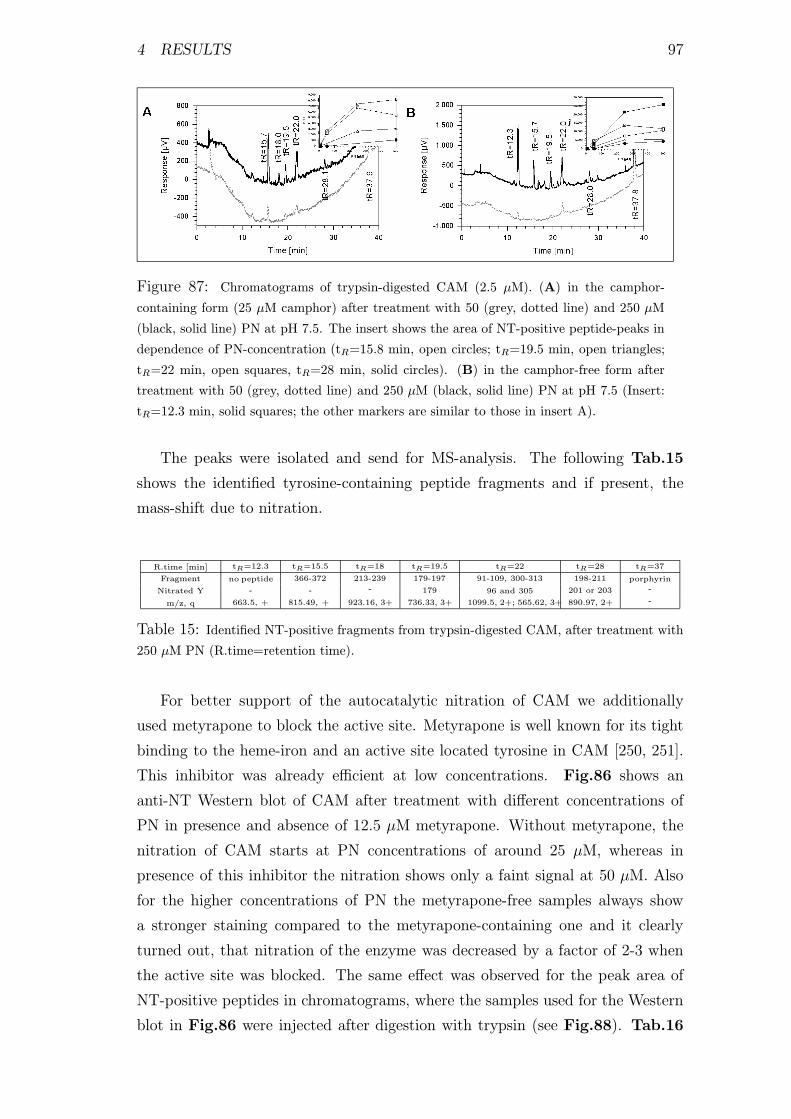
4 RESULTS 97
Figure 87: Chromatograms of trypsin-digested CAM (2.5 µM). (A) in the camphor-
containing form (25 µM camphor) after treatment with 50 (grey, dotted line) and 250 µM
(black, solid line) PN at pH 7.5. The insert shows the area of NT-positive peptide-peaks in
dependence of PN-concentration (tR=15.8 min, open circles; tR=19.5 min, open triangles;
tR=22 min, open squares, tR=28 min, solid circles). (B) in the camphor-free form after
treatment with 50 (grey, dotted line) and 250 µM (black, solid line) PN at pH 7.5 (Insert:
tR=12.3 min, solid squares; the other markers are similar to those in insert A).
The peaks were isolated and send for MS-analysis. The following Tab.15
shows the identified tyrosine-containing peptide fragments and if present, the
mass-shift due to nitration.
R.time [min] tR=12.3 tR=15.5 tR=18 tR=19.5 tR=22 tR=28 tR=37
Fragment no peptide 366-372 213-239 179-197 91-109, 300-313 198-211 porphyrin
Nitrated Y - - - 179 96 and 305 201 or 203 -
m/z, q 663.5, + 815.49, + 923.16, 3+ 736.33, 3+ 1099.5, 2+; 565.62, 3+ 890.97, 2+ -
Table 15: Identified NT-positive fragments from trypsin-digested CAM, after treatment with
250 µM PN (R.time=retention time).
For better support of the autocatalytic nitration of CAM we additionally
used metyrapone to block the active site. Metyrapone is well known for its tight
binding to the heme-iron and an active site located tyrosine in CAM [250, 251].
This inhibitor was already efficient at low concentrations. Fig.86 shows an
anti-NT Western blot of CAM after treatment with different concentrations of
PN in presence and absence of 12.5 µM metyrapone. Without metyrapone, the
nitration of CAM starts at PN concentrations of around 25 µM, whereas in
presence of this inhibitor the nitration shows only a faint signal at 50 µM. Also
for the higher concentrations of PN the metyrapone-free samples always show
a stronger staining compared to the metyrapone-containing one and it clearly
turned out, that nitration of the enzyme was decreased by a factor of 2-3 when
the active site was blocked. The same effect was observed for the peak area of
NT-positive peptides in chromatograms, where the samples used for the Western
blot in Fig.86 were injected after digestion with trypsin (see Fig.88). Tab.16
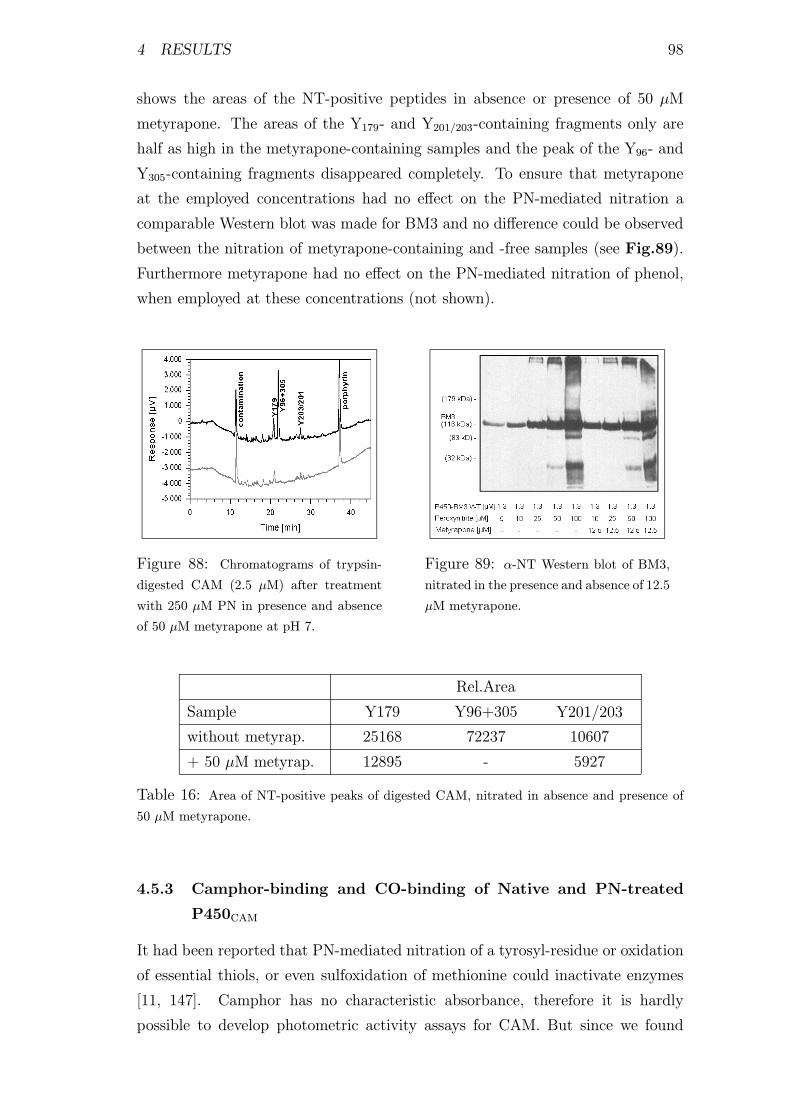
4 RESULTS 98
shows the areas of the NT-positive peptides in absence or presence of 50 µM
metyrapone. The areas of the Y179- and Y201/203-containing fragments only are
half as high in the metyrapone-containing samples and the peak of the Y96- and
Y305-containing fragments disappeared completely. To ensure that metyrapone
at the employed concentrations had no effect on the PN-mediated nitration a
comparable Western blot was made for BM3 and no difference could be observed
between the nitration of metyrapone-containing and -free samples (see Fig.89).
Furthermore metyrapone had no effect on the PN-mediated nitration of phenol,
when employed at these concentrations (not shown).
Figure 88: Chromatograms of trypsin-
digested CAM (2.5 µM) after treatment
with 250 µM PN in presence and absence
of 50 µM metyrapone at pH 7.
Figure 89: α-NT Western blot of BM3,
nitrated in the presence and absence of 12.5
µM metyrapone.
Rel.Area
Sample Y179 Y96+305 Y201/203
without metyrap. 25168 72237 10607
+ 50 µM metyrap. 12895 - 5927
Table 16: Area of NT-positive peaks of digested CAM, nitrated in absence and presence of
50 µM metyrapone.
4.5.3 Camphor-binding and CO-binding of Native and PN-treated
P450CAM
It had been reported that PN-mediated nitration of a tyrosyl-residue or oxidation
of essential thiols, or even sulfoxidation of methionine could inactivate enzymes
[11, 147]. Camphor has no characteristic absorbance, therefore it is hardly
possible to develop photometric activity assays for CAM. But since we found

4 RESULTS 99
a PN-mediated nitration of Y96, which is known to be also binding site for
camphor [249], we expected also a modulation of the camphor binding capacity.
Therefore we investigated the binding of camphor to the enzyme. The camphor-
free enzyme has an absorption maximum at 418 nm, the camphor-containing
enzyme-substrate complex at around 390 nm [247]. Fig.90A, B and C shows
the spectra of titration of camphor-free CAM with camphor, after treatment
with 0, 50 and 250 µM PN. It is obvious that the PN-treated enzyme could
interact with camphor less efficiently than the non-treated one. 250 µM PN
completely abolished the substrate binding spectrum (C).
Figure 90: Camphor-binding spectra of 2.5 µM CAM after treatment with 0 (A), 50 (B)
or 250 (C) µM PN at pH 7.5. Camphor was added stepwise to give final concentrations of
1-1000 µM.
CO-binding spectra of dithionite-reduced PN-treated and non-treated enzyme
showed a significant decrease of the 450 nm band in dependence of the PN
concentration (see Fig.91). The characteristic band of reduced CO-bound P450
enzymes at 450 nm was completely formed in the non-treated enzyme and de-
creased after preincubation with 50 and 250 µM PN. Therefore a loss in activity
could have been assigned neither exclusively to the nitration of Y96 and a result-
ing decreased camphor affinity nor to the oxidation of the heme-thiolate moiety
and the resulting altered ability to form the necessary Compound I and II species.
Figure 91: CO-binding spectra of 2.1 µM
CAM (substrate-free) after treatment with
0, 50 and 250 µM PN at pH 7.5. Enzyme
was first treated with PN, then 250 µM
CO were added followed by dithionite to
reduce the ferric heme. After these steps
the characteristic CO-binding spectrum at
around 450 nm appeared.

4 RESULTS 100
4.5.4 Kinetic Measurements of the Reaction of P450CAM with PN
For NOR [163], BM3 and CPO [111] we observed a red-shifted Soret band during
reactions with PN and in the case of CPO this species could directly be assigned
to the heme-thiolate ferryl band. Stopped-flow measurements of camphor-free
CAM revealed the existence of a similar band as in the cases of NOR, BM3
and CPO, suggesting a common mechanism of all P450 enzymes in reactions
with PN. This would also explain the low required concentrations for autocat-
alyzed nitration in these enzymes if a tyrosine residue is nearby the heme-iron
[11, 111, 252], the high efficiency in catalyzing the nitration of added phenol
[116, 163, 252] and the high turnover in PN decomposition kinetics [116, 163, 252].
Fig.92 and 93 show the stopped-flow spectra of the camphor-free and
-containing CAM. In absence of camphor it seems at a first sight as there
would be no reaction taking place, but in the insert, which shows the traces
at 417 (Soret band of native or P420 enzyme), 422 (isosbestic point) and 435
nm (intermediate band), one can see a very fast increase of an intermediate at
around 433-436 nm followed by a slower decrease of this species (Fig.92). The
formation of the intermediate reaches a maximum after 1000 ms, whereas its
decrease was completed after 15000 ms (see insert). The kinetic features and
the absorbance maximum of this intermediate seem to be comparable to that
ones which were found for the other P450 enzymes. Also the low yield of this
intermediate seems feasible regarding the nearby tyrosine which probably trapps
the ferryl species as it was postulated for the F87Y variant of BM3 [111].
In presence of camphor no such species could be observed. Also a red-shifted
band increased, as invisaged by the formation of the shoulder at 415-418 nm
(Fig.93). But since this species was stable for at least 20 s (see insert of kinetic
traces) we interpreted it as the oxidized P420-form of the enzyme. It might be
that also in this case a ferryl intermediate is formed, but is too unstable to be
observed. Similar to other P450 enzymes camphor-free CAM was highly efficient
in catalyzing the decomposition of PN at alkaline pH, but showed no effect in
the presence of camphor (Fig.94).

4 RESULTS 101
Figure 92: Stopped-flow spectra of 1 µM
CAM (substrate-free) with 300 µM PN in
0.1 M KPi pH 6.5 at 20 ◦C. Spectra were
taken after 10, 100, 500, 1000, 5000 and
15000 ms. The insert shows the traces at
417, 422 and 435 nm.
Figure 93: Stopped-flow spectra of 2 µM
CAM (substrate-bound) with 200 µM PN
at pH 6.5 and 20 ◦C. Spectra were taken
after 10, 100, 1000, 5000 and 15000 ms.
The insert shows the traces at 390, 403 and
416 nm.
Figure 94: Decomposition of 150 µM PN
in 0.1 M KPi at pH 8 and 10 ◦C in the
presence of 1 µM NOR, 1 µM CAM (free),
1 µM CAM (cont.) or 4 µM HRP.

5 DISCUSSION 102
5 Discussion
5.1 The Role of Phenoxy Radicals in Reactions of Perox-
ynitrite with Phenolic Compounds
The results of our investigation clarify the sequence of events starting from the
protonation of PN and leading to the nitrosylation, nitration and hydroxylation
of aromatic compounds. Especially the nitration mechanism of PGIS with PN
could be characterized by using phenol as a model. Our preparation of PN
contained nitrite but its contribution to the nitration and nitrosylation reactions
could be well separated from those mediated by PN. Nitration and nitrosylation
of phenol by nitrite in the acidic range occurred parallel to the protonation
to nitrous acid (pKa=3.5) and therefore could involve a polar mechanism via
[H2ON=O]+ or ”NO+”. Since also ·NO2 must be formed (or N2O3 as the
reaction product with ·NO [77]) the system is able to perform nitrosylations as
well as nitrations [128, 145]. Since such reactions were not observed with anisol
it is likely that phenoxyradicals are first formed by ·NO and/or ·NO2 and that
subsequently an addition of these radicals to the ring system followed [243, 254].
The nitrosylation with PN in the alkaline pH-range could not be due to
nitrite formation but rather to the reaction of the protonated PN (peroxynitrous
acid) with a second molecule of PN [9, 61]. This reaction yields dioxygen and
two moles of nitrite but since nitrite at higher pH-values can neither nitrate
nor nitrosylate phenol, the reactive intermediates must be ·NO and ·NO2
or N2O3 as already postulated [61] or could even originate directly from a
postulated HOON=O/−OO-N=O dimer [9]. However, the mechanism of phenol
nitrosylation was not a central part of our study.
Figure 95: The major reactions tak-
ing place in a system that consists of
phenol and PN.

5 DISCUSSION 103
At pH-values below 7 the protonation equilibrium keeps PN in its acid form
and the disproportionation will be suppressed in favor of the isomerization to
nitrate. Indeed nitrate formation is the only reaction occurring under acidic
conditions [61] which could be a consequence of having no PN available to form
an HOONO/−OON=O adduct. If one describes the postulated electronically
activated form of the trans-peroxynitrous acid as a triplet state then it becomes
feasible that before spin conversion the excited state has time to react with
organic molecules as observed repeatedly [62, 65, 90]. In the case of phenol the
hydroxylated and nitrated derivatives are formed, whereas with anisol the nitro
derivatives were virtually absent (1 % as compared to phenol). If one takes into
account a high amount of dimerization products which only can be explained
via phenoxyradical formation, it is evident that nitration would occur as a
consequence of addition of ·NO2 to the previously formed phenoxyradical. From
the fact that phenol can be nitrated with ·NO2 alone it is evident that from the
excited state intermediate not only the OH-radical part but also the remaining
NO2-radical can convert phenol to its phenoxyradical. This would explain that
with higher phenol concentrations a dramatic shift to the dimerization products
was observed. The dimerization products shown in Fig.96 may be formed via a
sandwich intermediate of two phenoxyradicals as postulated elsewhere [196, 255].
This intermediate leads to a characteristic dimerization product pattern with
low yields of 4,4’-biphenol and high yields of 2,4’-biphenol [196, 256]. Products
in brackets could not be identified, but probably are formed as observed in other
reactions involving phenoxyradicals [256]. We also detected additional peaks
with retention times that would fit to those expected for 2-phenoxy-phenol and
diphenyl-peroxide. Other hypothetical products potentially could be formed
from the addition of ·NO, ·NO2 or ·OH to an oxygen-centered phenoxyradical
leading to the highly unstable benzene-nitrite, benzene-nitrate and benzene-
hydroperoxide. The major products 2-,4-hydroxy- and nitro-phenols [62, 145] are
formed as discussed below. p-benzoquinone probably is an oxidation product of
hydroquinone and 4-nitro-catechol a nitration product of catechol as postulated
for the reaction of salicylate with PN [65].
This sequence of reactions with ·NO2 and ·OH radicals forming phenoxyradi-cals also explains why an excess of phenol leads to lower yields of nitro-phenols
and to higher amounts of dimerization products. It is worth mentioning that the
nitration of phenol has a second maximum between pH 9 and 12 with only low
activities at pH 8. We suggest that beyond the pKa of phenol at ≈10 increasingphenolate anion formation must occur and this would lead to a facilitated

5 DISCUSSION 104
Figure 96: Postulated mechanism of phenol nitration, nitrosylation, hydroxylation and
dimerization by PN.
abstraction of an electron and hence to higher yields of phenoxyradicals. Alter-
natively, the ·NO2 radical could add directly to the highly activated phenolate
ring. It should be noted that at pH 11 PN is stable for longer than 5 min,
allowing incubations for a longer time period in order to have all PN reacted.
The most striking support for a phenoxyradical intermediate is the lack of
nitration with anisol. The methoxy group has similar electronic effects as the
hydroxy group and if nitration would occur as an addition of ·NO2 to the
aromatic ring followed by subsequent one-electron oxidation it should also take
place with anisol. In contrast, the hydroxylation of anisol was comparable
to phenol hydroxylation by PN suggesting that the hydroxyl radical is strong
enough for an addition to the aromatic ring (see Fig.97). Whether the ·NO2
radical is able to cause the rearomatization or whether an excited state of
peroxynitrous acid is required cannot be answered from our present experiments.
Physiological concentrations of PN are normally in the nanomolar range, only
under pathophysiological conditions it can reach the micromolar range [5, 63].

5 DISCUSSION 105
Figure 97: Postulated mechanism of anisol hydroxylation by PN.
Therefore systems have been developed to simulate these physiological concen-
trations. Low fluxes of PN can be produced from SIN-1 or by coupling superox-
ide sources, e.g. xanthine oxidase/xanthine with NO-donors such as NONOates
[22, 243]. But at physiological fluxes of PN we have the same situation as shown
in Fig.22. Decreasing PN concentration has the same effect as increasing phenol
or tyrosine concentration. Due to the large excess of tyrosine (1 mM) the prob-
ability for PN (10-20 nmol/min) to react two times with one tyrosine molecule
or for a ·NO2 radical to meet a tyrosyl radical is small. Instead the reaction of
two tyrosyl radicals to form 3,3’-dityrosine is preferred as shown in Fig.29,30
[242]. Hence protein-bound tyrosine is not likely to dimerize, 3,3’-DT containing
proteins are rare in vivo, nitration is more likely [11, 118, 257].
5.2 The Nature of Peroxynitrite-mediated Reactions and
the Requirements for Potent Inhibitors
Our different test systems were examples for the double sided nature of PN-
mediated reactions. As already pointed out in the short introduction for this
topic, PN can react either by 1e-oxidations (e.g. nitration and hydroxylation
of phenolic compounds) or by 2e-oxidations (e.g. sulfoxidation). 1e-oxidations
are rather mediated by the protonated form of PN (ONOOH) or its activated
form ONOOH∗, which seems to posess similar reactivity as the radical cage of
[ONO· ·OH], in which each of the radicals can abstract an electron from a targetmolecule [75]. 2e-oxidations are mostly mediated by the anionic form of PN
(ONOO−) via oxene transfer, but also require more specific targets, e.g. thiols,
thioethers, selenium compounds or metals which can stabilize oxo-complexes
(e.g. MnIII to Mn=OV ) [84, 86, 50]. The 2e-oxidation formally follows a
heterolytic cleavage of the OO-bond in PN and this would yield nitrite as a
byproduct in such reactions. Indeed, increased levels of nitrite could be found
in reactions of ebselen with PN (result was not shown). But it is known that
there is no clearcut reaction mechanism, neither for the protonated nor for the
anionic form. This means, if the reaction of PN-anion with the target is too
slow, then dimerization of PN will yield intermediates which are also able to
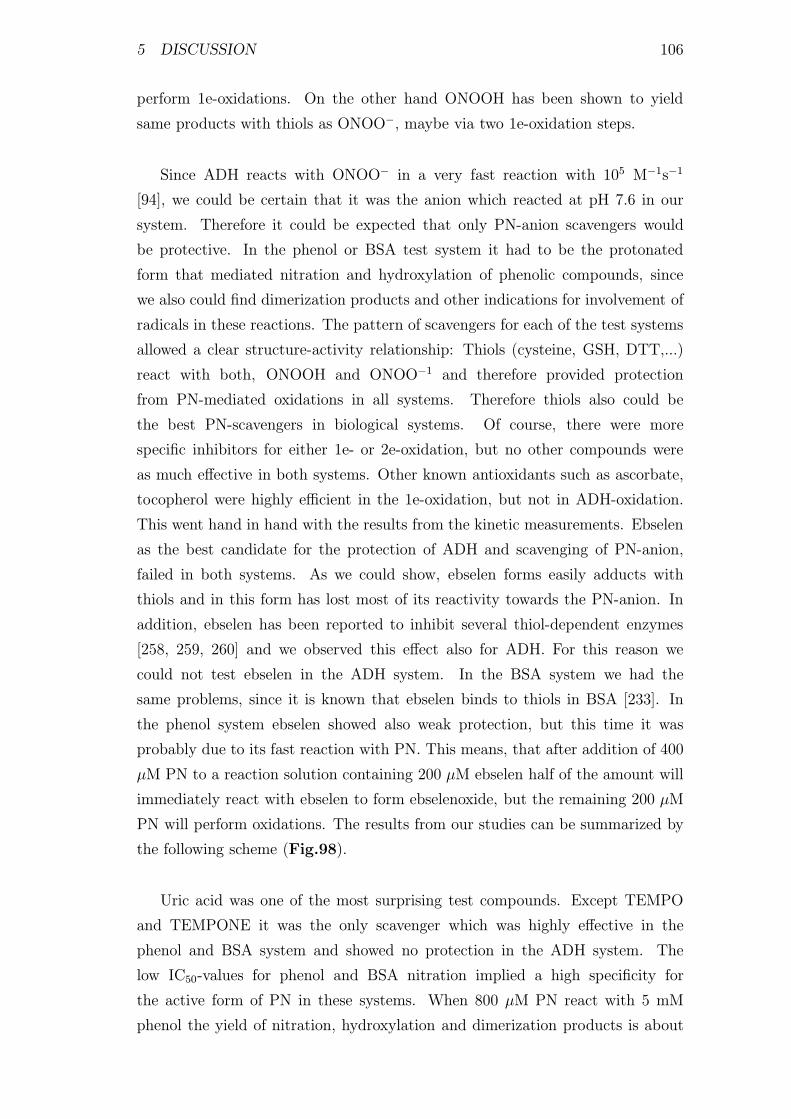
5 DISCUSSION 106
perform 1e-oxidations. On the other hand ONOOH has been shown to yield
same products with thiols as ONOO−, maybe via two 1e-oxidation steps.
Since ADH reacts with ONOO− in a very fast reaction with 105 M−1s−1
[94], we could be certain that it was the anion which reacted at pH 7.6 in our
system. Therefore it could be expected that only PN-anion scavengers would
be protective. In the phenol or BSA test system it had to be the protonated
form that mediated nitration and hydroxylation of phenolic compounds, since
we also could find dimerization products and other indications for involvement of
radicals in these reactions. The pattern of scavengers for each of the test systems
allowed a clear structure-activity relationship: Thiols (cysteine, GSH, DTT,...)
react with both, ONOOH and ONOO−1 and therefore provided protection
from PN-mediated oxidations in all systems. Therefore thiols also could be
the best PN-scavengers in biological systems. Of course, there were more
specific inhibitors for either 1e- or 2e-oxidation, but no other compounds were
as much effective in both systems. Other known antioxidants such as ascorbate,
tocopherol were highly efficient in the 1e-oxidation, but not in ADH-oxidation.
This went hand in hand with the results from the kinetic measurements. Ebselen
as the best candidate for the protection of ADH and scavenging of PN-anion,
failed in both systems. As we could show, ebselen forms easily adducts with
thiols and in this form has lost most of its reactivity towards the PN-anion. In
addition, ebselen has been reported to inhibit several thiol-dependent enzymes
[258, 259, 260] and we observed this effect also for ADH. For this reason we
could not test ebselen in the ADH system. In the BSA system we had the
same problems, since it is known that ebselen binds to thiols in BSA [233]. In
the phenol system ebselen showed also weak protection, but this time it was
probably due to its fast reaction with PN. This means, that after addition of 400
µM PN to a reaction solution containing 200 µM ebselen half of the amount will
immediately react with ebselen to form ebselenoxide, but the remaining 200 µM
PN will perform oxidations. The results from our studies can be summarized by
the following scheme (Fig.98).
Uric acid was one of the most surprising test compounds. Except TEMPO
and TEMPONE it was the only scavenger which was highly effective in the
phenol and BSA system and showed no protection in the ADH system. The
low IC50-values for phenol and BSA nitration implied a high specificity for
the active form of PN in these systems. When 800 µM PN react with 5 mM
phenol the yield of nitration, hydroxylation and dimerization products is about
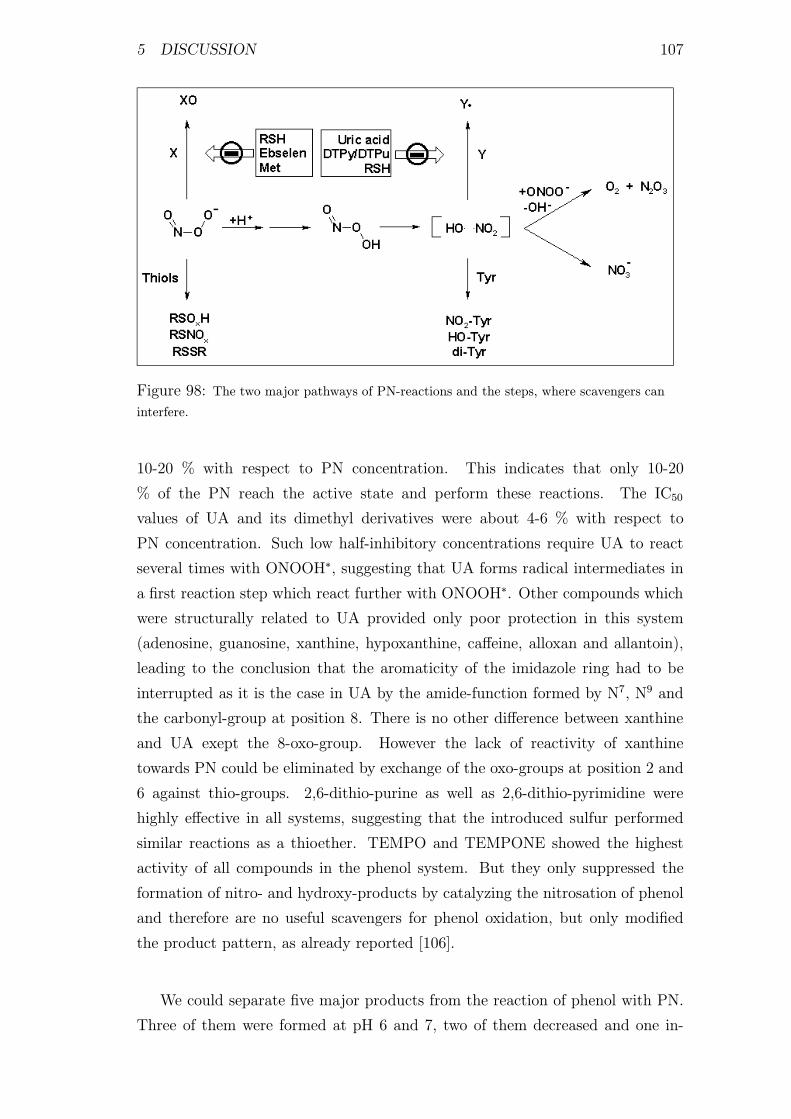
5 DISCUSSION 107
Figure 98: The two major pathways of PN-reactions and the steps, where scavengers can
interfere.
10-20 % with respect to PN concentration. This indicates that only 10-20
% of the PN reach the active state and perform these reactions. The IC50
values of UA and its dimethyl derivatives were about 4-6 % with respect to
PN concentration. Such low half-inhibitory concentrations require UA to react
several times with ONOOH∗, suggesting that UA forms radical intermediates in
a first reaction step which react further with ONOOH∗. Other compounds which
were structurally related to UA provided only poor protection in this system
(adenosine, guanosine, xanthine, hypoxanthine, caffeine, alloxan and allantoin),
leading to the conclusion that the aromaticity of the imidazole ring had to be
interrupted as it is the case in UA by the amide-function formed by N7, N9 and
the carbonyl-group at position 8. There is no other difference between xanthine
and UA exept the 8-oxo-group. However the lack of reactivity of xanthine
towards PN could be eliminated by exchange of the oxo-groups at position 2 and
6 against thio-groups. 2,6-dithio-purine as well as 2,6-dithio-pyrimidine were
highly effective in all systems, suggesting that the introduced sulfur performed
similar reactions as a thioether. TEMPO and TEMPONE showed the highest
activity of all compounds in the phenol system. But they only suppressed the
formation of nitro- and hydroxy-products by catalyzing the nitrosation of phenol
and therefore are no useful scavengers for phenol oxidation, but only modified
the product pattern, as already reported [106].
We could separate five major products from the reaction of phenol with PN.
Three of them were formed at pH 6 and 7, two of them decreased and one in-

5 DISCUSSION 108
creased at alkaline pH. At pH 8 and 9 two new products appeared, one of them
was not stable and formed another new product when standing for longer times.
These products were isolated from HPLC and investigated by MS- and NMR-
analysis, but no results could be obtained from these measurements. These ob-
servations were in agreement with detected tadical intermediates during reactions
of UA with PN and poor stability of oxidized products [4, 230].
5.2.1 Pitfalls when Using Ebselen as a Scavenger in Biological Sys-
tems
There are several aspects of the results presented. First, the unexpected lack
of protection by ebselen of PGI2 synthase nitration and inhibition has found an
explanation which is consistent with the high reactivity of ebselen with thiol com-
pounds [236, 232, 233]. Given to in vitro preparations of aortic rings ebselen is
present almost exclusively as its adducts to thiols. Due to its high concentration
of about 5 mM in cells GSH is a favorite reactant but some protein-bound thi-
ols/thiolates can even be more nucleophilic and therefore could also form adducts.
Figure 99: Chemistry of the system ebselen, glutathione and peroxynitrite.
Our results can be summarized by Fig.99, which also includes the known
complex chemistry, ebselen can perform under physiological conditions. These
numerous reactions and equilibria, that take place in this system are also the
reason why we could not determine a kinetic constant for the reaction of PN
with ebselen-GSH adduct. There are several species absorbing in the same
wavelength region and thus complicating such kinetic measurements, but at least
one can qualitatively see a much slower reaction compared with ebselen itself
(see Fig.47 and 48). As shown in Fig.99 GSH also reacts with PN (6), as
already described [144]. So it is impossible to distinguish in the kinetics between
effects which originate from ebselen, GSH or ebselen-GSH adduct. We could not
5 DISCUSSION 109
determine, whether the reactivity towards PN in a ebselen and GSH containing
system comes from the small amount of ”free” ebselen (1) which is formed by
a slow equilibrium from the adduct (3) (if so it must be very slow, or else one
would not get a peak for the adduct in HPLC), or whether it comes directly
from the adduct. The latter would mean that a reaction from the adduct (3) to
the ebselenoxide (2) is possible, but then the question is what happens to the
ebselen-bound GSH? Ebselenoxide (2) can be converted back to ebselen (1) by
two molecules of GSH [144]. Another possibility is the conversion of the adduct
(3) to the corresponding selenol (4) by one molecule of GSH followed by the
reaction with another molecule of ebselen to give the diselenide (5) [232]. Of
course also (4) and (5) may react with PN.
So the mechanism of ebselen inactivation towards PN is complex, but this
reaction scheme fits to the observations made in this study: ebselen binds to
thiols and forms isolatable adducts. These systems show a decreased reactivity
towards PN-anion, at least comparable to that of other tested seleno-compounds
such as Se-methionine [85, 86]. Therefore the loss of reactivity of ebselen towards
PN in biological systems seems to be due to this thiol-binding, hence in the
absence of any thiols as shown after preincubation with Ellman’s reagent ebselen
can well compete with microsomal PGI2 synthase for PN. Although the ebselen
adducts reacted too slow to protect PGI2 synthase they could interact with PN
and therefore at least could still function as antioxidants in cells. Therefore the
free radical nitration of phenol could be inhibited. In the context of PN nitration
of PGI2 synthase the results lend support to our mechanistic proposal that PN
reacts as its anion directly at the ferric heme and that the nitrated tyrosine must
be at the active site as judged from the protection against nitration by quasi-
substrates blocking the substrate binding site [12]. Thus, by kinetic and steric
reasons none of the known antioxidants was able to interfer with this process. In
case of an initially assumed inhibitory action of ebselen it might have been possible
to decide whether the nitration of PGI2 synthase, which now has been identified
to occur during atherosclerosis [173] and endotoxin exposure of aortic rings [167]
is only a pathological and damaging process or whether the simultaneous trapping
of ·NO and PGI2 by superoxide generation is a physiological reaction required forhost defense and cellular activation.

5 DISCUSSION 110
5.3 Spectral Intermediates During Reaction of PN
with Transition-metals and Their Effects on PN-
decomposition and PN-mediated Nitration
The experimental design of our study allows to conclude on a catalytic role
of ferric complexes in the decomposition of PN. Not only the decrease of the
absorbance of PN at 302 nm was enhanced but also the kinetics of dioxygen
formation as a consequence of PN disproportionation were increased to a similar
extent [163]. Since a molar ratio of Fe(III) complex to PN in the range of 1 :
100 was used a catalytic cycle must have been involved. Repetitive additions of
PN to NOR resulted in the same kinetics and indicated that true catalysis took
place. The catalytic cycle starts with a reaction of the ferric complex with the
PN anion since the pH-dependence indicates a higher efficiency of iron catalysis
compared to the metal-free decomposition at pH-values above the pK of PN.
MP-11, NOR and other heme thiolate proteins and a HRP-ascorbate coupled
system were the best candidates to promote the catalytic decomposition of PN
with NOR and CPO exhibiting even higher turnover numbers than MP-11.
Catalase and MPO were inactive [116, 163].
The resulting species from the interaction of NOR with PN absorbs at 435
nm and is formed in a rapid reaction with a fully developed spectrum already
80 ms after mixing [163]. Its subsequent decomposition back to the ferric NOR
in presence of an excess of PN occurs with a half-life time of 2.9 s which is
in the same range as the kinetics of the decrease of PN measured at 302 nm
or the increase in dioxygen formation (it has to be mentioned that there are
minor differences in pH and temperature of these different assays) [163]. From
this one can conclude that the second reaction step involving the decay of the
primary product represents the rate-limiting step in the cycle. Concerning the
nature of the primary intermediate one can assume a higher oxidation state of
the heme iron which could be either the ferryl (FeIV=O) or perferryl (FeV=O).
For NOR or other P450 enzymes the exact absorbance spectra of such species
is not known, but for HRP the observed Soret absorbance (shift from 398 to
418 nm in a difference spectrum) has been reported to correspond to a ferryl
complex [102]. Thus the first reaction would result in a ferryl species in addition
to the ·NO2 radical [175]. In the subsequent and rate-limiting reaction the
ferryl complex can oxidize a second PN molecule resulting in dioxygen and
·NO formation the latter combining with the remaining ·NO2 to N2O3. For
HRP this is a slow reaction. For MP-11 it becomes faster and for NOR and

5 DISCUSSION 111
CPO it proved to be a very fast process determining the efficacy to decompose PN.
Alternatively to this 1e-oxidation of PN an electronic rearrangement between
the ferryl species and the ·NO2 radical could give nitrate and the ferric complex
as described for hemoglobin [98] and metal porphyrins [104, 238] at nearly equal
concentrations of PN to metal porphyrin. Both pathways seem to be functional
since no significant change in the nitrite/nitrate ratio by NOR or MP-11 with
PN ratios of 1 : 100 was observed. This, however, must be a function of PN
concentration since at a low PN : enzyme ratio the disproportionation becomes
less likely.
The postulate of a ferryl complex was fully compatible with the observed re-
activity of phenol in the system and earlier reports about increased nitration in
presence of metal-catalysts [174, 152]. The increase of nitro- and dimerization-
products allow to conclude on phenoxy radicals as intermediates. It was impor-
tant that unlike the metal-free decomposition of PN no hydroxylated phenols
were formed in the presence of ferric complexes which agrees with the formation
of a ferryl species instead of a quasi-OH radical species derived from the pro-
tonated PN (see Fig.100). If the ferryl-nitrogen dioxide pair could react with
phenol as well as with PN then a competition between both reaction pathways
could be expected and indeed was found. Hence the following reaction cycle
meets all experimental data (Fig.101). By comparison with the mechanism of
the proton-catalyzed pathway of PN action (see Fig.100) it is evident that the
ferryl ion substitutes for the OH-radical-like species which explains the loss of
hydroxylating capability but the retention of the nitrating power.
This would explain that the yield of nitration parallels the decay kinetics
since during the lifetime of PN more can be diverted to the ferryl-nitrogen
dioxide pathway instead to the proton-catalyzed pathway. A reason for this
higher reactivity of the P450’s towards PN may be related to the nature of the
iron-thiolate structure which by having a partial covalent character could enhance
the reactivity of the oxo-species by preventing back-bonding as postulated for the
iron-oxene complex FeV=0 ↔ FeIV -O· [191]. Thus, the thiolate ligand not onlyinfluences the reactivity of the oxene complex (Compound I) in monooxygenases,
but also of the ferryl complex (Compound II) (see equations 55 and 56) which
so far has not yet been clearly identified with P450 enzymes, but UV/Vis and
resonance Raman spectras exist for CPO Compound II [239, 253].
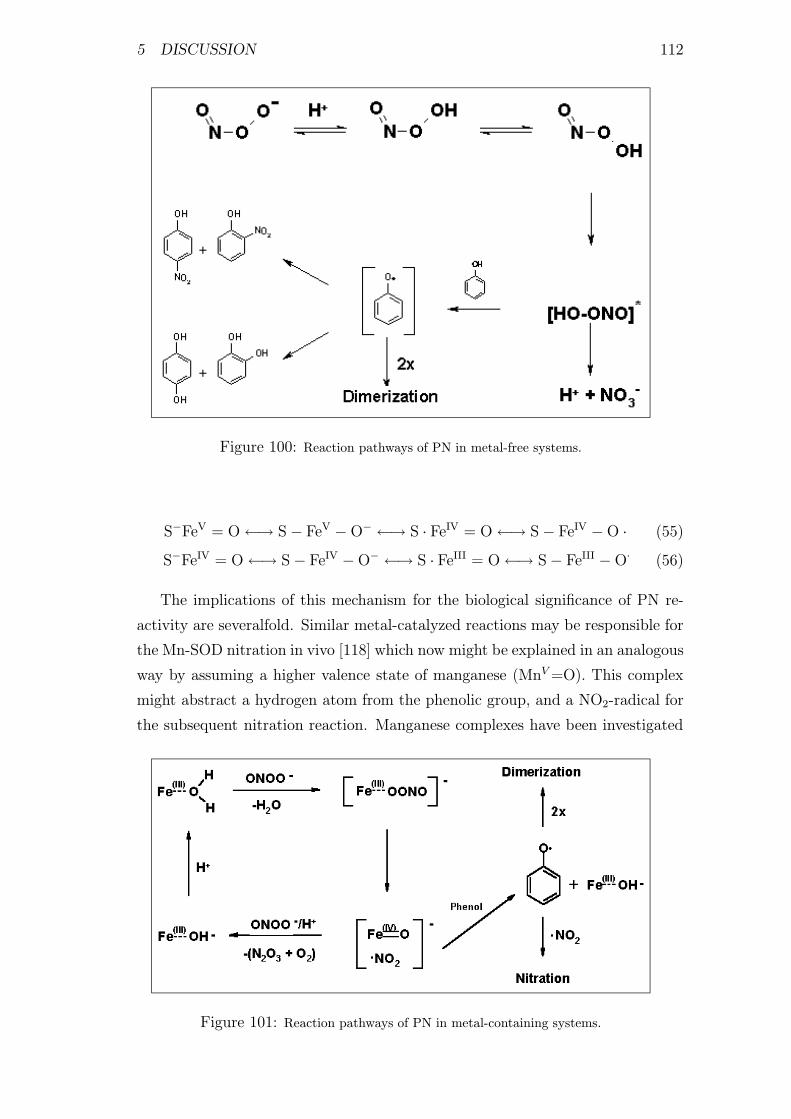
5 DISCUSSION 112
Figure 100: Reaction pathways of PN in metal-free systems.
S−FeV = O←→ S− FeV −O− ←→ S · FeIV = O←→ S− FeIV −O · (55)
S−FeIV = O←→ S− FeIV −O− ←→ S · FeIII = O←→ S− FeIII −O· (56)
The implications of this mechanism for the biological significance of PN re-
activity are severalfold. Similar metal-catalyzed reactions may be responsible for
the Mn-SOD nitration in vivo [118] which now might be explained in an analogous
way by assuming a higher valence state of manganese (MnV=O). This complex
might abstract a hydrogen atom from the phenolic group, and a NO2-radical for
the subsequent nitration reaction. Manganese complexes have been investigated
Figure 101: Reaction pathways of PN in metal-containing systems.
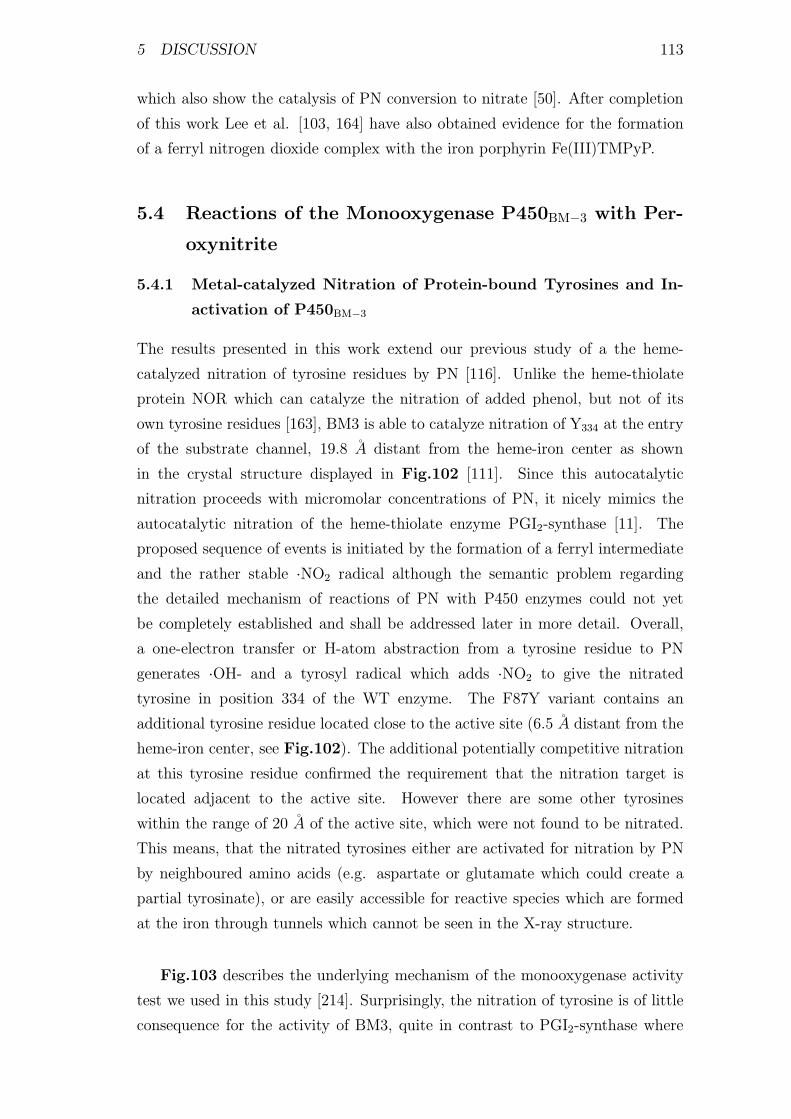
5 DISCUSSION 113
which also show the catalysis of PN conversion to nitrate [50]. After completion
of this work Lee et al. [103, 164] have also obtained evidence for the formation
of a ferryl nitrogen dioxide complex with the iron porphyrin Fe(III)TMPyP.
5.4 Reactions of the Monooxygenase P450BM−3 with Per-
oxynitrite
5.4.1 Metal-catalyzed Nitration of Protein-bound Tyrosines and In-
activation of P450BM−3
The results presented in this work extend our previous study of a the heme-
catalyzed nitration of tyrosine residues by PN [116]. Unlike the heme-thiolate
protein NOR which can catalyze the nitration of added phenol, but not of its
own tyrosine residues [163], BM3 is able to catalyze nitration of Y334 at the entry
of the substrate channel, 19.8 A distant from the heme-iron center as shown
in the crystal structure displayed in Fig.102 [111]. Since this autocatalytic
nitration proceeds with micromolar concentrations of PN, it nicely mimics the
autocatalytic nitration of the heme-thiolate enzyme PGI2-synthase [11]. The
proposed sequence of events is initiated by the formation of a ferryl intermediate
and the rather stable ·NO2 radical although the semantic problem regarding
the detailed mechanism of reactions of PN with P450 enzymes could not yet
be completely established and shall be addressed later in more detail. Overall,
a one-electron transfer or H-atom abstraction from a tyrosine residue to PN
generates ·OH- and a tyrosyl radical which adds ·NO2 to give the nitrated
tyrosine in position 334 of the WT enzyme. The F87Y variant contains an
additional tyrosine residue located close to the active site (6.5 A distant from the
heme-iron center, see Fig.102). The additional potentially competitive nitration
at this tyrosine residue confirmed the requirement that the nitration target is
located adjacent to the active site. However there are some other tyrosines
within the range of 20 A of the active site, which were not found to be nitrated.
This means, that the nitrated tyrosines either are activated for nitration by PN
by neighboured amino acids (e.g. aspartate or glutamate which could create a
partial tyrosinate), or are easily accessible for reactive species which are formed
at the iron through tunnels which cannot be seen in the X-ray structure.
Fig.103 describes the underlying mechanism of the monooxygenase activity
test we used in this study [214]. Surprisingly, the nitration of tyrosine is of little
consequence for the activity of BM3, quite in contrast to PGI2-synthase where

5 DISCUSSION 114
Figure 102: X-ray structure of BM3 WT without the reductase domain. All tyrosine
residues in the heme-domain are marked. Special thanks to Michael Schurle for rendering
this structure.
tyrosine nitration is the predominant enzyme-inactivating modification. How-
ever, as judged from the peak areas in chromatograms of trypsin-degraded BM3
WT incubated with different concentrations of PN, the observed IC50-value for
inactivation of 2-3 µM PN was too low to yield significant nitration. We therefore
consider the possibility of additional oxidation of an essential sulfhydryl group.
Indeed, the reductase domain contains a thiol important for the activity, in agree-
ment with the observed inhibition by ebselen [245]. PN-dependent thiol modifi-
cation is a well-known phenomenon [83, 137], and the fact that enzyme activity
could be partly restored by incubation with DTT at concentrations which do not
reduce 3-NT suggests PN-dependent thiol modification of BM3. Furthermore the
activity of the reductase in the NADPH-dependent reduction of cytochrome c is
inhibited by PN in a concentration-dependent way similar to what was observed
for the inactivation of the monooxygenase activity. Furthermore, we could show
by using the thiol-group determination reagent DTBP [218], that 2 thiol-groups
per enzyme molecule were oxidized at 10-fold molar excess of PN with respect to

5 DISCUSSION 115
the enzyme. This result supports the hypothesis that oxidation of a thiol group
rather than tyrosine nitration is responsible for enzyme inactivation.
Figure 103: Underlying mechanism for the monooxygenase activity assay of BM3.
5.4.2 Nitration of Tyrosines under Biological Conditions
Apart from the special significance for heme-thiolate proteins our results allow
to address the controversial problem of PN-mediated tyrosine nitration in vivo.
Pfeiffer and Mayer [22] questioned the biological relevance of PN-mediated
tyrosine nitration, since in their experiments a simultaneous generation of
superoxide and ·NO did not lead to a higher nitration of free tyrosine as ·NOalone. This was probably due to high yields of 3,3’-DT, which was described
to be the major product in reactions of Tyr with ·NO2 [242]. Here, we clearly
show that ·NO and O·−2 , simultaneously generated by SIN-1 or a XO/NONOate
system, do nitrate tyrosine (Fig.104 explains the mechanism by which SIN-1
forms PN and NONOate forms ·NO). This nitration could be suppressed byCu,Zn-SOD to the levels obtained with ·NO alone from spermine NONOate.
The nitration by ·NO was significantly lower and depended on the oxygen
concentration. Meanwhile the experiments of Pfeiffer and Mayer have been
extended and the results were corrected with respect to the high yields of 3,3’-DT
and to errors in their experimental setup [243].
Two arguments can be brought up to explain the reasons for the discrep-
ancy between the results with free tyrosine and those obtained in our enzymatic
systems. First, if an excess of tyrosine reacts with PN, the intermediate ·NO2
radical can competitively react with tyrosine to form another tyrosyl radical fol-

5 DISCUSSION 116
Figure 104: Mechanism for the for-
mation of PN by SIN-1 and of ·NO by
NONOate.
lowed by dimerization to 3,3’-dityrosine [242]. Second, the presence of the ferric
heme acts as an efficient catalyst for the nitration according to mechanisms estab-
lished previously [163]. The same applies for other metallo-enzymes like P4502B1
[123], Mn-SOD [118] and the copper ions in tyrosine hydroxylase and Cu,Zn-
SOD [113, 120]. Thus, autocatalysis by enzyme-bound transition metals results
in a higher specificity of PN under physiological conditions. However, other non-
transition metal containing proteins such as the SR Ca-ATPase have also been
nitrated with high yields in vitro by both systems, PN and various concentrations
of SIN-1 [122, 149].
5.4.3 Spectral Intermediates During Reactions of P450 Enzymes and
PN
Stopped-flow studies of the reaction between an excess PN and BM3 at neutral
pH indicate that this enzyme is not an efficient catalyst for the decomposition of
peroxynitrous acid (ONOOH) as there is no significant difference in the PN decay
rate in the presence or in the absence of the enzyme. In contrast, when less than
1 % CPO is reacted with PN at neutral pH the half-time for the disappearance
of the characteristic absorbance at 302 nm is about one third of that measured
under the same conditions but in the absence of CPO. Although both enzymes
increased the velocity of PN-decomposition at pH 8 and 9 [116, 163]. The rapid
reaction of CPO with PN yields the ferryl, iron(IV)-form of CPO (Compound
II) [239]. This reaction is likely to proceed via a one-electron oxidation of native
CPO by PN to Compound II and nitrogen dioxide, as already proposed for the
reaction of PN with NOR [163]. However, it cannot be excluded that, in a first
step, PN reacts with native CPO to the two-electron oxidized species Compound
I and nitrite, which then react very rapidly to the observed Compound II and
·NO2. CPO Compound I is partly formed when the enzyme is reacted with an
excess of H2O2 and decays back to native CPO with an observed rate constant
of about 0.3 s−1 [261].
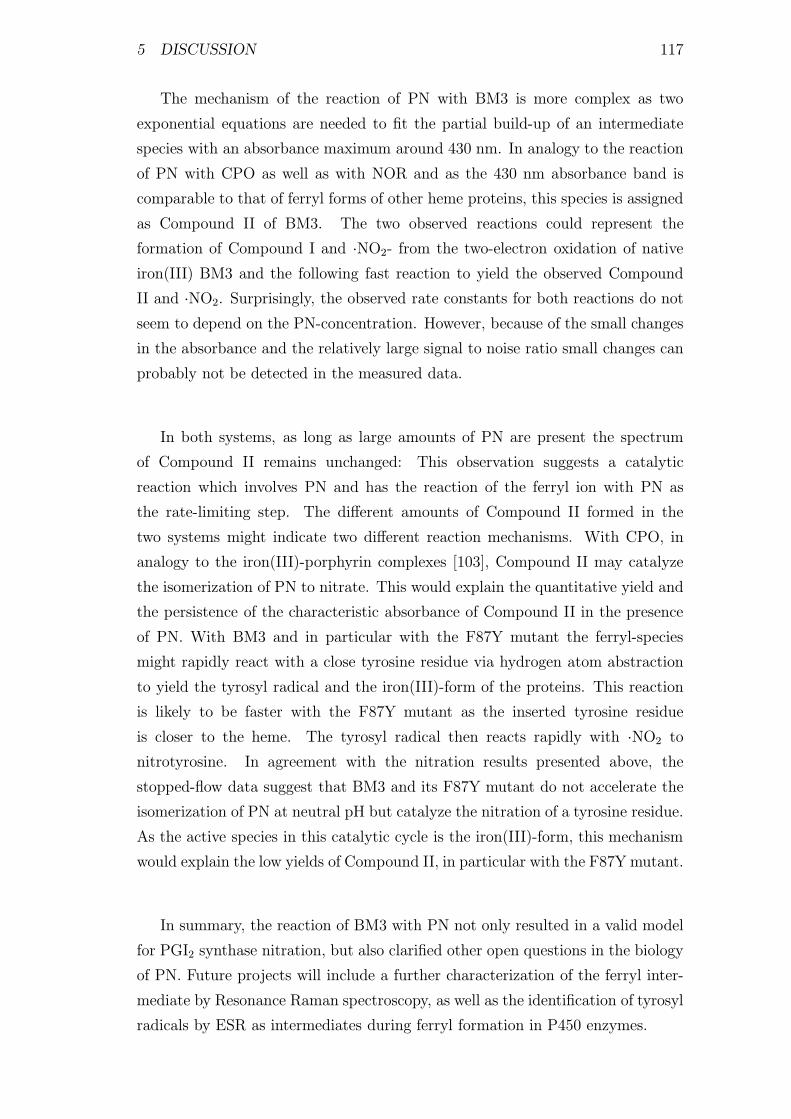
5 DISCUSSION 117
The mechanism of the reaction of PN with BM3 is more complex as two
exponential equations are needed to fit the partial build-up of an intermediate
species with an absorbance maximum around 430 nm. In analogy to the reaction
of PN with CPO as well as with NOR and as the 430 nm absorbance band is
comparable to that of ferryl forms of other heme proteins, this species is assigned
as Compound II of BM3. The two observed reactions could represent the
formation of Compound I and ·NO2- from the two-electron oxidation of native
iron(III) BM3 and the following fast reaction to yield the observed Compound
II and ·NO2. Surprisingly, the observed rate constants for both reactions do not
seem to depend on the PN-concentration. However, because of the small changes
in the absorbance and the relatively large signal to noise ratio small changes can
probably not be detected in the measured data.
In both systems, as long as large amounts of PN are present the spectrum
of Compound II remains unchanged: This observation suggests a catalytic
reaction which involves PN and has the reaction of the ferryl ion with PN as
the rate-limiting step. The different amounts of Compound II formed in the
two systems might indicate two different reaction mechanisms. With CPO, in
analogy to the iron(III)-porphyrin complexes [103], Compound II may catalyze
the isomerization of PN to nitrate. This would explain the quantitative yield and
the persistence of the characteristic absorbance of Compound II in the presence
of PN. With BM3 and in particular with the F87Y mutant the ferryl-species
might rapidly react with a close tyrosine residue via hydrogen atom abstraction
to yield the tyrosyl radical and the iron(III)-form of the proteins. This reaction
is likely to be faster with the F87Y mutant as the inserted tyrosine residue
is closer to the heme. The tyrosyl radical then reacts rapidly with ·NO2 to
nitrotyrosine. In agreement with the nitration results presented above, the
stopped-flow data suggest that BM3 and its F87Y mutant do not accelerate the
isomerization of PN at neutral pH but catalyze the nitration of a tyrosine residue.
As the active species in this catalytic cycle is the iron(III)-form, this mechanism
would explain the low yields of Compound II, in particular with the F87Y mutant.
In summary, the reaction of BM3 with PN not only resulted in a valid model
for PGI2 synthase nitration, but also clarified other open questions in the biology
of PN. Future projects will include a further characterization of the ferryl inter-
mediate by Resonance Raman spectroscopy, as well as the identification of tyrosyl
radicals by ESR as intermediates during ferryl formation in P450 enzymes.
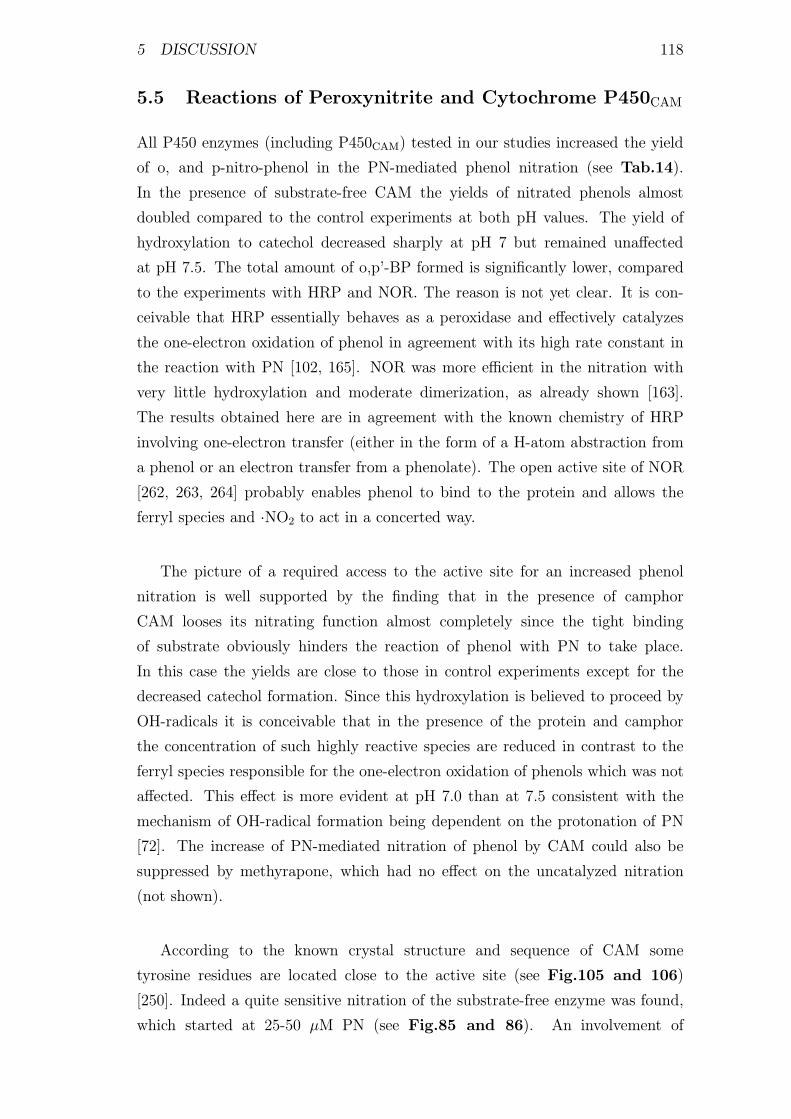
5 DISCUSSION 118
5.5 Reactions of Peroxynitrite and Cytochrome P450CAM
All P450 enzymes (including P450CAM) tested in our studies increased the yield
of o, and p-nitro-phenol in the PN-mediated phenol nitration (see Tab.14).
In the presence of substrate-free CAM the yields of nitrated phenols almost
doubled compared to the control experiments at both pH values. The yield of
hydroxylation to catechol decreased sharply at pH 7 but remained unaffected
at pH 7.5. The total amount of o,p’-BP formed is significantly lower, compared
to the experiments with HRP and NOR. The reason is not yet clear. It is con-
ceivable that HRP essentially behaves as a peroxidase and effectively catalyzes
the one-electron oxidation of phenol in agreement with its high rate constant in
the reaction with PN [102, 165]. NOR was more efficient in the nitration with
very little hydroxylation and moderate dimerization, as already shown [163].
The results obtained here are in agreement with the known chemistry of HRP
involving one-electron transfer (either in the form of a H-atom abstraction from
a phenol or an electron transfer from a phenolate). The open active site of NOR
[262, 263, 264] probably enables phenol to bind to the protein and allows the
ferryl species and ·NO2 to act in a concerted way.
The picture of a required access to the active site for an increased phenol
nitration is well supported by the finding that in the presence of camphor
CAM looses its nitrating function almost completely since the tight binding
of substrate obviously hinders the reaction of phenol with PN to take place.
In this case the yields are close to those in control experiments except for the
decreased catechol formation. Since this hydroxylation is believed to proceed by
OH-radicals it is conceivable that in the presence of the protein and camphor
the concentration of such highly reactive species are reduced in contrast to the
ferryl species responsible for the one-electron oxidation of phenols which was not
affected. This effect is more evident at pH 7.0 than at 7.5 consistent with the
mechanism of OH-radical formation being dependent on the protonation of PN
[72]. The increase of PN-mediated nitration of phenol by CAM could also be
suppressed by methyrapone, which had no effect on the uncatalyzed nitration
(not shown).
According to the known crystal structure and sequence of CAM some
tyrosine residues are located close to the active site (see Fig.105 and 106)
[250]. Indeed a quite sensitive nitration of the substrate-free enzyme was found,
which started at 25-50 µM PN (see Fig.85 and 86). An involvement of
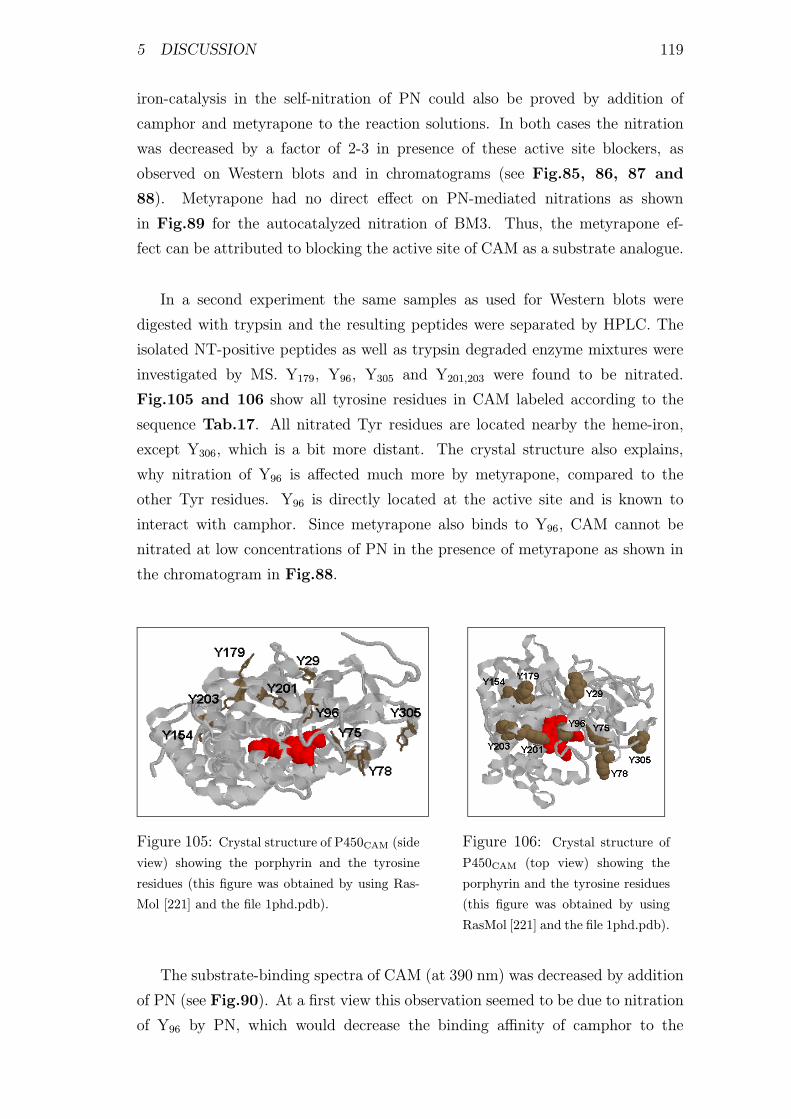
5 DISCUSSION 119
iron-catalysis in the self-nitration of PN could also be proved by addition of
camphor and metyrapone to the reaction solutions. In both cases the nitration
was decreased by a factor of 2-3 in presence of these active site blockers, as
observed on Western blots and in chromatograms (see Fig.85, 86, 87 and
88). Metyrapone had no direct effect on PN-mediated nitrations as shown
in Fig.89 for the autocatalyzed nitration of BM3. Thus, the metyrapone ef-
fect can be attributed to blocking the active site of CAM as a substrate analogue.
In a second experiment the same samples as used for Western blots were
digested with trypsin and the resulting peptides were separated by HPLC. The
isolated NT-positive peptides as well as trypsin degraded enzyme mixtures were
investigated by MS. Y179, Y96, Y305 and Y201,203 were found to be nitrated.
Fig.105 and 106 show all tyrosine residues in CAM labeled according to the
sequence Tab.17. All nitrated Tyr residues are located nearby the heme-iron,
except Y306, which is a bit more distant. The crystal structure also explains,
why nitration of Y96 is affected much more by metyrapone, compared to the
other Tyr residues. Y96 is directly located at the active site and is known to
interact with camphor. Since metyrapone also binds to Y96, CAM cannot be
nitrated at low concentrations of PN in the presence of metyrapone as shown in
the chromatogram in Fig.88.
Figure 105: Crystal structure of P450CAM (side
view) showing the porphyrin and the tyrosine
residues (this figure was obtained by using Ras-
Mol [221] and the file 1phd.pdb).
Figure 106: Crystal structure of
P450CAM (top view) showing the
porphyrin and the tyrosine residues
(this figure was obtained by using
RasMol [221] and the file 1phd.pdb).
The substrate-binding spectra of CAM (at 390 nm) was decreased by addition
of PN (see Fig.90). At a first view this observation seemed to be due to nitration
of Y96 by PN, which would decrease the binding affinity of camphor to the

5 DISCUSSION 120
enzyme, but CO-binding spectra of PN-treated CAM revealed (see Fig.91), that
additionally a conversion of the P450 to the P420 form occured. It is known,
that the P420 form of CAM is less efficient in binding the camphor molecule.
In decomposition kinetics of PN CAM showed a similar acceleration as the
other investigated P450 enzymes. In the presence of camphor this acceleration
decreased to the value of the uncatalyzed decomposition (see Fig.94). Contrary
to our previous observations neither camphor-free nor -containing CAM showed
the accumulation of a ferryl band (see Fig.92 and 93). The only observation
which could be made, was the conversion of the camphor-containing enzyme (390
nm) into the P420 form (416 nm) (see Fig.93). The substrate-free enzyme (417
nm) showed a similar kinetic behavior as NOR, BM3-WT and CPO, but the
yield of the ferryl intermediate (435 nm) was less (see Fig.92). If the absence
of a ferryl species is due to the easy oxidation of the thiolate ligand, to a slower
formation of the intermediate compared to its decomposition or to an effect at the
neighbouring Y96 will be examined as soon as another protein sample is available.
At present we favor the latter one, since BM3-F87Y also showed no ferryl band
and has a Tyr close to the active site. From these observations we suggest that
the ferryl intermediate can be trapped by a nearby Tyr, resulting in the ferric
iron complex together with a tyrosyl radical, which may react with the remaining
nitrogen dioxide from the first step. Whether a nitrated Tyr located at the active
site then sterically hinders another PN to reach the heme-iron or is able to react
a second time with a ferryl intermediate is not clear yet.

6 OUTLOOK 121
6 Outlook
Here are some topics that remained to clarify or for which we already have pre-
liminary data:
• The ferryl species, which is formed during reactions of P450 enzymes andPN have to be further characterized. Raman resonance measurements seem
to be suitable for this intention, since this technique has already been used
for the characterization of the ferryl species in CPO [253].
• CAM and the F87Y variant of BM3 showed no ferryl spectrum during their
reaction with PN. Since both have a tyrosine nearby the iron at the active
site, it is feasible that the ferryl is immediately trapped by these tyrosines.
In this case there should be a tyrosyl radical formed, which can be detected
by ESR spectrometry.
• By collaboration with Dr. Hager we will receive a sample of native CPO
and a mutant in which the heme-thiolate-containing cysteine is exchanged
by an alanine. We hope to find significant differences between these two
enzymes, which could give new insights in the importance of the thiolate
ligand during reactions with peroxides.
• We also plan to do experiments with non-heme proteins such as dopamine β-hydroxylase, which contains a sulfur coordinated copper ion (Cu2+). Since
we and others have shown that thiol oxidation could be a major pathway
by which PN inactivates enzymes (ADH, BM3, aconitase, GAPDH,...) po-
tentially all metal-sulfur containing proteins could be inactivated by PN.
β-hydroxylase could be a key to widespread PN-mediated damage during
neurodegenerative diseases (e.g. Parkinson).
7 SUMMARY 122
7 Summary
• The reaction mechanism of phenol with peroxynitrite was characterized.
This reaction was used as a model for PN-mediated nitration of tyrosine-
residues in proteins, especially in prostacyclin synthase. 2- and 4-nitro-
phenol as well as 2- and 4-hydroxy-phenol had already been identified as
major products of this reaction. In this work we identified 2,4’-biphenol
and 4-phenoxy-phenol as additional dimerization products, furthermore 2-
nitroso-phenol, 4-nitro-catechol and o-benzoquinone as additional products.
High yields of 4-nitroso-phenol at alkaline pH were found and a complete
picture of the dimerization product pattern was given, allowing to conclude
on phenoxy radicals as obligatory intermediates in this reaction. The latter
finding was also supported by the results obtained from reactions of anisol
with PN. Other new results concerned a maximum of nitrosation and oxygen
release at pH 9-10 and an involvement of radical species also at this pH.
• New scavengers for PN were identified and compared with known antiox-idants in different test systems. The choice of these test systems allowed
a detailed insight in the mechanism by which scavengers interact with PN.
Alcohol dehydrogenase reacts with the PN-anion and the enzyme is in-
activated by thioloxidation. Scavengers which are efficient in this system
also have to react with the PN-anion. We identified GSH, cysteine, Se-
methionine, dithio-purine and -pyrimidine as highly efficient in this system.
The scavenger concentration for the half-maximal protection were in the
range of 15-45 µM, in a system where 26 nM ADH were inactivated by 20
µM PN. Uric acid and its dimethyl analogues, ebselen and ascorbate were
inefficient in this system.
Phenol nitration and hydroxylation as well as nitration of BSA requires
peroxynitrous acid or its activated intermediate as the reactive species. In
these test systems uric acid and its 1,3- and 3,7- dimethyl analogues, 2-
thio-barbituric acid, 2,6-dithio-purine and -pyrimidine were highly efficient
in the inhibition the nitration and hydroxylation of phenol, followed by cys-
teine and ascorbate, which were especially less efficient in the suppression
of hydroxylation. Methionine, Se-methionine and GSH were less efficient
in both. The trend in the BSA system was similar. Scavengers which
could accelerate the decomposition of PN could also have benefical effects
on PN-mediated oxidations. Phosphine and pyruvate showed high effects
on PN-decay, pyruvate even seemed to react in a catalytic manner, but also
increased the nitration of phenol.

7 SUMMARY 123
Ebselen is known to react very fast with the PN-anion. Nevertheless it
was inefficient in our systems. Ebselen could also not protect PGIS from
inactivation by PN, due to adduct formation with thiols. The ebselen-GSH
adduct was identified and isolated by HPLC. The reaction of this adduct
with PN was very slow, but ebselen could protect PGIS from inactivation,
when thiol groups in microsomes were blocked with Ellmans reagent.
• Heme- and heme-thiolate proteins had a high catalytic effect on this nitra-tion. P450NOR, P450BM−3, chloroperoxidase and microperoxidase not only
showed high effects on the nitration and dimerization increase, but also
on the decrease of hydroxylation. Furthermore P450NOR and CPO were
most efficient in catalyzing the decomposition of PN. We identified a ferryl
intermediate in the reactions of P450NOR, P450BM−3 and CPO with PN.
Our results point towards a special role of the thiolate-ligand for the reac-
tivity of the ferryl intermediate. This high reactivity could be related to
a partial radical character of the sulfur in Compound II of P450 enzymes
(S-Fe-O· ↔S·Fe=O).
• P450BM−3 started to be nitrated at 0.5 µM PN and was inactivated with an
IC50-value of 2-3 µM. Y334 was found to be nitrated in the wildtype enzyme,
Y87 and Y334 were nitrated in the F87Y variant. Our studies revealed, that
the inactivation was not due to nitration, but due to thioloxidation in the
reductase domain. Stopped-flow measurements revealed the formation of
a ferryl species during reactions of P450BM−3 and CPO with PN and sec-
ond order rate constants of k(BM3)=2x10⁵ M−1s−1 and of k(CPO)=1x10⁶
M−1s−1 for this process.
• P450CAM started to be nitrated at 25 µM PN. Y179, Y96, Y305 and
Y201,203 were found to be nitrated after treatment with 250 µM PN. When
metyrapone was added, which blocks the active site, the nitration was de-
creased by a factor of 2-3. Treatment with PN decreased the camphor-
binding spectrum of P450CAM and resulted in the oxidized P420-species.
P450CAM could catalyze the decomposition of PN. In stopped-flow spectra
no ferryl species could be observed, a similar behavior was observed as for
the F87Y variant of P450BM−3.
7.1 Zusammenfassung
• Es wurde ein wesentlicher Beitrag zur Aufklarung des Reaktionsmechanis-mus von Peroxynitrit (PN) mit Phenol geleistet. Diese Reaktion wurde
7 SUMMARY 124
als Modell fur die Nitrierung von Tyrosinresten in Proteinen durch PN be-
nutzt, speziell in der Prostacyclin Synthase. Sowohl 2- und 4-Nitrophenol,
als auch 2- und 4-Hydroxyphenol wurden schon in der Vergangenheit als
Hauptprodukte dieser Reaktion beschrieben. In dieser Arbeit wurden
zusatzlich 2,4’-Biphenol und 4-Phenoxyphenol als Dimerisierungsprodukte
identifiziert, als auch 2-Nitrosophenol, 4-Nitrocatechol und o-Benzochinon
als neue Oxidationsprodukte. Hohe Ausbeuten an 4-Nitrosophenol im
alkalischen pH Bereich wurden nachgewiesen und ein komplettes Bild
des Dimerisierungsprodukt-Schemas konnte erstellt werden, was den
Ruckschluss auf eine obligatorische Beteiligung von Phenoxyradikalen in
dieser Reaktion zuliess. Diese Schlussfolgerung wurde weiterhin durch die
Ergebnisse unterstutzt, die aus der Reaktion von Anisol mit PN erhalten
wurden. Weitere neue Erkenntnisse aus dieser Arbeit betrafen das Maxi-
mum der Nitrosylierung und Sauerstofffreisetzung zwischen pH 9 und 10.
• Neue PN Hemmstoffe wurden getested und mit bekannten Antioxidantienin verschiedenen Testsystemen verglichen. Die Wahl dieser Testsysteme er-
laubte einen detaillierten Einblick in die Mechanismen nach denen Hemm-
stoffe mit PN reagieren. Alkohol Dehydrogenase reagiert mit dem PN-
Anion und das Enzym wird durch Thioloxidation inaktiviert. Hemm-
stoffe, die in diesem System effektiv waren mussen ebenfalls mit dem
Anion reagieren. Wir konnten GSH, Cystein, Se-Methionin, Dithiop-
urin und Dithiopyrimidin als hochst effizient identifizieren. Die halbmax-
imale Konzentration fur die Protektion von 26 nM ADH vor der Inak-
tivierung durch 20 µM PN lagen im Bereich von 15-45 µM. Harnsaure und
seine Dimethylanalogen, Ebselen, Ascorbat und Tyrosin waren ineffektiv in
diesem Testsystem.
Sowohl die Phenol-Nitrierung und Hydroxylierung als auch die Nitrierung
von BSA benotigen die protonierte Form von PN oder deren angeregten
Zustand. In diesen Testsystemen waren Harnsaure und seine 1,3- und 3,7-
Dimethylanalogen, 2-Thiobarbitursaure, 2,6-Dithiopurin und -Pyrimidin
hoch wirksam bei der Unterdruckung der Nitrierung und Hydroxylierung
von Phenol, gefolgt von Cystein und Ascorbat, die vorallem auf die Hy-
droxylierung einen kleineren Einfluss hatten. Methionin, Se-Methionin und
GSH waren in beiden Reaktionen weniger aktiv. Im BSA System waren
ahnliche Trends erkennbar. Hemmstoffe, die den Zerfall von PN beschleu-
nigen, konnten ebenso positive Effekte auf die von PN verursachten Oxi-
dationen haben. Phosphin und Pyruvat zeigten starke Beschleunigung des

7 SUMMARY 125
Zerfalls, Pyruvat schien sogar katalytisch zu wirken, allerdings erhohte es
die Nitrierung von Phenol.
Ebselen ist bekannt fur seine schnelle Reaktion mit PN. Trotzdem zeigte
es in unseren Testsystemen kaum Effekte und konnte PGIS nicht vor der
Inaktivierung durch PN schutzen. Ebselen ist bekannt, Addukte mit Thi-
olgruppen zu bilden. Das Ebselen-GSH-Addukt wurde isoliert und identi-
fiziert, sowie seine Reaktion mit PN als langsam erkannt. In mit Ellmans
Reagenz behandelten Mikrosomen, in denen alle Thiolgruppen blockiert
waren, konnte Ebselen die PGIS vor der Inaktivierung durch PN schutzen.
• Ham- und Ham-Thiolat-Proteine haben eine starke katalytische Wirkungauf diese Nitrierung. P450NOR, P450BM−3, CPO und Mikroperoxidase
erhohten nicht nur die Nitrierung und Dimerisierung, sondern erniedrigten
zugleich die Hydroxylierung. Weiterhin waren P450NOR und Chloroperox-
idase am effizientesten in der Katalyse des PN-Zerfalls. Wir konnten eine
Ferryl-Zwischenstufe in der Reaktion von P450NOR, P450BM−3 und CPO
mit PN identifizieren. Unsere Ergebnisse lassen den Schluss zu, dass der
Thiolat-Ligand eventuell eine Schlusselrolle fur die Reaktivitat der Fer-
ryl Spezies in P450 Enzymen einnimmt. Die konnte an einem partiellen
Radikalcharakter des Schwefels liegen (S-Fe-O· ↔S·Fe=O).
• Die Nitrierung von P450BM−3 begann bei 0,5 µM PN und das Enzym wurde
mit einem IC50-Wert von 2-3 µM inaktiviert. Y334 konnte im Wildtyp-
Enzym als nitriert identifiziert werden, Y87 zusatzlich in der F87Y Mutante.
Unsere Studien zeigten, dass die Inaktivierung nicht von der Nitrierung
herruhrte, sondern vielmehr von einer Thioloxidation in der Reduktase
Domane. Stopped-flow Messungen zeigten die Bildung von Compound II
und eine Geschwindigkeitskonstante zweiter Ordnung von k(BM3)=2x10⁵
M−1s−1 und k(CPO)=1x10⁶ M−1s−1 fur diesen Prozess.
• Die Nitrierung von P450CAM begann bei 25 µM PN. Y179, Y96, Y305
and Y201,203 konnten als nitriert identifiziert werden nach Behandlung mit
250 µM PN. Nach Zugabe von Metyrapon, welches das aktive Zentrum
blockiert, war die Nitrierung um einen Faktor 2-3 verringert. Behand-
lung mit PN verringerte das Campher-Bindungsspektrum und resultierte
in der oxidierten P420-Spezies. P450CAM konnte den Zerfall von PN nicht
katalysieren. Auch in Stopped-flow Spektren zeigte P450CAM nicht das fur
andere P450-Enzyme beobachtete Ferryl-Spektrum. Genau dasselbe Ver-
halten war bei der F87Y Mutante von P450BM−3 beobachtet worden.
REFERENCES 126
References
[1] R.A. Larson (1997) Naturally occuring antioxidants. Lewis Publications,
Boca Raton, Fla.
[2] H. Sies (1991) Oxidative stress. Academic Press, London, Great Britain.
[3] V. Darley-Usmar, and B. Halliwell (1996) Blood radicals. Reactive nitrogen
species, reactive oxygen species, transition metal ions, and the vascular
system. Pharmaceutical Research, 13, 649-657.
[4] J. Vasquez-Vivar, A.M. Santos, V.B.C. Junqueira, and O. Augusto (1996)
Peroxynitrite-mediated formation of free radicals in human plasma: EPR
detection of ascorbyl, albumin-thiyl and uric acid-derived free radicals.
Biochem. J., 314, 869-876.
[5] J.P. Crow, and J.S. Beckman (1995) Reactions between nitric oxide, super-
oxide and peroxynitrite: Footprints of Peroxynitrite in Vivo. Advances in
Pharmacology, 34, 17-43.
[6] M. Lehnig (1999) Radical mechanism of the decomposition of PN and the
PN-CO2 adduct and of reactions with L-tyrosine and related compounds
as studied by 15N chemically induced dynamic nuclear polarization. Arch.
Biochem. Biophys., 368, 303-318.
[7] R.E. Huie, and S. Padmaja (1993) Reaction of ·NO with O·−2 . Free Rad.
Res. Commun. 18, 195-199.
[8] G. Czapski, and S. Goldstein (1995) The Role of the reactions of ·NO with
superoxide and oxygen in biological systems: A kinetic approach. Free Rad.
Biol. Med., 19, 785-794.
[9] R. Kissner, T. Nauser, P. Bugnon, P.G. Lye, and W.H. Koppenol (1997)
Formation and properties of peroxynitrite as studied by laser flash photoly-
sis, high-pressure stopped flow technique, and pulse radiolysis. Chem. Res.
Toxicol., 10, 1285-1292.
[10] M.H. Zou, and V. Ullrich (1996) Peroxynitrite formed by simultaneous
generation of nitric oxide and superoxide selectively inhibits bovine aor-
tic prostacyclin synthase. FEBS Letters, 382, 101-104.
[11] M.H. Zou, C. Martin, and V. Ullrich (1997) Tyrosine nitration as a mech-
anism of selective inactivation of prostacyclin synthase by peroxynitrite.
Biol. Chem., 378, 707-713.
REFERENCES 127
[12] M.H. Zou, T. Klein, J.P. Pasquet, and V. Ullrich (1998) Interleukin 1-β de-
creases prostacyclin synthase activity in rat mesangial cells via endogenous
peroxynitrite formation. Biochem. J., 336, 507-512.
[13] S.R. Tannenbaum, D. Fett, V.R. Young, P.D. Land, and W.R. Bruce (1978)
Nitrite and nitrate are formed by endogenous synthesis in the human intes-
tine. Science, 200, 1487-1489.
[14] L.C. Green, S.R. Tannenbaum, and P. Goldman (1981) Nitrate synthesis
in the germfree and conventional rat. Science, 212, 56-58.
[15] S. Pfeiffer, B. Mayer, and B. Hemmens (1999) Stickstoffmonoxid: die ratsel-
hafte Chemie eines biologischen Botenstoffes. Angew. Chem., 111, 1824-
1844.
[16] M. Feelisch, and J.S. Stamler (1996) Methods in nitric oxide research. JOHN
WILEY & SONS, Chichester, Great Britain.
[17] A.R. Hurshman, C. Krebs, D.E. Edmondson, B. Hanh Huynh, and M.A.
Marletta (1999) Formation of a pterin radical in the reaction of the heme
domain of inducible nitric oxide synthase. Biochem., 38, 15689-96.
[18] J. Lehmann (1998) Organische Nitrate - Neue Perspektiven fur eine alte
Arzneistoffgruppe. Pharmazie in unserer Zeit, 27, 52-57.
[19] J.S. Beckman, and W.H. Koppenol (1996) Nitric oxide, superoxide and
peroxynitrite: The good, the bad and the ugly. The American Physiological
Society, invited review C, C1424-C1437.
[20] N. Nakatsubo et al (1998) Improved nitric oxide detection using 2,3-
diaminonaphthalene and its application to the evaluation of novel NOS
inhibitors. Biol. Pharm. Bull., 21, 1247-1250.
[21] M. Kelm, R. Dahmann, D. Wink, and M. Feelisch (1997) The nitric ox-
ide/superoxide assay. J. Biol. Chem., 272, 9922-9932.
[22] S. Pfeiffer, and B. Mayer (1998) Lack of tyrosine nitration by peroxynitrite
generated at physiological pH. J. Biol. Chem., 273, 27280-27285.
[23] P.C. Ford, D.A. Wink, and D.M. Stanbury (1993) Autoxidation kinetics of
aqueous nitric oxide. FEBS Lett., 326, 1-3.
[24] W.H. Koppenol (1998) Forum: The basic chemistry of nitrogen monoxide
and peroxynitrite. Free Rad. Biol. Med., 25, 385-391.
REFERENCES 128
[25] D.L.H. Williams (1997) Hypothesis article; Nitrosating agents: Is perox-
ynitrite a likely candidate? Nitric Oxide: Biol. Chem., 1, 522-527.
[26] E.G. DeMaster, B.J. Quast, B. Redfern, and H.T. Nagasawa (1995) Reac-
tion of nitric oxide with the free sulfhydryl group of human serum albumin
yields a sulfenic acid and nitrous oxide. Biochem., 34, 11494-11499.
[27] K. Nakahara, T. Tanimoto, K. Hatano, K. Usuda, and H. Shoun (1993) Cy-
tochrome P-450 55A1 (P-450dNIR) acts as nitric oxide reductase employing
NADH as the direct electron donor. J. Biol. Chem., 268, 8350-8355.
[28] L.J. Ignarro (1999) Stickstoffmonoxid: ein einzigartiges endogenes Signal-
molekul in der Gefassbiologie (Nobel-Vortrag). Angew. Chem., 111, 2002-
2013.
[29] F. Murad (1999) Die Entdeckung einiger biologischer Wirkungen von Stick-
stoffmonoxid und seiner Rolle fur die Zellkommunikation (Nobel-Vortrag).
Angew. Chem., 111, 1976-1989.
[30] L. Verdot, G. Lalmanach, V. Vercruysse, J. Hoebeke, F. Gauthier, and B.
Vray (1999) Chicken cystatin stimulates nitric oxide release from interferon-
γ-activated mouse peritoneal macrophages via cytokine synthesis. Eur. J.
Biochem., 266, 1111-1117.
[31] K.D. Kroncke, K. Fehsel, and V. Kolb-Bachofen (1997) Nitric oxide: Cyto-
toxicity versus cytoprotection - how, why, when and where? Nitric Oxide:
Biol. Chem., 1, 107-120.
[32] J.P. Eiserich, R.P. Patel, and V.B. O’Donnell (1998) Pathophysiology of
nitric oxide and related species: Free radical reactions and modification of
biomolecules. Mol. Aspects Med., 19, 221-357.
[33] N.S. Shah, and T.R. Billiar (1998) Role of nitric oxide in inflammation and
tissue injury during endotoxemia and hemorrhagic shock. Environ. Health
Perspect., 106, 1139-1143.
[34] D.C. Goodwin, M.R. Gunther, L.C. Hsi, B.C. Crews, T.E. Eling, R.P.
Mason, and L.J. Marnett (1998) Nitric oxide trapping of tyrosyl radicals
generated during prostaglandin endoperoxide synthase turnover. J. Biol.
Chem., 273, 8903-8909.
REFERENCES 129
[35] B.S. Winkler, M.E. Boulton, J.D. Gottsch, and P. Sternberg (1999) Ox-
idative damage and age-related macular degeneration. Molecular Vision, 5,
32-43.
[36] T. Chakraborti, S. Das, M. Mondal, S. Roychoudhury, and S. Chakraborti
(1999) Oxidant, mitochondria and calcium: An overview. Cell Signal, 11,
77-85.
[37] K.B. Beckman, and B.N. Ames (1998) Mitochondrial aging: Open ques-
tions. Ann. N. Y. Acad. Sci., 854, 118-127.
[38] H. Kuthan, and V. Ullrich (1982) Oxidase and oxygenase function of the
microsomal cytochrome P450 monooxygenase system. Eur. J. Biochem.,
126, 583-588.
[39] A. Sanders, R. Eisenthal, and R. Harrison (1997) NADH oxidase activity
of human xanthine oxidoreductase: Generation of superoxide anion. Eur.
J. Biochem., 245, 541-548.
[40] T. Nishino, K. Okamoto, S. Nakanishi, H. Hori, and T. Nishino (1997) Con-
version of xanthine dehydrogenase into oxidase and its role in reperfusion
injury. Biochem. Soc. Trans., 25, 783-786.
[41] H.Y. Chung, and K.H. Lee et al (1997) Xanthine DH/xanthine oxidase and
oxidative stress. Age, 20, 127-140.
[42] D. Voet, and J.G. Voet (1990) Biochemistry. John Wiley & Sons, New York,
USA.
[43] L. Yu, M.T. Quinn, A.R. Cross, and M.C. Dinauer (1998) Gp91(phox) is
the heme binding subunit of the superoxide-generating NADPH oxidase.
Proc. Natl. Acad. Sci. USA, 95, 7993-7998.
[44] N. Fazal, U.G. Knaus, F. Sabeh, R.L. Gamelli, J.A. McNulty, and M.M.
Sayeed (1999) Enhanced expression of neutrophil NADPH oxidase compo-
nents in intstine of rats after burn injury. Shock, 12, 438-442.
[45] K.N. Dileepan, and J. Kennedy (1985) Complete inhibition of
dihydro-orotate oxidation and superoxide production by 1,1,1-trifluoro-3-
thenoylacetone in rat liver mitochondria. Biochem. J., 225, 189-194.
REFERENCES 130
[46] T. Munzel, and U. Forstermann et al (2000) Effects of long-term nitroglyc-
erin treatment on endothelial nitric oxide synthase (NOS-III) gene expres-
sion, NOS-III-mediated superoxide production, and vascular NO bioavail-
ability. Circ. Res., 86, E7-E12.
[47] K.E. Muse, T.D. Oberley, J.M. Sempf, and L.W. Oberley (1994) Immunolo-
calization of antioxidant enzymes in adult hamster kidney. Histochem. J.,
26, 734-753.
[48] C. Canne, D.J. Lowe, S. Fetzner, B. Adams, A.T. Smith, R. Kappl, R.C.
Bray, and J. Huttermann (1999) Kinetics and interactions of molydenum
and iron-sulfur centers in bacterial enzymes of the xanthine oxidase family:
Mechanistic implications. Biochem., 38, 14077-14087.
[49] H. Zhang, A. Schmeisser, C.D. Garlichs, K. Plotze, U. Damme, A. Mugge,
and W.G. Daniel (1999) Angiotensin II-induced superoxide anion genera-
tion in human vascular endothelial cells: Role of membrane-bound NADH-
/NADPH-oxidases. Cardiovasc. Res., 44, 215-222.
[50] J. Lee, J.A. Hunt, and J.T. Groves (1998) Manganese porphyrins as redox-
coupled peroxynitrite reductases. J. Am. Chem. Soc., 120, 6053-6061.
[51] S. Marklund, and G. Marklund (1974) Involvement of the superoxide an-
ion radical in the autooxidation of pyrogallol and a convenient assay for
superoxide dismutase. Eur. J. Biochem., 47, 469-474.
[52] Y. Ogura, and I. Yamazaki (1983) Steady-state kinetics of the catalase
reaction in the presence of cyanide. J. Biochem., 94, 403-408.
[53] S. Hippeli, and E.F. Elstner (1997) OH-Radical-type reactive oxygen
species: A short review on the mechanism of OH-radical- and peroxyni-
trite toxicity. Z. Naturforsch., 52c, 555-563.
[54] S. Hippeli, U. Rohnert, D. Koske, and E.F. Elstner (1997 OH-radical-type
reactive oxygen species derived from superoxide and nitric oxide: A sensitive
method for their determination and differentiation. Z. Naturforsch., 52c,
564-570.
[55] C. Dahlgren, and A. Karlsson (1999) Respiratory burst in human neu-
trophils. J. Immunol. Methods, 232, 3-14.
[56] J.S. Beckman (1996) Oxidative damage and tyrosine nitration from perox-
ynitrite. Chem. Res. Toxicol., 9, 836-844.
REFERENCES 131
[57] M.N. Hughes, and H.G. Nicklin (1970) The chemistry of peroxynitrites. Part
II. Copper(II)-catalyzed reaction between hydroxylamine and peroxynitrite
in alkali. J. Chem. Soc., A, 925-928.
[58] D.S. Bohle, B. Hansert, S.C. Paulson, and B.D. Smith (1994) Biomimetic
sythesis of the putative cytotoxin peroxynitrite and ist characterization as
a tetramethylammonium salt. J. Am. Chem. Soc., 116, 7423-7424.
[59] J.H.M. Tsai, J.G. Harrison, J.C. Martin, T.P. Hamilton, M. van der Woerd,
M.J. Jablonsky, and J.S. Beckman (1994) Role of conformation of perox-
ynitrite anion (ONOO−) in its stability and toxicity. J. Am. Chem. Soc.,
116, 4115-4116.
[60] M. Worle, P. Latal, R. Kissner, R. Nesper, and W.H. Koppenol (1999)
Conformation of peroxynitrite: determination by crystallographic analysis.
Chem. Res. Toxicol., 12, 305-307.
[61] S. Pfeiffer, A.C.F. Gorren, K. Schmidt, E.R. Werner, B. Hansert, D.S.
Bohle, and B. Mayer (1997) Metabolic fate of peroxynitrite in aqueous
solution. J. Biol. Chem., 272, 3465-3470.
[62] M.S. Ramezanian, S. Padmaja, and W.H. Koppenol (1996) Nitration and
hydroxylation of phenolic compounds by peroxynitrite. Chem. Res. Toxicol.,
9, 232-240.
[63] L. Packer (1996) Nitric Oxide, Part B: Physiological and Pathological Pro-
cesses. Methods in Enzymology, 269, 175-329.
[64] H. Kaur, M. Whiteman, and B. Halliwell (1997) Peroxynitrite-dependent
aromatic hydroxylation and nitration of salicylate and phenylalanine. Is
hydroxyl radical involved? Free Rad. Res., 26, 71-82.
[65] B. Halliwell, and H. Kaur (1997) Hydroxylation of salicylate and pheny-
lalanine as assays for hydroxyl radicals: A cautionary note visited for the
third time. Free Rad. Res., 27, 239-244.
[66] A. van der Vliet, C.A. O’Neill, B. Halliwell, C.E. Cross, and H. Kaur (1994)
Aromatic hydroxylation and nitration of phenylalanine and tyrosine by per-
oxynitrite: evidence for hydroxyl radical production from peroxynitrite.
FEBS Lett., 339, 89-92.
REFERENCES 132
[67] S. Goldstein, G.L. Squadrito, W.A. Pryor, and G. Czapski (1996) Direct
and indirect oxidations by peroxynitrite, neither involving the hydroxyl
radical. Free Rad. Biol. Med., 21, 965-974.
[68] G. Merenyi (1997) Lifting the ban on hydroxyl radicals. Book of Abstracts:
First intern. conf. of the chem. and biol. of peroxynitrite, Ascona, Switzer-
land.
[69] W.H. Koppenol (1997) Should the ban on hydroxyl radicals be lifted? Book
of Abstracts: First intern. conf. of the chem. and biol. of peroxynitrite,
Ascona, Switzerland.
[70] W.A. Pryor, X. Jin, and G.L. Squadrito (1996) Insensitivity of the rate
of decomposition of peroxynitrite to changes in viskosity; evidence against
free radical formation. J. Am. Chem. Soc., 118, 3125-3128.
[71] C.E. Richeson, P. Mulder, V.W. Bowry, and K.U. Ingold (1998) The com-
plex chemistry of peroxynitrite decomposition: New insights. J. Am. Chem.
Soc., 120, 7211-7219.
[72] J.W. Coddington, J.K. Hurst, and S.V. Lymar (1999) Hydroxyl radical
formation during peroxynitrous acid decomposition. J. Am. Chem. Soc.,
121, 2438-2443.
[73] S. Dikalov, M. Skatchkov, and E. Bassenge (1997) Quantification of per-
oxynitrite, superoxide and peroxyl radicals by a new spin trap hydroxy-
lamine 1.hydroxy-2,2,6,6-tetramethyl-4-oxo-piperidine. Biochem. Biophys.
Res. Comm., 230, 54-57.
[74] D. Pietraforte, and M. Minetti (1997) Direct ESR detection of
peroxynitrite-induced tyrosine centred protein radicals in human blood
plasma. Biochem. J., 325, 675-684.
[75] D. Pietraforte, and M. Minetti (1997) One-electron oxidation pathway of
peroxynitrite decomposition in human blood plasma: Evidence for the for-
mation of protein tryptophan-centred radicals. Biochem. J., 321, 743-750.
[76] W.H. Koppenol (1999) Metal ions in biological systems: Chemistry of per-
oxynitrite and its relevance to biological systems, 36, 597-619. Edited by
A. and H. Sigel, Marcel Dekker, New York, USA.
REFERENCES 133
[77] S. Goldstein, G. Czapski, J. Lind, and G. Merenyi (1999) Effect of NO
on the decomposition of peroxynitrite: reaction of dinitrogen trioxide with
ONOO-anion. Chem. Res. Toxicol., 12, 132-136.
[78] A. Saha, S. Goldstein, D. Cabelli, and G. Czapski (1998) Determination of
optimal conditions for synthesis of peroxynitrite by mixing acidified hydro-
gen peroxide with nitrite. Free Rad. Biol. Med., 24, 653-659.
[79] R.M. Uppu, and W.A. Pryor (1996) Synthesis of peroxynitrite in a
two-phase system using isoamylnitrite and hydrogen peroxide. Analytical
Biochem., 236, 242-249.
[80] N.W. Kooy, J.A. Royall, H. Ischiropoulos, and J.S. Beckman (1994)
Peroxynitrite-mediated oxidation of dihydrorhodamine 123. Free Rad. Biol.
Med., 16, 149-156.
[81] J.P. Crow (1997) Dichlorodihydrofluorescein and dihydrorhodamin 123 are
sensitive indicators of peroxynitrite in vitro: Implications for intracellular
measurement of reactive nitrogen and oxygen species. Nitric Oxide: Biol.
Chem., 1, 145-157.
[82] W.H. Koppenol, J.J. Moreno, W.A. Pryor, H. Ischiropoulos, and J.S. Beck-
man (1992) Peroxynitrite, a cloaked oxidant formed by nitric oxide and
superoxide. Chem. Res. Toxicol., 5, 834-842.
[83] G. Scorza, and M. Minetti (1998) One-electron oxidation pathway of thiols
by peroxynitrite in biological fluids: bicarbonate and ascorbate promote the
formation of albumin disulfide dimers in human blood plasma. Biochem. J.,
329, 405-413.
[84] D.S. Bohle, P.A. Glassbrenner, and B. Hansert (1997) O-atom transfer
versus aromatic nitration reactions of peroxynitrite. Tetrahedron Letters,
38, 2425-2426.
[85] S. Padmaja, G.L. Squadrito, J.N. Lemercier, R. Cueto, and W.A. Pryor
(1997) Peroxynitrite-mediated oxidation of D,L-selenomethionine: Kinetics,
mechanism and the role of carbon dioxide. Free Rad. Biol. Medicine, 23,
917-926.
[86] K. Briviba, I. Roussyn, V.S. Sharov, and H. Sies (1996) Attenuation of
oxidation and nitration reactions of peroxynitrite by selenomethionine, se-
lenocystine and ebselen. Biochem. J., 319, 13-15.
REFERENCES 134
[87] S. Padmaja, S.L. Squadrito, J.N. Lemercier, R. Cueto, and W.A. Pryor
(1996) Rapid oxidation of DL-selenomethionine by peroxynitrite. Free Rad.
Biol. Med., 21, 317-322.
[88] D. Bartlett, D.F. Church, P.L. Bounds, and W.H. Koppenol (1995) The
kinetics of the oxidation of L-ascorbic acid by peroxynitrite. Free Rad. Biol.
Med., 18, 85-92.
[89] G.L. Squadrito, X. Jin, and W.A. Pryor (1995) Stopped-flow kinetic study
of the reaction of ascorbic acid with peroxynitrite. Arch. Biochem. Biophys.,
322, 53-59.
[90] S. Padmaja, M.S. Ramazenian, P.L. Bounds, and W.H. Koppenol (1996)
Reaction of peroxynitrite with L-tryptophan. Redox Report, 2, 173-177.
[91] Book of Abstracts: First intern. conf. of the chem. and biol. of peroxynitrite,
Ascona, Switzerland (1997).
[92] N.C. Hoglen, S.C. Waller, I.G. Sipes, and D.C. Liebler (1997) Reactions of
peroxynitrite with gamma-tocopherol. Chem. Res. Toxicol., 10, 401-407.
[93] A.A. Christen, M.K. Woodall, P.T. Southwell-Keely, W. Duncan, and B.N.
Ames (1997) Reactions of peroxynitrite with alpha-tocopherol... Proc. Natl.
Acad. Sci. USA, 94, 3218-3223.
[94] J.P. Crow, J.S. Beckman, and J.M. McCord (1995) Sensitivity of the es-
sential zinc-thiolate moiety of yeast alcohol dehydrogenase to hypochlorite
and peroxynitrite. Biochem., 34, 3544-3552.
[95] S.V. Lymar, Q. Jiang, and J.K. Hurst (1996) Mechanism of carbon dioxide-
catalyzed oxidation of tyrosine by peroxynitrite. Biochemistry, 35, 7855-
7861.
[96] A. Denicola, B.A. Freeman, M. Trujillo, and R. Radi (1996) Peroxyni-
trite reaction with carbon dioxide/bicarbonate: kinetics and influence on
peroxynitrite-mediated oxidations. Arch. Biochem. Biophys., 333, 49-58.
[97] H. Masumoto, R. Kissner, W.H. koppenol, and H. Sies (1996) Kinetic study
of the reaction of ebselen with peroxynitrite. FEBS Letters, 398, 179-182.
[98] M. Exner, and S. Herold (2000) Kinetic and mechanistic studies of the
peroxynitrite-mediated oxidation of oxymyoglobin and oxyhemoglobin.
Chem. Res. Toxicol., in press.
REFERENCES 135
[99] L. Castro, M. Rodriguez, and R. Radi (1994) Aconitase is readily inacti-
vated ny peroxynitrite, but not by its precursor, nitric oxide. J. Biol. Chem.,
269, 29409-29415.
[100] H. Sies, V.S. Sharov, L.O. Klotz, and K. Briviba (1997) Glutathione per-
oxidase protects against peroxynitrite-mediated oxidations. J. Biol. Chem.,
272, 27812-27817.
[101] S. Padmaja, G.L. Squadrito, and W.A. Pryor (1998) Inactivation of glu-
tathione peroxidase by peroxynitrite. Arch. Biochem. Biophys., 349, 1-6.
[102] R. Floris, S.R. Piersma, G. Yang, P. Jones, and R. Wever (1993) Interaction
of myeloperoxidase with peroxynitrite. A comparison with lactoperoxidase,
horseradish peroxidase and catalase. Eur. J. Biochem., 215, 767-775.
[103] J. Lee, J.A. Hunt, and J.T. Groves (1998) Mechanism of iron porphyrin
reactions with peroxynitrite. J. Am. Chem. Soc., 120, 7493-7501.
[104] M.K. Stern, M.P. Jensen, and K. Kramer (1996) Peroxynitrite decomposi-
tion catalysts. J. Am. Chem. Soc., 118, 8735-8736.
[105] R. Radi (1998) Peroxynitrite reactions and diffusion in biology. Chem. Res.
Toxicol., 11, 720-721.
[106] Book of Abstracts: Second intern. conf. of the chem. and biol. of peroxyni-
trite, crete, Greece (1999).
[107] R.M. Uppu, and W.A. Pryor (1996) Carbon dioxide catalysis of the reaction
of peroxynitrite with ethyl acetoacetate: an example of aliphatic nitration
by peroxynitrite. Biochem. Biophys. Res. Comm., 229, 764-769.
[108] O.I. Aruoma, M. Whiteman, T.G. England, and B. Halliwell (1997) An-
tioxidant action of ergothioneine: assessment of ist ability to scavenge per-
oxynitrite. Biochem. Biophys. Res. Comm., 231, 389-391.
[109] A.S. Pannala, C. Rice-Evans, J. Sampson, and S. Singh (1998) Interac-
tion of peroxynitrite with carotenoids and tocopherols within low-density
lipoprotein. FEBS Letters, 423, 297-301.
[110] K. Kikugawa, K. Hiramoto, S. Tomiyama, and Y. Asano (1997) Beta-
carotene effectively scavenges toxic nitrogen oxides: nitrogen dioxide and
peroxynitrous acid. FEBS Letters, 404, 175-178.
REFERENCES 136
[111] A. Daiber, S. Herold, C. Schoneich, K. Burger, D. Namgaladze, M. Mehl,
J.A. Peterson, and V. Ullrich (2000) Autocatalytic tyrosine nitration of
cytochrome P450BM3 and its F87Y mutant by peroxynitrite. Submitted to
Biochemistry.
[112] J.M. Souza, and R. Radi (1998) Glyceraldehyde-3-phosphate dehydrogenase
inactivation by peroxynitrite. Arch. Biochem. Biophys., 360, 187-194.
[113] D.M. Kuhn, C.W. Aretha, and T.J. Geddes (1999) Peroxynitrite inactiva-
tion of tyrosine hydroxylase: mediation by sulfhydryl oxidation, not tyrosine
nitration. J. Neuroscience, 19, 10289-10294.
[114] D.M. Kuhn, and T.J. Geddes (1999) Peroxynitrite inactivates tryptophan
hydroxylase via sulfhydryl oxidation. J. Biol. Chem., 274, 29726-29732.
[115] K. Takakura, J.S. Beckman, L.A. MacMillan-Crow, and J.P. Crow
(1999) Rapid and irreversible inactivation of protein tyrosine phosphatases
PTP1B, CD45, and LAR by peroxynitrite. Arch. Biochem. Biophys., 369,
197-207.
[116] M.H. Zou, A. Daiber, J.A. Peterson, H. Shoun, and V. Ullrich. (2000)
Rapid reactions of peroxynitrite with heme-thiolate proteins as the basis
for protection of prostacyclin synthase from inactivation by nitration. Arch.
Biochem. Biophys., in press.
[117] F. Yamakura, H. Taka, T. Fujimura, and K. Murayama (1998) Inactivation
of human manganese-superoxide dismutase by peroxynitrite is caused by
exclusive nitration of tyrosine 34 to 3-nitrotyrosine. J. Biol. Chem., 273,
14085-14089.
[118] L.A. MacMillan-Crow, J.P. Crow, and J.A. Thompson (1998) Peroxynitrite-
mediated inactivation of manganese superoxide dismutase involves nitration
and oxidation of critical tyrosine residues. Biochem., 37, 1613-1622.
[119] L.A. MacMillan-Crow, and J.A. Thompson (1999) Tyrosine modifications
and inactivation of active site manganese superoxide dismutase mutant
(Y34F) by peroxynitrite. Arch. Biochem. Biophys., 366, 82-88.
[120] J.P. Crow, Y. Zu Ye, M. Strong, M. Kirk, S. Barnes, and J.S. Beckman
(1997) Superoxide dismutase catalyzes nitration of tyrosine by peroxynitrite
in the rod and head domains of neurofilament-L. Journal Neurochem., 69,
1945-1953.
REFERENCES 137
[121] J.P. Crow, J.B. Sampson, Y. Zhuang, J.A. Thompson, and J.S. Beckman
(1997) Decreased zinc affinity of amyotrophic lateral sclerosis-associated su-
peroxide dismutase mutants leads to enhanced catalysis of tyrosine nitration
by peroxynitrite. J. Neurochem., 69, 1936-1943.
[122] R.I. Viner, D.A. Ferrington, T.D. Williams, D.J. Bigelow, and C. Schone-
ich (1999) Protein modification during biological aging: Selective tyrosine
nitration of the SERCA2a isoform of the sarcoplasmic reticulum Ca2+-
ATPase in skeletal muscle. Biochem. J., 340, 657-669.
[123] E.S. Roberts, H. Lin, J.R. Crowley, J.L. Vuletich, Y. Osawa, and P.F.
Hollenberg Peroxynitrite-mediated nitration of tyrosine and inactivation of
the catalytic activity of cytochrome P450 2B1. Chem. Res. Toxicol., 11,
1067-1074.
[124] B. Alvarez, G. Ferrer-Sueta, B.A. Freeman, and R. Radi (1999) Kinetics
of peroxynitrite reaction with amino acids and human serum albumin. J.
Biol. Chem., 274, 842-848.
[125] J.P.E.E. Pasquet, M.H. Zou, and V. Ullrich (1996) Peroxynitrite inhibition
of nitric oxide synthases. Biochimie, 78, 785-791.
[126] C.B. Hellberg, S.E. Boggs, and E.G. Lapetina (1998) Phosphatidylinositol
3-kinase is a target for protein tyrosine nitration. Biochem. Biophys. Res.
Comm., 252, 313-317.
[127] E. Ferguson, R.J. Singh, N. Hogg, and B. Kalyanaraman (1997) The mech-
anism of apolipoprotein B-100 thiol depletion during oxidative modification
of low-density lipoprotein. Arch. Biochem. Biophys., 341, 287-294.
[128] R.M. Uppu, J.N. Lemercier, G.L. Squadrito, H. Zhang, R.M. Bolzan, and
W.A. Pryor (1998) Nitrosation by peroxynitrite: Use of phenol as a probe.
Arch. Biochem. Biophys., 358, 1-16.
[129] N. Kerry, and C. Rice-Evans (1998) Peroxynitrite oxidises catechols to o-
quinones. FEBS Letters, 437, 167-171.
[130] A. Daiber, M. Mehl, and V. Ullrich (1998) New aspects in the reaction
mechanism of phenol with peroxynitrite: the role of phenoxy radicals. Nitric
Oxide: Biol. Chem., 2, 259-269.

REFERENCES 138
[131] K.A. Skinner, C.R. White, R. Patel, S. Tan, S. Barnes, M. Kirk, V. Darley-
Usmar, and D.A. Parks (1998) Nitrosation of uric acid by peroxynitrite. J.
Biol. Chem., 273, 24491-24497.
[132] L.J. Kennedy, K. Moore, J.L. Caulfield, S.R. Tannenbaum, and P.C. Dedon
(1997) Quantitation of 8-oxoguanine and strand breaks produced by four
oxidizing agents. Chem. Res Toxicol., 10, 386-392.
[133] P.A. King, E. Jamison, D. Strahs, V.E. Anderson, and M. Brenowitz (1993)
Footprinting proteins on DNA with peroxynitrous acid. Nucleic Acids Re-
search, 21, 2473-2478.
[134] H. Ohshima, Y. Yoshie, S. Auriol, and I. Gilibert (1998) Antioxidant and
pro-oxidant actions of flavonoids: Effects on DNA damage induced by nitric
oxide, peroxynitrite and nitroxyl anion. Free Rad. Biol. Med., 25, 1057-
1065.
[135] H. Ishida, M.U. Mohammed, Z. Su, X.-L. Niu, M. Fujishima, Y. Hamazaki,
and H. Nakazawa (1998) Interaction of superoxide, nitric oxide and per-
oxynitrite under various pathological conditions. Pathophysiology of Lipid
Peroxides and Related Free Radicals, 25-41.
[136] R. Radi, J.S. Beckman, K.M. Bush, and B.A. Freeman (1991) Peroxynitrite-
induced membrane lipid peroxidation: the cytotoxic potential of superoxide
and nitric oxide. Arch. Biochem. Biophys., 288, 481-487.
[137] R. Radi, J.S. Beckman, K.M. Bush, and B.A. Freeman (1991) Peroxynitrite
oxidation of sulfhydryls. J. Biol. Chem., 266, 4244-4250.
[138] W.A. Pryor, and G.L. Squadrito (1995) The chemistry of peroxynitrite:
A product from the reaction of nitric oxide with superoxide. Am. Physiol.
Soc., L699-L722.
[139] W.A. Pryor, X. Jin, and G.L. Squadrito (1994) One- and two-electron ox-
idations of methionine by peroxynitrite. Proc. Natl. Acad. Sci. USA, 91,
11173-11177.
[140] R. Meli, T. Nauser, and W.H. Koppenol (1999) Direct observation of in-
termediates in the reaction of peroxynitrite with carbon dioxide. Helvetica
Chimica Acta, 82, 722-725.

REFERENCES 139
[141] S. Goldstein, and G. Czapski (1998) Formation of peroxynitrate from the
reaction of peroxynitrite with carbon dioxide: evidence for carbonate radi-
cal production. J. Am. Chem. Soc., 120, 3458-3463.
[142] S. Goldstein, and G. Czapski (1999) Viscosity effects on the reaction of per-
oxynitrite with carbon dioxide: evidence for radical formation in a solvent
cage. J. Am. Chem. Soc., 121, 2444-2447.
[143] M.G. Bonini, R. Radi, G. Ferrer-Sueta, A.M.D.C. Ferreira, and O. Augusto
(1999) Direct EPR detection of the carbonate radical anion produced from
peroxynitrite and carbon dioxide. J. Biol. Chem., 274, 10802-10806.
[144] G.E. Arteel, K. Briviba, and H. Sies (1999) Minireview: Protection against
peroxynitrite. FEBS Letters, 445, 226-230.
[145] J.N. Lemercier, S. Padmaja, R. Cueto, G.L. Squadrito, R.M. Uppu, and
W.A. Pryor (1997) Carbon dioxide modulation of hydroxylation and nitra-
tion of phenol by peroxynitrite. Arch. Biochem. Biophys., 345, 160-170.
[146] A. Gow, D. Duran, S.R. Thom, and H. Ischiropoulos (1996) Carbon diox-
ide enhancement of peroxynitrite-mediated protein tyrosine nitration. Arch.
Biochem. and Biophys., 333, 42-48.
[147] H. Ischiropoulos, A.B. Al-Mehdi (1995) Peroxynitrite mediated oxidative
protein modifications. FEBS Letters, 364, 279-282.
[148] B.S. Berlett, R.L. Levine, and E.R. Stadtman (1998) Carbon dioxide stim-
ulates peroxynitrite-mediated nitration of tyrosine residues and inhibits ox-
idation of methionine residues of glutamine synthetase: Both mimic effects
of adenylation. Proc. Natl. Acad. Sci. USA, 95, 2784-2789.
[149] M. Tien, B.S. Berlett, R.L. Levine, P.B. Chock, and E.R. Stadtman (1999)
Peroxynitrite-mediated modification of proteins at physiological carbon
dioxide concentration: pH dependence of carbonyl formation, tyrosine ni-
tration and methionine oxidation. Proc. Natl. Acad. Sci. USA, 96, 7809-
7814.
[150] Y. Kato, S. Kawakishi, T. Aoki, K. Itakura, and T. Osawa (1997) Oxida-
tive modification of tryptophan residues exposed to peroxynitrite. Biochem.
Biophys. Res. Comm., 234, 82-84.
[151] W. Vogt (1995) Oxidation of methionyl residues in proteins: tools, targets
and reversal. Free Rad. Biol. Med., 18, 93-105.
REFERENCES 140
[152] J.B. Sampson, Y. Ye, H. Rosen, and J.S. Beckman (1998) Myeloperoxidase
and horseradish peroxidase catalyze tyrosine nitration in proteins from ni-
trite and hydrogen peroxide. Arch. Biochem. Biophys., 356, 207-213.
[153] B. Ahn, B.S. Han, D.J. Kim, and H. Ohshima (1999) Immunohistochemical
localization of inducible nitric oxide synthase and 3-nitrotyrosine in rat liver
tumors induced by N-nitrosodiethylamine. Carcinogenesis, 20, in print.
[154] C. Herce-Pagliai, S. Kotecha, and D.E.G. Shuker (1998) Analytical methods
for 3-nitrotyrosine as a marker of exposure to reactive nitrogen species: A
review. Nitric Oxide: Biol. Chem., 2, 324-336.
[155] B. Halliwell (1997) What nitrates tyrosine? Is nitrotyrosine specific as a
biomarker of peroxynitrite formation in vivo? FEBS Letters, 411, 157-160.
[156] H. Kaur, L. Lyras, P. Jenner, and B. Halliwell (1998) Artefacts in HPLC
detection of 3-nitrotyrosine in human brain tissue. J. Neurochem., 70, 2220-
2223.
[157] B. Roy, M. Lepoivre, Y. Henry, and M. Fontecave (1995) Inhibition of ri-
bonucleotide reductase by nitric oxide derived from thionitrites: Reversible
modifications of both subunits. Biochem., 34, 5411-5418.
[158] Y. Sanakis, C. Goussias, R.P. Mason, and V. Petrouleas (1997) NO interacts
with the tyrosyl radical Y·D of photosystem II to form an iminoxyl radical.
Biochem., 36, 1411-1417.
[159] H. Ohshima, I. Celan, L. Chazotte, B. Pignatelli, and H.F. Mower (1999)
Analysis of 3-nitrotyrosine in biological fluids and protein hydrolyzates by
high-performance liquid chromatography using a postseparation, on-line
reduction column and electrochemical detection: results with various ni-
trating agents. Nitric Oxide: Biol. Chem., 3, in print.
[160] Y. Kamisaki, K. Wada, K. Bian, B. Balabanli, K. Davis, E. Martin, F.
Behbod, Y.-C. Lee, and F. Murad (1998) An activity in rat tissues that
modifies nitrotyrosine-containing proteins. Proc. Natl. Acad, Sci. USA, 95,
11584-11589.
[161] B. Balabanli, Y. Kamisaki, E. Martin, and F. Murad (1999) Requirements
for heme and thiols for the nonenzymatic modification of nitrotyrosine.
Proc. Natl. Acad, Sci. USA, 96, 13136-13141.
REFERENCES 141
[162] G.L. Squadrito, and W.A. Pryor (1998) The nature of reactive species in
systems that produce peroxynitrite. Chem. Res. Toxicol., 11, 718-719.
[163] M. Mehl, A. Daiber, S. Herold, H. Shoun, and V. Ullrich (1999) Peroxyni-
trite reaction with heme proteins. Nitric Oxide: Biol. Chem., 3, 142-152.
[164] J.T. Groves (1999) Peroxynitrite: Reactive, invasive and enigmatic. Current
Opinion in Chem. Biol., 3, 226-235.
[165] S.C. Grace, M.G. Salgo, and W.A. Pryor (1998) Scavenging of peroxynitrite
by a phenolic/peroxidase system prevents oxidative damage to DNA . FEBS
Letters, 426, 24-28.
[166] H. Ischiropoulos (1998) Perspective: Biological tyrosine nitration: A patho-
physiological function of nitric oxide and reactive oxygen species. Arch.
Biochem. Biophys., 356, 1-11.
[167] M. Zou, M. Jendral, and V. Ullrich (1999) Prostaglandin endoperoxide-
dependent vasospasm in bovine coronary arteries after nitration of prosta-
cyclin synthase. Br. J. Pharmacol., 126, 1283-1292.
[168] M.H. Zou, A. Yesilkaya, and V. Ullrich (1999) Peroxynitrite inactivates
prostacyclin synthase by heme-thiolate-catalyzed tyrosine nitration. Drug
Metabolism Reviews, 31, 343-349.
[169] M.H. Zou, and M. Bachschmid (1999) Hypoxia-reoxygenation triggers coro-
nary vasospasm in isolated bovine coronary arteries via tyrosine nitration
of prostacyclin synthase. J. Exp. Med., 190, 135-139.
[170] V. Ullrich, and M.H. Zou (1998) Superoxide via peroxynitrite blocks prosta-
cyclin synthase. Oxygen homeostasis and its dynamics, Springer Verlag,
Tokia, Japan.
[171] J.S. Beckman, T.W. Beckman, J. Chen, P.A. Marshall, and B.A. Freeman
(1990) Apparent hydroxyl radical production by peroxynitrite: Implications
for endothelial injury from nitric oxide and superoxide. Proc. Natl. Acad.
Sci. USA, 87, 1620-1624.
[172] M.M. Ricetti, G.C. Guidi, G. Bellisola, R. Marrocchella, A. Rigo, and
G. Perona (1994) Selenium enhances glutathione peroxidase activity and
prostacyclin release in cultured human endothelial cells. Biological Trace
Element Res., 46, 113-123.
REFERENCES 142
[173] M.H. Zou, M. Leist, and V. Ullrich (2000) Selective nitration of prostacyclin
synthase and defective vasorelaxation in atherosclerotic bovine coronary
arteries. Am. J. Pathol., in press.
[174] G.G.A. Balavoine, Y.V. Geletii, and D. Bejan (1997) Catalysis of perox-
ynitrite reactions by manganese and iron porphyrins. Nitric Oxide: Biol.
Chem., 1, 507-521.
[175] J.P. Crow (1999) Manganese and iron porphyrins catalyze PN decomposi-
tion and simultaneously increase nitration and oxidant yield: Implications
for their use as PN scavengers in vivo. Arch. Biochem. Biophys., 371, 41-52.
[176] J. Evers (1998) The structure of heme proteins compounds I and II: Some
misconceptions. Free Rad. Biol. Med., 24, 1338-1346.
[177] J.L. Primus, M.G. Boersma, D. Mandon, S. Boeren, C. Veeger, R. Weiss,
and I.M. Rietjens (1999) The effect of iron to manganese substitution on
microperoxidase 8 catalysed peroxidase and cytochrome P450 type of catal-
ysis. J. Biol. Inorg. Chem., 4, 274-283.
[178] V. Ullrich (1979) Cytochrome P450 and biological hydroxylation reactions.
Topics in Current Chemistry, 83, 67-104.
[179] D. Sellmann, S. Emig, and F.W. Heinemann (1997) Stabilisierung von
Eisen in hoher Oxidationsstufe: Der einkernige Komplex [Fe(V)(I)(’N2S2’)].
Angew. Chem., 109, 1808-1810.
[180] C. Larroque, R. Lange, L. Maurin, A. Bienvenue, and J.E. van Lier (1990)
On the nature of the cytochrome P450ssc ”ultimate oxidant”: Characteri-
zation of a productive radical intermediate. Arch. Biochem. Biophys., 282,
198-201.
[181] V. Ullrich, and R. Brugger (1994) Prostacyclin- und Thromboxan-Synthase,
neue Aspekte der Katalyse durch Hamthiolat-Enzyme. Angew. Chem., 106,
1987-1996.
[182] S. Graham-Lorence, G. Truan, J.A. Peterson, J.R. Falck, S. Wei, C. Helvig,
and J.H. Capdevila (1997) An active site substitution, F87V converts cy-
tochrome P450 BM-3 into a regio- and stereoselective (14S,15R)-arachidonic
acid epoxygenase. J. Biol. Chem., 272, 1127-1135.

REFERENCES 143
[183] F.P. Guengerich, C.H. Yun, and T.L. Macdonald (1996) Evidence for a 1-
electron oxidation mechanism in N-dealkylation of N,N-dialkylanilines by
cytochrome P450 2B1. J. Biol. Chem., 271, 27321-27329.
[184] B. Jung, H. Graf, and V. Ullrich (1985) A new monooxygenase product
from 7-ethoxycoumarin and its relation to the O-dealkylation reaction. Biol.
Chem. Hoppe Seyler, 366, 23-31.
[185] M. Filatov, N. Harris, and S. Shaik (1999) On the ”rebound” mechanism
of alkane hydroxylation by cytochrome P450: Electronic structure of the
intermediate and the elctron transfer character in the rebound step. Angew.
Chem. Int. Ed. Engl., 38, 3510-3512.
[186] J.K. Atkinson, and K.U. Ingold (1993) Cytochrome P450 hydroxylation of
hydrocarbons: Variation in the rate of oxygen rebound using cyclopropyl
radical clocks including two new ultrafast probes. Biochem., 32, 9209-9214.
[187] F.P. Guengerich, L.C. Bell, and O. Okazaki (1995) Interpretations of cy-
tochrome P450 mechanisms from kinetic studies. Biochimie, 77, 573-580.
[188] P. Du, and G.H. Loew (1992) Role of axial ligand in the electronic structure
of model compound I complexes. Int. J. Quant. Chem., 44, 251-261.
[189] D.L. Harris, and G.H. Loew (1998) Theoretical investigation of the proton
assisted pathway to formation of cytochrome P450 compound I. J. Am.
Chem. Soc., 120, 8941-8948.
[190] M.T. Green (1998) Role of the axial ligand in determining the spin state of
resting cytochrome P450. J. Am. Chem. Soc., 120, 10772-10773.
[191] M.T. Green (1999) Evidence for sulfur-based radicals in thiolate compound
I. J. Am. Chem. Soc., in print.
[192] C. Rice-Evans, B. Halliwell, and G.G. Lunt (1994) Free radicals and ox-
idative stress: Environment, drugs and food additives. Biochemical Society
Symposium No.61, Portland Press, London, England.
[193] E.F. Elstner (1993) Sauerstoffabhangige Erkrankungen und Therapien. BI-
Wissenschaftsverlag, Mannheim, Germany.
[194] M. Marzinzig, A.K. Nussler, J. Stadler, E. Marzinzig, W. Barthlen, N.C.
Nussler, H.G. Beger, S.M. Morris, and U.B. Bruckner (1997) Analytical
methods: Improved methods to measure the endproducts of nitric oxide

REFERENCES 144
in biological fluids: Nitrite, nitrate and S-nitrosothiols. Nitric Oxide: Biol.
Chem., 1, 177-189.
[195] D.R. Lide (1983-1984). Handbook of Chemistry and Physics ,64th edition,
B117-118, CRC Press, London, Great Britain.
[196] D.R. Armstrong, C. Cameron, D.C. Nonhebel, and P.G. Perkins (1983)
Oxidative couplimg of phenols. A study of the role of spin density factors...
J. Chem. Soc., Perkin Trans., II, 563-568.
[197] W.L. Carrick, and G.L. Karapinka (1967) Synthese von 2,4’-Biphenol.
Chem. Abstracts, 67, 99853y.
[198] J.F. Pilichowski, P. Boule, and J.P. Billard (1995) Comportement pho-
tochimique du 4-nitrosophenol en solution aqueuse. Can. J. Chem., 73,
2143-2147.
[199] A. Fischer, R.M. Golding, and W.C. Tennant (1965) Nuclear Magnetic
Resonance studies of some aromatic nitroso-compounds. J. Chem. Soc.,
6032-6036.
[200] A. Alif, J. Pilichowski, and P. Boule (1991) Photochemistry and environ-
ment XIII: Phototransformation of 2-nitrophenol in aqueous solution. J.
Photochem. Photobiol. A: Chem., 59, 209-219.
[201] K. Muruyama, I. Tanimoto, and R. Goto (1967) Synthesis of o-
nitrosophenol. J. Org. Chem., 32, 2518-2520.
[202] G.H. Hakimelahi, H. Sharghi, H. Zarrinmayeh, and A. Khalafi-Nezhad
(1984) The synthesis and application of novel nitrating and nitrosating
agents. Helvetica Chim. Acta, 67, 906-915.
[203] G.A. Olah, H.C. Lin, J.A. Olah, and S.C. Narang (1978) Electrophilic and
free radical nitration of benzene and toluene with various nitrating agents.
Proc. Natl. Acad. Sci. USA, 75, 1045-1049.
[204] Y. Ushijima, M. Nakano, and T. Goto (1984) Production and identification
of bityrosine in horseradish peroxidase-hydrogen peroxide-tyrosine system.
Biochem. Biophys. Res. Comm., 125, 916-918.
[205] J. Balcells, J.A. Guada, and J.M. Peiro (1992) Silmultaneous dtermination
of allantoin and oxypurines in biological fluids by high-performance liquid
chromatography. J. Chromatogr., 575, 153-157.
REFERENCES 145
[206] R.N. Goyal, A. Brajter-Toth, G. Dryhurst, and N.T. Nguyen (1982) A
comparison of the peroxidase-catalyzed and electrochemical oxidation of
uric acid. Bioelectrochem. Bioenergetics, 9, 39-60.
[207] K.J. Volk, R.A. Yost, and A. Brajter-Toth (1989) On-line electrochem-
istry/thermospray/tandem mass spectrometry as a new approach to the
study of redox reactions : The oxidation of uric acid. Anal. Chem., 61,
1709-1717.
[208] M. Grootveld, and B. Halliwell (1987) Measurement of allantoin and uric
acid in human body fluids: A potentail index of free-radical reactions in
vivo? Biochem. J., 243, 803-808.
[209] J.L. Orsonneau, C. Massoubre, M. Cabanes, and P. Lustenberger (1992)
Simple and sensitive determination of urea in serum and urine. Clin. Chem.,
38, 619-623.
[210] S.S. Levinson (1978) Kinetic centrifugal analyzer and manual determina-
tion of serum urea nitrogen, with use of o-phthaldialdehyde reagent. Clin.
Chem., 24, 2199-2202.
[211] B. Langkau (1993) Studies with flavin enzymes: Catalytic mechansims of
2-aminobenzoyl-CoA monooxygenase/reductase and of yeast D-aminoacid
oxidases. Dissertation Universitat Konstanz.
[212] M.A. Noble, C.S. Miles, S.K. Chapman, D.A. Lysek, A.C. Mackay, G.A.
Reid, R.P. Hanzlik, and A.W. Munro (1999) Roles of key active-site residues
in flavocytochrome P450 BM3. Biochem. J., 339, 371-379.
[213] N. Okamoto, K. Tsuruta, Y. Imai, D. Tomura, and H. Shoun (1997) Fun-
gal P450nor: Expression in E. coli and site-directed mutageneses at the
putative distal region. Arch. Biochem. Biophys., 337, 338-344.
[214] U. Schwaneberg, C. Schmidt-Dannert, J. Schmitt, and R.D. Schmid (1999)
A continuous spectrophotometric assay for P450 BM-3, a fatty acid hydrox-
ylating enzyme, and its mutant F87A. Anal. Biochem., 269, 359-366.
[215] Y.Z. Ye, M. Strong, Z.Q. Huang, and J.S. Beckman (1996) Methods Enzy-
mol., 269, 201-209.
[216] Y. Kono, K. Kobayashi, S. Tagawa, K. Adachi, A. Ueda, Y. Sawa, and H.
Shibata (1997) Antioxidant activity of polyphenolics in diets: rate constants

REFERENCES 146
of reactions of chlorogenic acid and caffeic acid with reactive species of
oxygen and nitrogen. Biochim. Biophys. Acta, 1335, 335-342.
[217] M.B. Murataliev, and R. Feyereisen (1996) Functional interactions in cy-
tochrome P450BM3. Fatty acid substrate binding alters electron-transfer
properties of the flavoprotein domain. Biochem., 35, 15029-15037.
[218] P.C. Jocelyn (1987) Chemical reduction of disulfides. Methods Enzymol.,
143, 246-256.
[219] E.A. Merritt, and D.J. Bacon (1997) Raster3D: Photorealistic molecular
graphics. Methods in Enzymology, 277, 505-524.
[220] P.J. Kraulis (1991) MOLSCRIPT: A program to produce both detailed and
schematic plots of protein structures. Journal of Applied Crystallography,
24, 946-950.
[221] O. Sayle, and E.J. Milner-White (1995) RasMol: Biomolecular graphics for
all. Trends in Biochemical Sciences, 20, 374.
[222] R. Koradi, M. Billeter, and K. Wuthrich (1996) MOLMOL: A program for
display and analysis of macromolecular structures. J. Mol. Graphics, 14,
51-55.
[223] C. Jung, G. Hui Bon Hoa, K.L. Schrder, M. Simon, and J.P. Doucet (1992)
Biochem., 31, 12855-12862.
[224] P.J. Loida, and S.G. Sligar (1993) Engineering cytochrome P450cam to in-
crease the stereospecificity and coupling of aliphatic hydroxylation. Protein
Engineering, 6, 207-212.
[225] H. Masumoto, and H.Sies (1996) The reaction of Ebselen with peroxynitrite.
Chem. Res. Toxicol., 9, 262-267.
[226] T. Douki, J. Cadet, and B.N. Ames (1996) An adduct between
PON and 2’-desoxyguanosine: 4,5-Dihydro-5-hydroxy-4-(nitrosooxy)-2’-
deoxyguanosine. Chem. Res. Toxicol., 9, 3-7.
[227] H. Ohshima, M. Friesen, I. Brouet, and H. Bartsch (1990) Nitrotyrosine
as a new marker for endogenous nitrosation and nitration of proteins. Fd.
Chem. Toxic., 28, 647-652.
REFERENCES 147
[228] D.C. Hooper, S. Spitsin, R.B. Kean, J.M. Champion, G.M. Dickson, I.
Chaudhry, and H. Koprowski (1998) Uric acid, a natural scavenger of per-
oxynitrite, in experimentalallergic encephalomyelitis and multiple sclerosis.
Proc. Natl. Acad. Sci. USA, 95, 675-680.
[229] O.I. Aruoma, and B. Halliwell (1989) Inactivation of alpha1-antiproteinase
by hydroxyl radicals: the effect of uric acid. FEBS Letters, 244, 76-80.
[230] C.X.C. Santos, E.I. Anjos, and O. Augusto (1999) Uric acid oxidation by
peroxynitrite: Free radical formation and amplification of lipid oxidation.
Arch. Biochem. Biophys., 372, 285f.
[231] M.H. Zou, A. Daiber, M. Bachschmid, and V. Ullrich (2000) Nitration of
prostacyclin synthase: Mechanism and physiological implications. Free Rad.
Biol. Med., submitted.
[232] G. Haenen, B. De Roorj, N. Vermeulen, and A. Bast. (1989) Mechanism of
the reaction of ebselen with endogenous thiols. Mol. Pharm., 37, 412-422.
[233] V. Ullrich, P. Weber, F. Meisch, and F. von Appen. (1996) Ebselen-binding
equilibria between plasma and target proteins. Biochem. Pharmacol., 52,
15-19.
[234] B. Coxon, A.J. Fatiadi, L.T. Sniegoski, H.S. Hertz, and R. Schaffer (1977)
A novel acylative degradation of uric acid. Carbon-13 nuclear magnetic
resonance studies of uric acid and ist degradation products. J. Org. Chem.,
42, 3132-3139.
[235] B.F. Becker, N. Reinholz, T. Ozcelik, B. Leipert, and E. Gerlach (1989)
Uric acid as radical scavenger and antioxidant in the heart. Pflugers Arch.,
415, 127-135.
[236] A. Daiber, M.H. Zou, M. Bachschmid, and V. Ullrich (2000) Ebselen as
a peroxynitrite scavenger in vitro and ex vivo. Biochem. Pharmacol., 59,
153-160.
[237] G. Ferrer-Sueta, L. Ruiz-Ramirez, and R. Radi (1997) Ternary copper
complexes and manganese(III)tetrakis(4-benzoic acid)porphyrin catalyze
peroxynitrite-dependent nitration of aromatics. Chem. Res. Toxicol., 10,
1338-1344.

REFERENCES 148
[238] D. Salvemini, Z.Q. Wang, M.K. Stern, M.G. Currie, and T.P. Misko (1998)
Peroxynitrite decomposition catalysts: Therapeutics for peroxynitrite-
mediated pathology. Proc. Natl. Acad. Sci. USA, 95, 2659-2663.
[239] R. Nakajima, I. Yamazaki, and B.W. Griffin (1985) Spectra of chloroperox-
idase compounds II and III. Biochem. Biophys. Res. Commun., 128, 1-6.
[240] J.H. Capdevila, S. Wie, C. Helvig, J.R. Falck, Y. Belosludtsev, G. Truan,
S.E. Graham-Lorence, and J.A. Peterson (1996) The highly stereoselective
oxidation of polyunsaturated fatty acids by cytochrome P450BM3. J. Biol.
Chem., 271, 22663-22671.
[241] A. Ager, D.J. Wenham, and J.L. Gordon (1984) Stimulation of endothelial
cells by protease activity in commercial preparations of xanthine oxidase.
Thromb. Res., 35, 43-52.
[242] W.A. Prutz, H. Monig, J. Butler, and E.J. Land (1985) Reactions of ni-
trogen dioxide in aqueous model systems: Oxidation of tyrosine units in
peptides and proteins. Arch. Biochem. Biophys., 243,125-34.
[243] S. Goldstein, G. Czapski, J. Lind, and G. Merenyi (2000) Tyrosine nitration
by simultaneous generation of nitric oxide and superoxide under physiologi-
cal conditions. How the radicals do the job. J. Biol. Chem., 275, 3031-3036.
[244] S.S. Boddupalli, B.C. Pramanik, C.A. Slaughter, R.W. Estabrook, and J.A.
Peterson (1992) Fatty acid monooxygenation by P450BM3: Products identi-
fication and proposed mechanism for the sequential hydroxylation reactions.
Arch. Biochem. Biophys., 292, 20-28.
[245] A. Wendel, R. Otter, and G. Tiegs (1986) Inhibition by ebselen of microso-
mal NADPH-cytochrome P450-reductase in vitro but not in vivo. Biochem.
Pharmacol., 35, 2995-2997.
[246] A.O. Pedersen, and J. Jacobsen (1980) Reactivity of the thiol group in
human and bovine albumin at pH 3-9, as measured by exchange with 2,2’-
dithiodipyridine. Eur. J. Biochem., 106, 291-295.
[247] T.L. Poulos, and R. Raag (1992) Cytochrome P450cam: Crystallography,
oxygen activation and electron transfer. FASEB J., 6, 674-679.
[248] J.I. Manchester, and R.L. Ornstein (1996) Rational approach to improving
reductive catalysis by cytochrome P450cam. Biochim., 78, 714-722.

REFERENCES 149
[249] I. Schlichting, C. Jung, and H. Schulze (1997) Crystal structure of cy-
tochrome P450cam complexed with the (1S)-camphor enantiomer. FEBS
Lett., 415, 253-257.
[250] T.L. Poulos, and A.J. Howard (1987) Crystal structures of metyrapone- and
phenylimidazole-inhibited complexes of cytochrome P-450cam. Biochem.,
26, 8165-8174.
[251] G.R. Janig, A. Makower, H. Rabe, J. Friedrich, K. Ruckpaul (1984) Chem-
ical modification of tyrosine residues at the active centre of cytochrome
P450-cam. Biomed. Biochim. Acta, 43, K17-K24.
[252] A. Daiber, C. Schoneich, P. Schmidt, C. Jung, and V. Ullrich. Autocatalytic
nitration of P450CAM by peroxynitrite. Submitted to J. Inorg. Biochem..
[253] C.M. Hosten, A.M. Sullivan, V. Palaniappan, M.M. Fitzgerald, and J.
Terner (1994) Resonance Raman spectroscopy of the catalytic intermedi-
ates and derivatives of chloroperoxidase from Caldariomyces fumago. J.
Biol. Chem., 269, 13966-13978.
[254] T. Yu, A.M. Mebel, and M.C. Lin (1995) Reaction of phenoxy radical with
nitric oxide. J. Phys. Org. Chem., 8, 47-53.
[255] D.R. Armstrong, R.J. Breckenridge, C. Cameron, D.C. Nonhebel, P.L. Pau-
son, and P.G. Perkins (1983) The role of stereoelectronic factors in the
oxidation of phenols. Tetrah. Lett., 24, 1071-1074.
[256] P. Dufek, I. Cernohorsky, and V. Pacakova (1982) Gas chromatography as a
tool for the study of the products of photosensitized phenol decomposition.
Chromatography, 14, 19-28.
[257] B. Gmeiner, and C. Seelos (1989) Phosphorylation of tyrosine prevents
dityrosine formation in vitro. FEBS Letters, 255, 395-397.
[258] R. Hattori, Y. Yui, E. Shinoda, R. Inoue, T. Aoyama, H. Masayasu, C.
Kawai, and S. Sasayama (1996) Effect of ebselen on bovine and rat nitric
oxide synthase activity is modified by thiols. Jpn. J. Pharmacol., 72, 191-
193.
[259] T. Nikawa, G. Schuch, G. Wagner, and H. Sies (1994) Interaction of ebselen
with glutathione S-transferase and papain in vitro. Biochem. Pharmacol.,
47, 1007-1012.
REFERENCES 150
[260] I.A. Cotgreave, S.K. Duddy, G.E. Kass, D. Thompson, and P. Moldeus
(1989) Studies on the anti-inflammatory activity of ebselen. Ebselen inter-
feres with granulocyte oxidative burst by dual inhibition of NADPH oxidase
and protein kinase C? Biochem. Pharmacol., 38, 649-656.
[261] M.M. Palcic, R. Rutter, T. Araiso, L.P. Hager, and H.B. Dunford (1980)
Biochim. Biophys. Res. Commun., 94, 1123-1127.
[262] H.B. Dunford, and A.J. Adeniran (1986) Hammett rho sigma correlation
for reactions of horseradish peroxidase Compound II with phenols. Arch.
Biochem. Biophys., 251, 536-542.
[263] Z.S. Farhangrazi, M.E. Fossett, L.S. Powers, and W.R. Ellis Jr. (1995)
Variable-temperature spectroelectrochemical study of horseradish peroxi-
dase. Biochem., 34, 2866-2871.
[264] K. Nakahara, H. Shoun, S. Adachi, T. Iizuka, and Y. Shiro (1994) J. Mol.
Biol., 239, 158-159.
[265] H. Kopka, and P.W. Daly (1999) A guide to LATEX . Addison-Wesley, Har-
low, England.
This thesis was written with LATEX an intelligent freeware text editor [265].
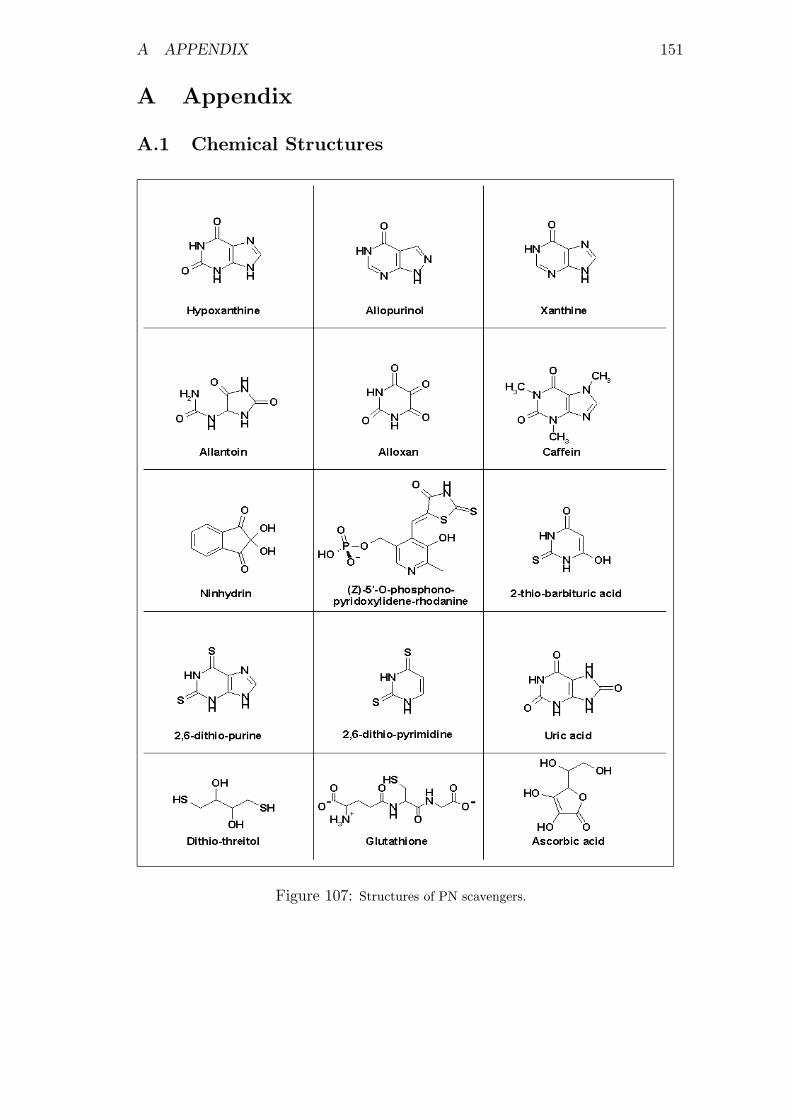
A APPENDIX 151
A Appendix
A.1 Chemical Structures
Figure 107: Structures of PN scavengers.

A APPENDIX 152
Figure 108: Structures of PN scavengers.

A APPENDIX 153
A.2 Sequences of P450CAM and P450BM−3
Table 17: Peptide-fragments from trypsin-digested P450CAM calculated by using ”Peptide
mass” (www.expasy.ch).

A APPENDIX 154
Table 18: Peptide-fragments from trypsin-digested P450BM−3 (part I) calculated by using
”Peptide mass” (www.expasy.ch).

A APPENDIX 155
Table 19: Peptide-fragments from trypsin-digested P450BM−3 (part II) calculated by using
”Peptide mass” (www.expasy.ch).

A APPENDIX 156
Table 20: Peptide-fragments from trypsin-digested P450BM−3 (part III) calculated by using
”Peptide mass” (www.expasy.ch).