diploma thesis r 1314 d optimization of the insight hp³ ... thesis torben... · diploma thesis r...
TRANSCRIPT

Diploma Thesis R 1314 D
Optimization of the InSight HP³-Mole
Torben Wippermann
September 2013
pages: 055
pictures: 042
tables: 002
Prof. Dr.-Ing. Peter Vörsmann
Technical University of Braunschweig
Institute of Aerospce Systems
Hermann-Blenk-Straße 23, 38108 Braunschweig
German Aerospace Center (DLR)
Institute of Space Systems
Department of Explorations Systems
Robert-Hooke-Straße 7, 28359 Bremen

ii
Optimization of the InSight HP³-Mole
Diploma Thesis
Torben Wippermann (matriculation number 2891468)
Institute of Aerospace Systems
Technical University of Braunschweig
September 2013
Reviewer: Prof. Dr.-Ing. Peter Vörsmann
Institute of Aerospace Systems
Technical University of Braunschweig
Dr.-Ing. Carsten Wiedemann
Institute of Aerospace Systems
Technical University of Braunschweig
Supervisor: Dr. Tim van Zoest
Department of Explorations Systems
Institute of Space Systems
German Aerospace Center (DLR) Bremen
Dipl.-Ing. (FH) Olaf Krömer
Department of Explorations Systems
Institute of Space Systems
German Aerospace Center (DLR) Bremen

iii
(Aufgabenstellung Seite 1)

iv
(Aufgabenstellung Seite 2)

v
Affidavit
I affirm in lieu of oath, that I have made the following thesis independently and only with the
aid of the specified literature.
Bremen, 17th of September 2013

vi
Overview
The German Aerospace Center (DLR) is providing the HP³-payload for the InSight-Mission of
NASA. InSight is the 12th part of the Discovery program and is supposed to investigate the
seismic activities, geodesy and heat transport of the interior of the mars [RD 13]. HP³ is the
abbreviation for Heat Flow & Physical Properties Package. It consists of a heat probe that will
measure the heat flow of the mars in depths of up to five meters. To get the probe there it is
integrated in the HP³-Mole. The HP³-Mole is a non-rotating drill that acts like a self-
hammering nail. An internal hammering mechanism, which is a three mass system, is
pushing the Mole with every stroke deeper in the Martian soil. These three masses are
linked to each other via two springs. In this thesis, several methods of improving the
advancing speed of the Mole are investigated. The changes that provide a high enhancement
will be integrated in the Prototype-Model, resp. the Engineering-Model of the Mole.
At first the optimal mass ratio of the three masses will be examined, which is composed of
the equations of the movement and strokes. For this mass ratio the mass of the outer hull
will be adjusted. First assessments show that the mass of the outer hull of the existing Mole
is too high. Besides the reducing of the mass, the outer hull should be built as thin as
possible to minimize the cross section of the mole. This will decrease the penetrating
resistance of the soil. In the new outer hull a way to integrate all the payloads and
electronics should be realized too. Another possibility to enhance the advancing speed is to
change the springs in the hammering mechanism. Further changes of the three masses and
the two springs will be considered in relation to the possible improvement of the hammering
process. The changes will be entered in an existing simulation to calculate the resulting
improvement in the penetration progress.
In the next step the cylindrical cam, which is used to tense the main spring, will be
redesigned. The aim of the change is to increase the height of the cylindrical cam. This has a
direct effect on the energy of the outer hull when hitting on the soil. The new designed
cylindrical cam has a complex shape that needs to be inserted in the simulation. The
penetrating progress will be simulated too.
Besides of the thinner Mole the shape of the tip of the Mole has a great influence on the
soils penetrating resistance. In the previous designs the tip has the shape of a cone. This will
be compared with other tips like flats, spheres, ogives and other cone angles.
In addition all the changes will be integrated in the 3D-CAD-model. The assembling of the
Mole should be considered during the designing process and should be as easy as possible.

vii
Contents
1. Introduction .................................................................................................................1
1.1. InSight ...................................................................................................................1
1.2. Principle of the HP³-Mole .......................................................................................5
1.3. Moles - State of the art ..........................................................................................6
1.4. Motivation .............................................................................................................8
2. Mole theory..................................................................................................................9
2.1. Displacement of the Force spring ...........................................................................9
2.2. Model for energy transfer .................................................................................... 13
2.3. Implementation in Mole-simulation ..................................................................... 16
3. Parameter analysis ..................................................................................................... 18
3.1. Mass ratio............................................................................................................ 18
3.2. Force spring displacement.................................................................................... 22
3.3. Spring rates ......................................................................................................... 27
3.4. Evaluation............................................................................................................ 30
4. Design changes ........................................................................................................... 32
4.1. Optimized parts of Hammering mechanism .......................................................... 32
4.2. Design of Tip shapes for testing ............................................................................ 35
4.3. Implementation in CAD-model ............................................................................. 38
5. Stress analysis............................................................................................................. 40
5.1. Hammer mass ...................................................................................................... 40
5.2. Actuator mass...................................................................................................... 42
5.3. Housing mass....................................................................................................... 44
6. Verification of improvements...................................................................................... 47
6.1. Design of Test stand ............................................................................................. 47
6.2. Performance of PT-Mole vs. BB-Mole ................................................................... 49
6.3. Performance of Hybrid-Mole vs. PT-Mole and BB-Mole......................................... 50
7. Conclusion.................................................................................................................. 52
7.1. Future work ......................................................................................................... 53
Appendix A Simulation output ...........................................................................................a
Appendix B Comparison BB-Mole and PT-Mole ................................................................. b
Appendix C Drawing of optimized Cylindrical cam .............................................................. c
Appendix D Drawings of different tips and Tip adapter ...................................................... d
Appendix E Deutsche Zusammenfassung ........................................................................... j
Appendix F Project files ................................................................................................... m
viii
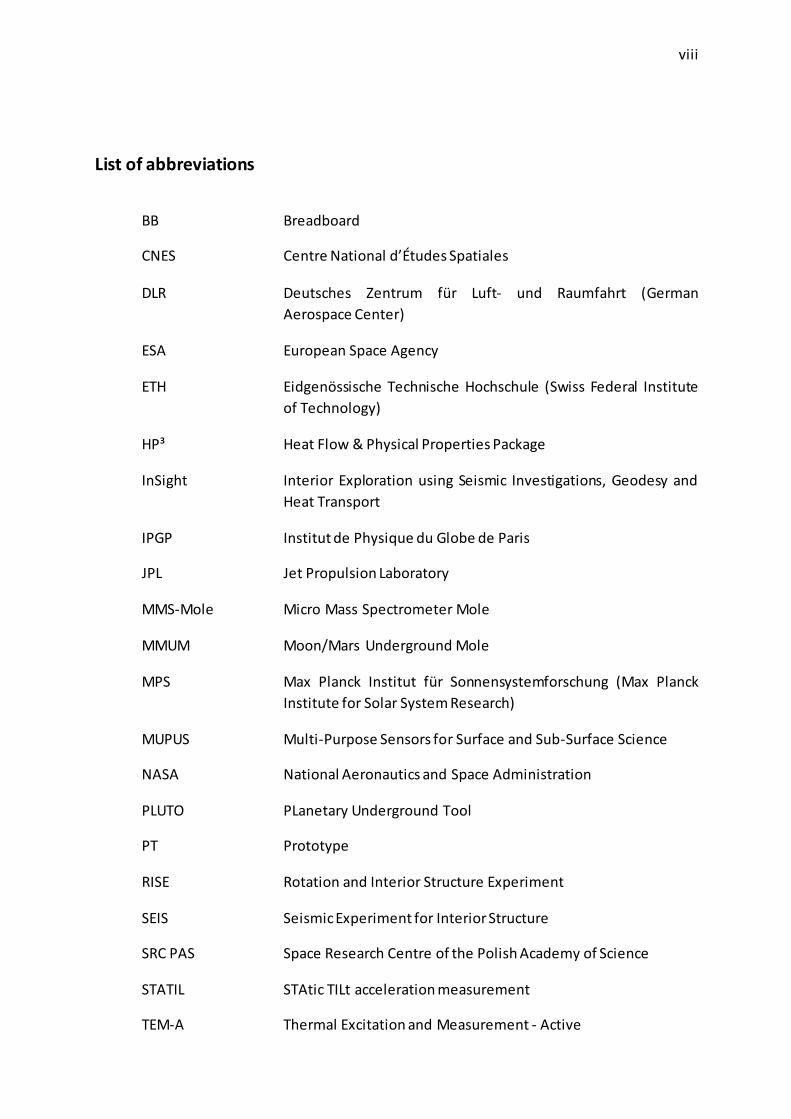
List of abbreviations
BB Breadboard
CNES Centre National d’Études Spatiales
DLR Deutsches Zentrum für Luft- und Raumfahrt (German
Aerospace Center)
ESA European Space Agency
ETH Eidgenössische Technische Hochschule (Swiss Federal Institute
of Technology)
HP³ Heat Flow & Physical Properties Package
InSight Interior Exploration using Seismic Investigations, Geodesy and
Heat Transport
IPGP Institut de Physique du Globe de Paris
JPL Jet Propulsion Laboratory
MMS-Mole Micro Mass Spectrometer Mole
MMUM Moon/Mars Underground Mole
MPS Max Planck Institut für Sonnensystemforschung (Max Planck
Institute for Solar System Research)
MUPUS Multi-Purpose Sensors for Surface and Sub-Surface Science
NASA National Aeronautics and Space Administration
PLUTO PLanetary Underground Tool
PT Prototype
RISE Rotation and Interior Structure Experiment
SEIS Seismic Experiment for Interior Structure
SRC PAS Space Research Centre of the Polish Academy of Science
STATIL STAtic TILt acceleration measurement
TEM-A Thermal Excitation and Measurement - Active

ix
TEM-P Thermal Excitation and Measurement – Passive
TiME Titan Mare Explorer
TLM Tether Length Measurement
WTS Wind and Thermal Shield

x
Formula symbols
Latin alphabet
Aep projected cross-section for equal pressure ogive
Agb contact area between Guide block and Hammer support structure
Astroke contact area between Hammer and Tip
bgb width of Guide block at contact are
cb spring rate of Brake spring
cf spring rate of Force spring
coc spring rate of Outer casing
cs spring rate of stand spring
Ch HAACK ogive constant
dha diameter of Hammer
di,t inner diameter of Tip
di,oc inner diameter of Outer casing
D outer diameter of the Mole
E1,kin kinetic energy of hammer mass prior to primary stroke
E1,kin,p kinetic energy of hammer mass after primary stroke
E12,kin kinetic energy of hammer and actuator mass prior to secondary stroke
E12,kin,p kinetic energy of hammer and actuator mass after secondary stroke
E2,kin kinetic energy of actuator mass
E3,kin kinetic energy of housing mass for one hammering cycle
E3,kin,1 kinetic energy of housing mass after primary stroke
E3,kin,2 kinetic energy of housing mass after secondary stroke
Ediss,1 dissipative loss for primary stroke
Ediss,2 dissipative loss for secondary stroke
Ef Force spring energy
Es stand spring energy
Es,1 stand spring energy due to first stroke
Es,2 stand spring energy due to second stroke
Es,fric energy losses due to friction
ETi YOUNG’s modulus of TiAl6V4
EX12 YOUNG’s modulus of MarvalX12
Fa driving force
Fa,n normal part of driving force
Fa,p parallel part of driving force
Fbr load force of Roller
Fbr,max maximum load force of Roller
xi
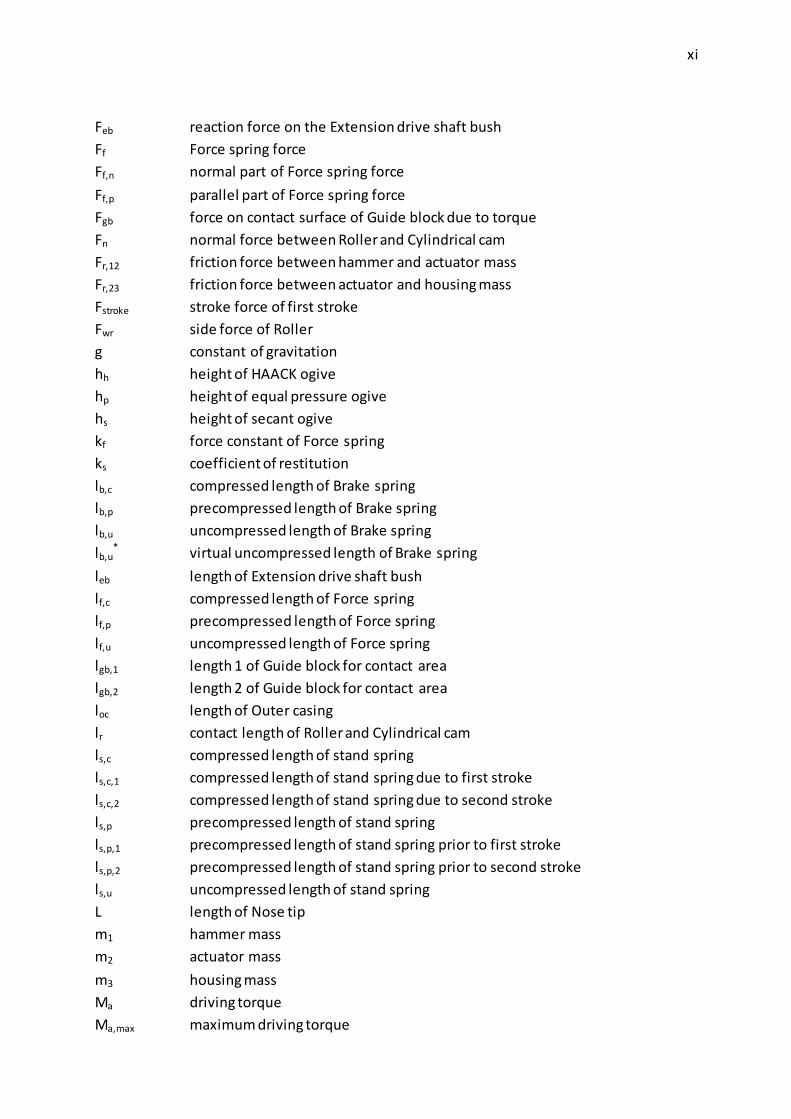
Feb reaction force on the Extension drive shaft bush
Ff Force spring force
Ff,n normal part of Force spring force
Ff,p parallel part of Force spring force
Fgb force on contact surface of Guide block due to torque
Fn normal force between Roller and Cylindrical cam
Fr,12 friction force between hammer and actuator mass
Fr,23 friction force between actuator and housing mass
Fstroke stroke force of first stroke
Fwr side force of Roller
g constant of gravitation
hh height of HAACK ogive
hp height of equal pressure ogive
hs height of secant ogive
kf force constant of Force spring
ks coefficient of restitution
lb,c compressed length of Brake spring
lb,p precompressed length of Brake spring
lb,u uncompressed length of Brake spring
lb,u* virtual uncompressed length of Brake spring
leb length of Extension drive shaft bush
lf,c compressed length of Force spring
lf,p precompressed length of Force spring
lf,u uncompressed length of Force spring
lgb,1 length 1 of Guide block for contact area
lgb,2 length 2 of Guide block for contact area
loc length of Outer casing
lr contact length of Roller and Cylindrical cam
ls,c compressed length of stand spring
ls,c,1 compressed length of stand spring due to first stroke
ls,c,2 compressed length of stand spring due to second stroke
ls,p precompressed length of stand spring
ls,p,1 precompressed length of stand spring prior to first stroke
ls,p,2 precompressed length of stand spring prior to second stroke
ls,u uncompressed length of stand spring
L length of Nose tip
m1 hammer mass
m2 actuator mass
m3 housing mass
Ma driving torque
Ma,max maximum driving torque

xii
Mb,ds bending moment on Drive shaft
Pal,CA104 maximum allowed contact pressure for CA104
Peb specific bush load on Extension drive shaft bush
pgb contact pressure between Guide block and Hammer support structure
pr,max maximum HERTZian stress of Roller
ra outer radius of Cylindrical cam
rar outer radius of Roller
rgb,1 radius 1 of Guide block for contact area
rgb,2 radius 2 of Guide block for contact area
rgb,3 radius 3 of Guide block for contact area
rgb,m mid radius for contact area of Guide block
rh radius of HAACK ogive
ri inner radius of Cylindrical cam
rm mid radius of Cylindrical cam
rp radius of equal pressure ogive
rs radius of secant ogive
R outer radius of the Mole
Ra radius of the Roller at the outer radius of Cylindrical cam
Ri radius of the Roller at the inner radius of Cylindrical cam
Rp0.2,X12 yield strength of MarvalX12
s height of Cylindrical cam, Force spring displacement
s1 height of Cylindrical cam at end of 1st segment
s2 height of Cylindrical cam at end of 2nd segment / maximum height
ss stand spring displacement
s’ slope of Cylindrical cam
Seb safety factor for Extension drive shaft bush
Sgb safety factor for Guide block
Sm safety factor for driving torque
Sr safety factor for Roller
St safety factor for Tip
Upot,ho potential energy of housing after first stroke
v1 velocity of hammer mass
v12 velocity of hammer and actuator mass
xgb,1 projected length 1 of Guide block for contact area
xgb,2 projected length 2 of Guide block for contact area
xgb,3 projected length 3 of Guide block for contact area
xoc deformation of Outer casing
z/b ratio of depth and contact pressure width of Roller

xiii
Greek alphabet
α inclination of Roller path
βs angle of slope of Cylindrical cam
θ HAACK ogive variable
λ secant ogive constant
μro coefficient of friction for rolling
μru coefficient of friction for slipping
ν POISSON’s ratio
ρs ogive radius of secant shape
ρt ogive radius of tangent shape
σt maximum compressive stress of Tip
σfa,Ti allowed fatigue stress of TiAl6V4
σvg equivalent stress of Roller
σvg,max maximum equivalent stress of Roller
σx stress in local x-direction of Roller
σy stress in local y-direction of Roller
σz stress in local z-direction of Roller
φs rotational angle of Cylindrical cam
φs,1 rotational angle of Cylindrical cam at end of 1st segment
φs,2 rotational angle of Cylindrical cam at end of 2nd segment / at the end of cam
χ inclination angle of Mole

xiv
List of figures
Fig. 1.1: TiME and Comet Hopper .........................................................................................1
Fig. 1.2: Probes of the Discovery Program.............................................................................2
Fig. 1.3: InSight lander with HP³, SEIS and RISE......................................................................3
Fig. 1.4: Subsystems of HP³ ..................................................................................................3
Fig. 1.5: Stages during operation of the HP³-Mole .................................................................5
Fig. 1.6: PLUTO-Mole ...........................................................................................................7
Fig. 2.1: Forces on the Roller ................................................................................................9
Fig. 2.2: Forces between Cylindrical cam, Roller and Hammer ............................................. 10
Fig. 2.3: Inclination χ of the Mole ....................................................................................... 12
Fig. 2.4: Velocities of m1 and m2 prior to the primary stroke................................................ 13
Fig. 2.5: Velocities of m1 and m3 after the primary stroke .................................................... 13
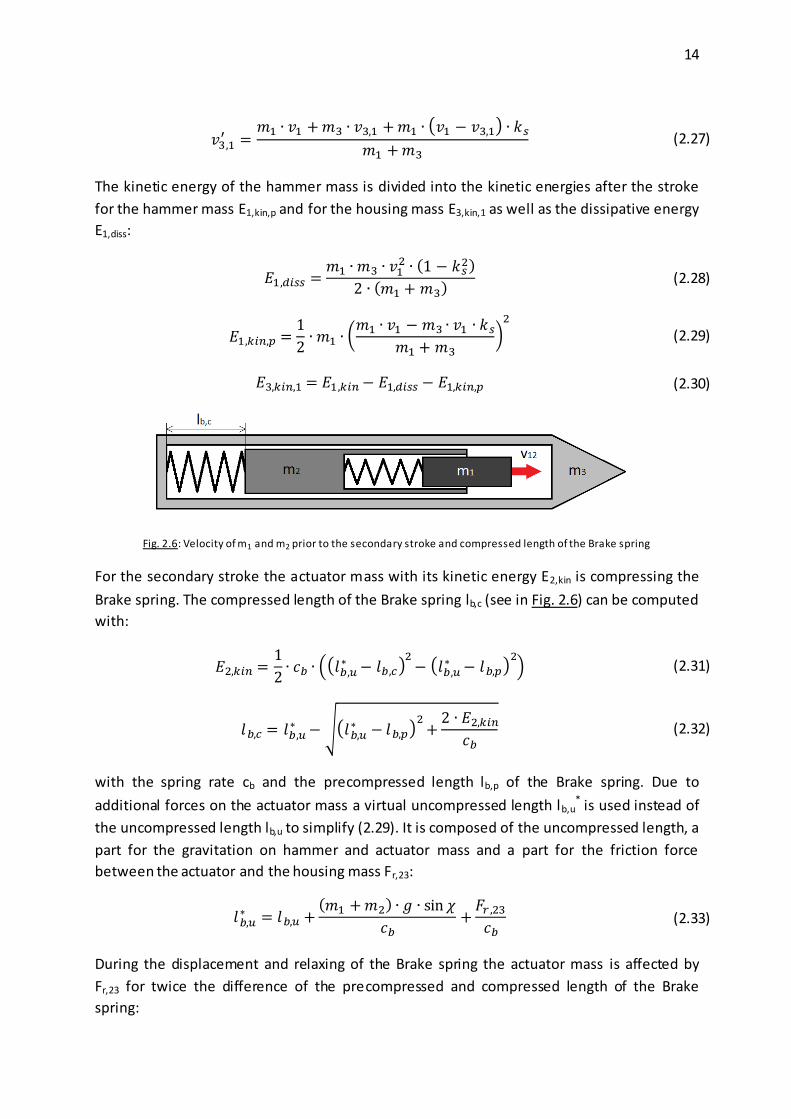
Fig. 2.6: Velocity of m1 and m2 prior to the secondary stroke and compressed length of
the Brake spring ................................................................................................... 14
Fig. 2.7: Velocities for m1 and m2 as well as m3 after the secondary stroke .......................... 15
Fig. 2.8: Torque on gear box for PT-Mole ............................................................................ 16
Fig. 3.1: Optimization of the housing mass for the PT-Mole................................................. 19
Fig. 3.2: Theoretical optimization of mass ratio – hammer mass.......................................... 20
Fig. 3.3: Theoretical optimization of mass ratio – actuator mass.......................................... 20
Fig. 3.4: Theoretical optimization of mass ratio – housing mass........................................... 21
Fig. 3.5: Optimization of the hammer mass for restricted values for actuator and housing ... 22
Fig. 3.6: Optimal used driving torque .................................................................................. 23
Fig. 3.7: Isometric view of the Cylindrical cam..................................................................... 23
Fig. 3.8: Different approaches for optimized shape of Cylindrical cam ................................. 25
Fig. 3.9: Different approaches for optimized slope of Cylindrical cam .................................. 25
Fig. 3.10: Different approaches for optimized torque of gear box ........................................ 26
Fig. 3.11: Optimization of Force spring rate – spring displacement ...................................... 27
Fig. 3.12: Optimization of Force spring rate – kinetic energy of housing............................... 28
Fig. 3.13: Comparison of optimized Cylindrical cam with PT-spring and with optimized
spring ................................................................................................................... 28
Fig. 3.14: Optimization of Force spring rate – change in overall Mole length........................ 29
Fig. 3.15: Optimization of the Brake spring rate for the PT-Mole ......................................... 30
Fig. 4.1: Assembly of TEM-A foils and covers to Outer casing............................................... 32
Fig. 4.2: Payload compartment of the PT-Mole ................................................................... 33
Fig. 4.3: Assembled payload compartment ......................................................................... 34
Fig. 4.4: Design criteria for tangent ogive............................................................................ 36
Fig. 4.5: Design criteria for secant ogive.............................................................................. 36
Fig. 4.6: Design criteria of equal pressure tip ...................................................................... 38

xv
Fig. 5.1: Parts of the Hammer assembly .............................................................................. 40
Fig. 5.2: Dimensions of Guide block .................................................................................... 41
Fig. 5.3: Loads on the Extension drive shaft bush ................................................................ 43
Fig. 5.4: Contact area of Hammer and Tip ........................................................................... 45
Fig. 6.1: Test stand with PT-Mole........................................................................................ 48
Fig. 6.2: Complete performance test of the BB-Mole........................................................... 49
Fig. 6.3: Scope on the strokes of two cycles for the BB-Mole ............................................... 50

xvi
List of tables
Tab. 3.1: Parameters of BB-Mole ........................................................................................ 18
Tab. 3.2: Summary of improvements .................................................................................. 30

1
1. Introduction
This diploma thesis deals with the HP³-system which is part of the InSight mission. The
background of this mission and previous Moles will be discussed in this chapter.
1.1. InSight
InSight was part of the final three proposed missions for NASA’s Discovery Program. Its
mission contains of a lander, similar to the Phoenix lander, which will land on Mars and will
deploy two of the scientific payloads to the surface. The payloads, SEIS, HP³ and RISE, will
investigate the interior of Mars to help understand the building of Mars and other terrestrial
planets [RD 15].
The other two missions of the final round were the Titan Mare Explorer (TiME) and Comet
Hopper. TiME’s purpose was to examine a lake on Titan and measure its carbon cycle while
sailing on the lake. Comet Hopper was intended to land and hop on the comet Wirtanen to
investigate the comet on different places and observe it during its approach to the sun. In
August 2012 InSight was selected to be the next mission of the Discovery Program [RD 13].
Fig. 1.1: TiME [RD 13] and Comet Hopper [RD 14]
1.1.1. The Discovery Program
NASA’s Discovery Program has the purpose to realize many small and focused missions to
explore the solar system. The missions should have a short development time and limited
resources. Since 1992 the program was able to bring 11 missions to launch and has with
InSight the twelfth mission in development. A few examples for these missions are the Mars
Pathfinder, which contained the first rover on mars, Sojourner, and Deep Impact, which was
the first to probe the surface of a comet. Stardust, which sampled cometary and interstellar

2
dust to return it to earth, and Kepler, the space telescope, were also part of this program
[RD 12] [RD 13]. An overview of all started Discovery missions is shown in Fig. 1.2.
Fig. 1.2: Probes of the Discovery Program [RD 12]
Beneath the pure scientific use, the Discovery Program also distributes the educational and
public outreach of the missions and their discoveries.
1.1.2. InSight mission, spacecraft and payloads
The InSight mission will launch in March 2016 and will land on Mars in September 2016. The
lander is of the same type as the Mars lander for Phoenix, which successfully landed on Mars
in 2007. The robotic arm that was used on the Phoenix lander to get a soil sample to the
lander deck will also be used. Now it will be used to grab the SEIS and the HP³-instrument
and place it next to the lander on the soil. Prior to that, cameras on the lander observe the
deployment area to verify a suitable position for the instruments. SEIS, which will be the first
instrument to deploy, is a seismometer build by the French space agency CNES with
participation of the Institut de Physique du Globe de Paris (IPGP), the Swiss Federal Institute
of Technology (ETH), the Max Planck Institute for Solar System Research (MPS), the Imperial
College and the Jet Propulsion Laboratory (JPL). It will measure quakes and other internal
processes of Mars. On top of SEIS the Wind and Thermal Shield (WTS) will be placed. It will
separate SEIS from the Martian environment to reduce disturbances from the wind or
temperature fluctuations. The next payload, to be deployed, is HP³, which will be described
in detail in 1.1.3. It is developed by the German Aerospace Center (DLR). RISE, the last of the
payloads, will stay on the lander. It measures the Doppler shift of Mars on the
communication to Earth. This can be used to determine the precession and nutation of the
Martian rotation. Several small instruments, like a radiometer or a magnetometer, will assist
the measurements and help to specify the disturbances [RD 15].

3
Fig. 1.3: InSight lander with HP³ (left front), SEIS (right front) and RISE (antennas on the lander) [RD 15]
The operational time of the instruments will be approximately two years. Fig. 1.3 shows the
InSight mission after the deployment was executed.
1.1.3. Set up and scientific use of HP³
The HP³-system consists of the Mole (1), the Science tether (2), the Support structure (3), the
Engineering tether (4), the Back End Electronics (BEE) box and a radiometer (not on the
picture). The subsystems are displayed in Fig. 1.4 which shows a newer version of HP³ as
Fig. 1.3.
Fig. 1.4: Subsystems of HP³ [RD 3]

4
Mole
The Mole is a non-rotating drill that should penetrate itself into the Martian soil. For that
purpose it uses an internal hammering mechanism. This hammering mechanism is the main
topic of this diploma thesis and is described in detail in 1.2. The goal for the Mole is to reach
at least 3 meter below surface. At maximum it can reach a depth of 5 meter. This depth is
given as a limit to avoid that the Mole reaches possible ground water. The hammering
mechanism will be operated in several intervals. After every 0.5 meter the hammering will
be stopped, the Mole and the surrounding soil are resting for 48 hours and a measuring
phase of 24 hours will take place. After that the Mole is penetrating again till it reaches the
next measuring depth.
The Mole also includes a part of the TEM-sensors. TEM stands for Thermal Excitation and
Measurement. Integrated in the outer hull are two heating foils, called TEM-A. They are the
active part of the TEM-sensors. They will heat up the soil during the measuring phase. As the
dissipating heat can be measured inside the foils, it is possible to read out the part of the
thermal energy, which is transferred to the soil. With this measurement the conductivity of
the Martian soil can be determined.
Another set of sensors is integrated on the inside of the Mole and behind the hammering
mechanism. These sensors are called STATIL, STAtic TILt acceleration measurement. They
consist of two accelerometers with two measuring axis each. Both accelerometers are
positioned in a defined angle to each other and their positions are calibrated to the Mole.
With this array the orientation of the Mole during the whole operation can be monitored. If
the Mole is not penetrating straight downwards it can be observed with STATIL.
Science tether
The Science tether is constructed like a flexprint cable. It consists of three layers of Kapton
tape with two layers of copper lines embedded. The copper lines are connected to the
internal of the Mole so that it is possible to operate the Motor, STATIL and TEM-A. The read
out of the data of TEM-A and STATIL will also be conveyed to the Support structure, where
the Science tether is attached to. In addition to the operation of the Mole, the Science tether
is functioned as a sensor itself. It builds the passive part of the TEM-sensors, TEM-P. TEM-P
consists of several temperature sensors glued on one side of the Kapton. The second layer of
copper lines is connected to each of the sensors separately. The purpose of the temperature
sensors is to measure the temperature gradient inside the reached depth on Mars. As the
sensors are fixed at defined positions and will record the temperature during each of the
measuring phases, it is possible to derive the depth dependence of the geothermal heat. In
combination with TEM-A it is possible to calculate the heat flow of Mars.
To reach the maximum depth, the Science tether has a length of 5 meter.

5
Engineering tether
The Engineering tether consists of three separate flexprint cables, which are fixed to each
other in various points of their three meter length. The three tethers serve for the electrical
connection of the Mole, the Science tether and the smaller subsystems inside the Support
structure with the BEE box on the lander deck. It is stored in the Support structure and will
be pulled out during the deployment with the robotic arm.
Support structure
The Support structure holds all the subsystems during launch, cruise, landing and
deployment. The Mole is stored during these phases in the long tube on the left on Fig. 1.4.
Apart from the Mole, Science tether and Engineering tether, the Support structure is
equipped with launch locks for the Mole, heaters for the tethers and the Tether Length
Measurement (TLM). TLM is reading a code of black squares on the Science tether, which
can be translated in the length of the Science tether at the point it passes TLM. In addition
with STATIL inside the Mole, it is possible to determine the position of the Mole during the
whole penetrating process. This is mandatory to allocate the data of TEM to a verified depth
[RD 16].
1.2. Principle of the HP³-Mole
Fig. 1.5: Stages during operation of the HP³-Mole [RD 10]

6
This chapter will give an overview of the work principle of the hammering mechanism of the
HP³-Mole. The mechanism consists of three masses and two springs between those masses.
The masses are the hammer mass, the actuator mass and the housing mass. The two springs
are the Force spring and the Brake spring. Fig. 1.5 shows the schematic setup of the
hammering mechanism and the different stages during the operation.
At the beginning of a cycle (stage a) the Force spring and the Brake spring are
precompressed and the three masses are not moving. The motor inside the actuator mass is
attached to a drive shaft with a roller mounted perpendicular to the shaft. This roller is
positioned on a cylindrical cam, which is part of the hammer mass. As the motor rotates the
drive shaft, the roller is rolling on the ramp of the cylindrical cam. This pulls the hammer
mass towards the actuator mass. With the Force spring between those two masses the
spring is loading during the rotation of the drive shaft. This displacement continues during
stage b and ends in stage c when the Roller is at the highest point of the cylindrical cam and
the Force spring fully compressed. After the end of the ramp, the roller is free and the Force
spring transfers its potential energy into kinetic energy for the hammer and the actuator
(stage d). The hammer hits the housing mass and the whole system is pushed deeper into
the soil. At the same time the actuator mass is sliding upwards and compresses the Brake
spring (stage e). The Brake spring unloads as well and accelerates the actuator together with
the hammer towards the tip. A second, smaller hit occurs and pushes the Mole another step
deeper into the soil (stage f). After that, the masses and springs are in their starting position
for the next cycle. The whole cycle takes place during one revolution of the drive shaft. For
the HP³-Mole this cycle takes about 3 seconds, where the stroke part lasts for approx. 0.1
seconds.
As the Mole is a closed system with no force from the outside (except for gravity), there
should be hardly any movement of the Mole. But as the fast movement of the housing mass
overcomes the static friction and the slow backwards movement of the actuator doesn’t, the
Mole can penetrate the soil. It doesn’t even needs the help of gravity as it can also penetrate
in horizontal direction.
1.3. Moles - State of the art
There are various developed Moles or Mole-related instruments so far. The common base of
these systems is that they contain an internal hammering mechanism that allows
penetration into the subsurface of its target.
1.3.1. PLUTO-Mole
PLUTO (PLanetary Underground TOol) is a Mole sampling mechanism that was part of Beagle
2 on the MarsExpress mission of ESA. It is one of the predecessors of HP³ and was also
developed by DLR. In addition to the hammering mechanism PLUTO had a sample chamber

7
inside the tip. It was possible to open it in the designated depth, take the sample and return
to the surface. The return was established with less powerful backwards strokes assisted
with a winch on the surface. As Beagle 2 failed to operate on Mars, PLUTO wasn’t
penetrating Mars in the end. Fig. 1.6 shows the PLUTO-Mole [RD 10].
Fig. 1.6: PLUTO-Mole [RD 10]
1.3.2. MUPUS
MUPUS (Multi-Purpose Sensors for Surface and Sub-Surface Science) is a Mole-like
instrument on the Philae-Lander of Rosetta. The basic functionality is comparable to other
Moles and it is used for several different measurements on 67P/Churyumov-Gerasimenko. In
one point it is fundamental different compared to other Moles: The hammering mechanism
stays above the surface and only an instrumented rod will be penetrating the comet. For this
reason the hammering mechanism is significant bigger than on other Moles. The rod is
instrumented with sensors to determine the heat flow of the comet. MUPUS will start
operating towards the end of 2014 [RD 4].
1.3.3. MMUM
The Moon/Mars Underground Mole (MMUM) is a concept of NASA for an instrumented
Mole which should also take a soil sample. With a diameter of 40 mm, a length of 600 mm
and weight of approx. 2 kg, it is bigger as other Moles that actually penetrate the soil. The
planned instruments inside the MMUM are a Raman-spectrometer and temperature sensors
[RD 17].
1.3.4. KRET
KRET (Polish for mole) is a Mole developed by the Space Research Centre of the Polish
Academy of Science (CRS PAS). The hammering mechanism is more complex as in the HP³-

8
Mole. The displacement of the Force spring is taken place during several revolutions of the
drive shaft and the hammer is hold by a latch during this phase. This allows a bigger
displacement of the spring and a bigger energy output per stroke. Hence the time for each
cycle is longer. CRS PAS also performed some tests with regard to different tip shapes and
their influence on the penetration performance. The scientific use of this Mole is in
characterizing soil parameters. During penetration the output energy is known and with
defined soil a calibration for the digging performance and its relation to soil parameters can
be established. When the KRET is penetrating another soil, it is possible to derive some
parameters with this calibration [RD 9].
1.3.5. Cryo-Mole / MMS-Mole
The Cryo-Mole and the MMS-Mole are two concepts developed by the DLR, which are
closely related to the HP³-Mole.
The Cryo-Mole is a combination of a Mole and a melting probe. Additional to the i nternal
hammering mechanism it has external heating foils attached. With this combination it is
possible to penetrate into subsurfaces inaccessible for pure Moles or pure melting probes.
These are areas of soil with ice enclosures or ice with contaminations in it. Examples for this
are the pole regions of Mars or ice in Antarctica. If a pure Mole hits an ice enclosure it will
probably be stuck or will be slowed down immensely, depending on the size of the ice. A
heat probe in dirty ice can melt away most of the ice, but as it proceeds deeper a soil layer
around the tip will assemble. In both cases the other instrument would be useful as well.
The MMS-Mole (micro-mass spectrometer-Mole) is a Mole with an integrated mass
spectrometer developed by the Open University in Milton Keanes (UK). It is an bigger Mole
in diameter to fit in the instrument and with some specification to allow the operation of the
mass spectrometer. This Mole is big enough to store other small instruments, e.g. a Radon
detector developed by the French “Institut de Recherche en Astrophysique et Planétologie”.
Therefor the MMS-Mole has a modular setup to allow simple changes to the design without
remodeling the whole system.
1.4. Motivation
The hammering mechanism of the HP³-Mole is unchanged since a few models. A better
performance of the Mole while restricted by the same requirements as before can increase
the possibility to reach the maximum depth of 5 meter. Therefor several changes in the
design are considered and estimated with the effort of implementing them. Even if the
changes will not be used for the InSight mission, an evolution of the HP³-Mole can increase
the chance for the use of this system in later missions. To enable these options, this thesis is
handling the analytical calculation of improvements, their implementation in the system and
their testing and comparison with the theory.

9
2. Mole theory
In the following chapter the basic equations for one hammering cycle are described. They
are used to calculate the actual and possible performances of the Mole and to compare
these with another.
2.1. Displacement of the Force spring
The first part of a hammering cycle is the displacement of the Force spring. In this phase the
Roller is rotated with the Drive shaft. With the driving force Fa it is pushed against the
Cylindrical cam. The Cylindrical cam is then pressed against the Force spring with the Force
spring force Ff. Therefor the Force spring is compressed. Between the Roller and the
Cylindrical cam the normal force Fn is at work. The friction for the rolling Roller on the
Cylindrical cam is then μro * Fn with the coefficient of friction for rolling μro. The occurring
forces on the Roller are shown in Fig. 2.1.
Fig. 2.1: Forces on the Roller
The driving and Force spring forces are split in normal and parallel parts. The equations of
equilibrium are:
(2.1)
(2.2)

10
With the gradient angle of the Cylindrical cam βs the normal and parallel forces can be
replaced with the original forces:
(2.3)
(2.4)
(2.5)
(2.6)
Solving this system of equations for Fa and put in the slope of the Cylindrical cam s’
(2.7) gives
(2.8)
The drive torque of the Motor and Gear box is needed for two parts. One part is the driving
force. It has the lever arm rm, which is the mid radius of the Cylindrical cam:
(2.9)
with the outer radius ra and the inner radius ri of the Cylindrical cam. The second part is used
for the friction force μru*Fwr between Roller and Hammer (see Fig. 2.2), with the coefficient
of friction for slipping μru. Its lever arm is the outer radius of the Roller rar.
Fig. 2.2: Forces between Cylindrical cam, Roller and Hammer
11
The occurring loads are multiplied with a safety factor Sm. This results in the formula for the
driving torque Ma, which has to be always lower than the maximum driving torque available:
( ) (2.10)
On the Roller appears the Roller load force Fbr which is composed of the driving force and
the Force spring force:
√
(2.11)
As seen in Fig. 2.2 the Roller side force Fwr can then be calculated with:
(2.12)
whereas α is the inclination of the Roller path. Inserting the equations (2.8), (2.11) and (2.12)
in (2.10) provides
(
√(
)
) (2.13)
The Force spring force Ff can be computed by
(2.14)
( ) (2.15)
where s is the height of the Cylindrical cam, cf is the spring rate for the Force spring. The
Force spring force constant kf contains the force due to the precompressed Force Spring by
lf,u – lf,p, the force of friction between the hammer and the Hammer support structure Fr,12
and the gravitation of the hammer with the inclination angle χ (see Fig. 2.3). For the
comparisons in this thesis χ is set to 90°, which also provides the highest loads. As shown in
2.2 the mass of the hammer is not fixed and therefor is k f not a real constant, but it is as a
good approach since:
( ) (2.16)
For example with values for the Breadboard-model: 23.0 N >> 1.0 N. With the Force spring
force (2.14) the equation (2.13) can be converted in the differential equation for the driving
torque:
( ) (
√(
)
) (2.17)

12
Fig. 2.3: Inclination χ of the Mole
The height s is a function of the rotational angle of the Cylindrical cam φ s. In all following
considerations the slope of the Cylindrical cam is not constant and can change its value with
the rotational angle φs, too. The remaining parameters of (2.16) are geometrical values,
coefficients of friction or other constants. Hence the driving torque is a function of s and s’,
which change with φs:
( ( ) ( )) (2.18)
For the equations of the strokes the length of the compressed Force spring l f,c is needed. This
can be calculated with the maximum height of the Cylindrical cam s2 and the precompressed
length for the Force spring l f,p:
(2.19)
( ) (2.20)
( )
( ( )
( ) √(
( ) ( )
)
)
(2.21)
with φs,2 the rotational angle at the end of the Cylindrical cam.

13
2.2. Model for energy transfer
In the following passage the model for the energy transfer for the primary and secondary
stroke is discussed. After the displacement of the Force spring it stores the Force spring
energy Ef, which is the initial energy for the model:
(( )
( )
) (2.22)
with the uncompressed length lf,u and the precompressed length lf,p of the Force spring.
After the release of the Roller the Force spring energy splits into two kinetic energies for the
hammer mass E1,kin and the actuator mass E2,kin (compare with Fig. 2.4):
(2.23)
(2.24)
Fig. 2.4: Velocities of m1 and m2 prior to the primary stroke
The velocity of the hammer mass before the primary stroke is
√
(2.25)
Fig. 2.5: Velocities of m1 and m3 after the primary stroke
After the primary stroke the resulting velocities of the hammer mass and the housing mass
shown in Fig. 2.5 are calculated (compared to [RD 1]) with:
( )
(2.26)
14
( )
(2.27)
The kinetic energy of the hammer mass is divided into the kinetic energies after the stroke
for the hammer mass E1,kin,p and for the housing mass E3,kin,1 as well as the dissipative energy
E1,diss:
( )
( ) (2.28)
(
)
(2.29)
(2.30)
Fig. 2.6: Velocity of m1 and m2 prior to the secondary stroke and compressed length of the Brake spring
For the secondary stroke the actuator mass with its kinetic energy E2,kin is compressing the
Brake spring. The compressed length of the Brake spring lb,c (see in Fig. 2.6) can be computed
with:
((
) (
) ) (2.31)
√(
)
(2.32)
with the spring rate cb and the precompressed length lb,p of the Brake spring. Due to
additional forces on the actuator mass a virtual uncompressed length lb,u* is used instead of
the uncompressed length lb,u to simplify (2.29). It is composed of the uncompressed length, a
part for the gravitation on hammer and actuator mass and a part for the friction force
between the actuator and the housing mass Fr,23:
( )
(2.33)
During the displacement and relaxing of the Brake spring the actuator mass is affected by
Fr,23 for twice the difference of the precompressed and compressed length of the Brake
spring:

15
( ) (2.34)
The velocity of the hammer and actuator mass before the secondary stroke v12 (Fig. 2.6) is
calculated from the kinetic energy of those masses E12,kin:
√
(2.35)
Fig. 2.7: Velocities for m1 and m2 as well as m3 after the secondary stroke
Equally to the primary stroke the velocities of the hammer and actuator mass v12’ and the
housing mass v3,2’ (Fig. 2.7) are calculated with:
( ) ( )
(2.36)
( ) ( ) ( )
(2.37)
The secondary stroke results in the kinetic energies for the hammer and actuator mass
E12,kin,p and for the housing mass E3,kin,2 after the stroke and results also in the dissipative
energy of the stroke E12,diss:
( )
( )
( ) (2.38)
( ) (
( )
)
(2.39)
(2.40)
The kinetic energies of the housing E3,kin,1 in (2.27) and E3,kin,2 in (2.35) displace the Mole
dependent of the properties of the surrounded soil. For further studies the totally kinetic
energy E3,kin for one hammering cycle is computed with:
(2.41)
The variables that influence this energy are the spring rates cb and cf and the three masses
m1, m2 and m3. Furthermore the maximum height of the Cylindrical cam s2, which is the

16
same as the displacement length of the Force spring, affects the kinetic energy of the
housing (this was shown in 2.1):
( ) (2.42)
This set of parameters builds the baseline for investigating the possibilities of improvements
to the Hammering mechanism in chapter 3.
2.3. Implementation in Mole-simulation
To evaluate the influence of design changes on a Mole model, the department of exploration
systems developed a simulation for Moles [RD 8]. It was written in MATLAB with Simulink.
All the necessary data can be filled in the initial file, such as masses, overall dimensions and
spring properties. As results the simulation outputs the needed current and torque of the
motor/gear box combination during the displacement phase, the energies of the three
masses during the strokes phase and the penetration depth over time. In Fig. 2.8 the torque
for the motor during displacement of the Force spring over one revolution of the Drive Shaft
is displayed. This example represents the shape of the Cylindrical cam of the PT-Mole design.
The maximum torque of the motor and gear box is marked with the horizontal lines. The full
output of the simulation shows Appendix A.
Fig. 2.8: Torque on gear box for PT-Mole
To get to those results, the simulation used a similar set of equations like those in 2.1 and
2.2 in the past. During this thesis the equations were enhanced to include all the additional
parameters that were stated in 2.1 and 2.2. These were more detailed coefficients of friction
and the safety factor σm. In the previous version of the simulation, the shape of the
Cylindrical cam could only described as up to three discrete slopes in three specified
sections. This part of the simulation was changed to allow variable slopes. Therefor it is now
possible to use functions and their derivatives for the shape and change parameters in them.

17
The part for the penetration rate uses the energy of the Outer Hull , the dimensions of the
Mole and a soil model to compute the penetrated distance per stroke. As some of the so il
parameters are dependent of the depth, the simulation uses Simulink to calculate the
penetration depth over time. For most of the issues of this thesis this part of the simulation
is sufficient and wasn’t changed. The soil model reaches its limits for the different Tip
shapes. That will be treated in 4.2.

18
3. Parameter analysis
Like it was shown in 2.2 the energy transferred to the housing is correlated to several
parameters of the system. In the following chapter these parameters will be divided in three
groups: the masses, the Force spring displacement and the spring rates.
The baseline that provides the remaining or yet unchanged parameters is the Breadboard-
model of the HP³-Mole. Tab. 3.1 shows an excerpt of this parameter set.
Parameter BB-Mole
Spring rate Force spring cf 11.6 N/mm
Uncompressed length Force spring lf,u 43.98 mm
Precompressed length Force spring lf,p 42 mm
Compressed length Force spring lf,c 35 mm
Spring rate Brake spring cb 0.222 N/mm
Uncompressed length Brake spring lb,u 70 mm
Precompressed length Brake spring lb,p 38 mm
Hammer mass m1 105 g
Actuator mass m2 230 g
Housing mass m3 552 g
Coefficient of restitution ks 0.67
Angle of slope Cylindrical cam βs,1 33.21°
Angle of slope Cylindrical cam βs,2 10.24°
Rotational angle Cylindrical cam φs,1 37.09°
Rotational angle Cylindrical cam φs,2 295.00°
Coefficient of friction for rolling µro 0.2
Coefficient of friction for slipping µru 0.15
Safety margin for torque σm 2
Tab. 3.1: Parameters of BB-Mole
3.1. Mass ratio
The optimized masses are highly depended on each other. The change of one mass varies
the optimal value for another mass. Therefor all three masses will be set into a ratio and the
optimal ratio will be investigated in this thesis. The only effect of the masses on the spring
displacement phase is the gravitational contribution of the hammer mass. Compared to the
other occurring forces this part has a minor effect (see 2.1). Hence the main work for
determining the mass ratio treats the energy transfer model of 2.2.

19
3.1.1. Prototype-Mole design
Due to the project schedule the design of the Prototype-model of the HP³-Mole should use
the same Hammering mechanism as for the Breadboard-Mole. For the Prototype-Mole the
mass of the housing is changing. Therefor the masses are compared to the Breadboard-Mole
first and the potential in changing the housing mass is investigated. A complete variation of
all masses is investigated in 3.1.2.
Fig. 3.1: Optimization of the housing mass for the PT-Mole
Using the parameters of the BB-Mole listed prior, the curve for the kinetic energy of the
housing mass calculates as shown in Fig. 3.1. In this case the housing mass was varied
between 0 and 0.6 kg in 0.005 kg steps. Reducing the mass of the housing from 0.552 kg to
approx. 0.145 kg would result in a significant improvement. With an overall kinetic energy of
both strokes (E3,kin) of 0.303 Nm, this change would provide an enhancement of 38.4 % (BB-
Mole: E3,kin = 0.219 Nm). In terms of the Mole theory the scientific instruments TEM-A and
STATIL and the internal electronics of the Mole are part of the housing mass. Therefor it is
the task for the PT-design to implement the instruments and electronics and reduce the
housing mass to 0.145 kg. This is further described in 4.1.1.
3.1.2. Complete variation of mass ratio
In the following part the mass ratio is determined which uses the same total mass of the
system as the PT-design and maximizes the kinetic energy of the housing. The total mass of
the PT-Mole is 0.52 kg with a realized housing mass of 0.195 kg. If the total mass is not fixed,
the kinetic energy of the housing can be increased more and more with a raising total mass.
But as this system is part of a flight mission the mass should be low.
0
0,05
0,1
0,15
0,2
0,25
0,3
0,35
0 0,1 0,2 0,3 0,4 0,5 0,6
E_3
kin
in N
m
m_3 in kg
E_3kin1
E_3kin2
E_3kin
BB-Mole

20
Varying the three masses concludes in the following figures:
Fig. 3.2: Theoretical optimization of mass ratio – hammer mass
Fig. 3.3: Theoretical optimization of mass ratio – actuator mass
0
0,05
0,1
0,15
0,2
0,25
0,3
0,35
0 0,1 0,2 0,3 0,4 0,5 0,6
E_3
kin
in N
m
m_1 in kg
E_3kin1
E_3kin2
E_3kin
PT-Mole
opt. value
0
0,05
0,1
0,15
0,2
0,25
0,3
0,35
0 0,1 0,2 0,3 0,4 0,5 0,6
E_3
kin
in N
m
m_2 in kg
E_3kin1
E_3kin2
E_3kin
PT-Mole
opt. value

21
Fig. 3.4: Theoretical optimization of mass ratio – housing mass
The optimal values for the masses are 0.215 kg for m1, 0.050 kg for m2 and 0.255 kg for m3.
This is a ratio of 4.3/1/5.1 (m1/m2/m3). For this mass ratio the kinetic energy is 0.327 Nm,
which would be an improvement of 7.9 % compared to the PT-Mole and 49.3 % compared to
the BB-Mole. However, the realization of the actuator mass is not possible. The main part of
this assembly is the motor and the gear box. With a weight of the used motor gear box -unit
in the BB-Mole and PT-Mole of 0.095 kg the aimed-at mass is already exceeded. The other
parts of this assembly, which partly experience high loads during the hammering process,
shouldn’t be built too light weight. Additionally the whole principle of hammering would be
changed for a design with these values. In Fig. 3.2, Fig. 3.3 and Fig. 3.4 it is shown that the
kinetic energy of the first stroke is considerable lower than the second stroke. That results in
a change of purposes for the springs and masses. The displacement of the Force spring and
the first stroke by the hammer is only used for the displacement of the Brake spring. Then
the Brake spring would fulfill the work of the Force spring and accelerate the actuator and
hammer towards the housing. This new hammering behavior would need to be checked with
different models and additional tests to verify the model. This is neither the intention of the
project nor of this thesis.
In another optimization the mass of the actuator will be fixed to the 0.220 kg of the
BB-Mole. To ensure that the total mass is not increasing significant and the second stroke
has a smaller share of the kinetic energy of the housing, the housing mass is set to the
realized mass of the PT-design (0.195 kg). Therefor the only varying mass is the hammer:
0
0,05
0,1
0,15
0,2
0,25
0,3
0,35
0 0,1 0,2 0,3 0,4 0,5 0,6
E_3
kin
in N
m
m_3 in kg
E_3kin1
E_3kin2
E_3kin
PT-Mole
opt. value
22
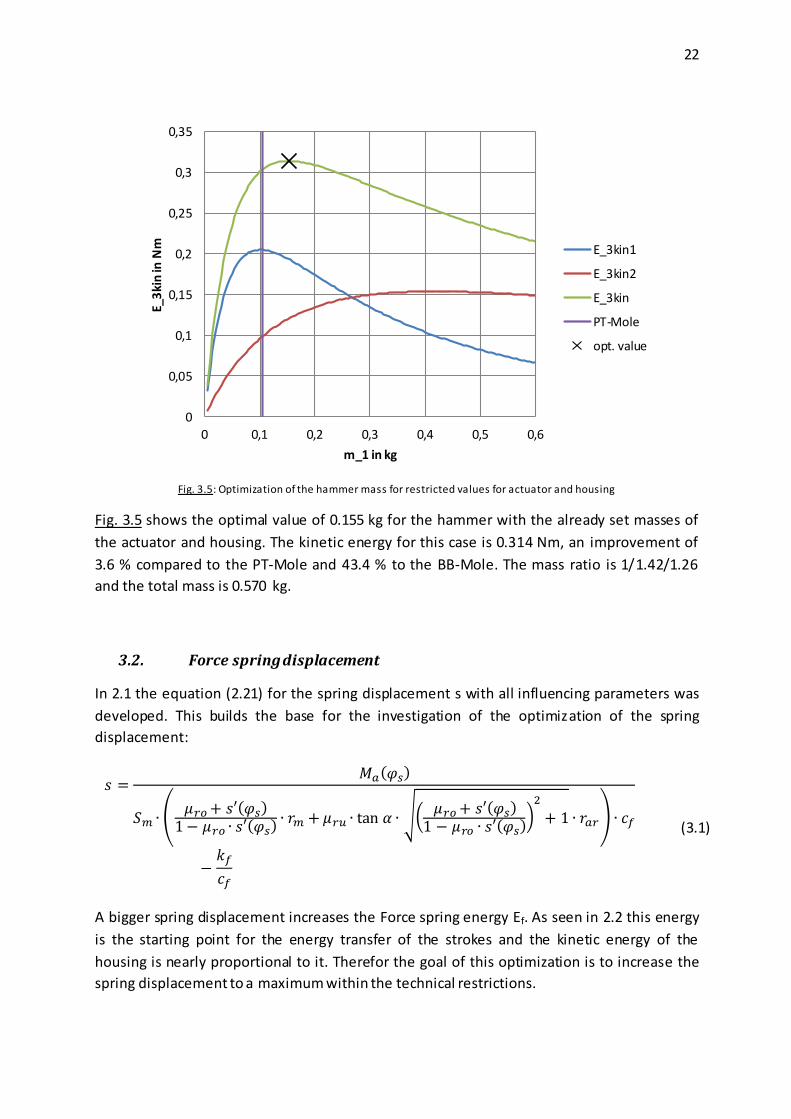
Fig. 3.5: Optimization of the hammer mass for restricted values for actuator and housing
Fig. 3.5 shows the optimal value of 0.155 kg for the hammer with the already set masses of
the actuator and housing. The kinetic energy for this case is 0.314 Nm, an improvement of
3.6 % compared to the PT-Mole and 43.4 % to the BB-Mole. The mass ratio is 1/1.42/1.26
and the total mass is 0.570 kg.
3.2. Force spring displacement
In 2.1 the equation (2.21) for the spring displacement s with all influencing parameters was
developed. This builds the base for the investigation of the optimization of the spring
displacement:
( )
( ( )
( ) √(
( ) ( )
)
)
(3.1)
A bigger spring displacement increases the Force spring energy Ef. As seen in 2.2 this energy
is the starting point for the energy transfer of the strokes and the kinetic energy of the
housing is nearly proportional to it. Therefor the goal of this optimization is to increase the
spring displacement to a maximum within the technical restrictions.
0
0,05
0,1
0,15
0,2
0,25
0,3
0,35
0 0,1 0,2 0,3 0,4 0,5 0,6
E_3
kin
in N
m
m_1 in kg
E_3kin1
E_3kin2
E_3kin
PT-Mole
opt. value

23
Some of the parameters are given by mission requirements (safety margin σm) or due to
dimensional restrictions in the Mole design (mid radius of Cylindrical cam rm and outer
radius of Roller rar). The force constant of Force spring kf is nearly untouched for the change
of the hammer mass and has only a very small influence on the spring displacement. With kf
= 24.2 N for the BB-Mole (105 kg hammer) compared to kf = 24.7 N of the 0.155 kg hammer
the difference in the spring displacement results in 0.04 mm between the mentioned
hammer masses. This would be within manufacturing tolerances. The Force spring rate cf is
one of the topics of 3.3 and is not treated here. The friction coefficients µro and µru would
decrease the spring displacement when rising (compare with (3.1)). Therefor the coefficients
need to be as small as possible. These are values which are influenced by the manufacturi ng
process and the lubrication during operation.
Fig. 3.6: Optimal used driving torque
Fig. 3.7: Isometric view of the Cylindrical cam
In this section the driving torque Ma and the slope of the Cylindrical cam s’ are the two
variables to investigate. In Fig. 3.6 the torque profile of the motor gear box-unit is shown for
one revolution of the Drive shaft of the PT-Mole. Fig. 3.7 depicts the Cylindrical cam. The red

24
hatched area shows the torque which could be used with the motor gear box -unit but is
unused. This additional torque can be employed to reach a bigger spring displacement. To
achieve this equation (3.1) is converted in a differential equation for the driving torque:
( ) ( ( ) )
( ( )
( ) √(
( )
( ))
) (3.2)
The requirements for this differential equation are the maximum torque of the gear box, the
maximum rotational angle (kept the same as in the previous models) and the maximum
slope. The equation is replaced by a constant slope that is chosen to be the maximum slope
for the first section. It is the maximum slope that was used in the BB- and PT-Mole. In the
past the Roller has shown that it can overcome this slope in practice.
The differential equation cannot be solved analytical. Therefor a self-written computer
program by a colleague at DLR is used to solve this equation numerical. The result is a
function of the height of the Cylindrical cam, which is equal to the spring displacement,
depending on the rotational angle of the Drive shaft. Differentiate this function with respect
to φs gives the slope of the Cylindrical cam. When applying the height function s(φs) and the
slope function s’(φs) in (3.2) the torque progression should stay at a constant level for the
numerical computed part. Yet the result wasn’t a constant curve. Changing the approach to
solve the differential equation numerical didn’t give a better height function. Nevertheless
implementing a numerical equation in the Mole-simulation and in the CAD-model would be
quiet complicated. A numerical solution is also very impractical as for every changing
parameter a new solution has to be found. Therefor several approaches with different
functions were performed.

25
Fig. 3.8: Different approaches for optimized shape of Cylindrical cam
Fig. 3.9: Different approaches for optimized slope of Cylindrical cam
0
2
4
6
8
10
12
0 1 2 3 4 5 6
s in
mm
φ_s in rad
first section
numerical solution
logarithmic function
log. & sqrt function
0
0,1
0,2
0,3
0,4
0,5
0,6
0,7
0 1 2 3 4 5 6
s'
φ_s in rad
first section
numerical solution
logarithmic function
log. & sqrt function
26
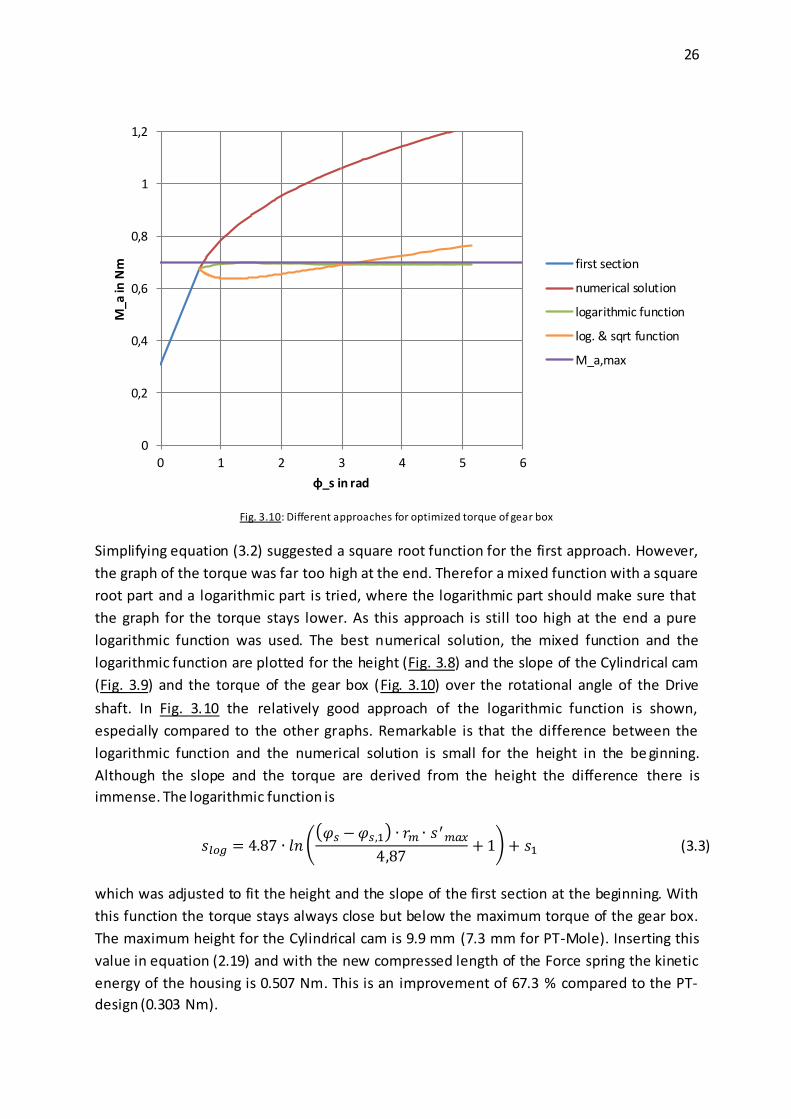
Fig. 3.10: Different approaches for optimized torque of gear box
Simplifying equation (3.2) suggested a square root function for the first approach. However,
the graph of the torque was far too high at the end. Therefor a mixed function with a square
root part and a logarithmic part is tried, where the logarithmic part should make sure that
the graph for the torque stays lower. As this approach is still too high at the end a pure
logarithmic function was used. The best numerical solution, the mixed function and the
logarithmic function are plotted for the height (Fig. 3.8) and the slope of the Cylindrical cam
(Fig. 3.9) and the torque of the gear box (Fig. 3.10) over the rotational angle of the Drive
shaft. In Fig. 3.10 the relatively good approach of the logarithmic function is shown,
especially compared to the other graphs. Remarkable is that the difference between the
logarithmic function and the numerical solution is small for the height in the be ginning.
Although the slope and the torque are derived from the height the difference there is
immense. The logarithmic function is
(( )
) (3.3)
which was adjusted to fit the height and the slope of the first section at the beginning. With
this function the torque stays always close but below the maximum torque of the gear box.
The maximum height for the Cylindrical cam is 9.9 mm (7.3 mm for PT-Mole). Inserting this
value in equation (2.19) and with the new compressed length of the Force spring the kinetic
energy of the housing is 0.507 Nm. This is an improvement of 67.3 % compared to the PT-
design (0.303 Nm).
0
0,2
0,4
0,6
0,8
1
1,2
0 1 2 3 4 5 6
M_a
in N
m
φ_s in rad
first section
numerical solution
logarithmic function
log. & sqrt function
M_a,max

27
3.3. Spring rates
Like described in chapter 2 the displacement of the Force and the Brake spring takes place in
different phases of the hammering process. Hence the optimal spring rates are not
dependent on each other.
3.3.1. Force spring rate
For the Force spring the equations of 2.1 and (2.22) of 2.2 are used. Varying the spring rate
doesn’t influence the energy transfer model further more. Therefor the optimization is
comparable with the spring displacement in 3.2 and influences the displacement as well. The
Force spring energy needs to be maximized to gain more output energy of the housing. To
avoid worsen effects on the displacement both parameters (displacement s and spring rate
cf) are optimized simultaneous. The spring rate was varied between 0 and 15 N/mm (11.6
N/mm for PT-Mole). For every change in the spring rate the maximum height of the
Cylindrical cam is computed which results of an adjusted logarithmic function. This function
gives a torque profile similar to the function in 3.2, where the torque is close to the
maximum value but always below.
Fig. 3.11: Optimization of Force spring rate – spring displacement
0
5
10
15
20
25
0 5 10 15
s_2
in m
m
c_f in N/mm
just first section
1st & 2nd section
c_f = 11,6 N/mm

28
Fig. 3.12: Optimization of Force spring rate – kinetic energy of housing
Fig. 3.13: Comparison of optimized Cylindrical cam with PT-spring and with optimized spring
In the figures Fig. 3.11, Fig. 3.12 and Fig. 3.14 the graphs are split in “just first section” and
“1st & 2nd section”. The theoretical slopes of the Cylindrical cam is partly bigger than the
maximum slope defined by the biggest slope of the BB-Mole and PT-Mole design. Where the
slope over the complete Cylindrical cam is bigger than the maximum value, the Cylindrical
cam contains only of a linear rising ramp (blue part of the graph). In the red part of the graph
the linear section at the beginning still exists but also a logarithmic part for the height. Fig.
0
0,1
0,2
0,3
0,4
0,5
0,6
0 5 10 15
E_3
kin
in N
m
c_f in N/mm
just first section
1st & 2nd section
c_f = 11,6 N/mm
E_3kin,max
0
0,1
0,2
0,3
0,4
0,5
0,6
0,7
0,8
0 1 2 3 4 5 6
M_a
in N
m
φ_s in rad
opt. spring
PT-spring
M_a,max

29
3.11 shows the realizable spring displacement s2 with the restrictions of the maximum
torque, maximum slope and maximum rotational angle. For the calculated spring
displacement with the corresponding Force spring rate the kinetic energy of the housing is
displayed in Fig. 3.12. The optimal Force spring rate cf is at 6.79 N/mm, which enables a
kinetic energy of the housing of 0.543 Nm. This results in an improvement of 7.1 %
compared to the optimized Cylindrical cam with the PT-spring and 79.2 % compared to the
PT-design. In Fig. 3.13 the two torque profiles for the optimized cam with PT-spring and the
optimized cam with optimized spring are compared.
The disadvantage of this improvement is an increasing length of the Mole. As the additional
height of the Cylindrical cam needs more space inside the hammer the length of the Mole is
increasing at least by this value (displayed in Fig. 3.14). This additional space was not needed
for the PT-Force spring as there was still enough scope for the increased height of the
Cylindrical cam. Furthermore the length of the compressed Force spring needs to be
observed so that the parts inside the spring don’t interfere. For the maximum kinetic energy
of the housing the additional length Δlmole is 4.06 mm.
Fig. 3.14: Optimization of Force spring rate – change in overall Mole length
3.3.1. Brake spring rate
The Brake spring rate is a lot easier to investigate. The only influence on the hammering
process is its displacement during the movement of the actuator (compare with equation
(2.31) in 2.2).
-2
0
2
4
6
8
10
12
0 5 10 15
Δl_
mo
le,m
in in
mm
c_f in N/mm
just first section
1st & 2nd section
c_f = 11,6 N/mm
E_3kin,max

30
Fig. 3.15: Optimization of the Brake spring rate for the PT-Mole
The spring rate is varied between 0 and 0.5 N/mm. As shown in Fig. 3.15 the influence of the
Brake spring rate is only small. The kinetic energy of the housing is rising for a rising Brake
spring rate, but the difference between 0.222 N/mm (for the PT-Mole) and 0.5 N/mm is only
0.9 mNm (0.304 Nm total energy) and the improvement is approx. 0.3 %.
3.4. Evaluation
In this passage the changes of the prior investigations are summarized and compared.
Furthermore the disadvantages and the effort to realize the improvements are observed and
a ranking of priority is created. The enhancements are so far:
Parameter Improvement
to BB-Mole
Improvement
to PT-Mole
Disadvantage
mass-ratio PT-Mole +38.4 % --- ---
optimized mass-ratio (theoretically)
+49.3 % +7.9 % not realizable in practice
optimized mass-ratio (with requirements)
+43.4 % +3.6 % ---
optimized Cylindrical
cam
+131.5 % +67.3 % ---
optimized Force spring rate
+147.9 % +79.2 % increased Mole length
optimized Brake
spring rate
+38.8 % +0.3 % ---
Tab. 3.2: Summary of improvements
0
0,05
0,1
0,15
0,2
0,25
0,3
0,35
0 0,1 0,2 0,3 0,4 0,5
E_3
kin
in N
m
c_b in N/mm
E_3kin1
E_3kin2
E_3kin
PT-Mole

31
For realistic mass-ratios the improved Mole-models can be implemented by choosing other
dimensions for the relevant parts or choosing materials with other densities. However the
unrealistic mass-ratio that used no requirements from the environment is most likely
impossible to design, especially when using an equivalent motor as used by the PT-design.
Therefor this mass-ratio is disregarded further on. After building the PT-mole the possible
enhancement of a new Mole design is low.
The optimized shape of the Cylindrical cam is relatively easy to implement in the CAD-model
and with modern CNC-machines also possible to manufacture. Additionally the design of the
Mole is only affected at the Cylindrical cam. A first look on the CAD-model suggests that the
existing spaces inside the hammer and inside the Force spring are big enough that there is
no interference. With a large improvement compared to the already enhanced PT-Mole this
change is very advisable to realize.
Using an optimized shape for the Cylindrical cam and change the spring rate of the Force
spring at the same time, another small improvement is possible (7.1 % compared to Force
spring of the PT-Mole). On the down side, this also includes an increased Mole length and
some changes on the parts related to the Force spring to secure enough space for the larger
movement of the hammer. The requirements for the length of the Mole due to the available
space on the lander, hardly allow any raise of the total Mole length. Therefor the additional
length has to be shortened at another part of the Mole. However, this improvement can be
considered if other changes are already implemented.
The Brake spring seems to have nearly no influence to the Hammering mechanism. At least
for what the mole theory of chapter 2 suggested. Tests with older Mole-versions in the past
and first tests with the PT-Mole showed a decreased penetration performance for stiffer
Brake springs. The backwards directed movement of the Mole triggered by the actuator
movement is not represented well enough in the Mole theory. Therefor the theory has to be
reworked with respect to the actuator movement before considering any changes to the
Brake spring. So far the Brake spring is kept from the BB- and PT-design.
Ranking
The mass-ratio of the PT-Mole is one of the first realized improvements due to scheduling
reasons. For this purpose the housing has to be lighter. As for this model the parts of the
housing mass have to be remodeled anyway, the design process takes also places with
regard to thin walled parts and lighter materials. The optimized Cylindrical cam is the next to
implement since there are only minor changes and a large improvement to the system. A
further optimized mass-ratio and the optimized Force spring rate can be considered when
remodeling the hammer and actuator in a later process. The Brake spring stays the same so
far.

32
4. Design changes
This chapter explains the modeling of 3D-parts that were designed to fulfill the
enhancements of chapter 3. Furthermore the outer shape of the Mole is modified to reduce
the resistance force for penetrating the soil.
4.1. Optimized parts of Hammering mechanism
4.1.1. PT-Mole design
At first the Prototype model of the Mole is designed. The mass-ratio that was determined in
3.1.1 is one of the design guidelines. Additionally the outer diameter of the Mol e is
decreased. A thinner Mole experiences a smaller resistance when penetrating. But as the
Hammering mechanism of the PT-Mole stays the same as for the BB-Mole the inner
diameter of the housing must be 24 mm. Additionally TEM-A and STATIL has to fit in the new
design. The dimensions for the electronics for these systems and the motor are part of the
design as well. At the end the assembly of the model has to be regarded, too, so it will be
easier as in previous models. This design takes place in close coordination with my
supervisor at the DLR, since the design will be used in many tests for the HP³ -system to
prepare for the InSight mission.
Fig. 4.1: Assembly of TEM-A foils and covers to Outer casing
The main changes compared to the BB-Mole are the removal of the Inner casing that holds
the Hammering mechanism and the introduction of a more stable version of the payload

33
compartment. One of the tasks of the Inner and Outer casings at the BB-Mole is to protect
the TEM-A foils against the movement of the Hammering mechanism. The foils were glued
on the inner side of the Outer casing, therefor the Outer casing had to be made out of a
material with very good thermal conduction. This high strength copper alloy had a relatively
high density and thus the housing was heavy, especially with the additional casing on the
inside. For the PT-model the Inner casing is removed. To avoid direct contact between TEM-a
foils and Hammering mechanism and also to allow an easier gluing of the foils to the Outer
casing, the TEM-A foils are positioned on the outside of the Outer casing. To accomplish this,
a protection of the foils has to be implemented. On top of the foils another thin layer of
aluminum is glued. These covers are overlapping the foils and protect them against scratches
of sand or even embedded stones in the soil. In axial direction of the foils the Outer casing
has a bigger diameter. Since moving in the axial direction the biggest stress on the foils could
come from shearing forces. The bigger diameter of the massive Outer casing (compared to
the glue-foil-glue-aluminum-sandwich structure) is taking these loads. As the electronics of
the Mole are on the inside the wires for the TEM-A foils have to be guide through holes in
the Outer casing. Fig. 4.1 shows the assembly of the TEM-A foils (orange), the TEM-A covers
(outer parts) and the Outer casing (central part). The holes inside the Outer casing are
displayed in the bottom left corner, within the part with the bigger diameter. The wires of
the TEM-A foils are not displayed in this picture.
Fig. 4.2: Payload compartment of the PT-Mole
Inside the payload compartment STATIL, the wires to the motor and the interfaces to TEM-A
and the Science tether are implemented. STATIL consists of two PCBs mounted on a sled that
is damped by two spiral springs (central parts on the inside of the payload compartment in
Fig. 4.2). The Payload cage is designed to hold the two springs on both ends of the sled and is
therefore made out of one piece. At the top end of the Payload cage (in the front in Fig. 4.2)
the Connector PCB is mounted. There are the connectors for TEM-A and the Mole lines of

34
the Science tether (big connector in the middle of the PCB). Starting from this PCB the wires
to STATIL and the motor are guided by a part around the first spiral spring. All these wires go
into the first STATIL PCB, then the second STATIL PCB and the motor wires go around the
second spiral spring to the Motor PCB at the bottom of the Payload cage. At the second
spiral spring another part is guiding the flexprint cable around it. On the Motor PCB the
cables to the Motor inside the Brake spring are soldered.
Fig. 4.3: Assembled payload compartment
On top of the Outer casing is the Back casing. It is used to fix the payload compartment to
the Outer casing and to hold the cap that closes the Mole (seen on the left side of Fig. 4.3).
By introducing this casing it is possible to avoid a bigger outer diameter of the Mole as the
fixture points of the payload compartment can be located on a smaller diameter as the inner
diameter of the Outer casing. The overall outer diameter of the Mole is 26.4 mm, which is
set by the thickness of the sandwich structure of the TEM-A foils and a minimal wall
thickness for the Outer casing of 0.5 mm. This light weight design and the fact that the
material for all the housing assembly parts is now titanium instead of steel or a copper alloy,
decreases the mass of the housing significant. The new housing mass is 0.195 g and the total
Mole mass is 0.520 g (compared to the BB-model with 0.552 g housing mass and 0.877 g
total mass).
Additionally the sealing concept on the inside of the PT-Mole is more advanced than in the
models before. The pot-like shape of the Payload cage is used as an internal seal. All the
interfaces between that pot and the surrounding parts are sealed with PTFE-parts. To have a
defined path for the air flow during pressure changes (e. g. launchi ng from Earth and landing
on Mars) two sintered metal filters are implemented in the cap and in the pot of the Payload
cage. They are chosen to be fine enough to avoid soil contamination of the interior through
them.
The design of the PT-Mole is undergone several iteration steps. The design of TEM-A and
STATIL had to be modified to fit within the PT-Mole. The PT-design also had to change to
adjust to the instruments. During this process the PT-Mole is presented to the responsible
personal of the different instruments and subsystems. Therefor presentations were made to
introduce them to the new design. The presentations were either held by myself or they
were held by other colleagues. In Appendix B the designs of the Breadboard-Mole and the
Prototype-Mole are compared.

35
4.1.2. Cylindrical cam design
In section 3.2 the shape of the Cylindrical cam was determined that provides the largest
energy output for the housing mass. The shape is also restricted by the maximum values for
the torque, the slope and the rotational angle. The logarithmic function, which was an
analytical approach to the perfect match for the maximum torque, is transformed in a
notation that is suitable for the CAD-program. Enhancing the existing 3D-model for the
Cylindrical cam of the PT-design, it is now possible to define the shape of the cam with a
function. The rest of this part has stayed the same. The drawing with removed
measurements can be found in Appendix C.
4.1.3. Design of other parts
The remaining improvements of chapter 3 or not realized yet. As the project, this thesis is
related to, has to focus on only a few changes, only the most promising improvements are
tested. However the remaining changes discussed in chapter 3 can be used to investigate the
Mole further on after the launch of the mission.
4.2. Design of Tip shapes for testing
In the work of Grygorczuk, et al. [RD 9] and Fish, et al. [RD 7] a different shape for the Tip of
the Mole is recommended as the conical tip used by the BB- and PT-Mole. Both groups
tested a parabolic shape and compared the penetration performance with several conical
shapes (both groups) or a hyperbolic shape (Fish, et al.). The results show that a parabolic
shape (or ogive shape) can penetrate approx. 10 to 20 % deeper in the same time. However
both works only present one ogive shape that is either not further described [RD 7] or too
long for the HP³-Mole (additional 19 mm for the total Mole length) [RD 9].
To find the best ogive for the purpose of the HP³-Mole, several different shapes are
investigated. A study with the help of the Mole-simulation won’t be successful, since the soil
parameters that describe the influence of the tip shape are not known. It wasn’t possible to
find an extensive study published to this topic so far. There are works of various authors
considering the behavior of bullets entering concrete or sand. The topic is indeed very
similar to a Mole penetrating soil, but the penetration profile is not close enough to just use
this data. Therefor several different ogive shapes are chosen, fit in the requirements for the
Tip of the Mole, manufactured and tested (part of 6.3).
4.2.1. Tangent ogive
In [RD 2] the design criteria for a tangent, a secant and a HAACK ogive are described. In Fig.
4.4 the necessary parameters to design a tangent ogive are displayed. To keep the same
length as for the conical tip of the PT-design, this length is used for the length L of every

36
other shape. The radius R for every shape is set by the already existi ng outer diameter of the
PT-Mole. For the tangent tip the ogive radius for the tangent shape ρ t then calculates to:
(4.1)
Fig. 4.4: Design criteria for tangent ogive [RD 2]
4.2.2. Secant ogive
Fig. 4.5: Design criteria for secant ogive [RD 2]
The design parameters for the secant ogive are shown in Fig. 4.5. For this tip the ogive radius
for the secant shape ρs needs to be set to a value that fulfills the equation:
(4.2)
With this radius the secant ogive constant λ is computed by:

37
(
) (
√
) (4.3)
And the radius of the secant ogive rs is:
( ) √ ( )
(4.4)
In this equation the height of the secant tip hs is varying between 0 and L. In this case the
ogive radius is set to 35 mm, which results in a clearly different shape compared to the
tangent ogive and the cone.
4.2.3. HAACK ogive
The HAACK ogive is not derived from a geometrical figure, but has been analytical
determined to be a shape with a minimized drag [RD 11]. The function for the radius of the
HAACK ogive rh is:
( )
√ √
( )
(4.5)
(
) (4.6)
With the HAACK ogive variable θ, which is a function of the height of the HAACK ogive hh
(with values from 0 to L). The HAACK ogive constant Ch indicates different types of HAACK
ogives. By setting it to C = 1/3 the drag is at the minimum for the given length and volume of
the tip. Ogives with a C of 2/3 have a tangent transition to the side walls. In this case the
constant was set to 0, which is the minimum drag for given length and diameter of the tip.
4.2.4. Equal pressure ogive
The design criterion for another tip shape is an equal pressure distribution over the tip for
every ring segment with the same height. Fig. 4.6 shows a random tip shape which is divided
into three ring segments with the same height (h1 = h2 = h3). The projected cross-section of
each of the three segments should be the same (A1 = A2 = A3). With this requirement the
pressure is the same for every segment, which should result in a better displacement of the
soil.

38
Fig. 4.6: Design criteria of equal pressure tip
Hence the height of the equal pressure ogive hep at any point must fulfill the equation
(4.7)
so that the amount of the length of the tip L is equal with the amount of the total cross -
section. Solved for the radius of the equal pressure ogive rep (4.7) gives a simple square root
function:
√
(4.8)
The drawings of the ogive shapes can be found in Appendix D.
4.3. Implementation in CAD-model
4.3.1. PT-Mole design
The assembly of the PT-model parts is already discussed in 4.1.1. As the housing mass was
completely new designed the only adaption was made for the Hammering mechanism. Here
are the overall length and the diameter the most important values. Additionally the
interfaces for the rotational locking at the front and the Brake spring on the back have to be
regarded.
4.3.2. Optimized Cylindrical cam
For the optimized Cylindrical cam the changes on the Mole only affects the Cylindrical cam
itself. The clearance for the Roller inside the hammer mass and the distance between the
parts that extend inside the force spring are big enough that the higher ramp of the
Cylindrical cam doesn’t cause any problem.

39
4.3.3. Ogive tips
There are four different tip shapes that need to be tested and compared: the tangent tip,
the secant tip, the HAACK tip and the equal pressure tip. The testing will be performed with
the PT-Mole. But as in the normal assembly of the PT-Mole the Tip is not easily
exchangeable, another solution is needed to allow quick sequenced tests. Therefor the
interface between the tip and the Outer casing has changed. An adapter is modeled, that is
screwed in the Outer casing instead of the Tip. The adapter stays there for the whole test
campaign. The tips however are now fixed to the adapter using four screws. A sealing of this
screw connection is not necessary, since the adapter is completely closed towards the Tip.
On the other hand the adapter adds additional weight and length to the Mole housing. The
results of other tests with the conical tip cannot be used. So a conical tip to fit on the
adapter is modeled, too.
To make the tests even more comparable, the masses of all the tips are the same by design.
This is adjusted by the way the inside the tip is designed.
Both changes, the optimized Cylindrical cam and the different tips, are designed to be used
for the PT-Mole. As a PT-Mole equipped with these parts is not a normal PT-Mole anymore,
and this Mole is also not a complete new design, this model is called Hybrid-Mole. Similar to
the PT-design the modifications were presented and discussed for several occasions. Both,
the PT-Mole and the Hybrid-Mole are tested and compared with each other and the BB-
Mole in chapter 6.

40
5. Stress analysis
In this chapter the stress loads on the parts of the Hammering mechanism and housing
assembly are investigated. In [RD 10] an extensive stress analysis is performed. Using the
perceptions of this thesis the most critical parts can be determined. They are categorized by
their associate assembly and analyzed during this thesis. As two different Mole-models are
constructed, the PT-Moe and the Hybrid-Mole are investigated in this chapter.
5.1. Hammer mass
The only likely critical parts of the Hammer mass are the Guide blocks.
Guide blocks
Their purpose is to avoid the rotation of the Hammer inside the Hammer support structure.
That is necessary as the rotating Roller inside the Hammer pushes against the Cylindrical
cam in axial and tangential direction. Fig. 5.1 shows the parts of the Hammer mass and the
location of one Guide block. The second Guide block is located on the opposite position of
the first one. The contact pressure between the Guide blocks and the Hammer support
structure is the most feasible criterion to validate a sufficient design.
Fig. 5.1: Parts of the Hammer assembly
The contact area is marked in Fig. 5.2. With a few geometrical transformations the contact
area between Guide block and Hammer support structure can be computed with:
( ) ( ) ( ) (5.1)

41
The projected lengths xgb,i are given by
√
(5.2)
for i = 1; 2; 3. With these equations and the dimensions of the Guide block the contact area
can be determined to Agb = 7.36 mm2.
Fig. 5.2: Dimensions of Guide block
The contact pressure pgb can be computed by:
(5.3)
The force on each of the two Guide blocks Fgb is stated by the maximum occurring torque
Ma,max and the mid radius for the contact area rgb,m:
(5.4)
Therefor the contact pressure is 4.34 N/mm2. With an allowed contact pressure pal, CA104 of
25 N/mm2 for the copper alloy CA104 the safety factor for the Guide blocks Sgb is 5.76 and is
valid for the PT-Mole and the Hybrid-Mole.
(5.5)

42
5.2. Actuator mass
The most critical parts of the Actuator assembly are the Roller , the Roller axle, the Drive
shaft and the Extension drive shaft bush. As examples the validation of the Roller and the
Extension drive shaft bush are shown in this section.
Roller
The durability approval of the Roller concentrates on the contact pressure between Roller
and Cylindrical cam. For this load the shape modification hypothesis is used to calculate the
equivalent stress σvg for the three local coordinates of the Roller:
√ √( )
( )
( ) (5.6)
(√ (
)
) (5.7)
(
(
)
√ ( )
)
(5.8)
(
√ ( )
)
(5.9)
with the ratio of depth and contact area width z/b, the POISSON’s ratio ν and the maximum
HERTZian stress pr,max. The maximum HERTZian stress occurs at the inner radius of the
Cylindrical cam ri (compare with [RD 10]) and is given by
√
( ) (5.10)
(5.11)
with the maximum occuring load force of the Roller Fbr,max (determined in 2.1), the YOUNG’s
modulus of MarvalX12 EX12, the inclination of the Roller path α, the contact length between
Roller and Cylindrical cam lr and the radii of the Roller at the inner (Ri) and the outer (Ra)
radius of the Cylindrical cam. The values of the PT-Mole and the Hybrid-Mole are the same
except for the maximum occurring load force of the Roller. For the PT-Mole this value is
117.1 N, for the Hybrid-Mole 147.4 N. Hence the maximum HERTZian stress is 757.4 N/mm2

43
for the PT-Mole and 849.8 N/mm2 for the Hybrid-Mole. The maximum values for the
equivalent stress are 414.2 N/mm2 for the PT-Mole and 464.8 N/mm2 for the Hybrid-Mole.
Therefore the safety factors for these models are 2.66 (PT-Mole) and 2.37 (Hybrid-Mole)
with the use of MarvalX12 for the Roller. The equation for the safety factor for the Roller S r
is
(5.12)
with the yield strength of MarvalX12 Rp0.2,X12.
Extension drive shaft bush
Fig. 5.3: Loads on the Extension drive shaft bush
The Extension drive shaft bush was introduced to carry the bending moment generated by
the forces on the Roller. In the worst case only this bush is carrying the loads and the Drive
shaft bush is unloaded, if a mismatch in tolerances occurs. To simplify the conditions it is
assumed that the bending moment of the Drive shaft Mb,ds is affecting the Extension drive
shaft bush over the its length leb and that the progression is linear over the length (compare
with Fig. 5.3). The bending moment can then be replaced by a reaction force on the
Extension bush Feb. This force steps in at zeb = 1/3 * leb.
(5.13)
(5.14)
with the Force spring force Ff steps in with the lever arm rm, which is the mid radius of the
Cylindrical cam. The bending moment is 642.5 mNm for the PT-Mole and 820.1 mNm for the
44
Hybrid-Mole. Therefor are the values for the reaction force on the Extension drive shaft bush
321.3 N at the PT-model and 410.1 N at the Hybrid-model.
The criterion for the mechanical stress is the reaction force carried by the projected bush
area:
(5.15)
This specific bush load peb is 17.9 N/mm2 for the PT-Mole and 22.8 N/mm2 for the Hybrid-
Mole. With the allowed contact pressure pal,CA104 for CA104, the material of the Extension
drive shaft bush, of 25 N/mm2 the safety factor Seb is determined to:
(5.16)
The PT-Mole has a safety factor of 1.40 and the Hybrid-Mole a safety factor of 1.10. These
values are very low, but still above 1. However the worst case of only one loaded bush on
the Drive shaft should be avoided by choosing appropriate tolerances for the bushes.
5.3. Housing mass
The only critical part of the housing mass is the Tip as the strokes of the Hammering
mechanism hit it on the inside.
Tip
For the Tip the fatigue stress due to the strokes is investigated. To regard the worst case, it is
assumed that the complete energy difference of the Hammer before (E1,kin) and after the
first stroke (E1,kin,p) is transformed in potential energy of the housing Upot,ho. Therefor the
Outer casing would deform.
(5.17)
with the spring rate of the Outer casing coc and the deformation of the Outer casing xoc. This
could be realized by fixing the end of the Outer casing. The housing wouldn’t move after the
stroke and the additional energy would be used to deform the thin walled Outer casing. The
deformation is determined by (5.13):
√ ( )
(5.18)
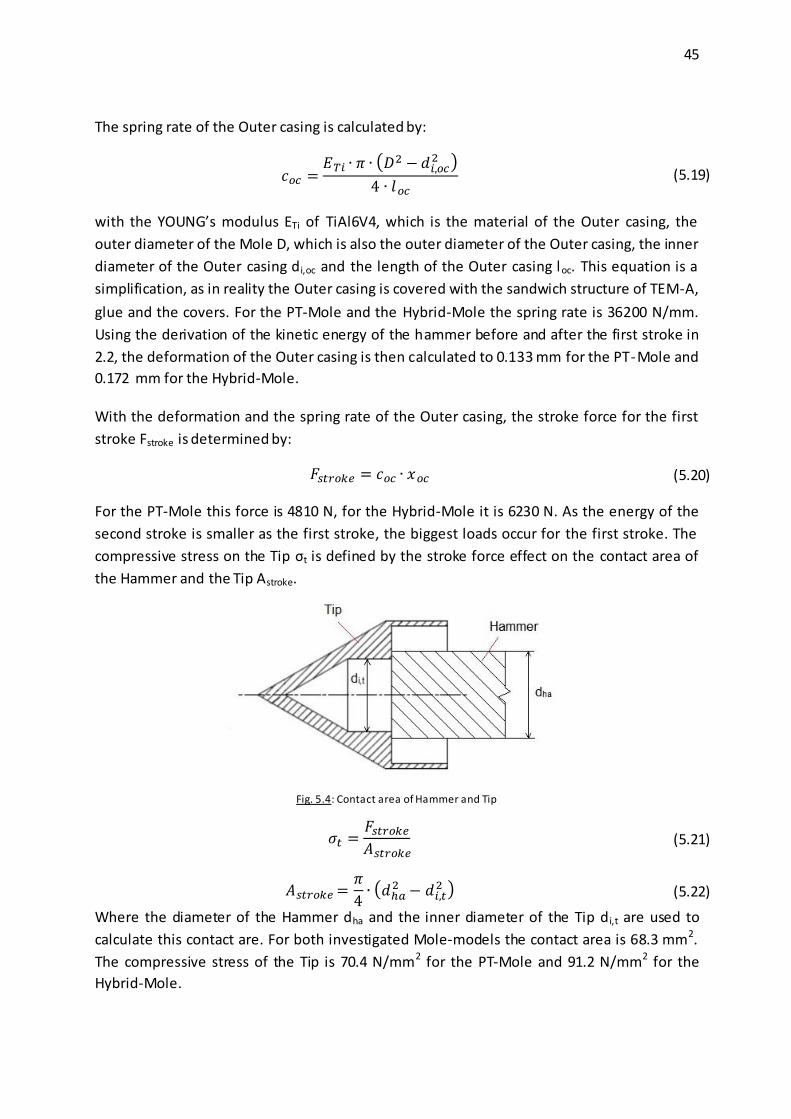
45
The spring rate of the Outer casing is calculated by:
(
)
(5.19)
with the YOUNG’s modulus ETi of TiAl6V4, which is the material of the Outer casing, the
outer diameter of the Mole D, which is also the outer diameter of the Outer casing, the inner
diameter of the Outer casing di,oc and the length of the Outer casing loc. This equation is a
simplification, as in reality the Outer casing is covered with the sandwich structure of TEM-A,
glue and the covers. For the PT-Mole and the Hybrid-Mole the spring rate is 36200 N/mm.
Using the derivation of the kinetic energy of the hammer before and after the first stroke in
2.2, the deformation of the Outer casing is then calculated to 0.133 mm for the PT-Mole and
0.172 mm for the Hybrid-Mole.
With the deformation and the spring rate of the Outer casing, the stroke force for the first
stroke Fstroke is determined by:
(5.20)
For the PT-Mole this force is 4810 N, for the Hybrid-Mole it is 6230 N. As the energy of the
second stroke is smaller as the first stroke, the biggest loads occur for the first stroke. The
compressive stress on the Tip σt is defined by the stroke force effect on the contact area of
the Hammer and the Tip Astroke.
Fig. 5.4: Contact area of Hammer and Tip
(5.21)
(
) (5.22)
Where the diameter of the Hammer dha and the inner diameter of the Tip d i,t are used to
calculate this contact are. For both investigated Mole-models the contact area is 68.3 mm2.
The compressive stress of the Tip is 70.4 N/mm2 for the PT-Mole and 91.2 N/mm2 for the
Hybrid-Mole.

46
The safety factor for the Tip St is determined by the allowed fatigue stress for TiAl6V4 σ fa,Ti,
the material of the Tip:
(5.23)
With the value for the allowed fatigue stress of 580 N/mm2 the safety factor of the PT-Mole
is 8.24 and of the Hybrid-Mole 6.36.
Additional to the mentioned critical parts the safety factors of several other parts are
calculated roughly. All safety factors are big enough to be sure that no part is damaged
during operations of the Mole.

47
6. Verification of improvements
This chapter treats the validation of the theoretically determined improveme nts with test
data. The most obvious way to test the different Mole-models is to perform penetration
tests in the same soil and with the same conditions. However, there are several
disadvantages for these tests. The duration of one single test is very long. Before each test
the soil needs to be prepared in the same way. Hence the soil needs to be freshly filled into
the testbed. Even then it is uncertain if the soil is completely comparable with the other
tests. To validate this, a penetrometer test needs to take place after each test. During this
test several soil parameters can be measured. These parameters help to classify the soil and
allow comparisons between different tests. To avoid the complete procedure of a
penetration test for the validation of the improvements of this thesis, a test stand is
designed.
6.1. Design of Test stand
Several requirements influence the design of a test stand for the Mole. It has to work in
controlled conditions so that a calibration of the Test stand is not necessary for every test.
The results of the measurement should give some indication for the performance it would
have in a soil test bed. The Test stand should use a simple principle to measure the output of
the Mole. In the best case the measurements can be easily converted into the desired
dimension. The Mole must return to its resting position after each hammering cycle. Hence
the Test stand can be used for several cycles and even for long duration tests.
For the measuring principle the deflection of a spring is used. Wi th a spring the kinetic
energy of the housing is directly converted into a displacement of the spring. The spring will
then return to the precompressed length due to the weight of the Mole. To measure the
displacement a distance is used. With a high sample rate the first and the second stroke can
be detected separately. This helps to verify the Mole theory as well. Therefor the Test stand
needs to position the spring and the Mole in a defined way. The Mole should move freely
along its axial direction and the distance sensor needs to be implemented in a sensible way.
To realize this a reflection surface for the LASER-sensor needs to be attached on top of the
spring.
Fig. 6.1 shows the realized Test stand with a PT-Mole (the Science tether is not attached in
this picture). The Mole is positioned on a part that is the negative shape of the cone tip. This
part is screwed to a fixture for the measurement spring with the reflection surface in
between (squared sheet metal below the triangular plate in Fig. 6.1). The Mole is guided in

48
axial direction by a pipe mounted on the stand plate (triangular plate in picture). At both
ends PTFE-rings are screwed to the pipe that works as sliding bushes for the Mole. The
distance sensor is mounted on top of the stand plate and i s pointing downwards through a
hole in the stand plate on the reflection surface.
Fig. 6.1: Test stand with PT-Mole
The output of the sensor is a voltage that can be converted in a length. The displacement of
the stand spring ss can be determined by building the difference of the measured length to
the resting position. With the length of the stand spring in the uncompressed state (l s,u) and
precompressed state (ls,p) the spring energy of the maximum compressed stand spring Es can
be computed:
(6.1)
(( )
( )
) (6.2)
Where ls,c is the length of the compressed stand spring and cs is the spring rate of the stand
spring. As seen in Fig. 6.3 the two strokes of one cycle can be read out separately. The total
kinetic energy of the housing E3,kin can then be determined by:
(6.3)

49
(( )
( )
( )
( )
)
(6.4)
Where the indices 1 and 2 stand for the first resp. second stroke. The energy loss by friction
Es,fric is induced by friction of the Mole to the PTFE-rings as well as friction inside the stand
spring. The portion of this energy of the total kinetic energy of the housing needs to be
determined by a calibration. It is dependent on the spring displacement and the Mole which
is used in the Test stand.
6.2. Performance of PT-Mole vs. BB-Mole
First tests performed with the BB-Mole showed a spring displacement of 1.8 mm for the first
stroke in the average of 20 stroke cycles. The second stroke showed a displacement of
approx. 0.25 mm. Fig. 6.2 shows a complete test in the Test stand for the BB-Mole. In Fig. 6.3
the diagram is focused on two stroke cycles. The first stroke generates a big spring
displacement, the stand spring unloads immediately and the second stroke takes place when
the spring passes the resting position for the first time. After that the spring is oscillating
until it comes to a rest. The difference between the local maxima and minima in this phase
can be used to determine the friction losses in the Test stand. There is no additional energy
transferred by the Mole to the stand spring in this phase.
Fig. 6.2: Complete performance test of the BB-Mole
-1
-0,5
0
0,5
1
1,5
2
0 2000 4000 6000 8000 10000 12000Spri
ng
dis
pla
cem
en
t in
mm
Measurement samples
BB-Mole
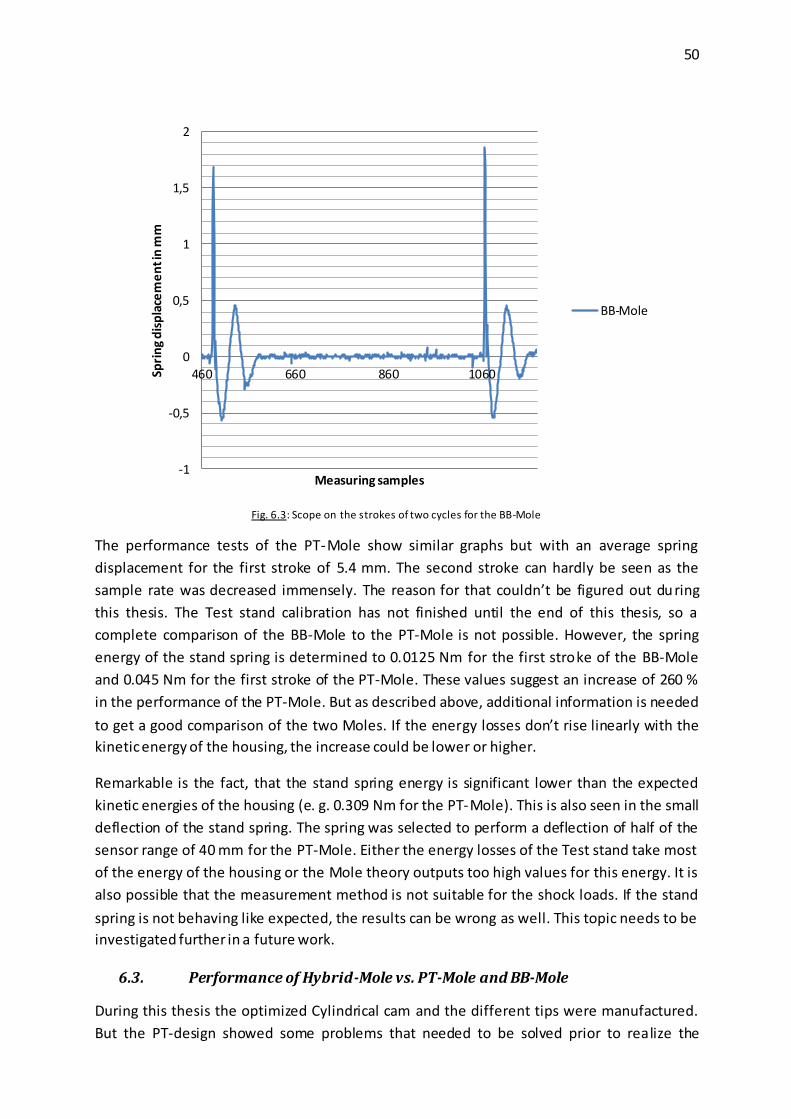
50
Fig. 6.3: Scope on the strokes of two cycles for the BB-Mole
The performance tests of the PT-Mole show similar graphs but with an average spring
displacement for the first stroke of 5.4 mm. The second stroke can hardly be seen as the
sample rate was decreased immensely. The reason for that couldn’t be figured out du ring
this thesis. The Test stand calibration has not finished until the end of this thesis, so a
complete comparison of the BB-Mole to the PT-Mole is not possible. However, the spring
energy of the stand spring is determined to 0.0125 Nm for the first stroke of the BB-Mole
and 0.045 Nm for the first stroke of the PT-Mole. These values suggest an increase of 260 %
in the performance of the PT-Mole. But as described above, additional information is needed
to get a good comparison of the two Moles. If the energy losses don’t rise linearly with the
kinetic energy of the housing, the increase could be lower or higher.
Remarkable is the fact, that the stand spring energy is significant lower than the expected
kinetic energies of the housing (e. g. 0.309 Nm for the PT-Mole). This is also seen in the small
deflection of the stand spring. The spring was selected to perform a deflection of half of the
sensor range of 40 mm for the PT-Mole. Either the energy losses of the Test stand take most
of the energy of the housing or the Mole theory outputs too high values for this energy. It is
also possible that the measurement method is not suitable for the shock loads. If the stand
spring is not behaving like expected, the results can be wrong as well. This topic needs to be
investigated further in a future work.
6.3. Performance of Hybrid-Mole vs. PT-Mole and BB-Mole
During this thesis the optimized Cylindrical cam and the different tips were manufactured.
But the PT-design showed some problems that needed to be solved prior to realize the
-1
-0,5
0
0,5
1
1,5
2
460 660 860 1060Spri
ng
dis
pla
cem
en
t in
mm
Measuring samples
BB-Mole

51
Hybrid-Mole. Therefor a test campaign with the Hybrid-Mole couldn’t proceed in this thesis.
The assembly and tests of the Hybrid-Mole need to take place in a future work.
Furthermore is the Test stand only able to detect the kinetic energy of the housing mass. The
improvements with the smaller outer diameter and the tip shapes cannot be tested. For
these parts penetration tests in soil are needed. These tests will be performed in the future
as well.

52
7. Conclusion
In this thesis the Mole theory is investigated with respect to potential improvements. To
implement a more complex shape for the Cylindrical cam the way its parameters affect the
system is enhanced. Instead of constant slopes, it is now possible to use a function for the
shape. After the changeable parameters, that affect the energy output of the Mole, are
summarized in the expression
( ) (7.1)
each of these parameters is analyzed.
The mass ratio was optimized in a first step to fit the restrictions for the PT-Mole design.
Therefore the masses m1 and m2 don’t change, but the mass m3 is varied. The optimal
housing mass for this case is determined and is used as a desi gn criterion of the PT-Mole.
The masses are then considered as free variables to look for the optimal mass-ratio. After
introducing reasonable restrictions for the masses, a realizable mass-ratio is computed. To
enhance the Force spring displacement it has to rise to its maximum possible value for the
given requirements. Therefor the shape of the Cylindrical cam was changed to use the
maximum gear box torque for a longer period. A change of the Force spring rate affects this
shape and also the length of the Mole. Hence the analysis suggests a smaller spring rate,
which needs more space inside the Hammering mechanism. Changing the Brake spring
shows nearly no effect on the Mole performance, at least with this Mole theory. All these
changes are evaluated by their gain for the performance, the effort of implementing them
and the disadvantages they introduce to the Mole.
The most efficient improvements are realized, first as a CAD-model. The biggest potential of
the change in the mass-ratio is realized in the PT-Mole-design, which is part of this thesis.
Hence a complete redesign of the housing mass is performed. During this design the
instruments and electronics of the HP³-Mole are integrated as well. For the Cylindrical cam
the 3D-model is issued, too. With regard to the work of other institutions the usage of
another tip is considered, which should decrease the penetration resistance of the soil. As
this cannot be implemented in the soil-model, several different ogive shaped tips are
designed. To test these tips without disassembling the Mole, an adapter was designed as
well, where the tips can be easily screwed to.
The designs of the PT-Mole and the Hybrid-Mole are then examined with respect to the
stress levels of critical parts. The change of material and higher loads are introduced by the
improvements. After the confirmation of the safety margins for the parts, they were
manufactured.

53
In the Test stand, which is designed during the work of chapter 6, the different Mole-models
can be compared with respect to the kinetic energy of the housing. The calibration of the
Test stand is not yet matured. Hence only a rough comparison of the BB-Mole and the PT-
Mole was possible. There it was possible to show a significant improvement, but the exact
value for that needs the energy losses inside the Test stand as well. The Hybrid-Mole was not
assembled so far. Therefor the comparison of this model to the previous ones is not possible
yet.
7.1. Future work
During the progression of this thesis the Mole theory at the current state showed some
inadequateness. The theory needs a closer look for the role of the Brake spring and the
friction losses inside the Hammering mechanism. The measured energy output at the stand
spring is smaller by more than a magnitude. At this point it is also possible that the friction
losses inside the Test stand are too big. A calibration of the Test stand for every Mole -model
is necessary.
The test campaign for validating the tip shapes needs to take place. Representative results
are not only useful for choosing the best option for the HP³-Mole. But some correlations
between the tip shapes and their soil parameters will improve the comprehension of the
Mole-soil-interaction.
For future work, most likely after the InSight mission has launched, the other mentioned
changes should be considered as well. Therefor the performance of the Mole can be
enhanced further and the selection of a Mole for future missions is likelier.

54
List of literature
[RD 1] Beitz, W., Grote, K.-H., Dubbel Taschenbuch für den Maschinenbau, Springer-Verlag, Berlin, 19. edition, 1997
[RD 2] Crowell, G. A., The Descriptive Geometry of Nose Cones, http://de.scribd.
com/doc/60921375/The-Descriptive-Geometry-of-Nose-Cone, last checked :
15.09.2013
[RD 3] DLR, Heat Flow and Physical Properties Package, http://www.dlr.de/pf/
desktopdefault.aspx/tabid-8653, last checked: 10.09.2013
[RD 4] DLR, Rosetta, http://www.dlr.de/rb/de/desktopdefault.aspx/tabid-
4538/7439_read-11269/, last checked: 10.09.2013
[RD 5] Faulhaber, Technical Data for products, http://www.faulhaber.com/, last checked: 19.08.2013
[RD 6] Fischer, U., et al., Tabellenbuch Metall, Verlag Europa-Lehrmittel, Haan-Gruiten, 42. edition, 2002
[RD 7] Fish, C. S., Ban, H., Sellers, S., White, J., Wouden, A., Allen, D., Heat Flow
Probe for Lunar and Planetary Missions, American Geophysical Union, Fall
Meeting 2009
[RD 8] Große, J., Simulation and parameter studies for the conceptual design of a combined thermal and mechanical penetration mechanism for icy planetary bodies, Diploma thesis Universität Bremen, 2010
[RD 9] Grygorczuk, J., Seweryn, K., Wawrzaszek, R., Banaszkiewicz, M.,
Technological Features in the New Mole Penetrator “KRET”, 13th European
Space Mechanism and Tribology Symposium, Wien, 2009
[RD 10] Grzesik, A., Konstruktion eines Schlagmechanismus für einen instrumentierten Penetrator zur Bodenerkundung bei Planetenmissionen (Mercury Surface Element), Diploma thesis Fachhochschule Aachen, 2004
[RD 11] Haack, W., Geschoßformen kleinsten Wellenwiderstandes, Bericht 139 der
Lilienthal-Gesellschaft, 1941
[RD 12] Historic Spacecraft, Discovery Program Missions, http://historicspacecraft. com/Probes_Discovery.html, last checked: 10.09.2013
[RD 13] NASA, Discovery Program, http://discovery.nasa.gov/index.cfml, last checked: 19.08.2013

55
[RD 14] NASA, Goddard Space Flight Center, http://www.nasa.gov/centers/goddard/ news/releases/2011/11-033.html, last checked: 20.08.2013
[RD 15] NASA, InSight, http://insight.jpl.nasa.gov/home.cfm, last checked: 10.09.2013
[RD 16] Spohn, T., et al., InSight: Measuring the Martian heat flow using the Heat flow
and Physical Properties Package (HP³), 43rd Lunar and Planetary Science
Conference, The Woodlands, 2012
[RD 17] Stoker, C. R., Gonzales, A., Zavaleta, J. R., Moon/Mars Underground Mole,
http://esto.nasa.gov/conferences/nstc2007/papers/Gonzales_Andy_C10P1_
NSTC-07-0117.pdf, Download: 10.09.2013

a
Appendix A Simulation output
The output of the Mole-simulation contains graphs for the rotation speed of the motor, the
motor current, the rotation speed of the gear box, the power consumption and the gear box
torque over rotational angle. Furthermore the penetration depth over the designated
simulation time is given.

b
Appendix B Comparison BB-Mole and PT-Mole
In the pictures below a comparison of the PT-Mole (left) and the BB-Mole (right) is shown.
The hammer mass (green), actuator mass (turquoise) and housing mass (orange) are
highlighted.

c
Appendix C Drawing of optimized Cylindrical cam
Drawing of the optimized Cylindrical cam for the PT-model Force spring. Measurements are
removed.

d
Appendix D Drawings of different tips and Tip adapter
Drawing of the conical tip with removed measurements:

e
Drawing of the tangent tip with removed measurements:
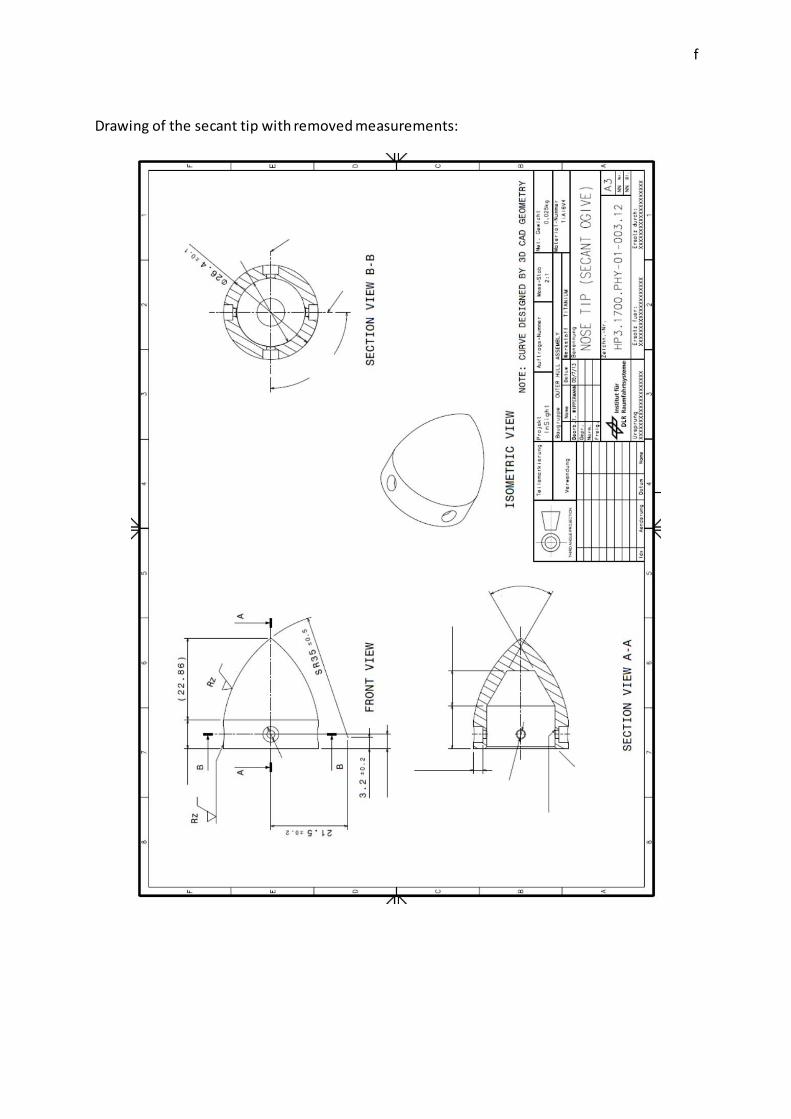
f
Drawing of the secant tip with removed measurements:

g
Drawing of the HAACK tip with removed measurements:

h
Drawing of the equal pressure tip with removed measurements:

i
Drawing of the conical tip with removed measurements:

j
Appendix E Deutsche Zusammenfassung
1. Einführung
Das Thema dieser Diplomarbeit ist die Optimierung des HP³-Moles. Dies ist ein rotationsloser
Bohrer, der von dem Deutschen Zentrum für Luft- und Raumfahrt entwickelt wurde und für
die InSight-Mission eingesetzt werden soll. Im Rahmen dieser Mission wird das HP³-System
(Heat Flow and Physical Properties Package) zum Mars geflogen und auf dessen Oberfläche
abgesetzt. Hierfür wird ein Lander, der auf dem Phönix-Lander basiert, benutzt. Auf diesem
werden zudem die Instrumente SEIS und RISE verstaut.
Zur Zeit der Durchführung dieser Diplomarbeit wurden mehrere Moles von unterschied-
lichen Institutionen entwickelt oder befinden sich in der Entwicklung. Hierbei lassen sich
grundsätzlich zwei verschiedene Arten von Moles unterscheiden: Moles zur Proben -
rückführung an die Oberfläche (z. B. PLUTO) und Moles zur Durchführung von Messungen im
Inneren des Himmelskörpers (z. B. MUPUS).
2. Mole-Theorie
Auf dem Marsboden angekommen und nachdem alle System-checks durchgeführt wurden,
beginnt der interne Schlagmechanismus des HP³-Moles zu arbeiten. Dies ist ein 3-Massen-
System, dass durch zwei Federn zueinander gekoppelt ist. Die Schlagfeder wird durch eine
Rolle gespannt, die auf einer zylindrischen Rampe, die Steigungsrampe, hochrollt. Dadurch
wird die Hammer Masse, die die Steigungsrampe enthält, zum Aktuator, bei der die Rolle Teil
der Baugruppe ist, gezogen. Erreicht die Rolle das Ende der Rampe, kann sich die Schlagfeder
wieder entspannen. Dabei beschleunigt sie den Hammer in Richtung des Gehäuses und
dieser stößt auf das Gehäuse. Ein Teil der kinetischen Energie des Hamemrs wird dabei auf
das Gehäuse übertragen. Dadurch bewegt sich der Mole ein Stück tiefer in den Marsboden.
Zeitgleich bewegt sich der Aktuator in die entgegengesetzte Richtung und spannt die
Bremsfeder. Diese befindet sich zwischen dem Aktuator und dem Gehäuse. Die Bremsfeder
entspannt sich wieder und lässt den Aktuator und den Hammer auf das Gehäuse schlagen.
Dadurch wird ein zweites Mal kinetische Energie auf das Gehäuse übertragen und der Mole
kommt wieder ein Stück tiefer in den Boden. Danach befinden sich die Massen wieder in der
Ausgangslage und ein weiterer Zyklus beginnt mit dem Spannen der Schlagfeder.
Für diesen Prozess lassen sich sechs Parameter zusammenfassen, die diesen beeinflussen:
Die Massen des Hammers, des Aktuators und des Gehäuses, die Federkonstanten der
Schlag- und der Bremsfeder, sowie die Auslenkung der Schlagfeder.
k
3. Parameteranalyse
Eine Veränderung bei einer der drei Massen bewirkt eine Verschiebung des optimalen
Wertes für die anderen Massen. Um die Massen zu optimieren wird deswegen das
Verhältnis der Massen zueinander betrachtet und verbessert. Zunächst wird allerdings für
das nächste Model des Moles nur eine begrenzte Veränderung eingebracht, da der Hammer
und der Aktuator beibehalten werden. Der optimale Wert für die Gehäusemasse ist
0.145 kg. Dies gibt somit ein Designkriterium für den Prototypen-Mole an, dass die Masse
möglichst diesen Wert erreichen soll. Im weiteren wird zunächst das Massenverhältnis nur
mit der Einschränkung optimiert, dass das Gesamtgewicht gleichbleiben soll. Ohne diese
Vorgabe würden die einzelnen Massen ihr Optimum bei deutlich größeren Werten haben.
Das Ergebnis dieser Betrachtung ergibt jedoch unrealistische Werte für den Aktuator aus.
Zudem wird das grundlegende Prinzip des Schlagmechanismus verändert, da der erste Stoß
durch den Hammer nur noch zum Spannen der Bremsfeder genutzt wird. Um dies zu
verhindern, werden andere Einschränkungen gemacht, die teilweise realistische Massen
vorgeben. Das Verbesserungspotential durch die erste Veränderung zum Prototyp-Mole
beträgt + 38,4 % für die kinetische Energie des Gehäuses im Vergleich zum vorhergehenden
Breadboard-Mole. Die weiteren Anpassungen steigern dies noch einmal um 7,9 % (mit
unrealistischen Massen), bzw. 3,6 % (mit realistischen Werten).
Die Auslenkung der Schlagfeder müsste auf den größtmöglichen Wert erhöht werden, der
durch die gegebenen Bedingungen erreichbar ist, da sie die gespeicherte Energie der
Schlagfeder erhöht. Die kinetische Energie des Gehäuses steigt mit steigender
Schlagfederenergie. Das Verbesserungspotential liegt hierbei in der Nutzung des maximalen
Drehmomentes des Getriebes für einen längeren Zeitraum. Dies kann durch eine
Veränderung der Gestalt der Steigungsrampe erreicht werden. Es hat sich hierbei erwiesen,
dass eine logarithmische Funktion für die Höhe der Steigungsrampe sehr gut an das
maximale Drehmoment herankommt. Dadurch kann die kinetische Energie des Gehäuses um
67,3 % im Vergleich zum PT-Mole verbessert werden.
Durch die Optimierung der Federkonstante der Schlagfeder wird ebenfalls auch die Gestalt
der Steigungsrampe verändert. Es kann hierbei eine Steigerung von 79,2 % zum PT-Mole
erreicht werden, jedoch auf Kosten einer Erhöhung der Molelänge. Die Bremsfeder hat nach
der Mole-Theorie scheinbar keinen großen Einfluss auf die Leistung des Moles. Da dies
jedoch nicht mit Beobachtungen aus früheren Tests übereinstimmt, wird die Federkonstante
der Bremsfeder nicht verändert.
4. Designveränderungen
In einem ersten Schritt wird der Prototyp-Mole konstruiert. Die Gehäusemasse wird dabei so
niedrig wie möglich gehalten während zugleich die Messinstrumente im Inneren des Moles

l
untergebracht werden. Zudem wird der Außendurchmesser des Moles verkleinert um den
Eindringwiderstand des Bodens zu verringern.
Als weitere Veränderung wird die modifizierte Steigungsrampe realisiert. Zudem werden
verschiedene Spitzenformen konstruiert, die aufbauend auf anderen Arbeiten den
Eindringwiderstand weiter verringern sollen. Da hierzu jedoch keine genauen Daten über das
bestmögliche Design bestehen, werden mehrere Spitzen mit unterschiedlichen Formen
entwickelt. Diese sollen später getestet werden, wobei dafür ein möglichst einfaches
Austauschen der Spitzen möglich sein sollte. Deshalb wird außerdem ein Adapter für die
Spitzen konstruiert. Die verbesserte Steigungsrampe und die Spitzen werden bei einem PT-
Mole angewandt werden. Da dies jedoch nicht zum eigentlichen Konzept gehört, w ird dieser
Mole Hybrid genannt.
5. Belastungsberechnung
Durch die erhöhten Energien der Federn und der Stöße sind auch die Materialbelastungen
größer. Um sicher zu gehen, dass die Bauteile trotzdem ausreichend ausgelegt sind, werden
die Belastungen bei kritischen Bauteilen nachgerechnet. Es wird gezeigt, dass diese Bauteile
eine ausreichende Sicherheit gegen Versagen haben.
6. Validierung der Verbesserungen
Um die errechneten Verbesserungen zu bestätigen wird ein Teststand konstruiert, der relativ
einfach und schnell eine Aussage über die Leistungsfähigkeit machen kann. Hierfür wird der
Mole auf eine Halterung auf einer Feder gesetzt und die Auslenkung durch die Schläge
mittels eines Abstandssensors gemessen. Der Teststand führt dabei auch den Mole damit
dieser zentriert auf der Feder positioniert ist. Um die erhaltenen Ergebnisse auch in die
kinetische Energie des Gehäuses umgerechnet werden kann, müssen die Reibungsverluste in
dem Teststand bestimmt werden. Erste Tests mit dem BB-Mole und dem PT-Mole zeigen,
dass diese wahrscheinlich einen großen Einfluss auf die Messwerte haben. Zudem ist
dennoch die Energie der Teststandfeder deutlich geringer als es die Theorie vermuten lässt.
Daraus ergibt sich, dass die Theorie noch weitere Verbesserungen benötigt.
Die Tests mit dem Hybrid-Mole müssen noch durchgeführt werden. Hierbei kann lediglich
der Einfluss der Steigungsrampe in dem Teststand analysiert werden. Die Verbesserung
durch die verschiedenen Spitzen ist nur in einem Penetrationstest möglich. Ebenso verhält
es ich mit dem einfluss des kleineren Außendurchemssers des Moles bei dem PT-Mole.
Trotz alle dem konnte eine deutliche Verbesserung von dem BB-Mole zum PT-Mole mit Hilfe
des Teststandes bestätigt werden.

m
Appendix F Project files
The project files contain the Work Breakdown Structure, the timeline and the Work Package
Description.

n
(Zeitplan, eine Seite)

o
(“Work package description”, 19 Seiten)